
Study on Ecological Threshold of Groundwater in Typical Salinization Area of Qian’an County

1
Key Laboratory of Groundwater Resources and Environment, Jilin University, Ministry of Education, No 2519, Jiefang Road, Changchun 130021, China
2
Jilin Provincial Key Laboratory of Water Resources and Environment, Jilin University, Changchun 130021, China
3
National-Local Joint Engineering Laboratory of In-Situ Conversion, Drilling and Exploitation Technology for Oil Shale, Changchun 130021, China
4
College of New Energy and Environment, Jilin University, No 2519, Jiefang Road, Changchun 130021, China
*
Author to whom correspondence should be addressed.
Water 2021, 13(6), 856; https://doi.org/10.3390/w13060856
Submission received: 21 February 2021
/
Revised: 17 March 2021
/
Accepted: 18 March 2021
/
Published: 20 March 2021
(This article belongs to the Section Hydrology)
Abstract
:A suitable groundwater level is an important condition to maintain the stability of the vegetation community, especially in arid and semi-arid areas. The surface of Qian’an County in Western Jilin Province is often accompanied by salinization due to the influence of natural and human factors. In order to maintain the healthy development of ecological vegetation and reduce the risk of soil salinization, the concept of an ecological threshold of groundwater level is proposed, and two methods are used to determine the reasonable ecological threshold of groundwater. (1) Based on field investigation and indoor experiment, the data layer of soil texture, land use type and groundwater mineralization degree in the research area was established by using remote sensing technology and GIS technology. According to the thickness of vegetation root layer and the height of capillary rise of different soil and water types, the influence of groundwater salinity is considered, and the sum of the two is taken as the ecological threshold of groundwater in the study area. The reasonable threshold value of suitable growth of various vegetation crops is 3.76~5.66 m. (2) According to the relationship between the normalized vegetation index (NDVI) and the groundwater buried depth and phreatic salt, the groundwater buried depth and the mineralization degree under the best vegetation cover are analyzed as follows: the buried depth of groundwater is between 4.8 m and 6.1 m, and the salinity of groundwater is between 0.37 and 1.25 g/L, which are reasonable groundwater properties in the study area of the ecological threshold. This result not only enriches and broadens the content of groundwater research, but also helps to predict the prospect of water resource development.
1. Introduction
As a part of water resources, groundwater is the main source of water supply for people’s lives and for industrial and agricultural production in some areas. Therefore, the appropriate groundwater level is an important condition to maintain the stability of the vegetation community, especially in arid and semi-arid areas [1]. If the groundwater level is too high, the salinity of soil bottom or groundwater will rise to the surface with capillary water. After water evaporation, the salinity will accumulate in the surface soil, which can easily cause soil salinization; if the groundwater level is too low, the regional vegetation coverage will be reduced, and the soil structure will be loose, which can easily cause soil desertification [2]. At the same time, the soil condition and water quality of an area also act on the groundwater in turn, making the groundwater play a full role in controlling the ecological environment. If the present situation (physical and chemical properties) of groundwater can meet the requirements of the ecological environment, it will not cause the deterioration of the ecological environment [3].
In China, many scholars began to study the ecological groundwater level in the late 1990s. In 2003, Zhang Changchun, Shao Jing li and others studied the reasonable ecological water level of groundwater in North China Plain and proposed that the upper limit of ecological water level is to prevent soil salinization, and the lower limit is the ideal water level for groundwater to obtain the maximum recharge [2]. In 2004, Fan zili et al. studied the relationship between groundwater, soil water and vegetation in the Tarim River Basin, and related the groundwater depth to the ecological environment. They divided the groundwater depth into five types—swamp water level, salinization water level, suitable ecological water level, plant stress water level and desertification water level—and determined the corresponding burial depth [4]. In 2006, Sun caizhi and others studied the ecological groundwater level in the lower Liaohe Plain [5]. In 2009, Rong Lishan and Shu Longcang discussed various methods for estimating the reasonable ecological groundwater level based on the definition of reasonable ecological groundwater level [6]. Then, taking the lower reaches of Tarim River as an example, the relationship between groundwater depth and Populus euphratica branch growth after emergency ecological water transfer was analyzed [6]. In 2010, Rong Lishan and others took the Yellow River Delta as an example, analyzed the vegetation distribution in the Yellow River Delta, selected typical vegetation types, analyzed the most suitable salt range and the relationship between groundwater table depth and regional soil salt content, and determined the most suitable groundwater table depth for vegetation growth in the study area [7]. In 2010, Zhao Haiqing et al. analyzed the negative environmental effects caused by the decline of groundwater level in Songnen Plain through field investigation [8]. In 2016, Chen Nanxiang et al. studied the ecological groundwater level in Zhongmou County and calculated the upper and lower limits of the ecological groundwater level in the study area based on the dynamic data of groundwater level in the study area [9]. In 2019, Dangxueya et al. took ecological vegetation as the research object, studied the groundwater threshold in Qaidam Basin, and clarified the relationship between ecological vegetation and groundwater [10].
The study of ecological water level has been carried out in foreign countries for a long time. In 1992, Cochard, Tyree. et al. studied the relationship between groundwater level and vegetation growth [11]. In 1999, Prathapar et al. Established a simulation model of groundwater table depth, crop irrigation amount and vegetation evaporation in a semi-arid area to study the salt accumulation in the root layer under the condition of groundwater table irrigation [12]. Jonathan L. et al. [13] (2001) studied the physiological response of vegetation in different depths of groundwater table in Bill Williams watershed of the United States, calculated the threshold of groundwater table depth when plants carry out photosynthesis and other physiological functions and put forward the concept of ecological water level, that is, the water table depth of shallow groundwater, which can maintain the water required for the growth of zonal vegetation. In 2005, Ricky Taylor used groundwater numerical simulation to study the groundwater-dependent ecosystem in the South African estuary. The research shows that plants and animals depend on groundwater to survive in the early dry season until the next rainy season [14]. In 2006, Derek et al. studied the groundwater ecosystem that relies on groundwater to maintain the healthy growth of xerophytic vegetation, analyzed the relationship between groundwater and vegetation, and summarized the ecological water level of dominant plants [15].
In terms of the relationship between groundwater depth and soil salinization, in 2000, R. Ali established the relationship between soil salinization and groundwater depth through the LEACHC model (a salinity model describing soil water movement, solute transport and salt accumulation) and established the appropriate groundwater depth related to groundwater electronic conductivity and soil salinity [16]. In 2003, Jorenush et al. analyzed the influence of climate, soil type, irrigation water quality, management system, groundwater level and groundwater quality on surface salinization and alkalization and analyzed the degree of influence of changes in main factors on salinization and alkalization by establishing relevant models [17]. In 2006, Rengasamy, P. analyzed the influence of groundwater level on secondary salinization under different terrain conditions in Australia [18].
In order to study the relationship between groundwater and surface natural vegetation, the relevant scholars [19] proposed the concept of ecological water level based on the study of the relationship between groundwater and soil water content, the relationship between groundwater and natural vegetation, and the physiological functions of photosynthesis of plants. Ecological water level refers to the shallow groundwater depth needed to maintain the growth of zonal natural vegetation [20]. In the past, the ecological groundwater level only considered the impact of groundwater depth on groundwater ecology. Based on the research, this paper proposes the concept of ecological groundwater threshold, which enriches the concept of ecological groundwater level. Compared with the previous groundwater ecological level, the reasonable groundwater ecological threshold is a dynamic change interval composed of the upper and lower thresholds, which is based on the condition of maintaining the virtuous development of the ecological environment; in the interval, the virtuous development of the ecological environment can be ensured. Generally, the groundwater ecological level only considers the groundwater depth, while the groundwater ecological threshold fully considers the groundwater depth, groundwater salinity, micro-geomorphic characteristics of the study area, lithology of the vadose zone, water temperature and other factors and determines a suitable threshold range for the benign evolution of the ecological environment. In this paper, the typical salinization area in Qian’an County, Songyuan City, Jilin Province is taken as the study area. Based on the previous calculation of ecological water level, three different methods are used to analyze and calculate the ecological threshold of groundwater in the study area. According to the analysis results, the suitable threshold range of groundwater in the study area is determined. Based on the study of soil and groundwater in Qian’an County, this paper attempts to clarify: (1) the ecological threshold of groundwater calculated by the improved traditional ecological water level calculation method, and (2) according to the relationship between the normalized vegetation index and groundwater depth and salinity, whether the ecological threshold of groundwater is suitable for the study area.
2. Study Area
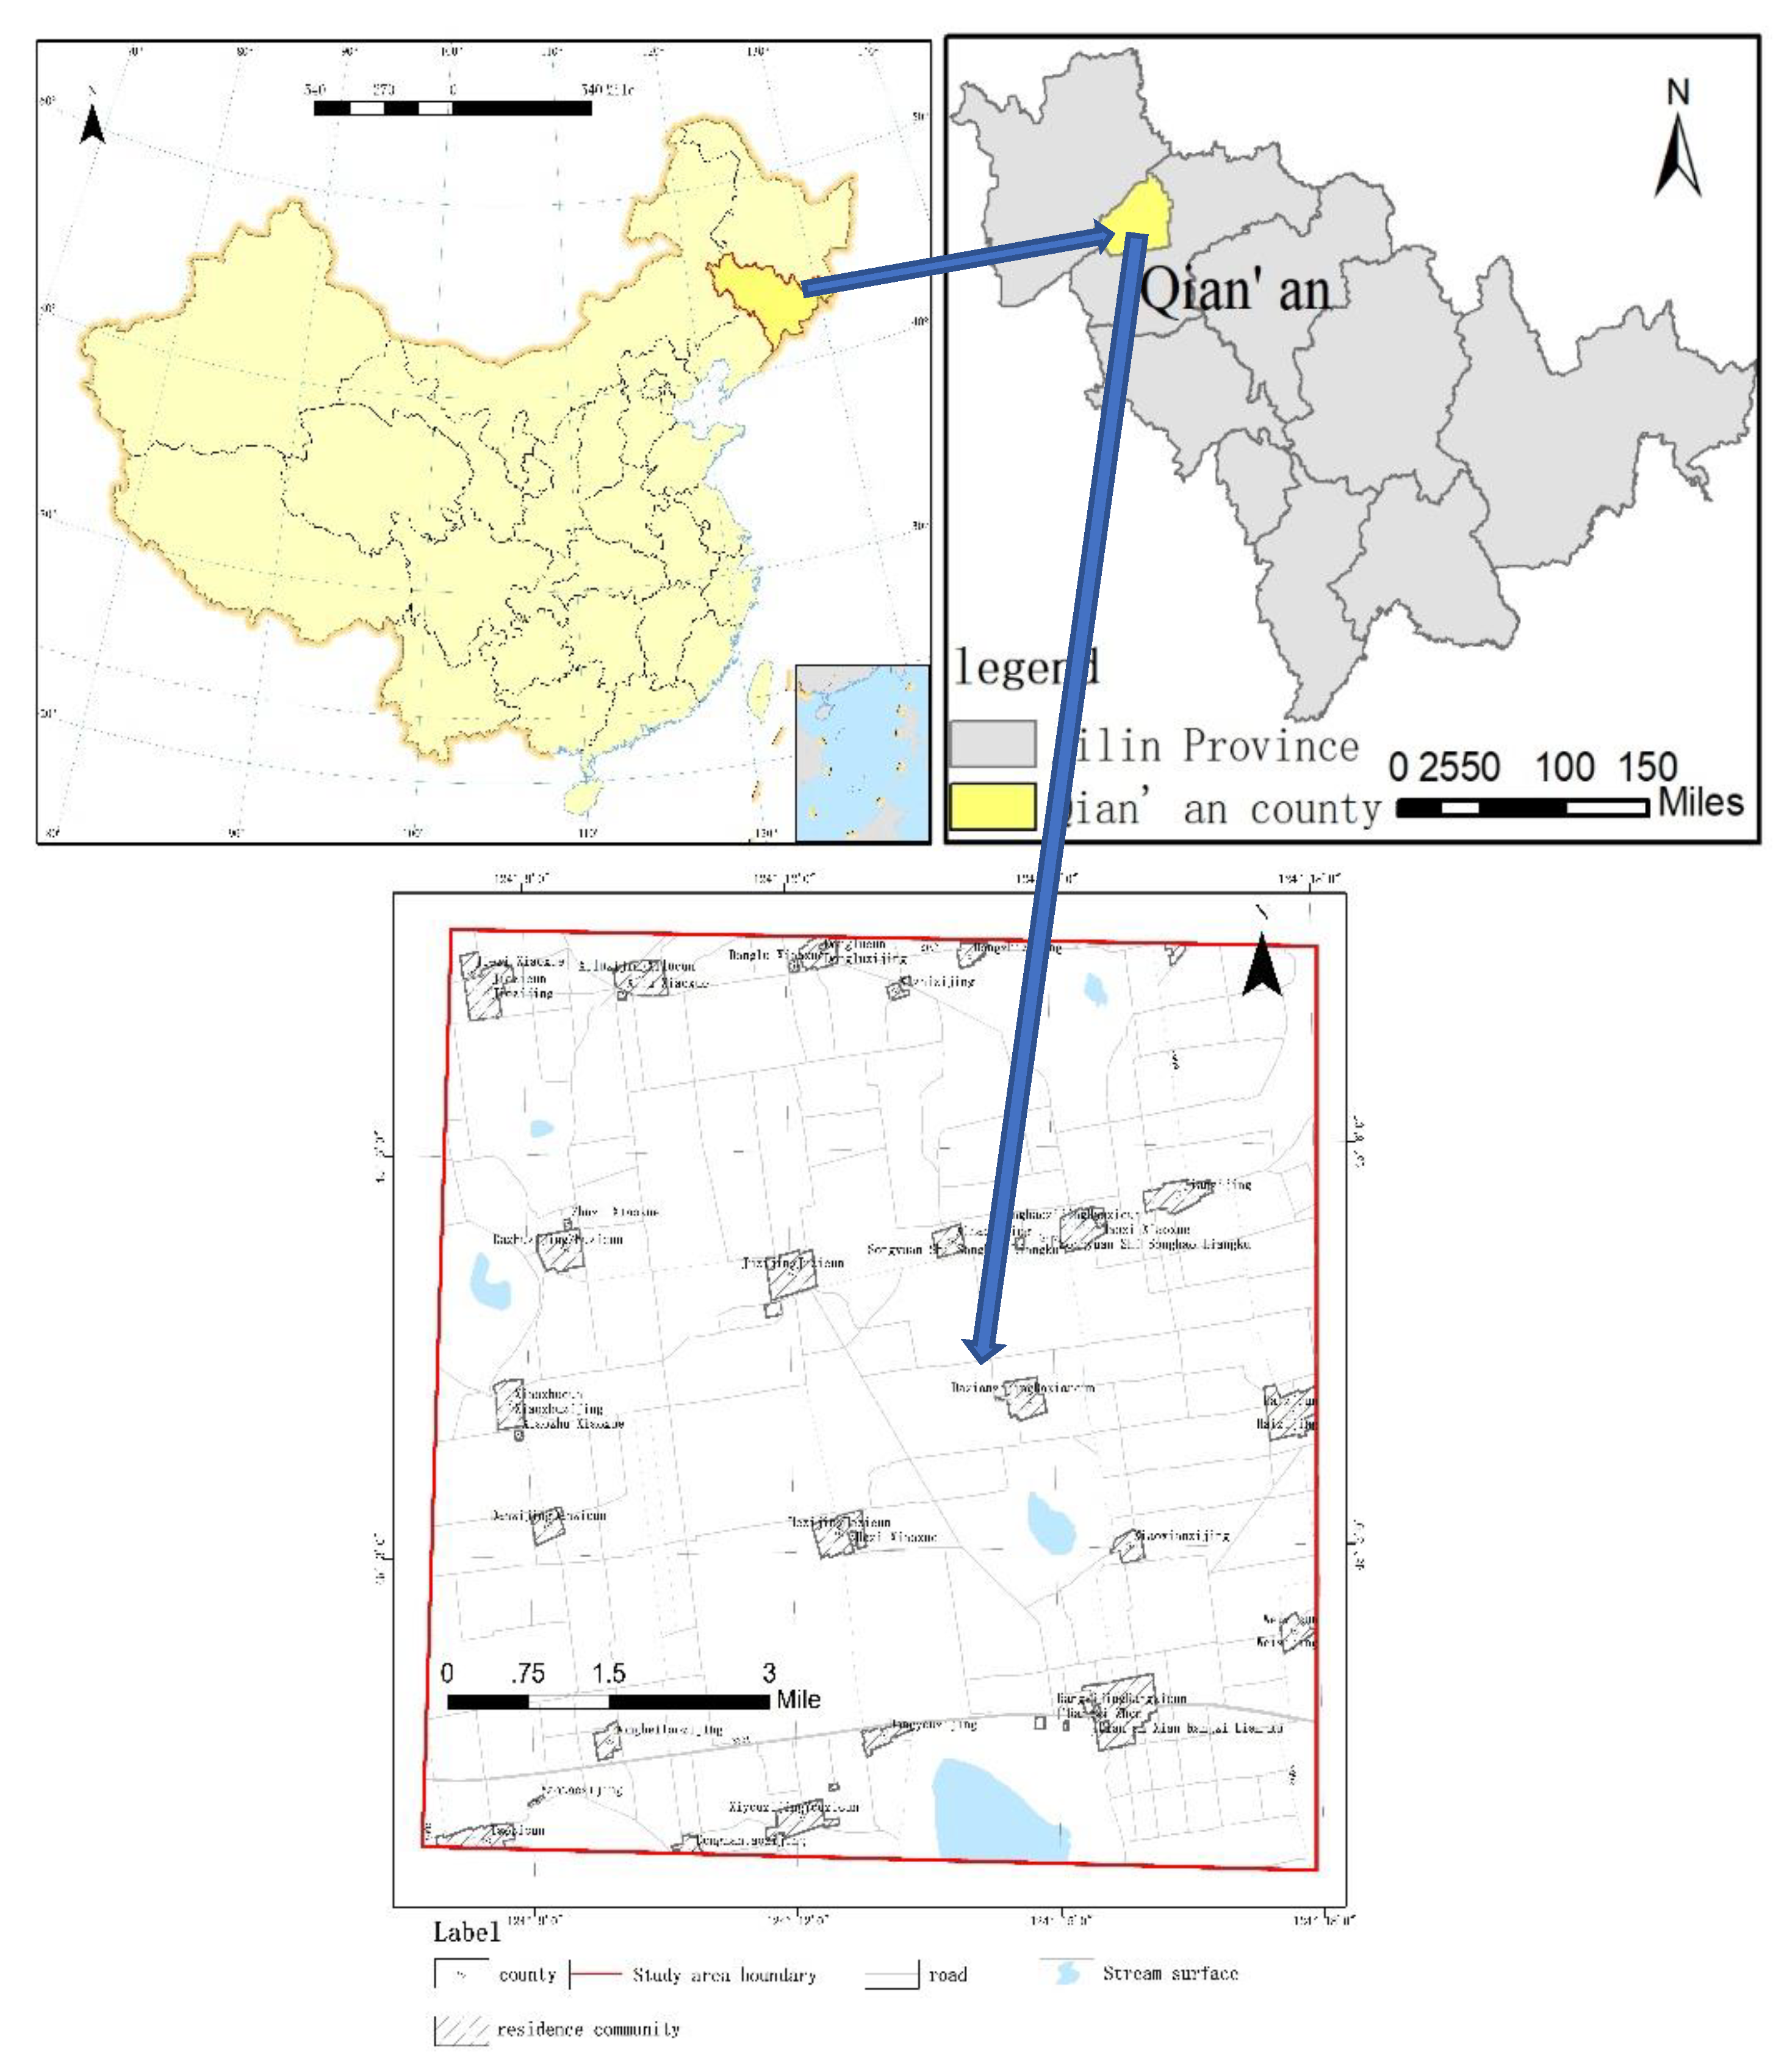
In this study, an area of about 190 km2 in the east of Qian’an County, Jilin Province is taken as the key research area (Figure 1). Qian’an county is located in the northwest of Jilin Province, in the hinterland of Songnen Plain. The terrain is flat and open, and the overall terrain is high in the southwest and low in the Northeast [21]. Qian’an county belongs to Songyuan City. It is located between 123°21′16″–124°22′50″ E and 44°37′47″–45°18′08″ N.
Qian’an county belongs to the continental semi-arid monsoon climate zone. It is dry and windy in spring, hot in summer, has concentrated precipitation, less rain in autumn, a large temperature difference, and cold and long in winter. The annual temperature difference is large, and the frost-free period is short. According to the observation data of Qian’an meteorological station, the annual average temperature is 4.6 °C, the extreme maximum temperature is 37.8 °C and the extreme minimum temperature is −34.8 °C. According to the meteorological data from 1957 to 2018, the average annual precipitation is 418.0 mm. The main precipitation period is from June to September, accounting for 70–80% of the total annual precipitation. The annual average evaporation is 1872.44 mm, which is 4.48 times that of precipitation [22]. There is no surface river in Qian’an County, and the surface water is poor. The surface runoff is concentrated in the low-lying lake bubble in the county, but it is difficult to use because of the poor water quality and high salinity. The precipitation runoff collected in the big and small lake bubbles cannot flow out [3].
The terrain in the area is flat with slight fluctuation. The highest ground elevation is 211 m above sea level, which is located in the southwest of Qian’an County, and the relative elevation difference is small. There are many lakes and marshes in the area, and the larger lake bubbles from are Dabusu lake, Daozi pao, Hua’ao pao, etc., which mostly form a semi-closed lake basin.
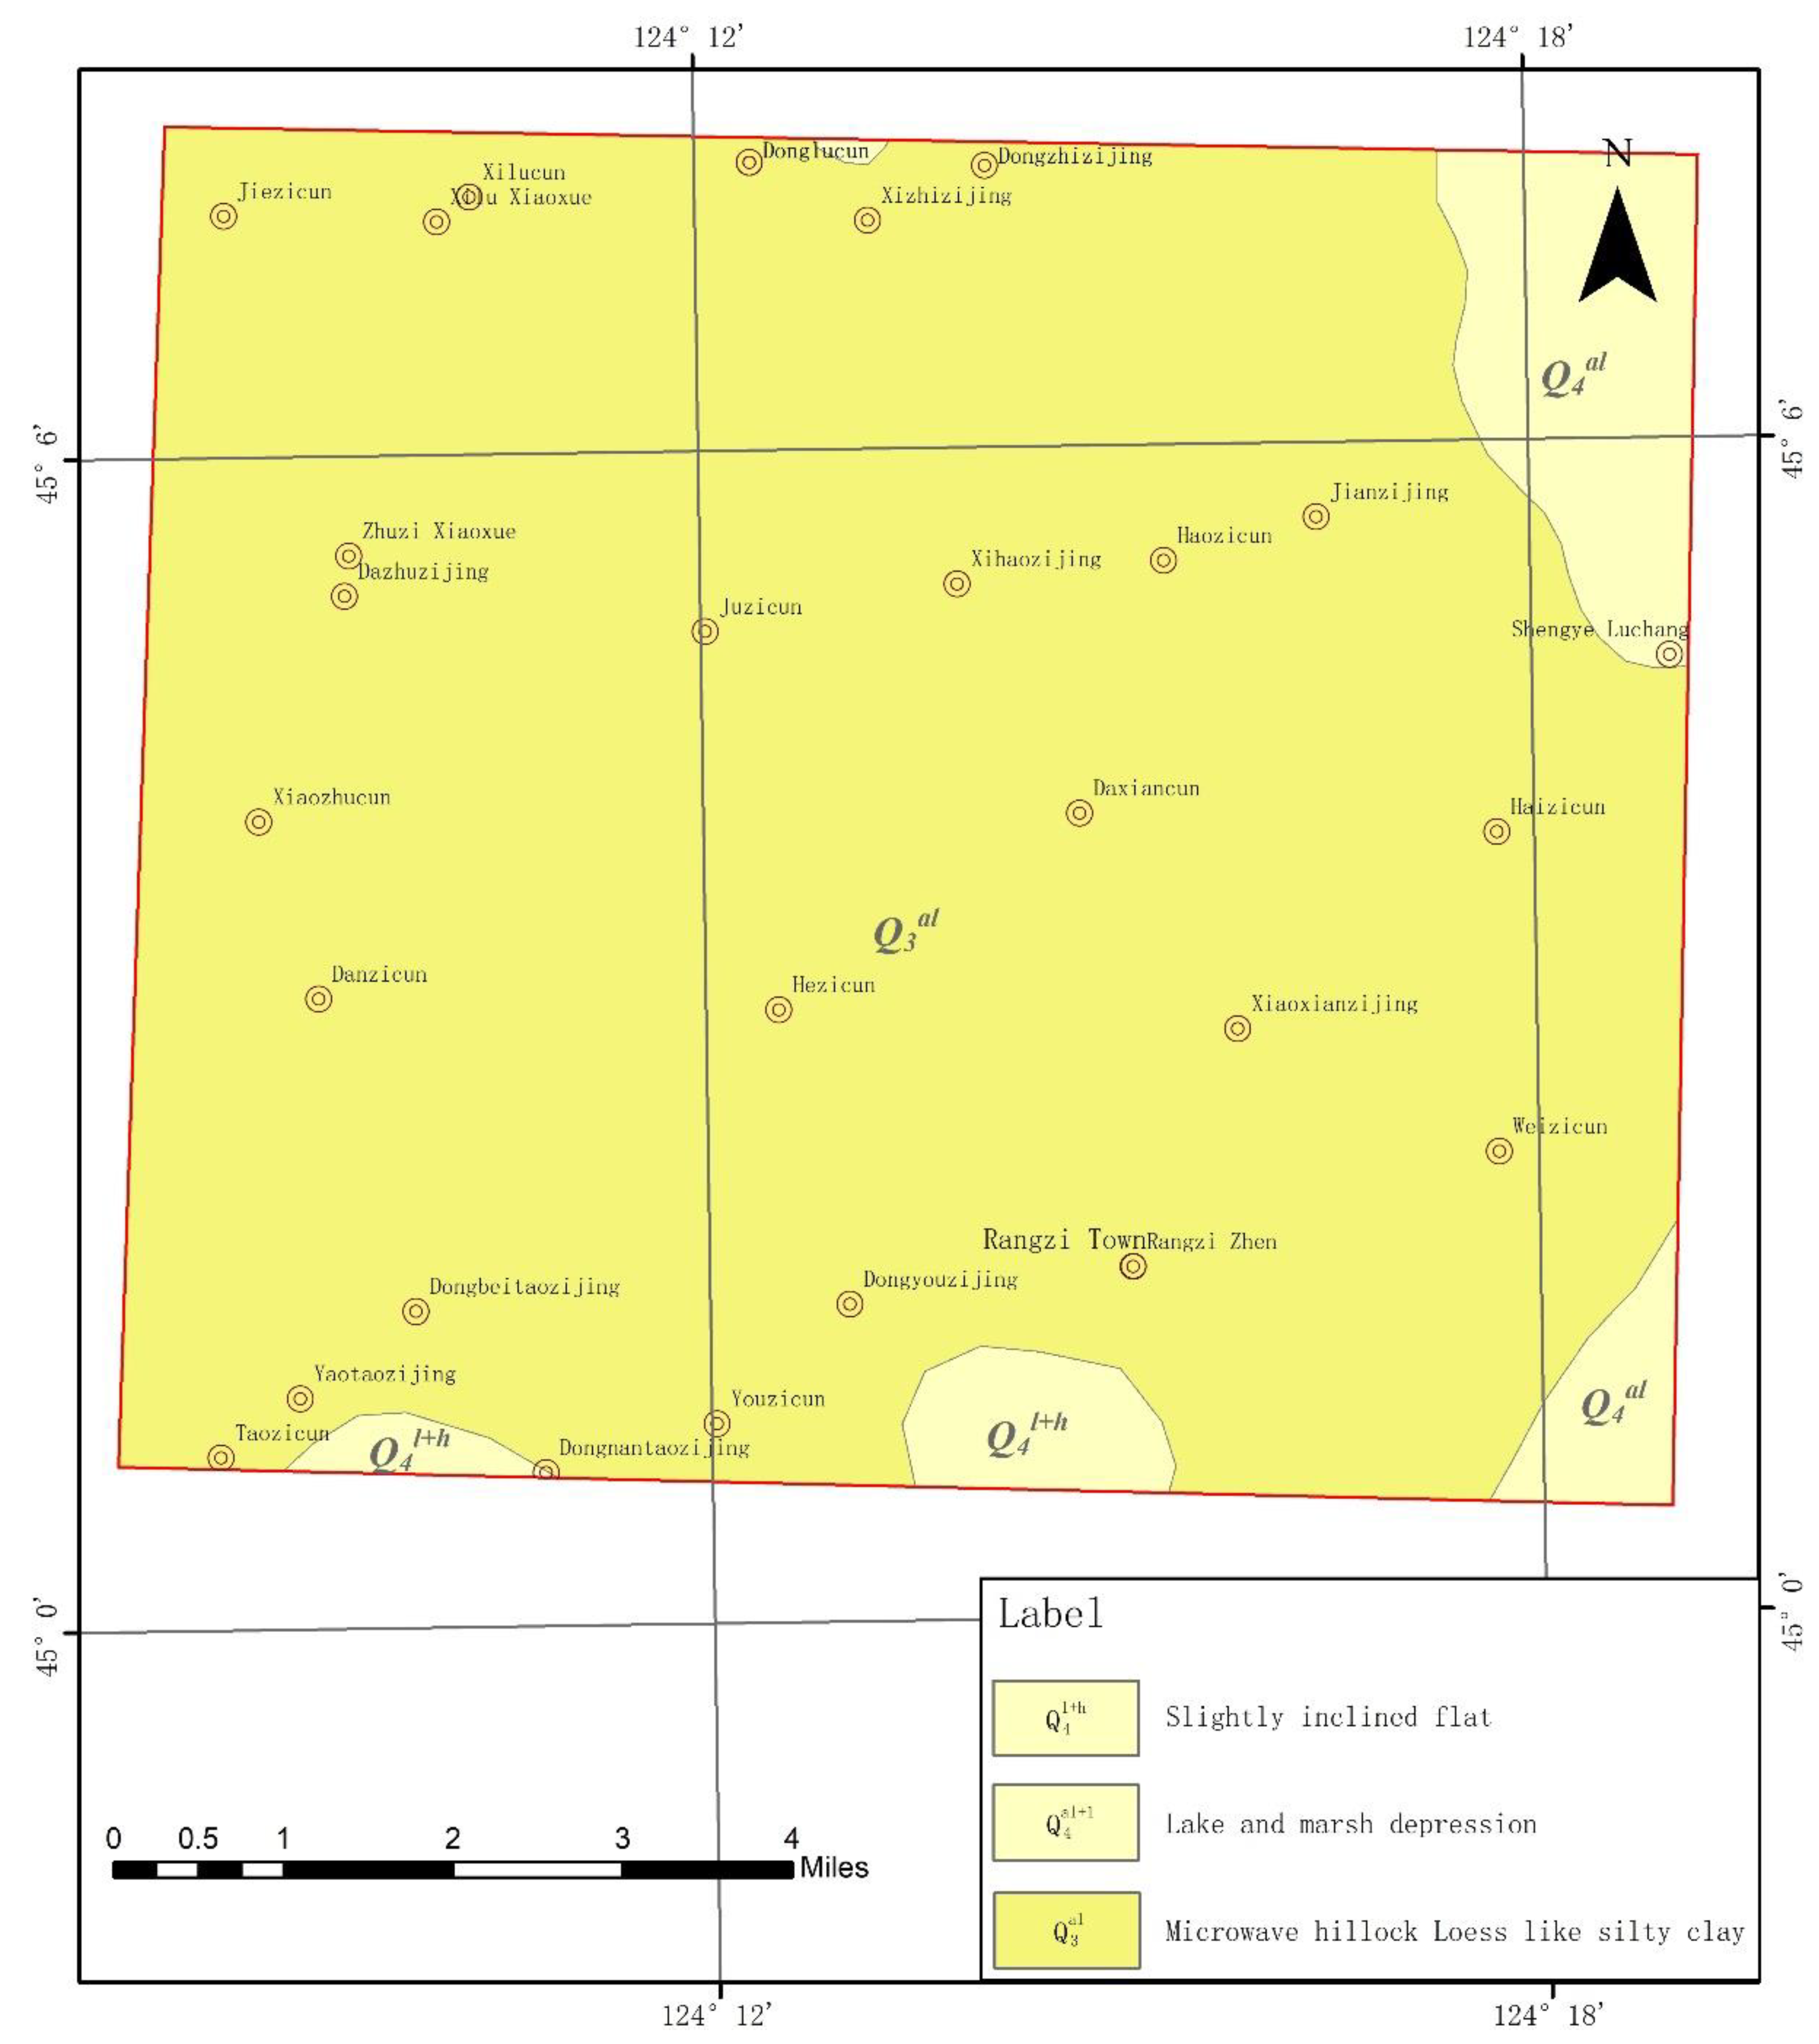
The geomorphology of this area is controlled by regional tectonic movement, its genetic type is accumulation topography and its genetic form is alluvial lacustrine plain. According to the difference of genetic form, the alluvial lacustrine plain is divided into three morphological units: microwave-like hillock, slightly inclined flat and lake marsh depression (Table 1). The geomorphic types of the study area are shown in Figure 2.
The landform of Qian’an county is formed by an alluvial lacustrine plain. Among them, the microwave-like hillock is distributed in most sections, the ground elevation is 140–147 m, the ground is undulating in microwave shape, and the surface lithology is loess-like sandy loam of Upper Pleistocene (Q3). Slightly inclined, flat land is distributed in the southeast of Qian’an county; the ground elevation is 140–150 m; the ground is flat and slightly inclined to the northeast, showing grassland landscape; the surface lithology is Holocene alluvial loam; and the salinization is serious. The lake marsh depression is distributed in the low-lying area of Qian’an county. Its terrain is characterized by the semi-closed low land with high around and low in the middle. The ground elevation is generally lower than 140 m. The lithology of the surface layer is Holocene (Q4) loam, and the soil surface is salinized.
3. Materials and Methods
3.1. Improved Traditional Groundwater Ecological Level Calculation Method
Firstly, an improved traditional groundwater ecological water level determination method is adopted in the salinized area. According to the soil texture type, land use type and groundwater salinity distribution characteristics in the study area, the soil and water conditions in the whole study area are classified by using overlay analysis technology on the platform of ArcGIS, and the classified soil and water conditions are taken as the minimum unit of groundwater ecological threshold calculation [3]. The ecological threshold of groundwater was calculated based on soil type, hydrochemical characteristics, capillary height, vegetation root thickness and permafrost thickness.
- (1)
- Characteristics of soil types
Through field investigation, soil samples were taken from the set section with a soil ring knife every 20 cm until water was seen. Soil types in the study area were determined by the samples.
- (2)
- Hydrochemical characteristics
The chemical characteristics of phreatic water are closely related to the formation of saline soil. The chemical composition of phreatic water is similar to that of saline soil. The salt content in soil is restricted by phreatic water. The higher the phreatic water content, the higher the total salt content, and vice versa. When the salinity is greater than 1.0 g/L, the soil salinization is higher; when the salinity is 0.5–1.0 g/L, the soil salinization is mild and moderate; when the salinity is less than 0.5 g/L, the soil salinization is basically non-salinized. On this basis, the hydrochemical characteristics of phreatic water should be considered in the investigation of the ecological threshold of groundwater level.
- (3)
- Capillary height and root thickness of vegetation
Based on the indoor experiment, the capillary rise height of soil samples was measured, and the capillary rise height of different soils under different salinity types was measured. At the same time, according to the field investigation and consulting data, the root development thickness of different land use types in a typical area in terms of salinization was determined.
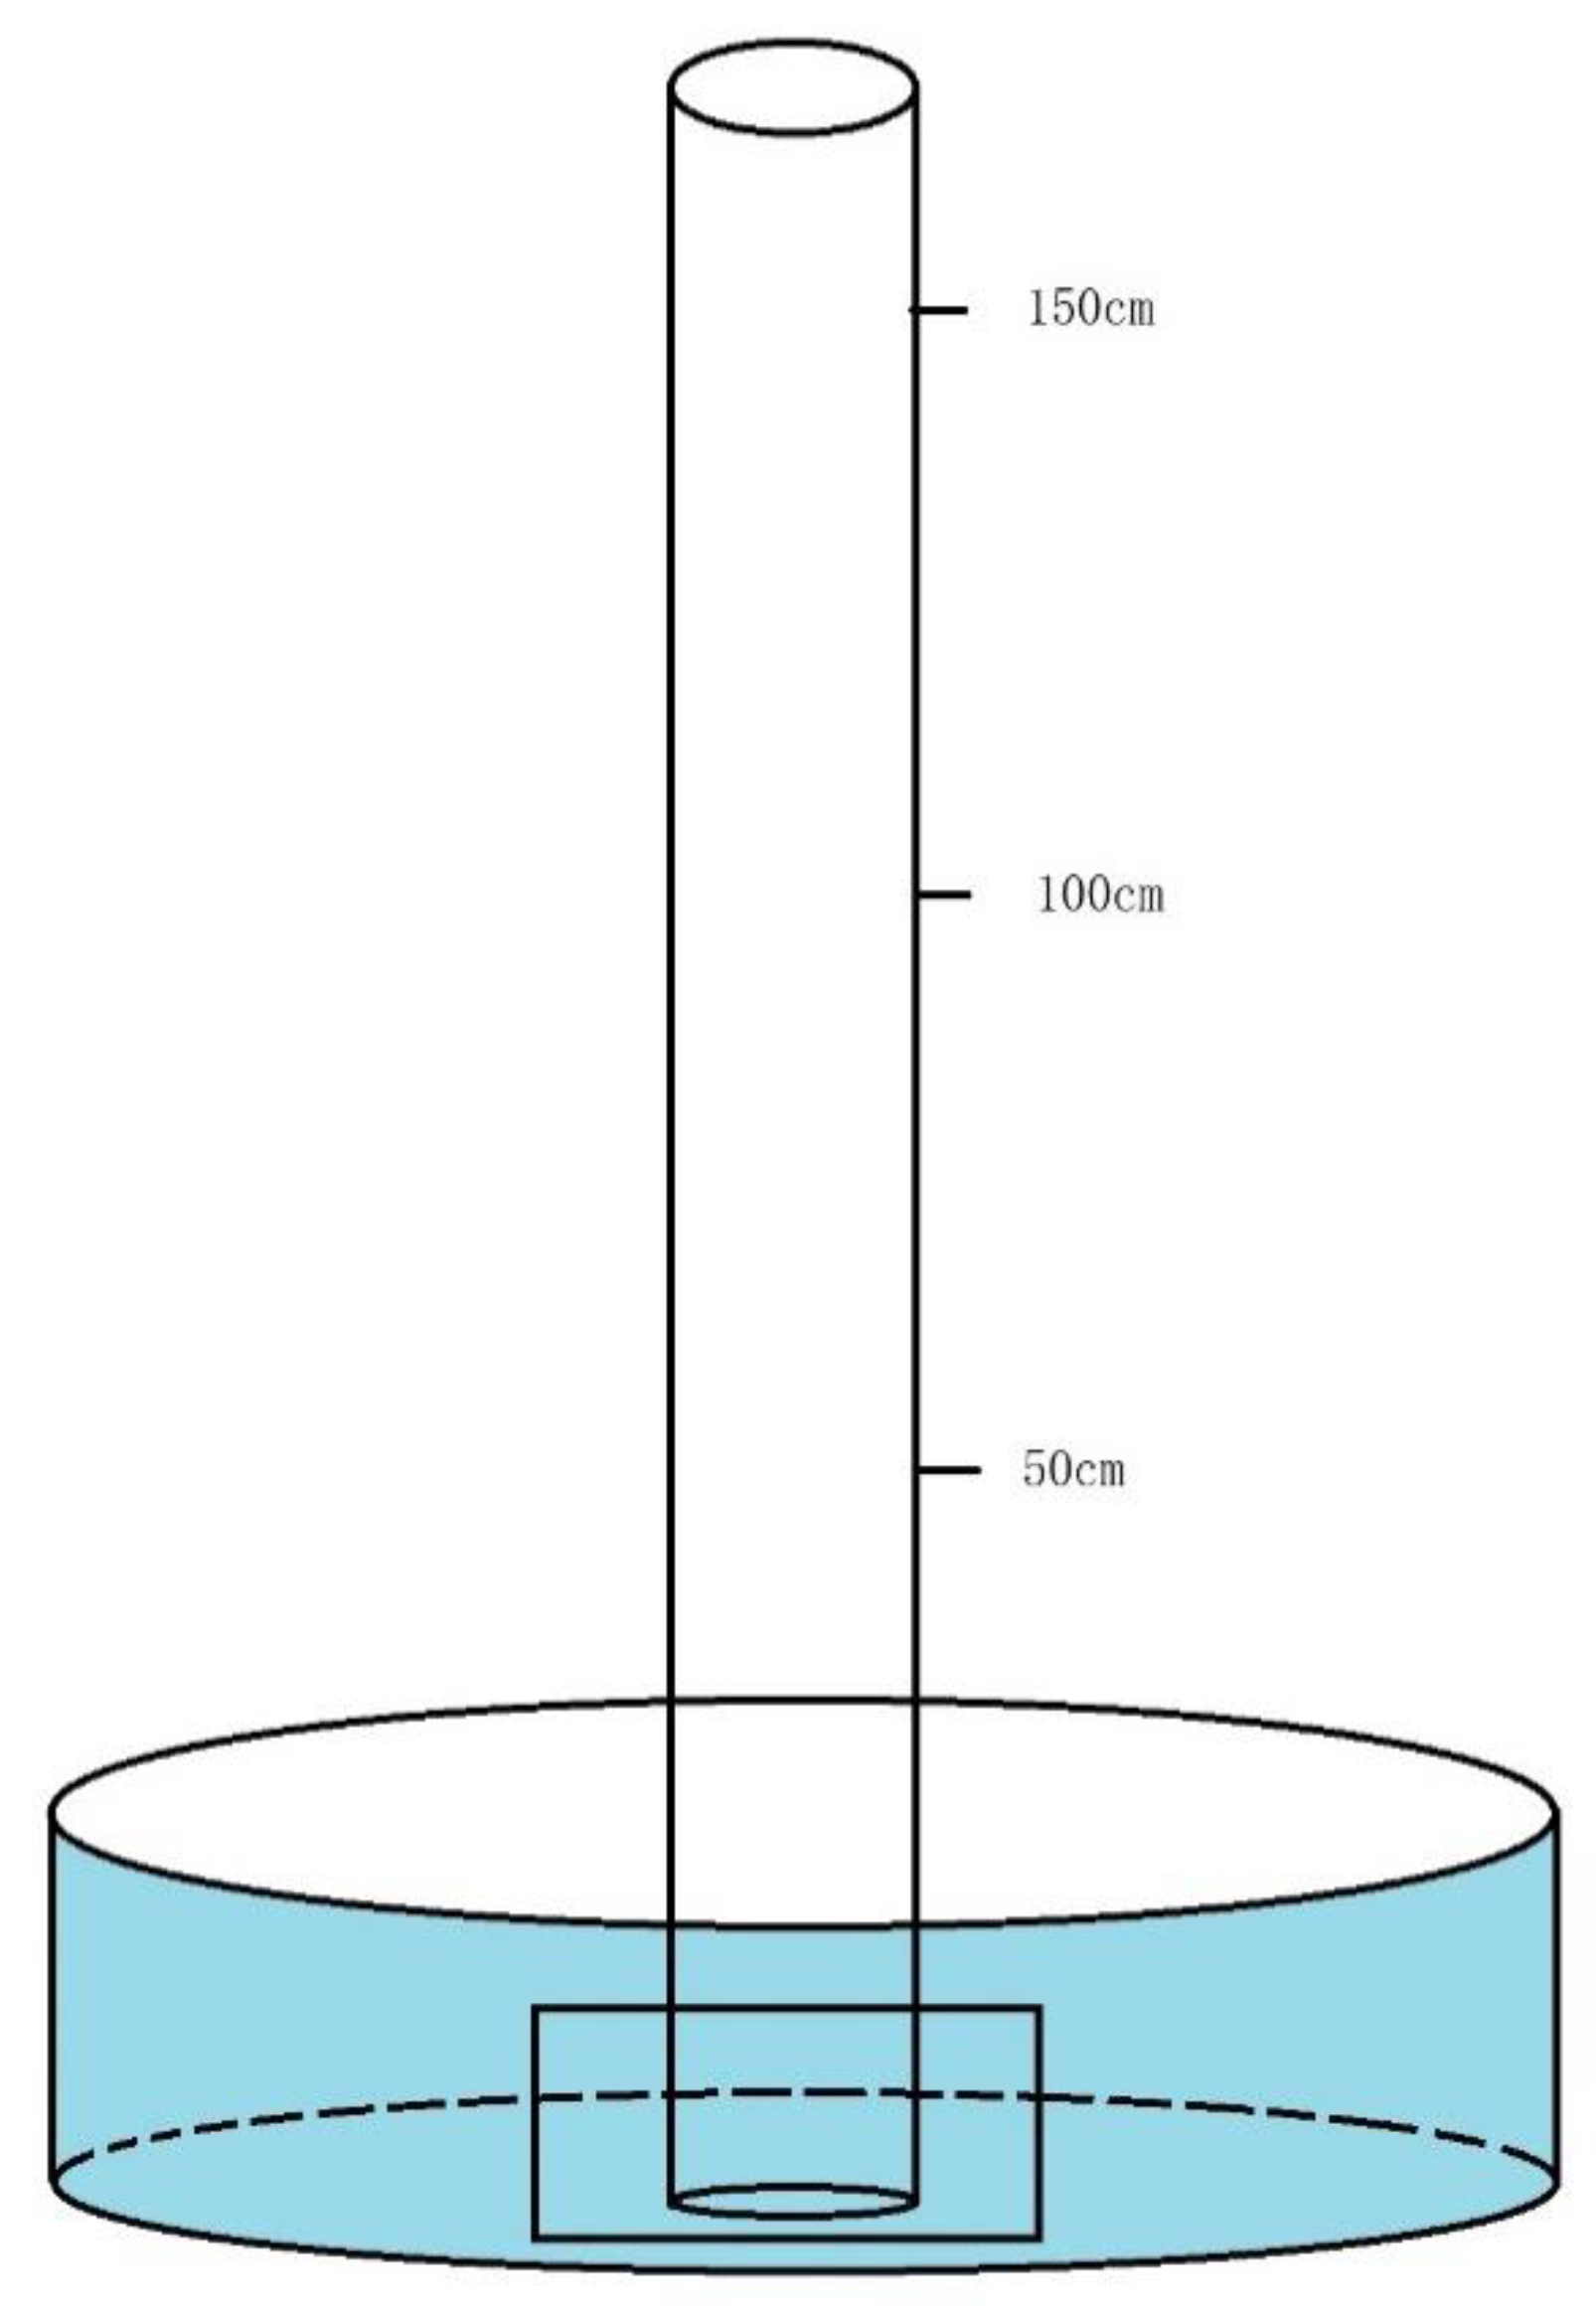
The capillary rise height test was analyzed and determined by a direct observation method. According to the actual density of the tamping tube in the laboratory, the tamping rod is used to calculate the dry density of the tamping tube. The filled glass tube was placed on the water tray, and the capillary rising height was observed regularly. The capillary rising height of sandy loam was stable in 22 days, and it did not increase in 25 days. At the same time, the salinity of water also affected the capillary rising height. Therefore, taking sandy loam as an example, the capillary rising height of sandy loam was observed in water with a salinity of 0.5 g/L, 1 g/L, 1.5 g/L and 2 g/L, respectively.
The device as shown in Figure 3 was used in the experiment, which included a bracket, water tray and thick wall glass tube. The inner diameter of the glass tube was 20 mm, and the length was 170 cm. There was a length scale on the outer wall of the glass tube with a division value of 0.1 cm. The zero point was at the lower end, and the bottom was covered with metal mesh. Six experimental devices were set up in this experiment, including two groups of different soil texture capillary height measurements and four groups of the same soil texture different mineralization contrast test.
- Filling soil sample: according to the bulk density of each group of soil samples, the mass of soil sample filled with 150 cm long glass tube was weight, put into the glass tube by stages with a funnel, and tamped gently with a tamping rod to make the density uniform and to reach the same as the actual dry density. Before filling the soil sample, 5 cm quartz sand was put into the bottom of the glass tube.
- Water injection: After filling, the glass tube was vertically inserted into the tray and fixed with a bracket, and then water was injected into the tray. The water surface was 0.5 cm higher than the quartz sand, and the water surface remained unchanged during the experiment.
- Observation: after water injection, after 5 min, 10 min, 30 min, 60 min, 120 min, 0.5 d and 1 d, the soil color in the glass tube was observed every other day, and the height and position of capillary rising at each time were recorded until the rising rate tended to be stable.The capillary rising height measuring device is shown in Figure 3.
- (4)
- Thickness of permafrost
The thickness of the frozen soil layer (frozen soil depth) has a significant control on the movement of soil water. The frozen soil layer can accumulate more water. After the spring thawing, from the surface, the lower frozen soil layer forms a seasonal aquifuge. In this way, the water in the upper frozen soil layer can easily reach the surface under the capillary effect, which leads to the most obvious and serious salt return period in the region. Therefore, the permafrost provides relay conditions for the formation of soil salinization.
3.2. Relationship between Groundwater Depth, Salinity and NDVI
The growth of vegetation in nature depends on the environment in which it grows. The growth status of vegetation in an area is often the result of multiple factors such as sunlight, air, water and soil nutrients. These factors usually change with time and space. The spatial differences are affected by soil properties and topography. Therefore, we think that the depth of groundwater is the main factor for the growth of vegetation in typical areas, and salinity is another important factor for controlling the development of vegetation in typical salinization areas. Therefore, using remote sensing data to quantitatively describe the growth of vegetation in the study area, so as to further analyze the relationship between vegetation growth and groundwater depth and mineralization.
In remote sensing data, the normalized difference vegetation index (NDVI) is an important index to characterize the state of surface vegetation. It is very sensitive to the change of vegetation and is widely used in the study of surface vegetation cover and vegetation growth. At the same time, it can analyze the impact of weather and climate events on the biosphere. It has been widely used in the study of global and regional temporal and spatial changes of terrestrial vegetation ecosystem and its response to climate change.
If the NDVI value is large, it indicates that the vegetation growth is good. If the NDVI value is small, it indicates that the vegetation development is poor. Through the analysis and calculation of remote sensing data, the NDVI value of typical area is calculated by using the grid calculator tool of ArcGIS software.
NDVI = (NIR − R)/(NIR + R)
NIR and R are DN values of near infrared band (Band 4) and red band (band 3) of TM, respectively.
After calculating the NDVI value of the study area, the measured water table depth and groundwater salinity were interpolated according to the pixel size of NDVI value (to ensure the same pixel size is helpful for the comparative analysis of values under the same pixel size), and then the corresponding water table depth (salinity) and NDVI data in each pixel space were obtained. Then, the average NDVI value of each interval can be obtained by taking the water level burial depth (salinity) as an interval of 1 m, and the corresponding NDVI mean value of each interval can be obtained. The two curves can be drawn to get the relationship curve between NDVI mean value and phreatic water level burial depth (salinity).
4. Results and Discussion
4.1. Improved Traditional Groundwater Ecological Level Calculation Results
4.1.1. Characteristics of Soil Types
Through sampling analysis, there are two types of soil in the study area, loam and sandy loam. The size of loam is between 0.2 mm and 0.05 mm, with 40% sand, 20% clay and 40% silt. Sandy loam contains 60% sand, 10% clay and 30% silt.
4.1.2. Hydrochemical Characteristics
The overall terrain of the study area is high in the southwest and low in the northeast. The southwest is mostly hilly land, the middle is mainly alluvial lacustrine lowland, and the northeast is flat. Topography can generally determine the flow direction of surface water and groundwater, thus affecting the regional distribution of Groundwater Hydrochemical Characteristics in the study area. When the terrain is high, the energy of driving groundwater movement is high, the groundwater movement is relatively fast, the groundwater runoff is strong and the groundwater buried depth is large, so the groundwater quality is relatively good. On the contrary, in low-lying terrain, the driving energy of groundwater is low, the groundwater movement is slow, the runoff is relatively weak, and the groundwater depth is small, so the groundwater quality is relatively poor.
The chemical characteristics of groundwater in this area are controlled by geology, geomorphology, groundwater occurrence conditions, groundwater depth and circulation conditions. Due to shallow burial, strong evaporation and concentration of pore phreatic water, slow runoff, and long leaching time, the hydrochemical types of the water in this layer are more complex, most of which are sodium bicarbonate, sodium calcium, sodium, sodium magnesium, sodium magnesium calcium type water, with large salinity of 200–2500 mg/L, and the total hardness of the groundwater is between 200–1500 mg/L. The content of fluorine ion is generally high, ranging from 2.31 to 2.73 mg/L. The content of iron and manganese ion is high in some areas, and the content of nitrate ion is 170 to 300 mg/L. Most of them are not suitable for drinking.
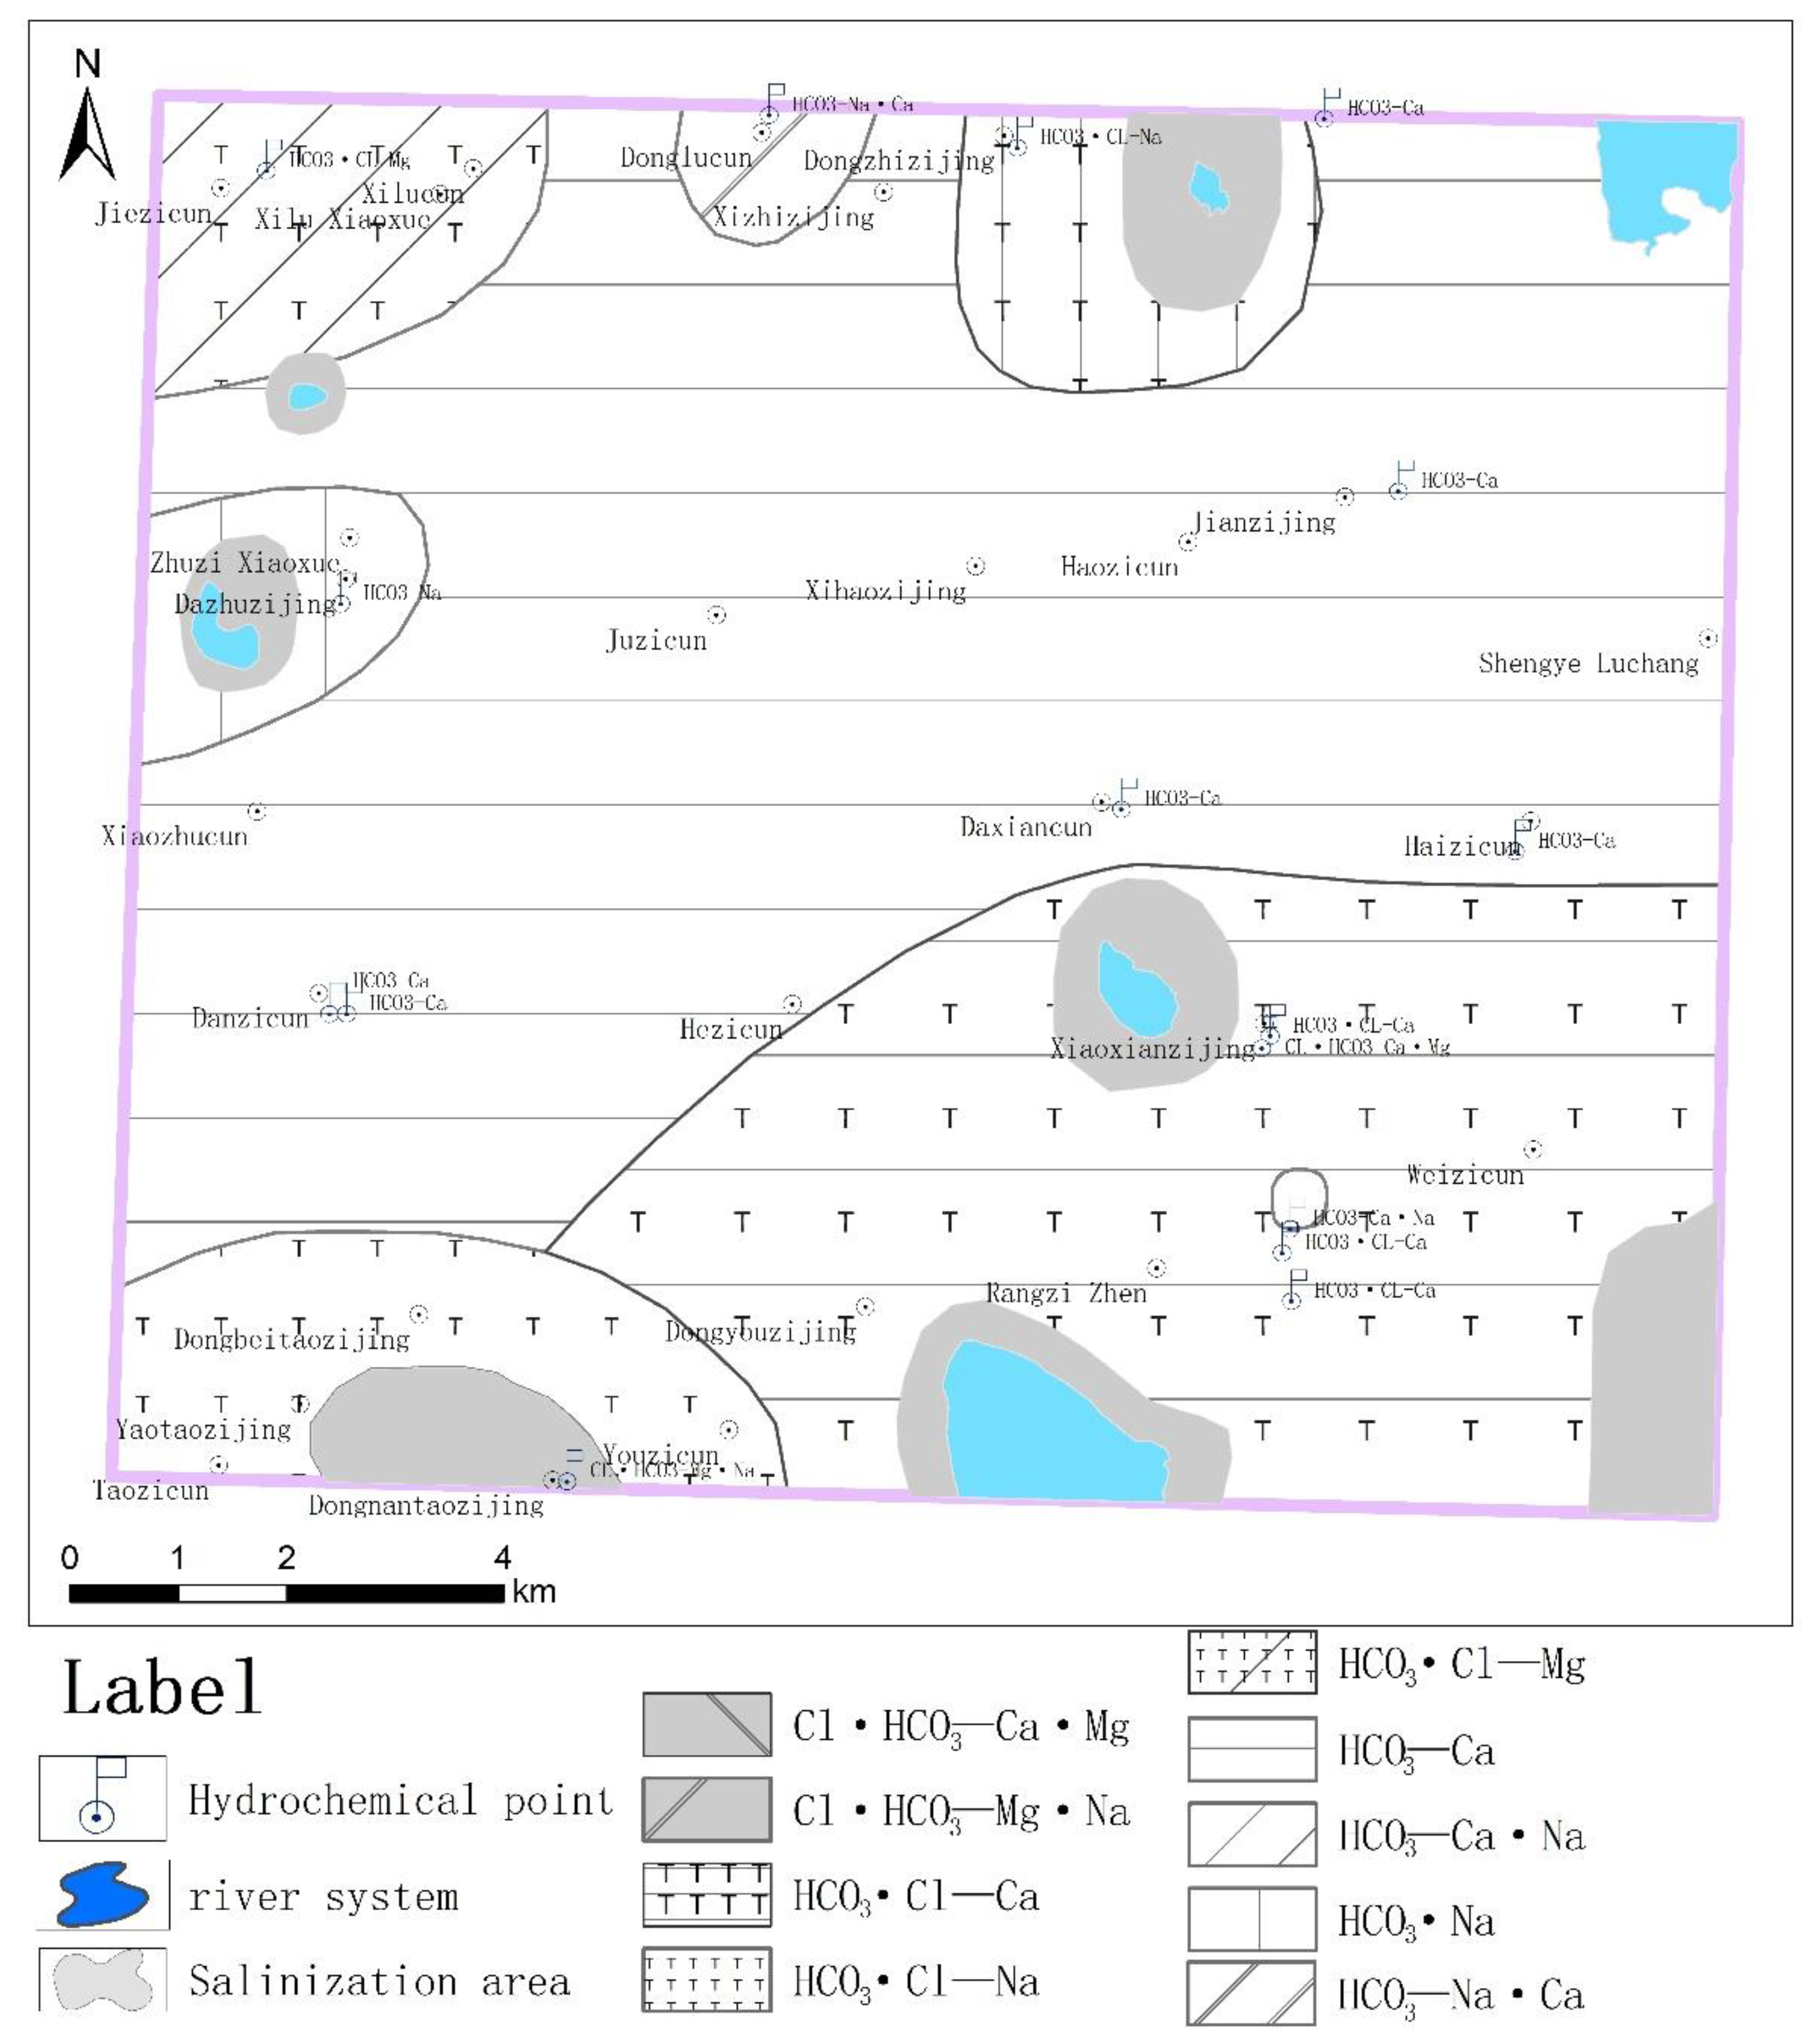
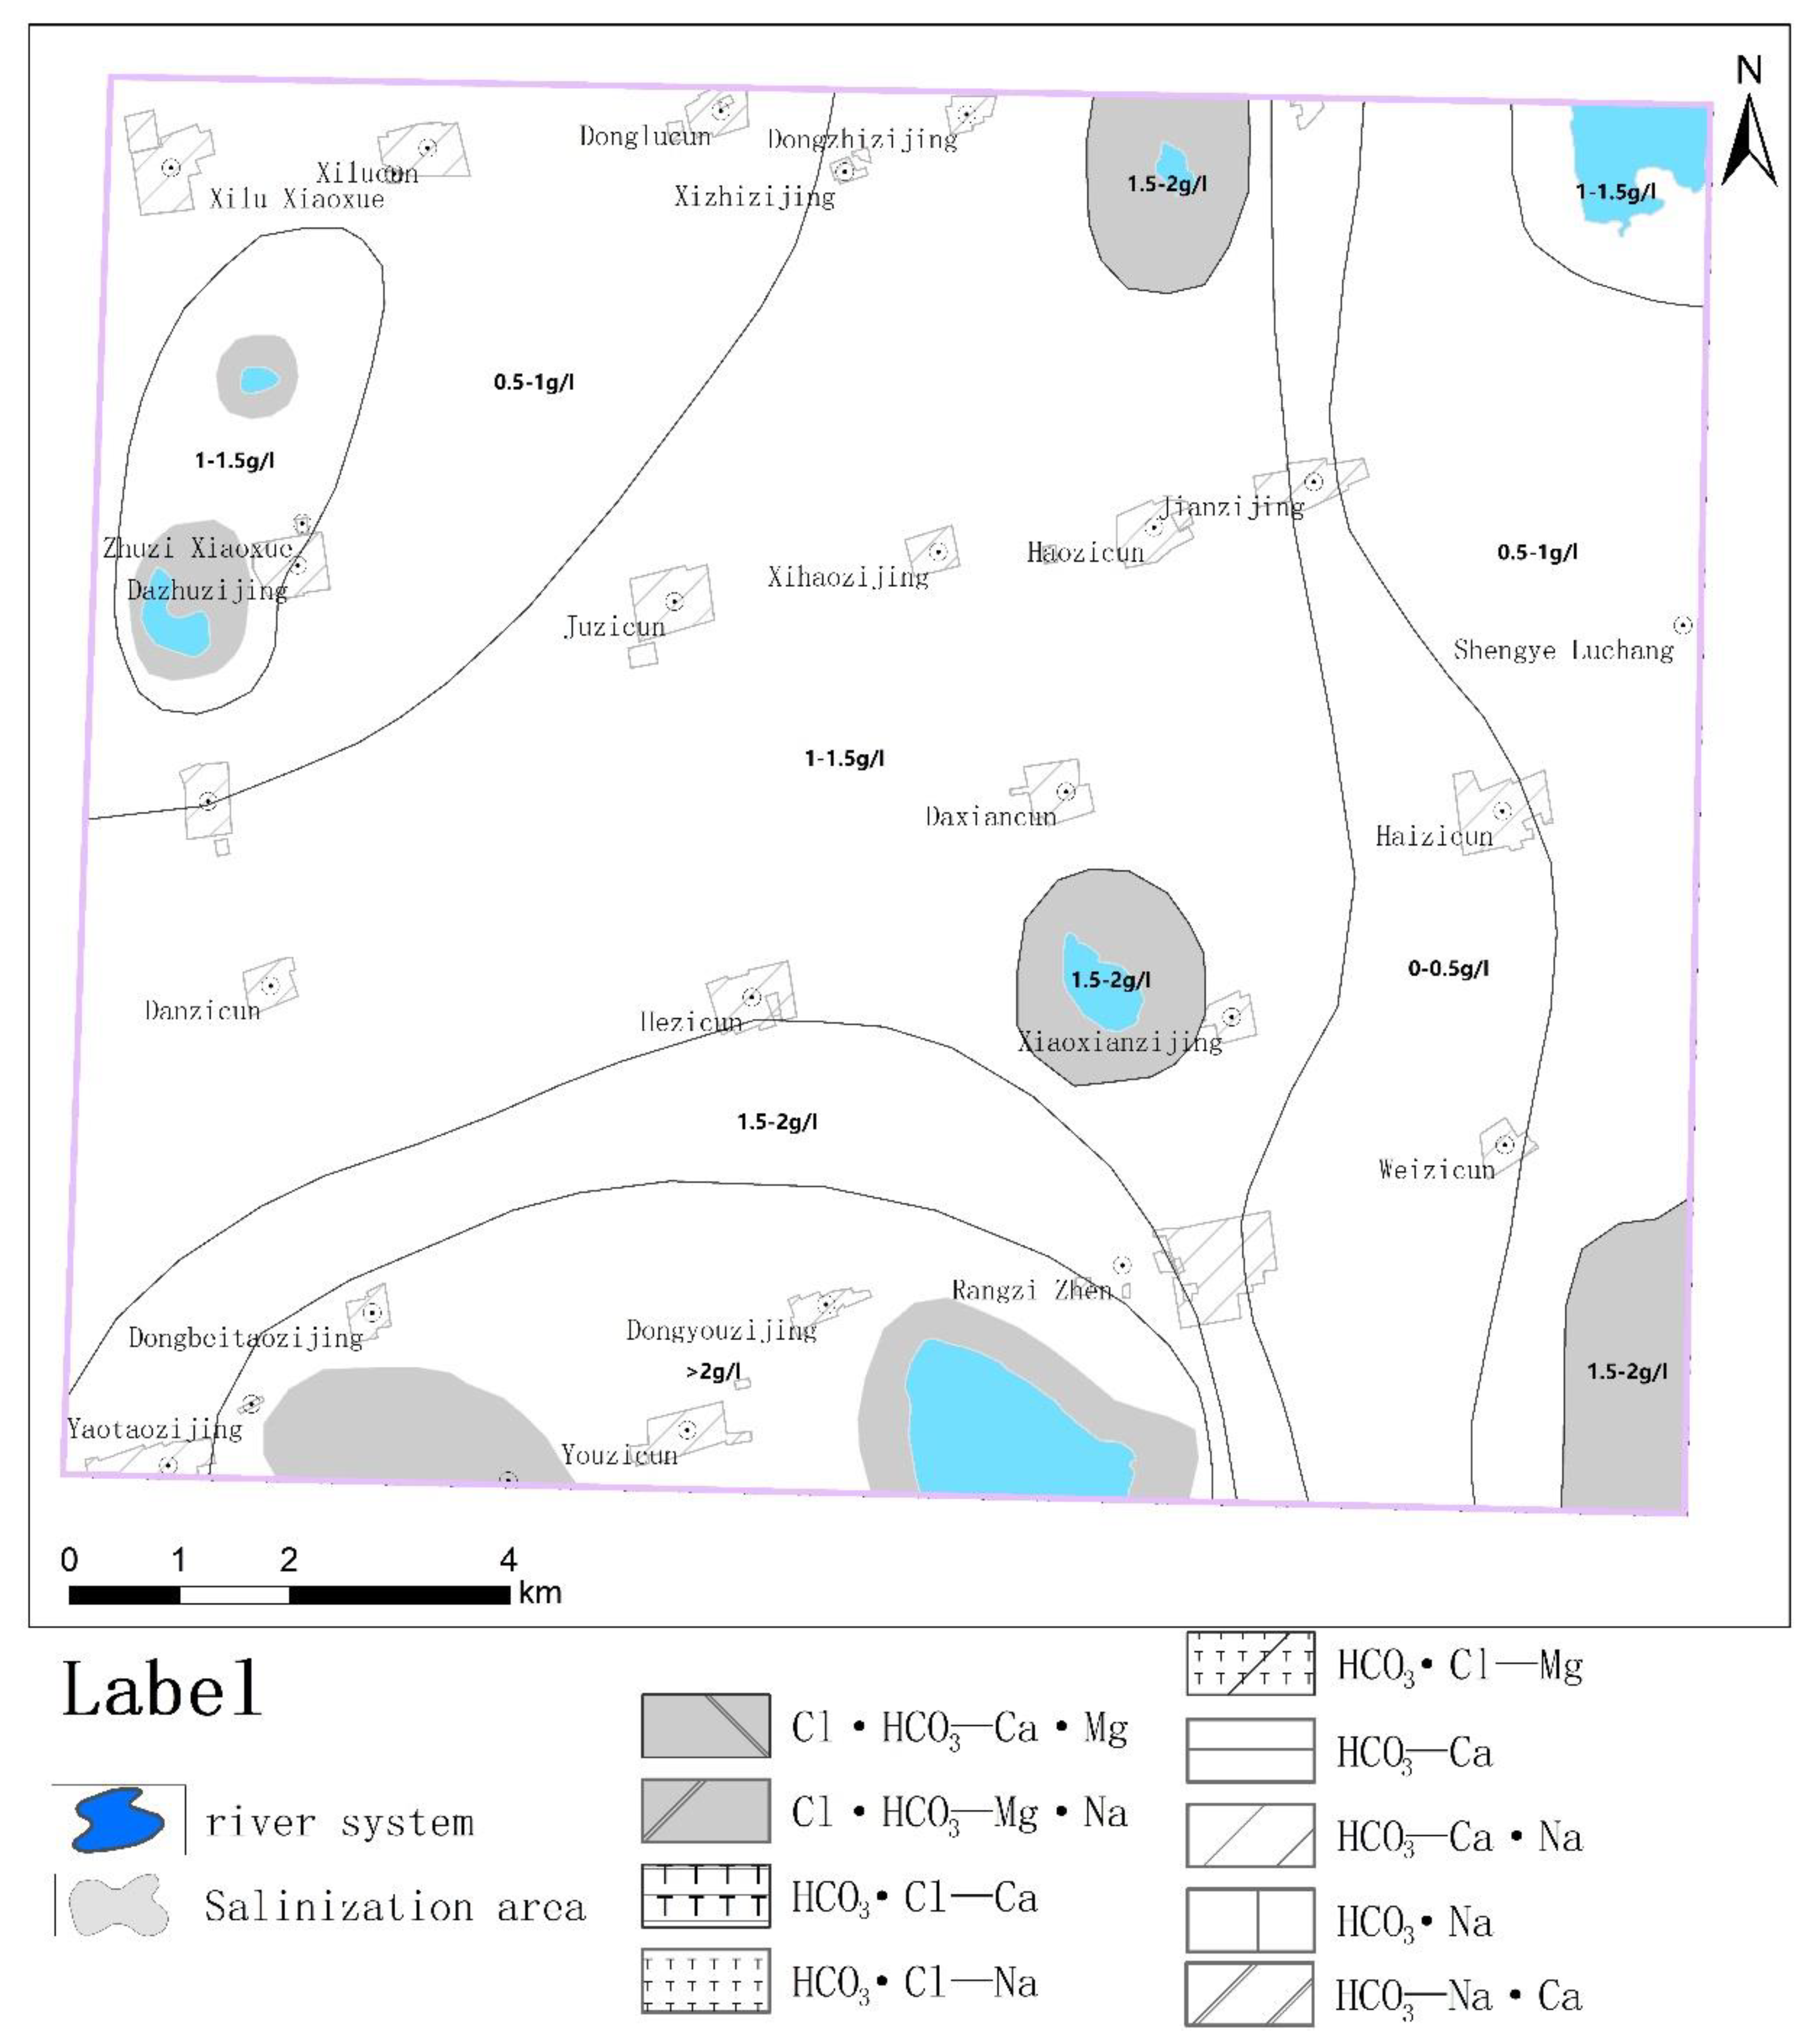
The topography of the study area determines that from southwest to northeast, the hydrochemical types of groundwater show the following obvious change trend: HCO3-Ca·Na type→HCO3·CL-Na·CA type→Cl·HCO3-Na type. The change trend of hydrochemical types of groundwater is consistent with the change of topography. The hydrochemical types of typical salinization areas are shown in Figure 4.
Based on the results of field investigation and laboratory analysis, the distribution characteristics of groundwater salinity in the salinized area were analyzed (Figure 5). The mineralization degree of groundwater in the southwest of the study area is relatively high, basically >2 g/L. The mineralization degree of groundwater in the southwest of the central part is 1.5–2 g/L. The mineralization degree of groundwater in the middle part is 1.0–1.5 g/L. The mineralization degree of groundwater in the east part is relatively low, and the mineralization degree of groundwater in most areas is 0–1 g/L. The salinity of phreatic water is greater than or equal to 1 g/L.
4.1.3. Capillary Height and Root Thickness of Vegetation
The capillary rise height test was analyzed and determined by the direct observation method.
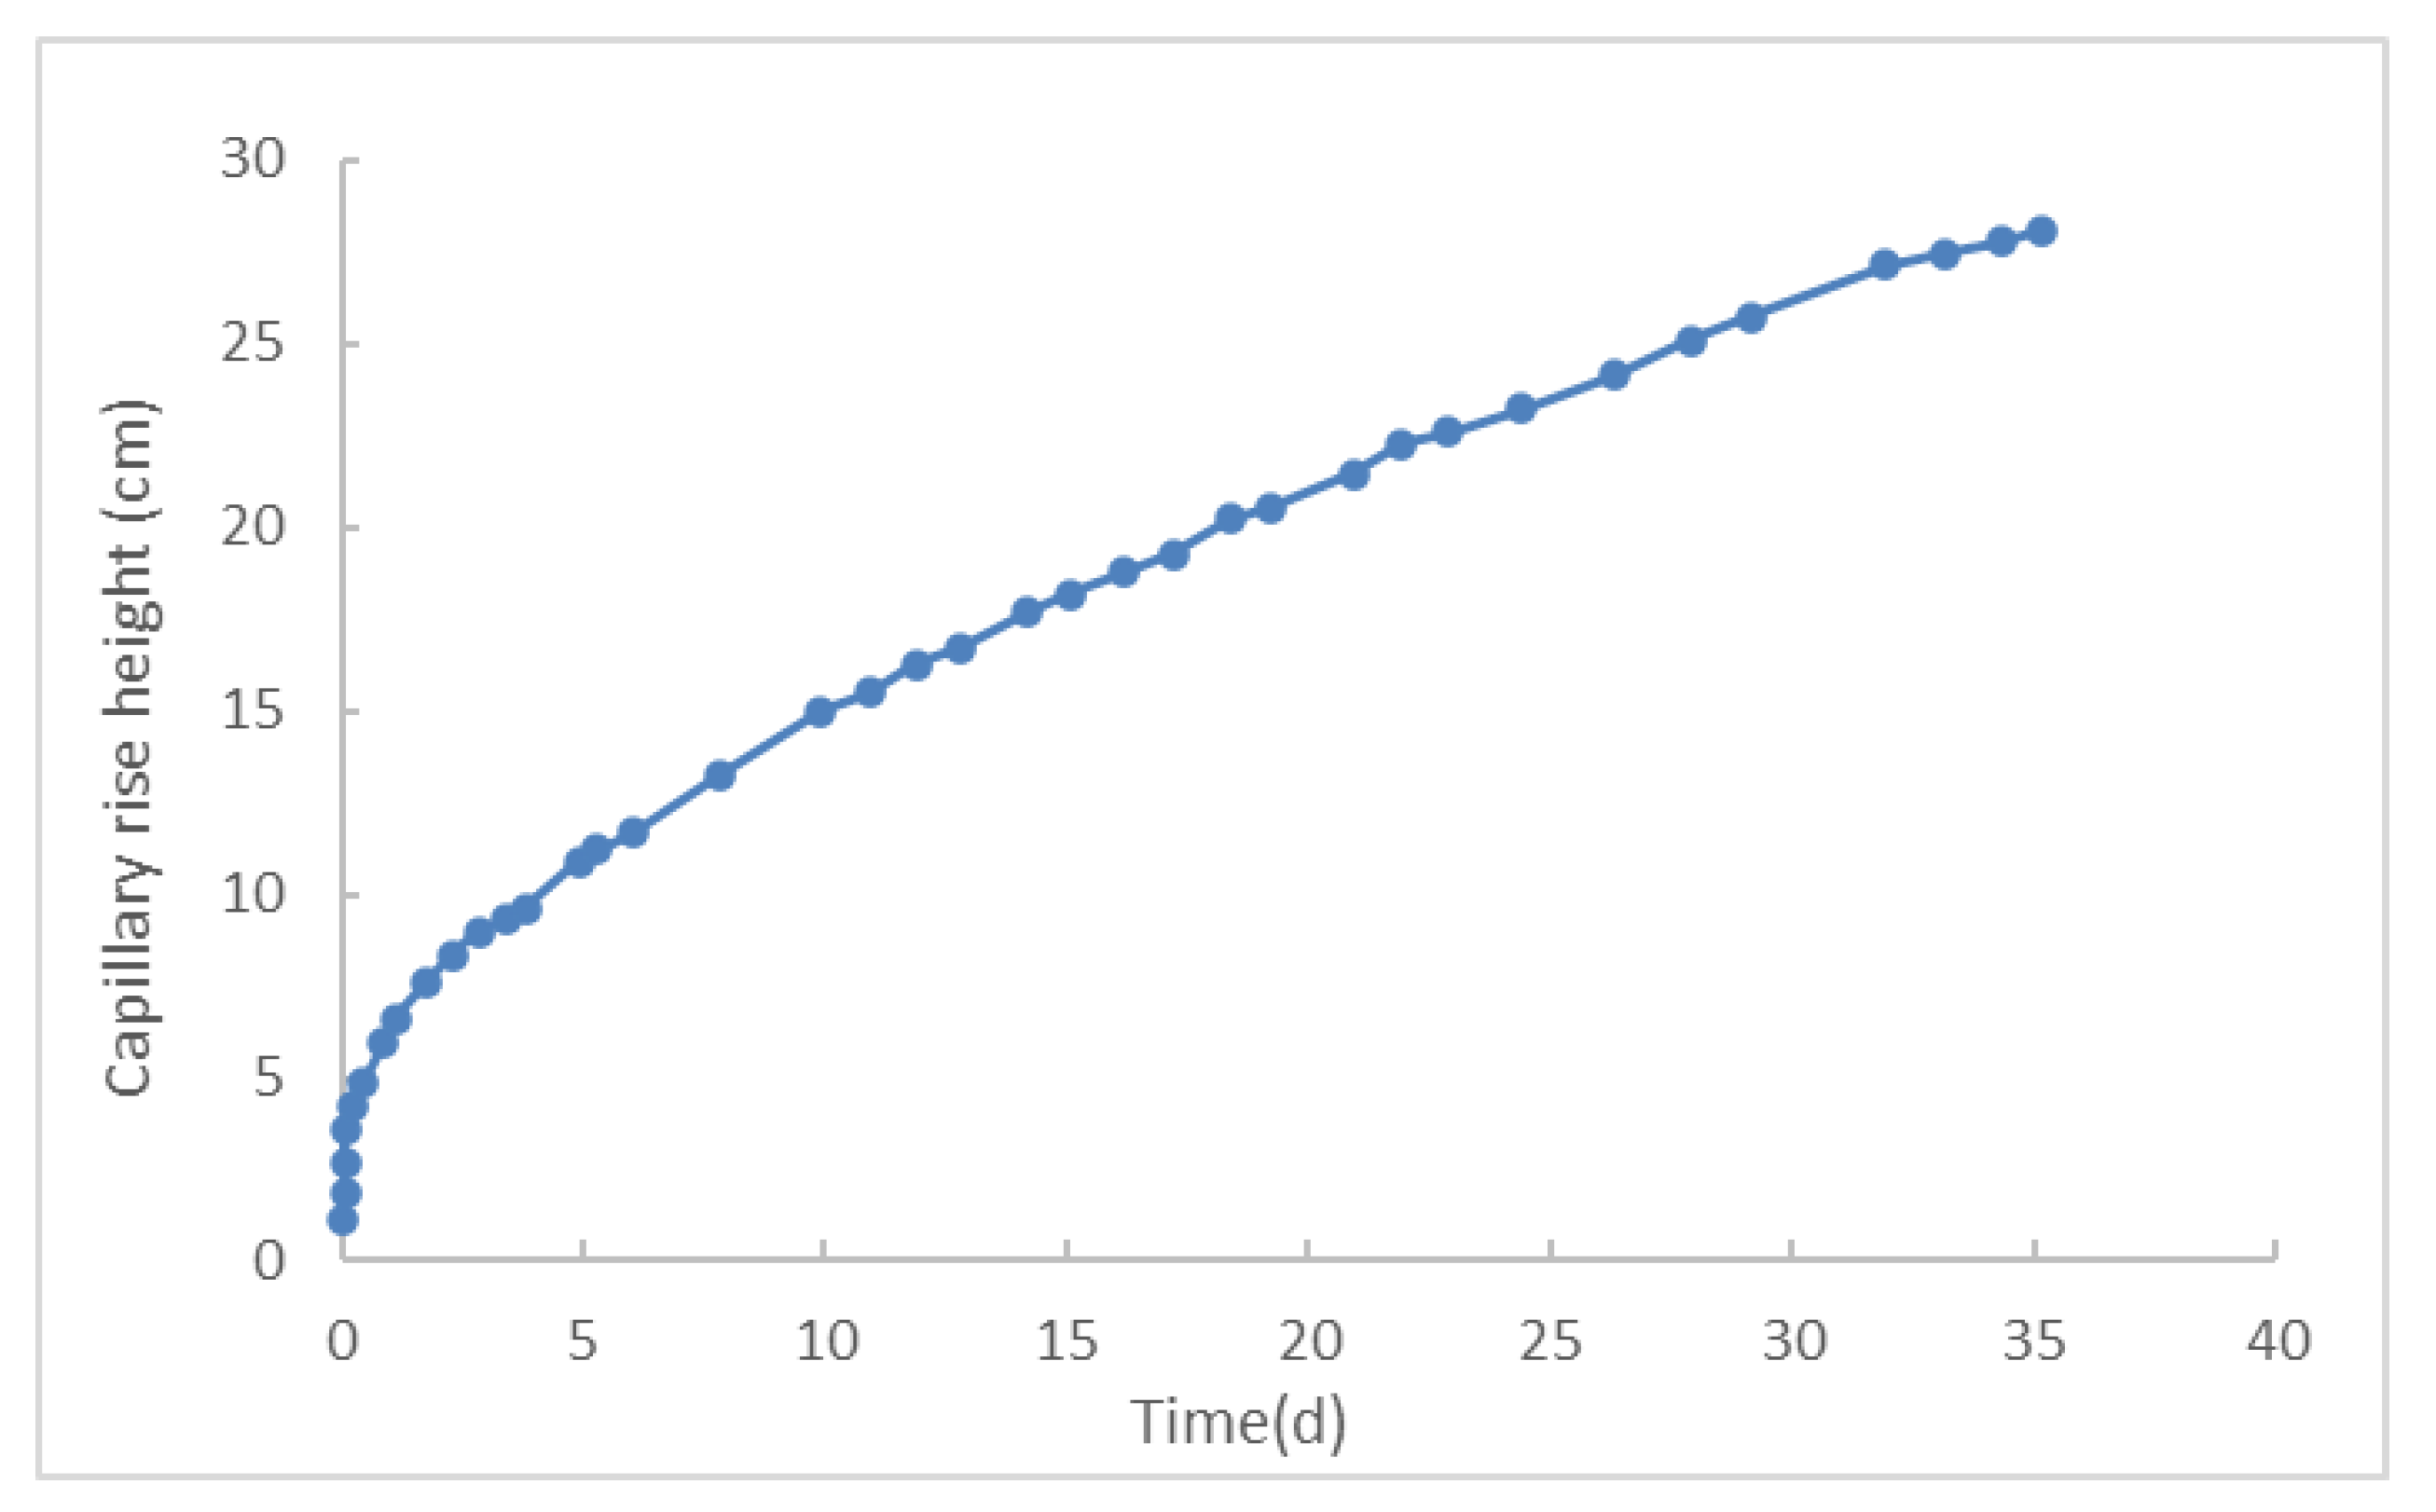
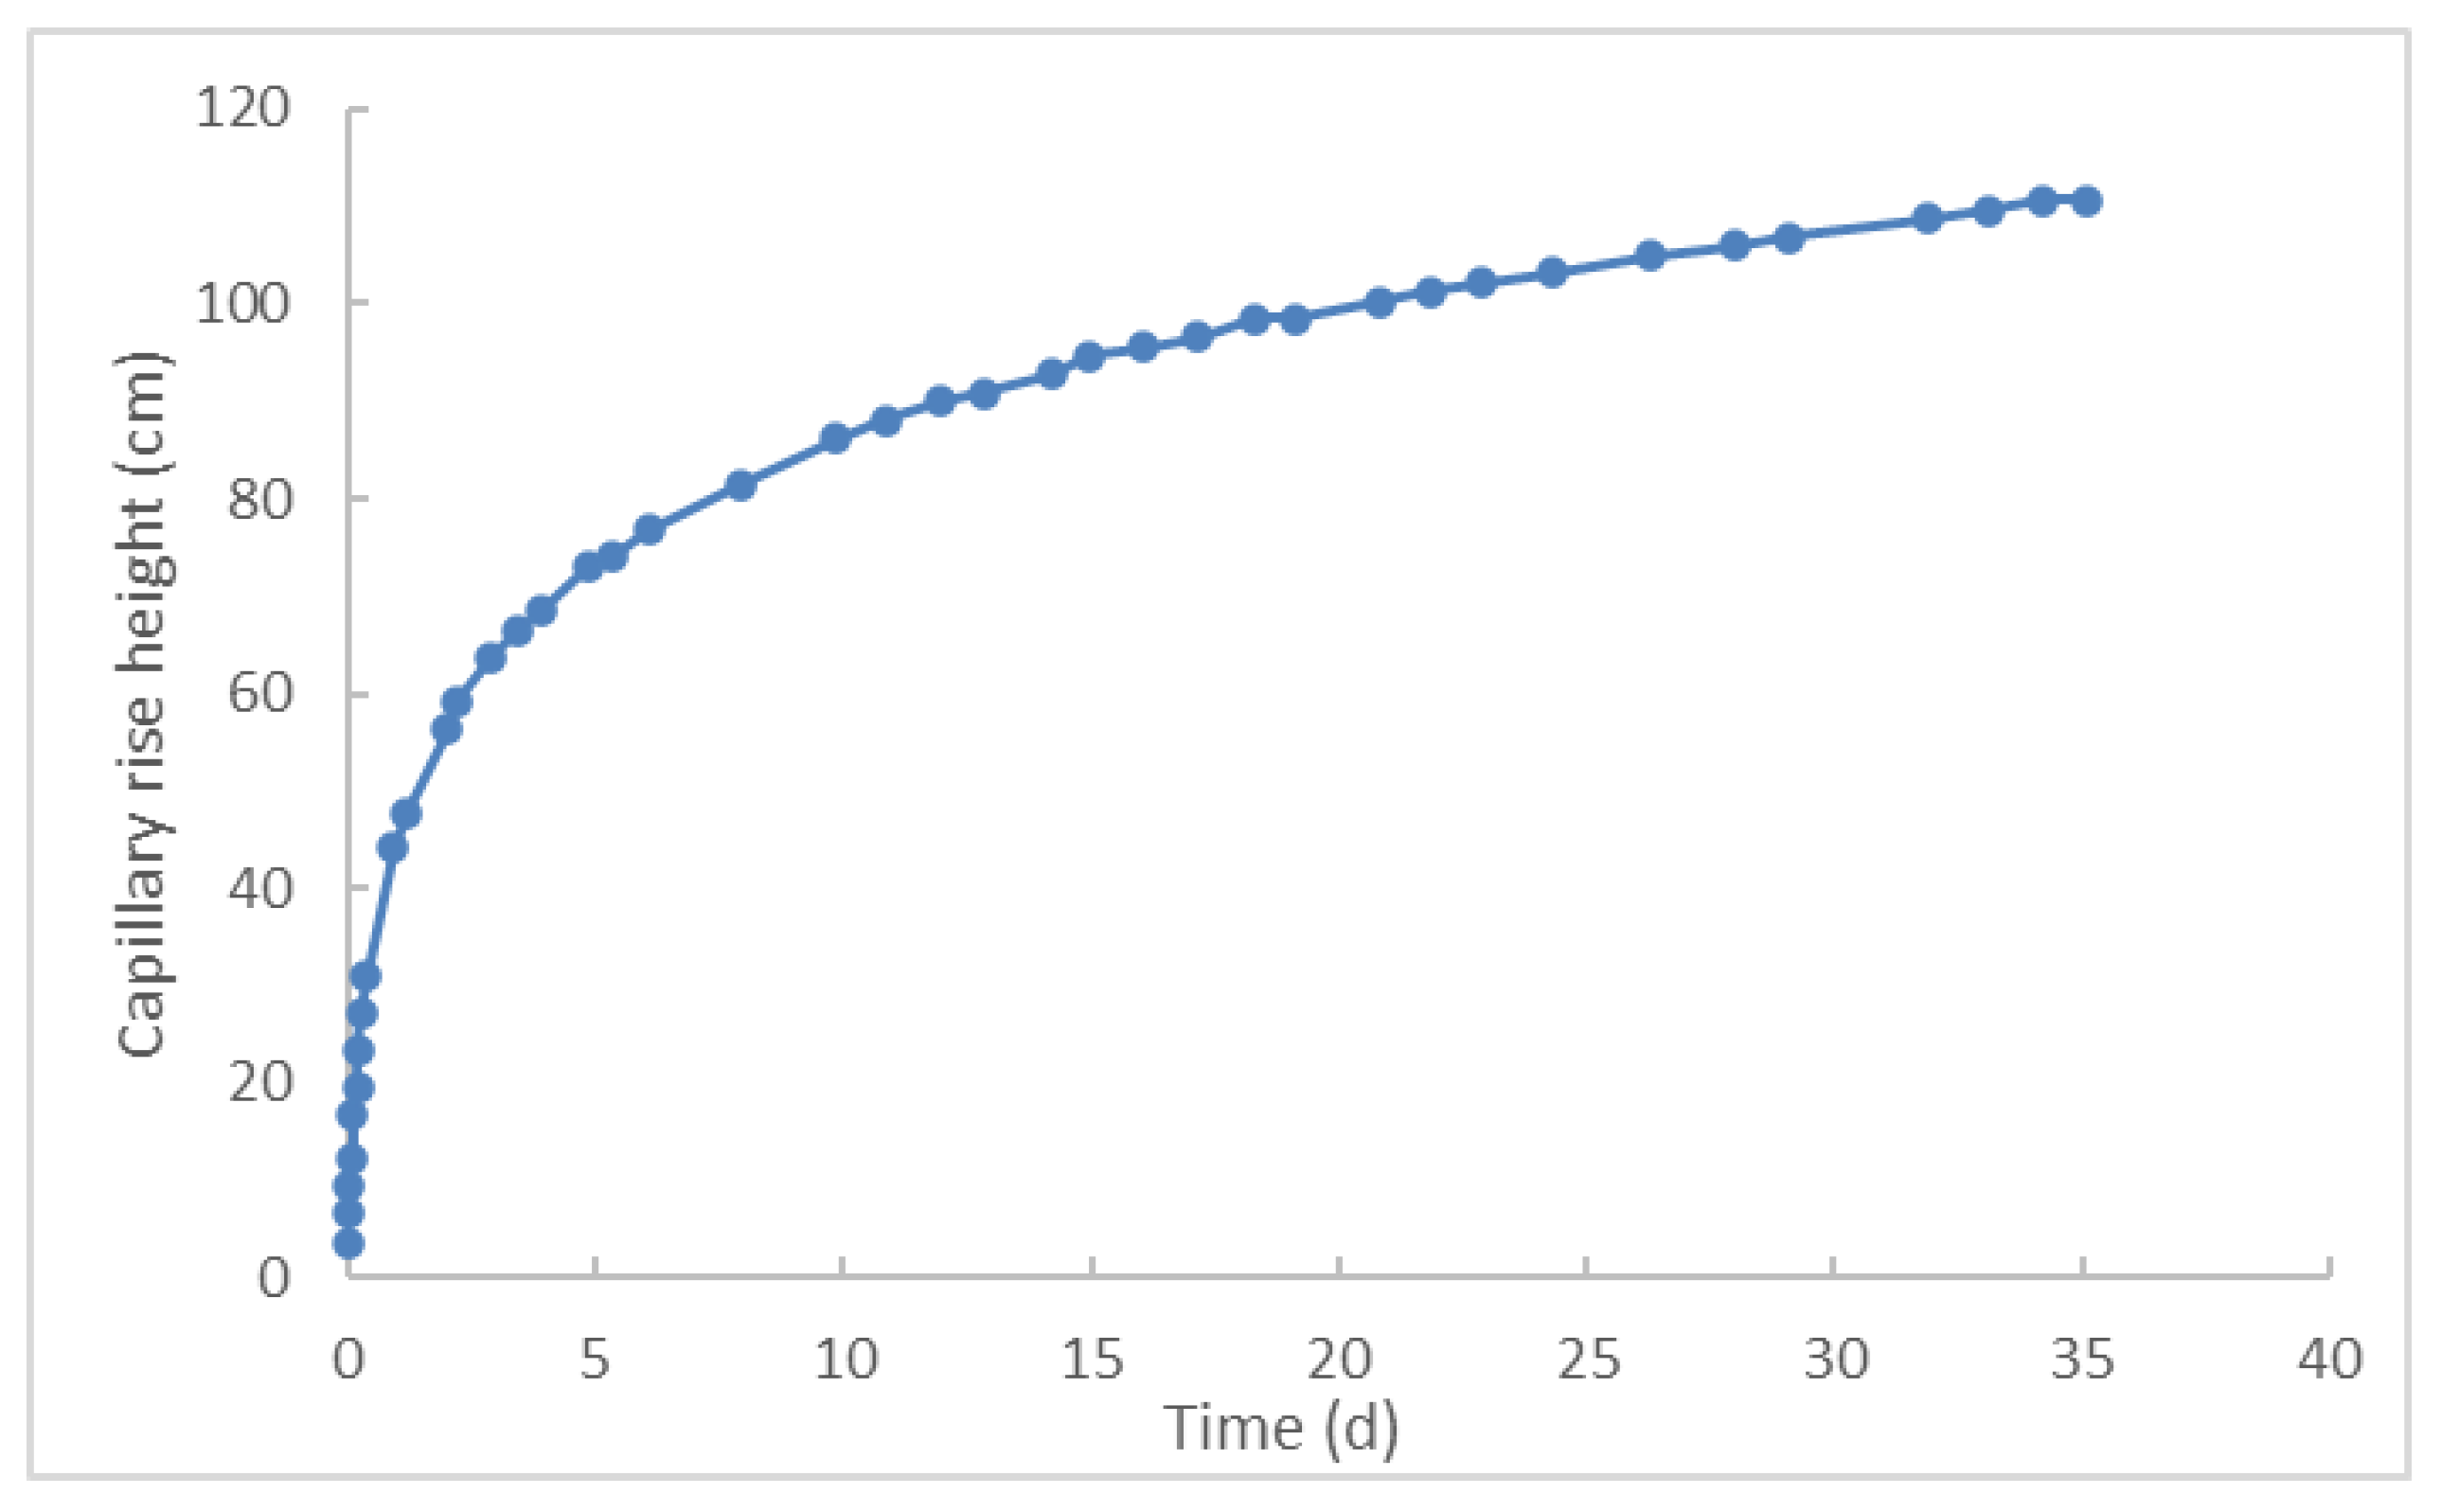
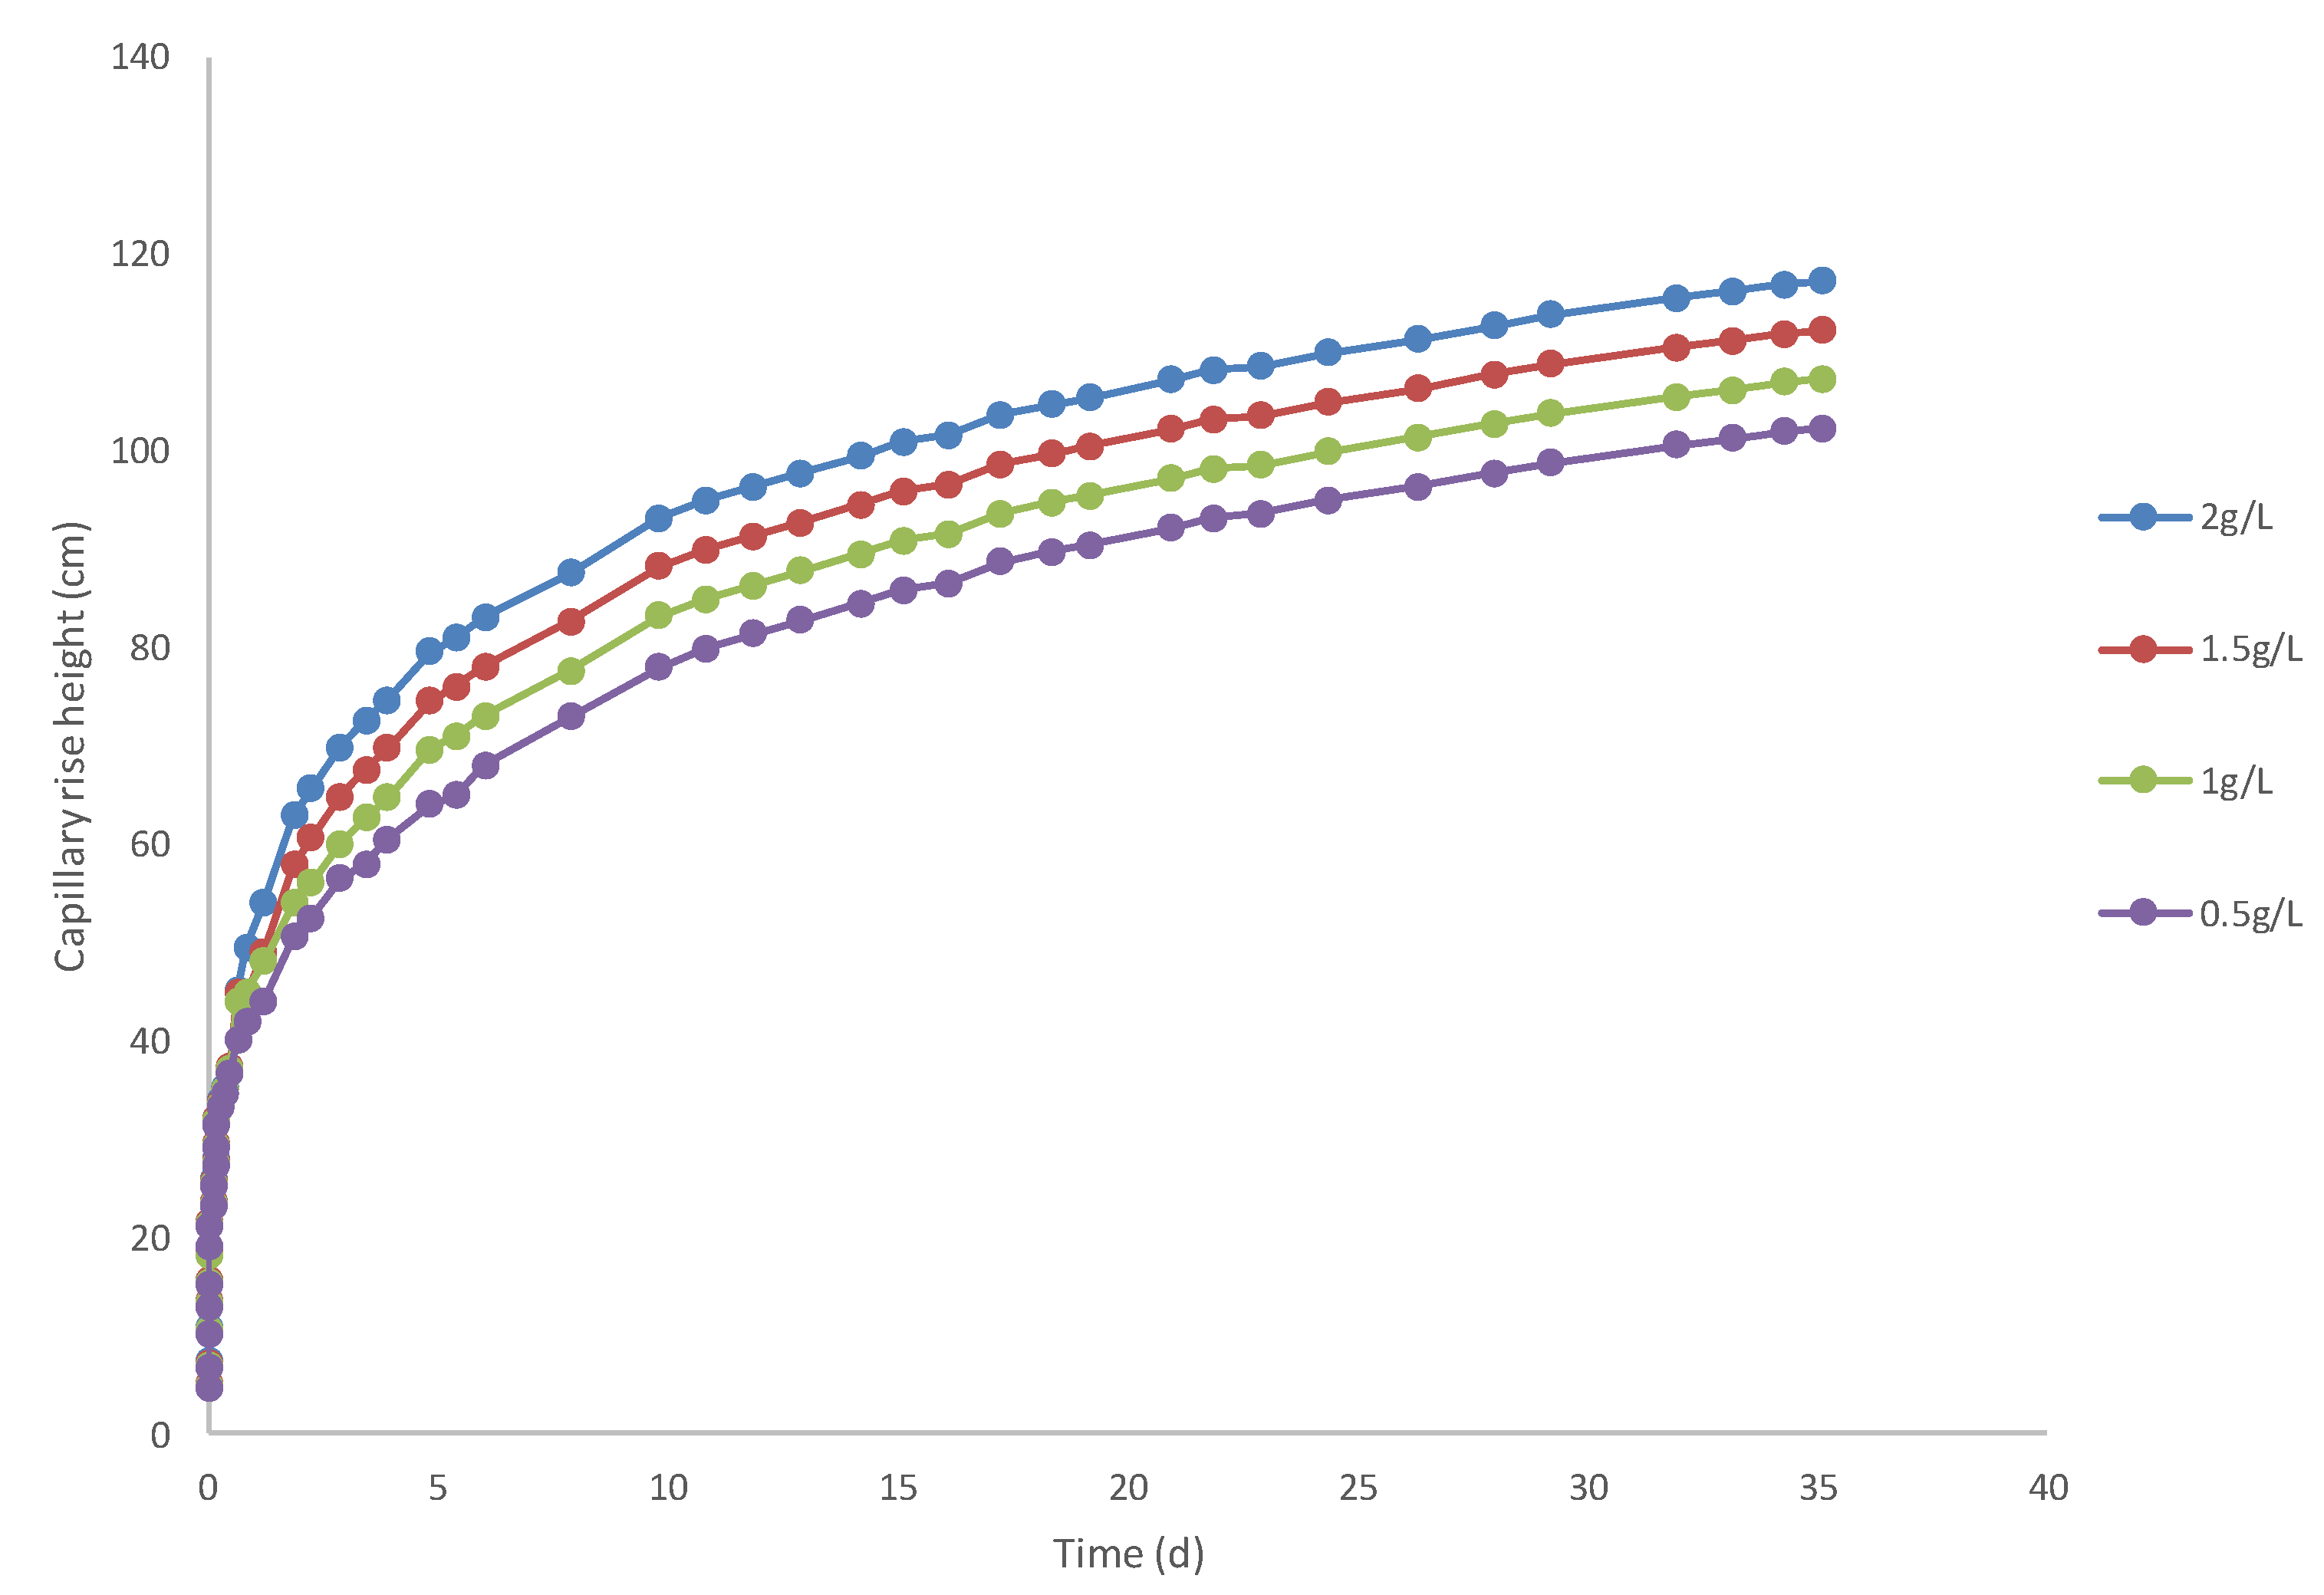
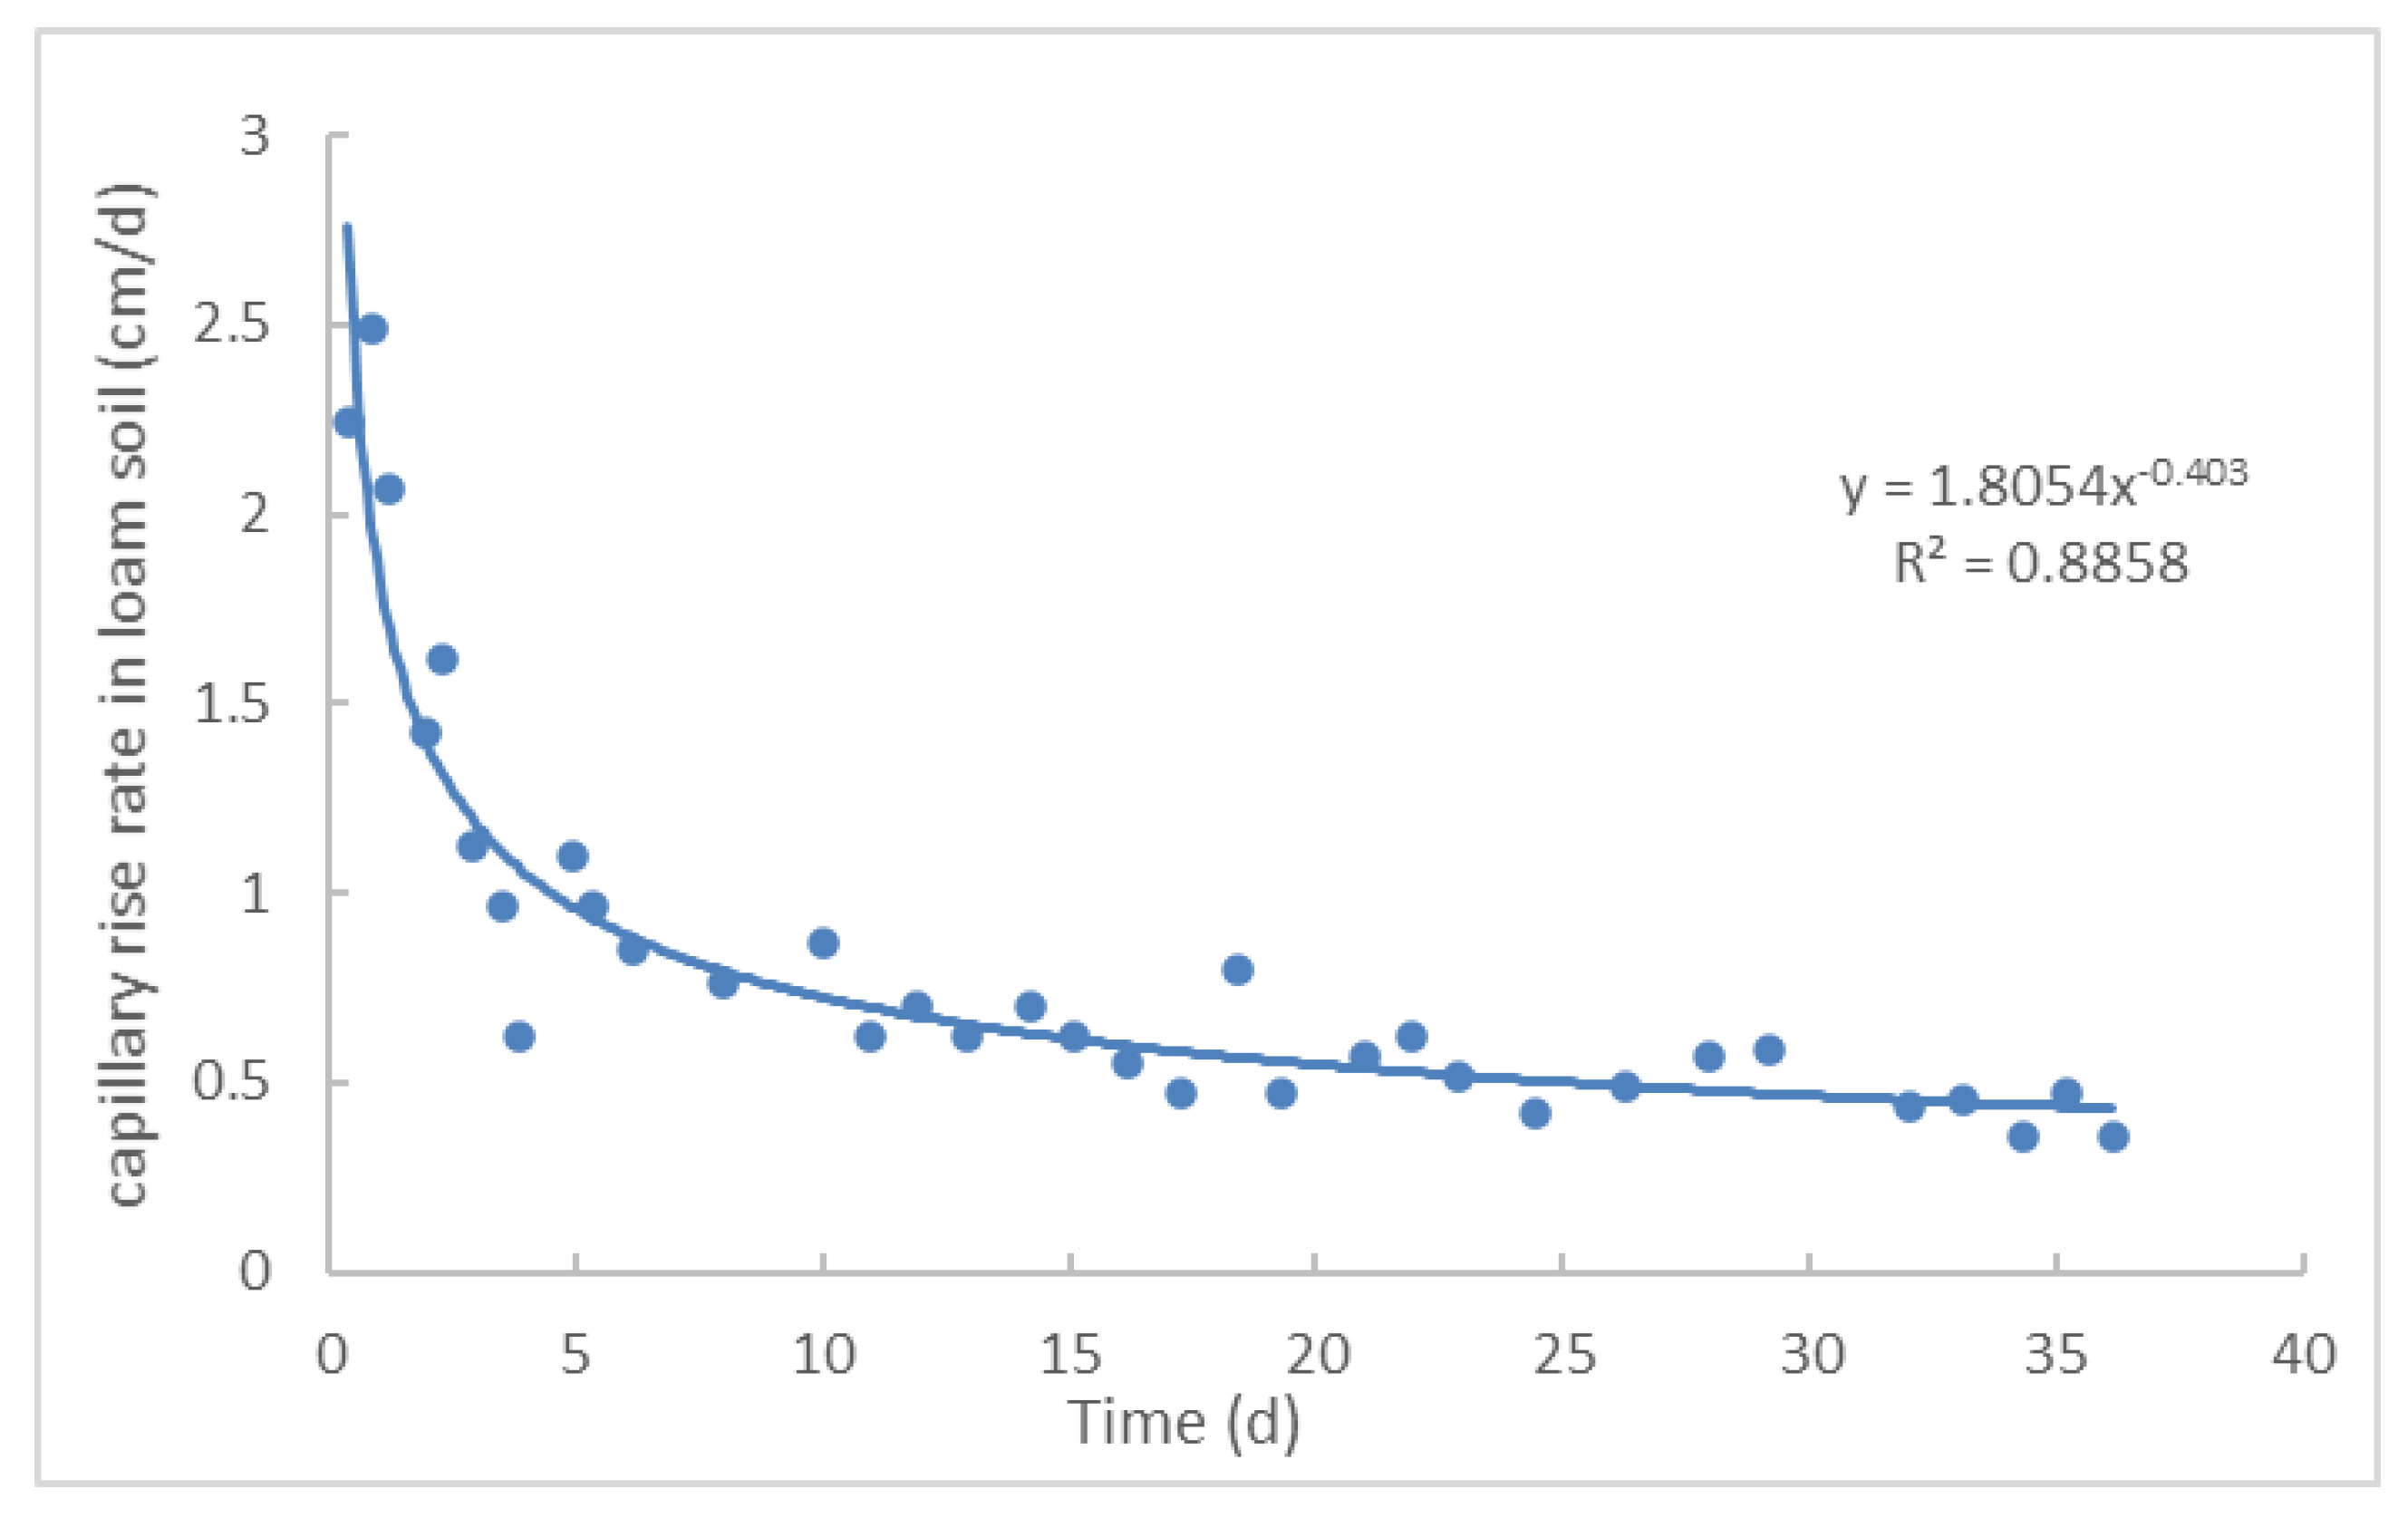
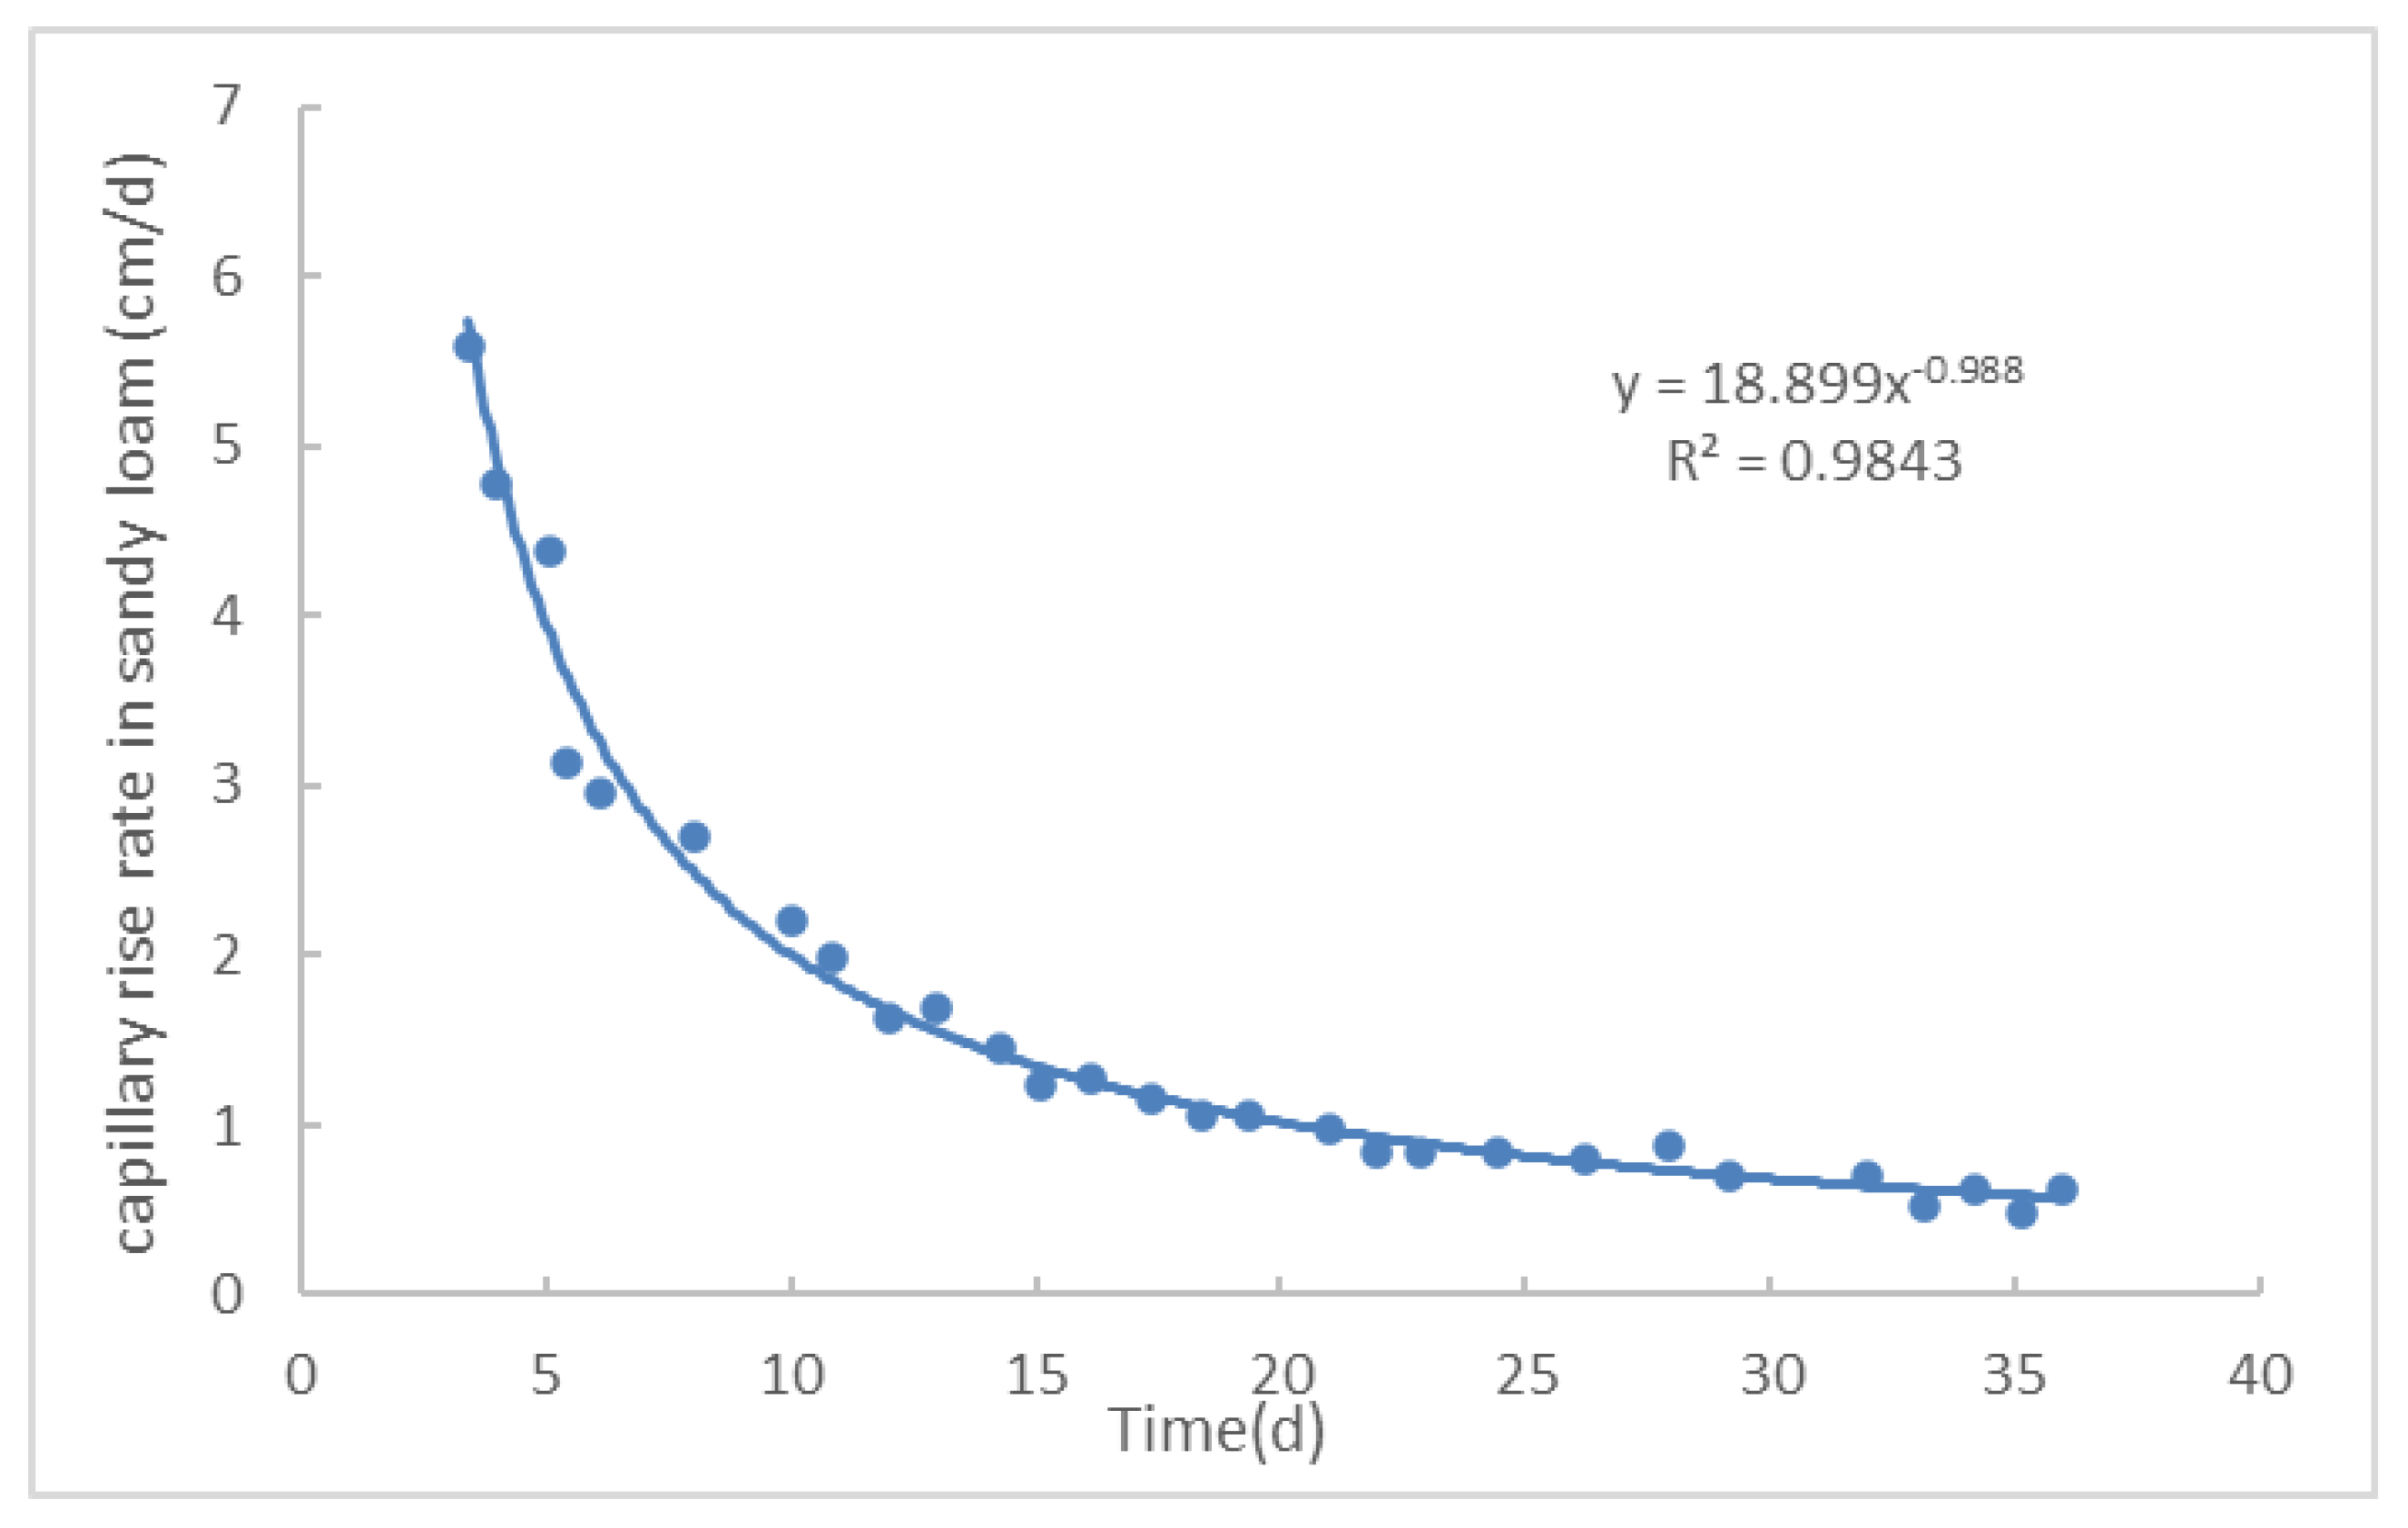
After 35 days of observation, the capillary rise height data under different experimental treatments were obtained. After sorting out the experimental data, it can be seen that the capillary height of different soils increased rapidly in the first 5 days and then increased steadily with the passage of time. The experimental results are shown in Figure 6, Figure 7 and Figure 8. The observation data after steady rising were used to calculate the capillary rising height rate in different experimental devices, and the integral diagram was made, as shown in Figure 9 and Figure 10.
It can be seen from the figure that the rising rate of different soils is exponentially related to time. The fitting curve was obtained by trend analysis, and the fitting degree is mostly above 0.9. Therefore, it is feasible to use the fitting curve to predict the change of soil capillary rising rate with time. Due to the long duration of soil capillary rising height, limited by the research time, the time when soil stopped rising was not observed, so the fitting curve was used to calculate the limit rising height. When the rising rate was less than 0.1 cm/d, the maximum height of capillary rising was considered to be reached. The maximum height of capillary rising in each group is calculated as shown in Table 2.
From the comparison of capillary rise height of sandy loam under different salinity water conditions, it can be concluded that the maximum capillary rise height increases gradually with the increase of salinity, and the average is that the maximum capillary rise height increases by 10 cm for every 1 g/L increase of salinity. This experimental conclusion is consistent with the empirical value, so this method can be used when considering the influence of groundwater salinity on capillary rise height value.
The vegetation type in the study area belongs to the transitional zone type between Mongolian Plateau and Chang Bai Mountain vegetation area. According to the field investigation and referring to the relevant conclusions about the root length of the main herbaceous vegetation in the north of China in the herbaceous root system of northern China and the theory of crop cultivation (Northern Edition), the root layer thickness of herbaceous plants in the salinized area was determined. See Table 3 for details.
- Thickness of permafrost
The frozen soil layer in the region starts in the middle of November every year. From the surface freezing, the thickness of the frozen soil layer gradually increases with the cooling of the air temperature, and basically reaches the maximum frozen soil depth from January to February. Generally, the depth of the frozen soil layer in the region is 1.80–2.20 m. By the end of March or early April of the next year, the frozen soil begins to thaw but mostly does not thaw. By the middle of May, the frozen soil is clear.
According to the improved traditional groundwater ecological level calculation method, the ecological threshold range of salinization area is the sum of the thickness of vegetation root and the maximum capillary height of soil affected by groundwater salinity. The capillary rising height of soil and the thickness of vegetation root layer under different land use types are projected into the typical salinization area. The capillary rising height and the thickness of root layer in each calculation unit are extracted and then added. Considering the response of permafrost, the final value is taken as the calculation unit. The upper limit range of ecological groundwater level in each calculation area is shown in Table 4.
4.2. Relationship between Groundwater Depth, Salinity and NDVI Value
4.2.1. Relationship between Groundwater Depth and NDVI
According to the analysis of NDVI index in the study area, as shown in Figure 5, for typical salinization areas, those with vegetation coverage less than 0.1 have no vegetation coverage, those with vegetation coverage less than 0 are generally water bodies, and those with vegetation coverage greater than 0.3 are areas with better vegetation coverage.
It can be clearly seen from the curve that when the groundwater depth is about 4.8 m to 6.1 m, the average NDVI is the largest and the vegetation coverage is higher; when the groundwater depth is less than 2.2 M, the vegetation is basically undeveloped and the average NDVI is less than 0.1.
4.2.2. Relationship between Groundwater Salinity and NDVI
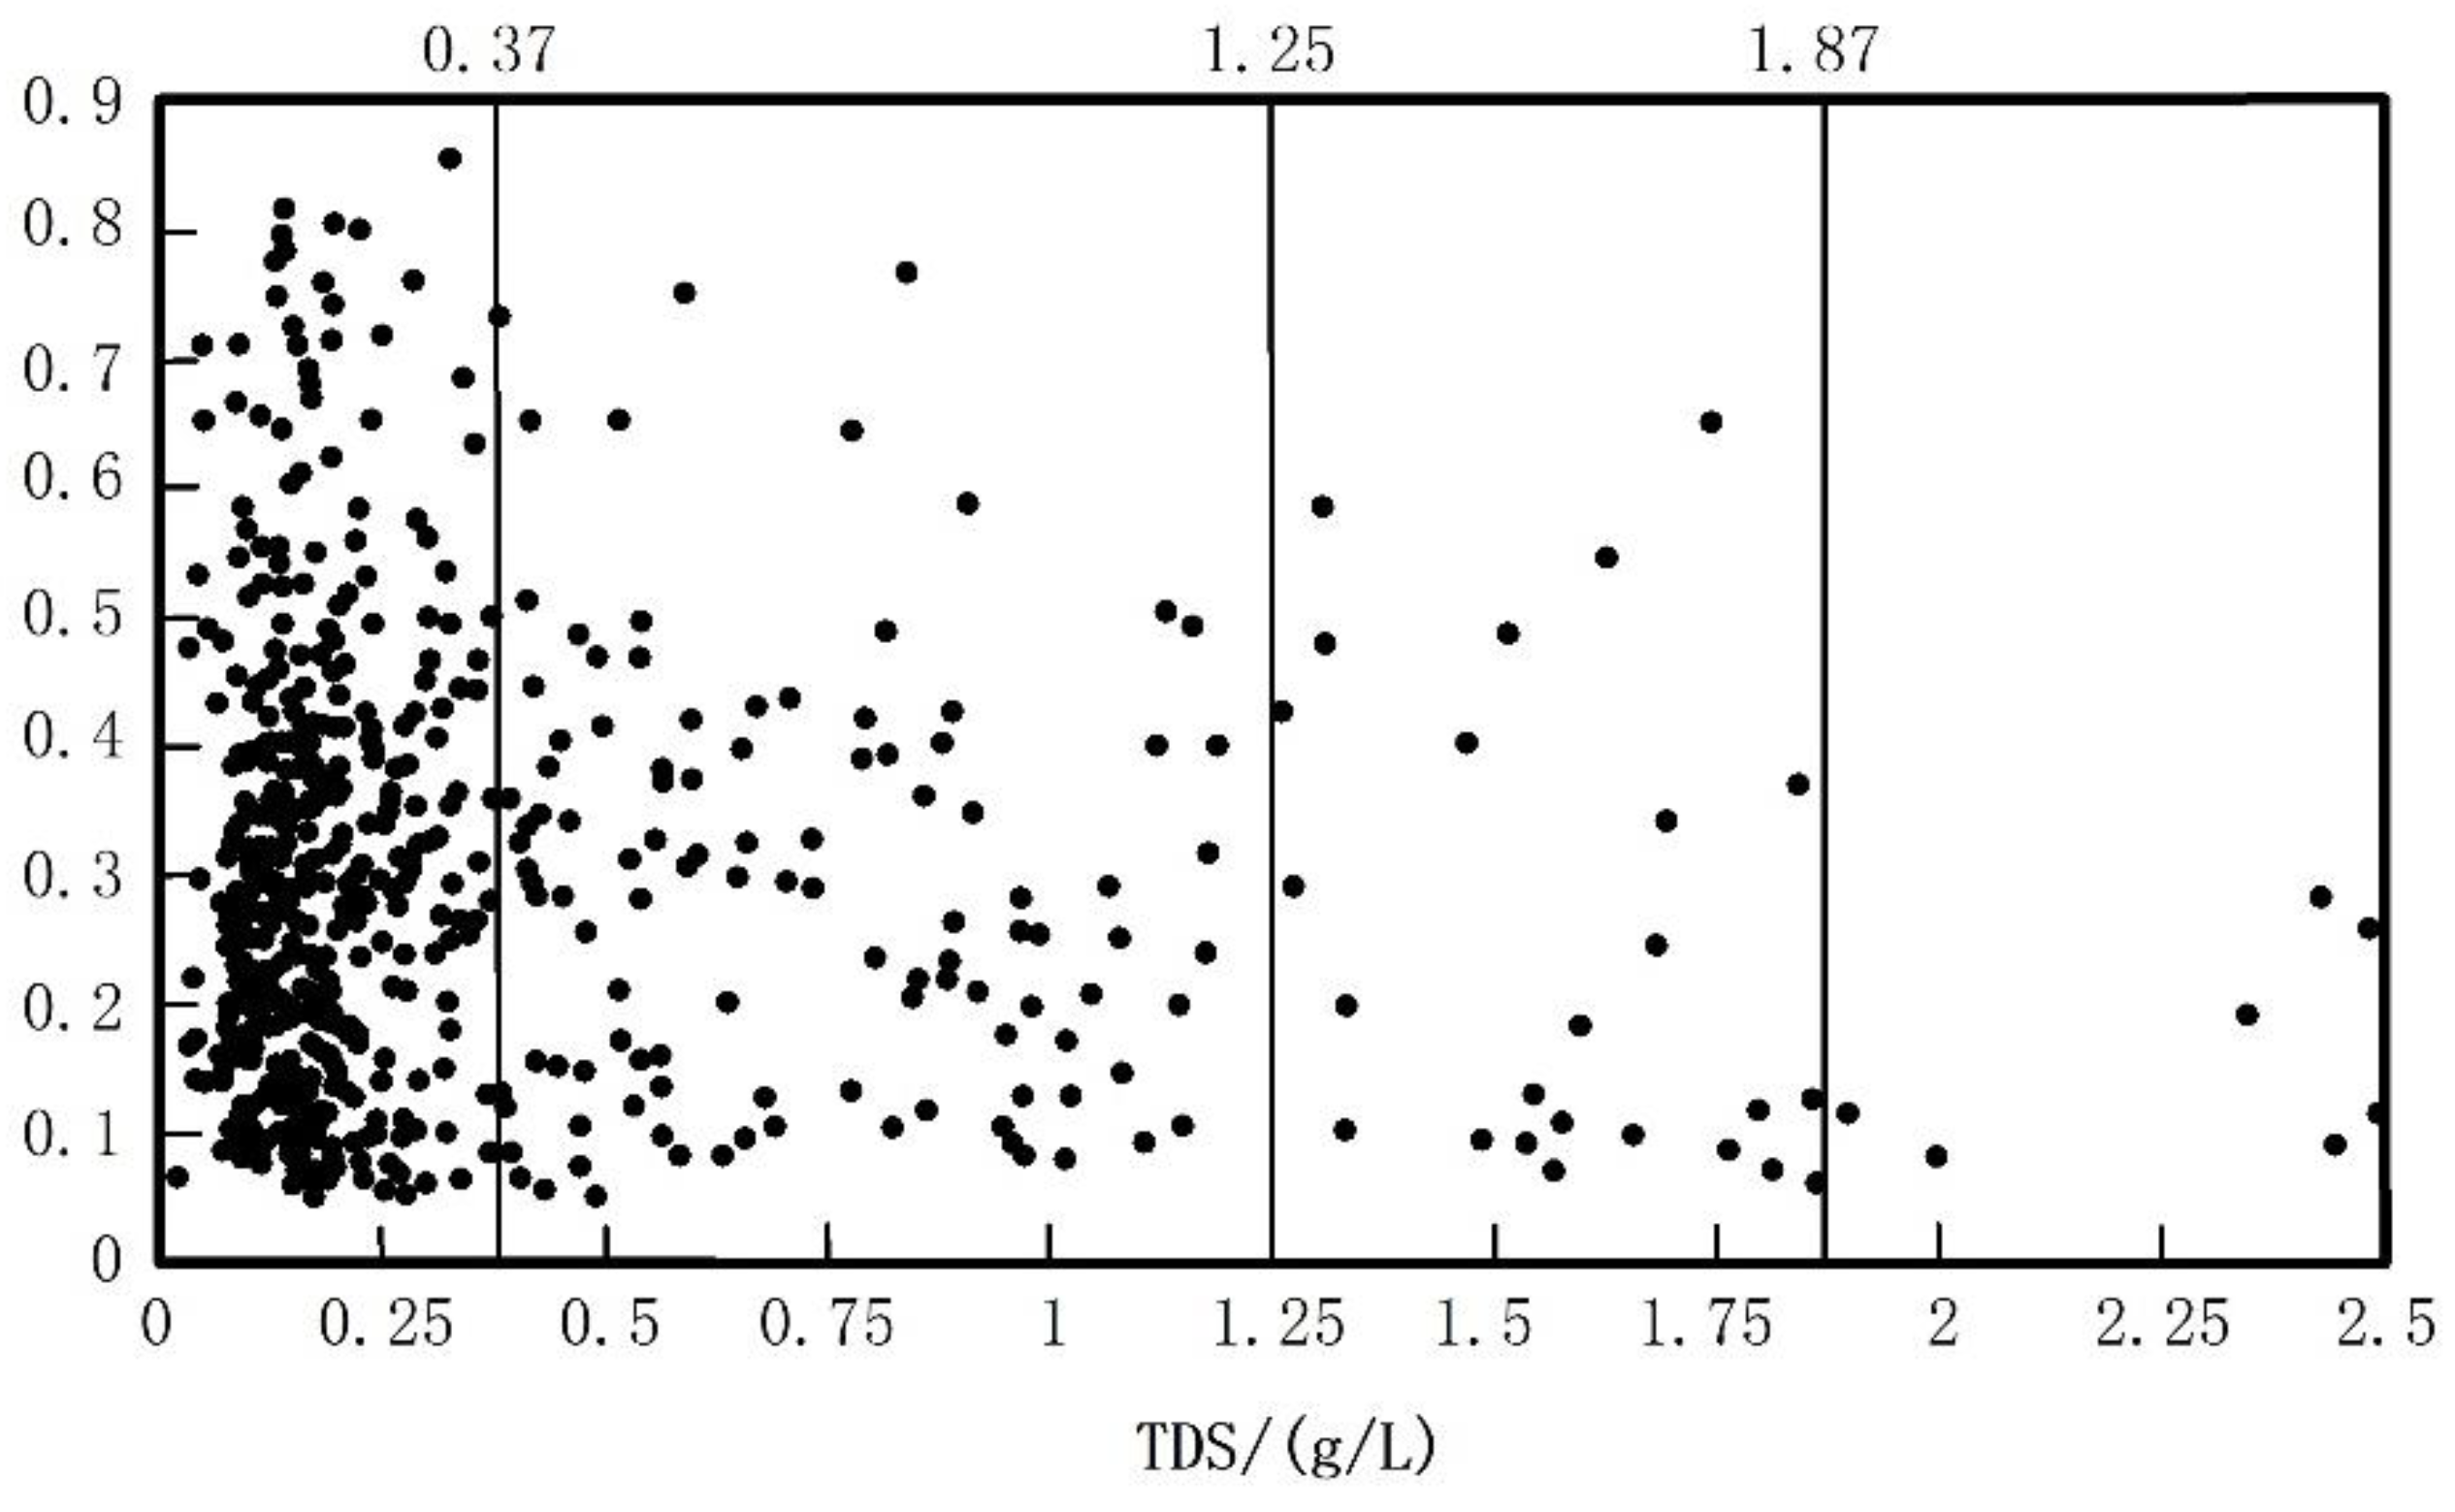
Using the salinity distribution map of groundwater in a typical salinization area, the salinity is interpolated, and then the NDVI value of the selected pixel and the corresponding TDS content were drawn into a scatter diagram, the relationship between NDVI and TDS content is obtained(Figure 11) and the groundwater salinity suitable for vegetation growth in typical salinization area was determined.
It can be seen from the figure that the groundwater mineralization affects the vegetation coverage. The vegetation coverage is low in high salinity areas. For high salinity areas, only some crops and vegetation with high salt tolerance can survive normally. Generally speaking, with the increase in TDS, the NDVI scatter distribution shows the characteristics of decreasing density and high value points. When TDS < 0.37 g/L, the scattered points are dense, the density of NDVI high value points is high and the vegetation growth is good; when the salinity is between 0.37–1.25 g/L, the scattered points are dense, but the density of NDVI high value points is significantly reduced, and the vegetation growth is good; when the salinity is between 1.25–1.87 g/L, the scattered points are sparse, the vegetation growth is limited, and the development is poor. When the salinity of groundwater is more than 2 g/L, there is almost no scatter, and the NDVI values are all below 0.15, indicating poor vegetation growth.
5. Conclusions
The groundwater ecological water level is a range of changes based on the condition of maintaining the benign development of the ecological environment. It is an interval composed of the threshold of the upper and lower limit of the groundwater level. The groundwater level is a line in the profile, while the groundwater ecological level is a water level change zone. For the typical salinization area of Qian’an, the groundwater ecological water level is the water level where soil does not salinize.
The determination of groundwater ecological water level should be based on the principle of maintaining the minimum demand for groundwater for plant growth and not causing the deterioration of the ecological environment and geological environment. The upper and lower limits should be determined comprehensively based on the specific natural conditions, soil vegetation conditions, hydrogeological conditions and groundwater level dynamic conditions. The groundwater level in this area is not only conducive to the growth of local vegetation, but also does not lead to the deterioration of ecological and geological environment. The ecological threshold of groundwater in a typical area of Qian’an county was analyzed and calculated using the improved traditional groundwater ecological water level, groundwater buried depth, mineralization degree and NDVI value. The optimal value is taken as the optimal ecological threshold of groundwater in a typical salinization area.
- (1)
- According to the improved traditional calculation method of groundwater ecological water level, the ecological threshold range of salinization area is the sum of vegetation root thickness plus the maximum capillary rise height of soil affected by the salinity of groundwater. The maximum ecological water level in the typical salinization area is 5.66 m and the minimum value is 3.76 M.
- (2)
- According to the relationship between groundwater depth and mineralization and NDVI value, it was calculated that in salinization areas, in addition to the relationship between groundwater buried depth and NDVI value, the salinity of groundwater is also an important index. After research, it was found that in the typical salinization area, where the groundwater buried depth is about 4.8 m to 6.1 m, the NDVI average value is the largest and the vegetation is well developed in the groundwater buried area. When the depth was less than 2.2 M, the vegetation is not developed, and the soil will be salinized, and the mean value of NDVI is less than 0.1. When TDS is less than 0.37 g/L, the vegetation growth and development is good; when the mineralization is between 0.37–1.25 g/L, the vegetation grows better; when the mineralization is between 1.25–1.87 g/L, the vegetation growth is limited and the development is poor; when the mineralization degree is greater than 2 g/L, the NDVI value is below 0.15, and the vegetation growth and development is poor. It can be concluded that the ecological threshold of groundwater in the typical salinization area is as follows: the buried depth of groundwater level should be greater than 2.2 M, the mineralization degree of groundwater should be less than 1.25 g/L; the most suitable ecological threshold of groundwater is as follows: the buried depth of groundwater should be between 4.8 m and 6.1 m, and the mineralization degree of groundwater should be 0.37–1.25 g/L.
- (3)
- The optimal ecological threshold range of groundwater is 4.8–5.66 m, and the mineralization degree of groundwater is 0.37–1.25 g/L in the typical salinization area of Qian’an county. In this area, it is beneficial to the growth of local vegetation, and it does not lead to the deterioration of ecological and geological environment.
Author Contributions
Conceptualization, G.W.; data curation, C.X. and X.L.; formal analysis, G.W., Z.Q.; funding acquisition, C.X. and X.L.; methodology, G.W.; project administration, C.X. and X.L.; supervision, X.L.; writing—original draft, G.W. All authors have read and agreed to the published version of the manuscript.
Funding
The study was financially supported by Natural Science Foundation of China (No. 41572216), the China Geological Survey Shenyang Geological Survey Center “Chang-Ji Economic Circle Geological Environment Survey” project (121201007000150012), the Provincial School Co-construction Project Special-Leading Technology Guide (SXGJQY2017-6), and the Jilin Province Key Geological Foundation Project (2014-13).
Institutional Review Board Statement
Not applicable.
Informed Consent Statement
Not applicable.
Data Availability Statement
Data are contained within the article.
Acknowledgments
We would like to thank the anonymous reviewers and the editor.
Conflicts of Interest
The authors declare no conflict of interest.
References
- Zhao, X.Q. Study on Optimized Management of Groundwater Resources in Tongyu County for Ecological Environment; Jilin University: Changchun, China, 2009. [Google Scholar]
- Zhang, C.C.; Shao, J.L.; Li, C.J.; Cui, Y.L. Study on groundwater eco-environmental water level in North China Plain. J. Jilin Univ. 2003, 3, 323–326. [Google Scholar]
- Zhao, H.Q. Study on Groundwater Niche and Water Regulation in Western Plain of Jilin Province; China University of Geosciences: Wuhan, China, 2012. [Google Scholar]
- Fan, Z.L.; Ma, Y.J.; Zhang, H.; Wang, R.H.; Zhao, Y.J.; Zhou, H.F. Determination of ecological groundwater level and its reasonable depth in Tarim River Basin. Geogr. Arid Area 2004, 1, 8–13. [Google Scholar]
- Sun, C.Z.; Liu, Y.L.; Yang, J. Study on ecological groundwater level and water regulation in plain area of Liaohe River Basin. Prog. Water Conserv. Hydropower Technol. 2007, 4, 15–19. [Google Scholar]
- Rong, L.S.; Liu, G.H.; Shu, L.C. Study on the estimation method of reasonable ecological groundwater level—A case study of the lower reaches of Tarim River. Groudwater 2009, 31, 12–16. [Google Scholar]
- Rong, L.S.; Liu, G.H.; Shu, L.C. Study on ecological groundwater table depth in the Yellow River Delta. Hydropower Energy Sci. 2010, 6, 92–95. [Google Scholar]
- Zhao, H.Q.; Zhang, Z.H.; Chen, Y.L. Groundwater level decline and environmental negative effects in Songnen Plain. Resour. Environ. Arid Areas 2010, 1, 126–130. [Google Scholar]
- Ye, M.; Xu, D.Z.; Gong, J.J. Study on reasonable ecological water level of radial growth of Populus euphratica with different DBH. Geogr. Sci. 2011, 2, 172–177. [Google Scholar]
- Dang, X.Y.; Lu, N.; Gu, X.F. Groundwater threshold of ecological vegetation in Qaidam Basin. Hydrogeol. Eng. Geol. 2019, 46, 5–12. [Google Scholar]
- Cochard, H.; Cruiziat, P.; Tyree, M.T. Use of positive pressures to establish vulnerability curves: Further support for the air-seeding hypothesis, implications for pressure-volume analysis. Plant Physiol. 1992, 100, 205. [Google Scholar] [CrossRef] [PubMed] [Green Version]
- Prathapar, S.; Qureshi, A. Modelling the effects of deficit irrigation on soil salinity, depth to water table and transpiration in semi-arid zones with monsoonal rains. Int. J. Water Resour. Dev. 1999, 15, 141–159. [Google Scholar] [CrossRef]
- Horton, J.L.; Thomas, E.K.; Stephen, C.H. Physiological response to groundwater depth varies among species and with river flow regulation. Ecol. Appl. 2011, 11, 1046–1059. [Google Scholar] [CrossRef]
- Taylor, R.; Kelbe, B.; Haldorsen, S. Groundwater-dependent ecology of the shoreline of the subtropical Lake St Lucia estuary. Environ. Geol. 2006, 49, 586–600. [Google Scholar] [CrossRef]
- Eamus, D.; Froend, R.; Loomes, R.; Hose, G.; Murray, B. A functional methodology for determining the groundwater regime needed to maintain the health of groundwater-dependent vegetation. Aust. J. Bot. 2006, 54, 97–114. [Google Scholar] [CrossRef] [Green Version]
- Ali, R.; Elliott, R.; Ayars, J. Soil salinity modeling over shallow water tables. II: Application of LEACHC. J. Irrig. Drain. Eng. 2000, 126, 234. [Google Scholar] [CrossRef]
- Jorenush, M.; Sepaskhah, A. Modelling capillary rise and soil salinity for shallow saline water table under irrigated and non-irrigated conditions. Agric. Water Manag. 2003, 61, 125–141. [Google Scholar] [CrossRef]
- Rengasamy, P. World salinization with emphasis on Australia. J. Exp. Bot. 2006, 57, 1017. [Google Scholar] [CrossRef] [PubMed] [Green Version]
- Zheng, D.; Li, W.H.; Chen, Y.P.; Liu, J.Z. Study on the relationship between groundwater and natural vegetation in arid areas. Resour. Sci. 2005. [Google Scholar] [CrossRef]
- Zhou, M.X.; Xiao, H.L.; Luo, F. Study on the relationship between groundwater salinity and vegetation growth in Ejina Delta. Desert China 2004, 24, 53–58. [Google Scholar]
- Zhang, L.C.; Xiao, C.L.; Liang, X.J. Analysis on hydrochemical characteristics of groundwater in Qian’an County. Jilin Water Conserv. 2006, 1, 32–35. [Google Scholar]
- Wang, Y.N.; Sun, Y.L.; Zhang, L.L. Dynamic variation characteristics and genetic analysis of groundwater level in Qian’an County. Jilin Geol. 2020, 39, 98–102. [Google Scholar]
Figure 1.
Geographical location of the study area.

Figure 2.
Geomorphological map of the study area.

Figure 3.
Capillary rising height measuring device.

Figure 4.
Division of groundwater hydrochemical types in the study area.

Figure 5.
Zoning of groundwater salinity in the study area.

Figure 6.
Accumulation curve of capillary height in the loam.

Figure 7.
Accumulation curve of capillary height in the sandy loam.

Figure 8.
Capillary rising height under different salinity treatments.

Figure 9.
Variation curve of capillary rise rate in the loam soil.

Figure 10.
Variation curve of capillary rise rate in the sandy loam soil.

Figure 11.
Relationship between groundwater salinity and NDVI index in typical salinization area.


Table 1.
Brief list of geomorphic types.
| Genetic Type | Formation Form | Morphological Unit | Surface Lithology | Age of Formation |
|---|---|---|---|---|
| Accumulation topography | Alluvial lacustrine plain | Lake and marsh depression | Silty clay | Q4al+l |
| Slightly inclined flat | Silty clay | Q4al, Q4l+h | ||
| Microwave hillock | Loess like silty clay | Q3al |
Table 2.
The maximum capillary height under different treatment conditions.
| Treatment Conditions | Fitting Curve | Fit Degree | Maximum Capillary Rise Height |
|---|---|---|---|
| loam, 0 g/L | y = 1.8054x−0.408 | 0.8858 | 205 |
| Sandy loam, 0 g/L | y = 18.899x−0.9884 | 0.9843 | 146 |
| Sandy loam, 0.5 g/L | y = 18.261x−0.9946 | 0.9794 | 152 |
| Sandy loam, 1 g/L | y = 22.554x−1.0504 | 0.9776 | 156 |
| Sandy loam, 1.5 g/L | y = 18.275x−0.9742 | 0.9791 | 161 |
| Sandy loam, 2 g/L | y = 19.236x−0.9626 | 0.9863 | 166 |
Table 3.
Vegetation root development thickness of different land use types.
| Land Use Types | Paddy Field | Dry Land | Grass Land | Sparse Forest Land | Saline Alkali Land | Water Body |
|---|---|---|---|---|---|---|
| Root development thickness | 20 | 4 | 35 | 200 | 17 | - |
Table 4.
Calculation of ecological threshold of groundwater level.
| Calculation Area | Soil Texture | Land Use Types | Mineralization Degree | Capillary Rise Height (cm) | Soil Root Thickness (cm) | Influence Height of Salinity (cm) | Thickness of Permafrost (m) | Ecological Threshold of Groundwater (m) |
|---|---|---|---|---|---|---|---|---|
| 1 | Sandy loam | Grassland | 1 | 146 | 35 | 10 | 2 | 3.91 |
| 2 | 20 | 2 | 4.01 | |||||
| 2 | Dry land | 1 | 40 | 10 | 2 | 3.96 | ||
| 2 | 20 | 2 | 4.06 | |||||
| 3 | Open woodland | 1 | 200 | 10 | 2 | 5.56 | ||
| 2 | 20 | 2 | 5.66 | |||||
| 4 | Paddy field | 1 | 20 | 10 | 2 | 3.76 | ||
| 5 | Saline alkali land | 1 | 17 | 10 | 2 | 3.86 | ||
| 6 | loam | Grassland | 1 | 205 | 35 | 10 | 2 | 4.5 |
| 2 | 20 | 2 | 4.6 | |||||
| 7 | Dry land | 1 | 40 | 10 | 2 | 4.55 | ||
| 2 | 20 | 2 | 4.65 | |||||
| 9 | Paddy field | 1 | 20 | 10 | 2 | 4.35 | ||
| 10 | Saline alkali land | 1 | 17 | 10 | 2 | 4.32 |
Publisher’s Note: MDPI stays neutral with regard to jurisdictional claims in published maps and institutional affiliations. |
© 2021 by the authors. Licensee MDPI, Basel, Switzerland. This article is an open access article distributed under the terms and conditions of the Creative Commons Attribution (CC BY) license (http://creativecommons.org/licenses/by/4.0/).
Share and Cite
MDPI and ACS Style
Qi, Z.; Xiao, C.; Wang, G.; Liang, X. Study on Ecological Threshold of Groundwater in Typical Salinization Area of Qian’an County. Water 2021, 13, 856. https://doi.org/10.3390/w13060856
AMA Style
Qi Z, Xiao C, Wang G, Liang X. Study on Ecological Threshold of Groundwater in Typical Salinization Area of Qian’an County. Water. 2021; 13(6):856. https://doi.org/10.3390/w13060856
Chicago/Turabian StyleQi, Zhiwei, Changlai Xiao, Ge Wang, and Xiujuan Liang. 2021. "Study on Ecological Threshold of Groundwater in Typical Salinization Area of Qian’an County" Water 13, no. 6: 856. https://doi.org/10.3390/w13060856
Note that from the first issue of 2016, this journal uses article numbers instead of page numbers. See further details here.