Article

Water Quality and Hydrogeochemical Characteristics of Some Karst Water Sources in Apuseni Mountains, Romania

1
INCDO-INOE 2000 Research Institute for Analytical Instrumentation, 67 Donath Street, 400293 Cluj-Napoca, Romania
2
Faculty of Materials and Environmental Engineering, Technical University, 103-105 Muncii Boulevard, 400641 Cluj-Napoca, Romania
3
Faculty of Horticulture, University of Agricultural Sciences and Veterinary Medicine, 3-5 Calea Manastur, 400372 Cluj-Napoca, Romania
4
Department of Geospeleology and Paleontology, Emil Racovitza Institute of Speleology, Calea 13 Septembrie, 050711 Bucharest, Romania
5
Cluj Department, Emil Racovita Institute of Speleology, 5 Clinicilor Street, 400006 Cluj-Napoca, Romania
*
Author to whom correspondence should be addressed.
Water 2021, 13(6), 857; https://doi.org/10.3390/w13060857
Submission received: 2 March 2021 / Revised: 17 March 2021 / Accepted: 18 March 2021 / Published: 21 March 2021
(This article belongs to the Special Issue Research on Karst Eco-Hydrology and Sediment)

Abstract

:
Human activities and natural factors determine the hydrogeochemical characteristics of karst groundwaters and their use as drinking water. This study assesses the hydrogeochemical characteristics of 14 karst water sources in the Apuseni Mountains (NW Romania) and their potential use as drinking water sources. As shown by the Durov and by the Piper diagrams, the chemical composition of the waters is typical of karst waters as it is dominated by HCO3 and Ca2+, having a circumneutral to alkaline pH and total dissolved solids ranging between 131 and 1092 mg L−1. The relation between the major ions revealed that dissolution is the main process contributing to the water chemistry. Limestone and dolostone are the main Ca and Mg sources, while halite is the main Na and Cl source. The Gibbs diagram confirmed the rock dominance of the water chemistry. The groundwater quality index (GWQI) showed that the waters are of excellent quality, except for two waters that displayed medium and good quality status. The quality of the studied karst waters is influenced by the geological characteristics, mainly by the water–rock interaction and, to a more limited extent, by anthropogenic activities. The investigated karst waters could be exploited as drinking water resources in the study area. The results of the present study highlight the importance of karst waters in the context of good-quality water shortage but also the vulnerability of this resource to anthropogenic influences.

1. Introduction

Mountain regions worldwide supply fresh water to the population from the downstream areas and they can also deliver significant runoff to lowland agriculture, which is highly dependent on these resources [1]. Mountain aquifers, particularly the ones formed in karstified carbonate rocks (limestone, dolomite), collect the infiltrated rainfall, preserving valuable water supplies. However, the karst aquifers are the most vulnerable to anthropic activities and more easily influenced by natural elements (e.g., different types of rocks or geological settings).
According to the World Karst Aquifer Map (WOKAM), potentially accessible karst aquifers cover 15.2% of the global land surface, of which 9.4% are covered by continuous carbonate rocks and 5.8% by discontinuous carbonate rocks [1]. In Europe, karsts cover 21.8% of the territory. The global topographic distribution of the carbonate rocks is as follows: 31.1% in plains, 28.1% in hills and 40.8% in mountains [1,2]. In an effort to provide a global perspective, the World Karst Spring hydrograph (WoKaS) database collects research observations related to over 400 springs, consisting of location identification, discharge observations and technical validation and quality assessment of datasets [3]. However, karst springs from the present study are not included in this database.
In Romania, approximately 2.3% of the territory is covered by karst (predominantly carbonate rocks) [1]. Although a rather small surface area is occupied by limestones, dolomites and marbles [4], the karst aquifers are critical for the inhabitants, in some cases being the only source of drinking water. The Apuseni Mountains, belonging to the Western Romanian Carpathians, cover ~10.750 km2, of which 1132 km2 are carbonated rocks. The average altitude is 700 m, Curcubata Mare being the highest peak (1849 m) [5]. The landscape is dominated by a unique karst environment, due to its extent and its landscape diversity, whose key characteristic consists of a complex underground hydrological network. In the Apuseni Mountains, there is a considerable number of caves, including the Vantului Cave (~50 km), the longest in Romania, and Varasoaia (653 m depth), the deepest in Romania. The most important rivers that spring from the Apuseni Mountains are Cris, Aries and Somesul Mic, the hydrographic network development being strongly linked with three major basins: Somesul Mic, Crisurile (Alb, Negru, Repede) and Mures [6]. The specific average flow rate ranges between 20 and 40 L/s km2 in the western area and 10–20 L/s km2 in the eastern part of the mountains, these differences being correlated with the amount of precipitation. Moreover, the water resources vary significantly due to the petrographic context, some of the areas being defined by their impermeability, while others are represented by a rapid drainage in the karst environment [6]. Depending on the karst network’s development, extent and structural proprieties (e.g., fracture pattern), the supply of groundwater in karst varies considerably. The flow system is interrelated by joints, conduits and cavities, which influence its ability to deposit and transport water from the surface to the springs [7]. Due to the high heterogeneity of the aquifer and to the rapid flow velocities of water in a karst environment, pollutants can easily reach the groundwater and alter its quality [8].
Natural factors (e.g., rock matrix) and human activities (e.g., agriculture, cattle farming, household activities leading to waste dumping into the environment) determine the groundwater quality and its possible uses. Excessive water abstraction, agriculture, animal husbandry and unsustainable household practices are the main stressors of the groundwater flows [9]. Overall, the chemical profile of groundwater is regulated by the water–rock interaction, ion exchange, weathering, geological structure, rock type, flow trajectory, residence time, agriculture, industry and urbanization [1,9,10]. Major chemical characteristics of the karst groundwater include the pH, total hardness, total dissolved solids, cations (K, Na, Ca, Mg) and anions (HCO3, F, Cl, NO3, SO42−).
The aim of the present study was to provide data regarding the hydrogeochemical characteristics of karst water sources from the Apuseni Mountains, Romania, as well as to assess their quality based on the groundwater quality index (GWQI) and their suitability as drinking water sources, based on comparisons against the water quality guidelines.

2. Materials and Methods

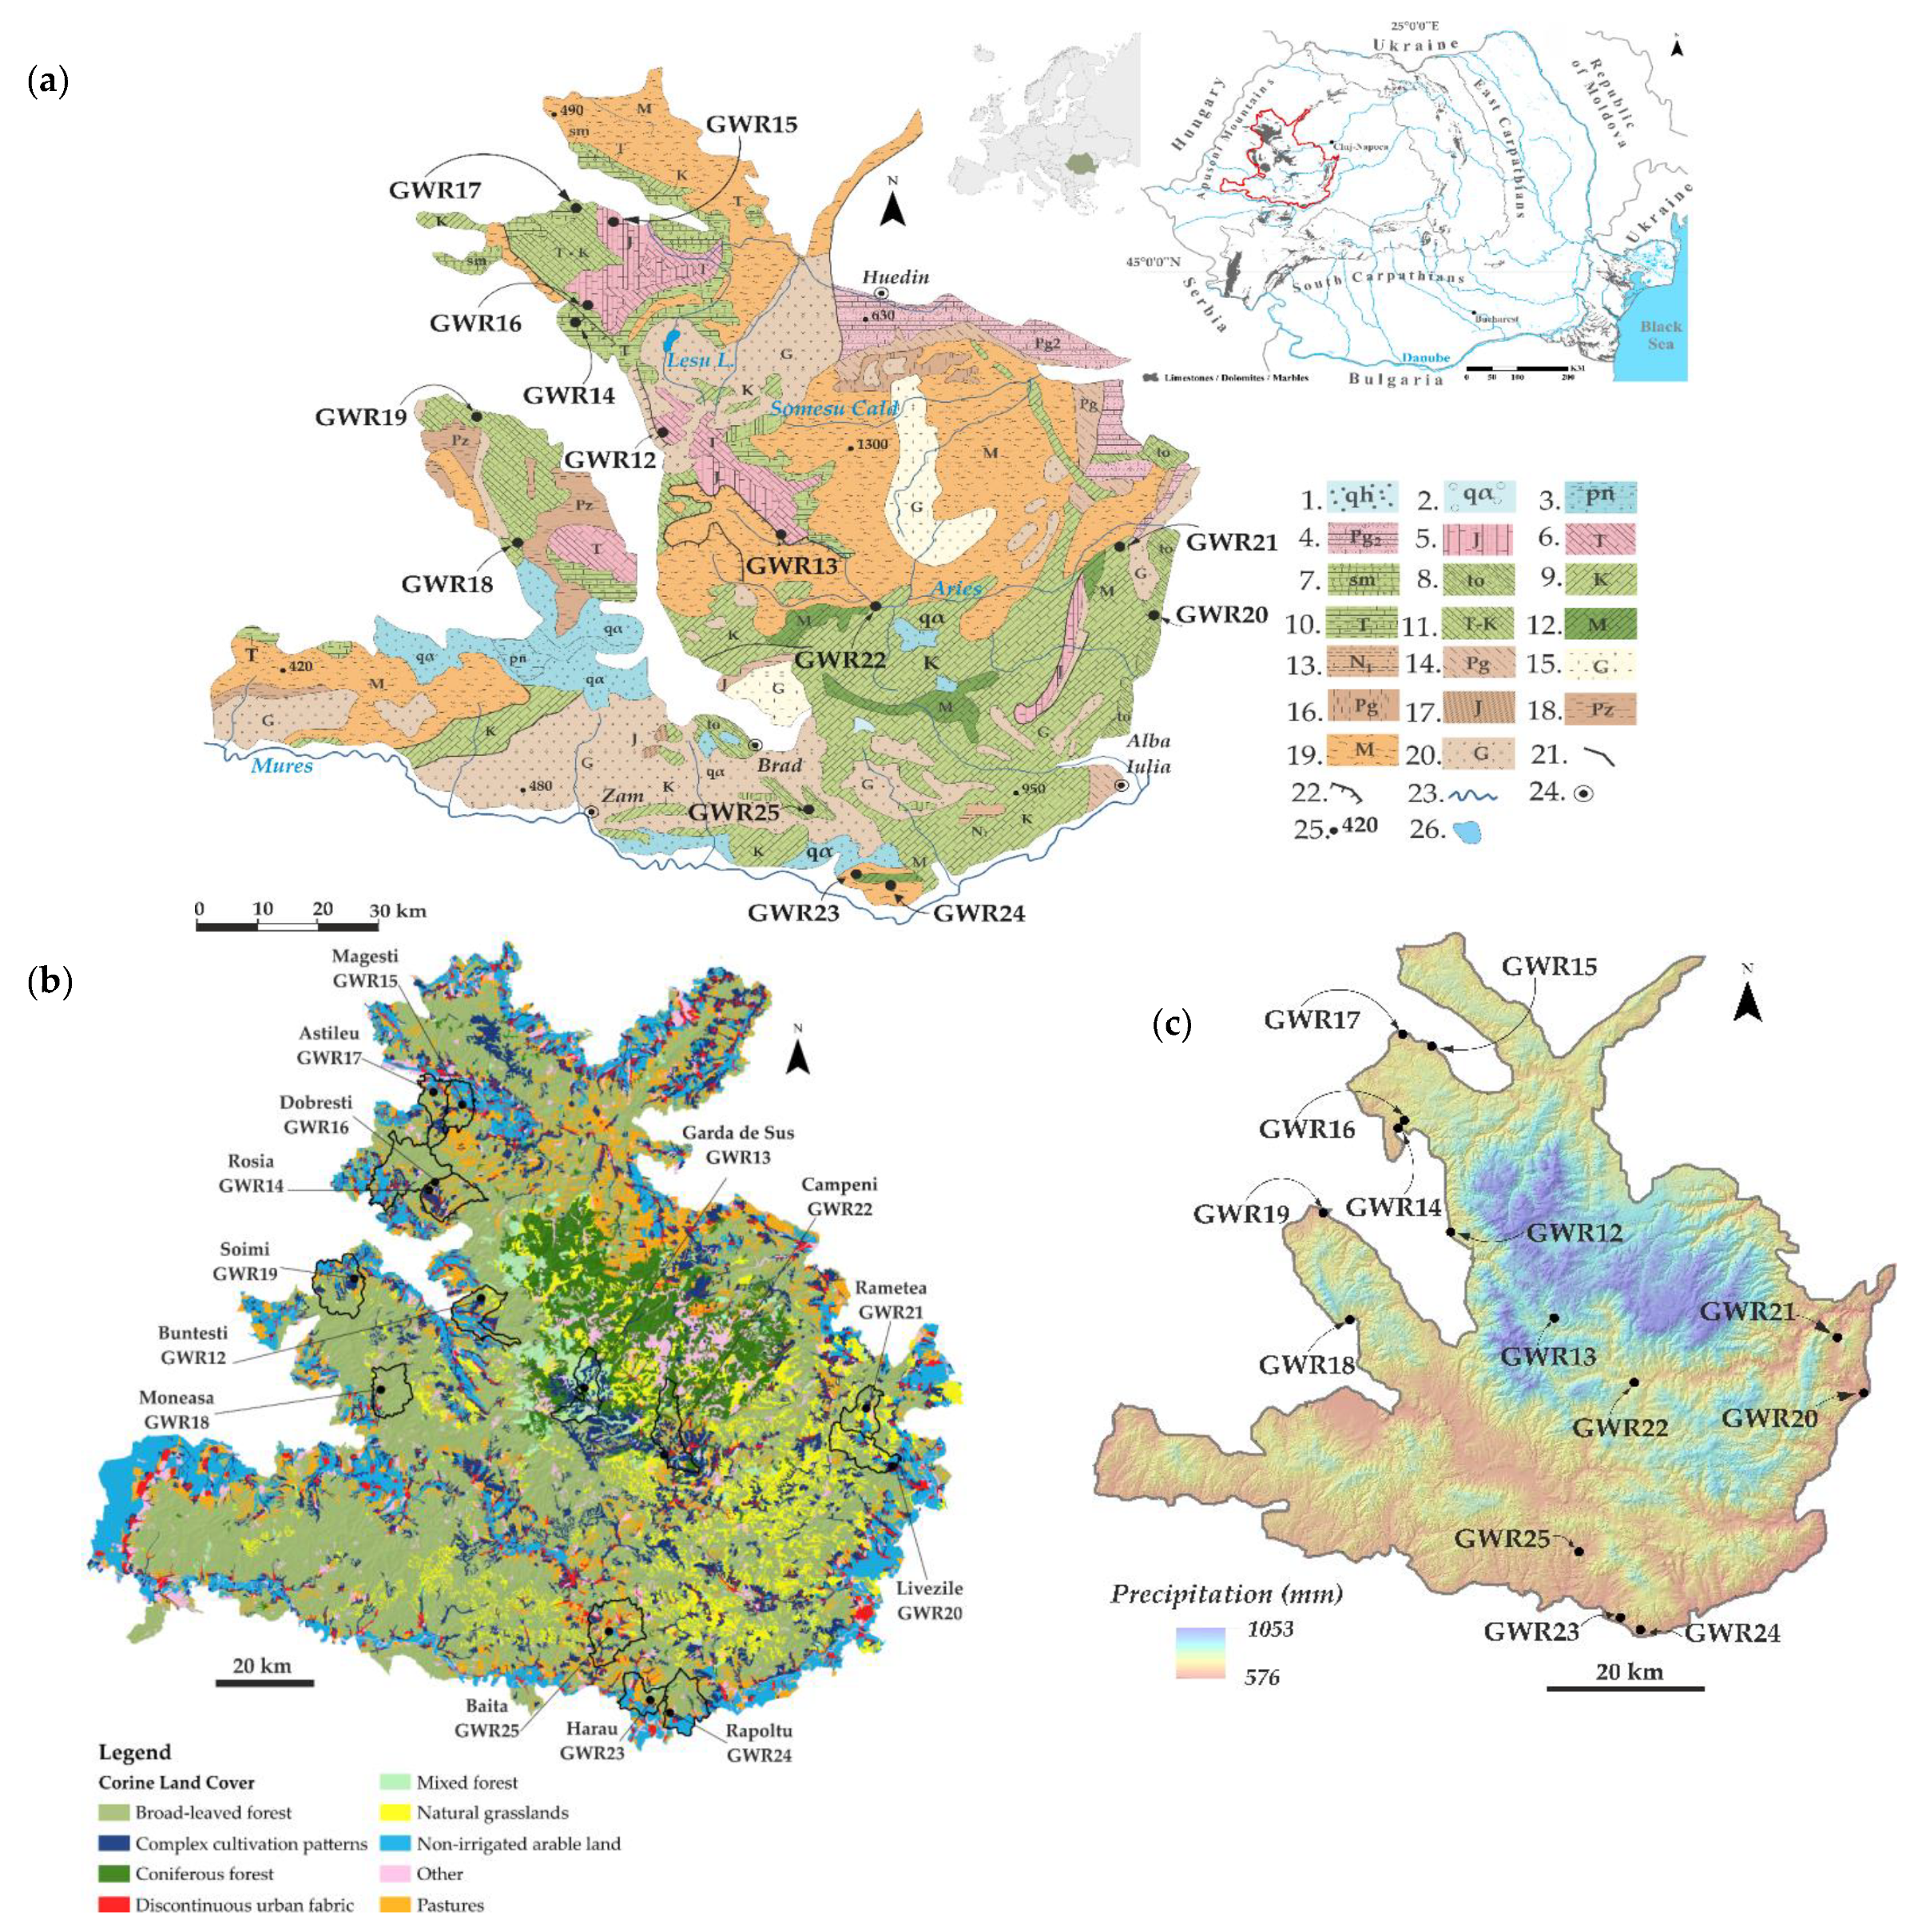
2.1. Study Area and Sampling

The Apuseni Mountains are known for their petrographic mosaic and complex structure. The northern part is composed by basement tectonic units represented by metamorphic rocks (Early Proterozoic) with associated granites (Late Cambrian to Early Permian) and volcanic and sedimentary cover (Permo-Mesozoic), while the southern part includes ophiolites (Middle Jurassic), volcanic rocks (Late Jurassic) and sedimentary deposits (Late Jurassic to Late Cretaceous) [11].
The complex setting of the lithological and tectonic structure of the Apuseni Mountains defines the multiple ways in which groundwater recharges, flows and discharges. Groundwater can be stored in local or discontinuous aquifers, located in porous formations, limestones or fractured rocks. Most of the sources belong to aquifers in limestones, sandstones and conglomerates, while GWR23 and GWR24 are at the contact between crystalline schists and crystalline limestones (Figure 1a).
Besides the lithological features, the climate plays a key role in the groundwater recharge process, one of the main components being precipitation. In the Apuseni Mountains, the climate is continental moderate with western influences [6] and, according to the Köppen–Geiger climate classification, two types of climate can be identified: temperate, at low altitudes, and continental/cold (without dry season but with warm summers), at high altitudes [12,13]. The precipitation ranges between 1050 mm (at high altitudes in the northern part of the area) and 570 mm (at low altitudes in the southern part of the Apuseni Mountains). With the exception of GWR13, which is located at a higher altitude, having a higher level of precipitation (773 mm), and GWR20, with a low mean annual precipitation (585 mm), the other sources are located at a lower altitude and have an annual precipitation mean of around 640 mm (Figure 1b).
Karst water samples were collected seasonally (from October 2019 to August 2020) from 14 water sources situated in the Apuseni Mountains (North-Western Romania) (Table 1).
The land cover in the Apuseni Mountains is associated mostly with natural areas, especial with broad-leaved forests, non-irrigated arable land and pastures (Figure 1c). Despite the extended natural areas in the Apuseni Mountains and the decline in the population, the agricultural practices and industrial activities can play an important role in the degradation of both surface and groundwater quality. The most important anthropogenic activities with a possible impact on water quality are related to household activities, agriculture (e.g., intensive farming, deforestation, waste management), limestone exploitation, present or historical polymetallic ores mining and processing. The deficient management of natural resources (soils, pastures, forests) also imposes pressure on the groundwater resources.

2.2. Analysis and Quality Assurance

The water samples were transferred in pre-cleaned polyethylene bottles, kept at 4 °C during transportation and analyzed within the next 24 h. The pH and electrical conductivity (EC) were measured in situ using a Hanna HI 9829 Multiparameter (Hanna, Woonsocket, RI, USA) [17]. Total alkalinity (TA) and bicarbonates (HCO3) were determined by titration with 0.1 N HCl in the presence of bromocresol green indicator [17]. Total nitrogen (TN) was determined by catalytic combustion and chemiluminiscence detection using a Multi N/C 2100 Analyzer (Analytik Jena, Jena, Germany). Total dissolved solids (TDS) were determined by gravimetric method [17]. Ammonium (NH4+) was determined by the salicylate–hypochlorite method, using a Spectrum BX II UV-Vis Spectrophotometer (Perkin Elmer, Waltham, Massachusetts, US) [17]. For the anions, cations and trace metals determination, the water samples were filtered through 0.45-μm cellulose acetate membrane filters. The anions (NO3, F, Cl, SO42−) were measured by ion chromatography, using a 761 IC compact ion chromatograph (Metrohm, Herisau, Switzerland), equipped with a Metrosep 5–100/4 column and a Metrosep A Supp 4/5-mm guard column [17]. Major cations (Ca, K, Mg, Na) were measured after acidulation with 65% HNO3 to a pH < 2, by inductively coupled plasma optical emission spectrometry (ICP-OES), using a 5300 Optima DV spectrometer (Perkin Elmer, Shelton, CT, United States) [17]. Trace metals and metalloids (Ba, Sr, Fe, Cd, Cr, Co, Cu, Ni, Mn, Zn, Pb and As) were determined by inductively coupled plasma–mass spectrometry (ICP-MS) after acidulation with 65% HNO3 to a pH < 2, using an ELAN DRC II spectrometer (Perkin Elmer, Waltham, MA, United States) [17]. Total hardness (TH) was computed as equivalent CaCO3, based on Ca and Mg concentrations [17].
Calibration standards, procedural blank measurements and duplicate samples were used for the quality assurance of results. The measurement accuracy was tested using the 1643e NIST (National Institute of Standards and Technology, Gaithersburg, MD, USA) Water certified reference material for metals and IC1 Multi-Element standard (Certipur Merck, Darmstadt, Germany) for anions. The mean recoveries were 94–105% for metals and 89–102% for anions.
All reagents were of analytical grade and were used as received without any further purification. Ultrapure water from a Millipore system (Molsheim, France) was used for all dilutions and for the preparation of the standard solutions.

2.3. GWQI

The groundwater quality index (GWQI) is a useful tool to establish water quality and indicates the overall impact of chemical composition on the water quality [18,19]. Initially, the water quality index (WQI) was developed by the National Sanitation Foundation as a standard index for water quality assessment and also as a technique of rating water quality [20]. The use of WQI for groundwater quality assessment was presented in several studies [21,22,23]. The GWQI, as a standard index in groundwater quality assessment, was defined by Ribeiro et al. [24]. The GWQI calculation consists in the selection of the groundwater-specific parameters, the establishment of a relationship between the expected values and the dimensionless subindex values and the aggregation of the resulting values into a sum type index [25]. In this study, the GWQI was calculated based on the methodology presented by Adimalla et al. and consisted of the following steps: (a) assignment of weights (wi) for each parameter based on their importance for groundwater quality (Table 2); (b) calculation of the relative weight (Wi) using Equation (1); (c) establishment of the quality rating (qi) according to Equation (2); (d) calculation of the subindex for each indicator (SIi) according to Equation (3); (e) aggregation of SIi into the GWQI according to Equation (4) [18].
W i = w i i = 1 n w i
q i = C i S i × 100
S I i = W i × q i .  
G W Q I = i = 1 n S I i
where wi is the weight of each parameter, Wi is the relative weight, qi represents the quality rating for each parameter, Ci and Si represent the concentration and the guideline value according to the drinking water quality guidelines established by the World Health Organization (WHO) and by the Directive 98/83/EC [26,27], SIi represents the subindex of the ith parameter [18,19].

2.4. Water Typology and Multivariate Statistics

The water typology was assessed using the Piper and Durov diagrams. Both diagrams allow the visualization of the relative abundance of common ions in the water samples and assume that the sum of anions is equal to the sum of cations and thus the relative concentrations of ions are given in percentage basis. The Piper diagram offers information on the relationship between the water composition and rock types, while the Durov diagram reveals the geochemical processes that affect the groundwater [28]. The Piper diagram is a ternary plot representing the major anions (Cl, CO32− +HCO3, SO42−) in the lower right corner, the major cations (Ca2+, Mg2+, Na+ +K+) in the lower left corner and a diamond plot in the middle. The diamond plot results from the projection of the data from the two triangles. Based on the positioning of the sample in the diamond, the hydrochemical facies can be identified [29]. The Piper diagram was drawn using GWChart [30]. The Durov diagram is a composite plot consisting of 2 ternary diagrams, one positioned on the left side representing the major cations (Ca2+, Mg2+, Na+ +K+), the other positioned on the top, representing the major anions (Cl, CO32−, +HCO3 SO42−), and a central rectangular binary plot containing the projection of the 2 ternary plots. In addition, a pH plot is added to the bottom and a TDS (total dissolved solids) plot is added to the right side of the diagram [31,32]. The Durov diagram was drawn using the AqQa software (free versions).
The Gibbs diagram and the scatterplots showing the relationship between the major ions were represented using MS Excel.
Agglomerative hierarchical clustering (AHC) was used to identify the similarity of variable values in datasets for samples grouped according to their common behavioral patterns. Applied to water quality data, Q-mode cluster analysis can build clusters of distinct hydrochemical quality, while R-mode cluster analysis can detect associations among different variables (water quality parameters) and the factors influencing them (sources and processes) [33]. Clustering is performed sequentially from the most similar pair upwards, using normalized datasets (mean observations over a period) in order to classify similar sampling sites spread over the karst study area (spatial variability), and the results are presented in dendrograms [34]. The AHC was carried out on standardized data using the Ward method of aggregation and the squared Euclidian distance as a measure of similarity [35,36,37]. For the statistical processing of the data, XLStat (Addinsoft, Boston, MA, USA) was used.

3. Results and Discussion

3.1. Spatial Distribution of Groundwater Chemistry

The results of the physico-chemical analysis in the groundwater samples are indicated in Table 3 and Table 4. The studied waters were circumneutral to alkaline, with mean values of pH ranging between 6.43 and 8.20. The highest pH values were found in GWR12 and GWR18, localized in the western part of the studied area, while the lowest values were recorded in the southern part of the Apuseni Mountains for GWR23 and GWR24. In the case of GWR23, the mean value of pH was just below the guideline value set by the WHO and by the European Legislation [26,27]. Waters with low pH favor mineral dissolution and element leaching, while a high pH enhances the precipitation of the minerals, especially of calcite, in the case of karst waters [38,39,40,41].
The EC in all water sources was well below the recommended limit for drinking water (2500 μs cm−1). The highest EC values were measured in samples GWR23 and GWR24, where the pH was the lowest, suggesting a more intensive mineral dissolution than at the other sites. The lowest EC was determined for GWR12, GWR13, GWR18 and GWR22. A similar spatial variation pattern was noticed also for the TDS, with values ranging between 131 and 1092 mg L−1, the highest values being recorded in the southern region and the lowest in the middle region of the studied area. The spatial variation of the EC and TDS may reflect the wide variation in the anthropic activities and natural processes in the studied region, and also the dilution effects—due to the groundwater recharging from the Aries and Somesul Mic rivers [42,43,44,45].
The TA ranged from 2.30 mmol L−1 in the case of GWR18 to 23.9 mmol L−1 in the case of GWR23. In the northern and eastern areas, TA and HCO3 were relatively constant, with values ranging from 3.90 (GWR14) to 5.75 (GWR15) mmol L−1 and from 229 (GWR14) to 338 mg L−1 (GWR17), respectively, in the north, and from 4.73 mmol L−1 (GWR21) to 5.85 mmol L−1 (GWR20) and from 291 mg L−1 (GWR21) to 361 mg L−1 (GWR20), respectively, in the eastern region. The lowest values of TA and HCO3 content were recorded in the central part of the Apuseni Mountains for GWR12, GWR18, GWR13 and GWR22. In the southern region (GWR23, GWR24), the values of the TA and HCO3 content were the highest among all the studied water sources, the HCO3 content exceeding by far the guideline values, according to the WHO (500 mg L−1) [26]. The high values of the TA and HCO3 content observed at these sites may be attributed to the presence of carbonate minerals. The HCO3 and Ca were the dominant ions, representing together 70% (GWR20) to 96% (GWR16) of the total ions, which confirms that carbonate lithology was the dominant source of ionic species. The increased Na, Cl and SO42− contents in the sample GWR20 could be attributed to halite dissolution and to silicate weathering, but also to the presence of anthropogenic pollution sources.
With the exception of GWR20, the order of dominant cations was Ca (62–96%) > Mg (0.1–6%) > Na (0.06–1.1%) > K (0.02–0.16%), confirming the limestone and dolostone lithology of the area. In the case of GWR20, the order was Ca (76%) > Na (1.6%) > Mg (1.1%) > K (0.1%), indicating the different lithology of the area and/or the presence of anthropic inputs. The order of the main anions was HCO3 (99–89%) > SO42− (2.2–8.8%) > NO3 (0.8–3.2%) > Cl (0.6–1.4%) in the majority of samples. In the case of GWR22, the concentration of NO3- exceeded the Cl and SO42− concentration, suggesting the existence of anthropogenic pollution, while in GWR20, the Cl was higher than the SO42− and NO3, confirming the presence of halite mineral dissolution.
The highest NO3 concentration was found in GWR22, while the highest SO42− concentration was found in GWR20. The presence of SO42− may be related to the dissolution of sulfate minerals and to the input of fertilizers and urban waste, while the presence of NO3 is due to the infiltration of NO3 fertilizers, septic tanks and household sew in the aquifer [46]. Among the karst waters, Cl concentrations showed very strong variation, from 0.758 mg L−1 in the case of GWR18 to 91.0 mg L−1 in the case of GWR20. The lowest spatial variation was outlined by F concentration, with the highest value in the case of GWR23 (0.840 mg L−1) and the lowest in GWR13 (0.073 mg L−1).
The major cations’ abundance in the water samples decreased as follows: Ca > Na > Mg > K. The Ca and Mg concentrations followed the spatial trend of the EC and TDS, with the highest values in the waters from the southern area—GWR23 (348 mg L−1 Ca, 58.5 mg L−1 Mg) and GWR24 (273 mg L−1 Ca, 49.0 mg L−1 Mg). In addition, the lowest Ca concentrations were determined in the water sources located in the central and western parts of the studied area—GWR12, GWR18, GWR13 and GWR22. Mg, on the other hand, had the lowest values in the northern part of the Apuseni Mountains, the lowest Mg concentrations being measured in GWR16. In addition, a slight increase in Mg and K could be noticed in the eastern region of the studied area. K showed slight variation, from 0.540 mg L−1 in GWR22 to 5.11 mg L−1, in the case of GWR23. While the lowest concentrations of Na were noticed in the upstream and central areas (GWR17—GWR22), in the southern region, the Na concentrations ranged from 5.78 mg L−1 (GWR25) to 28.2 mg L−1 (GWR20). Even so, all the observed values of Na concentrations were within the acceptable WHO/Directive 98/83/EC [26,27] limits.
Based on the TH values, GWR17, GWR15, GWR16, GWR14, GWR19, GWR21, GWR22, GWR20, GWR25, GWR23 and GWR24 were classified as very hard waters (TH > 181), GWR12 and GWR13 as hard waters (121 < TH < 180) and GWR18 as moderately hard water (61 < TH < 120) [47]. Only the centrally located water sources were included in the moderate/hard TH classes, while the highest values were obtained in the case of GWR23 and GWR24, due to the high concentrations of Ca and Mg. The long-term use of waters with high TH may lead to renal lithiasis, while low concentrations of Ca and Mg could favor disorders of the skeletal system [14,47,48].
The NH4+ concentration was below the guideline values for drinking waters set by the WHO and by the Directive 98/83/EC [26,27] in all the samples. The NH4+ concentration ranged from 0.067 (GWR24) to 0.495 mg L−1 (GWR22), and the concentration of TN ranged from <0.700 (GWR12, GWR18, GWR23, GWR24) to 2.49 mg L−1 (GWR15).
The concentrations of the trace elements (Ba, Cd, Cr, Cu, Ni, Pb and As) in the karst water were below the WHO and Directive 98/83/EC acceptable guidelines values for drinking purposes. Ba concentration ranged from 6.14 mg L−1 to 679 mg L−1. The lowest value was attributed to GWR22, while the highest values to GWR23 and GWR24. Even so, regarding the Ba concentration, all the tested karst waters were within the acceptable limits indicated by the WHO Guideline for Drinking Water and by the Directive 98/83/EC [26,27]. The highest Sr concentrations were determined in GWR23, GWR20 and GWR24, while the rest of the samples did not present strong variation among sites.
The high concentrations of Sr in GWR23, GWR24 and GWR20 is a consequence of the Sr and Ca association in groundwaters (as they present chemical similarities) and of the interactions with salted water [49]. In the case of Fe, three out of fourteen karst waters exceeded the guideline values established by the WHO and by the Directive 98/83/EC—GWR16, GWR23 and GWR24. In the case of GWR3, Fe was the only element that could negatively influence the karst water’s good quality. The range of Cr concentration was lower than the permissible level (50 µg L−1) established by the WHO and by the Directive 98/83/EC [26,27], presenting slightly higher values for GWR14, GWR19 and GWR12. The concentrations of Co were situated below 2.0 µg L−1 in all the studied samples; the highest values were established in the central area of the Apuseni Mountains (GWR13). Cu concentrations were below the guideline values established by the WHO and by the Directive 98/83/EC [26,27] and no significant spatial variation among sites was noticed. The concentration of Ni was influenced by the soil type, pH level and aquifer depth [50]. In this study, almost all waters had Ni concentrations much lower than the guideline value established by the WHO for drinking water purposes, except for GWR23 and GWR24, which had Ni concentrations close to the guideline established by the Directive 98/83/EC [27]. The Mn concentration in GWR23 was higher than the guideline value established by the Directive 98/83/EC [27], but smaller than the guideline value established by the WHO. Except for the southern-located water sources (GWR23, GWR24), in the studied area, no significant variation in Mn concentrations (2.21–7.81 µg L−1) was noticed. Although the highest values of Zn concentrations were obtained in the case of GWR17, GWR15, GWR19, GWR25 and GWR12, all these water sources being located at the territorial limit of the studied area, no significant differences were recorded in the Zn distribution among the water sources. The Pb concentrations met the guideline values set by the Directive 98/83/EC in all tested karst waters, slightly higher values being identified in the water sources located in the central region, while As had a value equal to the guideline value in the case of GWR22. Despite this, As had acceptable concentrations in all the studied water samples, with very minor variations among sites.

3.2. Groundwater Quality Index (GWQI)

To determine the karst water’s suitability for drinking purposes, based on the GWQI (Table 5), the quality of groundwater was divided into five classes ranging from good quality to extremely poor quality. The GWQI < 50 indicates excellent quality, while 50 < GWQI < 100 suggests good quality, 100 < GWQI < 150 indicates medium quality, 150 < GWQI < 200 indicates poor quality, and GWQI >200 indicates extremely poor quality [51,52]. However, this GWQI does not consider the microbiologic load in the GWQI calculation. The GWQI ranged from 27.1 to 107, with a mean value of 40.0 and a standard deviation of 24.9, indicating that the quality of karst waters from the Apuseni Mountains in the study area ranged between medium and excellent. Some concerns could appear due to the high concentrations of TDS, HCO3, F, Ca, Fe and Mn in GWR23 and GWR24. For the southern region, the GWQI was between 86.8 and 106, indicating only good or medium groundwater quality, most probably due to rock dissolution processes. Generally, aquifers with GWQI < 100 are appropriate for domestic use (drinking, cooking, animal husbandry), while those with GWQI > 100 may cause severe risks to human health, potentially leading to the failure of multiple organs [53].
In Dobrogea, another important karst area in Romania, Moldovan et al. reported excellent to good water quality and, for a couple of sources, the presence of possible health risk due to the high content of NO3, Cd and Cr [47]. Nitrate pollution is one of the most important causes of groundwater pollution, being the main reason for poor groundwater quality in a karst region in Central America [54], while TDS is reported to be the reason for the poor quality of a groundwater in Tefenni, Turkey [55]. Water with low quality is mainly characterized by high values of NO3, Cl, SO42−, Ca, Mg and Na, due to natural interactions such as weathering of rocks and evaporation processes, or to anthropogenic influences, especially pollution with organic materials subject to underground nitrification processes. Seasonal variation in water quality might be an issue in the future and continuous monitoring may be a suitable method to identify the main processes and the origin of the contaminants affecting the groundwater quality and recharge of the aquifer [55,56].

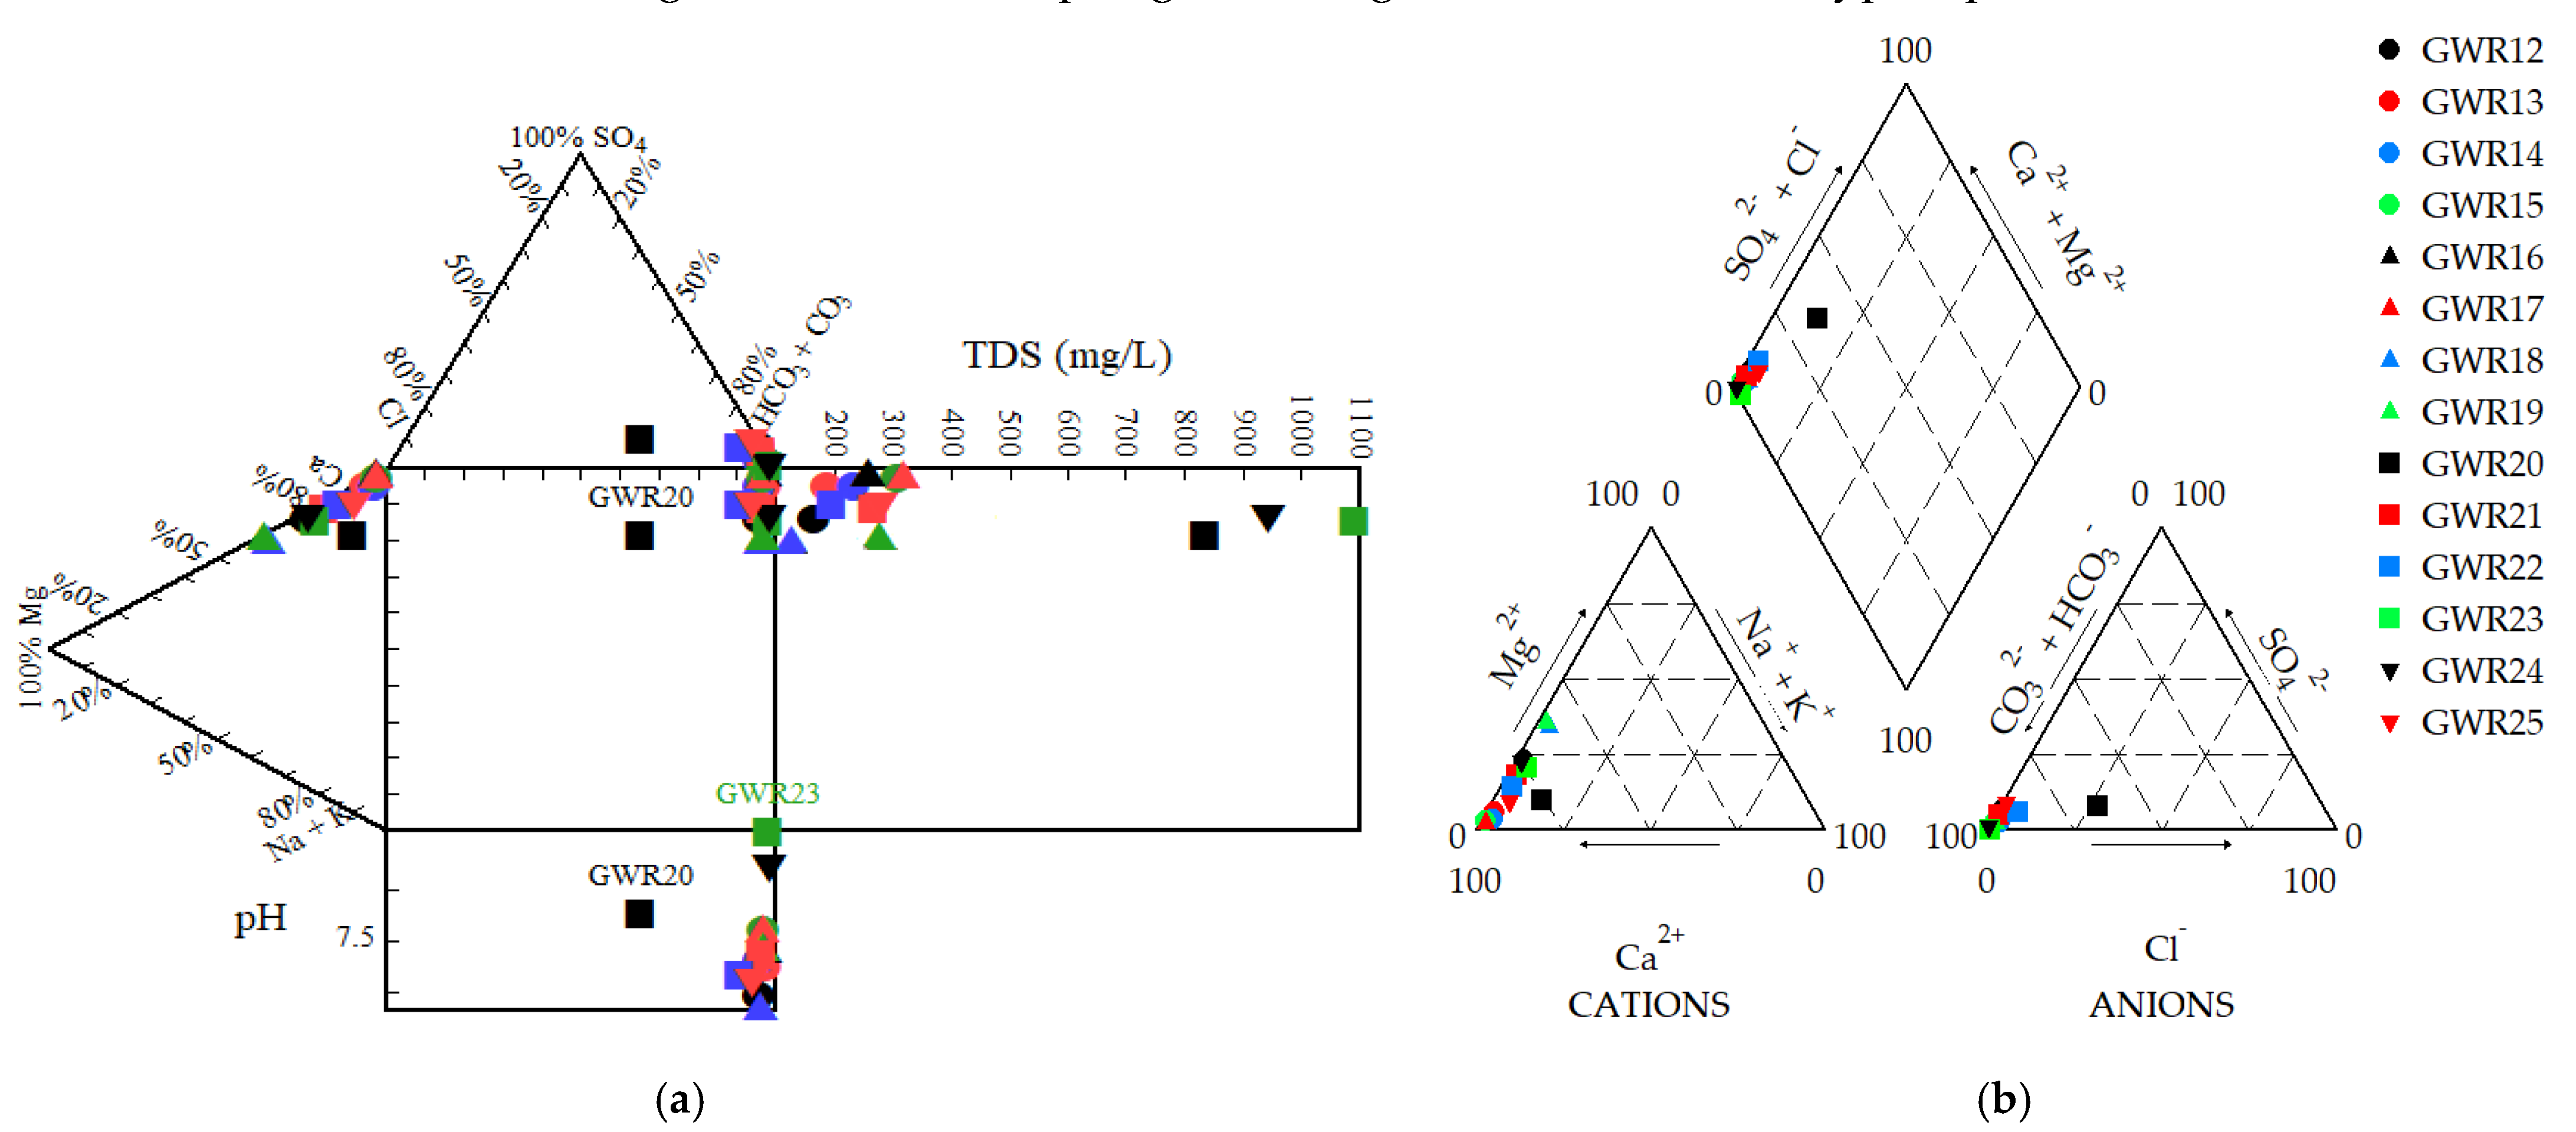
3.3. Hydrogeochemical Facies

Generally, the Durov diagram indicates the main hydrochemical processes involved in the water chemistry: ion exchange, reverse ion exchange, simple dissolution and mixing [32]. For the studied karst waters, the Durov diagram (Figure 2a) shows that the majority of waters are alkaline with TDS, confirming the influence of limestone lithology on the water composition. The GWR20, GWR23 and GWR24 are circumneutral with a high TDS. For all samples, the main process that defines the water chemistry is the dissolution, along with the water recharge in limestone and, to a lesser extent, in dolostone. The Piper diagram (Figure 2b) showed that the sum of alkaline earth elements (Ca + Mg) is higher than the sum of alkali elements (Na + K). Similarly, the sum of weak acid radicals (HCO3 + CO3) is higher than the sum of strong acid radicals (SO4 + Cl). All the studied karst water samples have similar Ca-Mg-HCO3 type hydrogeochemical facies, confirming that all studied springs discharge from a carbonate-type aquifer.

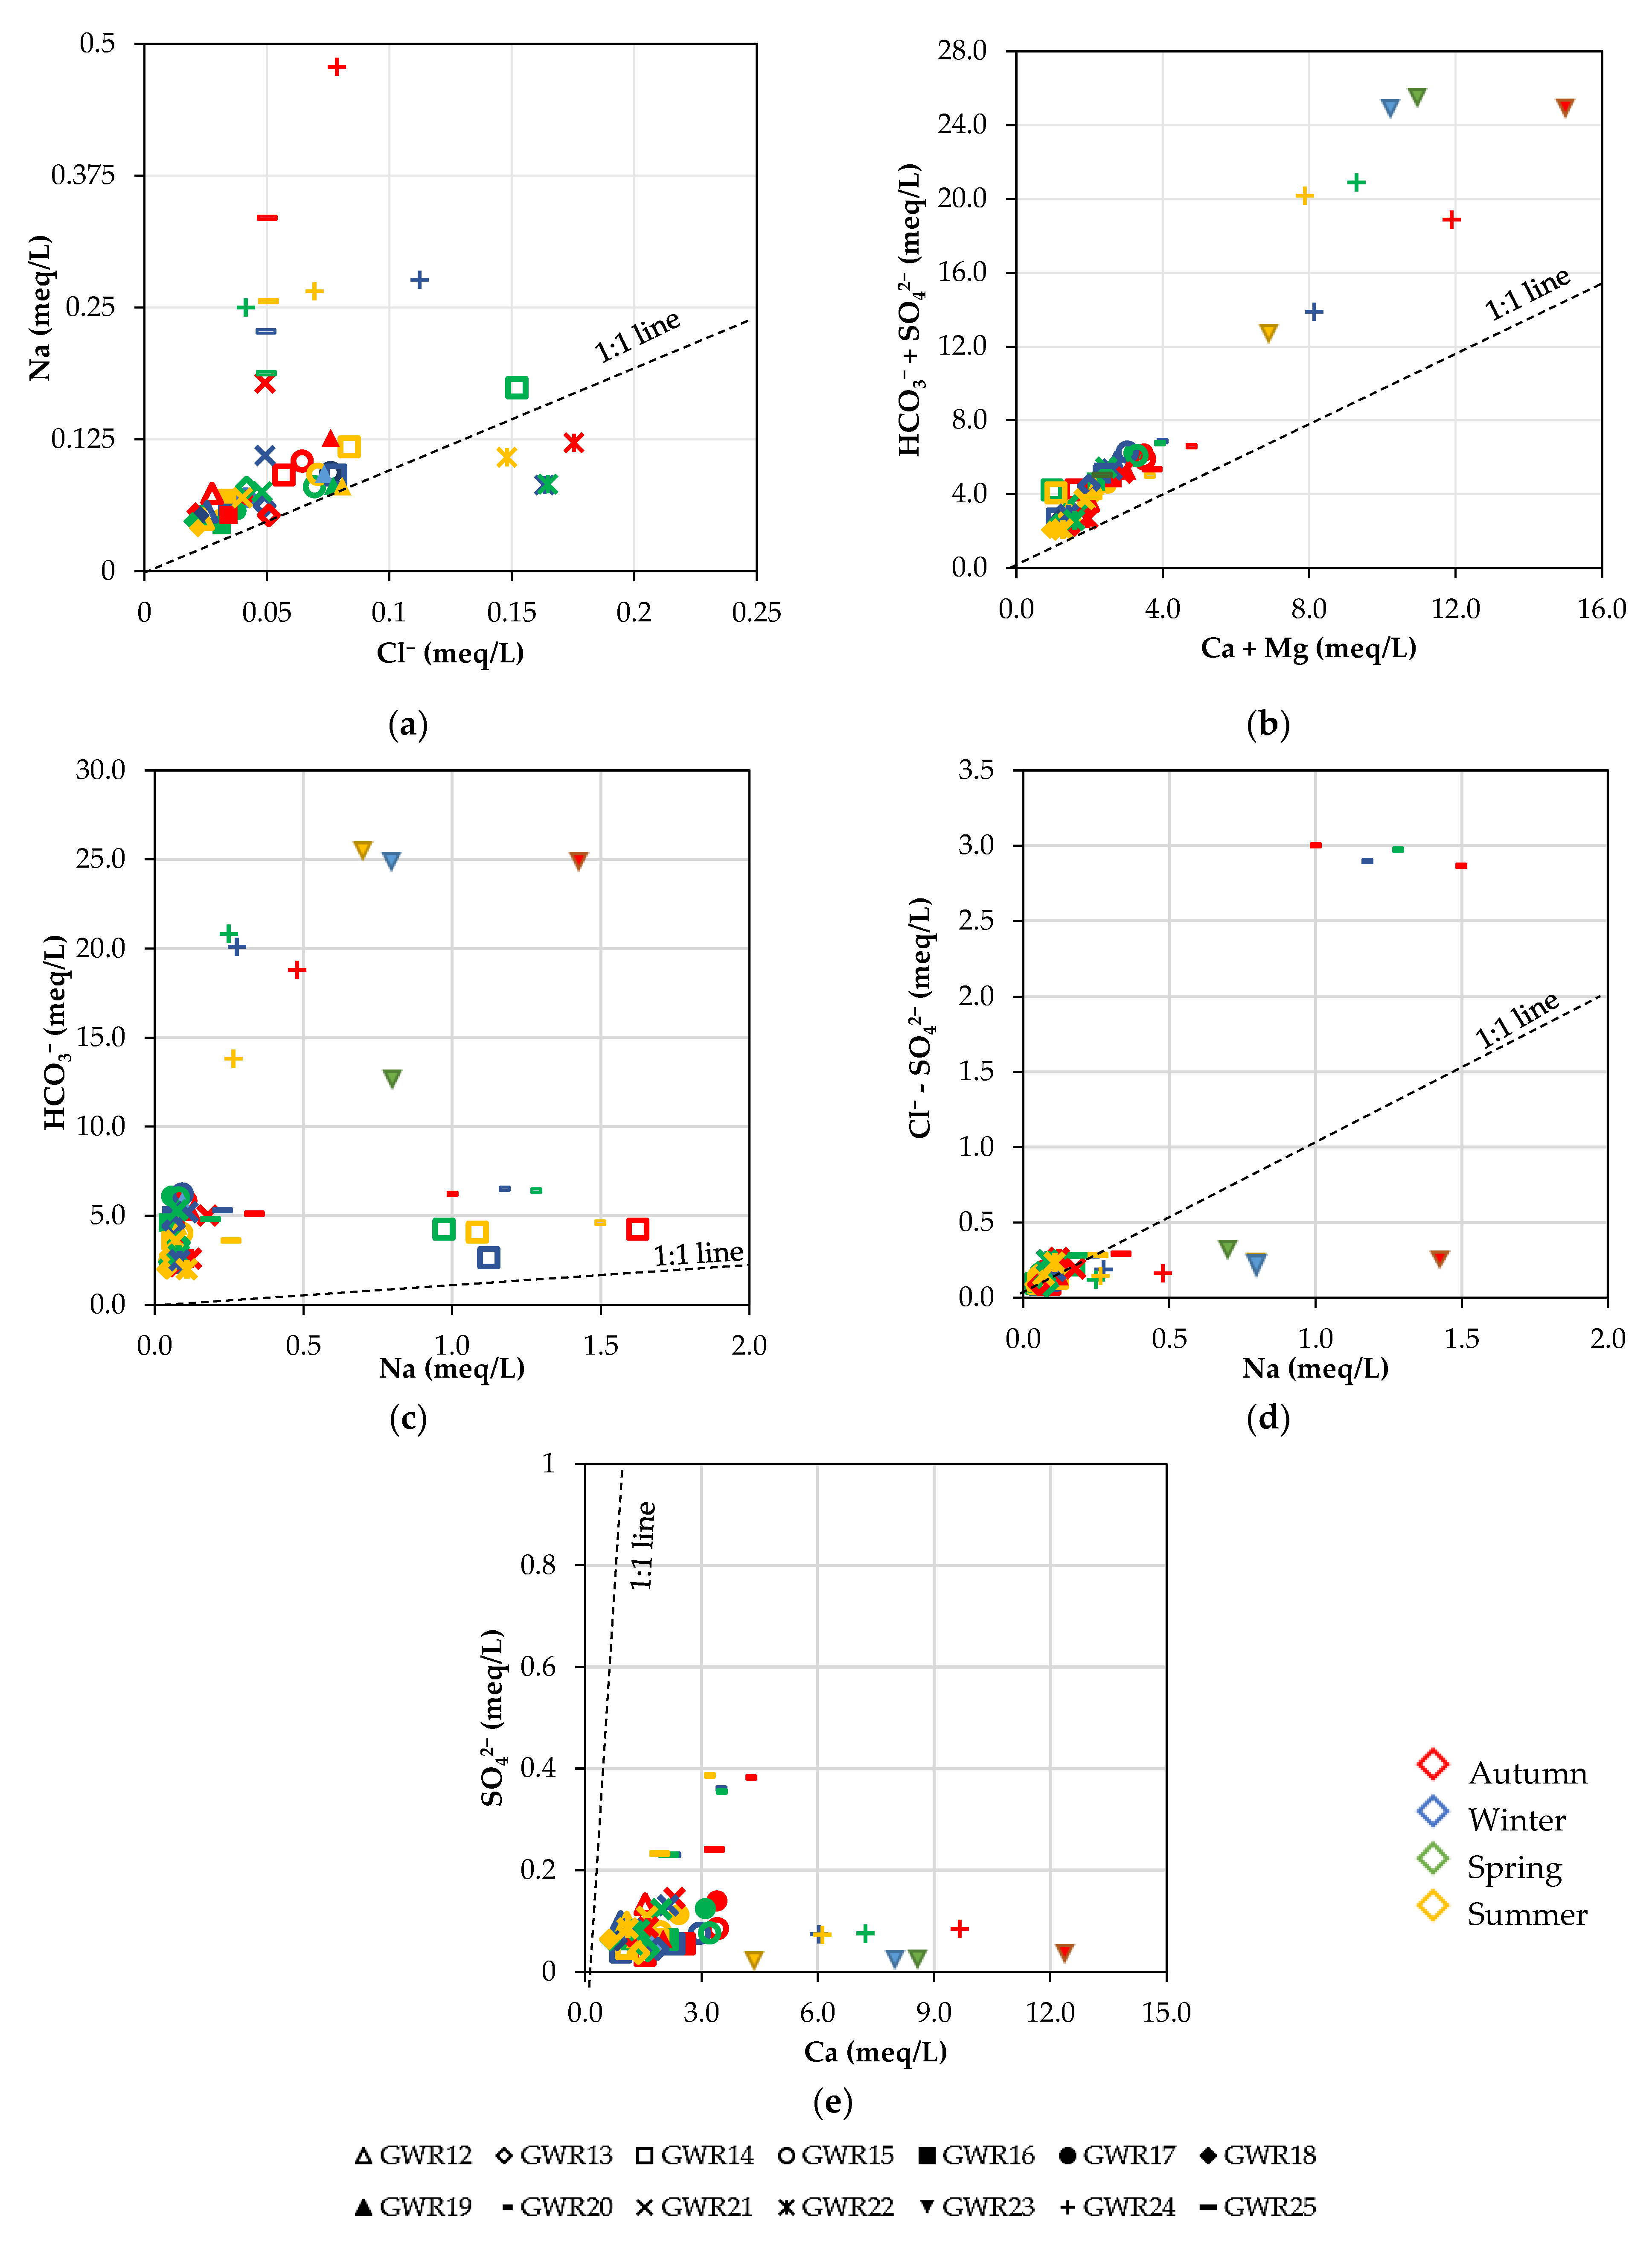
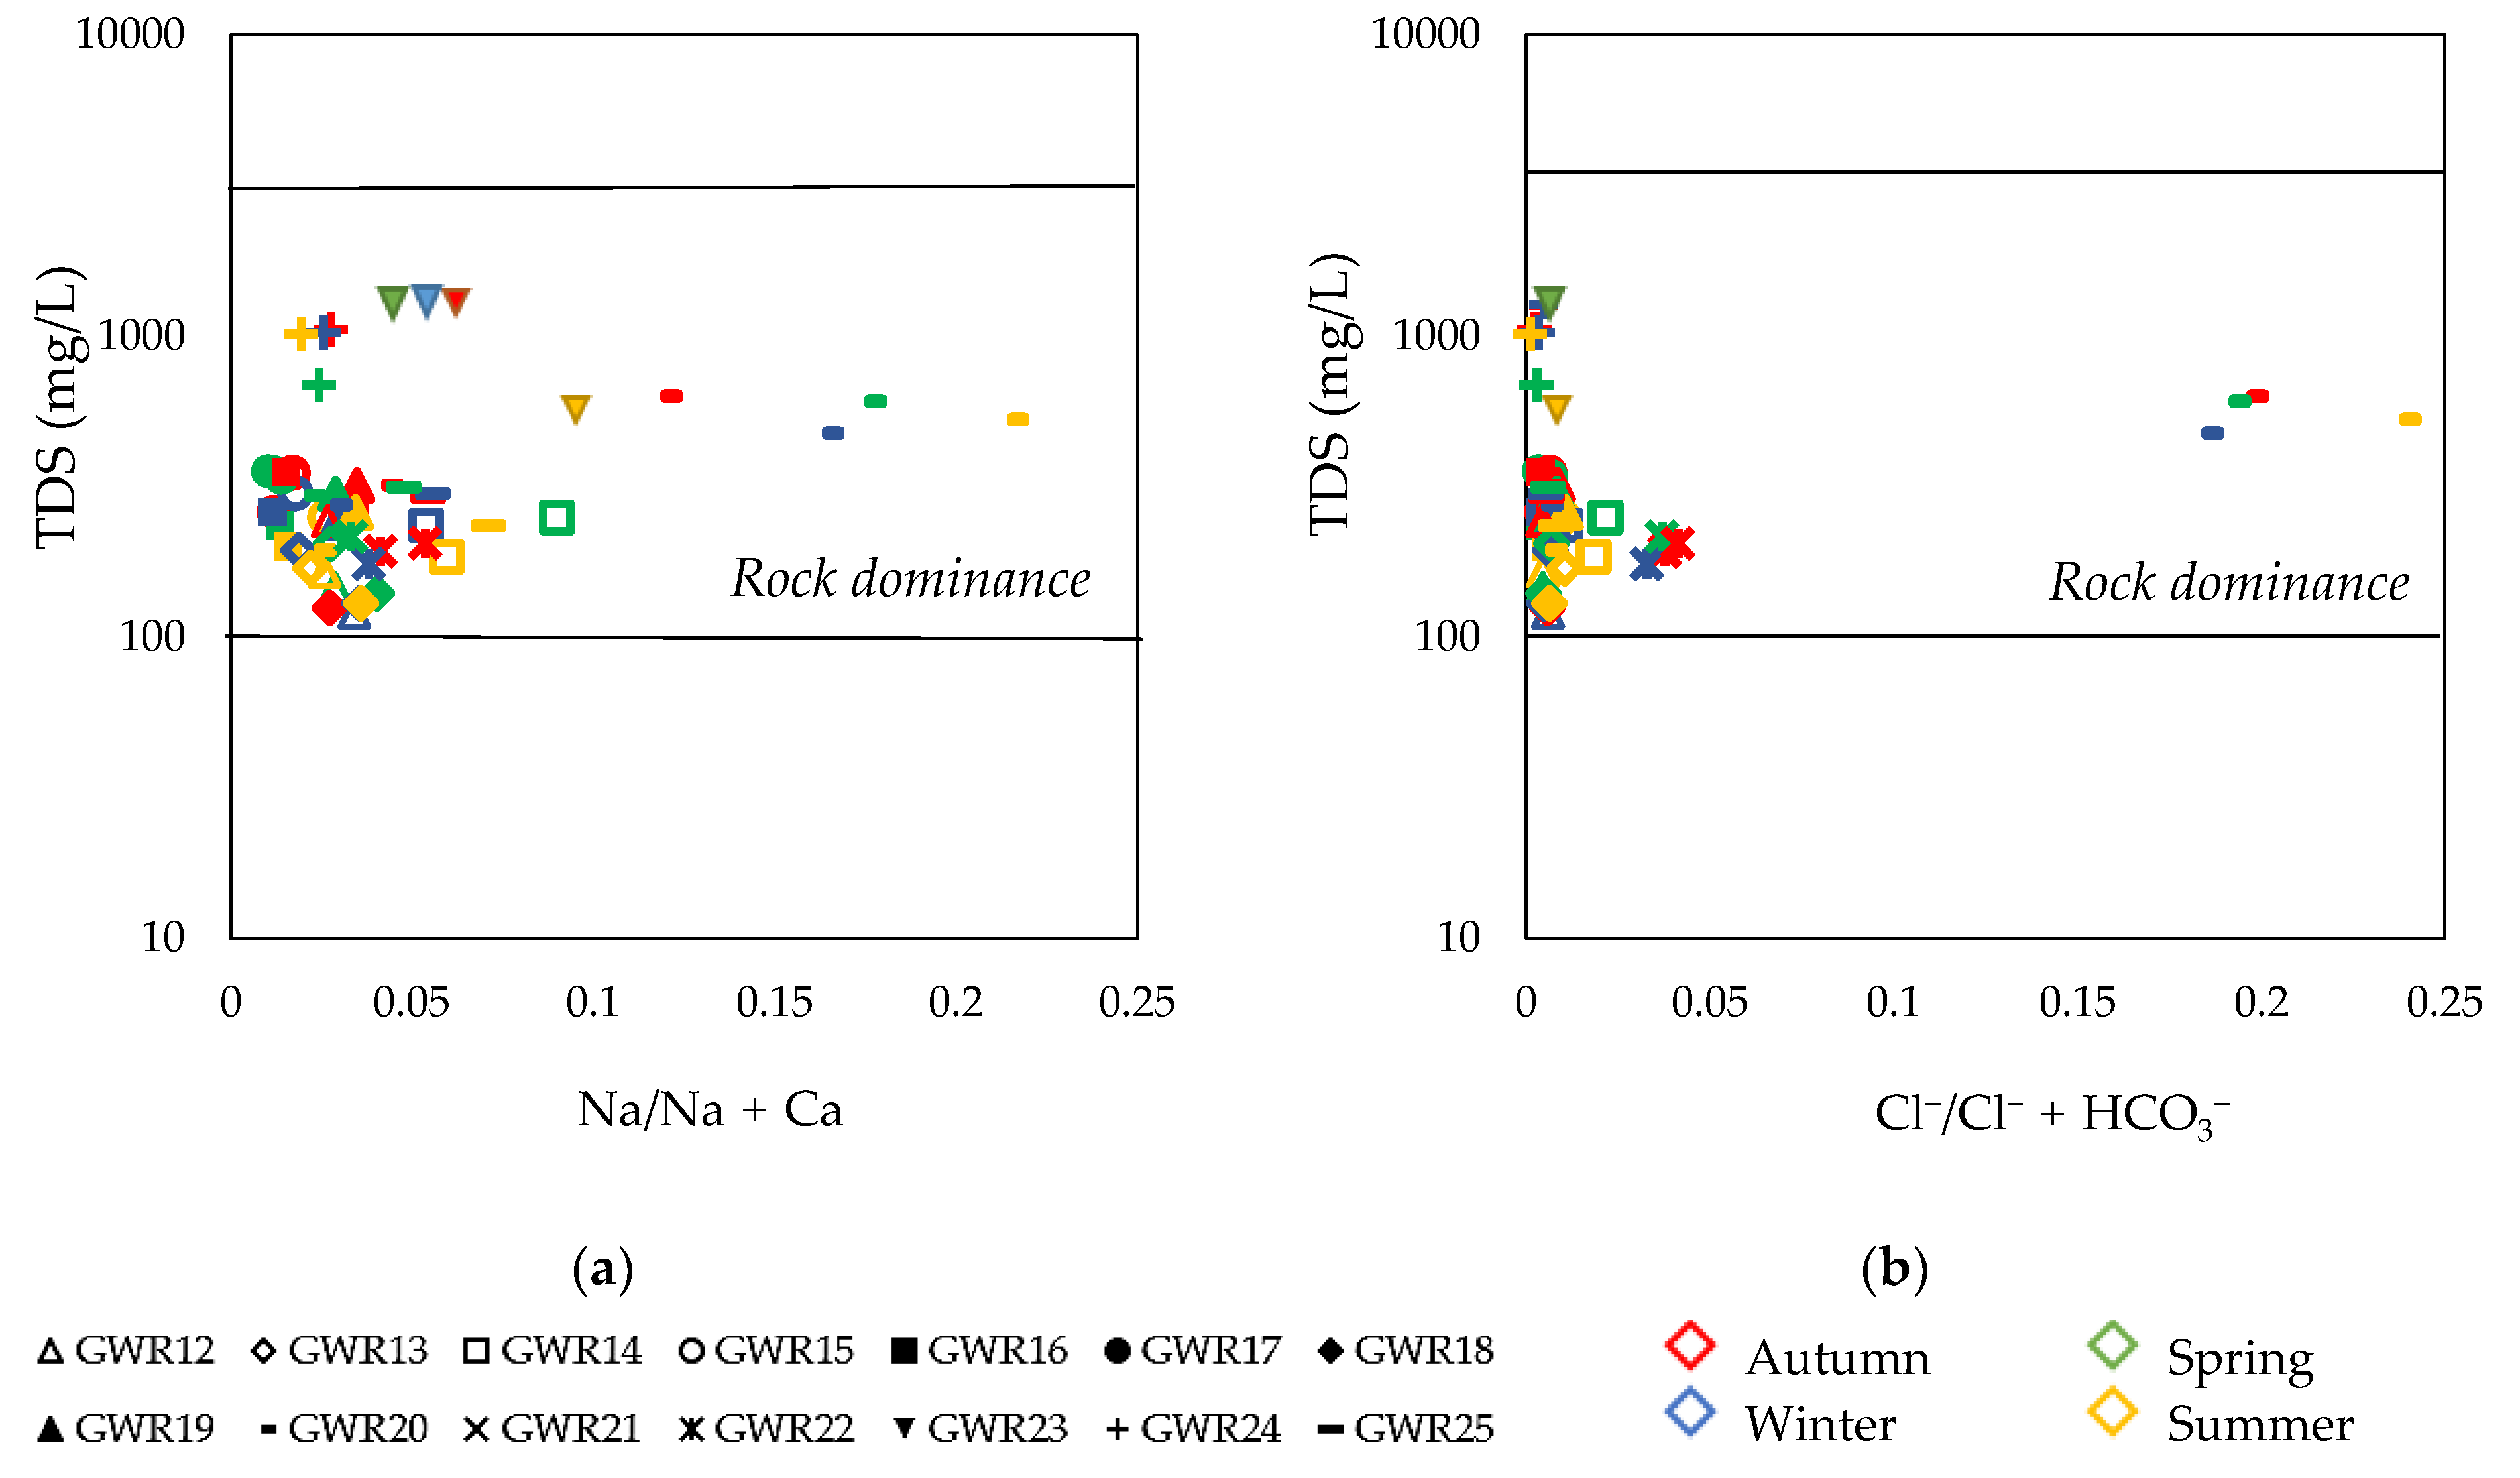
3.4. Main Hydrochemical Processes

The interaction of water with minerals plays a significant role in controlling the chemistry of groundwaters. The major ion chemistry indicates the type of water–rock interactions: dissolution, weathering or ion exchange [57,58]. To establish the possible interaction between karst and water and to reveal the possible origin of the solutes in groundwater, the major ion relationship (Figure 3) and the Gibbs diagram (Figure 4) were plotted. The plotted ratios of the dominant ions in the karst waters did not show any significant differences between the sampling seasons.
The relation between Na and Cl may indicate (i) halite dissolution if the Na/Cl ratio is approximately 1; (ii) silicate weathering or cation exchange if the Na/Cl ratio > 1, and (iii) an anthropogenic input if the Na/Cl < 1 [8,58]. Figure 3a showed that most of the studied karst waters were along the 1:1 line or above, indicating that halite dissolution and silicate weathering were the most important sources of Na. The ratio between Ca + Mg and HCO3 + SO42− around the 1:1 relation line (Figure 3b) showed that carbonates and dolomite dissolution were the main Ca and Mg sources in all samples except for GWR23 and GWR24. As shown in Figure 3c, there were no water samples plotted around the 1:1 line, suggesting that the dissolution of silicates was not the main source of cations [8,58]. As the plotted ratio of Na/ Cl-SO42− lay around the 1:1 line (Figure 3d), these ions derive most probably from the dissolution of sodium sulphate and halite [8,58]. Since Ca concentration was much higher than SO42− (Figure 3e), the weathering of gypsum was not the main source of Ca and SO42− [8].
The Gibbs [59,60,61] diagram is another tool for assessing the hydrogeochemical evolution of karst and for identifying the predominant processes of groundwater chemistry. Initially, the diagrams were developed to explain the main processes governing the surface water chemistry: atmospheric precipitation, rock–water interaction and evaporation. Later, the Gibbs diagrams were used also for groundwater chemistry [62,63]. Barica [63] highlighted the low importance of evaporation in groundwater chemistry, while Marandi proposed a simplification of the Gibbs diagram, where the rock dominance has higher importance than the other factors [64].
With high values of TDS and low values of Na/Na + Ca or Cl/Cl + HCO3, the Gibbs diagram (Figure 4) indicated that all the samples fell in the central region, suggesting that rock weathering was the main hydrochemical process influencing the chemical composition of the waters, in all the analyzed seasons.

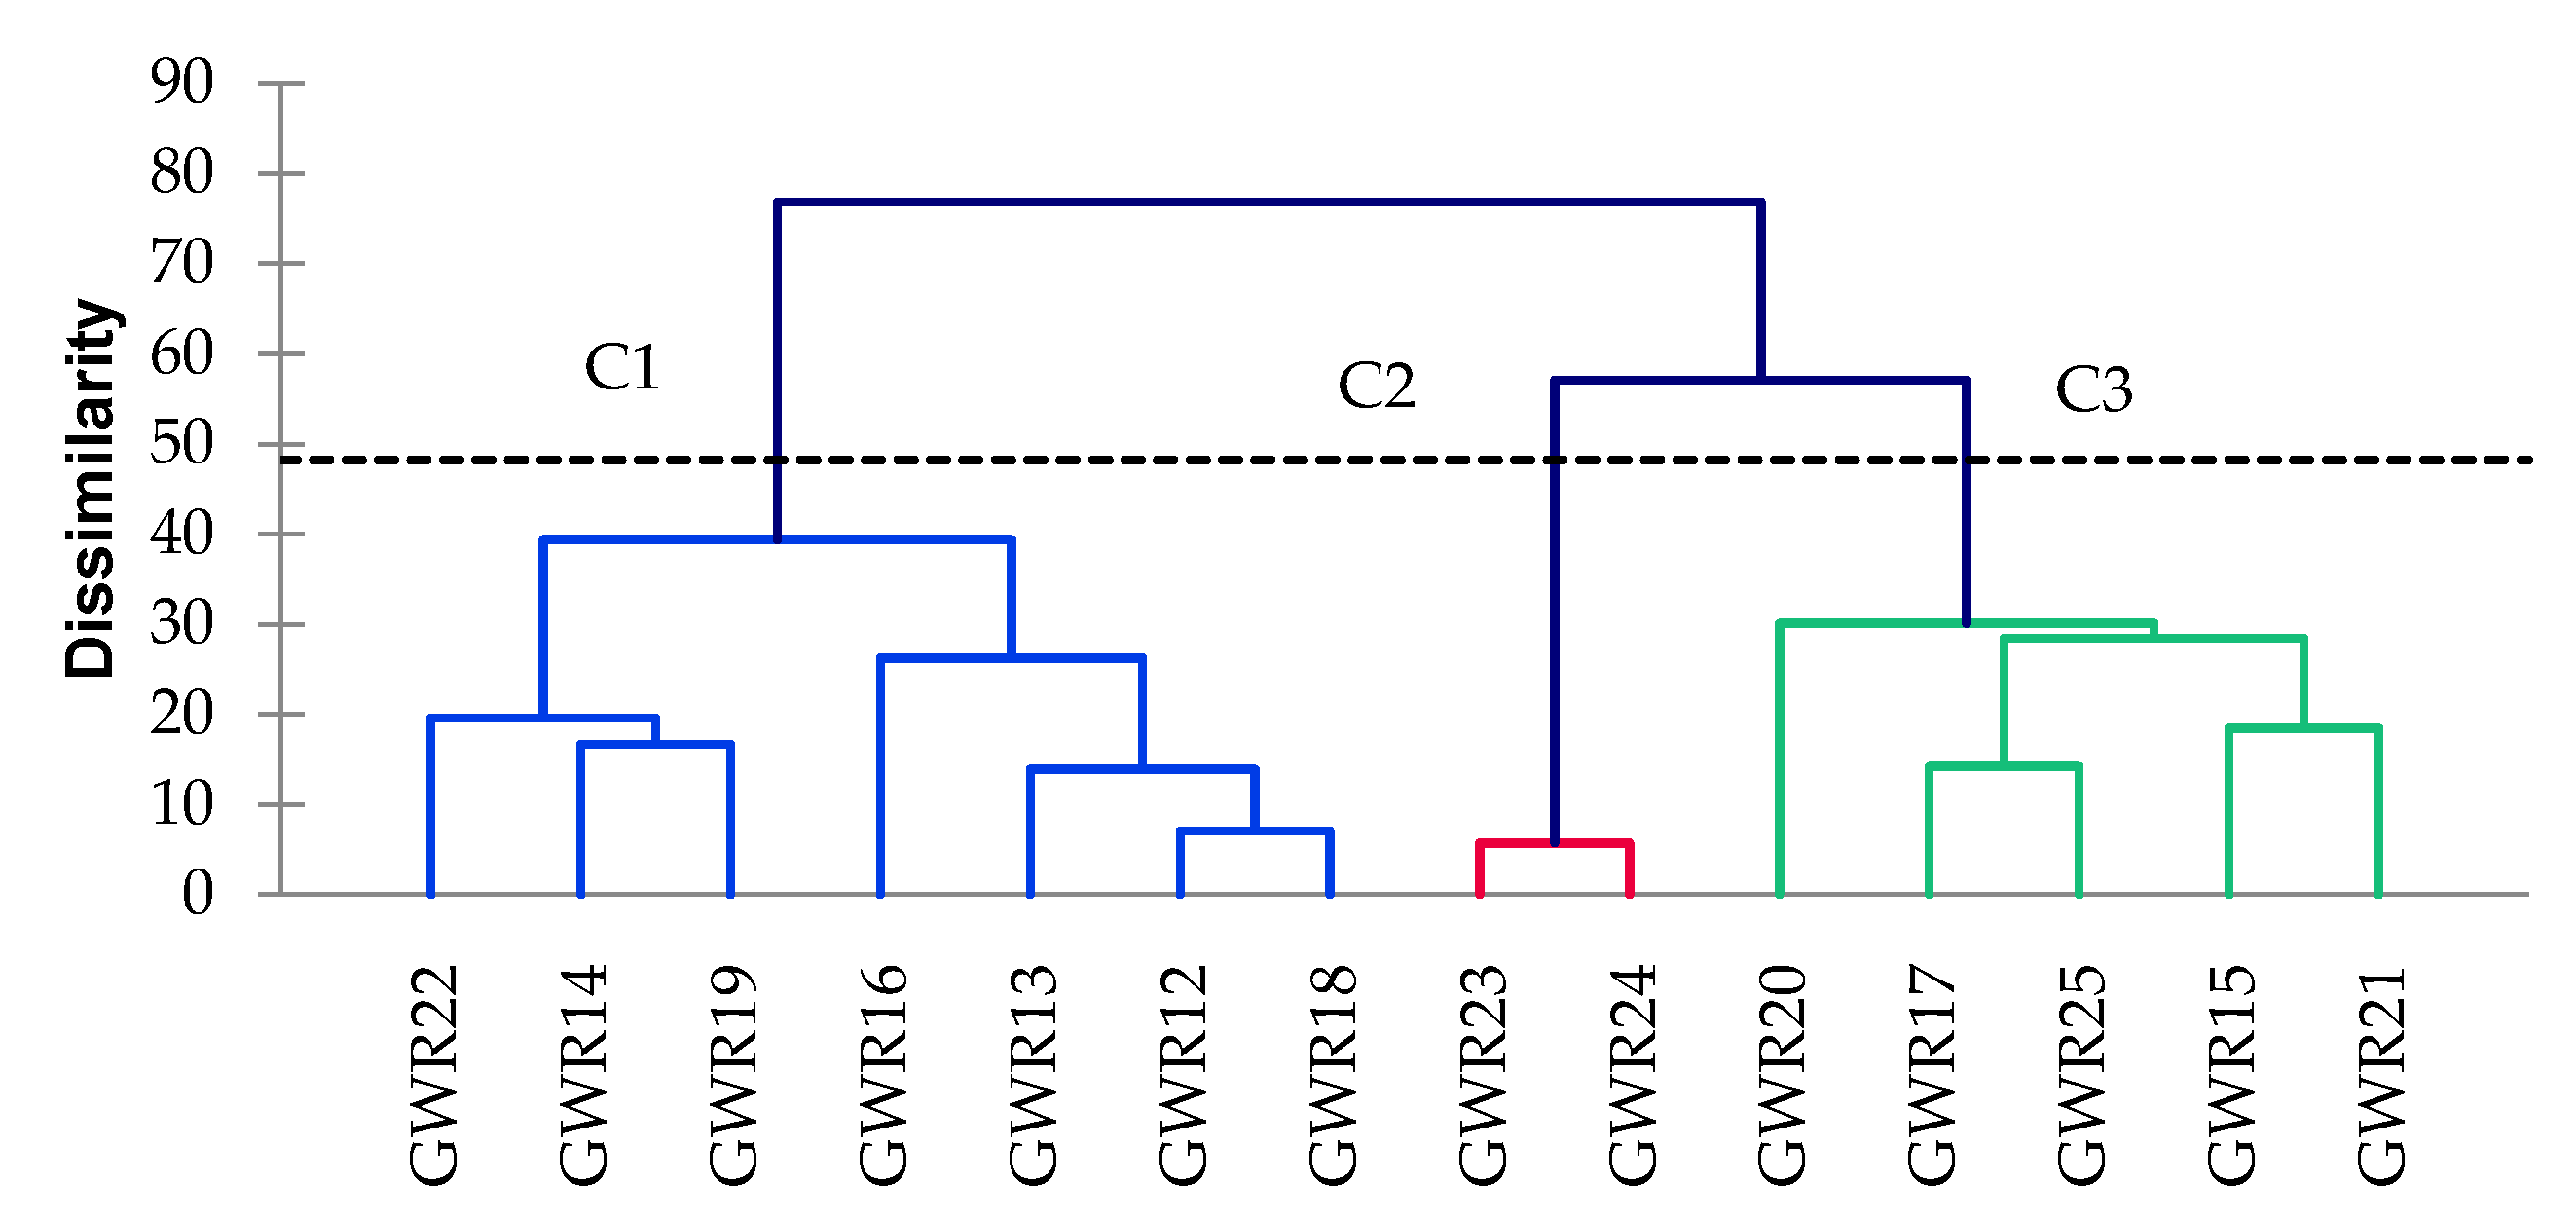
3.5. Cluster Analysis

Based on the similarity in chemical characteristics, the studied karst waters were classified into three clusters (Figure 5). The first group, C1, comprises the samples located in the western–central region of the studied area. These samples correspond to karst sources with low ecological risk, having excellent quality, low EC and low carbonate content. The water samples grouped in C1 originate from local or discontinuous aquifers based on limestone/sandstone/dolomite geological beds. Cluster C2 groups the water samples with the lowest quality, GWR23 and GWR24, characterized by an average pH below 7 and high EC and carbonate contents. GWR23 and GWR24 are situated at the interface of crystalline schists, limestones and dolomites in metamorphic formations.
Group C3 includes karst waters with average TA, TH, HCO3 content and an average concentration of metals, situated within or next to metamorphic formations of limestone and dolomites. According to the GWQI, the overall quality of the water samples grouped in C3 was excellent, but with higher GWQI values than the water samples from C1.

4. Conclusions

The geochemical characteristics of karst water sources from the Apuseni Mountains were investigated. The hydrogeochemical analysis of the study revealed that the majority of the studied indicators were lower than the guidelines established by the WHO and the Directive 98/83/EC, except for the HCO3, Mn, Fe and As. The studied springs were free of contamination with heavy metals (Co, Cu, Cr, Ni, Zn and Pb) and of nitrogen compounds (total nitrogen, NO3 and NH4+), with the exception of the water sources located in the southern region of the study area. High levels of HCO3, Ca, Mg and Fe were found in the case of GWR23 and GWR24, while the As concentration was higher than the allowable limit for drinking purposes, in the case of GWR22. Based on the GWQI classification, the majority of the samples fell under the excellent water category, proving their suitability for drinking purposes, except for GW23 and GW24, which were characterized as having only medium, respectively good quality. The GWQI ranged between 21.7 and 107. The Piper trilinear diagram showed that the groundwaters in the study area were classified as Ca-Mg-HCO3 type. According to the Gibbs diagram, the predominant samples fell under the rock–water interaction dominance, except for GWR23 and GWR24, suggesting that the chemistry of water sources in the southern region was governed by evaporation processes. This study is significant for the protection of karst water sources, presenting informative data, useful models and methods for groundwater quality evaluation. The chemical composition of karst waters is influenced by different factors and the specific characteristics of the region (climate, geology, hydrology, anthropogenic activities). To the best of our knowledge, the hydrogeochemical nature of the studied springs has been poorly investigated, specific data of groundwater quality not being included in the WOKAM. Therefore, the data obtained in the present study could be useful in comparing karst water resources in Romania with karst waters in different parts of the world.

Author Contributions

Conceptualization, A.M., V.M. and O.T.M.; methodology, M.-A.H. and E.K.; sampling, I.C.M., M.K. and T.B.; analysis, O.C., M.-A.H., A.M., E.A.L. and E.K.; writing—original draft preparation, A.M., E.K., M.-A.H., I.C.M., E.A.L. and O.T.M.; writing—review and editing, O.C., E.K., E.A.L., V.M. and O.T.M.; funding acquisition, O.T.M. All authors have read and agreed to the published version of the manuscript.

Funding

This research leading to these results has received funding from the EEA grants 2014-2021, under Project GROUNDWATERISK, contract no. 4/2019.

Institutional Review Board Statement

Not applicable.

Informed Consent Statement

Not applicable.

Data Availability Statement

The data presented in this study is available on request from the corresponding author.

Conflicts of Interest

The authors declare no conflict of interest.

References

  1. Chen, Z.; Aulier, S.A.; Bakalowicz, M.; Drew, D.; Griger, F.; Hartmann, J.; Jiang, G.; Moosdorf, N.; Richts, A.; Stevanovic, Z.; et al. The world karst aquifer mapping project: Concept, mapping procedure and map of Europe. Hydrogeol. J. 2017, 25, 771–785. [Google Scholar] [CrossRef] [Green Version]
  2. Goldscheider, N.; Chen, Z.; Auler, A.S.; Bakalowicz, M.; Broda, S.; Drew, D.; Hartmann, J.; Jiang, G.; Moosdorf, N.; Stevanovic, Z.; et al. Global distribution of carbonate rocks and karst water resources. Hydrogeol. J. 2020, 28, 1661–1677. [Google Scholar] [CrossRef] [Green Version]
  3. Olarinoye, T.; Gleeson, T.; Marx, V.; Seeger, S.; Adinehvand, R.; Allocca, V.; Andreo, B.; Apaéstegui, J.; Apolit, C.; Arfib, B.; et al. Global karst springs hydrograph dataset for research and management of the world’s fastest-flowing groundwater. Sci. Data 2020, 7, 59. [Google Scholar] [CrossRef] [PubMed] [Green Version]
  4. Onac, B.P.; Goran, C. Karst and caves of Romania: A brief overview. In Caves and Karst Systems of Romania; Ponta, G.M.L., Onac, B.P., Eds.; Springer: Cham, Switzerland, 2019; pp. 21–35. [Google Scholar]
  5. Orășeanu, I.; Iurkiewicz, A. Karst hydrogeology of Romania; Belvedere: Oradea, Romania, 2010; p. 444. [Google Scholar]
  6. Bătinaş, R.; Şerban, G.; Sabӑu, D. Water resources from Apuseni Mountains—Major coordinates. In Water Resources Management in Romania; Negm, A., Romanescu, G., Zeleňáková, M., Eds.; Springer International Publishing: Cham, Switzerland, 2020; pp. 517–575. [Google Scholar]
  7. Ponta, M.L. Karst hydrogeology. In Cave and karst systems of Romania; Ponta, M.L., Onac, B.P., Eds.; Springer International Publishing AG: Cham, Switzerland, 2019; pp. 41–47. [Google Scholar]
  8. Zhang, B.; Zhao, D.; Zhou, P.; Qu, S.; Liao, F.; Wang, G. Hydrochemical characteristics of groundwater and dominant water–rock interactions in the Delingha Area, Qaidam Basin, Northwest China. Water 2020, 12, 836. [Google Scholar] [CrossRef] [Green Version]
  9. Hartmann, A.; Goldscheider, N.; Wagener, T.; Lange, J.; Weiler, M. Karst water resources in a changing world: Review of hydrological modeling approaches. Rev. Geophys. 2014, 52, 218–242. [Google Scholar] [CrossRef]
  10. Wang, Z.; Torres, M.; Paudel, P.; Hu, L.; Yang, G.; Chu, X. Assessing the karst groundwater quality and hydrogeochemical characteristics of a prominent dolomite aquifer in Guizhou, China. Water 2020, 12, 2584. [Google Scholar] [CrossRef]
  11. Seghedi, I. Geological evolution of the Apuseni Mountains with emphasis on the Neogene magmatism–A review. In Au-Ag-telluride Deposits of the Golden Quadrilateral, Apuseni Mountains; Cook, N.J., Ciobanu, C.L., Eds.; Geol. Inst. of Romania: Bucharest, Romania, 2004; pp. 5–23. [Google Scholar]
  12. Ács, F.; Zsákai, A.; Kristóf, E.; Szabó, A.I.; Breuer, H. Carpathian Basin climate according to Köppen and a clothing resistance scheme. Theor. Appl. Climatol. 2020, 141, 299–307. [Google Scholar] [CrossRef] [Green Version]
  13. Peel, M.C.; Finlayson, B.L.; McMahon, T.A. Updated world map of the Köppen-Geiger climate classification. Hydrol. Earth Syst. Sci. 2007, 11, 1633–1644. [Google Scholar] [CrossRef] [Green Version]
  14. Ghenea, C.; Bandrabur, T.; Ghenea, A. Atlas of Romania: The Underground and Mineral Waters Map; Sheet V-2; Romanian Academy, Institute of Geography: Bucharest, Romania, 1981. [Google Scholar]
  15. European Union. Copernicus Land Monitoring Service 2018, European Environment Agency (EEA). Available online: https://land.copernicus.eu/ (accessed on 3 December 2020).
  16. Fick, S.E.; Hijmans, R.J. WorldClim 2: New 1 km spatial resolution climate surfaces for global land areas. Int. J. Climatol. 2017, 37, 4302–4315. [Google Scholar] [CrossRef]
  17. Clesceri, L.S.; Eaton, A.D.; Greenberg, A.E.; Franson, M.A.H. Standard methods for the examination of water and wastewater, 19th ed.; American Public Health Association, American Water Works Association, Water Environment Federation: Washington, DC, USA, 1995. [Google Scholar]
  18. Adimalla, N.; Qian, H.; Nandan, M.J. Groundwater chemistry integrating the pollution index of groundwater and evaluation of potential human health risk: A case study from hard rock terrain of south India. Ecotoxicol. Environ. Saf. 2020, 206, 111217. [Google Scholar] [CrossRef]
  19. Towfiqul Islam, A.R.; Siddiqua, M.T.; Zahid, A.; Tasnim, S.S.; Rahman, M. Drinking appraisal of coastal groundwater in Bangladesh: An approach of multi-hazards towards water security and health safety. Chemosphere 2020, 255, 126933. [Google Scholar] [CrossRef]
  20. Horton, R.K. An index number system for rating water quality. J. Water Pollut. Control. Fed. 1965, 37, 300–305. [Google Scholar]
  21. Backman, B.; Bodis, D.; Lahermo, P.; Rapant, S.; Tarvainen, T. Application of a groundwater contamination index in Finland and Slovakia. Environ. Geo. 1998, 36, 55–64. [Google Scholar] [CrossRef]
  22. Soltan, M.E. Evaluation of groundwater quality in Dakhla Oasis (Egyptian Western Desert). Environ. Monit. Assess. 1999, 57, 157–168. [Google Scholar] [CrossRef]
  23. S’tambuk-Giljanovic, N. Water quality evaluation by index in Dalmatia. Water Res. 1999, 33, 2440–3423. [Google Scholar] [CrossRef]
  24. Ribeiro, L.; Paralta, E.; Nascimento, J.; Amaro, S.; Oliveira, E.; Salgueiro, R. A agricultura e a delimitac ao das zonas vulnera’veis aos nitratosdeorigem agrı’cola segundo a Directiva 91/676/CE. Proceeding of the III Congreso Iberico sobre Gestion e Planificacion del Agua, Universidad de Sevilla, Seville, Spain, 13–17 November 2002; pp. 508–513. [Google Scholar]
  25. Saeedi, M.; Abessi, O.; Sharifi, F.; Meraji, H. Development of groundwater quality index. Environ. Monit. Assess. 2010, 163, 327–335. [Google Scholar] [CrossRef]
  26. WHO. Guidelines for Drinking-Water Quality, 4th ed.; Incorporating first addendum; World Health Organization: Geneva, Switzerland, 2017; Available online: https://www.who.int/publications/i/item/9789241549950 (accessed on 14 January 2021).
  27. Council Directive 98/83/EC of 3 November 1998 on the quality of water intended for human consumption. Available online: https://eur-lex.europa.eu/legal-content/EN/TXT/PDF/?uri=CELEX:31998L0083&from=EN (accessed on 3 December 2020).
  28. Ghobadi, M.H.; Dehban Avan Stakhri, M.; Mirarab, A. Investigating the hydrogeological properties of springs in a karstic aquifer in Dorfak region (Guilan Province, Iran). Environ. Earth Sci. 2018, 77, 96. [Google Scholar] [CrossRef]
  29. Piper, A.M. A graphic procedure in the geochemical interpretation of water analyses. Eos. Trans. Am. Geophys. Union 1944, 25, 914–928. [Google Scholar] [CrossRef]
  30. Winston, R.B. Graphical user interface for MODFLOW, Version 4; U.S. Geological Survey Open-File Report; USGS: Rolla, MO, USA, 2020; 27, p. 315.
  31. Durov, S.A. Classification of natural waters and graphical representation of their composition. Doklady Akademii Nauk SSSR 1948, 59, 87–90. [Google Scholar]
  32. Ravikumar, P.; Somashekar, R.K.; Prakash, K.L. A comparative study on usage of Durov and Piper diagrams to interpret hydrochemical processes in groundwater from Srlis river basin, Karnataka, India. Elixir Earth Sci. 2015, 80, 31073–31077. [Google Scholar]
  33. Brown, C. Applied Multivariate Statistics in Geohydrology and Related Science, 1st ed.; Springer: Berlin, Germany, 1998; pp. 1–248. [Google Scholar]
  34. Singh, S.K.; Singh, C.K.; Kumar, K.S.; Gupta, R.; Mukherjee, S. Spatial-temporal monitoring of groundwater using multivariate statistical techniques in Bareilly District of Uttar Pradesh, India. J. Hydrol. Hydromech. 2009, 57, 45–54. [Google Scholar] [CrossRef] [Green Version]
  35. Saaty, T. A scaling method for priorities in hierarchical structures. J. Math. Psychol. 1977, 15, 234–281. [Google Scholar] [CrossRef]
  36. Wind, Y.; Saaty, T.L. Marketing Applications of the analytic hierarchy process. Manag. Sci. 1980, 16, 641–658. [Google Scholar] [CrossRef]
  37. Rahman, M.M.; Howladar, M.F.; Hossain, M.A.; Shahidul Huqe Muzemder, A.T.M.; Al Numanbakth, M.A. Impact assessment of anthropogenic activities on water environment of Tillai River and its surroundings, Barapukuria Thermal Power Plant, Dinajpur, Bangladesh. Groundw. Sustain. Dev. 2019, 10, 100310. [Google Scholar] [CrossRef]
  38. Freeze, R.A.; Cherry, J.A. Groundwater; Prentice-Hall: Englewood, NJ, USA, 1979. [Google Scholar]
  39. Hynes, H.B.N. Groundwater and stream ecology. Hydrobiologia 1983, 100, 93–99. [Google Scholar] [CrossRef]
  40. Ansari, J.A.; Umar, R. Evaluation of hydrogeochemical characteristics and groundwater quality in the quaternary aquifers of Unnao District, Uttar Pradesh, India. HydroResearch 2019, 1, 36–47. [Google Scholar] [CrossRef]
  41. Singh, A.K.; Tewary, B.K.; Sinha, A. Hydrochemistry and quality assessment of groundwater in part of NOIDA metropolitan city, Uttar Pradesh. J. Geo. Soc. India 2011, 78, 523–540. [Google Scholar] [CrossRef]
  42. Levei, E.; Senila, M.; Miclean, M.; Abraham, B.; Roman, C.; Stefanescu, L.; Moldovan, O.T. Influence of Rosia Poieni and Rosia Montana mining areas on the water quality of Aries River. Environ. Eng. Manag. J. 2011, 101, 23–30. [Google Scholar] [CrossRef]
  43. Moldovan, O.T.; Levei, E.; Banciu, M.; Banciu, H.L.; Marin, C.; Pavelescu, C.; Brad, T.; Cimpean, M.; Meleg, I.; Iepure, S.; et al. Spatial distribution patterns of the hypothetic invertebrate communities in a polluted river in Romania. Hydrobiologia 2011, 669, 63–82. [Google Scholar] [CrossRef]
  44. Moldovan, O.T.; Meleg, I.N.; Levei, E.; Terente, M. A simple method for assessing biotic indicators and predicting biodiversity in the hyporheic zone of a river polluted with metals. Ecol. Indic. 2013, 24, 412–420. [Google Scholar] [CrossRef]
  45. Moldovan, O.T.; Baricz, A.; Szekeres, E.; Kenesz, M.; Hoaghia, M.; Levei, E.; Mirea, I.; Năstase-Bucur, R.; Brad, T.; Chiciudean, I.; et al. Testing different membrane filters for 16S rRNA gene-based metabarcoding in karstic springs. Water 2020, 12, 3400. [Google Scholar] [CrossRef]
  46. Masoud, A.A.; Aldosari, A.A. Groundwater quality assessment of a multi-layered aquifer in a desert environment: A case study in Wadi ad-Dawasir, Saudi Arabia. Water 2020, 12, 3020. [Google Scholar] [CrossRef]
  47. Moldovan, A.; Hoaghia, M.-A.; Kovacs, E.; Mirea, I.C.; Kenesz, M.; Arghir, R.A.; Petculescu, A.; Levei, E.A.; Moldovan, O.T. Quality and health risk assessment associated with water consumption—A case study on karstic springs. Water 2020, 12, 3510. [Google Scholar] [CrossRef]
  48. Bhadra, T.; Hazra, S.; Sinha Ray, S.P.; Barman, B.C. Assessing the groundwater quality of the coastal aquifers of a vulnerable delta: A case study of the Sundarban Biosphere Reserve, India. Groundw. Sustain. Dev. 2020, 11, 100438. [Google Scholar] [CrossRef]
  49. Udeshani, W.A.C.; Dissanayake, H.M.K.P.; Gunatilake, S.K.; Chandrajith, R. Assessment of groundwater quality using water quality index (WQI): A case study of a hard rock terrain in Sri Lanka. Develop. 2020, 11, 100421. [Google Scholar] [CrossRef]
  50. Adeyemi, A.A.; Ojekunle, Z.O. Concentrations and health risk assessment of industrial heavy metals pollution in groundwater in Ogun state, Nigeria. Sci. Africa 2021, 11, e00666. [Google Scholar] [CrossRef]
  51. Belkhiri, L.; Tiri, A.; Mouni, L. Spatial distribution of the groundwater quality using kriging and Co-kriging interpolations. Groundw. Sustain. Dev. 2020, 11, 100473. [Google Scholar] [CrossRef]
  52. Rakib, M.A.; Sasaki, J.; Matsuda, H.; Quraishi, S.B.; Mahmud, M.J.; Bodrud-Doza, M.; Atique Ullah, A.K.M.; Fatema, K.J.; Newaz, M.A.; Bhuiyan, M.A.H. Groundwater salinization and associated co-contamination risk increase severe drinking water vulnerabilities in the southwestern coast of Bangladesh. Chemosphere 2020, 246, 125646. [Google Scholar] [CrossRef]
  53. Adimalla, N.; Taloor, A.K. Hydrogeochemical investigation of groundwater quality in the hard rock terrain of South India using Geographic Information System (GIS) and groundwater quality index (GWQI) techniques. Groundw. Sustain. Dev. 2019, 10, 100288. [Google Scholar] [CrossRef]
  54. Smith, A.N.I.; Ortega-Camachi, D.; Acosta-Gonzalez, G.; Leal-bautista, R.M.; Fox, W.E., III; Cejuda, E. A multi-approach assessment of land use effects on groundwater quality in a karstic aquifer. Heliyon 2020, 6, e03970. [Google Scholar] [CrossRef] [PubMed]
  55. Varol, S.; Davraz, A. Evaluation of the groundwater quality with WQI (Water Quality Index) and multivariate analysis: A case study of the Tefenni plain (Burdur/Turkey). Environ. Earth Sci. 2015, 73, 1725–1744. [Google Scholar] [CrossRef]
  56. Krishna Kumar, S.; Logeshkumaran, A.; Magesh, N.S.; Godson, P.S.; Chandraseker, N. Hydro-geochemistry and application of water quality index (WQI) for groundwater quality assessment, Anna Nagar, part of Chennai City, Tamil Nadu, India. Appl. Water Sci. 2015, 5, 335–343. [Google Scholar] [CrossRef] [Green Version]
  57. Bhat, N.A.; Jeelani, G.; Bhat, M.Y. Hydrogeochemical assessment of groundwater in karst environments, Bringi watershed, Kashmir Himalayas, India. Curr. Sci. 2014, 106, 1000–1007. [Google Scholar]
  58. Yuan, J.; Xu, F.; Deng, G.; Tank, Y.; Li, P. Hydrogeochemistry of shallow groundwater in a karst aquifer system of Bijie City, Guizhou Province. Water 2017, 9, 625. [Google Scholar] [CrossRef] [Green Version]
  59. Gibbs, R.J. Mechanisms controlling world water chemistry. Science 1970, 170, 1088–1090. [Google Scholar] [CrossRef]
  60. Liu, H.; Tang, J.; Zhang, X.; Wang, R.; Zhu, B.; Li, N.; Liang, C.; Zhao, P. Seasonal variations of groundwater recharge in a small subtropical agroforestry watershed with horizontal sedimentary bedrock. J. Hydro. 2020, 125703. [Google Scholar] [CrossRef]
  61. Lyu, M.; Pang, Z.; Yin, L.; Zhang, J.; Huang, T.; Yang, S.; Li, Z.; Wang, X.; Gulbostan, T. The control of the groundwater flow system and geochemical processes on groundwater chemistry: A study case in Wushenzhao Basin, NW China. Water 2019, 11, 790. [Google Scholar] [CrossRef] [Green Version]
  62. Barica, J. Salinization of groundwaters in arid zones. Water Res. 1972, 6, 925–933. [Google Scholar] [CrossRef]
  63. Palmer, D.C.; Cherry, J.A. Geochemical evolution of groundwater in sequences of sedimentary rocks. J. Hydro 1984, 75, 27–65. [Google Scholar] [CrossRef]
  64. Marandi, A.; Shand, P. Groundwater chemistry and the Gibbs Diagram. Appl. Geochem. 2018, 97, 209–212. [Google Scholar] [CrossRef]
Figure 1. Sampling sites’ locations in the general groundwater map (a) (modified after Ghenea et al., 1981 [14]); Corinne Land Cover (b) (data from Copernicus Land Monitoring Service 2018, European Environment Agency [15]), and the mean annual precipitation (c) (modified after Fick et al., 2017 [16]) in the Apuseni Mountains. Legend for (a): 1. Gravels and sands; 2. Pyroclastic rocks; 3. Gravels, sands and clays (local or discontinuous aquifers in porous formations); 4. Limestones and marly limestones; 5. Limestones; 6. Limestones and dolomites (local aquifers in limestones); 7. Limestones, sandstones and conglomerates; 8. Calcareous sandstones and limestones; 9. Limestones, marly limestones, sandstones and conglomerates; 10. Limestones and sandstones; 11. Limestones, dolomites, sandstones and conglomerates; 12. Limestones and dolomites in metamorphic formations (local or discontinuous aquifers in fissured rocks); 13. Marls, clays, tuffs and sands; 14. Marls, clays, limestones, sands and conglomerates; 15. Igneous rocks (formations with possible deep aquifers); 16. Red clays and marls; 17. Marls and shales; 18. Shales, clays, sandstones and conglomerates; 19. Crystalline schists; 20. Igneous rocks (formations without groundwater); 21. Faults; 22. Overthrust; 23. Rivers; 24. Localities; 25. Altitude (m); 26. Lakes.
Water 13 00857 g001
Figure 2. Durov (a) and Piper (b) diagrams describing the water facies of the studied karst waters.
Water 13 00857 g002
Figure 3. Scatterplots showing the correlation between major cations/anions to discriminate the geochemical processes in the four seasons: (a) Na vs. Cl, (b) (SO4 2− + HCO3) vs. (Ca + Mg), (c) Na vs. HCO3, (d) Na vs. Cl−SO42−, (e) Ca vs. SO42−.
Water 13 00857 g003
Figure 4. Gibbs diagram for the major ion composition of the studied karst water sources in the Apuseni Mountains: (a) Na/Na + Ca vs. TDS plot; (b) Cl/Cl + HCO3 vs. TDS plot.
Water 13 00857 g004
Figure 5. Dendrograms classifying the groundwater samples based on the chemical composition.
Water 13 00857 g005
Table 1. The studied karst water sources in the Apuseni Mountains with details on their geographic localization, flow rate in different seasons and the estimated number of people that use the water.
SiteNameCoordinatesAltitude
(m.a.s.l.)
Territorial
Administrative Unit
Population Using the WaterFlow Rate (L min−1)
AutumnWinterSpringSummer
GWR12Ferice46°38’28.12” N22°31’22.23” E350Buntesti50927.56060
GWR13Valea Politei46°28’45.17” N22°48’28.70” E786Garda de Sus580151524
GWR14Tarina46°50’16.83” N22°22’19.94” E292Rosia40052.7610
GWR15Josani46°59’58.52” N22°27’19.65” E298Magesti29724103050
GWR16Albioara46°51’12.41” N22°23’15.00” E460Dobresti6017.56.61515
GWR17Pisnita47° 1’18.92” N22°22’33.02” E258Astileu8232.8057
GWR18Moneasa46°27’54.26” N22°15’38.55”E330Moneasa636300300600150
GWR19Borz46°40’10.88” N22°10’43.39” E167Soimi1966.867.57.5
GWR20Livezile46°20’51.63” N23°38’23.28” E334Livezile63410101015
GWR21Rimetea46°27’13.19” N23°34’ 2.92” E532Rametea5841003530200
GWR22Campeni46°21’29.54” N23° 1’35.73” E563Campeni181106.67.510
GWR23Banpotoc45°54’ 9.52” N23° 0’15.91” E228Harau46560804028
GWR24Rapoltel45°52’48.88” N23° 3’36.25” E334Rapoltu2421006090100
GWR25Craciunesti46° 1’16.11” N22°52’15.19” E250Baita26242.527.5
Table 2. List of the groundwater quality parameters guideline value (Si), weight (wi) relative weight (Wi), used for the groundwater quality index (GWQI).
ParameterUnitGuideline Value
(Si) *
Weight
(wi)
Relative Weight
(Wi)
Potential of hydrogen (pH) 6.5–8.530.05
Total dissolved solids (TDS)mg L−1100050.09
Calcium (Ca)mg L−175 *40.07
Magnesium (Mg)mg L−13040.07
Sodium (Na)mg L−120020.04
Potassium (K)mg L−11220.04
Chloride (Cl)mg L−125040.07
Bicarbonate (HCO3)mg L−150050.09
Nitrate (NO3)mg L−15050.09
Sulfate (SO42−)mg L−125030.05
Fluoride (F)mg L−11.550.09
Arsenic (As)µg L−11030.05
Manganese (Mn)µg L−110030.05
Iron (Fe)µg L−1100030.05
Lead (Pb)µg L−11030.05
Nickel (Ni)µg L−17030.05
w i = 57 W i = 1.00 .
* Si represents the guideline values according to WHO [26].
Table 3. Range and mean values of pH, electrical conductivity (EC), total alkalinity (TA), HCO3, total dissolved solids (TDS), total hardness (TH), total nitrogen (TN), NH4+, NO3, F, Cl and SO42− in karst springs.
Site pH
EC
μS cm−1
TA
mmol L−1
HCO3
mg L−1
TDS
mg L−1
TH
mg L−1
TN
mg L−1
NH4+
mg L−1
NO3
mg L−1
F
mg L−1
Clmg L−1SO42−
mg L−1
GWR12Range7.80–8.20193–3282.40–3.80146–215120–242120–196<0.7000.032–0.1270.380–2.600.080–0.1300.820–0.9808.64–12.8
Mean8.052493.00178168148<0.7000.0861.600.1030.88810.0
GWR13Range7.20–8.10213–3182.80–4.00171–268170–205145–198<0.700–1.160.065–0.0902.69–4.55<0.050–0.1001.48–1.803.58–4.35
Mean7.772813.432181901720.9200.0773.590.0731.674.00
GWR14Range7.00–8.00232–4042.90–4.50159–256185–274167–2101.50–2.900.041–0.7806.48–10.50.060–0.1202.02–5.403.10–6.28
Mean7.703403.902292361922.140.2637.960.0753.294.38
GWR15Range7.10–7.80329–5674.00–6.60244–378250–350203–3512.10–3.040.079–0.6009.00–11.30.070–0.1302.29–2.707.25–8.14
Mean7.404875.753363102972.490.21910.10.0882.507.55
GWR16Range7.20–8.00267–4213.60–4.80220–305200–352193–227<0.700–0.924<0.026–0.2301.28–3.500.060–0.1201.12–1.225.30–6.14
Mean7.633704.452752622270.7810.0992.470.0801.195.67
GWR17Range7.10–7.70370–5704.40–6.10268–372260–355250–3490.940–1.10<0.026–0.2204.08–4.620.060–0.1201.10–1.4710.8–13.4
Mean7.434935.533383233061.050.1014.260.0831.3112.0
GWR18Range8.10–8.30182–2102.00–2.70122–165125–14095.2–124<0.700<0.026–0.1301.65–1.840.100–0.1700.700–0.8105.80–6.60
Mean8.201932.30140131112<0.7000.0781.740.1180.7586.07
GWR19Range7.50–7.70400–5054.40–5.50268–354240–320214–3011.55–2.100.029–0.2256.32–6.900.080–0.1302.60–2.875.75–6.21
Mean7.604525.133172802601.710.2256.670.0982.735.97
GWR20Range7.00–7.50759–9154.60–6.40281–397475–630353–4671.01–2.60<0.026–0.9004.50–8.35<0.050–0.18088.0–93.034.0–37.0
Mean7.238385.853615603971.500.2795.620.14391.035.5
GWR21Range7.60–7.70318–4713.60–5.20220–323195–320187–2881.20–1.40<0.026–0.3204.42–5.520.060–0.1201.42–1.7510.4–13.9
Mean7.654164.732912712451.310.1265.120.0751.6612.2
GWR22Range7.30–8.20231–2842.00–3.00122–171175–215126–1943.90–4.02<0.026–1.4013.3–18.20.090–0.1405.26–6.237.87–8.36
Mean7.852572.531511971554.020.42516.40.1105.798.11
GWR23Range6.20–6.90959–165420.6–25.4769–1549560–1280911–1299<0.700<0.026–0.250<0.200–0.3800.340–1.116.60–10.21.80–3.19
Mean6.43165423.9133610921110<0.7000.1010.3050.8407.912.31
GWR24Range6.50–7.301151–164013.8–20.8842–1269690–1052736–1010<0.700<0.026–0.1550.290–0.8200.170–0.2501.47–3.997.00–8.05
Mean6.75144517.91121947883<0.7000.0670.5030.2132.687.35
GWR25Range7.80–8.00355–4693.60–5.30220–323235–315207–2960.830–0.910<0.026–0.2603.07–4.600.060–0.1201.76–1.8022.1–23.1
Mean7.884224.702872852450.8770.1143.650.0751.7822.4
Si *6.5–8.52500NA500NANANANA501.50NA250
DWS **6.5–9.52500NANANANANA0.50501.50250250
* Si represents the guideline values according to WHO [26]; ** DWS represents the drinking water standard according to the Directive 98/83/EC [27].
Table 4. Range and mean values of major and trace elements in karst springs.
Site Ca
mg L−1
K
mg L−1
Mg
mg L−1
Na
mg L−1
Ba
µg L−1
Sr
µg L−1
Fe
µg L−1
Cr
µg L−1
Co
µg L−1
Cu
µg L−1
Ni
µg L−1
Mn
µg L−1
Zn
µg L−1
Pb
µg L−1
As
µg L−1
GWR12Range36.8–61.50.664–1.106.76–10.21.14–1.7026.4–74.844.3–84.360.7–2760.499–18.8<0.210–1.821.99–5.142.36–23.22.64–15.92.38–26.40.914–3.84<0.690–1.69
Mean45.40.8568.501.3443.363.21837.350.7543.519.467.8111.82.311.00
GWR13Range54.7–74.90.851–1.172.03–2.671.23–1.838.13–15.728.4–25.650.1–1281.28–10.20.515–1.951.83–3.332.92–9.511.34–5.082.14–19.60.726–2.44<0.690–1.44
Mean64.70.9902.431.5011.222.279.06.211.012.527.103.5910.91.670.940
GWR14Range64.7–80.50.708–2.241.27–2.102.10–4.0010.3–20.034.9–38.933.3–2011.02–21.3<0.210–1.891.22–3.063.34–17.31.45–5.072.25–13.51.56–3.20<0.690–0.914
Mean74.11.191.632.7313.736.81109.820.8132.5010.43.428.632.140.746
GWR15Range78.2–1370.596–0.8001.76–2.201.84–2.4012.9–22.849.9–58.844.4–2672.48–5.910.210–1.942.36–5.465.55–29.52.12–4.054.68–18.61.27–1.82<0.690–0.755
Mean1150.7052.012.1217.053.21273.660.9413.4412.83.3612.41.480.706
GWR16Range75.3–1020.445–0.8161.11–1.901.00–1.608.50–18.619.7–23.025.9–7990.87–4.16<0.210–1.841.66–2363.32–14.11.07–2.712.41–12.81.35–3.04<0.690–0.763
Mean88.50.5911.381.2713.121.62432.630.7252.017.062.228.742.020.708
GWR17Range97.1–1361.14–2.001.70–2.201.16–1.609.84–20.844.3–51.940.1–1961.02–8.590.210–0.6401.51–2.704.69–22.70.751–3.127.55–28.60.506–1.94<0.690–0.722
Mean1191.581.961.3615.947.91094.300.4192.0311.42.3016.11.310.701
GWR18Range26.0–33.21.18–2.277.18–10.90.941–1.3057.4–12499.1–12832.0–2691.29–7.66<0.210–1.891.61–3.752.36–10.30.850–4.028.94–12.01.03–4.24<0.690–2.52
Mean29.01.699.671.1490.11101114.260.7672.805.962.2110.72.031.33
GWR19Range52.0–80.70.825–1.6720.5–24.51.85–2.9013.3–25.555.8–64.646.0–3230.541–15.0<0.21–1.971.64–2.892.83–12.60.940–5.591.58–23.5<0.20–3.08<0.690–1.31
Mean66.31.1822.92.1817.960.01488.010.8172.169.163.1914.61.440.845
GWR20Range124–1671.80–3.399.59–12.222.7–34.118.0–32.8410–48525.5–2290.754–12.6<0.210–1.921.21–2.634.55–13.61.56–9.714.13–19.90.723–1.24<0.690
Mean1412.5010.928.226.14511264.610.7411.907.623.959.060.961<0.690
GWR21Range64.0–91.90.573–2.026.64–14.31.60–4.107.25–15.864.1–71.336.0–2752.37–4.30<0.210–1.901.32–3.253.49–17.11.31–4.455.62–22.10.645–1.40<0.690–1.25
Mean80.01.0711.12.4910.467.41123.620.7142.309.442.5211.11.090.967
GWR22Range43.9–65.00.341–0.7054.08–7.601.88–2.804.75–9.1897.5–43.048.1–4581.00–6.86<0.210–1.841.45–2.712.92–9.041.81–3.835.78–18.41.11–2.547.97–12.7
Mean53.00.5405.532.266.1439.71603.690.7202.045.493.0211.11.8410.2
GWR23Range264–4164.09–7.5753.2–62.916.1–32.8593–798359–52563.7–6140.690–2.63<0.210–1.690.985–3.717.13–21.135.0–1344.57–19.7<0.210–2.18<0.690–2.20
Mean3485.1158.521.46794783091.860.7762.3813.887.511.71.031.07
GWR24Range215–3171.64–3.1744.6–53.45.75–11.0105–139231–321120–6122.24–6.51<0.210–1.631.18–3.9910.4–19.015.1–49.31.67–21.7<0.210–3.36<0.690–5.54
Mean2732.1549.07.301232963253.640.7781.9614.130.310.61.562.00
GWR25Range77.0–1040.295–0.7643.61–9.204.31–7.7010.3–18.275.3–94.031.2–3031.05–7.28<0.210–1.161.89–4.504.13–24.81.48–12.52.09–20.1<0.210–2.64<0.690–2.04
Mean 88.80.5695.675.7814.986.11373.910.5502.799.934.6112.01.611.03
Si *NANANA2001300NA20050NA200070100NA1010
DWS **NANANANANANA20050NA20002050NA1010
* Si represents the guideline values according to WHO [26]; ** DWS represents the drinking water standard according to the Directive 98/83/EC [27].
Table 5. Groundwater quality index (GWQI) of the studied karst waters.
SiteGWQI ValueWater Quality *
GWR1225.9Excellent
GWR1323.8Excellent
GWR1427.1Excellent
GWR1533.9Excellent
GWR1631.3Excellent
GWR1733.0Excellent
GWR1821.7Excellent
GWR1933.7Excellent
GWR2044.0Excellent
GWR2130.3Excellent
GWR2231.5Excellent
GWR23107Medium
GWR2486.8Good
GWR2531.0Excellent
Mean40.0-
STDV24.9-
* Excellent (GWQI < 50), good (50 < GWQI < 100), medium (100 < GWQI < 150), poor (150 < GWQI < 200), extremely poor (GWQI >200) quality [18].
Publisher’s Note: MDPI stays neutral with regard to jurisdictional claims in published maps and institutional affiliations.

