Article

Changes in Pelagic Fish Community Composition, Abundance, and Biomass along a Productivity Gradient in Subtropical Lakes

1
State Key Laboratory of Lake Science and Environment, Nanjing Institute of Geography and Limnology, Chinese Academy of Sciences, Nanjing 210008, China
2
Wuhan Zhiyue Water Ecological Technology Company, LTD., Wuhan 430014, China
3
Yunan Key Laboratory of Plateau Geographical Processes and Environmental Change, Faculty of Geography, Yunnan Normal University, Kunming 650500, China
4
School of Geography, South China Normal University, Guangzhou 510630, China
5
Department of Ecology and Institute of Hydrobiology, Jinan University, Guangzhou 510630, China
6
Sino-Danish Centre for Education and Research (SDC), University of Chinese Academy of Sciences, Beijing 100190, China
7
Department of Bioscience, Aarhus University, Silkeborg 8600, Denmark
8
Limnology Laboratory, Department of Biological Sciences and Centre for Ecosystem Research and İmplementation, Middle East Technical University, Ankara 06800, Turkey
9
Institute of Marine Sciences, Middle East Technical University, Erdemli-Mersin 33731, Turkey
*
Author to whom correspondence should be addressed.
Water 2021, 13(6), 858; https://doi.org/10.3390/w13060858
Submission received: 23 January 2021 / Revised: 16 March 2021 / Accepted: 17 March 2021 / Published: 21 March 2021
(This article belongs to the Special Issue Impacts of Human Activities and Climate Change on Freshwater Fish)

Abstract

:
How fish communities change with eutrophication in temperate lakes is well documented, while only a few studies are available from subtropical lakes. We investigate the fish community structure in 36 lakes located in the Yangtze River basin, covering a wide nutrient gradient. We found that fish species richness and total fish catch per unit effort (CPUE) increased significantly with chlorophyll a (Chla). Among the different feeding types, the proportion of zooplanktivores increased significantly with Chla, while the percentage of omnibenthivores showed no obvious changes; the CPUE of piscivorous Culter spp. increased with Chla, while their proportion of total catch decreased pronouncedly. Based on the index of relative importance (IRI), the most important and dominant fish species was the zooplanktivorous Sijiao (Toxabramis swinhonis), followed by the omniplanktivorous sharpbelly (Hemiculter leucisculus) and the omnibenthivorous crucian carp (Carassius carassius), a small-sized species belonging to the Cyprinidae family. The CPUE of these three species increased significantly with Chla. The focus has, so far, been directed at large fish, but as emphasized by our results, the abundant small fish species were dominant in our subtropical study lakes even in terms of biomass, and, accordingly, we recommend that more attention be paid to the population dynamics of these species in the future.

1. Introduction

Fish play an important role in structuring aquatic ecosystems through various pathways. Predation by planktivorous fish on zooplankton affects the abundance, size, and species composition of the zooplankton community [1,2,3] and, thereby, indirectly, the phytoplankton, having cascading effects even down to physicochemical conditions [4]. Benthivorous fish may also affect the water quality by inducing sediment disturbance and resuspension, resulting in reduced water transparency and increased nutrient release from the sediment [5]. Fish abundance and community structure are influenced by the nutrient state and productivity of lakes [6,7,8,9,10]. Anthropogenic eutrophication has become a severe problem in lake ecosystems worldwide, often accompanied by an increase in phytoplankton biomass and loss of water clarity, with implications for the fish community as well. For instance, the feeding efficiency of piscivorous fish in productive lakes is reduced due to decreased water transparency, while planktivorous fish species may be less affected [11]. Consequently, planktivorous and omnivorous fish may benefit from the released predation pressure by piscivores and the enhanced food availability in terms of higher biomasses of zooplankton [12] and macroinvertebrates [13,14,15] in eutrophic lakes.
The responses of fish community structure to lake eutrophication have been intensively investigated, especially in Europe. Typically, the total biomass of fish increases with eutrophication [10,16]; the fish community changes to a dominance of cyprinids, especially roach (Rutilus rutilus) and bream (Abramis brama) [7,8], and the percentage of piscivorous fish declines with nutrient enrichment in European lakes [3]. However, in a study of 36 Finnish lakes, the biomass of both cyprinids and percids increased with lake productivity [7]. At lower nutrient levels, eutrophication leads to a shift from dominance by salmonids to percids [17,18]. Fish size is also affected by eutrophication, with a shift from dominance by large-sized to smaller-sized specimens [3,19]; this may, in part, be due to the weaker predator control of planktibenthivorous fish by piscivorous fish in more eutrophic lakes.
The response of fish community structure to lake eutrophication in subtropical lakes has been comparatively less investigated [20,21,22,23,24,25]. The richness of omnivorous fish species is reported to increase with decreasing latitude [26]; fish, overall, become smaller, and their abundance is higher [27,28]. In China, crucian carp (Carassius carassius), common carp (Cyprinus carpio), sharpbelly (Hemiculter leucisculus), Sijiao (Toxabramis swinhonis), silver carp (Hypophthalmichthys molitrix), bighead carp (Hypophthalmichthys nobilis), and some smaller-sized zooplanktivorous fish species are common, especially in shallow subtropical lakes [21,29]. A large number of shallow lakes are located in the Yangtze River basin [30] (subtropical zone). These lakes exhibit contrasting nutrient states [31], but little is known about their fish communities and how they respond to changes in productivity. We conducted a survey of 36 Yangtze River basin lakes with contrasting nutrient concentrations. Based on existing relationships for temperate lakes, we hypothesized that (1) fish species richness would be higher in the more productive lakes and that (2) fish total catch per unit effort would increase with increasing productivity, while (3) mean body size would decrease because of the dominance by small-sized species. We also predicted that (4) zooplanktivorous fish would constitute an increasing proportion at the expense of piscivores and that the proportion of omnivores would be high in the more productive lakes.

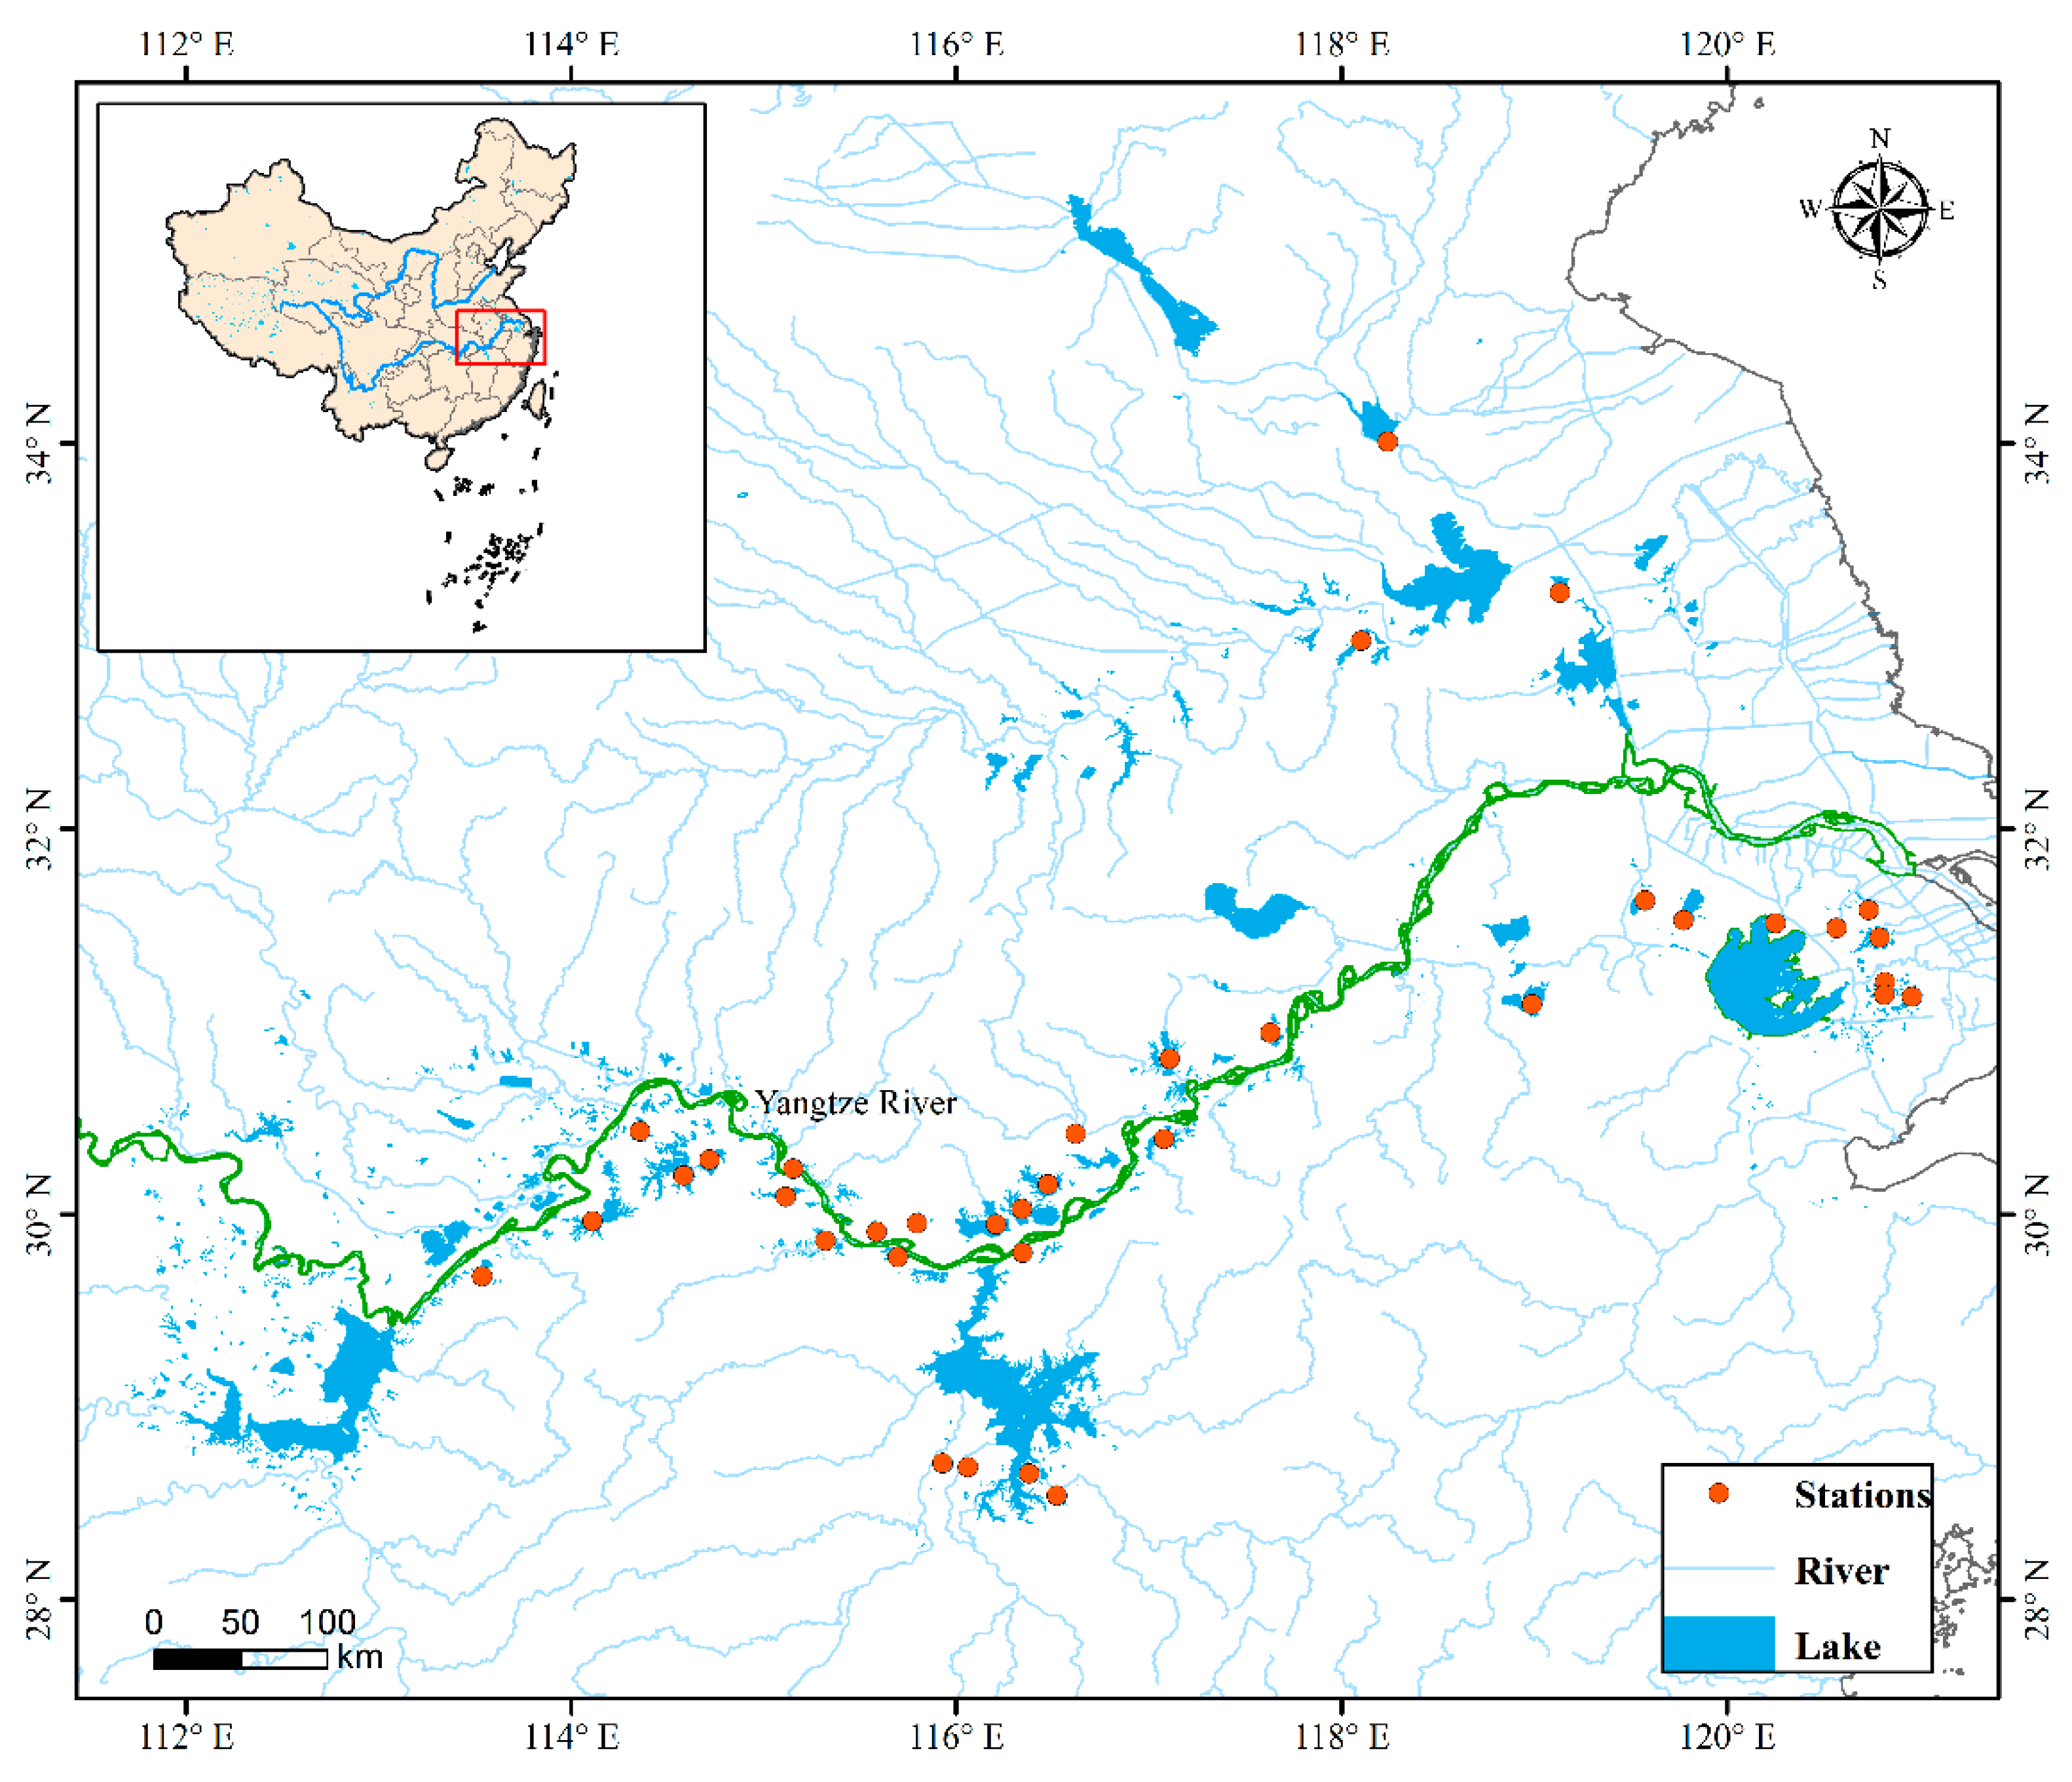
2. Materials and Methods

2.1. Sample Collection and Analysis

In the summer (June to August) of 2016, fish community structure and lake physicochemical variables were investigated in 36 lakes (Figure 1). Multisized gill nets—eight mesh sizes (5, 10, 15, 20, 25, 30, 35, and 40 mm), 10 m long, and 1.5 m high—were used to sample the fish community. The nets are pieced together, from small to large, the 5–15 mm mesh nets being pelagic and the remaining benthic. New nets were used in each lake as holes may often occur after net retrieval and the removal of fish. During each sampling event, at around 9:00 to 10:00 a.m., one net was set randomly perpendicular to the shoreline in the pelagic area of each lake and left for 2 h, after which total catch per net was recorded as biomass per unit effort (per hour) (BPUE) and number per unit effort (NPUE). We classified fish species by their feeding habits, following Teixeira-de Mello et al. (2009) [20]: planktivores, omnibenthivores, omniplanktivores, omniherbivores, and piscivores. According to Teixeira-de Mello et al. (2009) [20], zooplanktivorous fish feed only on zooplankton, while omnivorous fish feed on at least two trophic levels; piscivores feed mainly on fish but also include shrimps in their diet. Nevertheless, we adapted this classification for the omnivorous species with omniplanktivores (feeding mainly on plankton) and omnibenthivores (collecting food mostly from the sediment).
Physicochemical samples and variables of the study lakes were collected from three stations per lake. A Secchi disc was used to measure the transparency (SD), and water depth was recorded with a sensor (SM-5 Depthmate Portable Sounder, Laylin Associates LTD., Unionville, VA, USA) at each sampling site. The integrated water samples, pooled from three subsamples collected at different depths (0.5, 1.0, and 1.5 m), were taken with a 5-L water sampler (made by plexiglass) at each site; a 5-L subsample was brought back to the laboratory. There, total nitrogen (TN) was determined using an alkaline potassium persulfate digestion-UV spectrophotometric method, and total phosphorus (TP) was determined following the ammonium molybdate spectrophotometric method after digestion with K2S2O8 solution according to the Chinese Standard Methods for Monitoring Lake Eutrophication [32]. Chlorophyll a was measured using a 90% acetone/water (volume/volume) solution extraction, followed by spectrophotometry, and calculated without correcting for pheophytin interference [33]. Total suspended solid (TSS) samples were prepared by filtering 0.5–2 L lake water through preweighed GF/C filters, which were then dried at 60 °C.

2.2. Data Analysis

An index of relative importance (IRI) [34,35] was used to estimate the contribution of each fish species to the total catch. Potential collinearity among predictors (e.g., Chla, TP, TN, SD, lake size, average depth) was checked using the variance inflation factor (VIF < 5). Thereafter, multiple regressions were performed to identify the significant explanatory variables in fish compositional data (e.g., NPUE, BPUE, richness, average fish size, proportion of each fish trophic group) with a generalized linear model (GLM). Akaike Information Criterion (AIC) was used to select the best model. Finally, the most powerful predictor in explaining fish compositional patterns in our study lakes was chosen for further analysis.
For relationships between different trophic groups of fish and environmental variables, fish were categorized into zooplanktivores, omnivores (omniplanktivores and omnibenthivores), and piscivores. Linear regression was used to analyze the relationships between fish species richness, total catch per unit effort (NPUE and BPUE), mean fish size (BPUE/NPUE), NPUE of small- (TL < 15 cm) and large-sized (TL > 15 cm) fish, NPUE and BPUE of the dominant species, and their own best explanatory variables. The data were log10x transformed to meet the requirements of normal distribution and homogeneity of variance. Data used for the analysis of correlations, such as TP, Chla, and SD, were the average of three sampling sites in each lake. All analyses were performed in the R4.0.3 statistical software [36] using both “raster” [37] and “usdm” [38] packages.

3. Results

3.1. Physicochemical Parameters of the Studied Lakes

The study lakes were, overall, shallow and turbid (Table 1), having a mean depth of 4.2 m (1.5–7.1 m) and an average Secchi depth of 0.8 m (0.1–2 m). Total nitrogen and TP varied markedly, averaging 1.2 mg N L−1 and 89 µg P L−1 (Table 1). The concentration of Chla ranged between 4.4 and 84 µg L−1 (mean: 32 µg L−1; Table 1).

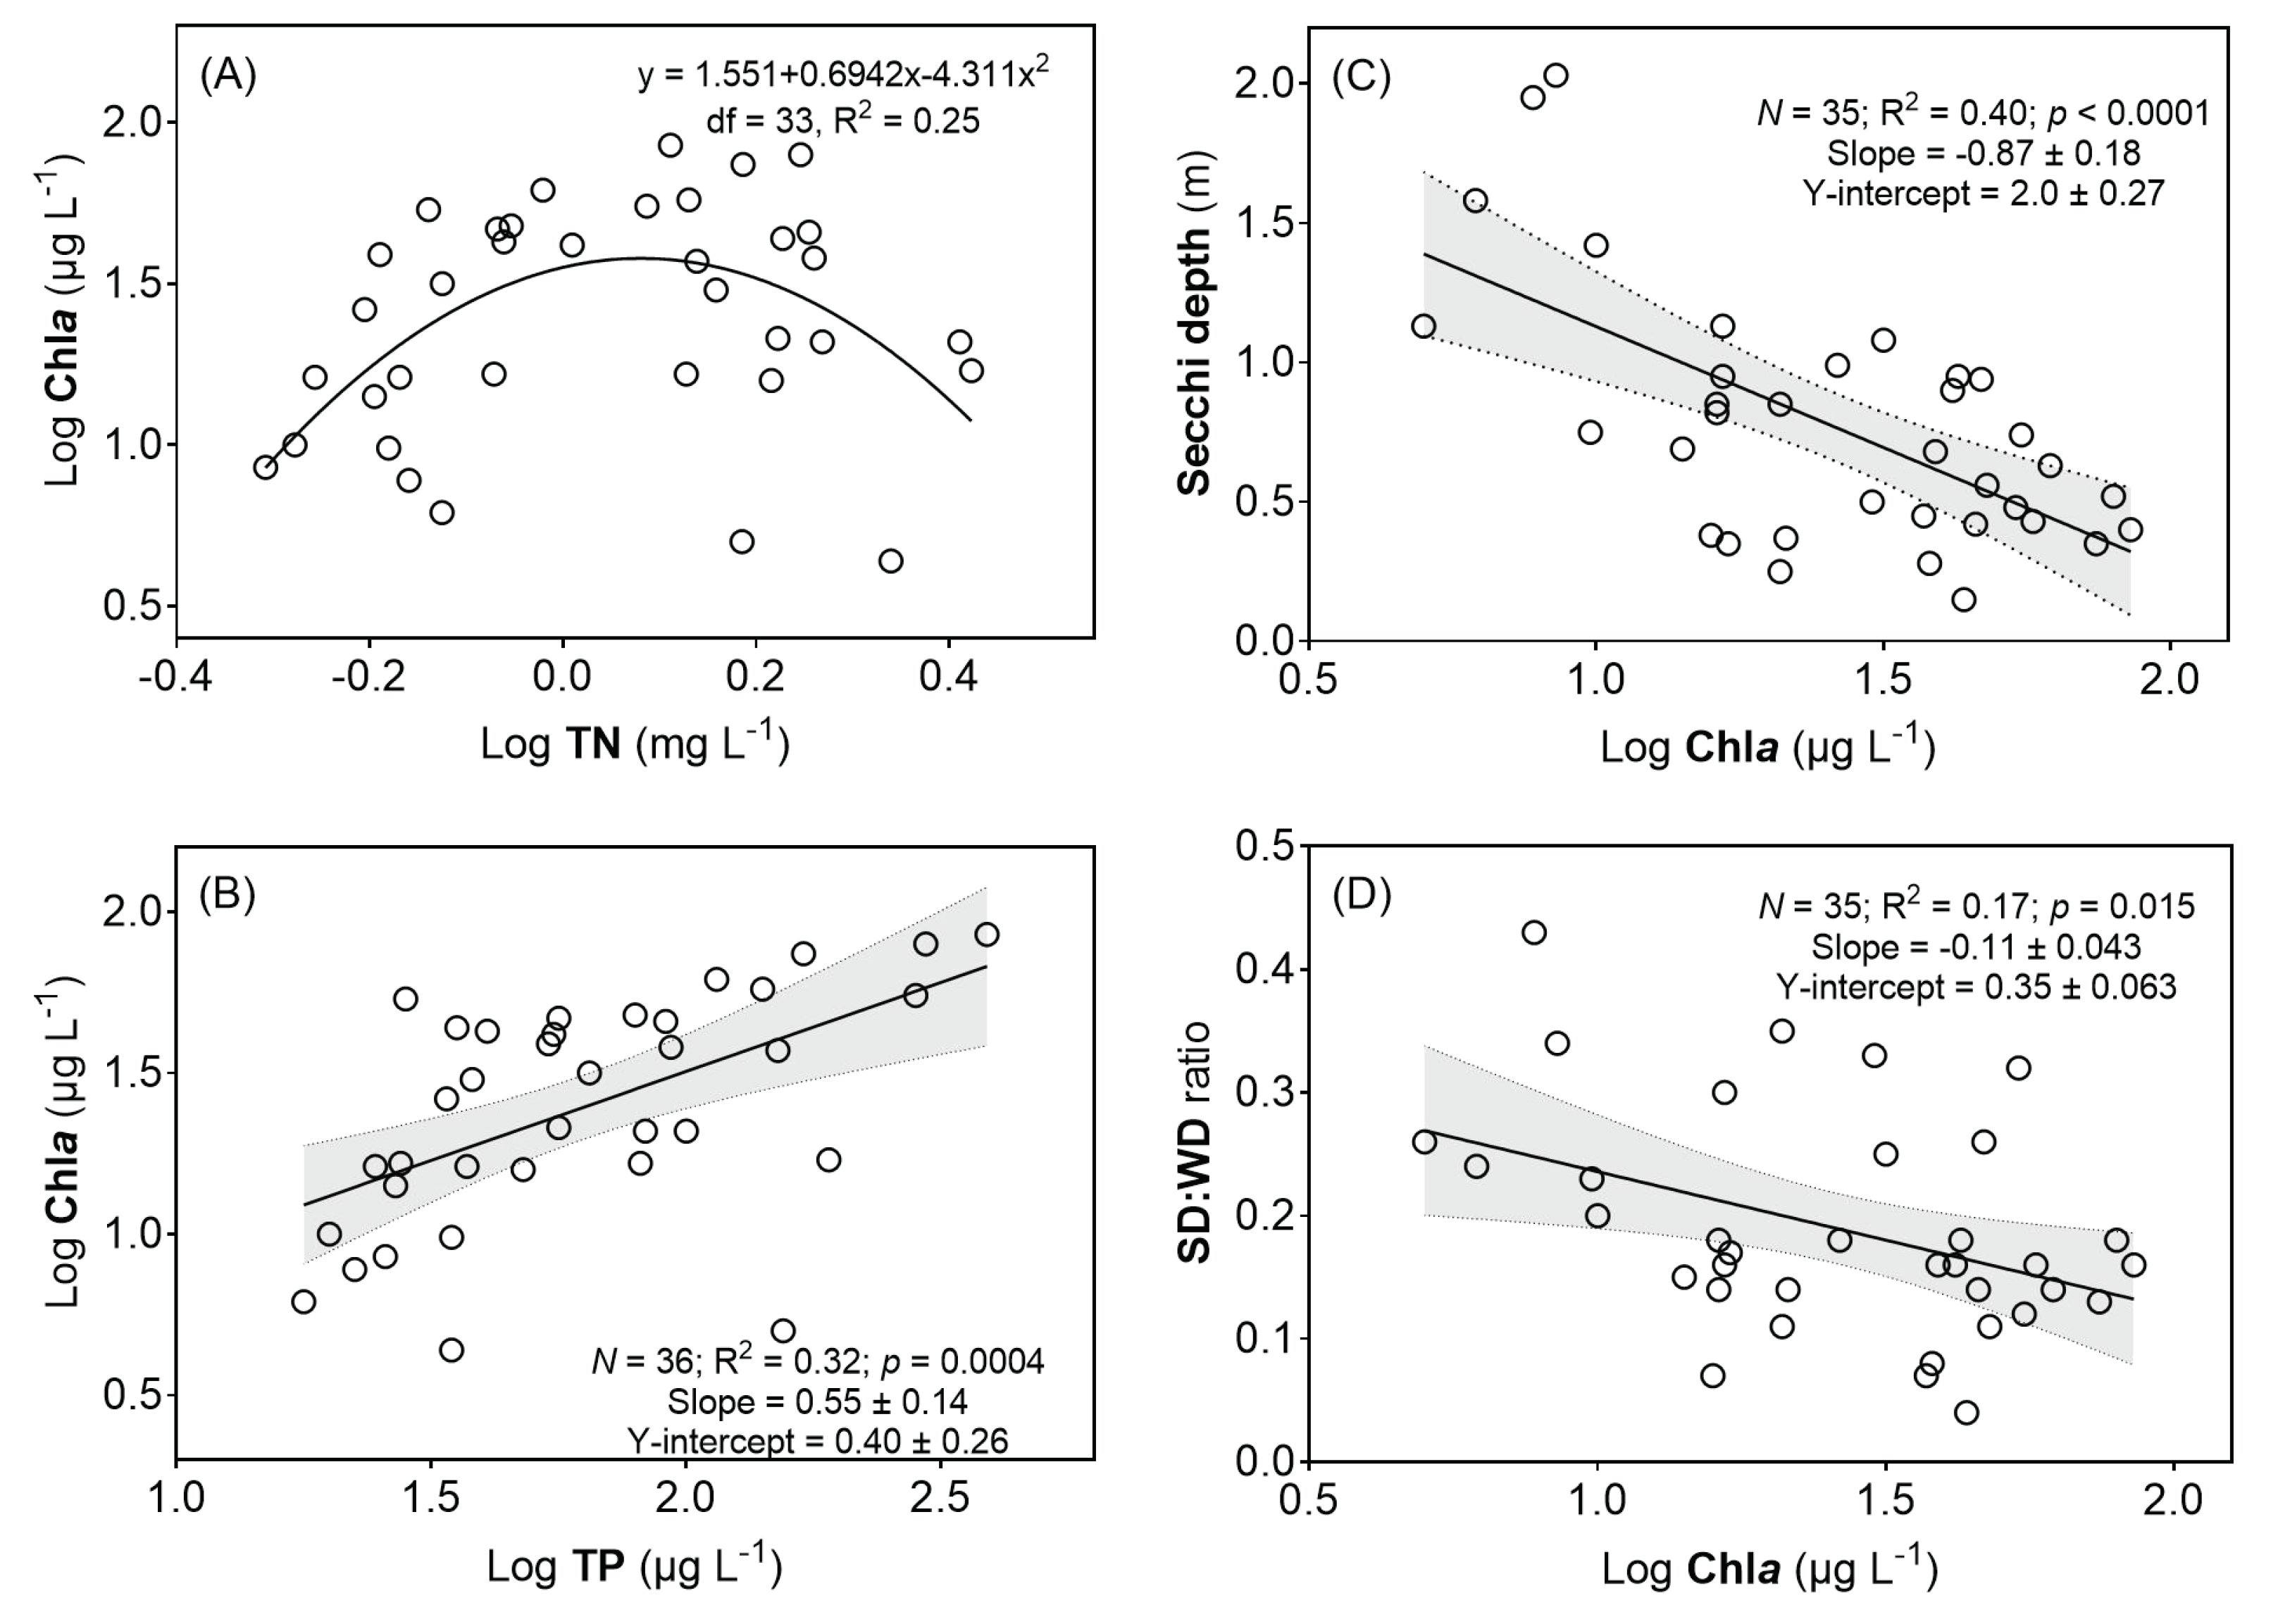
3.2. Relationships between Chla and Lake Nutrients and Transparency and Results of GLM Analysis

The concentration of Chla was quadratically correlated with TN (Figure 2A; R2 = 0.25) and significantly positively linearly related to TP (Figure 2B; p = 0.0004); Secchi depth declined with Chla (Figure 2C; p < 0.0001). Likewise, the ratio of Secchi depth to water depth (SD:WD) declined significantly with Chla (Figure 2D, p = 0.015), with an average of 0.19, ranging from 0.04 to 0.43.
Parameters (e.g., estimate, t-value, p-value) of GLM analysis of the selected environmental variables are given in Table 2. Overall, Chla was the most powerful explanatory variable for most of the fish community traits tested in our study (e.g., fish species richness, NPUE, BPUE, and N% of both zooplanktivores and piscivores; Table 2). Moreover, TP, TN, Secchi depth, and lake size were also important explanatory variables for some fish community traits, e.g., TN for mean fish size and the biomass proportion of both benthivores and piscivores, TP for the biomass proportion of piscivores, lake size for mean fish size, and both NPUE and BPUE of the piscivorous Culter spp. (Table 2 and Table S1).

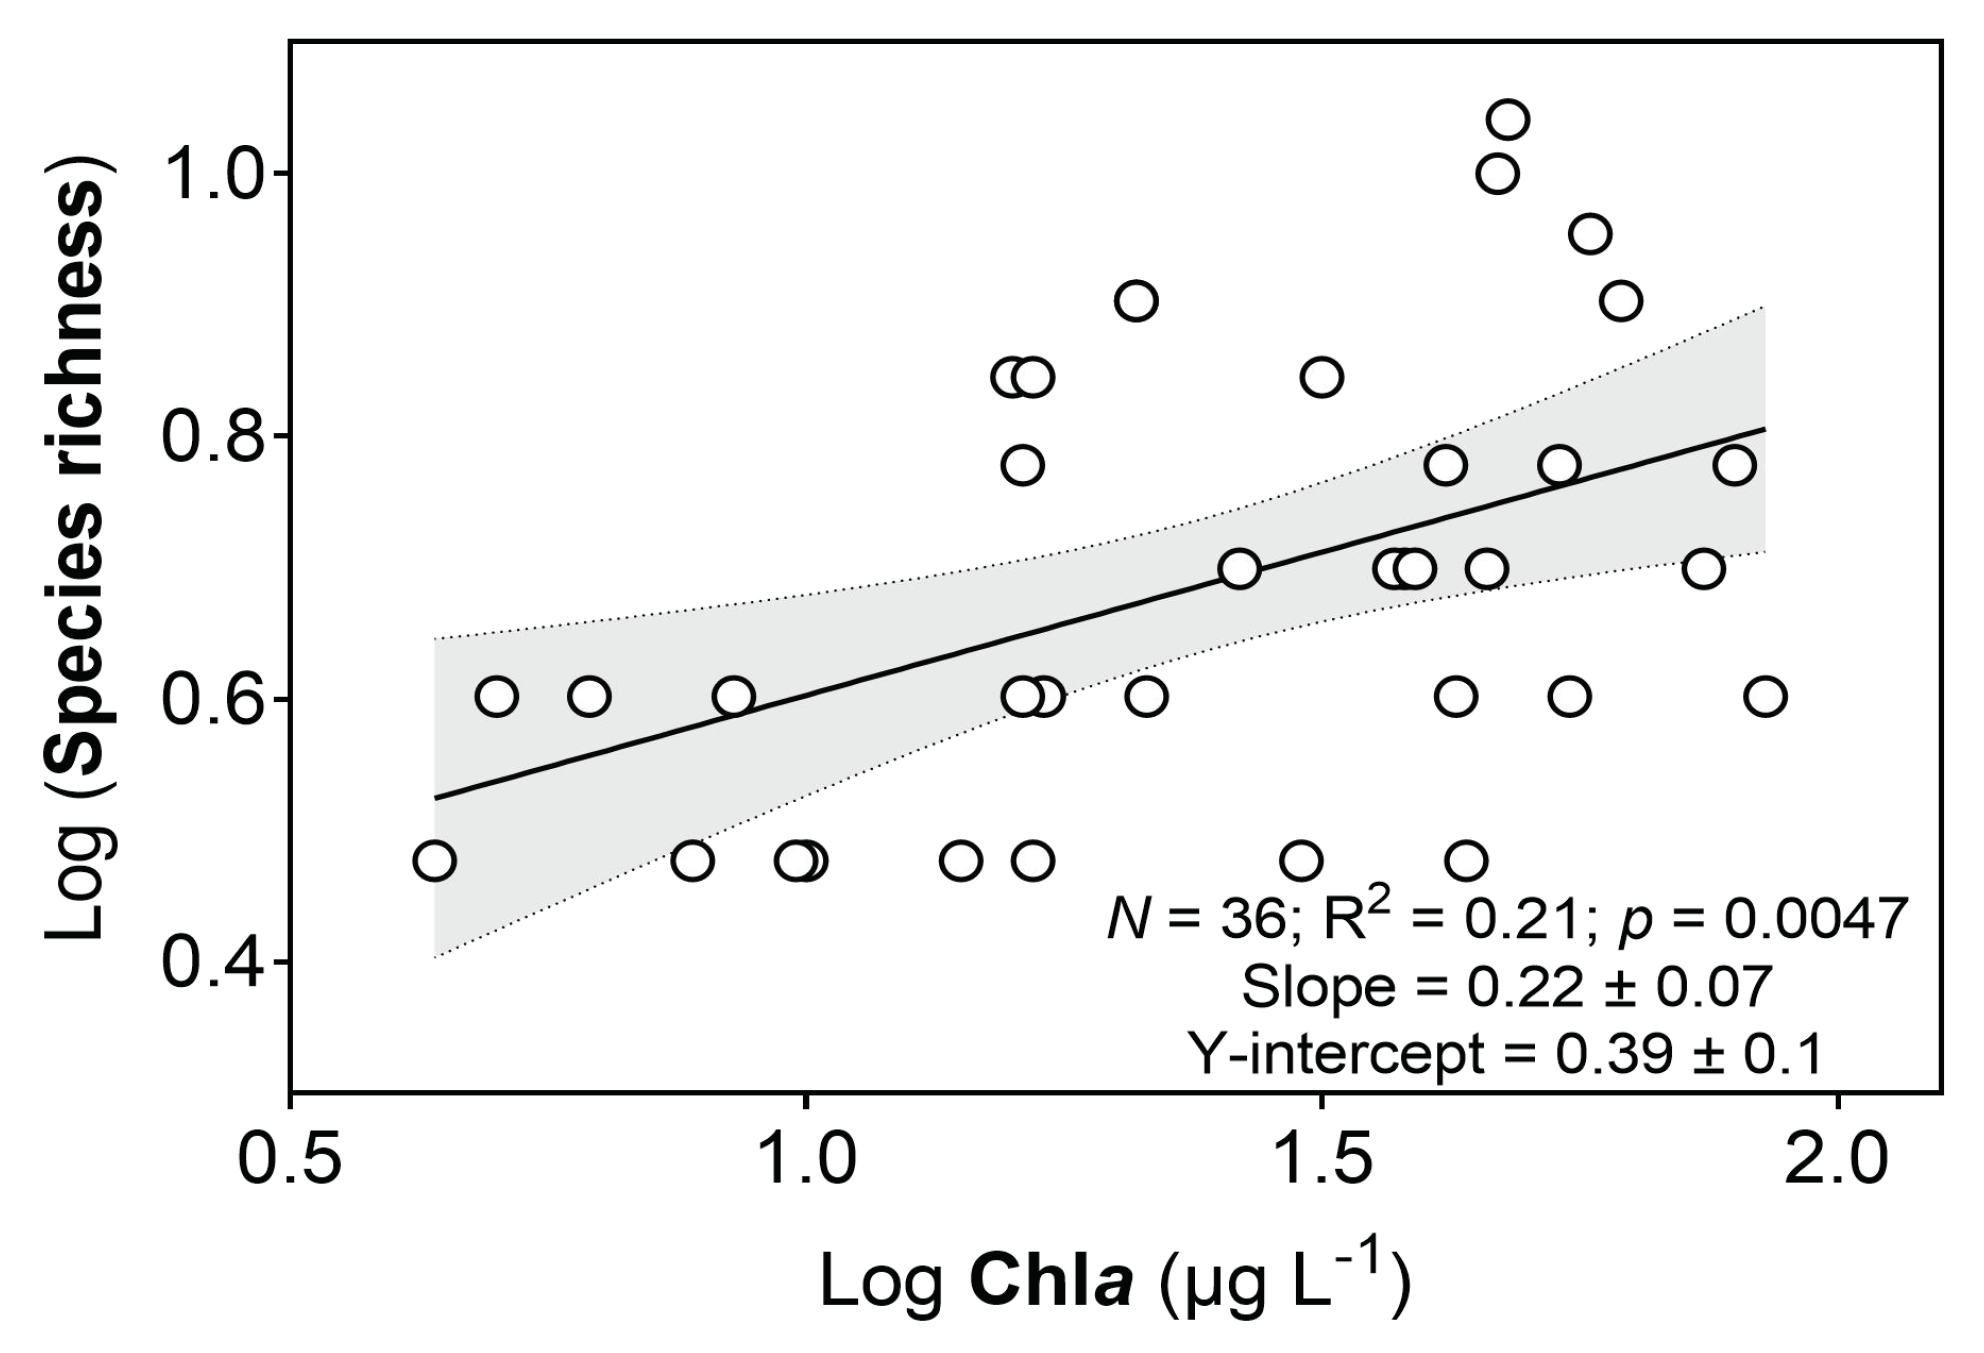
3.3. Fish Species Richness along the Chla Gradient

On average, five species were caught per lake, ranging from three to 13 species. Lake primary productivity (Chla) was the most powerful explanatory variable for fish species richness in our study lakes (Table 2). A significant positive linear relationship was found between species richness and Chla (Figure 3).

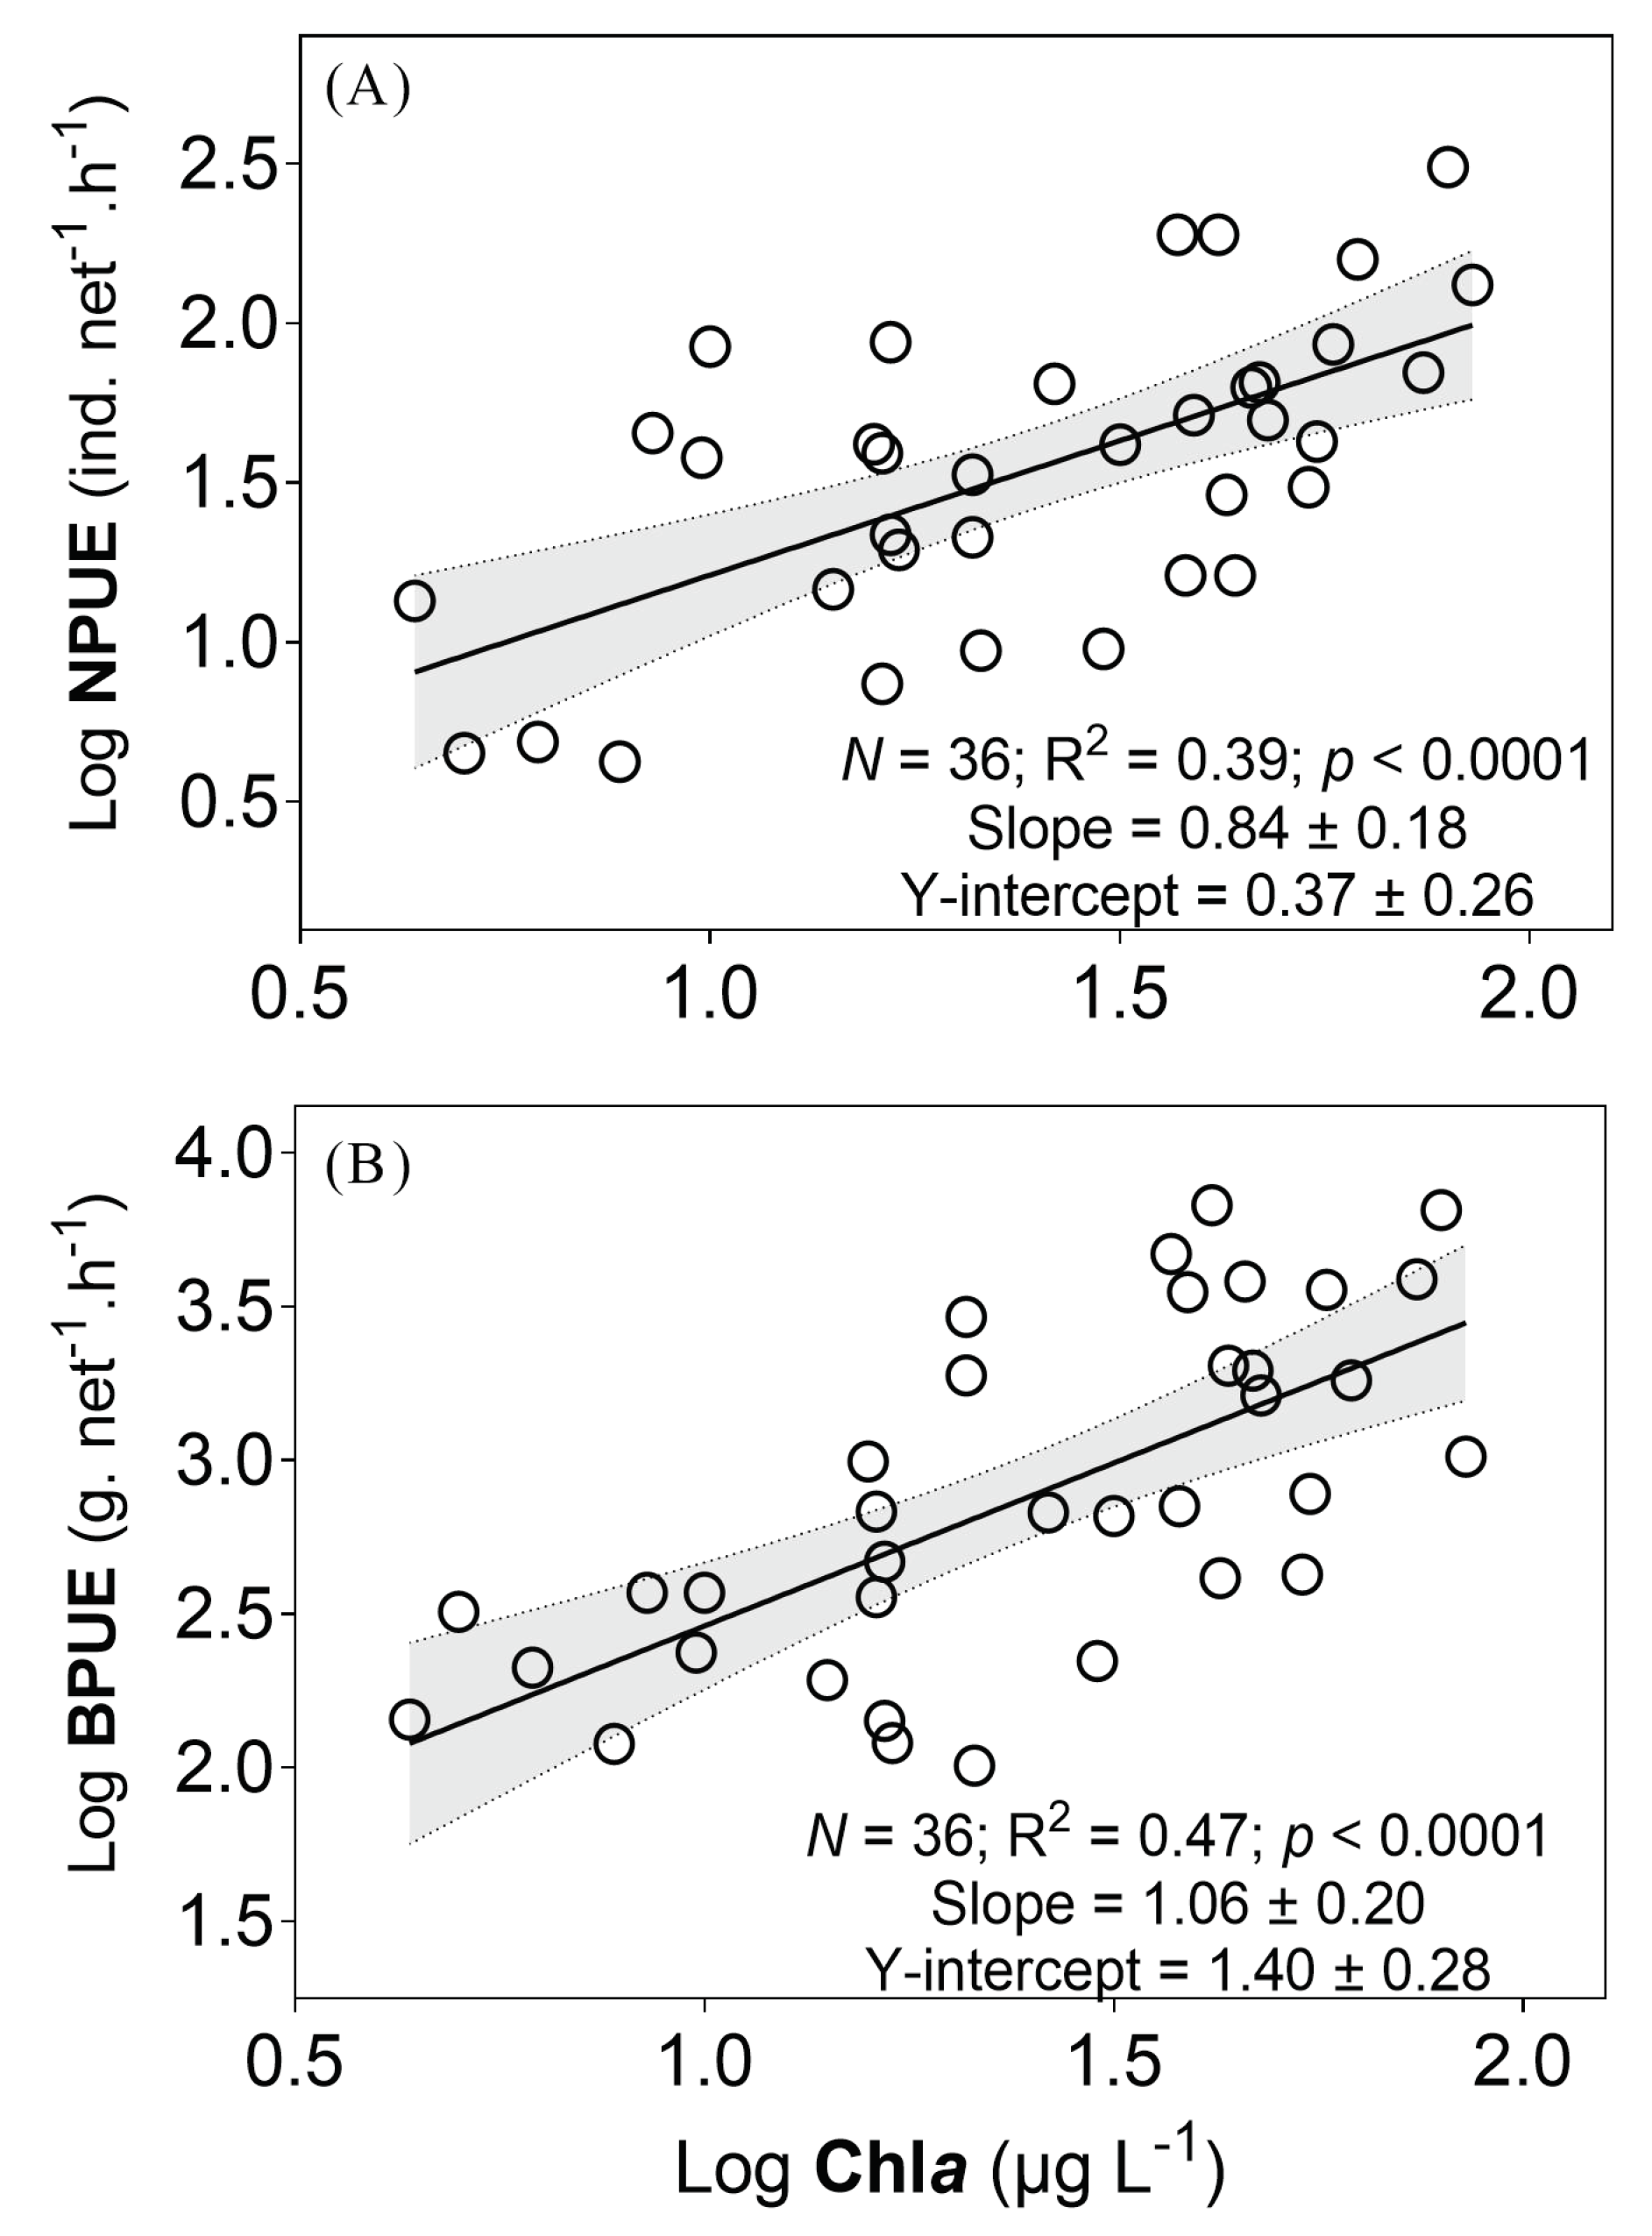
3.4. Relationships of Fish Catch with Lake Productivity

Fish NPUE increased significantly with Chla (Figure 4A; p < 0.0001), varying from 4 to 309 ind. net−1 h−1 (mean = 60 ind. net−1 h−1). BPUE was also higher in lakes with high Chla (Figure 4B; p < 0.0001) and varied from 0.1 to 6.8 kg net−1 h−1 (mean = 1.5 kg net−1 h−1).

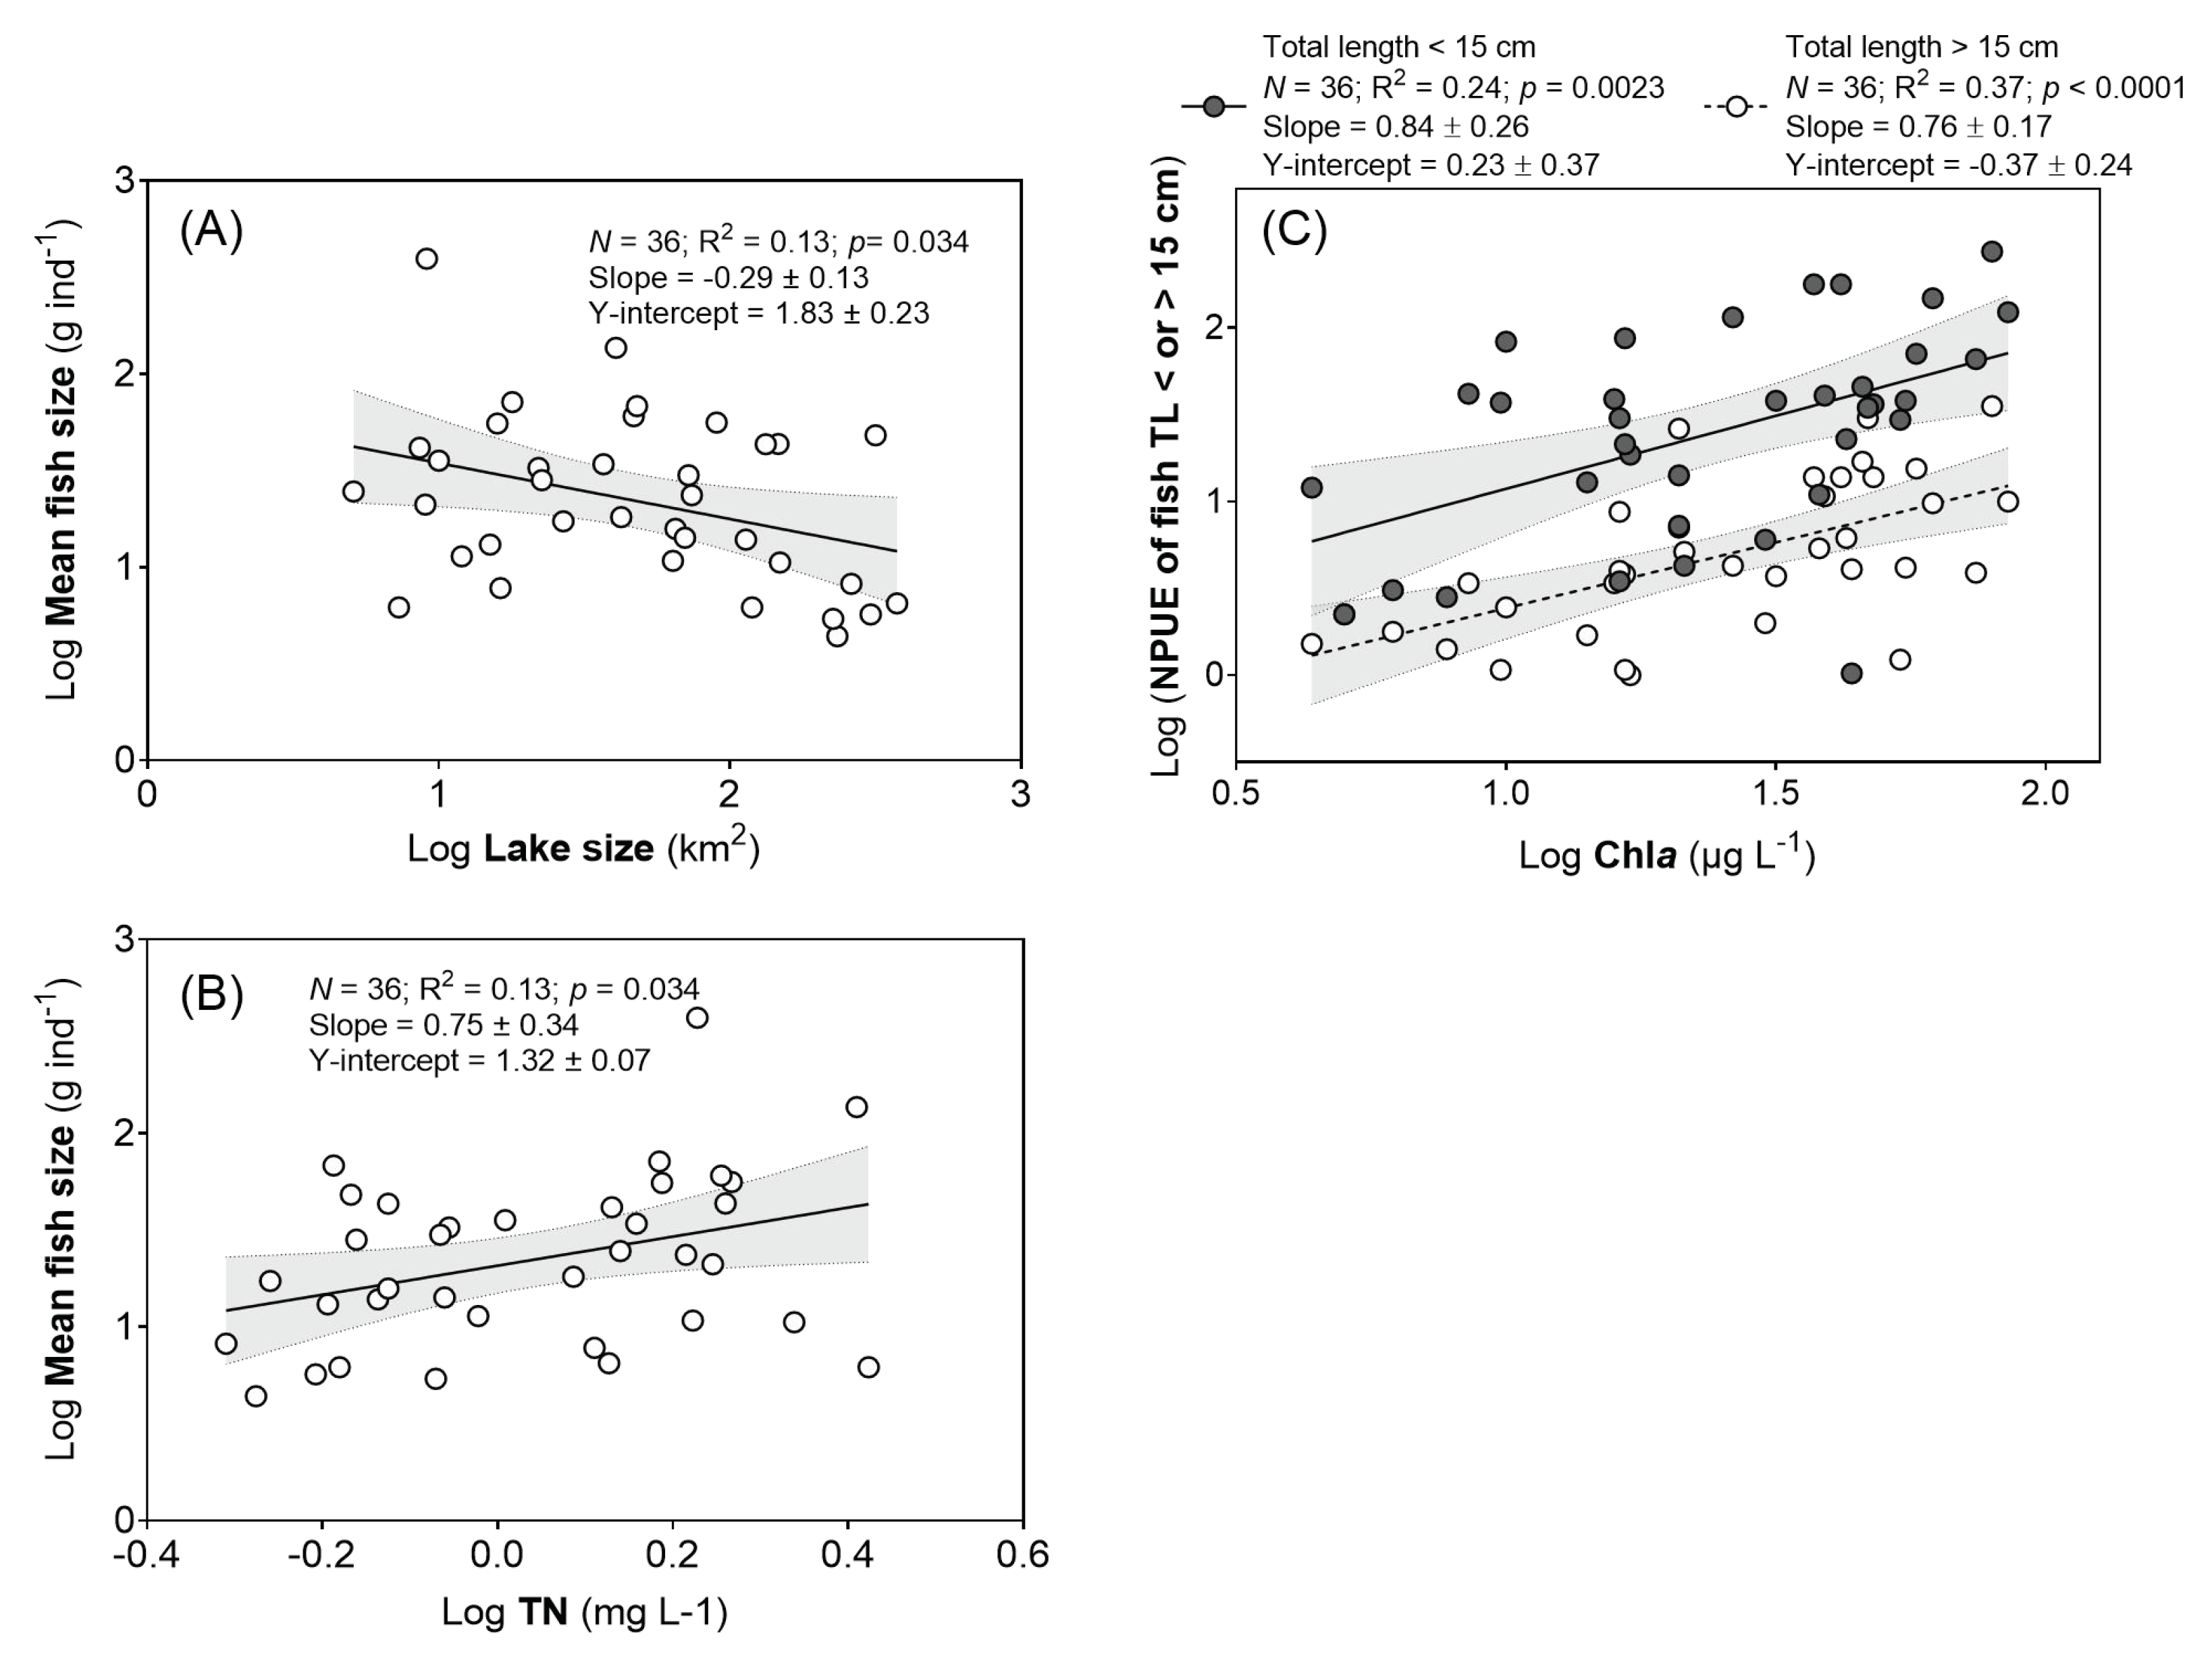
3.5. Fish Size and NPUE of Different Size Classes of Fish

The average body weight of fish (calculated as BPUE/NPUE) was negatively related to lake surface size (Figure 5A; p = 0.034) and positively related to TN (Figure 5B; p = 0.034).
For both size classes of fish (total length <15 and >15 cm), the catch was significantly positively related to Chla (Figure 5C). The average NPUE of smaller-sized fish (TL < 15 cm, 52 ind. net−1 h−1) was almost 7-fold higher than that of fish with TL > 15 cm (7.6 ind. net−1 h−1), the mean percentage of smaller-sized fish being 79% (ranging between 20% and 99.5%).

3.6. Composition of Fish Community Structure and Trophic Groups

In total, 3384 fish were caught, belonging to 20 species, of which 16 came from the Cyprinidae family. The zooplanktivorous T. swinhonis had the highest frequency of occurrence (FO%, 89%), followed by the omniplanktivorous H. leucisculus (78%) and the omnibenthivorous C. carassius (69%) (Table 3). The piscivorous Culter spp. had a relatively high FO% (56%), but its number percentage (N%, 1.2%) and biomass percentage (B%, 3%) were low (Table 3). Zooplanktivorous fish dominated the fish community structure in terms of numbers (65%), and omniplanktivores and omnibenthivores contributed 25% and 8%, respectively, while the piscivores and omniherbivores constituted <2%. In terms of biomass, omniplanktivores (48%) and omnibenthivores (30%) were the most important, while zooplanktivores and omniherbivores constituted 15% and 4%, respectively. The contribution of piscivores was low (3%).
The smaller-sized T. swinhonis was the dominant zooplanktivorous species, constituting 62% of the total fish catch by numbers, while the omniplanktivorous H. leucisculus and omnibenthivorous C. carassius made up 21% and 7%, respectively (Table 3). In terms of biomass, the large-sized H. nobilis and medium-sized C. carassius contributed 36% and 26%, respectively, to the total catch and T. swinhonis 14% (Table 3).
According to the IRI score, the planktivorous T. swinhonis was the most important or abundant fish in the study lakes, followed by the omnibenthivorous C. carassius and the omniplanktivorous H. leucisculus (Table 3). Less abundant fish were the omniplanktivorous H. nobilis, the zooplanktivorous C. nasus, and the piscivorous Culter spp.

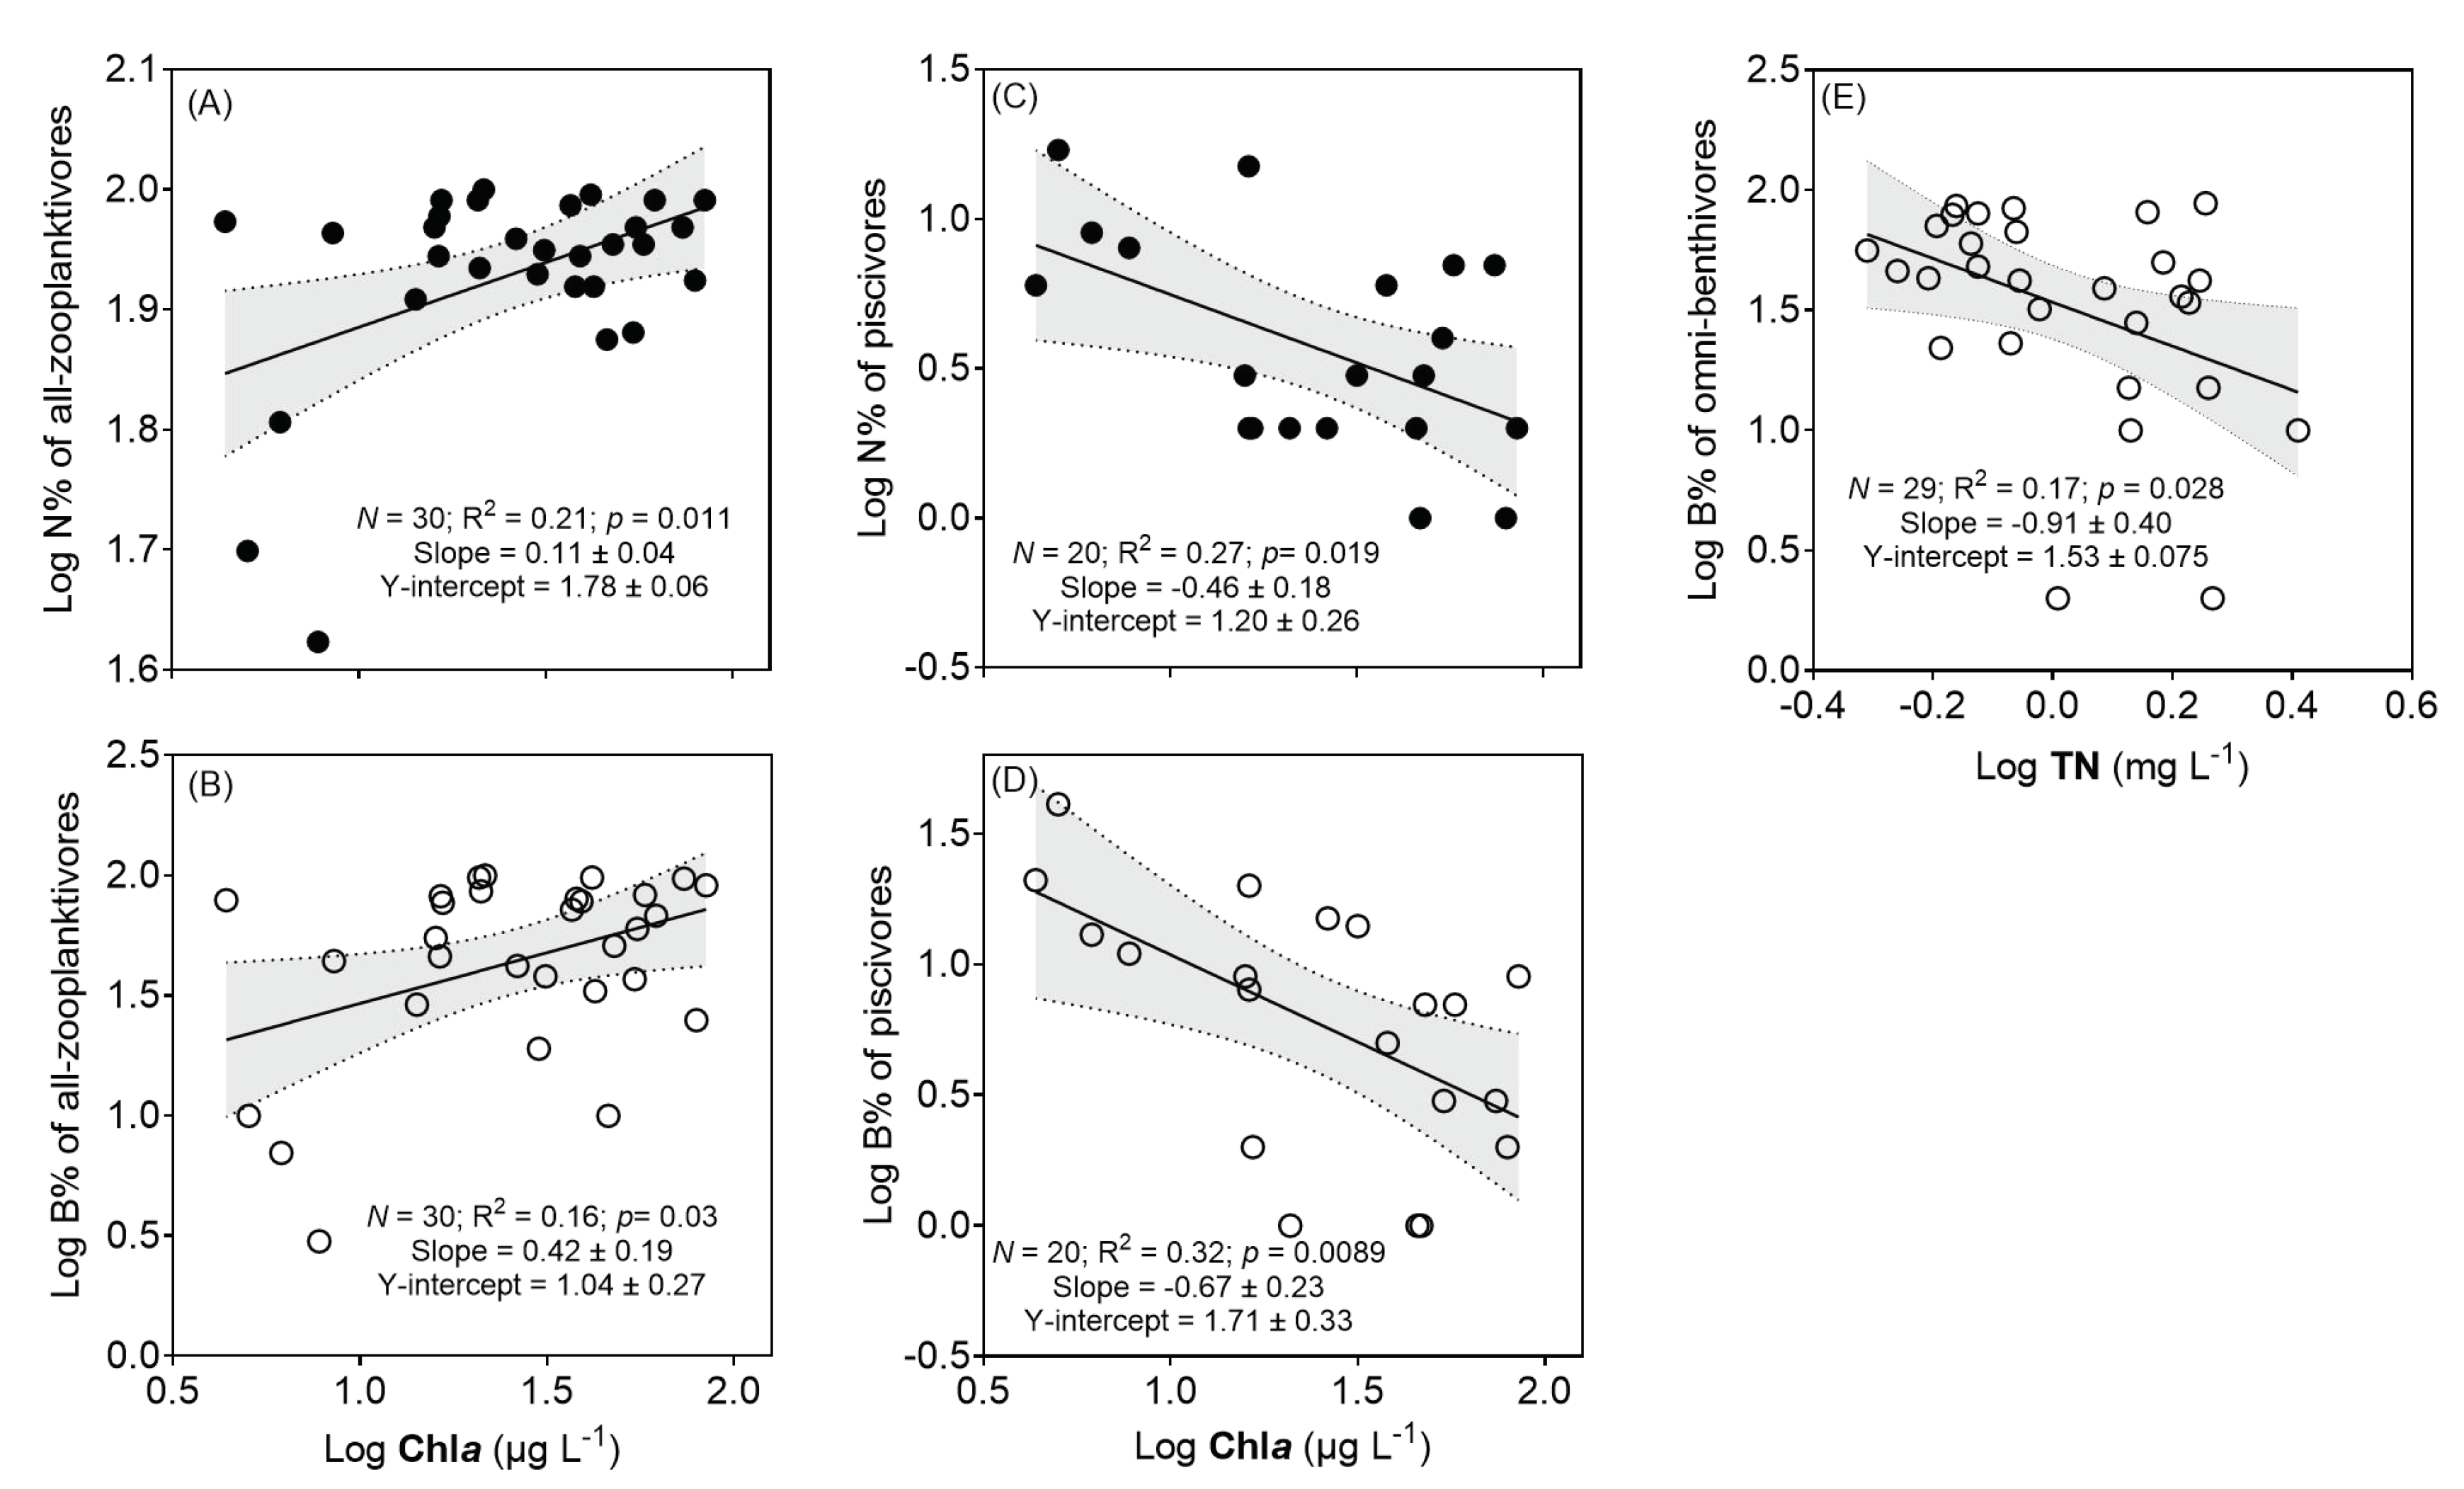
3.7. Correlations of Different Trophic Groups of Fish with Chla and TN

Lake primary productivity (expressed as Chla) was the most powerful predictor for the number (N%) and biomass (B%) proportions of both zooplanktivorous and piscivorous fish, while TN was the best explanatory variable for the B% of omnibenthivorous fish (Table 2).
Both in terms of number and biomass, the percentage of all zooplanktivorous fish increased significantly with Chla (Figure 6A,B). However, the contribution of piscivores decreased pronouncedly with Chla (Figure 6C,D). The B% of omnibenthivores was significantly negatively related to TN (Figure 6E); in contrast, the relationships between N% of omnibenthivores and environmental variables were insignificant.

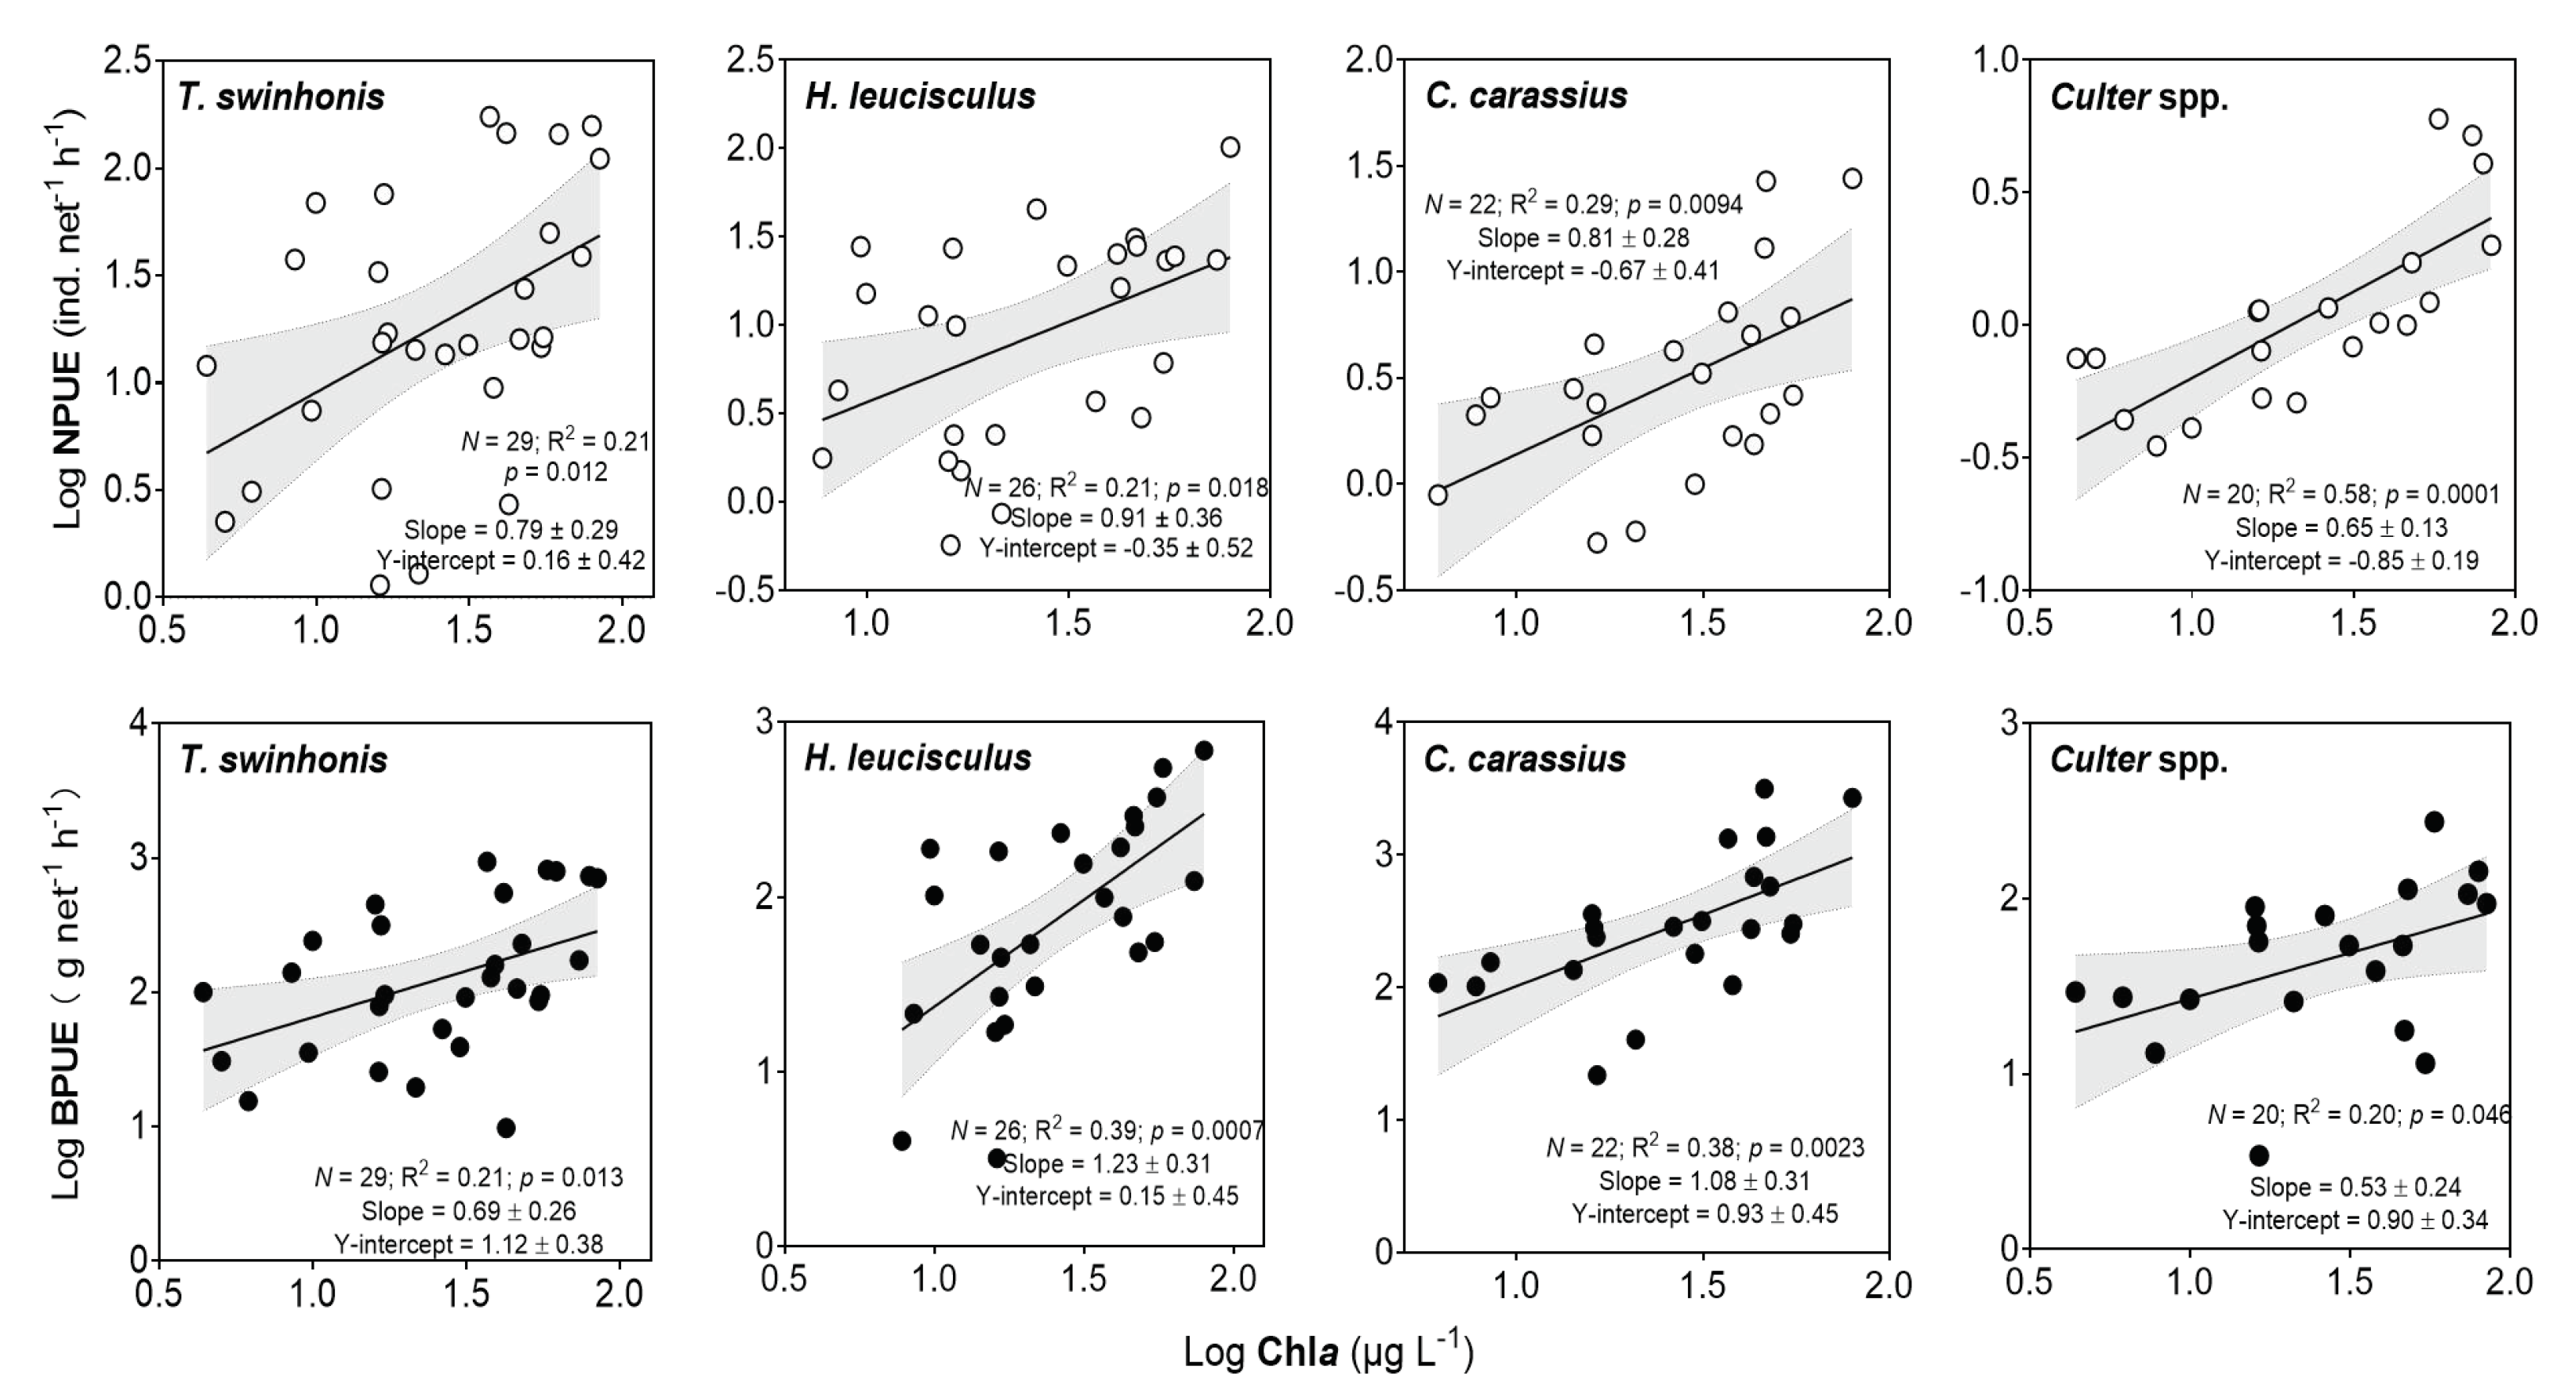
3.8. Relationships between the Catch of Three Dominant Species and Piscivorous Fish and Chla

Chla of phytoplankton was the best explanatory variable for both NPUE and BPUE of three dominant fish species from different trophic groups and the piscivorous Culter spp. (Table 2). Both NPUE and BPUE of T. swinhonis increased markedly with Chla (Figure 7). Similarly, NPUE and BPUE of H. leucisculus demonstrated a significant positive linear correlation with Chla (Figure 7). In addition, both NPUE and BPUE of the omnibenthivorous C. carassius increased markedly with Chla (Figure 7). Contrary to the proportional decline of piscivores with Chla, NPUE and BPUE of Culter spp. increased markedly with Chla (Figure 7).

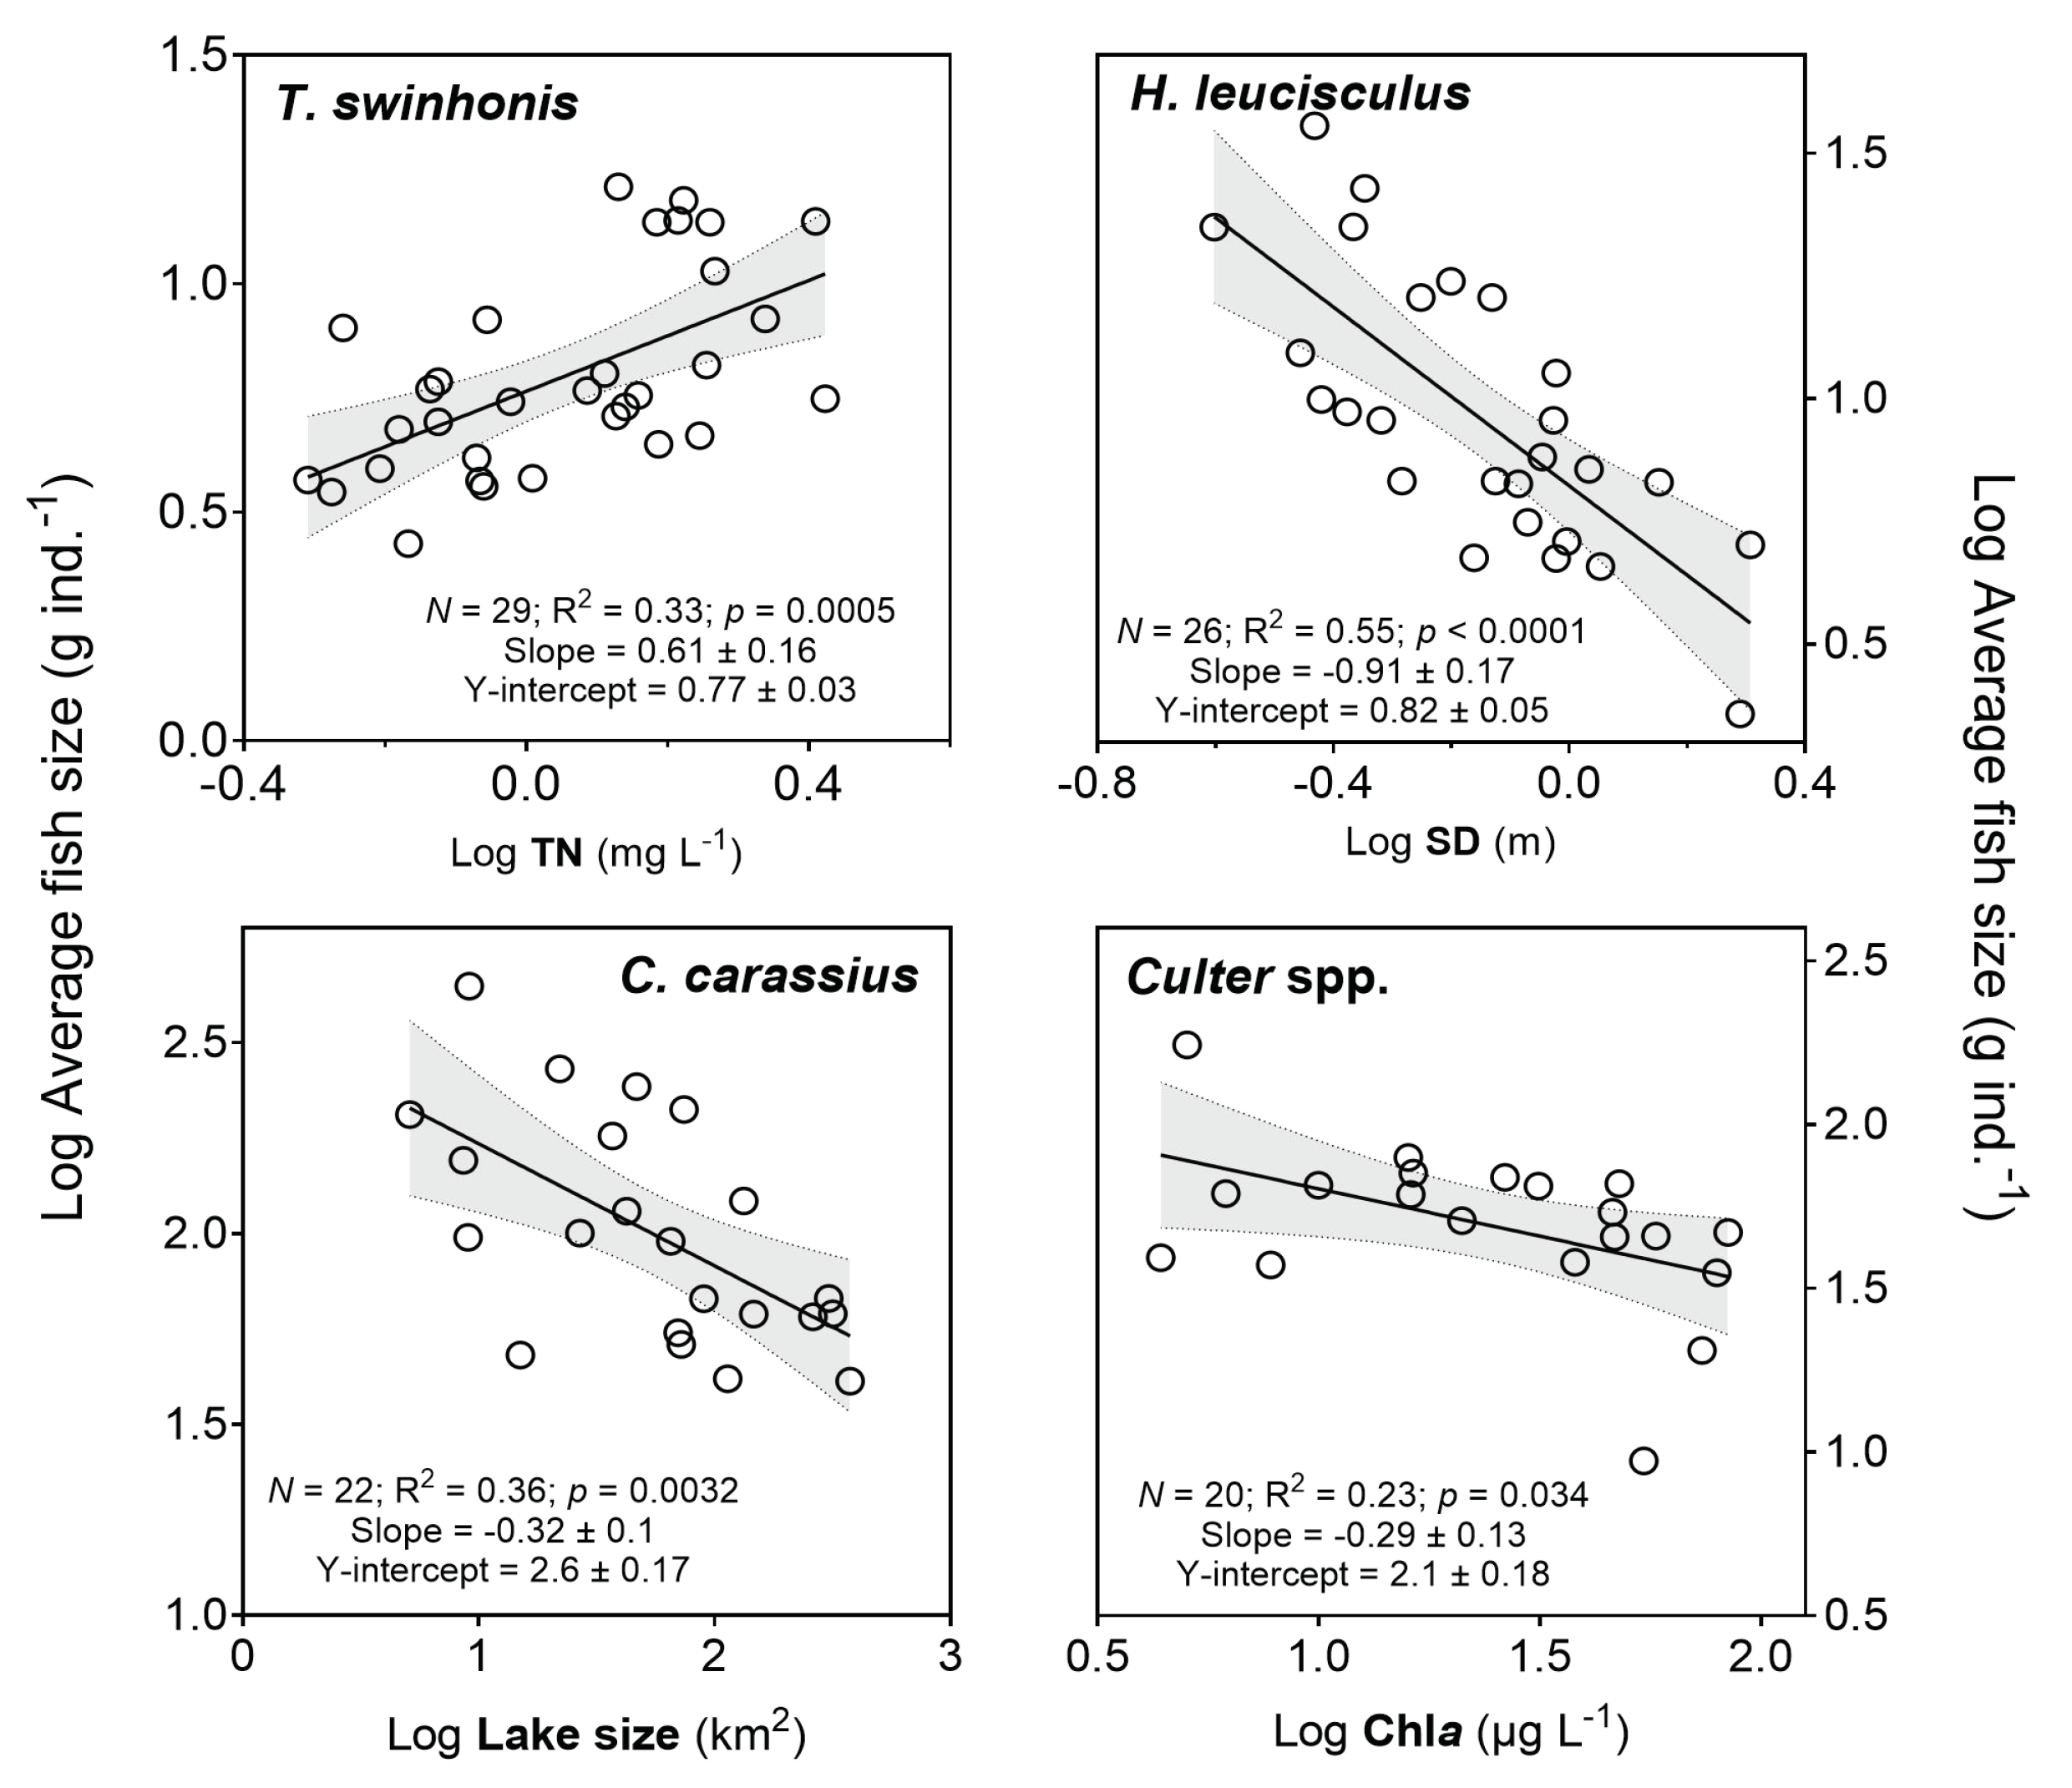
3.9. Relationships between Mean Body Weight of Three Dominant Species and Piscivorous Fish and Environmental Variables

The mean body weight (averaging 7 g ind.−1) of the zooplanktivorous T. swinhonis increased significantly and linearly with TN (Figure 8). By contrast, the average body weight of the omniplanktivorous H. leucisculus showed a markedly negative linear relationship with Secchi depth (Figure 8). However, lake size was the most powerful determinant for crucian carp; thus, the mean size of the omnibenthivorous C. carassius, having a mean body weight of 120 g ind.−1, decreased linearly with lake size (Figure 8). The average body weight of the piscivorous Culter spp., having a mean body weight of 48 g ind.−1, decreased significantly with Chla (Figure 8).

4. Discussion

We found that species richness was significantly linearly related to lake productivity (expressed as Chla), which is in accordance with several studies from the temperate climate zone [7,39,40]. The relationship between species richness and environmental factors has been well studied in Europe [3,7,10,16,41,42]. Our results differ from those of Jeppesen et al. (2000) [3], which showed a unimodal relationship with TP, and those of Helminen et al. (2000) [43], which revealed a reduction in species number in eutrophic Finnish lakes that was attributed to oxygen deficiency. The difference in fish species between the European studies and the present studies may reflect the somewhat smaller Chla gradient of our study lakes. We found that 16 out of 20 species came from the Cyprinidae family, and the increase in species richness along a Chla gradient was mainly attributed to an increasing number of cyprinids, especially omnivorous species. A similar trend has been found in temperate European lakes [7].
Fish species richness is reported to increase markedly with lake area [10,16,39,40,44,45], but we found no such relationship, confirming an earlier study of 109 Chinese lakes [46]. Most of our study lakes were shallow and eutrophic, which may have resulted in reduced habitat availability [47], weakening the effect of lake area on fish species richness. Moreover, our data were collected offshore only, and most fish species are typically found in the littoral zone of lakes, even in very large lakes [48]. Accordingly, in a study of 56 Danish lakes, Menezes et al. (2013) [42] found that lake area was a poor predictor of fish species richness in offshore samples, while it emerged as the best predictor for littoral samples.
As expected, both NPUE and BPUE increased markedly with lake productivity, as also recorded for European lakes [7,10,16,43,49], Florida lakes [22,44], Argentinian lakes and reservoirs [50], and Canadian lakes [51]. When divided into species, both NPUE and BPUE of the three most dominant species increased markedly with productivity; for instance, the average NPUE of the most abundant species, T. swinhonis, was 61 ind. net−1 h−1 in high productive lakes (Chla > 40 µg L−1), which was 2.5-fold higher than at lower Chla. A similar trend was found for H. leucisculus and C. carassius, for which average BPUE was 3.1- and 3.5-fold higher, respectively, than in lakes with Chla < 40 µg L−1. The contribution of the three most dominant species, all from the Cyprinidae family, to the total fish catch of the 36 lakes averaged 90% in abundance and 47% in biomass, respectively. Our results from shallow subtropical lakes show that lake eutrophication results in cyprinid species dominance, as previously seen in temperate lakes [7,27,52].
The mean body weight (BPUE/NPUE) of fish has been reported to decline with lake eutrophication [10]. However, we found that the mean fish size of the total catch increased significantly with TN despite the overall dominance of small-sized species in our study lakes, as previously observed in other subtropical lakes [20,28]. In our study lakes, the NPUE increase of large-sized fish (TL > 15 cm) with Chla resulted in a larger mean fish size in the high-TN lakes.
We found a dominance of zooplanktivorous and omnivorous species in high productive lakes, which is in accordance with former studies [8,27,52]. In our study, the zooplanktivorous Sijiao was the most dominant species, followed by the omnibenthivorous crucian carp and the omniplanktivorous sharpbelly, all being highly linearly related to Chla. The dominance of these species may, in part, reflect an increase in the biomass of zooplankton with the increasing Chla/eutrophication, as seen in both shallow subtropical lakes [12,53] and mesocosm experiments in this climate region [54]. Sijiao feed mainly on zooplankton, especially cyclopoid copepods [55], and although sharpbelly is a typical omniplanktivorous fish, they feed substantially on zooplankton in eutrophic lakes [56]. Thus, a higher biomass of zooplankton in eutrophic lakes [4] may facilitate the population growth of both Sijiao and sharpbelly. A notable difference from the studies of north temperate lakes was that the proportion of omnibenthivorous fish was overall high and did not differ along the lake productivity gradient, as otherwise seen in lakes in both northern Europe [27] and the USA [57]. High dominance of omnivores is, however, to be expected in warm lakes [26,57]. In our study, crucian carp was the dominant omnivorous species and constituted about 90% of the total omnivore CPUE in the 36 lakes, both in terms of abundance and biomass. They can use macrophytes as a food resource [55,58,59] in clear water lakes and detritus in turbid lakes [59], in addition to feeding on benthic animals such as oligochaetes and chironomids [60,61]. In a study of a restored subtropical lake, sharpbelly and crucian carp utilized plant material rather effectively [55], and they were also the most abundant (IRI) fish species in Poyang Lake [25], which receives a large seasonal input of plant detritus. Higher abundance and biomass of benthic macroinvertebrates in more productive (high TP and Chla contents) lakes [13,14,15] may have further favored omnibenthivorous fishes such as crucian carp.
The low proportions of piscivorous fish may have contributed to the dominance of smaller-sized fishes in our study lakes. It is widely accepted that predation pressure by piscivorous fish is weak in warm lakes [28]. In a study of a shallow restored subtropical lake, the piscivorous mandarin and snakehead fed mainly on shrimps rather than fish [55], even though the abundance of fish was relatively high. Furthermore, piscivorous fish were reported to have only weak control of the abundance of their prey fish in a subtropical enclosure experiment [62]. Culter spp. was the only piscivorous fish caught in our study lakes, and although both NPUE and BPUE of the fish correlated positively with productivity, their proportion of the catch showed a significant negative relationship with Chla. The mean body weight of Culter was less than 50 g ind.−1 (mean TL = 18.7 cm), indicating that they were not efficient fish predators. Supporting this view, Li et al. (2011) [63] only found fish in the diet of Culter when the standard length exceeded 20 cm. Smaller-sized Culter fed mainly on zooplankton [63,64]; thus, the higher zooplankton availability in more productive lakes [12,53] may also support the development of small sizes of the piscivorous Culter. Accordingly, in our study lakes, both the enhanced food availability and the absence of or weak predation pressure by piscivorous fish at high Chla likely contributed importantly to the dominance of small fish such as Sijiao, sharpbelly, and crucian carp.
A number of studies have documented that the proportions of zooplanktivores and omnivores were positively related to nutrients, whereas the percentage of piscivores decreased markedly with lake productivity [24,27,65]. For our subtropical lakes, we also found that the proportion of all zooplanktivores (zooplanktivores + omniplanktivores) increased significantly with lake productivity, while the proportion of piscivorous fish decreased. The strong correlations of the smaller-sized zooplanktivorous Sijiao and the omniplanktivorous sharpbelly with lake productivity contributed mainly to these general zooplanktivore relationships. The lower proportion of piscivores in more productive lakes may, in part, be due to low water transparency as most piscivores are a visual foraging species, for example, perch [66], pike [67], and mandarin fish [68]. However, prey consumption of planktivorous fish is typically less affected by turbidity [11], making elevated turbidity advantageous for planktivorous fish at reduced predation by piscivores. Moreover, strong food competition for zooplankton between juvenile piscivores and zooplanktivores, which dominated the catches in our study, may contribute to the decline in piscivores [49,69].
Multimesh gillnets have been widely used to investigate lake fish community structure, and the European standard (CEN, 2005) has been applied in many studies [10,70,71,72]. In China, there is no similar standard. In our study, we used fewer mesh sizes (8 vs. 14) and a smaller mesh size range (5–40 vs. 6.5–75 mm (Lundgreen net type) and 5.5–55 mm (CEN standard)), so the smallest and largest fish were not efficiently captured. However, our gillnets caught fish within a large individual size range of 6–63.5 cm in total length and 1.2–2657 g in wet weight; NPUE and BPUE ranges were 4–309 ind. net−1 h−1 and 0.1–6.8 kg net−1 h−1, respectively. Thus, we believe that our gillnets gave a representative picture of the pelagic fish species community. Another limitation in our study is the limited number of nets used, which gives rise to some uncertainty but still allowed us to identify strong relationships with eutrophication, likely reflecting the large nutrient gradient selected.
A potential caveat in our study is fish stocking, for which there is a long tradition in Chinese freshwaters. Unfortunately, we do not have stocking data for our study lakes. Usually, in China, silver carp, bighead carp, common carp, and grass carp are the dominant cultured species because of their fast growth rate and bigger sizes [73]. However, both the occurrence and proportion of these four species were relatively low in our catches (Table 2). Thus, the FO% of bighead carp, silver carp, and common carp were 28%, 11%, and 6% and their percent abundance (N%) 1.3%, 0.6%, and 0.05%, respectively. We, therefore, assumed a low effect of stocking on our results.

5. Conclusions

We found that fish catches increased significantly with lake productivity and that a high abundance, biomass, and proportion of zooplanktivorous fish, as judged from other studies, e.g., [1,2,3,4], lead to high predation pressure on zooplankton, with consequent negative impacts on lake ecosystems through cascading effects. The small-sized zooplanktivorous Sijiao and the omniplanktivorous sharpbelly were the most dominant species in our study lakes, and this may be so in other subtropical lakes along the Yangtze River. In the management and restoration of shallow subtropical lakes, the focus has mainly on larger fish species, but our results also show that small fish, occurring in high abundance, should be considered for the purpose of restoration. Therefore, more attention should be paid to the population dynamics of these species in future investigations.

Supplementary Materials

The following are available online at https://www.mdpi.com/2073-4441/13/6/858/s1, Table S1: Results of the multiple regressions using generalized linear model (GLM) to select the significant explanatory environmental variables for fish compositional data. Environmental variables: chlorophyll a concentration in phytoplankton (Chla, μg L−1), mean depth (m), total nitrogen in the water (TN, mg L−1), lake surface size (km2), Secchi depth (SD, m) and total phosphorus in the water (TP (μg L−1). Fish community traits: NPUE, number per unit effort (ind. net−1 h−1); BPUE, biomass per unit effort (kg net−1 h−1); mean fish size (BPUE/NPUE, g ind.−1); TL, total length; N%, percentage in number; B%, percentage in biomass; Sijiao, Toxabramis swinhonis; sharpbelly, Hemiculter leucisculus; crucian carp, Carassius carassius..

Author Contributions

Conceptualization, J.Y. and Z.L.; methodology, W.Z., Y.Z., and J.Y.; formal analysis, H.H. and J.Y.; investigation, L.K., Y.Z., F.C., M.Z., H.H., and J.Y.; writing—original draft preparation, J.Y.; writing—review and editing, J.Y., Z.L., M.Z., E.J., and H.H.; visualization, J.Y., H.H., and M.Z.; supervision, Z.L. and E.J.; project administration, Z.L., X.Y., and J.Y.; funding acquisition, J.Y., Z.L., and X.Y. All authors have read and agreed to the published version of the manuscript.

Funding

This research was funded by the National Natural Science Foundation of China (41877415, 41530753) and the NIGLAS 135 Project (NIGLAS2018GH03). E.J. was supported by the Centre for Water Technology (watec.au.dk, accessed on 23 January 2021), Aarhus University, and ANAEE, Denmark (www.anaee.dk, accessed on 23 January 2021).

Acknowledgments

We thank Qianhong Wang, Chengrong Bai, Qinghui Zhang, Xiumei Zhang, and Lijun Zhou for field and laboratory support and Anne Mette Poulsen for language assistance.

Conflicts of Interest

The authors declare no conflict of interest.

References

  1. Brooks, J.L.; Dodson, S.I. Predation, body size, and composition of plankton. Science 1965, 150, 28–35. [Google Scholar] [CrossRef]
  2. Lazzaro, X. A review of planktivorous fishes: Their evolution, feeding behaviours, selectivities, and impacts. Hydrobiologia 1987, 146, 97–167. [Google Scholar] [CrossRef]
  3. Jeppesen, E.; Lauridsen, T.L.; Mitchell, S.F.; Christoffersen, K.; Burns, C.W. Trophic structure in the pelagial of 25 shallow New Zealand lakes: Changes along nutrient and fish gradients. J. Plankton Res. 2000, 22, 951–968. [Google Scholar] [CrossRef] [Green Version]
  4. Jeppesen, E.; Søndergaard, M.; Lauridsen, T.L.; Davidson, T.A.; Liu, Z.; Mazzeo, N.; Trochine, C.; Özkan, K.; Jensen, H.S.; Trolle, D.; et al. Biomanipulation as a restoration tool to combat eutrophication: Recent advances and future challenges. Adv. Ecol. Res. 2012, 47, 411–488. [Google Scholar] [CrossRef]
  5. Meijer, M.-L.; De Haan, M.W.; Breukelaar, A.W.; Buiteveld, H.; Donk, E. Is reduction of the benthivorous fish an important cause of high transparency following biomanipulation in shallow lakes? Hydrobiologia 1990, 200, 303–315. [Google Scholar] [CrossRef]
  6. Persson, L.; Andersson, G.; Hamrin, S.F.; Johansson, L. Predator regulation and primary production along the productivity gradient of temperate lake ecosystems. In Complex Interactions in Lake Communities; Carpenter, S.R., Ed.; Springer: New York, NY, USA, 1988; pp. 45–65. ISBN 978-1-4612-8372-0. [Google Scholar]
  7. Olin, M.; Rask, M.; Ruuhljärvi, J.; Kurkilahti, M.; Ala-Opas, P.; Ylönen, O. Fish community structure in mesotrophic and eutrophic lakes of southern Finland: The relative abundances of percids and cyprinids along a trophic gradient. J. Fish Biol. 2002, 60, 593–612. [Google Scholar] [CrossRef]
  8. Mehner, T.; Diekmann, M.; Brämick, U.; Lemcke, R. Composition of fish communities in German lakes as related to lake morphology, trophic state, shore structure and human-use intensity. Freshw. Biol. 2005, 50, 70–85. [Google Scholar] [CrossRef]
  9. Jeppesen, E.; Søndergaard, M.; Jensen, J.P.; Havens, K.E.; Anneville, O.; Carvalho, L.; Coveney, M.F.; Deneke, R.; Dokulil, M.T.; Foy, B.; et al. Lake responses to reduced nutrient loading—an analysis of contemporary long-term data from 35 case studies. Freshw. Biol. 2005, 50, 1747–1771. [Google Scholar] [CrossRef]
  10. Brucet, S.; Pédron, S.; Mehner, T.; Lauridsen, T.L.; Argillier, C.; Winfield, I.J.; Volta, P.; Emmrich, M.; Hesthagen, T.; Holmgren, K.; et al. Fish diversity in European lakes: Geographical factors dominate over anthropogenic pressures. Freshw. Biol. 2013, 58, 1779–1793. [Google Scholar] [CrossRef] [Green Version]
  11. De Robertis, A.; Ryer, C.H.; Veloza, A.; Brodeur, R.D. Differential effects of turbidity on prey consumption of piscivorous and planktivorous fish. Can. J. Fish. Aquat. Sci. 2003, 60, 1517–1526. [Google Scholar] [CrossRef]
  12. Jia, J.; Shi, W.; Chen, Q.; Lauridsen, T.L. Spatial and temporal variations reveal the response of zooplankton to cyanobacteria. Harmful Algae 2017, 64, 63–73. [Google Scholar] [CrossRef] [PubMed]
  13. Gong, Z.; Xie, P. Impact of eutrophication on biodiversity of the Macrozoobenthos community in a Chinese shallow lake. J. Freshw. Ecol. 2001, 16, 171–178. [Google Scholar] [CrossRef] [Green Version]
  14. Cai, Y.; Gong, Z.; Qin, B. Influences of habitat type and environmental variables on benthic macroinvertebrate communities in a large shallow subtropical lake (Lake Taihu, China). Ann. Limnol. Int. J. Limnol. 2011, 47, 85–95. [Google Scholar] [CrossRef] [Green Version]
  15. Cai, Y.; Gong, Z.; Qin, B. Benthic macroinvertebrate community structure in Lake Taihu, China: Effects of trophic status, wind-induced disturbance and habitat complexity. J. Great Lakes Res. 2012, 38, 39–48. [Google Scholar] [CrossRef]
  16. Mehner, T.; Diekmann, M.; Gonsiorczyk, T.; Kasprzak, P.; Koschel, R.; Krienitz, L.; Rumpf, M.; Schulz, M.; Wauer, G. Rapid recovery from eutrophication of a stratified lake by disruption of internal nutrient load. Ecosystems 2008, 11, 1142–1156. [Google Scholar] [CrossRef]
  17. Hartmann, J.; Nümann, W. Percids of lake constance, a lake undergoing eutrophication. J. Fish. Res. Board Can. 1977, 34, 1670–1677. [Google Scholar] [CrossRef]
  18. Persson, L. Competition, predation and environmental factors as structuring forces in freshwater fish communities: Sumari (1971) revisited. Can. J. Fish. Aquat. Sci. 1997, 54, 85–88. [Google Scholar] [CrossRef]
  19. Perrow, M.R.; Jowitt, A.J.D.; Leigh, S.A.C.; Hindes, A.M.; Rhodes, J.D. The stability of fish communities in shallow lakes undergoing restoration: Expectations and experiences from the Norfolk Broads (U.K.). Hydrobiologia 1999, 408, 85–100. [Google Scholar] [CrossRef]
  20. Teixeira-de Mello, F.; Meerhoff, M.; Jeppesen, E.; Pekcan-Hekim, Z. Substantial differences in littoral fish community structure and dynamics in subtropical and temperate shallow lakes. Freshw. Biol. 2009, 54, 1202–1215. [Google Scholar] [CrossRef]
  21. Mao, Z.; Gu, X.; Zeng, Q.; Zhou, L.; Sun, M. Status and changes of fishery resources (2009–2010) in Lake Taihu and their responses to water eutrophication. J. Lake Sci. 2011, 23, 967–973. [Google Scholar]
  22. Hoyer, M.V.; Bennett, J.P.; Canfield, D.E. Monitoring freshwater fish in Florida lakes using electrofishing: Lessons learned. Lake Reserv. Manag. 2011, 27, 329–342. [Google Scholar] [CrossRef] [Green Version]
  23. Gao, J.; Liu, Z.; Jeppesen, E. Fish community assemblages changed but biomass remained similar after lake restoration by biomanipulation in a Chinese tropical eutrophic lake. Hydrobiologia 2014, 724, 127–140. [Google Scholar] [CrossRef]
  24. Boll, T.; Levi, E.E.; Bezirci, G.; Özuluğ, M.; Tavşanoğlu, Ü.N.; Çakıroğlu, A.I.; Özcan, S.; Brucet, S.; Jeppesen, E.; Beklioğlu, M. Fish assemblage and diversity in lakes of western and central Turkey: Role of geo-climatic and other environmental variables. Hydrobiologia 2016, 771, 31–44. [Google Scholar] [CrossRef]
  25. Jin, B.-S.; Winemiller, K.O.; Shao, B.; Si, J.-K.; Jin, J.-F.; Ge, G. Fish assemblage structure in relation to seasonal environmental variation in sub-lakes of the Poyang Lake floodplain, China. Fish. Manag. Ecol. 2019, 26, 131–140. [Google Scholar] [CrossRef]
  26. González-Bergonzoni, I.; Meerhoff, M.; Davidson, T.A.; Teixeira-de Mello, F.; Baattrup-Pedersen, A.; Jeppesen, E. Meta-analysis shows a consistent and strong latitudinal pattern in fish omnivory across ecosystems. Ecosystems 2012, 15, 492–503. [Google Scholar] [CrossRef]
  27. Jeppesen, E.; Jensen, J.P.; Søndergaard, M.; Lauridsen, T.L.; Landkildehus, F. Trophic structure, species richness and biodiversity in Danish lakes: Changes along a phosphorus gradient. Freshw. Biol. 2000, 45, 201–218. [Google Scholar] [CrossRef]
  28. Meerhoff, M.; Clemente, J.M.; Teixeira De Mello, F.; Iglesias, C.; Pedersen, A.R.; Jeppesen, E. Can warm climate-related structure of littoral predator assemblies weaken the clear water state in shallow lakes? Glob. Chang. Biol. 2007, 13, 1888–1897. [Google Scholar] [CrossRef]
  29. Ye, S.; Li, Z.; Zhang, T.; Liu, J.; Xie, S. Assessing fish distribution and threats to fish biodiversity in the Yangtze River Basin, China. Ichthyol. Res. 2014, 61, 183–188. [Google Scholar] [CrossRef]
  30. Ma, R.; Yang, G.; Duan, H.; Jiang, J.; Wang, S.; Feng, X.; Li, A.; Kong, F.; Xue, B.; Wu, J.; et al. China’s lakes at present: Number, area and spatial distribution. Sci. China Earth Sci. 2011, 54, 283–289. [Google Scholar] [CrossRef]
  31. Yang, G.; Ma, R.; Zhang, L.; Jiang, J.; Yao, S.; Zhang, M.; Zeng, H. Lake status, major problems and protection strategy in China. J. Lake Sci. 2010, 22, 799–810. [Google Scholar]
  32. Jin, X.; Tu, Q. The Standard Methods for Observation and Analysis in Lake Eutrophication, 2nd ed.; Environmental Science: Beijing, China, 1990. [Google Scholar]
  33. SEPA. Analytical Methods for Water and Wastewater Monitor, 4th ed.; Chinese Environmental Science Press: Beijing, China, 2002. [Google Scholar]
  34. Pinkas, L.; Oliphant, M.S.; Iverson, I.L.K. Food habitats of Albacore, Blue-Fintuna, and Bonito in California waters. Fish. Bull. 1971, 152, 1–105. [Google Scholar]
  35. Selleslagh, J.; Amara, R.; Laffargue, P.; LeSourd, S.; Lepage, M.; Girardin, M. Fish composition and assemblage structure in three Eastern English Channel macrotidal estuaries: A comparison with other French estuaries. Estuar. Coast. Shelf Sci. 2009, 81, 149–159. [Google Scholar] [CrossRef]
  36. R Core Team. R: A Language and Environment for Statistical Computing; R Core Team: Vienna, Austria, 2020; Available online: https://www.r-project.org (accessed on 23 January 2021).
  37. Hijmans, R.J.; van Etten, J.; Sumner, M.; Cheng, J.; Baston, D.; Bevan, A.; Bivand, R.; Busetto, L.; Canty, M.; Fasoli, B.; et al. Raster: Geographic Data Analysis and Modeling. 2020. Available online: https://cran.r-project.org/web/packages/raster/index.html (accessed on 14 November 2020).
  38. Naimi, B.; Hamm, N.A.S.; Groen, T.A.; Skidmore, A.K.; Toxopeus, A.G. Where is positional uncertainty a problem for species distribution modelling? Ecography 2013, 37, 191–203. [Google Scholar] [CrossRef]
  39. Dodson, S.I.; Arnott, S.E.; Cottingham, K.L. The relationship in lake communities between primary productivity and species richness. Ecology 2000, 81, 2662–2679. [Google Scholar] [CrossRef]
  40. Amarasinghe, U.S.; Welcomme, R.L. An analysis of fish species richness in natural lakes. Environ. Boil. Fishes 2002, 65, 327–339. [Google Scholar] [CrossRef]
  41. Jeppesen, E.; Canfield, D.E.; Bachmann, R.W.; Søndergaard, M.; Havens, K.E.; Johansson, L.S.; Lauridsen, T.L.; Sh, T.; Rutter, R.P.; Warren, G.; et al. Toward predicting climate change effects on lakes: A comparison of 1656 shallow lakes from Florida and Denmark reveals substantial differences in nutrient dynamics, metabolism, trophic structure, and top-down control. Inland Waters 2020, 10, 197–211. [Google Scholar] [CrossRef]
  42. Menezes, R.F.; Borchsenius, F.; Svenning, J.-C.; Søndergaard, M.; Lauridsen, T.L.; Landkildehus, F.; Jeppesen, E. Variation in fish community structure, richness, and diversity in 56 Danish lakes with contrasting depth, size, and trophic state: Does the method matter? Hydrobiologia 2012, 710, 47–59. [Google Scholar] [CrossRef]
  43. Helminen, H.; Karjalainen, J.; Kurkilahti, M.; Rask, M.; Sarvala, J. Eutrophication and fish biodiversity in Finnish lakes. SIL Proc. 2000, 27, 194–199. [Google Scholar] [CrossRef]
  44. Bachmann, R.W.; Jones, B.L.; Fox, D.D.; Hoyer, M.; Bull, L.A.; Canfield, D.E. Relations between trophic state indicators and fish in Florida (U.S.A.) lakes. Can. J. Fish. Aquat. Sci. 1996, 53, 842–855. [Google Scholar] [CrossRef]
  45. Drakou, E.G.; Bobori, D.C.; Kallimanis, A.S.; Mazaris, A.D.; Sgardelis, S.P.; Pantis, J.D. Freshwater fish community structured more by dispersal limitation than by environmental heterogeneity. Ecol. Freshw. Fish 2009, 18, 369–379. [Google Scholar] [CrossRef]
  46. Zhao, S.; Fang, J.; Peng, C.; Tang, Z.; Piao, S. Patterns of fish species richness in China’s lakes. Glob. Ecol. Biogeogr. 2006, 15, 386–394. [Google Scholar] [CrossRef]
  47. Allan, J.D.; Abell, R.; Hogan, Z.; Revenga, C.; Taylor, B.W.; Welcomme, R.L.; Winemiller, K.O. Overfishing of inland waters. Bioscience 2005, 55, 1041–1051. [Google Scholar] [CrossRef] [Green Version]
  48. Vander Zanden, M.J.; Vadeboncoeur, Y. Fishes as integrators of benthic and pelagic food webs in lakes. Ecology 2002, 83, 2152–2161. [Google Scholar] [CrossRef]
  49. Persson, L.; Diehl, S.; Johansson, L.; Andersson, G.; Hamrin, S.F. Shifts in fish communities along the productivity gradient of temperate lakes-patterns and the importance of size-structured interactions. J. Fish Biol. 1991, 38, 281–293. [Google Scholar] [CrossRef]
  50. Quiros, R. Empirical relationships between nutrients, phyto- and zooplankton and relative fish biomass in lakes and reservoirs of Argentina. SIL Proc. 1991, 24, 1198–1206. [Google Scholar] [CrossRef]
  51. Hayden, B.; Myllykangas, J.-P.; Rolls, R.J.; Kahilainen, K.K. Climate and productivity shape fish and invertebrate community structure in subarctic lakes. Freshw. Biol. 2017, 62, 990–1003. [Google Scholar] [CrossRef]
  52. Persson, L.; Diehl, S.; Johansson, L.; Andersson, G.; Hamrin, S.F. Trophic interactions in temperate lake ecosystems: A test of food chain theory. Am. Nat. 1992, 140, 59–84. [Google Scholar] [CrossRef]
  53. Yang, G.; Zhong, C.; Pan, H. Comparative studies on seasonal variations of metazooplankton in waters with different eutrophic states in Lake Taihu. Environ. Monit. Assess. 2009, 150, 445–453. [Google Scholar] [CrossRef]
  54. Chen, F.; Dai, X.; Shu, T.; Gulati, R.D.; Liu, Z. Microcystins derived from lysing Microcystis cells do not cause negative effects on crustacean zooplankton in Lake Taihu, China. Aquat. Ecol. 2013, 47, 379–387. [Google Scholar] [CrossRef]
  55. Yu, J.; Liu, Z.; He, H.; Zhen, W.; Guan, B.; Chen, F.; Li, K.; Zhong, P.; Teixeira-de Mello, F.T.; Jeppesen, E. Submerged macrophytes facilitate dominance of omnivorous fish in a subtropical shallow lake: Implications for lake restoration. Hydrobiologia 2016, 775, 97–107. [Google Scholar] [CrossRef]
  56. Li, Y.; Ye, J.; Chen, F.; Lliu, Z.; Wang, W.; Liu, X. Feeding ecology of Hemiculter Leucisculus in the Meiliang Bay of Taihu Lake. J. Hohai Univ. 2008, 36, 82–85. (In Chinese) [Google Scholar]
  57. Moss, B. Climate change, nutrient pollution and the bargain of Dr Faustus. Freshw. Biol. 2010, 55, 175–187. [Google Scholar] [CrossRef]
  58. Rao, W.; Ning, J.; Zhong, P.; Jeppesen, E.; Liu, Z. Size-dependent feeding of omnivorous Nile tilapia in a macrophyte-dominated lake: Implications for lake management. Hydrobiologia 2015, 749, 125–134. [Google Scholar] [CrossRef]
  59. Gao, J.; Zhong, P.; Ning, J.; Liu, Z.; Jeppesen, E. Herbivory of omnivorous fish shapes the food web Structure of a Chinese tropical eutrophic lake: Evidence from stable isotope and fish gut content analyses. Water 2017, 9, 69. [Google Scholar] [CrossRef] [Green Version]
  60. Penttinen, O.-P.; Holopainen, I.J. Seasonal feeding activity and ontogenetic dietary shifts in crucian carp, Carassius carassius. Environ. Biol. Fish. 1992, 33, 215–222. [Google Scholar] [CrossRef]
  61. Richardson, M.J.; Whoriskey, F.G.; Roy, L.H. Turbidity generation and biological impacts of an exotic fish Carassius auratus, introduced into shallow seasonally anoxic ponds. J. Fish Biol. 1995, 47, 576–585. [Google Scholar] [CrossRef]
  62. Chen, K.-N.; Bao, C.-H.; Zhou, W.-P. Ecological restoration in eutrophic Lake Wuli: A large enclosure experiment. Ecol. Eng. 2009, 35, 1646–1655. [Google Scholar] [CrossRef]
  63. Li, B.; Wang, Z.; Jin, L.; Ye, F.; Chen, D.; Zhang, Y. Study on diet shift of Erythroulter Mongolicus with stable isotope technology. J. Fish. Chin. 2011, 35, 1419–1425. (In Chinese) [Google Scholar]
  64. Zhou, D.; Ye, J.; Wang, W.; Liu, Z. Feeding habits and the relation to the size of Cultrichthys Erythropterus in Meiliang Bay, Lake Taihu: Implication for biomanipulation and management. J. Lake Sci. 2011, 23, 796–800. (In Chinese) [Google Scholar]
  65. Hossain, M.; Arhonditsis, G.B.; Hoyle, J.A.; Randall, R.G.; Koops, M.A. Nutrient management and structural shifts in fish assemblages: Lessons learned from an Area of Concern in Lake Ontario. Freshw. Biol. 2019, 64, 967–983. [Google Scholar] [CrossRef]
  66. Diehl, S. Foraging Efficiency of Three Freshwater Fishes: Effects of Structural Complexity and Light. Oikos 1988, 53, 207–214. [Google Scholar] [CrossRef]
  67. Jönsson, M.; Ranåker, L.; Nilsson, P.A.; Brönmark, C. Foraging efficiency and prey selectivity in a visual predator: Differential effects of turbid and humic water. Can. J. Fish. Aquat. Sci. 2013, 70, 1685–1690. [Google Scholar] [CrossRef]
  68. Liang, X. On the feeding behavior of Mandarin Fish (Siniperca Chuatsi). Oceanol. Limnol. Sin. 1995, 26, 119–125. (In Chinese) [Google Scholar]
  69. Zhou, X.; Hu, Z.; Liu, Q.; Yang, L.; Wang, Y. Feeding ecology of the non-indigenous fish Hypomesus nipponensis in Lake Ulungur, China: Insight into the relationship between its introduction and the collapse of the native Eurasian perch population. Mar. Freshw. Res. 2013, 64, 549–557. [Google Scholar] [CrossRef]
  70. Lauridsen, T.L.; Landkildehus, F.; Jeppesen, E.; Jørgensen, T.B.; Søndergaard, M. A comparison of methods for calculating Catch Per Unit Effort (CPUE) of gill net catches in lakes. Fish. Res. 2008, 93, 204–211. [Google Scholar] [CrossRef]
  71. Mehner, T.; Emmrich, M.; Hartwig, S. Spatial predictors of fish species composition in European lowland lakes. Ecography 2014, 37, 73–79. [Google Scholar] [CrossRef]
  72. Arranz, I.; Mehner, T.; Benejam, L.; Argillier, C.; Holmgren, K.; Jeppesen, E.; Lauridsen, T.L.; Volta, P.; Winfield, I.J.; Brucet, S. Density-dependent effects as key drivers of intraspecific size structure of six abundant fish species in lakes across Europe. Can. J. Fish. Aquat. Sci. 2016, 73, 519–534. [Google Scholar] [CrossRef] [Green Version]
  73. Zhang, G.; Chang, J.; Shu, G. Applications of factor-criteria system reconstruction analysis in the reproduction research on Grass Carp, Black Carp, Silver Carp and Bighead in the Yangtze River. Int. J. Gen. Syst. 2000, 29, 419–428. [Google Scholar] [CrossRef]
Figure 1. Locations of the study lakes. The red dots indicate the sampling lakes; the blue lines represent rivers or tributaries of the lake.
Water 13 00858 g001
Figure 2. Relationships between (A) total nitrogen (TN) and (B) total phosphorus (TP) in the water, (C) water transparency (Secchi depth, SD), and (D) the ratio of Secchi depth to water depth (SD:WD) versus the concentration of Chla. N, number of lakes; Chla, chlorophyll-a concentration in phytoplankton. The dashed lines represent the 95% confidence band.
Water 13 00858 g002
Figure 3. Relationships between richness of the fish species caught and Chla. The dashed line represents the 95% confidence band. N, number of lakes; Chla, chlorophyll a concentration in phytoplankton.
Water 13 00858 g003
Figure 4. Relationships between fish catch per unit effort (NPUE, number per unit effort (A); BPUE, biomass per unit effort (B) and Chla. N, number of lakes; Chla, chlorophyll-a concentration in phytoplankton. The dashed lines represent the 95% confidence band.
Water 13 00858 g004
Figure 5. Relationships between mean body weight (total biomass/total numbers) of all fish caught (A,B) and when divided into two size classes based on fish total length (TL, (C)) and environmental variables. NPUE, catch per unit effort in numbers; Chla, chlorophyll-a concentration in phytoplankton; TN, total nitrogen concentration in the water. The dashed lines represent the 95% confidence band.
Water 13 00858 g005
Figure 6. Percent abundance (N%) and biomass (B%) of all zooplanktivores (zooplanktivores + omniplanktivores (A,B)) and piscivores (C,D) along the Chla gradient and of omnibenthivores (E) along the TN gradient. N, number of lakes; Chla, chlorophyll-a concentration in phytoplankton. The dashed lines represent the 95% confidence band.-
Water 13 00858 g006
Figure 7. Relationships between catch per unit effort (NPUE and BPUE) of the three dominant fish species and piscivores and Chla. N, number of lakes; Chla, chlorophyll-a concentration in phytoplankton; NPUE, catch per unit effort in numbers; BPUE, catch per unit effort in biomass. Notes: Toxabramis swinhonis (zooplanktivore), Hemiculter leucisculus (omnizooplanktivore), Carassius carassius (omnibenthivore) and Culter spp. (piscivore). The dashed lines represent the 95% confidence band.
Water 13 00858 g007
Figure 8. Relationship between average fish weight of the dominant fish species and the selected environmental variables. N, number of lakes; TN, total nitrogen concentration in the water; SD, Secchi depth; Chla, chlorophyll-a concentration in phytoplankton. Toxabramis swinhonis (zooplanktivore), Hemiculter leucisculus (omni-zooplanktivore), Carassius carassius (omni-benthivore), and Culter spp. (piscivores). The dashed lines represent the 95% confidence band.
Water 13 00858 g008
Table 1. Characteristics of the investigated lakes. SD represents the standard deviation of the sampling lakes. Chla, chlorophyll a concentration in phytoplankton.
ParametersMinimumMaximumMean±SD
Lake area (km2)7.337594102.6
Secchi depth (m)0.120.80.5
Depth (m)1.57.14.21.6
Secchi depth: water depth ratio0.020.40.20.09
Total suspended solids (mg L−1)3.25916.510.5
Total nitrogen (mg L−1)0.52.71.20.6
Total phosphorus (µg L−1)17.63938987.2
Chla (µg L−1)4.4843221.7
Table 2. Results of the multiple regressions using a generalized linear model (GLM) to select the significant explanatory environmental variables for fish compositional data. Environmental variables: chlorophyll a concentration in phytoplankton (Chla, μg L−1), mean depth (m), total nitrogen in the water (TN, mg L−1), lake surface size (km2), Secchi depth (SD, m), and total phosphorus in the water (TP, μg L−1). AIC, Akaike Information Criterion. Fish community traits: NPUE, number per unit effort (ind. net−1 h−1); BPUE, biomass per unit effort (kg net−1 h−1); mean fish size (BPUE/NPUE, g ind.−1); TL, total length; N%, percentage in number; B%, percentage in biomass; Sijiao, Toxabramis swinhonis; sharpbelly, Hemiculter leucisculus; crucian carp, Carassius carassius. Note: both significant and insignificant explanatory environmental variables for fish community traits are shown in Table S1.
Fish Compositional ParametersEnvironmental VariablesAICEstimatet-ValuePr (>|t|)
Log Fish species richnessLog Chla160.52.72.60.012
Log NPUELog Chla43.20.84.20.00017
Log BPUELog Chla40.70.94.5<0.0001
Log Mean fish sizeLog TN39.61.02.60.014
Log Lake size42.5−0.3−2.50.019
Log NPUE of fish TL < 15 cmLog Chla60.00.93.60.0012
Log NPUE of fish TL > 15 cmLog Chla48.00.73.20.0028
Log N% of zooplanktivoresLog Chla−64.90.13.00.006
Log SD−64.0−0.1−2.20.04
Log B% of zooplanktivoresLog SD25.0−0.6−2.50.02
Log Chla27.50.42.30.033
Log B% of benthivoresLog TN33.2−0.9−2.30.028
Log N% of piscivoresLog Chla14.2−0.5−2.60.019
Log B% of piscivoresLog Chla24.1−1.4−6.5<0.0001
Log TN29.7−2.8−5.4<0.0001
Log TP30.51.24.30.00063
Log SD31.9−1.0−3.80.0019
Log NPUE of SijiaoLog Chla53.40.82.70.012
Log BPUE of SijiaoLog Chla53.50.82.60.014
Log NPUE of sharpbellyLog Chla45.61.33.50.0022
Log BPUE of sharpbellyLog Chla38.61.13.20.0041
Log NPUE of crucian carpLog Chla25.41.34.20.00048
Log SD32.90.92.70.016
Log BPUE of crucian carpLog Chla29.30.92.80.011
Log NPUE of CulterLog Chla2.50.53.70.002
Log Lake size12.0−0.2−2.20.042
Log BPUE of CulterLog Lake size18.8−0.5−3.00.008
Log Chla22.10.52.20.04
Log Mean size of SijiaoLog TN−16.50.63.80.00059
Log Mean size of sharpbellyLog SD−2.9−0.8−4.40.00016
Log Mean size of crucian carpLog Lake size5.9−0.2−2.20.042
Log mean size of CulterLog Chla13.2−0.4−2.10.05
Table 3. Frequency occurrence (FO%), relative contribution by number (N%) and biomass (B%), and index of relative importance (IRI) of the fish sampled. Note: The highest value for each trophic group is given in bold when there are more than one species in the trophic group.
Trophic GroupSpeciesFO%N%B%IRIIRI%
ZooplanktivoresToxabramis swinhonisa896214671952
Coilia nasusb42311871.5
Hyporhamphus intermediusc280.50.1170.1
Neosalanx taihuensisd60.050.010.30.0
OmniplanktivoresHemiculter leucisculusa78216216417
Hypophthalmichthys nobilisa2813610278
Hypophthalmichthys molitrixa110.65570.4
Pseudobrama simonia110.81210.2
Acheilognathus macropterusa170.30.290.07
Pseudorasbora parvaa60.30.0520.01
OmnibenthivoresCarassius carassiusa69726225318
Tachysurus fulvidracoe280.72750.6
Cyprinus carpioa60.05170.06
Xenocypris microlepisa80.10.660.05
Xenocypris hupeinensisa60.040.060.50.0
Xenocypris davidia30.020.050.20.0
Hemibarbus labeoa30.020.080.30.0
Sarcocheilichthys sinensisa30.040.10.40.0
OmniherbivoreMegalobrama amblycephalaa110.94540.4
PiscivoresCulter spp. a561.232342
Note: label of different fish families, a = Cyprinidae, b = Engraulidae, c = Hemiramphidae, d = Salangidae, e = Bagridae.
Publisher’s Note: MDPI stays neutral with regard to jurisdictional claims in published maps and institutional affiliations.

