
Analysis of the Impact of Land Use Changes on Soil Erosion Intensity and Sediment Yield Using the IntErO Model in the Talar Watershed of Iran


 ,
,  , and
, and
Abstract
:
1. Introduction
2. Materials and Methods
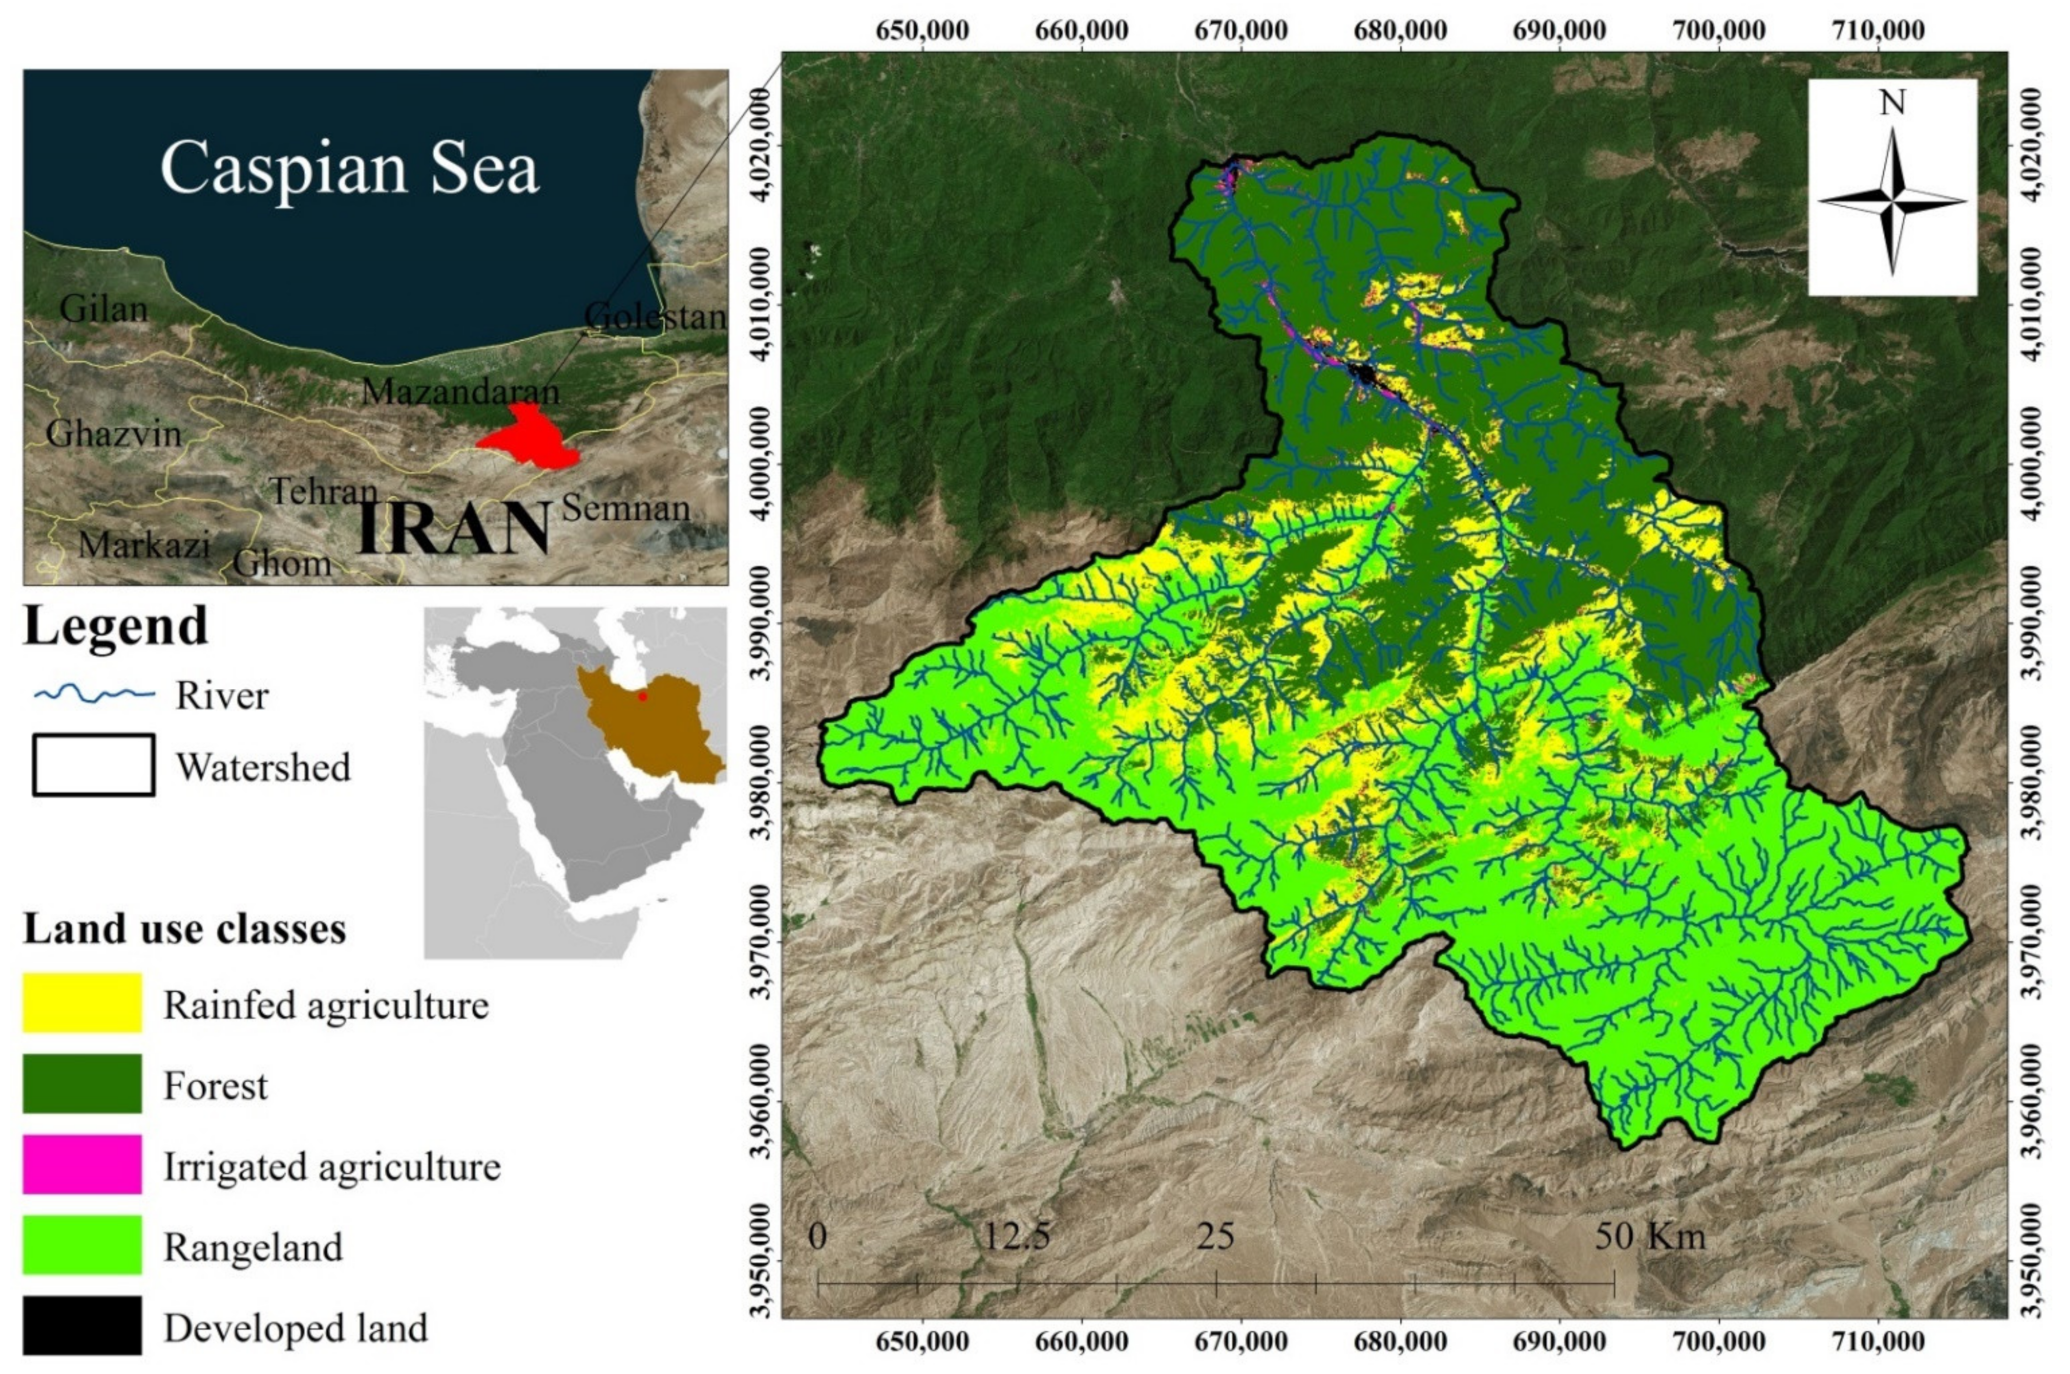
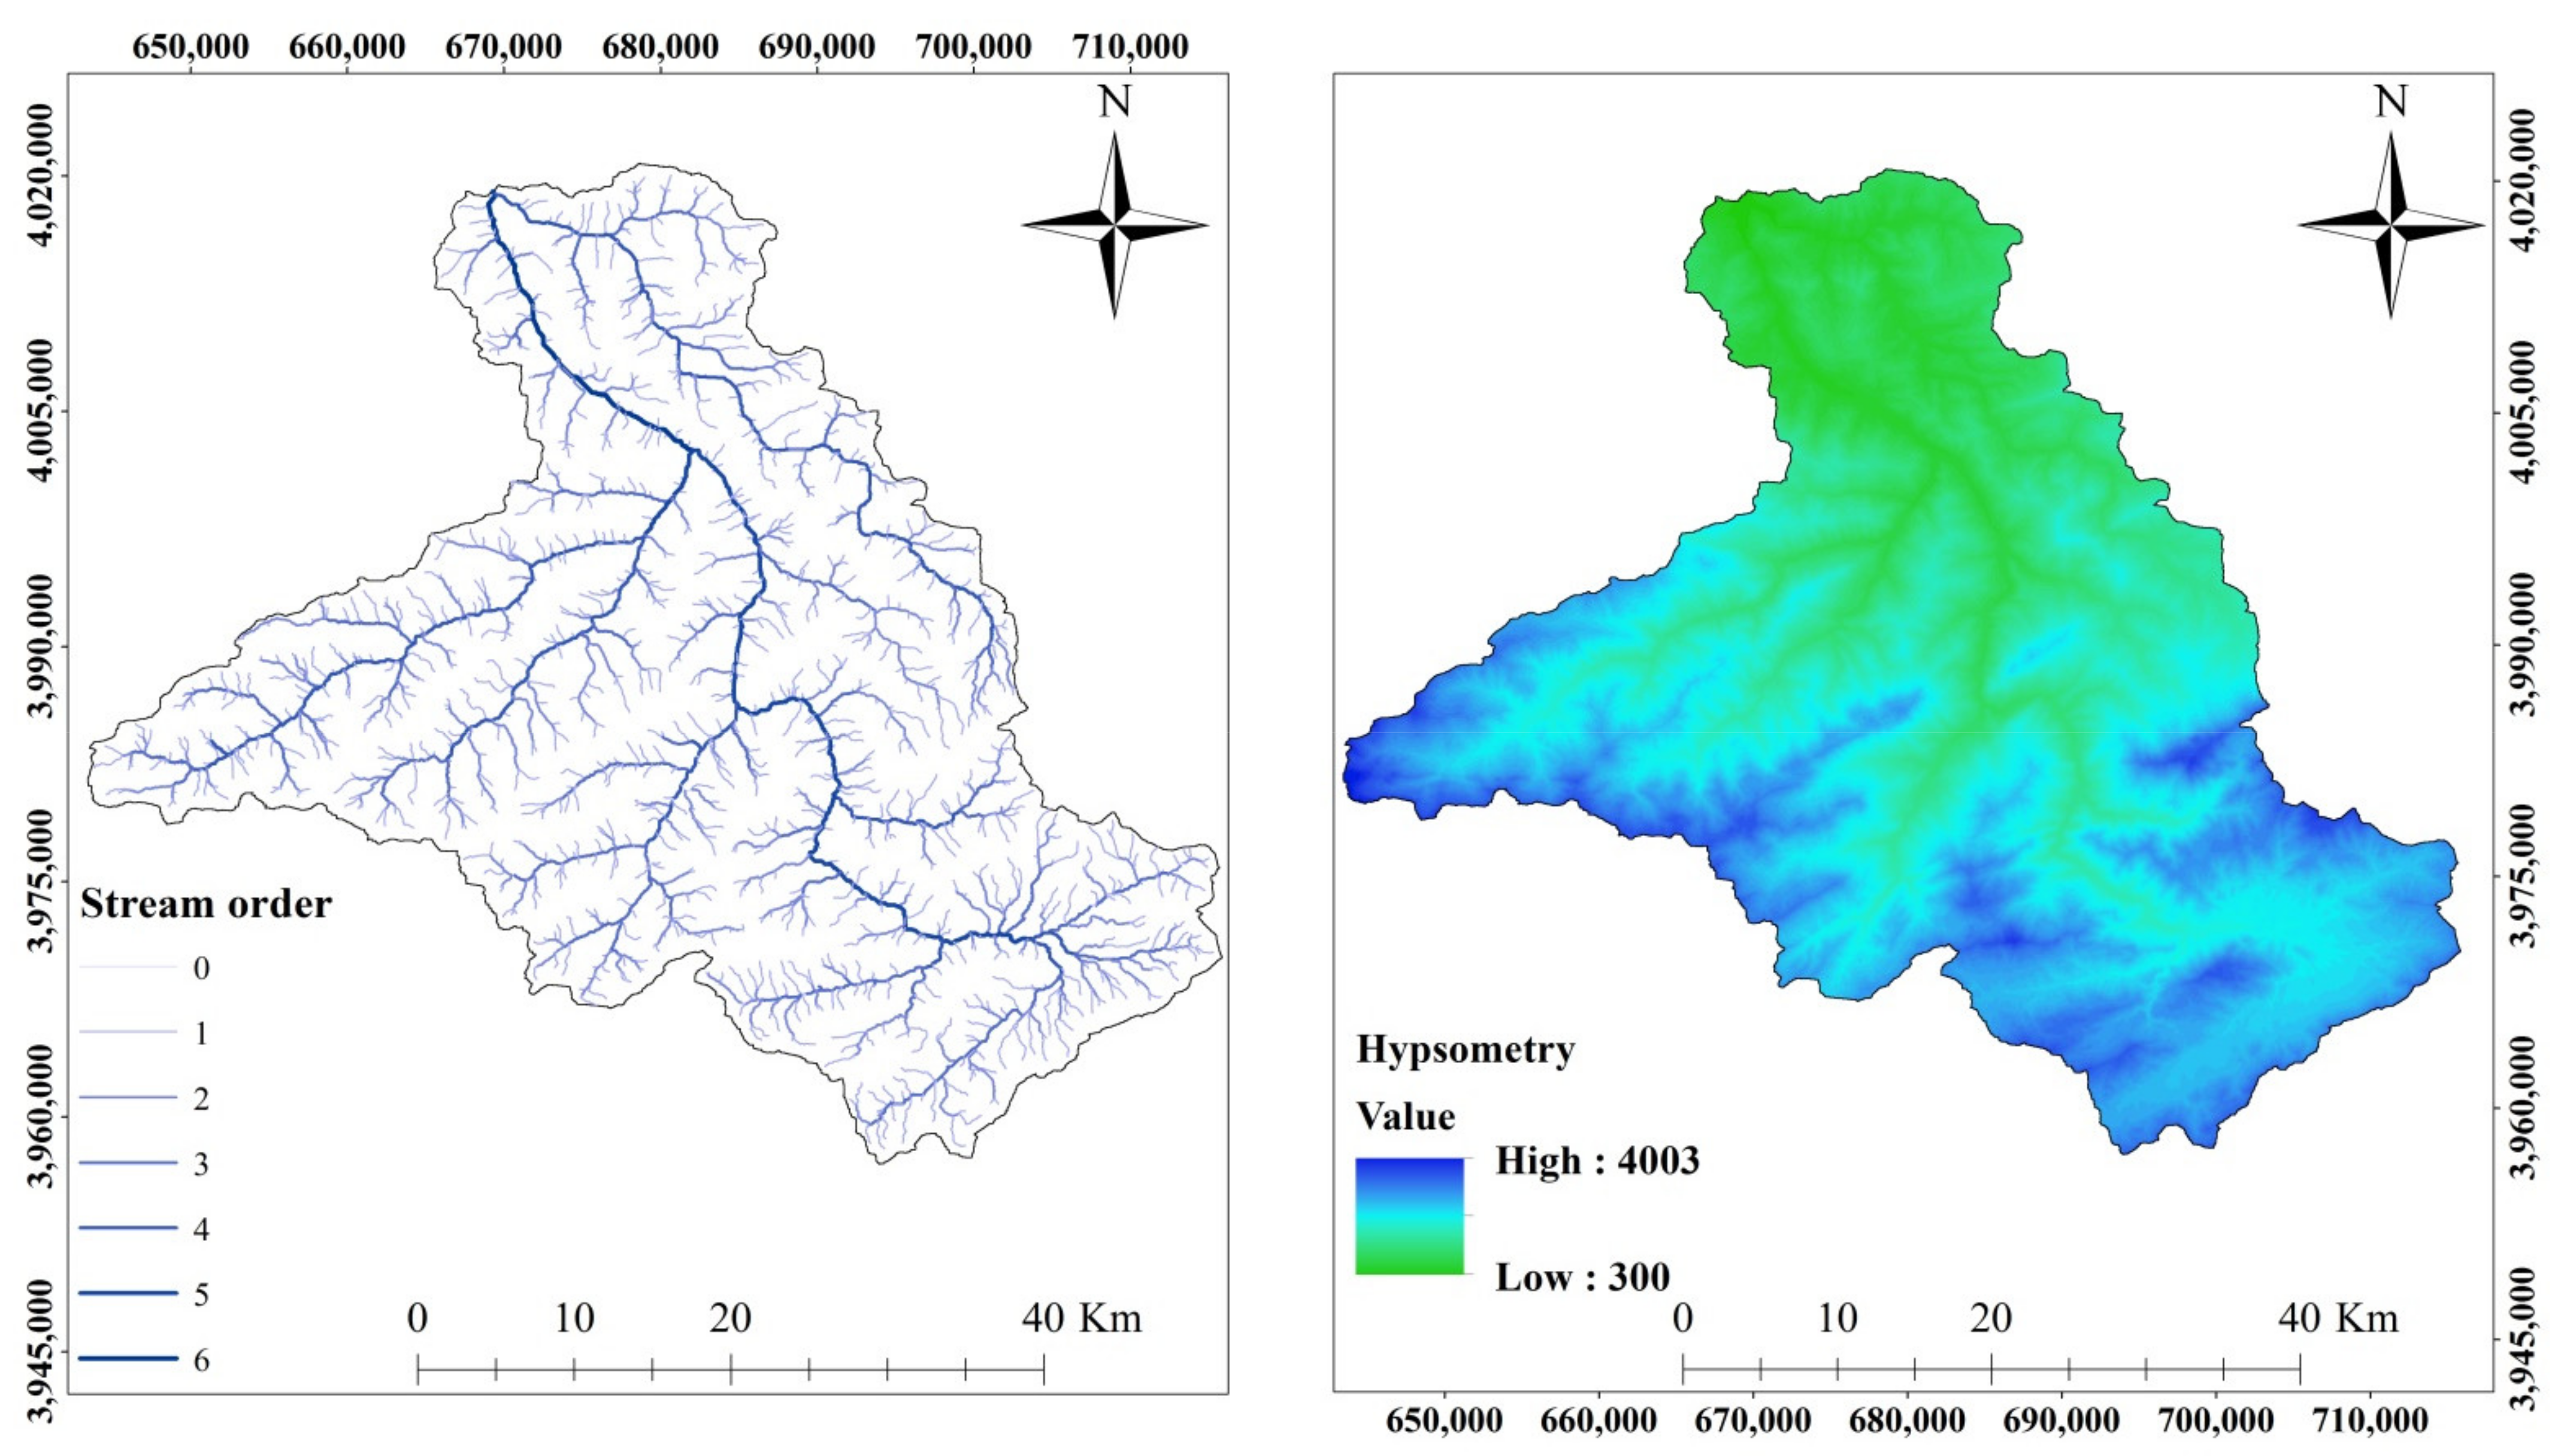
2.1. Study Area
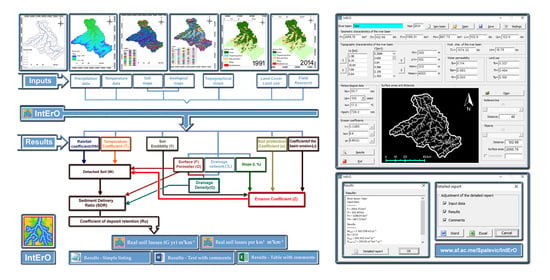
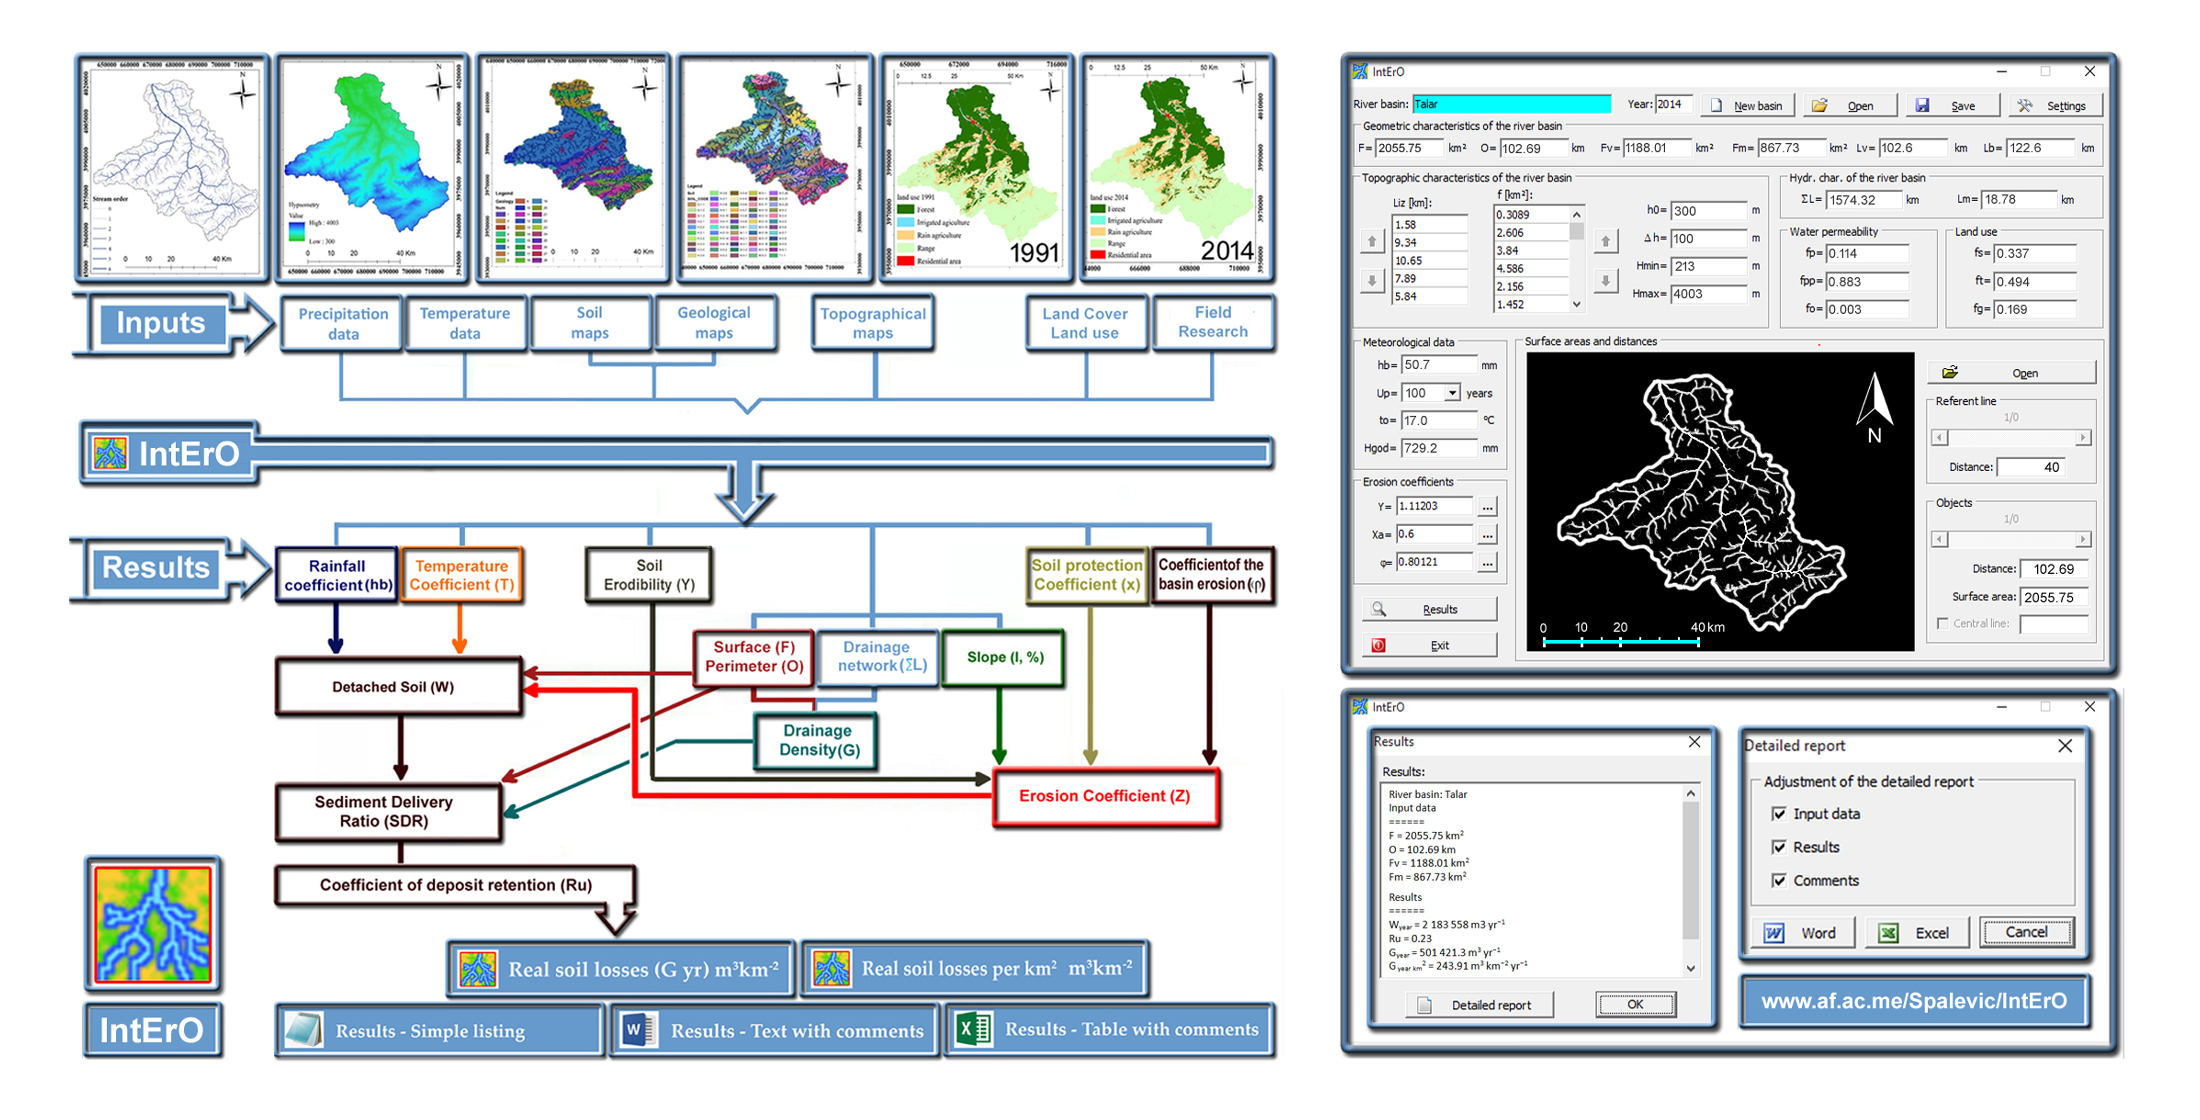
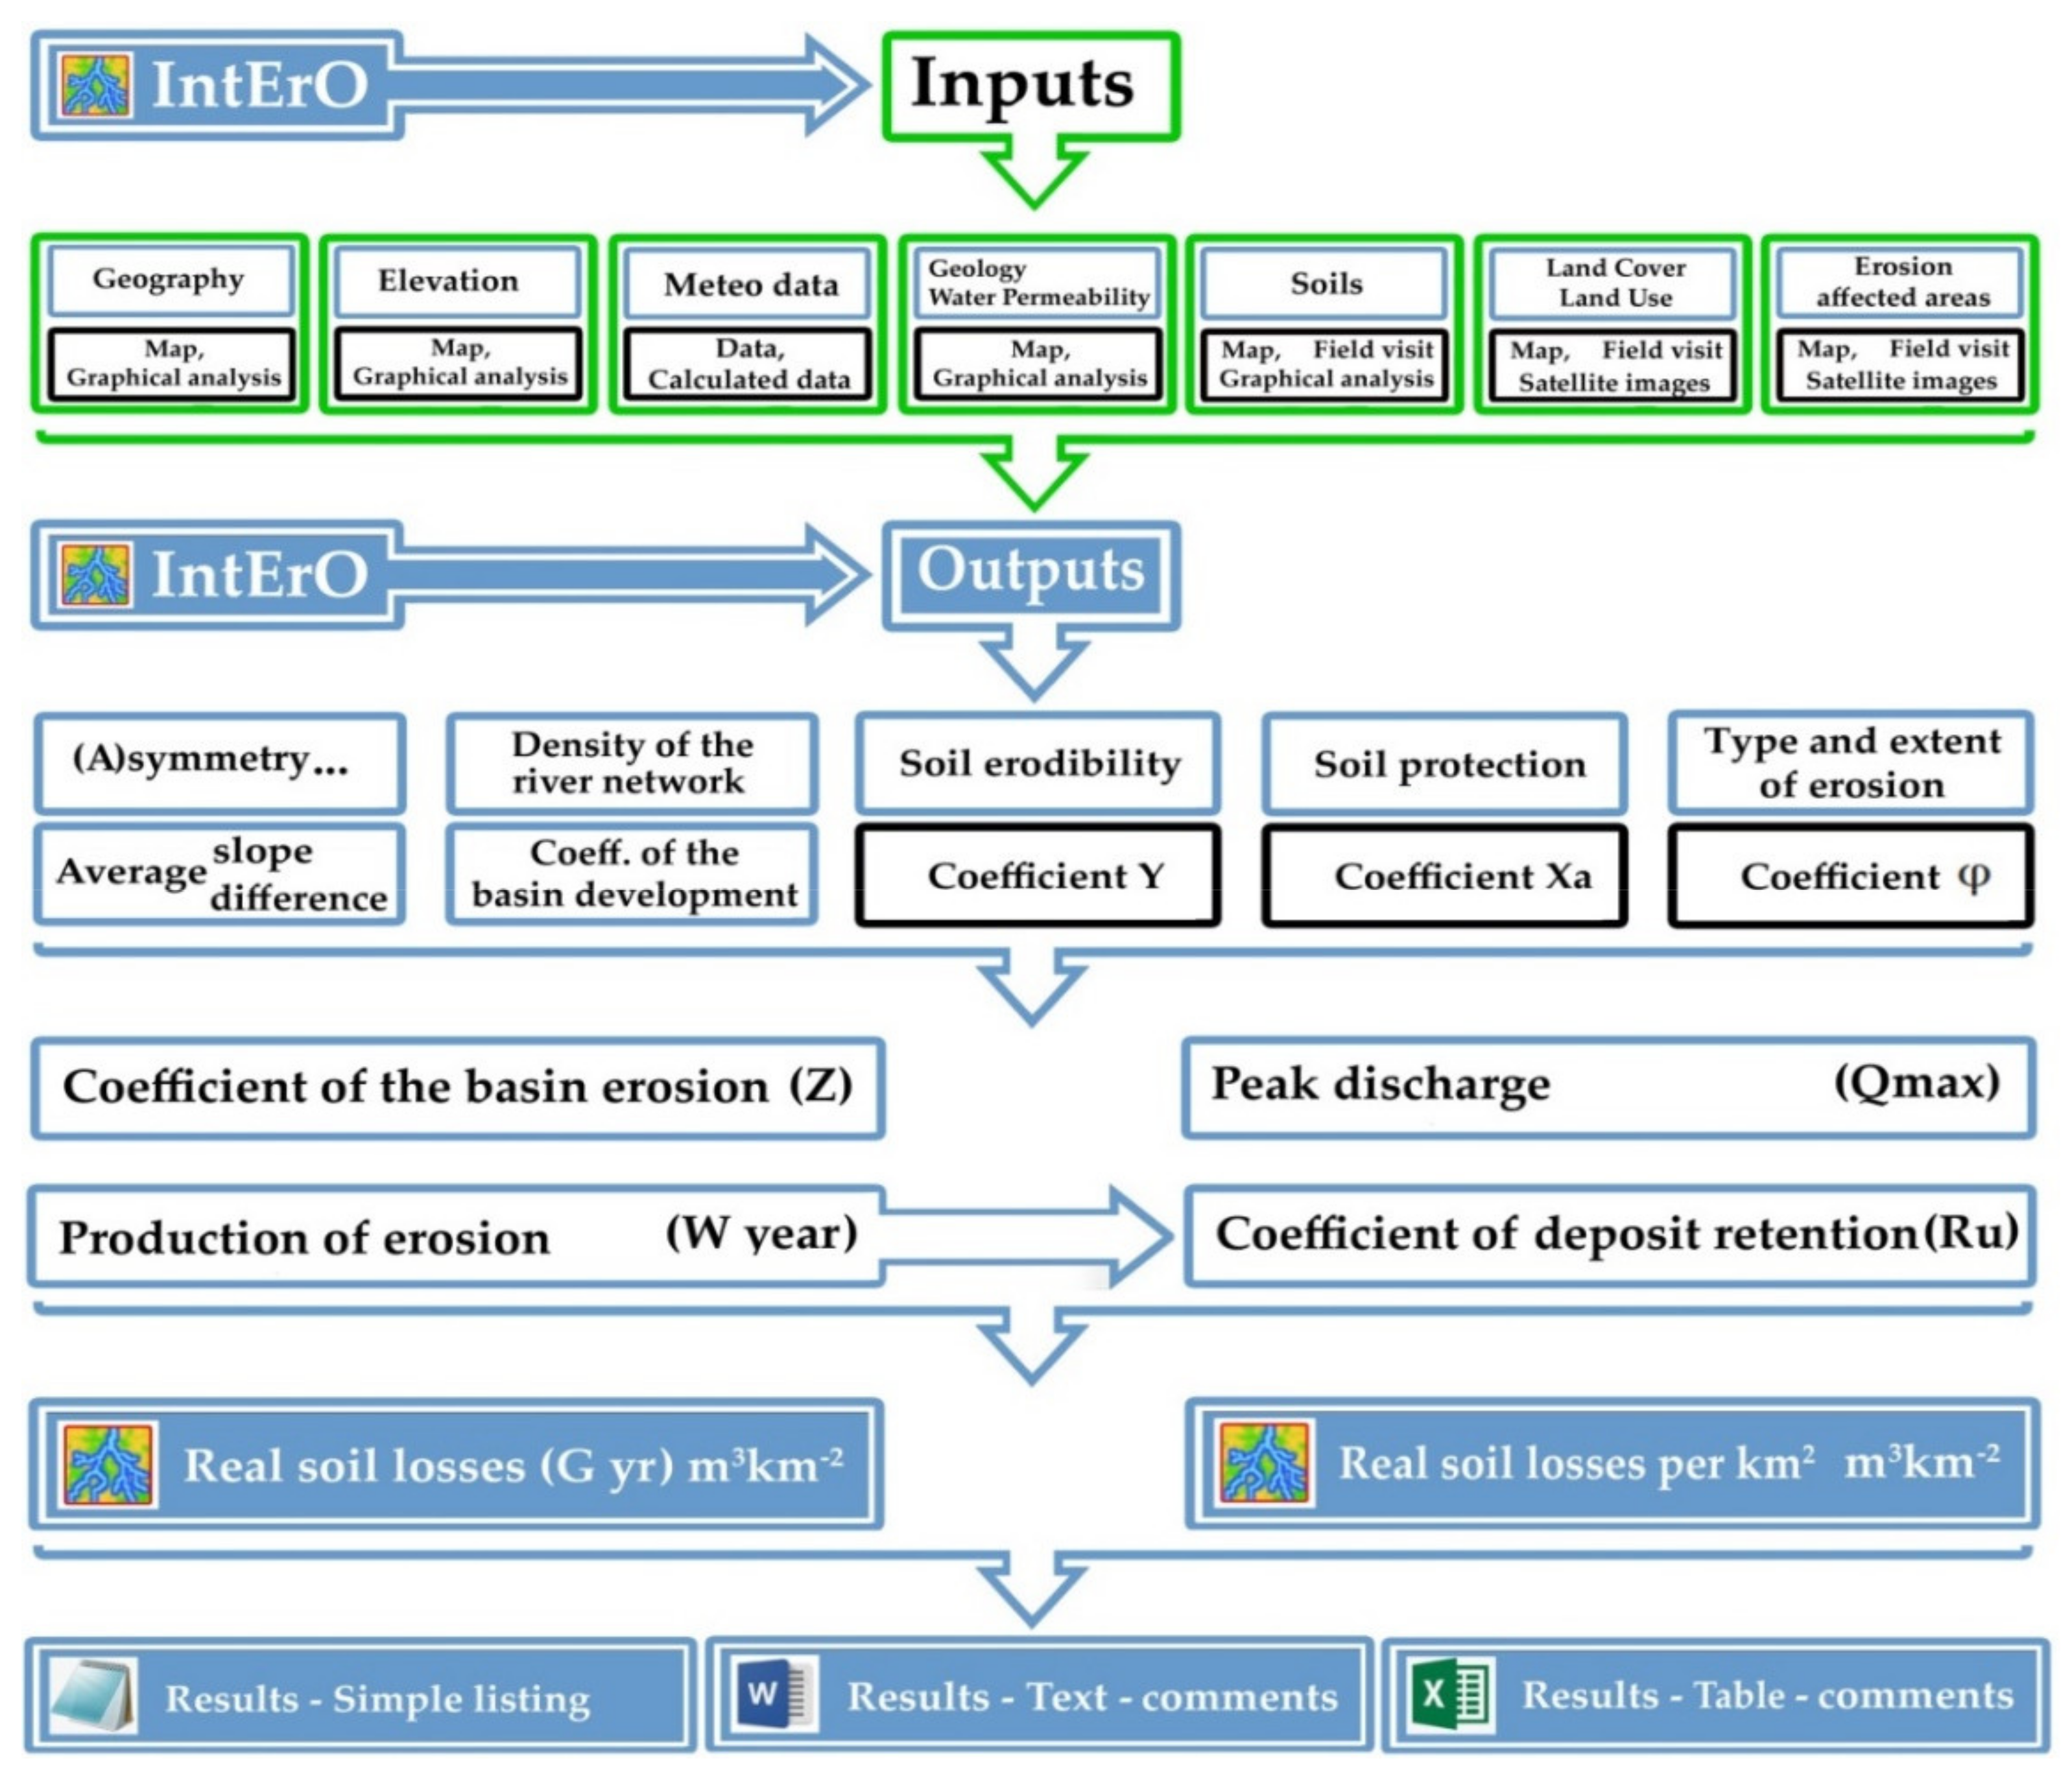
2.2. IntErO Model Application
3. Results
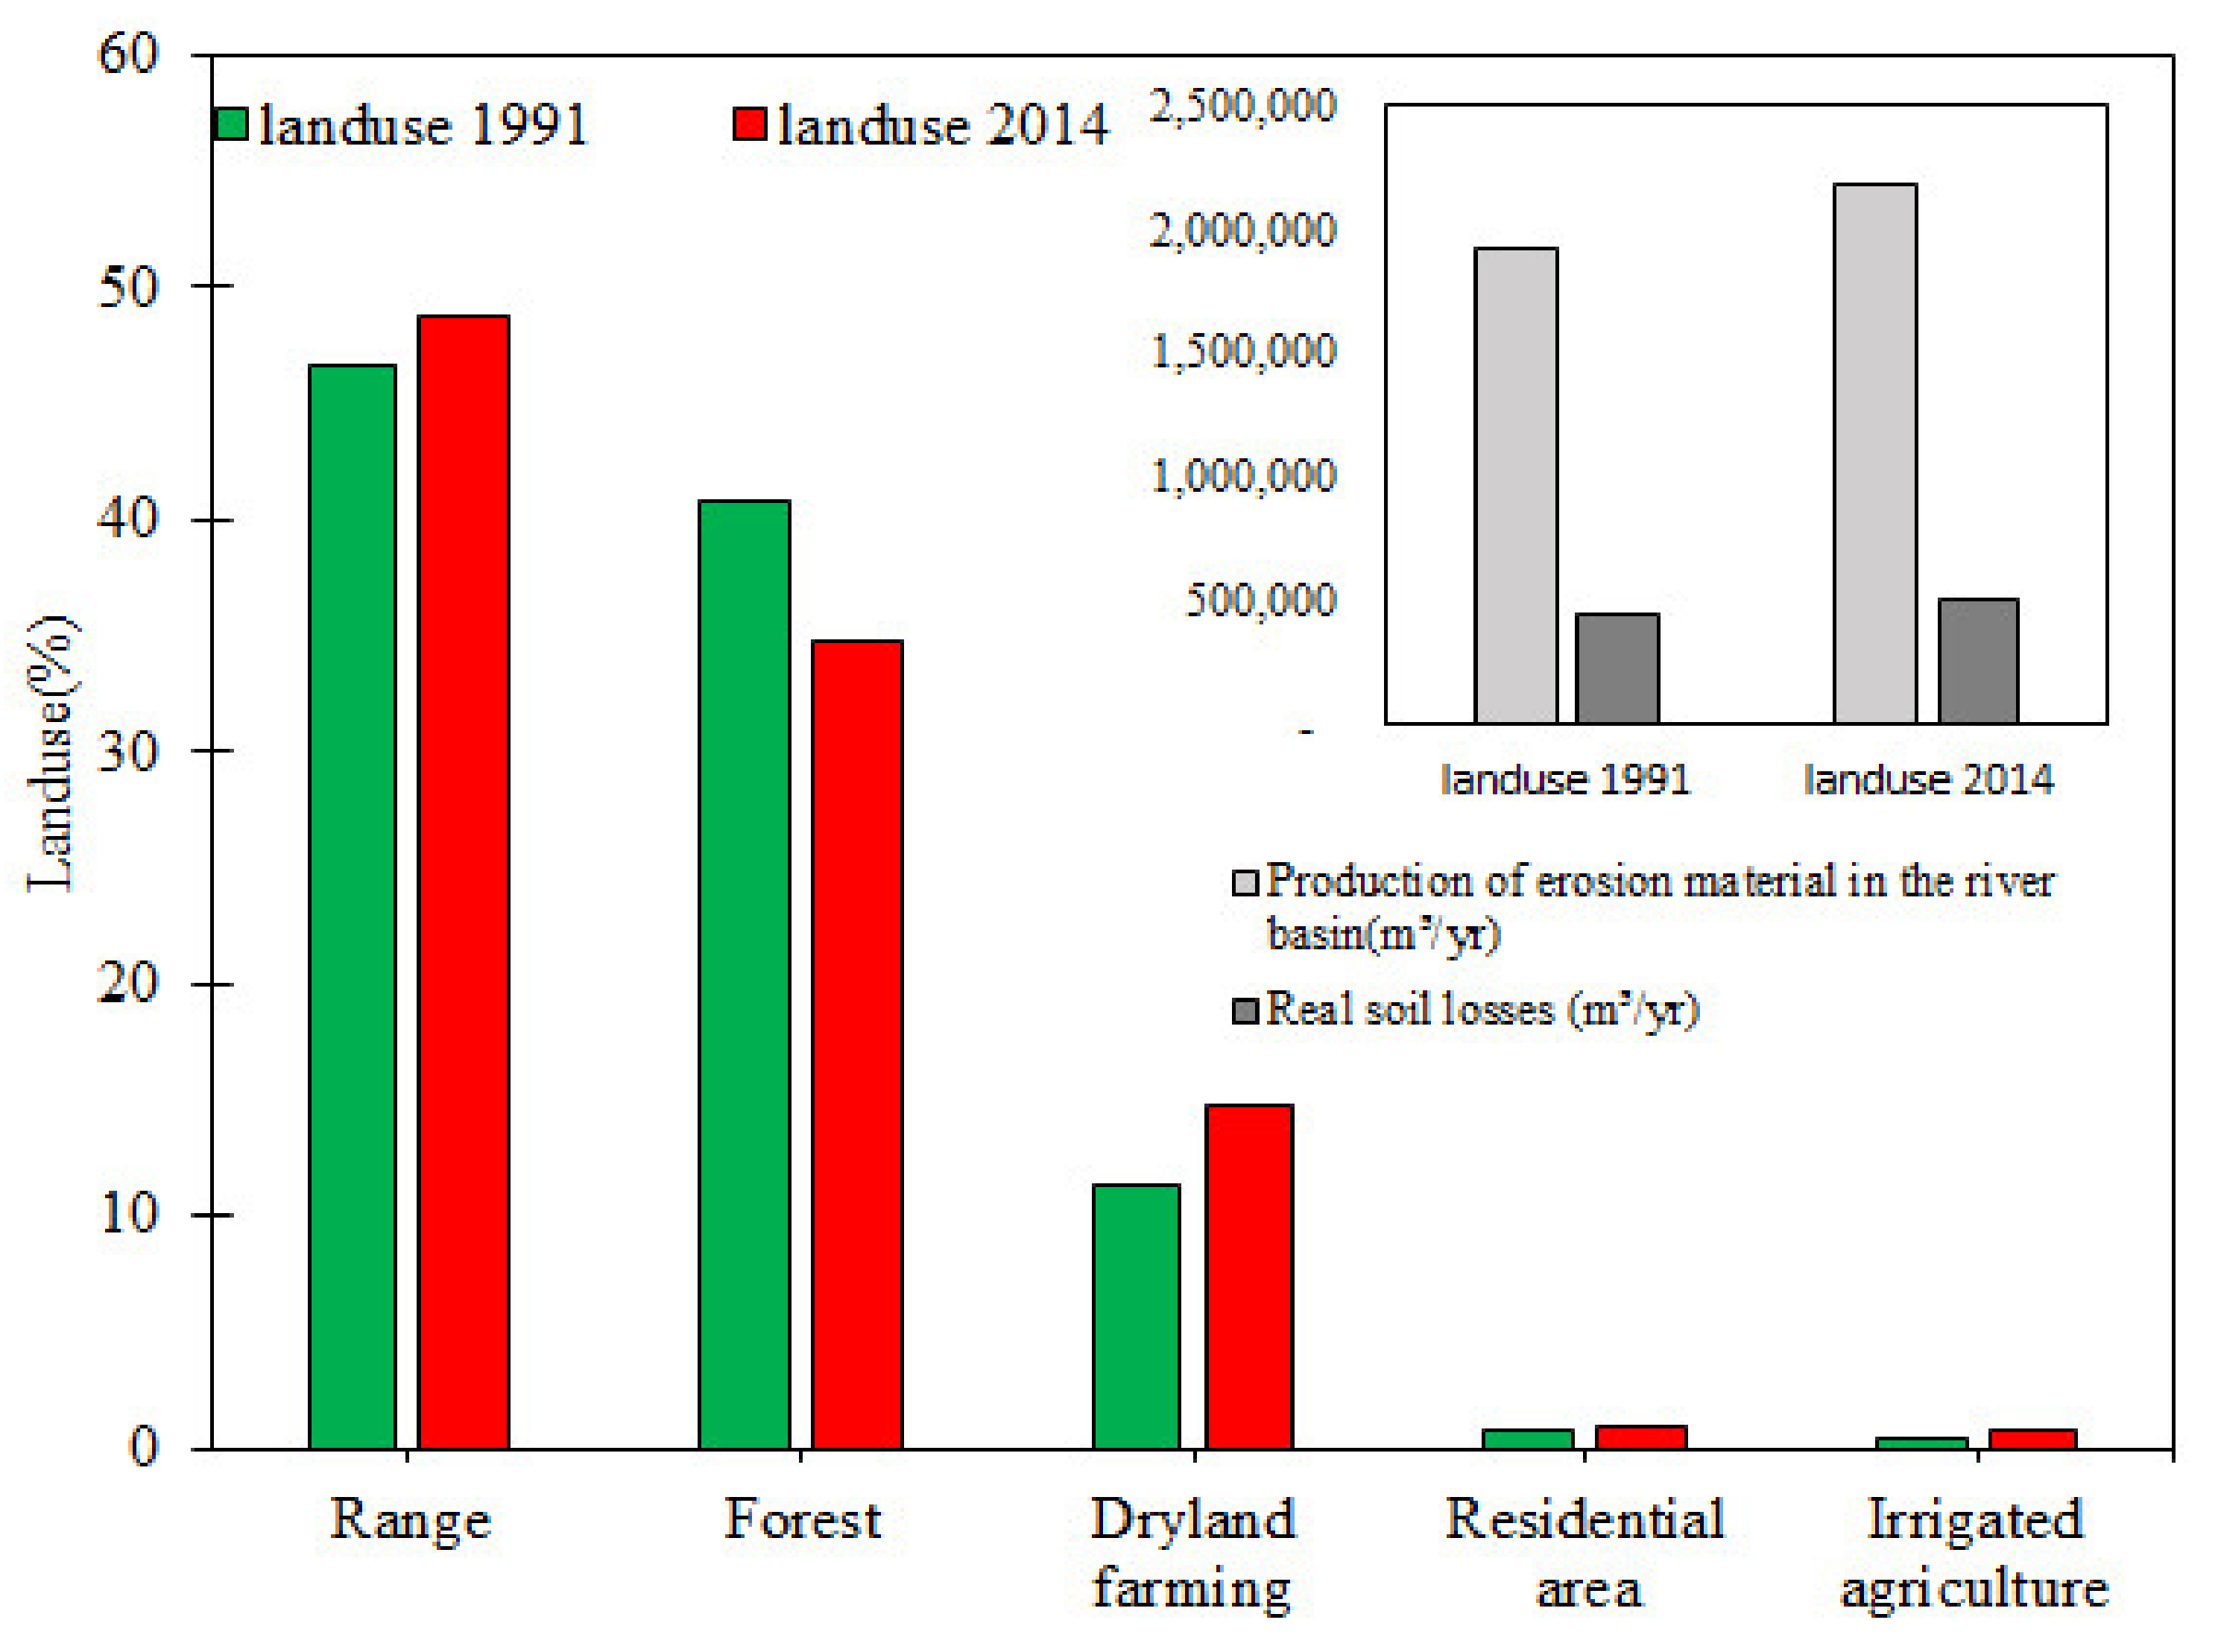
3.1. Land Use Changes (1991–2014)
3.2. Climatic Characteristics, Geological Structure, and Soil Characteristics of the Studied Area
3.3. Vegetation and Land Use
3.4. Soil Erosion and Runoff Characteristics
4. Conclusions
Author Contributions
Funding
Acknowledgments
Conflicts of Interest
References
- Eswaran, H.; Lal, R.; Reich, P.F. Land degradation: An overview. In Responses to Land Degradation; Oxford Press: New Delhi, India, 2001; pp. 20–35. [Google Scholar]
- Zabihi, M.; Mirchooli, F.; Motevalli, A.; Khaledi Darvishan, A.; Pourghasemi, H.R.; Zakeri, M.A.; Sadighi, F. Spatial modelling of gully erosion in Mazandaran Province, northern Iran. Catena 2018, 161, 1–13. [Google Scholar] [CrossRef]
- Khaledi Darvishan, A.; Homayounfar, V.; Sadeghi, S.H. The impact of standard preparation practice on the runoff and soil erosion rates under laboratory conditions. Solid Earth 2016, 7, 1293–1302. [Google Scholar] [CrossRef] [Green Version]
- Khaledi Darvishan, A.; Sadeghi, S.H.; Homaee, M.; Arabkhedri, M. Measuring sheet erosion using synthetic color-contrast aggregates. Hydrol. Processes 2014, 28, 4463–4471. [Google Scholar] [CrossRef]
- Turner, B.L.; Clark, W.C.; Kates, R.W.; Richards, J.F.; Mathews, J.T.; Meyer, W.B. The Earth as Transformed by Human Action; Cambridge University Press: Cambridge, UK, 1990. [Google Scholar]
- Dabral, P.P.; Baithuri, N.; Pandey, A. Soil erosion assessment in a hilly catchment of North Eastern India using USLE, GIS and remote sensing. Water Resour. Manag. 2008, 22, 1783–1798. [Google Scholar] [CrossRef]
- Kavian, A.; Gholami, L.; Mohammadi, M.; Spalevic, V.; Soraki, M.F. Impact of Wheat Residue on Soil Erosion Processes. Not. Bot. Horti Agrobot. Cluj-Napoca 2018, 46, 553–562. [Google Scholar] [CrossRef] [Green Version]
- Ferreira, V.; Panagopoulos, T.; Cakula, A.; Andrade, R.; Arvela, A. Predicting soil erosion after land use changes for irrigating agriculture in a large reservoir of southern Portugal. Agric. Agric. Sci. Procedia 2015, 4, 40–49. [Google Scholar] [CrossRef] [Green Version]
- Li, T.; Liu, K.; Ma, L.; Bao, Y.; Wu, L. Evaluation on Soil Erosion Effects Driven by Land Use Changes over Danjiang River Basin of Qinling Mountain. J. Nat. Resour. 2016, 4, 4. [Google Scholar]
- Wang, W.; Shao, Q.; Yang, T.; Peng, S.; Xing, W.; Sun, F.; Luo, Y. Quantitative assessment of the impact of climate variability and human activities on runoff changes: A case study in four catchments of the Haihe River basin, China. Hydrol. Processes 2013, 27, 1158–1174. [Google Scholar] [CrossRef]
- Spalevic, V.; Barovic, G.; Vujacic, D.; Curovic, M.; Behzadfar, M.; Djurovic, N.; Dudic, B.; Billi, P. The Impact of Land Use Changes on Soil Erosion in the River Basin of Miocki Potok, Montenegro. Water 2020, 12, 2973. [Google Scholar] [CrossRef]
- Parteli, E.J.; Da Silva, L.R.; Andrade, J.S., Jr. Self-organized percolation in multi-layered structures. J. Stat. Mech. Theory Exp. 2010, 2010, P03026. [Google Scholar] [CrossRef] [Green Version]
- Ghanbarian, B.; Sahimi, M.; Daigle, H. Modeling relative permeability of water in soil: Application of effective-medium approximation and percolation theory. Water Resour. Res. 2016, 52, 5025–5040. [Google Scholar] [CrossRef] [Green Version]
- Efthimiou, N.; Lykoudi, E.; Panagoulia, D.; Karavitis, C. Assessment of soil susceptibility to erosion using the EPM and RUSLE Models: The case of Venetikos River Catchment. Glob. NEST J. 2016, 18, 164–179. [Google Scholar]
- Panagoulia, D.; Zarris, D.; Maggina, K. An assessment of the interaction between storm events and sediment transport. In Proceedings of the 5th International Synposium on Ecohydraulics, Aguatic Habitats: Analysis & Restoration, Madrid, Spain, 12–17 September 2004; pp. 12–17. [Google Scholar]
- Lazzari, M.; Gioia, D.; Piccarreta, M.; Danese, M.; Lanorte, A. Sediment yield and erosion rate estimation in the mountain catchments of the Camastra artificial reservoir (Southern Italy): A comparison between different empirical methods. Catena 2015, 127, 323–339. [Google Scholar] [CrossRef]
- Prasannakumar, V.; Shiny, R.; Geetha, N.; Vijith, H. Spatial prediction of soil erosion risk by remote sensing, GIS and RUSLE approach: A case study of Siruvani river watershed in Attapady valley, Kerala, India. Environ. Earth Sci. 2011, 64, 965–972. [Google Scholar] [CrossRef]
- Gavrilovic, S. A method for estimating of the average annual quantity of sediments according to the potency of erosion. Bull. Fac. For. 1962, 26, 151–168. [Google Scholar]
- Gavrilovic, S. Engineering of Torrential Flows and Erosion; Izgradnja: Belgrade, Serbia, 1972; 272p. [Google Scholar]
- Blinkov, I.; Kostadinov, S. Applicability of various erosion risk assessment methods for engineering purposes. In Proceedings of the BALWOIS 2010 Conference-Ohrid, Republic of Macedonia, Ohrid, North Macedonia, 25–29 May 2010; pp. 25–29. [Google Scholar]
- Gholami, L.; Batista, P.; Behzadfar, A.; Khaledi Darvishan, A.; Behzadfar, M. Application of IntErO model for soil loss estimation case study: S7-1 Watershed of Shirindareh river basin, Iran. In Proceedings of the 7th International Agricultural Symposium “Agrosym 2016”, Jahorina, Bosnia and Herzegovina, 6–9 October 2016; pp. 2169–2177. [Google Scholar]
- Lenaerts, T. Geomorphological Mapping of Montenegro: Landform Genesis and Present Processes. Master’s Thesis, University of Gent, Faculty of Geography, Gent, Belgium, 2014; p. 128. [Google Scholar]
- Spalevic, V.; Curovic, M.; Borota, D.; Fustic, B. Soil erosion in the river basin Zeljeznica, area of Bar, Montenegro. Agric. For. 2012, 54, 5–24. [Google Scholar]
- Spalevic, V.; Curovic, M.; Simunic, I.; Behzadfar, M.; Tanaskovic, V. Land degradation, land use and soil erosion: The case of Montenegro. CIHEAM Watch Lett. Land Issues Mediterr. Ctries. 2014, 28, 58–62. [Google Scholar]
- Tavares, A.S.; Spalevic, V.; Avanzi, J.C.; Nogueira, D.A.; Silva, M.L.N.; Mincato, R.L. Modelling of water erosion by the erosion potential method in a pilot subbasin in southern Minas Gerais. Semin. Cienc. Agrar. Londrina 2019, 40, 555–572. [Google Scholar] [CrossRef] [Green Version]
- Spalevic, V.; Nyssen, J.; Curovic, M.; Lenaerts, T.; Kerckhof, A.; Annys, K.; den Branden, J.; Frankl, A. The impact of land use on soil erosion in the River Basin Boljanska Rijeka in Montenegro. In Proceedings of the 4th International Agricultural Symposium “Agrosym 2013”, Jahorina, Bosnia and Herzegovina, 3–6 October 2013; pp. 54–63. [Google Scholar]
- Spalevic, V.; Hübl, J.; Hasenauer, H.; Curovic, M. Calculation of soil erosion intensity in the Bosnjak Watershed, Polimlje River Basin, Montenegro. In Proceedings of the 5th International Agricultural Symposium “Agrosym 2014”, Jahorina, Bosnia and Herzegovina, 23–26 October 2014; pp. 730–738. [Google Scholar]
- Globevnik, L.; Holjevic, D.; Petkovsek, G.; Rubinic, J. Applicability of the Gavrilovic method in erosion calculation using spatial data manipulation techniques. Int. Assoc. Hydrol. Sci. Publ. 2003, 279, 224–233. [Google Scholar]
- Spalevic, V. Impact of Land Use on Runoff and Soil Erosion in Polimlje. Ph.D. Thesis, Faculty of Agriculture, University of Belgrade, Belgrade, Serbia, 2011; pp. 1–260. [Google Scholar]
- Chalise, D.; Kumar, L.; Spalevic, V.; Skataric, G. Estimation of Sediment Yield and Maximum Outflow Using the IntErO Model in the Sarada River Basin of Nepal. Water 2019, 11, 952. [Google Scholar] [CrossRef] [Green Version]
- Ouallali, A.; Aassoumi, H.; Moukhchane, M.; Moumou, A.; Houssni, M.; Spalevic, V.; Keesstra, S. Sediment mobilization study on Cretaceous, Tertiary and Quaternary lithological formations of an external Rif catchment, Morocco. Hydrol. Sci. J. 2020, 65, 1568–1582. [Google Scholar] [CrossRef]
- Mohammadi, M.; Khaledi Darvishan, A.; Bahramifar, N. Spatial distribution and source identification of heavy metals (As, Cr, Cu and Ni) at sub-watershed scale using geographically weighted regression. Int. Soil Water Conserv. Res. 2019, 7, 308–315. [Google Scholar] [CrossRef]
- Khaledi Darvishan, A.; Derikvandi, M.; Aliramaee, R.; Khorsand, M.; Spalevic, V.; Gholami, L.; Vujacic, D. Efficiency of IntErO Model to Predict Soil Erosion Intensity and Sediment Yield in Khamsan Representative Watershed (West of Iran). Agrofor Int. J. 2018, 3, 22–31. [Google Scholar] [CrossRef] [Green Version]
- Khaledi Darvishan, A.; Mohammadi, M.; Skataric, G.; Popovic, S.; Behzadfar, M.; Rodolfo Ribeiro Sakuno, N.; Luiz Mincato, R.; Spalevic, V. Assessment of soil erosion, sediment yield and maximum outflow, using IntErO model (Case study: S8-IntA Shirindarreh Watershed, Iran). Agric. For. 2019, 65, 203–210. [Google Scholar] [CrossRef]
- Behzadfar, A.; Guicardi, C.F.A.; Markoski, M.; Sakuno, R.B.N.; Mincato, L.R.; Moteva, M.; Tanaskovik, V. Calculation of Soil loss from the S7-3 Catchment of the Shirindareh Watershed, Iran using the River Basin Model. Agric. For. 2016, 62, 65–71. [Google Scholar] [CrossRef] [Green Version]
- Behzadfar, M.; Tazioli, A.; Vukelic-Shutoska, M.; Simunic, I.; Spalevic, V. Calculation of sediment yield in the S1—1 Watershed, Shirindareh Watershed, Iran. Agric. For. 2014, 60, 207–216. [Google Scholar]
- Barovic, G.; Silva, M.L.N.; Batista, P.V.G.; Vujacic, D.; Souza, S.W.; Avanzi Junior, C.; Behzadfar, M.; Spalevic, V. Estimation of sediment yield using the IntErO model in the S1-5 Watershed of the Shirindareh River Basin, Iran. Agric. For. 2015, 61, 233–243. [Google Scholar] [CrossRef] [Green Version]
- Yousefi, S.; Kivarz, N.; Ramezani, B.; Rasoolzadeh, N.; Naderi, N.; Mirzaee, S. An Estimation of Sediment by Using Erosion Potential Method and Geographic Information Systems in Chamgardalan Watershed: A Case Study of Ilam Province, Iran. Geodyn. Res. Int. Bull. 2014, 2, 34–41. [Google Scholar]
- Spalevic, V. Application of Computer-Graphic Methods in the Studies of Draining Out and Intensities of Ground Erosion in the Berane Valley. Master’s Thesis, Faculty of Agriculture of the University of Belgrade, Belgrade, Serbia, 1999; p. 135. [Google Scholar]
- Spalevic, V.; Dlabac, A.; Spalevic, B.; Fustic, B.; Popovic, V. Application of computer-Graphic methods in the research of runoff and intensity of ground erosion-I program “River basins”. Agric. For. 2000, 46, 19–36. [Google Scholar]
- De Vente, J.; Poesen, J. Predicting soil erosion and sediment yield at the basin scale: Scale issues and semi-quantitative models. Earth-Sci. Rev. 2005, 71, 95–125. [Google Scholar] [CrossRef]
- Efthimiou, N.; Lykoudi, E. Soil erosion estimation using the EPM model. In Proceedings of the 14th International Conference of the Geological Society of Greece, Thessaloniki, Greece, 25–27 May 2016; Volume L. [Google Scholar]
- Shahabi, H.; Salari, M.; Bin Ahmad, B.; Mohammadi, A. Soil Erosion Hazard Mapping in Central Zab Basin Using EPM Model in GIS Environment. Int. J. Geogr. Geol. 2016, 5, 224–235. [Google Scholar] [CrossRef]
- Noori, H.; Siadatmousavi, S.M.; Mojaradi, B. Assessment of sediment yield using RS and GIS at two sub-basins of Dez Watershed, Iran. Int. Soil Water Conserv. Res. 2016, 4, 199–206. [Google Scholar] [CrossRef] [Green Version]
- Kojchevska, T. EPM for Soil Loss Estimation in Different Geomorphologic Conditions and Data Conversion by Using GIS. Ph.D. Thesis, Mediterranean Agronomic Institute, Chania, Greece, 2014. [Google Scholar]
- Dragičević, N.; Karleuša, B.; Ožanić, N. A review of the Gavrilović method (erosion potential method) application. Građevinar 2016, 68, 715–725. [Google Scholar]
- Milanesi, L.; Pilotti, M.; Clerici, A.; Gavrilovic, Z. Application of an improved version of the Erosion Potential Method in Alpine areas. Ital. J. Eng. Geol. Environ. 2015, 1, 17–30. [Google Scholar]
- Gavrilovic, Z. Use of an empirical method (Erosion Potential Method) for calculating sediment production and transportation in unstudied or torrential streams. In International Conference on River Regime; Hydraulics Research Ltd.: Wallingford, UK, 1988; pp. 411–422. [Google Scholar]
- Staut, M. Recent Erosional Processes in the Catchment of the Dragonja River. Ph.D. Thesis, University of Ljubljana, Ljubljana, Slovenia, 2004. [Google Scholar]
- Afshar Harb, A.; Bolourchi, M.; Mehr Parto, M. Geological Quadrangle Map of Iran no. J5 (Bojnurd Sheet), Scale 1: 250,000; Geological Survey of Iran: Tehran, Iran, 1987. [Google Scholar]
- Dragičević, N.; Karleuša, B.; Ožanić, N. Erosion Potential Method (Gavrilović Method) Sensitivity Analysis. Soil Water Res. 2017, 12, 51–59. [Google Scholar] [CrossRef] [Green Version]
- Draganic, J.; Silva, M.L.N.; Avanzi, C.J.; Kisic, I.; Spalevic, V. Soil Loss Estimation using the IntErO Model in the S1-2 Watershed of the ShirinDareh River Basin, Iran. In Proceedings of the 9th Congress of the Soil Science Society of Bosnia and Herzegovina, Mostar, Bosnia and Herzegovina, 23–25 November 2015. [Google Scholar]
- Spalevic, V.; Barovic, G.; Batista, P.V.G.; Darvishan Khaledi, A.; Behzadfar, M.; Tanaskovik, V. Calculation of sediment yield at the S1-4 catchment of the Shirindareh Watershed of Iran using the Erosion Potential Model. In Proceedings of the 3rd WASWAC Conference, Belgrade, Serbia, 22–26 August 2016. [Google Scholar]
- Behzadfar, M.; Djurovic, N.; Simunic, I.; Filipovic, M.; Spalevic, V. Calculation of soil erosion intensity in the S1-6 Watershed of the Shirindareh River Basin, Iran. In Proceedings of the International Scientific Conference: Challenges in Modern Agricultural Production, Skopje, Macedonia, 11 December 2014. [Google Scholar]
- Kavian, A.; Mohammadi, M.; Gholami, L.; Rodrigo-Comino, J. Assessment of the Spatiotemporal Effects of Land Use Changes on Runoff and Nitrate Loads in the Talar River. Water 2018, 10, 445. [Google Scholar] [CrossRef] [Green Version]
- Khaleghi, M.R. The influence of deforestation and anthropogenic activities on runoff generation. J. For. Sci. 2017, 63, 245–253. [Google Scholar]
- Moeini, A.; Zarandi, N.K.; Pazira, E.; Badiollahi, Y. The relationship between drainage density and soil erosion rate: A study of five watersheds in Ardebil Province, Iran. WIT Trans. Ecol. Environ. 2015, 197, 129–138. [Google Scholar]
- Bolleli, T.M.; Lense, G.H.E.; Santana, D.B.; Moreira, R.S.; Sestras, P.; Spalevic, V.; Mincato, R.L. Estimates of soil losses in watershed under tropical of altitude climate in Brazil. Agric. For. 2020, 66, 73–88. [Google Scholar]
- Myronidis, D.; Arabatzis, G. Evaluation of Greek Post-Fire Erosion Mitigation Policy through Spatial Analysis. Pol. J. Environ. Stud. 2009, 18, 865–872. [Google Scholar]
- Khoi, D.N.; Suetsugi, T. Impact of climate and land-use changes on hydrological processes and sediment yield-a case study of the Be River catchment, Vietnam. Hydrol. Sci. J. 2014, 59, 1095–1108. [Google Scholar] [CrossRef]
- Kigira, F.K.; Gathenya, J.M.; Home, P.G. Modeling the Influence of Land Use/Land Cover changes on sediment yield and hydrology in Thika River catchment Kenya, using SWAT Model. In Proceedings of the 2007 JKUAT Scientific, Technological and Industrialisation Conference, Juja, Kenya, 25–26 October 2007. [Google Scholar]
- Myronidis, D.; Ioannou, K.; Sapountzis, S.; Fotakis, D. Development of a sustainable plan to combat erosion for an island of the Mediterranean region. Fresenius Environ. Bull. 2010, 19, 1694–1702. [Google Scholar]
- Dragicevic, N.; Karleusa, B.; Ozanic, N. Modification of erosion potential method using climate and land cover parameters. Nat. Hazards Risk 2018, 9, 1085–1105. [Google Scholar] [CrossRef] [Green Version]
- Gocić, M.; Dragićević, S.; Radivojević, A.; Martić Bursać, N.; Stričević, L.; Đorđević, M. Changes in Soil Erosion Intensity Caused by Land Use and Demographic Changes in the Jablanica River Basin, Serbia. Agriculture 2020, 10, 345. [Google Scholar] [CrossRef]
- Kostadinov, S.; Braunović, S.; Dragićević, S.; Zlatić, M.; Dragović, N.; Rakonjac, N. Effects of Erosion Control Works: Case Study-Grdelica Gorge, the South Morava River (Serbia). Water 2018, 10, 1094. [Google Scholar] [CrossRef] [Green Version]
- Rodrigo-Comino, J.; Keesstra, S.; Cerdà, A. Soil Erosion as an Environmental Concern in Vineyards: The Case Study of Celler del Roure, Eastern Spain, by Means of Rainfall Simulation Experiments. Beverages 2018, 4, 31. [Google Scholar] [CrossRef] [Green Version]
- Rodrigo-Comino, J.; Taguas, E.; Seeger, M.; Ries, J.B. Quantification of soil and water losses in an extensive olive orchard catchment in Southern Spain. J. Hydrol. 2018, 556, 749–758. [Google Scholar] [CrossRef]
- Feng, T.; Wei, W.; Chen, L.; Rodrigo-Comino, J.; Die, C.; Feng, X.; Ren, K.; Brevik, E.C.; Yu, Y. Assessment of the impact of different vegetation patterns on soil erosion processes on semiarid loess slopes. Earth Surf. Process. Landf. 2018, 43, 1860–1870. [Google Scholar] [CrossRef]
- Mohammadi, M.; Khaledi Darvishan, A.; Spalevic, V. Application of IntErO Model to Investigate the Effects of Land Use Changes on Soil Erosion and Sediment Yield in Talar Watershed, Northern Iran. In Book of Abstracts of the Green Room Sessions, Proceedings of the 2018 International GEA (Geo Eco-Eco Agro) Conference, Podgorica, Montenegro, 1–3 November 2018; Spalevic, V., Ed.; Faculty of Philosophy, University of Montenegro: Podgorica, Montenegro, 2018; p. 162. [Google Scholar]


| Inputs | Amount and Unit |
|---|---|
| River basin areas (F) | 2055.75 km2 |
| The length of the watershed (O) | 102.69 km |
| The area of the bigger river basin part (Fv) | 1188.01 km2 |
| The area of the smaller river basin part (Fm) | 867.73 km2 |
| Natural length of the main watercourse (Lv) | 102.6 km |
| Length of the contours/isohyets (liz) | 8921 km |
| Altitude of the first contour line | 300 m |
| Incidence (Up) | 100 years |
| The lowest river basin elevation | 213 m |
| The highest river basin elevation | 4003 m |
| A part of the river basin consisted of a very permeable products from rocks(fp) | 0.114 |
| A part of the river basin area consisted of medium permeable rocks (fpp) | 0.883 |
| A part of the river basin consisted of poor water permeability rocks (f0) | 0.003 |
| A part of the river basin under forests (fs) | 0.337 |
| A part of the river basin under grass, meadows, pastures, and orchards (ft) | 0.494 |
| A part of the river basin under bare land, plough-land, and ground without grass vegetation (fg) | 0.169 |
| The total length of the main watercourse with tributaries of I and II class | 1574.32 km |
| The shortest distance between the fountainhead and mouth(Lm) | 18.78 km |
| The volume of the torrent rain (hb) | 50.7 mm |
| Average annual air temperature (t0) | 17.0 °C |
| Average annual precipitation (H year) | 729.2 mm |
| Coefficient of Soil Cover | X Value |
|---|---|
| Areas Without Vegetal Cover (Bare Land, Building Area, Water) | 0.8–0.9 |
| Crop Fields, Meadows, Grasslands | 0.6–0.8 |
| Built-up Areas and Crops, Degraded Shrublands | 0.4–0.6 |
| Arboricultural Lands, Clear Shrublands | 0.2–0.4 |
| Reforested Areas, Dense Forests, Dense Shrublands | 0.05–0.2 |
| Coefficient of Soil Resistance | Y Value |
| Marls, Clays, Poorly Consolidated Sands, Rock With Little Resistance | 1.3–1.7 |
| Weak Rock, Clayey Pelites With Microbereccia Beds, Recent Quaternary Scree | 1–1.3 |
| Rock With Moderate Erosion Resistance, Quaternary Fluvial Terraces | 0.6–1 |
| Hard Rock, Sandstone of the Numidian Nappe | 0.5–0.6 |
| Coefficient of Type and Extent of Erosion | Φ Value |
| Deep Ravines, Landslides, Badlands Areas, and Bank Undercutting | 0.8–0.9 |
| Sheet Erosion, Less than 50% of the Basin Area With Rill and Gullies Erosion | 0.6–0.7 |
| 20% of the Area Attacked by Surface Erosion, Minor Slips in Stream Channels | 0.3–0.5 |
| Land Surface Without Visible Erosion, Mostly Crop Fields | 0.1–0.2 |
| Land Use Type | Land Use 1991 | Land Use 2014 | Changes (1991–2014) | |||
|---|---|---|---|---|---|---|
| Area (ha) | Percent | Area (ha) | Percent | Area (ha) | Percent | |
| Forest | 83,902.75 | 40.82 | 71,424.71 | 34.79 | −12,478.04 | −6.03 |
| Irrigated agriculture | 1017.82 | 0.49 | 1493.82 | 0.72 | +476.00 | +0.23 |
| Rainfed agriculture | 23,272.06 | 11.32 | 30,520.31 | 14.81 | +7248.25 | +3.49 |
| Rangeland | 95,826.45 | 46.61 | 100,307.50 | 48.79 | +4481.05 | +2.18 |
| Residential area | 1563.77 | 0.76 | 1837.72 | 0.89 | +273.95 | +0.13 |
| Num | Description | Class | Area (ha) |
|---|---|---|---|
| 1 | Alternation of dolomite, limestone, and variegated shale | 2 | 50.7 |
| 2 | Basaltic volcanic tuff | 3 | 6.9 |
| 3 | Conglomerate and sandstone | 2 | 3.0 |
| 4 | Conglomerate, sandstone, and shale with plantremains and coal seams | 2 | 19.4 |
| 5 | Dark grey medium—bedded to massive limestone | 2 | 14.7 |
| 6 | Dark grey shale and sandstone | 2 | 936.3 |
| 7 | High level piedmont fan and valley terrace deposits | 1 | 16.0 |
| 8 | Hyporite bearing limestone | 1 | 16.1 |
| 9 | Light-red coarse grained, polygenic conglomerate with sandstone intercalations | 2 | 6.1 |
| 10 | Light grey, thin—bedded to massive limestone | 2 | 135.3 |
| 11 | Light—red to brown marl and gypsiferous marl with sandstone intercalations | 2 | 0.5 |
| 12 | Low level piedmont fan and valley terrace deposits | 1 | 8.0 |
| 13 | Marl, calcareous sandstone, sandy limestone, and minor conglomerate | 2 | 156.0 |
| 14 | Marl, gypsiferous marl and limestone | 2 | 197.1 |
| 15 | Nummulitic limestone | 2 | 10.7 |
| 16 | Polymictic conglomerate and sandstone | 2 | 120.7 |
| 17 | Red conglomerate and sandstone | 2 | 1.4 |
| 18 | Red marl, gypsiferous marl, sandstone, and conglomerate | 2 | 6.1 |
| 19 | Swamp and marsh | 1 | 1.1 |
| 20 | Thick—bedded to massive limestone | 2 | 13.2 |
| 21 | thick bedded grey o’olitic limestone; thin—platy, yellow to pinkish shaly limestone with worm tracks and well to thick—bedded dolomite and dolomitic limestone | 2 | 62.3 |
| 22 | Thick bedded to massive, white to pinkish orbitolina bearing limestone | 2 | 41.9 |
| 23 | Undifferentiated limestone, shale, and marl | 2 | 13.9 |
| 24 | Undifferentiated lower Paleozoic rocks | 1 | 27.0 |
| 25 | Undifferentiated unit, composed of dark red micaceous siltstone and sandstone | 2 | 16.6 |
| 26 | Upper cretaceous, undifferentiated rocks | 1 | 78.7 |
| 27 | Well—bedded to thin—bedded, greenish—grey argillaceous limestone with intercalations of calcareous shale | 2 | 8.4 |
| 28 | Well bedded green tuff and tuffaceous shale | 1 | 87.7 |
| Types of Soil Products and Related Types | Y | Area (%) |
|---|---|---|
| Sands, gravel, and loose soils | 2.00 | 1.17 |
| Loess, tuffs, saline, steppe soils | 1.60 | 0.00 |
| Disintegrated limestone and marl | 1.20 | 11.3 |
| Serpentine soil, red sandstones, flysch deposits | 1.10 | 2.66 |
| Podzols and parapodzols, disintegrated shales | 1.00 | 0.00 |
| Compact and shaley limestone, red soils, and humus silicate soils | 0.90 | 45.16 |
| Eutric cambisols and mountain soils | 0.80 | 33.33 |
| Vertisols, boggy ploughand and marsh soils | 0.60 | 0.00 |
| Chernozem and alluvial sediments of good structure | 0.50 | 1.16 |
| Bare, compact eruptives | 0.25 | 2.23 |
| Types of Land Use | Xa | Area (%) |
| Bare land | 1.00 | 1.72 |
| Plough land | 0.90 | 16.43 |
| Orchards and vineyards | 0.70 | 0.00 |
| Mountain pastures | 0.60 | 48.15 |
| Meadows | 0.40 | 0.00 |
| Degraded forests | 0.60 | 13.70 |
| Forests of good spacing | 0.05 | 20.00 |
| Erosion Conditions | Φ | Area (%) |
| Deep erosion | 1.00 | 2.02 |
| 80% of basin under rill and gully erosion | 0.90 | 3.03 |
| 50% of basin under rill and gully erosion | 0.80 | 6.06 |
| 100% of basin under surface erosion | 0.70 | 8.08 |
| 100% of basin under surface erosion without visible rills, gullies, and landslides | 0.60 | 15.15 |
| 50% of basin under surface erosion | 0.50 | 8.08 |
| 20% of basin under surface erosion | 0.30 | 8.08 |
| Minor slides in watercourses beds | 0.20 | 1.01 |
| Basin mostly under ploughland | 0.15 | 14.14 |
| Basin under forests and perennial vegetation | 0.10 | 34.34 |
| Output Variables | Amount and Unit (1991) | Amount and Unit (2014) |
|---|---|---|
| Coefficient of the river basin form | 0.2 | 0.2 |
| Coefficient of the watershed development | 0.63 | 0.63 |
| Average river basin width | 29.88 km | 29.88 km |
| (A) symmetry of the river basin | 0.31 | 0.31 |
| Density of the river network of the basin | 0.77 | 0.77 |
| Coefficient of the river basin tortuousness | 5.4 | 5.4 |
| Average river basin altitude | 1807.87 m | 1807.87 m |
| Average elevation difference of the river basin | 1594.87 m | 1594.87 m |
| Average river basin decline | 43.4 | 43.4% |
| The height of the local erosion base of the river basin | 3790 m | 3790 m |
| Coefficient of the erosion energy of the river basin’s relief | 179.16 | 179.16 |
| Coefficient of the region’s permeability | 0.67 | 0.67 |
| Coefficient of the vegetation cover | 0.74 | 0.77 |
| Analytical presentation of the water retention in inflow | 0.5507 m | 0.5507 m |
| Energetic potential of water flow during torrent rains | 8020.44 m km s | 8020.44 m km s |
| Maximum flow discharge (Q100) | 432.14 m3 s−1 | 446.91 m3 s−1 |
| Temperature coefficient of the region | 1.34 | 1.34 |
| Coefficient of the river basin erosion | 0.452 | 0.492 |
| Production of erosion material in the river basin | 1,918,186 m3 yr−1 | 2,183,558 m3 yr−1 |
| Coefficient of the deposit retention | 0.23 | 0.23 |
| Real soil losses per year | 440,482.4 m3 yr−1 | 501,421.3 m3 yr−1 |
| Real soil losses per year per km2 | 214.27 m3 km−2 yr−1 | 243.91 m3 km−2 yr−1 |
Publisher’s Note: MDPI stays neutral with regard to jurisdictional claims in published maps and institutional affiliations. |
© 2021 by the authors. Licensee MDPI, Basel, Switzerland. This article is an open access article distributed under the terms and conditions of the Creative Commons Attribution (CC BY) license (http://creativecommons.org/licenses/by/4.0/).
Share and Cite
Mohammadi, M.; Khaledi Darvishan, A.K.; Spalevic, V.; Dudic, B.; Billi, P. Analysis of the Impact of Land Use Changes on Soil Erosion Intensity and Sediment Yield Using the IntErO Model in the Talar Watershed of Iran. Water 2021, 13, 881. https://doi.org/10.3390/w13060881
Mohammadi M, Khaledi Darvishan AK, Spalevic V, Dudic B, Billi P. Analysis of the Impact of Land Use Changes on Soil Erosion Intensity and Sediment Yield Using the IntErO Model in the Talar Watershed of Iran. Water. 2021; 13(6):881. https://doi.org/10.3390/w13060881
Chicago/Turabian StyleMohammadi, Maziar, Abdulvahed Khaledi Khaledi Darvishan, Velibor Spalevic, Branislav Dudic, and Paolo Billi. 2021. "Analysis of the Impact of Land Use Changes on Soil Erosion Intensity and Sediment Yield Using the IntErO Model in the Talar Watershed of Iran" Water 13, no. 6: 881. https://doi.org/10.3390/w13060881