
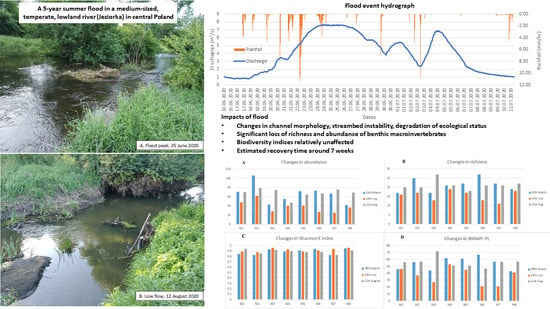
Effect of a Summer Flood on Benthic Macroinvertebrates in a Medium-Sized, Temperate, Lowland River

 ,
,
Abstract
:
1. Introduction
2. Materials and Methods
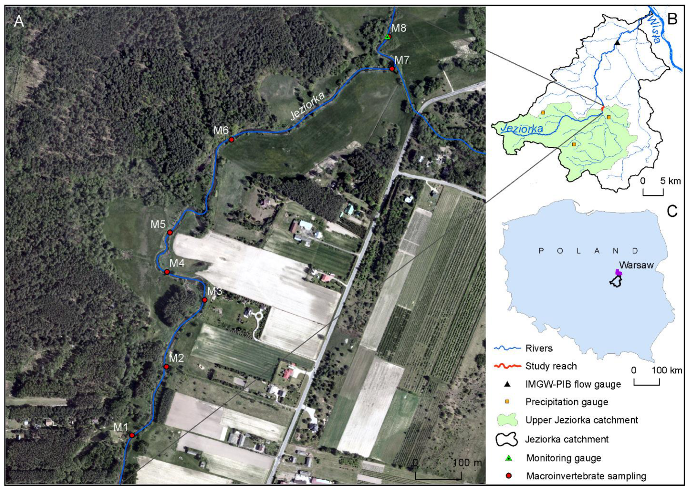
2.1. Study Area
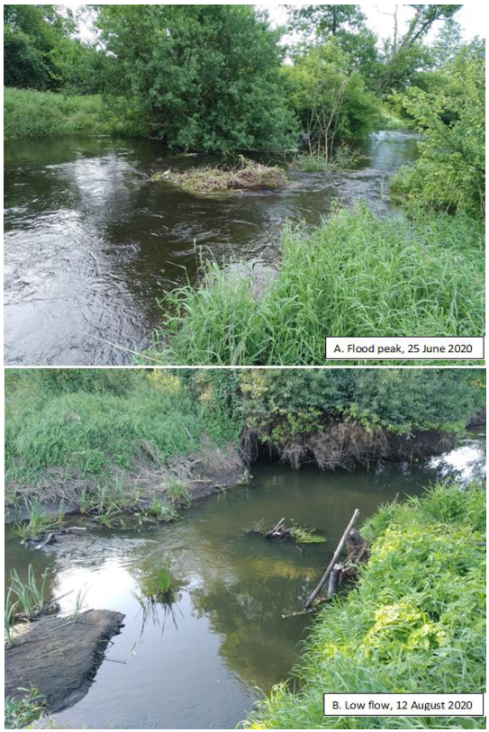
2.2. Flood Event
2.3. Environmental Monitoring
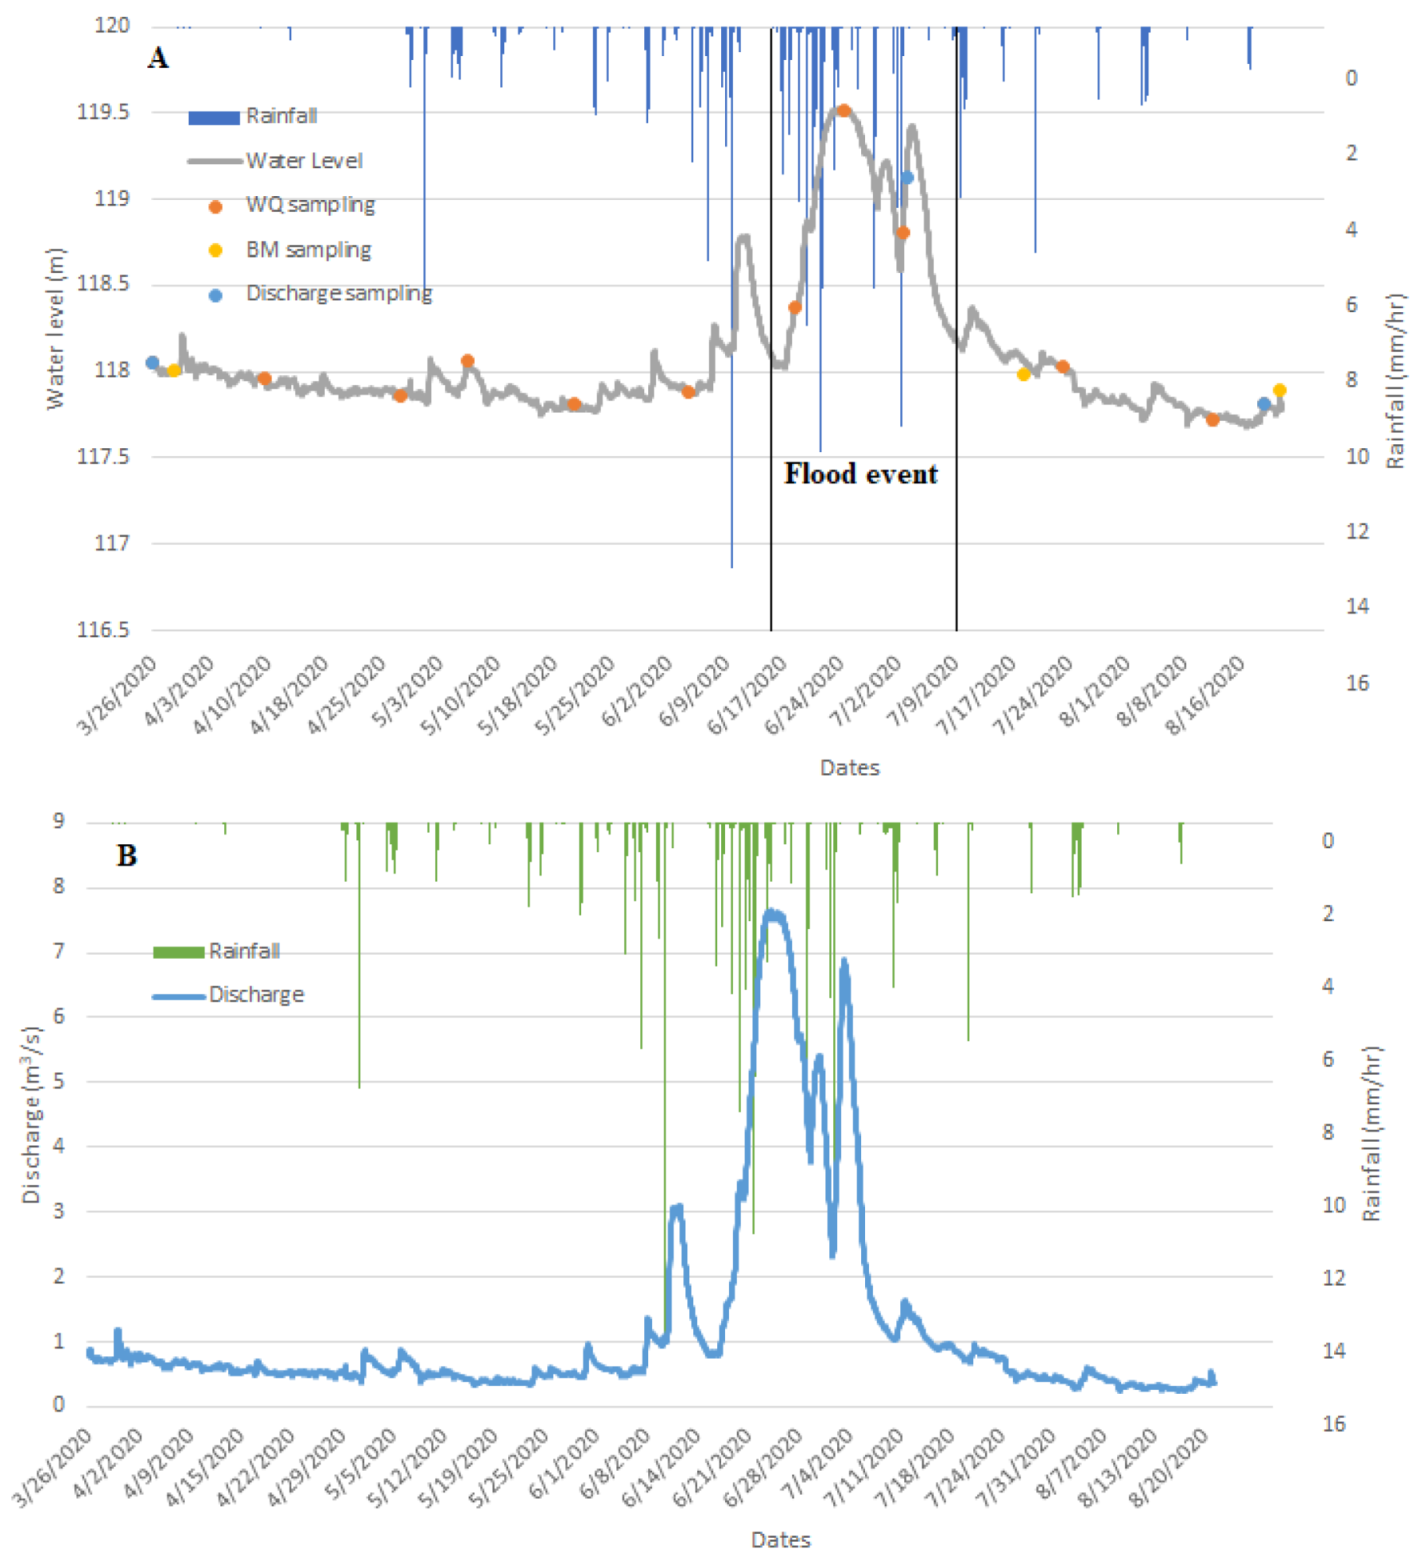
2.3.1. Hydrological Monitoring
2.3.2. Water Quality Monitoring
2.3.3. Monitoring of Benthic Macroinvertebrates
2.4. Data Analysis
2.4.1. Hydrological Variation
2.4.2. Bed Stability Estimation
- d50 = median particle diameter (m)
- d90 = 90% particle diameter (m)
- h = mean water depth (m)
2.4.3. Analysis of BM Indices
3. Results
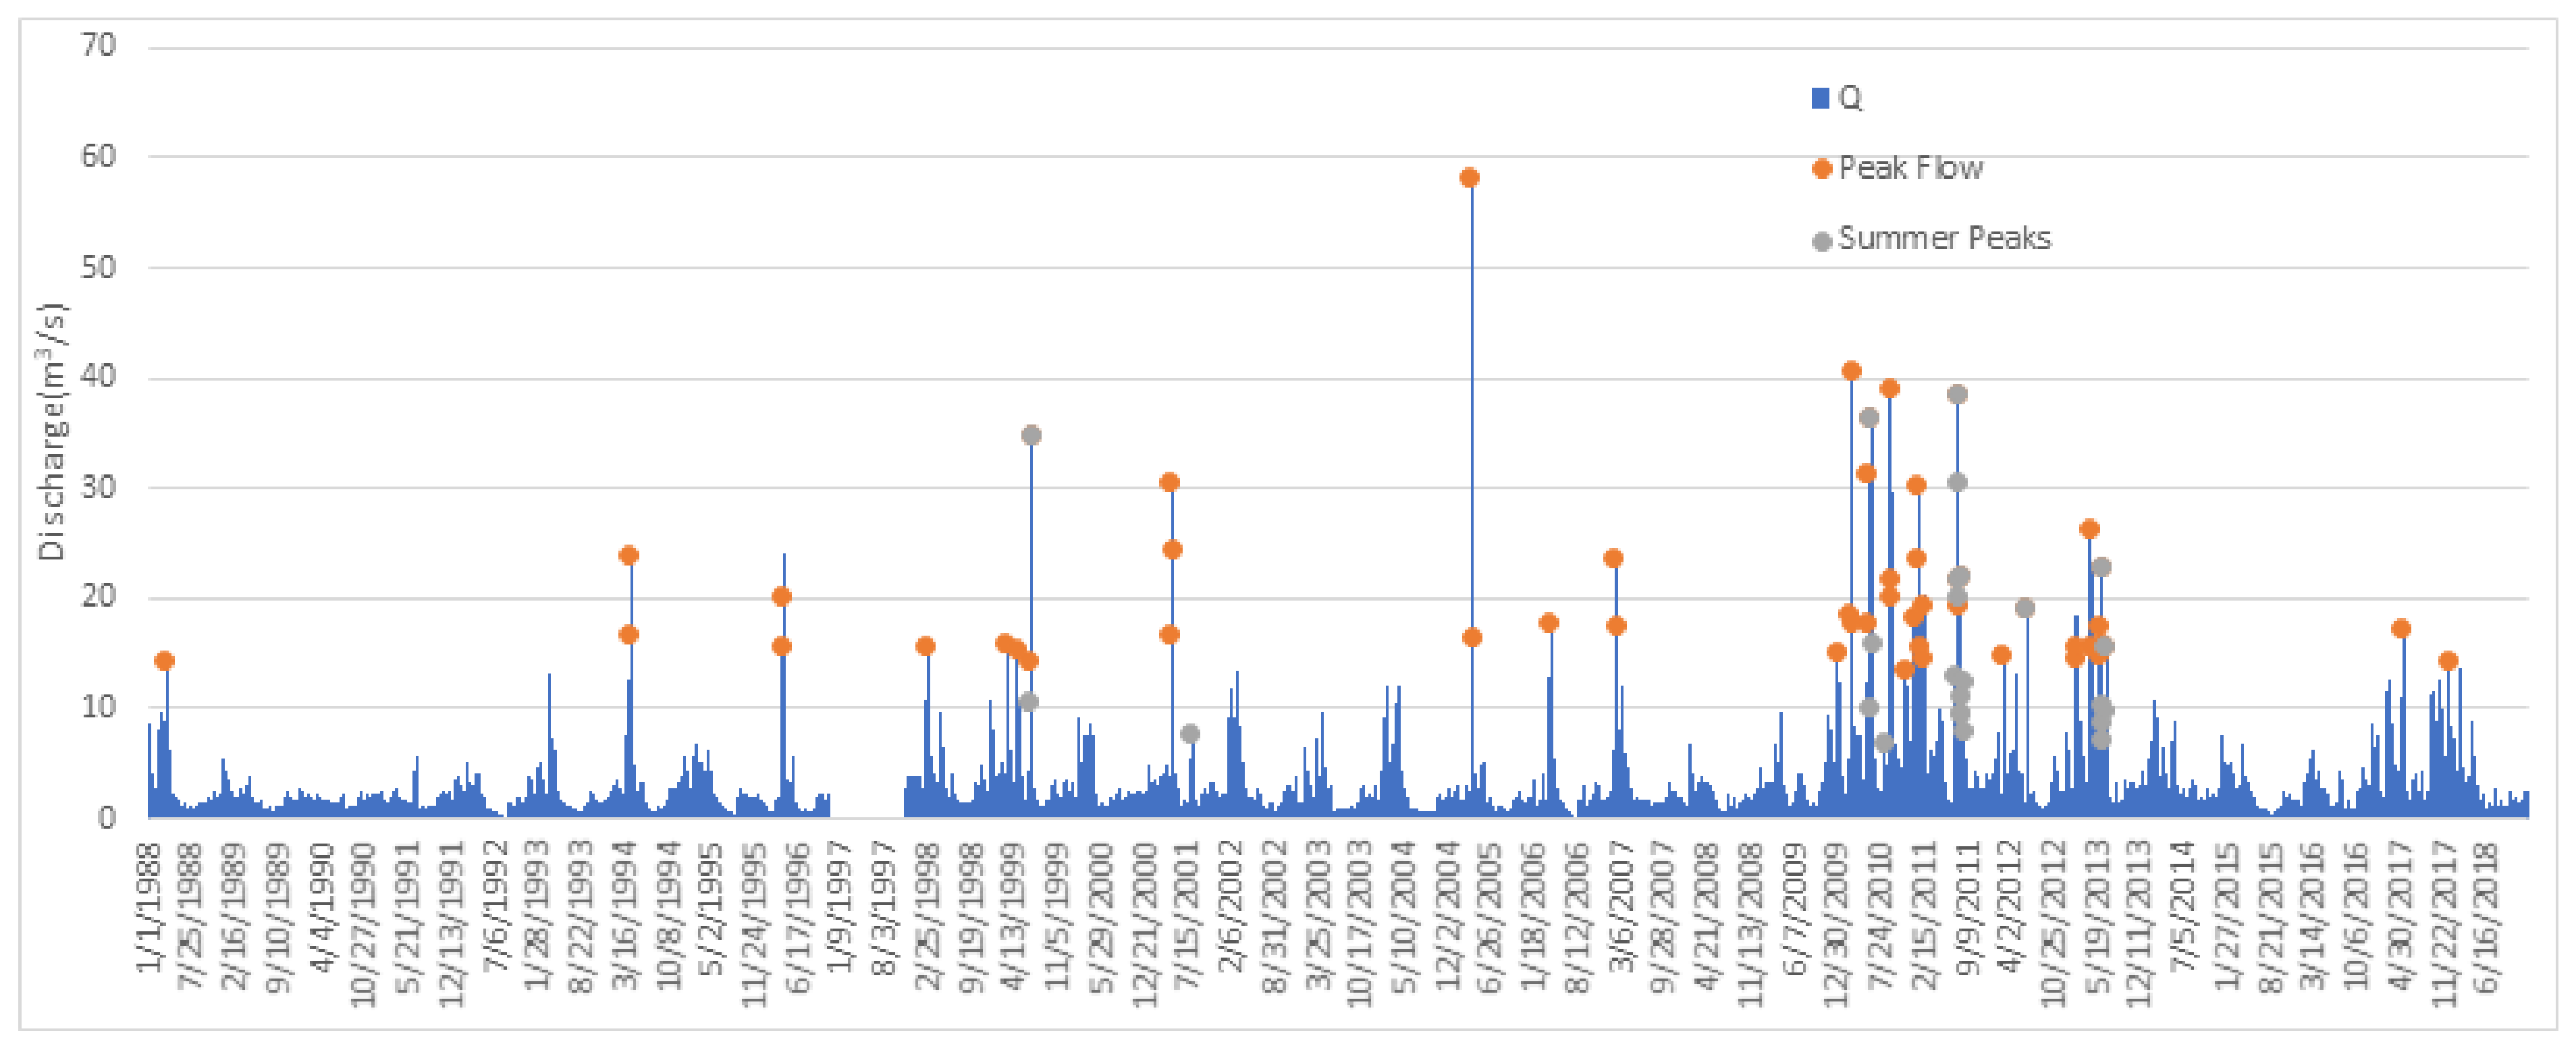
3.1. Flood Frequency Analysis (FFA)
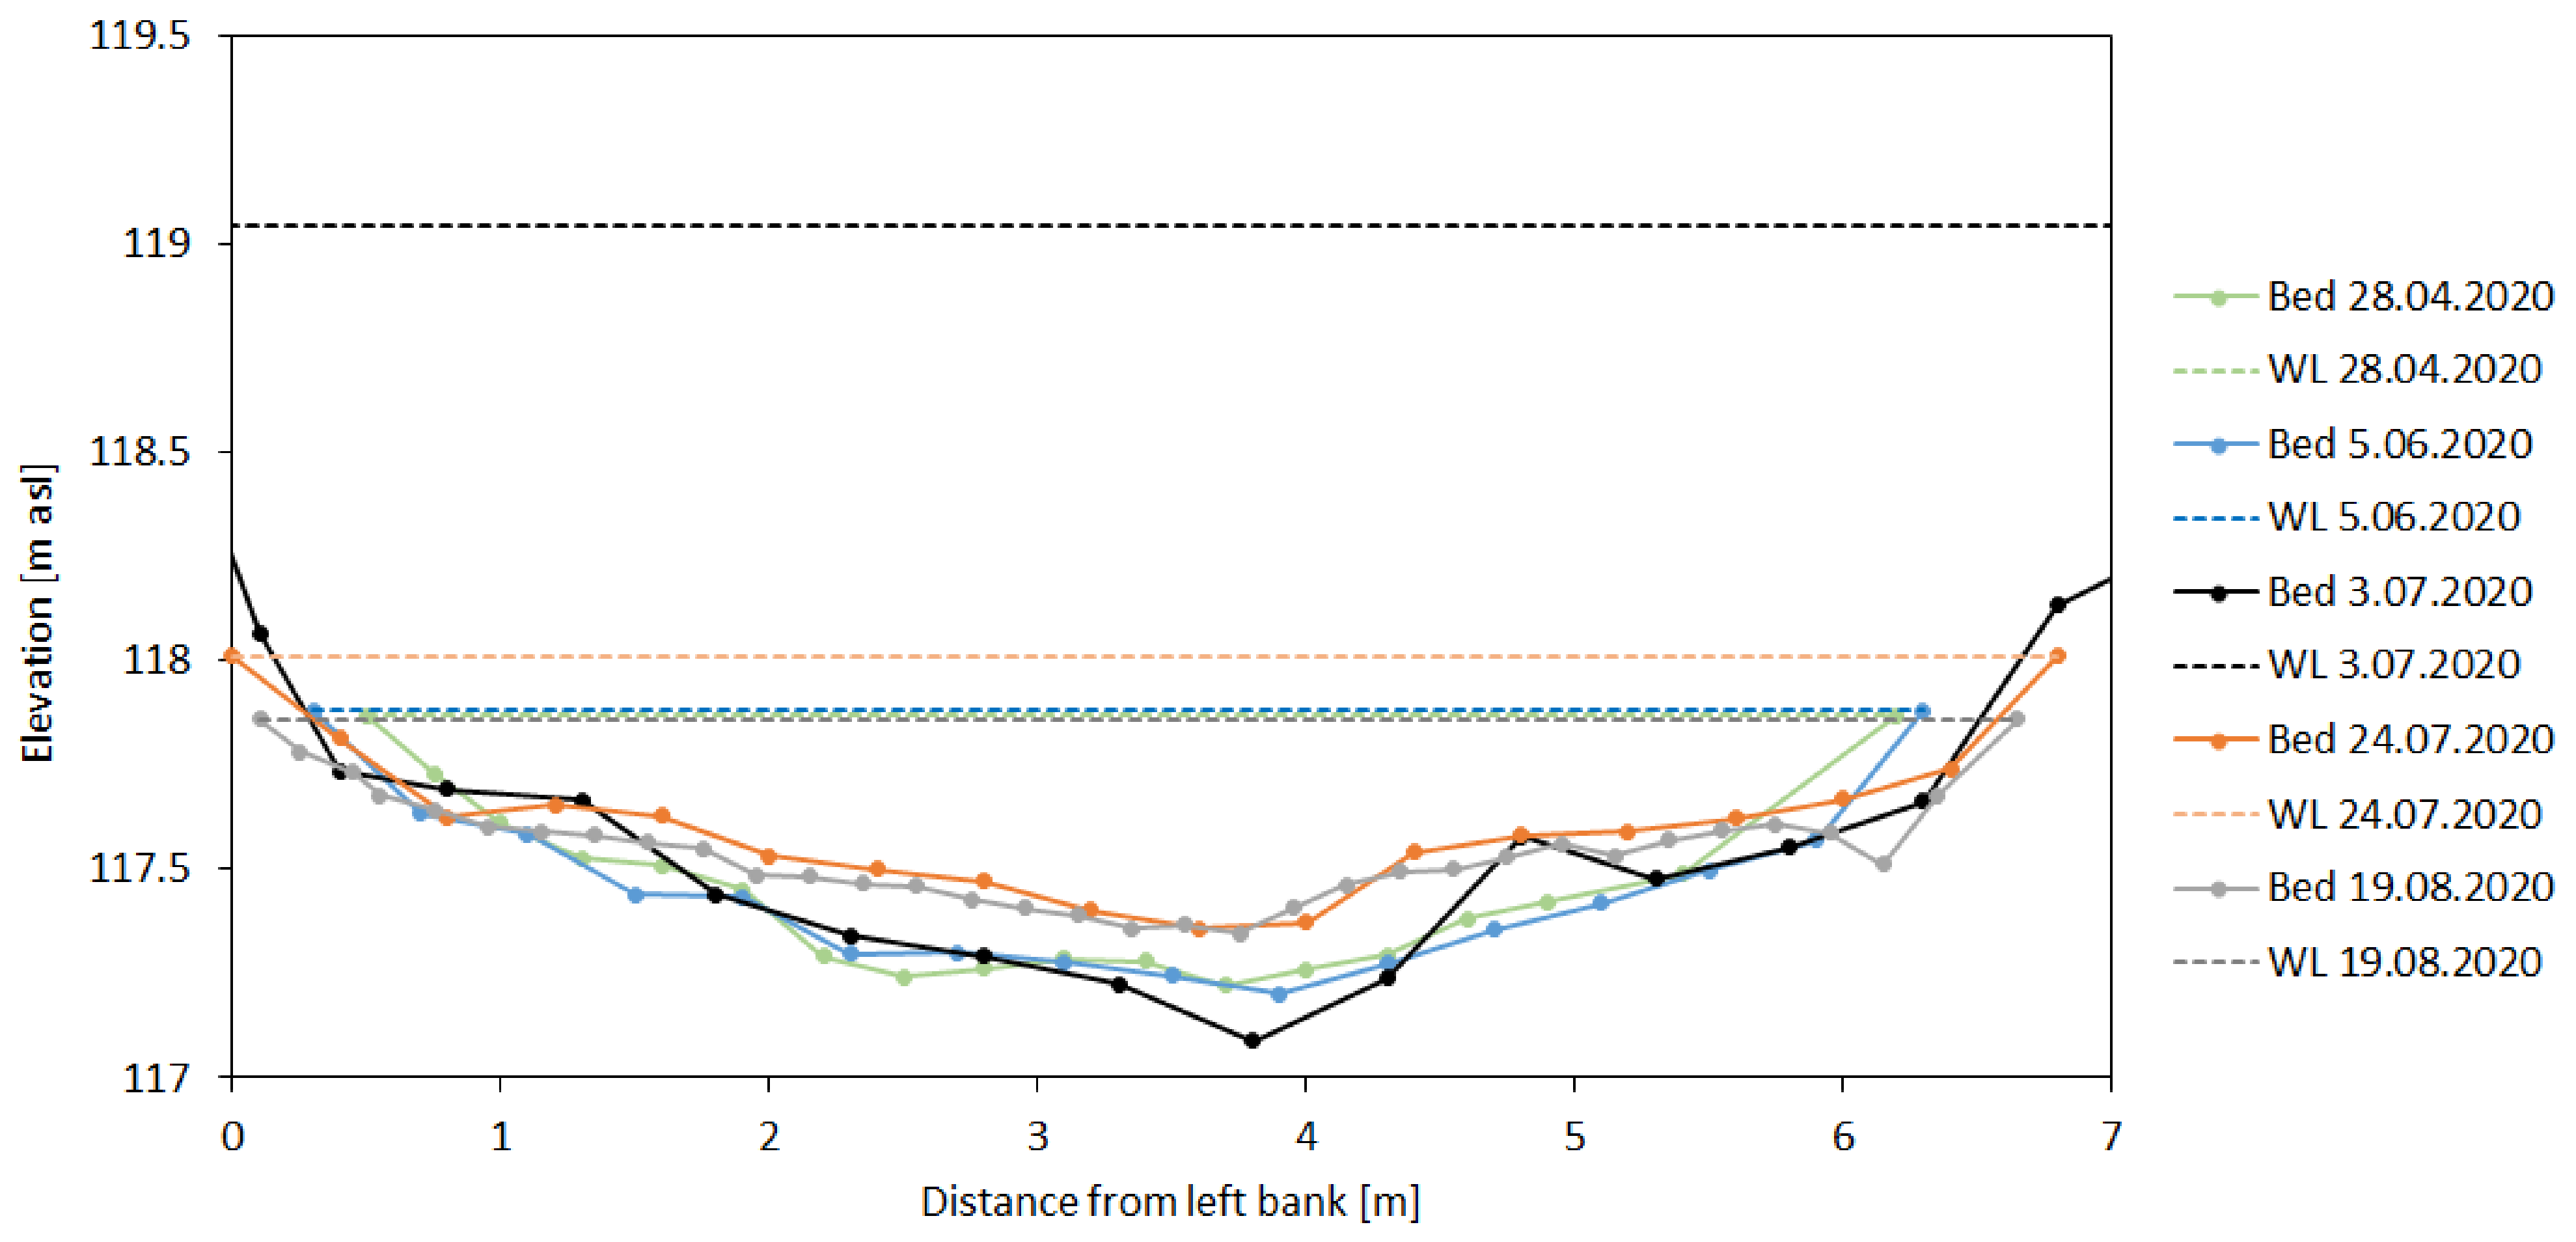
3.2. Assessment of Bed Stability
3.3. Changes in Water Quality
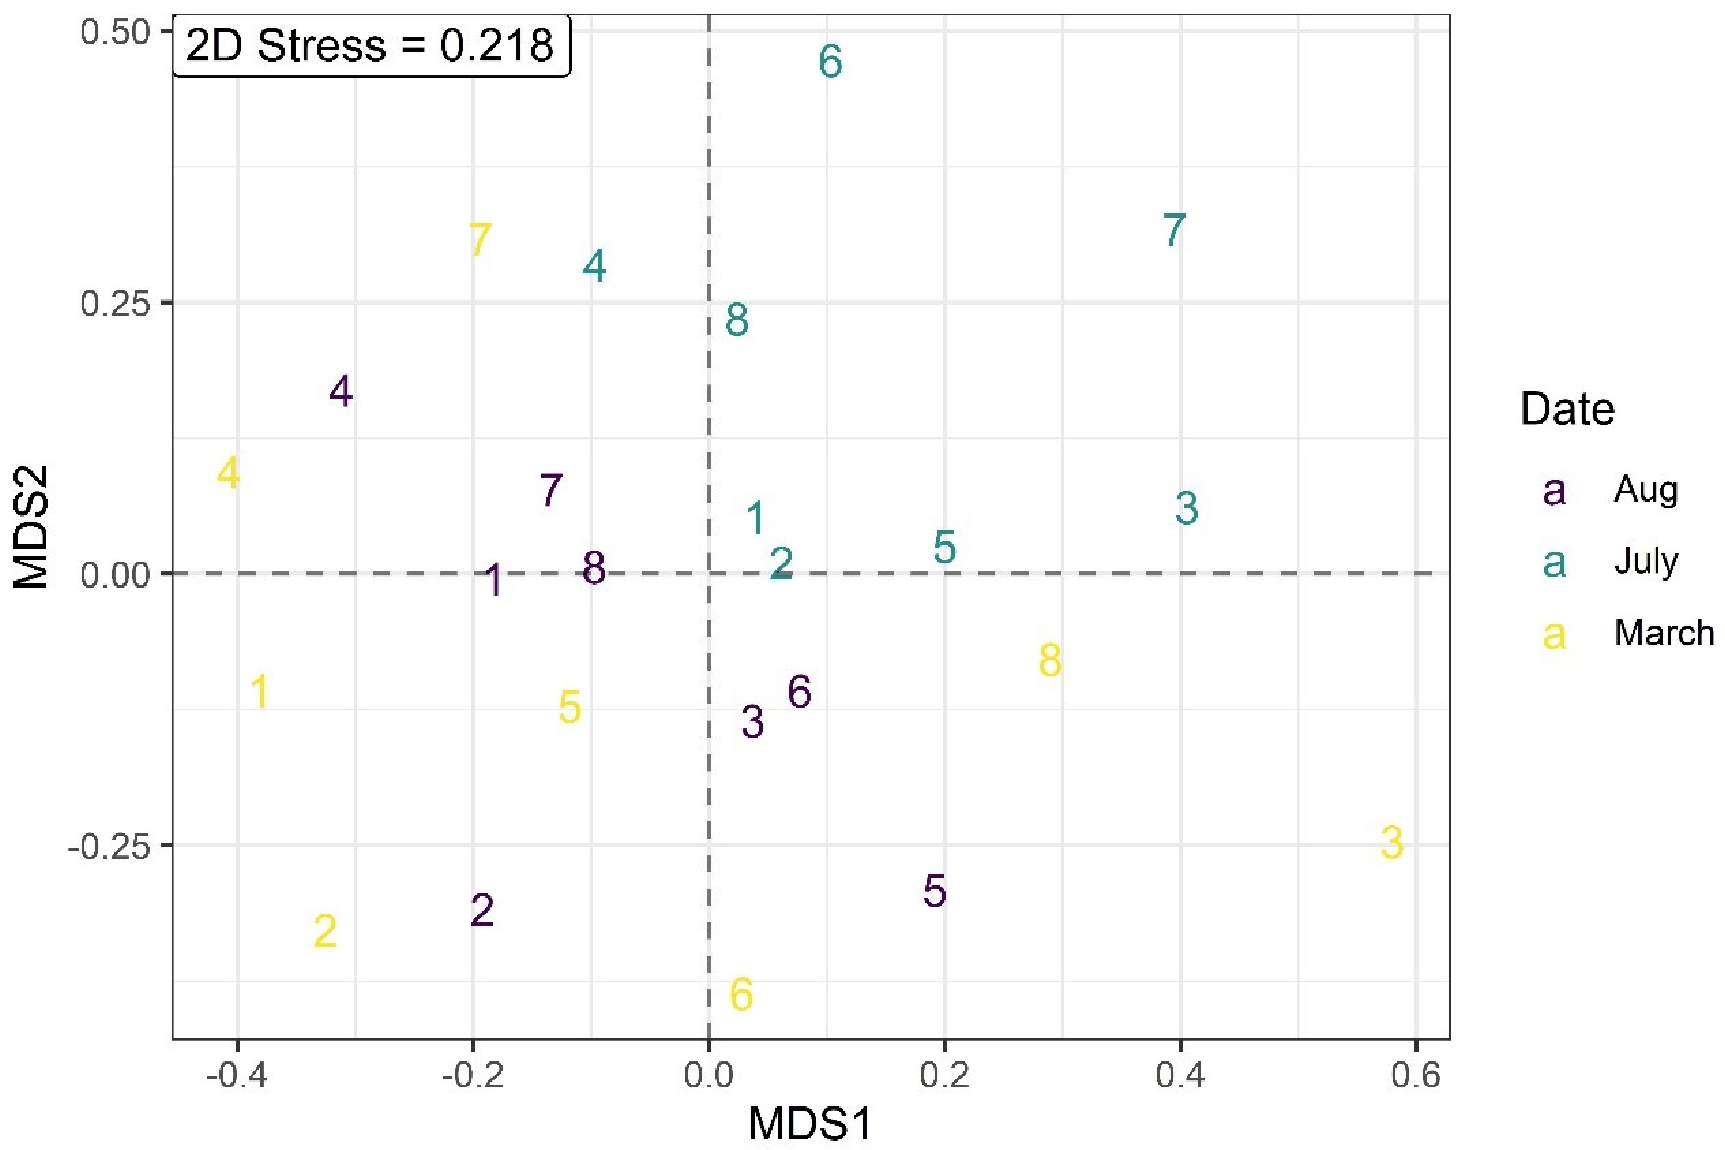
3.4. Changes in BM Community
4. Discussion
5. Conclusions
- (1)
- Taxa abundance and richness, as well as the ecological status of the reach measured by the BMWP-PL index, declined substantially following the flood, while no significant changes in Shannon evenness and Simpson diversity indices were observed.
- (2)
- Community composition was strongly affected, but taxon-specific responses to the flood event were diverse. The least resistant taxa belonged to Gastropoda and Coleoptera, whereas Cheumatopsyche lepida and Chironomus sp. exhibited the highest resistance.
- (3)
- The BM community recovered after the flood relatively quickly, as evidenced by sampling carried out 7 weeks after the flood peak, which suggests that most taxa showed high resilience to flood.
- (4)
- The studied water quality parameters exhibited diverse responses during the flood. The most apparent ones were a decline in DO, pH, and NH4-N and an increase in NO3-N.
- (5)
- Stream velocities exceeding critical velocity during the flood led to channel bed instability and increased bedload transport, as well as to a permanent modification of bed morphology as documented by depth sampling during discharge measurements.
Supplementary Materials
Author Contributions
Funding
Institutional Review Board Statement
Informed Consent Statement
Data Availability Statement
Acknowledgments
Conflicts of Interest
References
- Chattopadhyay, S.; Edwards, D.R.; Yu, Y.; Hamidisepehr, A. An Assessment of Climate Change Impacts on Future Water Availability and Droughts in the Kentucky River Basin. Environ. Process. 2017, 4, 477–507. [Google Scholar] [CrossRef]
- Core Writing Team. Intergovernmental Panel on Climate Change (2014) Climate Change 2014: Synthesis Report. Contribution of Working Groups 646 I, II and III to the Fifth Assessment Report of the Intergovernmental Panel on Climate Change; IPCC: Geneva, Switzerland, 2014; p. 151. [Google Scholar]
- Hosseinzadehtalaei, P.; Tabari, H.; Willems, P. Climate change impact on short-duration extreme precipitation and intensity–duration–frequency curves over Europe. J. Hydrol. 2020, 590, 125249. [Google Scholar] [CrossRef]
- Mueller, E.N.; Pfister, A. Increasing occurrence of high-intensity rainstorm events relevant for the generation of soil erosion in a temperate lowland region in Central Europe. J. Hydrol. 2011, 411, 266–278. [Google Scholar] [CrossRef]
- Mezghani, A.; Dobler, A.; Haugen, J.E.; Benestad, R.E.; Parding, K.M.; Piniewski, M.; Kardel, I.; Kundzewicz, Z.W. CHASE-PL Climate Projection dataset over Poland—Bias adjustment of EURO-CORDEX simulations. Earth Syst. Sci. Data 2017, 9, 905–925. [Google Scholar] [CrossRef]
- Piniewski, M.; Szcześniak, M.; Huang, S.; Kundzewicz, Z.W. Projections of runoff in the Vistula and the Odra river basins with the help of the SWAT model. Hydrol. Res. 2017, 49, 303–317. [Google Scholar] [CrossRef]
- Piniewski, M.; Prudhomme, C.; Acreman, M.C.; Tylec, L.; Oglęcki, P.; Okruszko, T. Responses of fish and invertebrates to floods and droughts in Europe. Ecohydrology 2017, 10, e1793. [Google Scholar] [CrossRef]
- Szczerkowska-Majchrzak, E.; Grzybkowska, M. Effects of Hydrological Disturbance of Different Magnitude on Riverine Habitats and Benthic Invertebrates. Pol. J. Ecol. 2015, 63, 135–141. [Google Scholar] [CrossRef]
- Metcalfe, J.L. Biological water quality assessment of running waters based on macroinvertebrate communities: History and present status in Europe. Environ. Pollut. 1989, 60, 101–139. [Google Scholar] [CrossRef]
- Musonge, P.S.L.; Boets, P.; Lock, K.; Goethals, P.L.M. Drivers of Benthic Macroinvertebrate Assemblages in Equatorial Alpine Rivers of the Rwenzoris (Uganda). Water 2020, 12, 1668. [Google Scholar] [CrossRef]
- Hajdukiewicz, H.; Wyżga, B.; Amirowicz, A.; Oglęcki, P.; Radecki-Pawlik, A.; Zawiejska, J.; Mikuś, P. Ecological state of a mountain river before and after a large flood: Implications for river status assessment. Sci. Total Environ. 2018, 610–611, 244–257. [Google Scholar] [CrossRef] [PubMed]
- Robinson, C.T. Long-term changes in community assembly, resistance, and resilience following experimental floods. Ecol. Appl. 2012, 22, 1949–1961. [Google Scholar] [CrossRef] [PubMed]
- Parasiewicz, P.; King, E.L.; Webb, J.A.; Piniewski, M.; Comoglio, C.; Wolter, C.; Buijse, A.D.; Bjerklie, D.; Vezza, P.; Melcher, A.; et al. The role of floods and droughts on riverine ecosystems under a changing climate. Fish. Manag. Ecol. 2019, 26, 461–473. [Google Scholar] [CrossRef]
- Franssen, N.R.; Gido, K.B.; Guy, C.S.; Tripe, J.A.; Shrank, S.J.; Strakosh, T.R.; Bertrand, K.N.; Franssen, C.M.; Pitts, K.L.; Paukert, C.P. Effects of floods on fish assemblages in an intermittent prairie stream. Freshw. Biol. 2006, 51, 2072–2086. [Google Scholar] [CrossRef]
- Herbst, D.B.; Cooper, S.D.; Medhurst, R.B.; Wiseman, S.W.; Hunsaker, C.T. A comparison of the taxonomic and trait structure of macroinvertebrate communities between the riffles and pools of montane headwater streams. Hydrobiologia 2018, 820, 115–133. [Google Scholar] [CrossRef]
- Bond, N.R.; Downes, B.J. The independent and interactive effects of fine sediment and flow on benthic invertebrate communities characteristic of small upland streams. Freshw. Biol. 2003, 48, 455–465. [Google Scholar] [CrossRef]
- Matthaei, C.; Uehlinger, U.; Frutiger, A. Response of benthic invertebrates to natural versus experimental disturbance in a Swiss prealpine river. Freshw. Biol. 1997, 37, 61–77. [Google Scholar] [CrossRef]
- Le, C.T.U.; Paul, W.L.; Gawne, B.; Suter, P.J. Insight into the multi-decadal effects of floods on aquatic macroinvertebrate community structure in the Murray River using distributed lag nonlinear models and counterfactual analysis. Sci. Total Environ. 2021, 757, 143988. [Google Scholar] [CrossRef]
- Le, C.T.U.; Paul, W.L.; Gawne, B.; Suter, P.J. Quantitative Flow-Ecology Relationships Using Distributed Lag Nonlinear Models: Large Floods in the Murray River Could Have Delayed Effects on Aquatic Macroinvertebrates Lasting More Than Three Decades. Water Resour. Res. 2020, 56, e2019WR025896. [Google Scholar] [CrossRef]
- Death, R. The effect of floods on aquatic invertebrate communities. Aquatic Insects: Challenges to Populations. Proceedings of the Royal Entomological Society’s 24th Symposium; British Library: London, UK, 2008; p. 533. [Google Scholar]
- Suren, A.M.; Jowett, I.G. Effects of floods versus low flows on invertebrates in a New Zealand gravel-bed river. Freshw. Biol. 2006, 51, 2207–2227. [Google Scholar] [CrossRef]
- Dumnicka, E.; Koszalka, J. The effect of drought on Oligochaeta communities in small woodland streams. Biologia 2005, 541, 143–150. [Google Scholar]
- Grzybkowska, M.; Temech, A.; Dukowska, M. Impact of long-term alternations of discharge and spate on the chironomid community in the lowland Widawka River (Central Poland). Hydrobiologia 1996, 324, 107–115. [Google Scholar] [CrossRef]
- Oglęcki, P. Awifauna odcinków doliny rzeki Jeziorki o zróżnicowanym stopniu naturalności. In Proceedings of the Materiały 695 Ogólnopolskiej Konferencji Naukowej “Wybrane Problemy Przyrodniczo-Rolniczych Podstaw Inżynierii Środowiska, SGGW, Warsaw, Poland, 1996; pp. 141–146. [Google Scholar]
- Pusłowska-Tyszewska, D.; Tyszewski, S. Bilanse wodnogospodarcze na potrzeby opracowania warunków korzystania z wód zlewni rzecznych na przykładzie Jeziorki. In Monografie Komitetu Gospodarki Wodnej PAN; Banasik, K., Hejduk, L., Kaznowska, E., Eds.; Wydawnictwo Uniwersytetu Rolniczego w Krakowie: Warszawa, Poland, 2014; Volume XX. [Google Scholar]
- Gorecki, M. Hydromorphological Status Assessment of the Jeziorka River by the RHS Method. Bachelor’s Thesis, Warsaw University of Life Sciences, Warsaw, Poland, 2017. [Google Scholar]
- Kołodziejczyk, A.; Koperski, P. Bezkręgowce Słodkowodne Polski. Klucz do Oznaczania oraz Podstawy Biologii i Ekologii 704 Makrofauny (Freshwater Invertebrates in Poland: Key to the Identification and Principles of Biology and Ecology); Warsaw University Press: Warszawa, Poland, 2000. (in Polish) [Google Scholar]
- McCafferty, W.P. Aquatic Entomology: The Fisherman’s and Ecologist’s Illustrated Guide to Insects and Their Relatives; Jones & Bartlett: Sadbury, MA, USA, 1998. [Google Scholar]
- Wyżga, B.; Oglęcki, P.; Radecki-Pawlik, A.; Zawiejska, J. Diversity of Macroinvertebrate Communities as a Reflection of Habitat Heterogeneity in a Mountain River Subjected to Variable Human Impacts. In Stream Restoration in Dynamic Fluvial Systems; Wiley Online Library: Washington, DC, USA, 2011; pp. 189–207. [Google Scholar] [CrossRef]
- Wyżga, B.; Amirowicz, A.; Oglęcki, P.; Hajdukiewicz, H.; Radecki-Pawlik, A.; Zawiejska, J.; Mikuś, P. Response of fish and benthic invertebrate communities to constrained channel conditions in a mountain river: Case study of the Biała, Polish Carpathians. Limnologica 2014, 46, 58–69. [Google Scholar] [CrossRef]
- Wyżga, B.; Oglęcki, P.; Hajdukiewicz, H.; Zawiejska, J.; Radecki-Pawlik, A.; Skalski, T.; Mikuś, P. Interpretation of the invertebrate-based BMWP-PL index in a gravel-bed river: Insight from the Polish Carpathians. Hydrobiologia 2013, 712, 71–88. [Google Scholar] [CrossRef]
- Hauer, C.; Pulg, U. The non-fluvial nature of Western Norwegian rivers and the implications for channel patterns and sediment composition. CATENA 2018, 171, 83–98. [Google Scholar] [CrossRef]
- Van Rijn, L.C. Principles of Sediment Transport in Rivers, Estuaries and Costal Seas; Aqua Publications: Amsterdam, The Netherlands, 1993; Volume 679. [Google Scholar]
- Oksanen, J.A.O. Vegan: Community Ecology Package. R Package Version 2.4-6. 2018. Available online: https://CRAN.R-project.org/package=vegan (accessed on 24 August 2020).
- Bezak, N.; Brilly, M.; Šraj, M. Comparison between the peaks-over-threshold method and the annual maximum method for flood frequency analysis. Hydrol. Sci. J. 2014, 59, 959–977. [Google Scholar] [CrossRef]
- Cunderlik, J.M.; Ouarda, T.B.M.J.; Bobée, B. Determination of flood seasonality from hydrological records/Détermination de la saisonnalité des crues à partir de séries hydrologiques. Hydrol. Sci. J. 2004, 49, 526. [Google Scholar] [CrossRef]
- Theodoropoulos, C.; Vourka, A.; Stamou, A.; Rutschmann, P.; Skoulikidis, N. Response of freshwater macroinvertebrates to rainfall-induced high flows: A hydroecological approach. Ecol. Indic. 2017, 73, 432–442. [Google Scholar] [CrossRef]
- Álvarez-Cabria, M.; Barquín, J.; Juanes, J.A. Microdistribution patterns of macroinvertebrate communities upstream and downstream of organic effluents. Water Res. 2011, 45, 1501–1511. [Google Scholar] [CrossRef]
- Morris, M.W.L.; Hondzo, M. Double-averaged rough-bed open-channel flow with high Glossosoma (Trichoptera: Glossosomatidae) abundance. Environ. Fluid Mech. 2013, 13, 257–278. [Google Scholar] [CrossRef]
- Pan, B.-Z.; Wang, H.-Z.; Ban, X.; Yin, X.-A. An exploratory analysis of ecological water requirements of macroinvertebrates in the Wuhan branch of the Yangtze River. Quat. Int. 2015, 380–381, 256–261. [Google Scholar] [CrossRef]
- wa Kangeri, A.K.; Jansen, J.M.; Joppe, D.J.; Dankers, N.M.J.A. In situ investigation of the effects of current velocity on sedimentary mussel bed stability. J. Exp. Mar. Biol. Ecol. 2016, 485, 65–72. [Google Scholar] [CrossRef]
- de Brouwer, J.H.F.; Besse-Lototskaya, A.A.; ter Braak, C.J.F.; Kraak, M.H.S.; Verdonschot, P.F.M. Flow velocity tolerance of lowland stream caddisfly larvae (Trichoptera). Aquat. Sci. 2017, 79, 419–425. [Google Scholar] [CrossRef]
- Schmidt, H.-H. Environmental Characteristics. In Central European Stream Ecosystems; Wiley Online Library: Singapore, 2012; pp. 21–71. [Google Scholar] [CrossRef]
- Shaw, P.; Shick, A.; Hassan, M. Bedload Sediment Transport in the Sand Rivers of Botswana. Botsw. Notes Rec. 1994, 26, 115–127. [Google Scholar]
- Rempel, L.L.; Richardson, J.S.; Healey, M.C. Flow Refugia for Benthic Macroinvertebrates during Flooding of a Large River. J. N. Am. Benthol. Soc. 1999, 18, 34–48. [Google Scholar] [CrossRef]
- Lancaster, J.; Belyea, L.R. Defining the limits to local density: Alternative views of abundance–environment relationships. Freshw. Biol. 2006, 51, 783–796. [Google Scholar] [CrossRef]
- Calderon, M.R.; Baldigo, B.P.; Smith, A.J.; Endreny, T.A. Effects of extreme floods on macroinvertebrate assemblages in tributaries to the Mohawk River, New York, USA. River Res. Appl. 2017, 33, 1060–1070. [Google Scholar] [CrossRef]
- Fisher, S.G.; Gray, L.J.; Grimm, N.B.; Busch, D.E. Temporal Succession in a Desert Stream Ecosystem Following Flash Flooding. Ecol. Monogr. 1982, 52, 93–110. [Google Scholar] [CrossRef]
- Gray, L.J.; Fisher, S.G. Postflood Recolonization Pathways of Macroinvertebrates in a Lowland Sonoran Desert Stream. Am. Midl. Nat. 1981, 106, 249–257. [Google Scholar] [CrossRef]
- Smith, A.J.; Baldigo, B.P.; Duffy, B.T.; George, S.D.; Dresser, B. Resilience of benthic macroinvertebrates to extreme floods in a Catskill Mountain river, New York, USA: Implications for water quality monitoring and assessment. Ecol. Indic. 2019, 104, 107–115. [Google Scholar] [CrossRef]
- Poff, N.L.; Zimmerman, J.K.H. Ecological responses to altered flow regimes: A literature review to inform the science and management of environmental flows. Freshw. Biol. 2010, 55, 194–205. [Google Scholar] [CrossRef]
- Rader, R.B.; Voelz, N.J.; Ward, J.V. Post-Flood Recovery of a Macroinvertebrate Community in a Regulated River: Resilience of an Anthropogenically Altered Ecosystem. Restor. Ecol. 2008, 16, 24–33. [Google Scholar] [CrossRef]
- Su, P.; Wang, X.; Lin, Q.; Peng, J.; Song, J.; Fu, J.; Wang, S.; Cheng, D.; Bai, H.; Li, Q. Variability in macroinvertebrate community structure and its response to ecological factors of the Weihe River Basin, China. Ecol. Eng. 2019, 140, 105595. [Google Scholar] [CrossRef]
- Fritz, K.M.; Dodds, W.K. Resistance and Resilience of Macroinvertebrate Assemblages to Drying and Flood in a Tallgrass Prairie Stream System. Hydrobiologia 2004, 527, 99–112. [Google Scholar] [CrossRef]
- Mundahl, N.D.; Hunt, A.M. Recovery of stream invertebrates after catastrophic flooding in southeastern Minnesota, USA. J. Freshw. Ecol. 2011, 26, 445–457. [Google Scholar] [CrossRef]
- Ilg, C.; Foeckler, F.; Deichner, O.; Henle, K. Extreme flood events favour floodplain mollusc diversity. Hydrobiologia 2008, 621, 63. [Google Scholar] [CrossRef]
- Kim, D.G.; Yoon, T.J.; Baek, M.J.; Bae, Y.J. Impact of rainfall intensity on benthic macroinvertebrate communities in a mountain stream under the East Asian monsoon climate. J. Freshw. Ecol. 2018, 33, 489–501. [Google Scholar] [CrossRef]
- Townsend, C.R.; Scarsbrook, M.R.; Dolédec, S. The intermediate disturbance hypothesis, refugia, and biodiversity in streams. Limnol. Oceanogr. 1997, 42, 938–949. [Google Scholar] [CrossRef]
- Sponseller, R.A.; Grimm, N.B.; Boulton, A.J.; Sabo, J.L. Responses of macroinvertebrate communities to long-term flow variability in a Sonoran Desert stream. Glob. Chang. Biol. 2010, 16, 2891–2900. [Google Scholar] [CrossRef]
- Stanley, E.H.; Fisher, S.G.; Grimm, N.B. Ecosystem Expansion and Contraction in Streams. BioScience 1997, 47, 427–435. [Google Scholar] [CrossRef]
- Milner, A.M.; Picken, J.L.; Klaar, M.J.; Robertson, A.L.; Clitherow, L.R.; Eagle, L.; Brown, L.E. River ecosystem resilience to extreme flood events. Ecol. Evol. 2018, 8, 8354–8363. [Google Scholar] [CrossRef]
- Leber, M. The Influence of Flooding on Macroinvertebrate Diversity of the James River Rock Pools. Honors Thesis, University of Richmond, Richmond, VA, USA, May 2020. [Google Scholar]
- Ding, Y.; Rong, N.; Shan, B. Impact of extreme oxygen consumption by pollutants on macroinvertebrate assemblages in plain rivers of the Ziya River Basin, north China. Environ. Sci. Pollut. Res. 2016, 23, 14147–14156. [Google Scholar] [CrossRef]
- Karaouzas, I.; Theodoropoulos, C.; Vourka, A.; Gritzalis, K.; Skoulikidis, N.T. Stream invertebrate communities are primarily shaped by hydrological factors and ultimately fine-tuned by local habitat conditions. Sci. Total Environ. 2019, 665, 290–299. [Google Scholar] [CrossRef]
- Maltby, L. Sensitivity of the crustaceans Gammarus pulex (L.) and Asellus aquaticus (L.) to short-term exposure to hypoxia and unionized ammonia: Observations and possible mechanisms. Water Res. 1995, 29, 781–787. [Google Scholar] [CrossRef]
- Collier, K.J.; Ilcock, R.J.; Meredith, A.S. Influence of substrate type and physico-chemical conditions on macroinvertebrate faunas and biotic indices of some lowland Waikato, New Zealand, streams. N. Z. J. Mar. Freshw. Res. 1998, 32, 1–19. [Google Scholar] [CrossRef]
- Lewin, I. The gastropod communities in the lowland rivers of agricultural areas—Their biodiversity and bioindicative value in the ciechanowska upland, central Poland. Malacologia 2006, 49, 7–23. [Google Scholar] [CrossRef]
- Jacob, U.; Walther, H.; Klenke, R. Aquatic insect larvae as indicators of limiting minimal contents of dissolved oxygen—Part II. Aquat. Insects 1984, 6, 185–190. [Google Scholar] [CrossRef]
- Zhang, Y.; Cheng, L.; Tolonen, K.E.; Yin, H.; Gao, J.; Zhang, Z.; Li, K.; Cai, Y. Substrate degradation and nutrient enrichment structuring macroinvertebrate assemblages in agriculturally dominated Lake Chaohu Basins, China. Sci. Total Environ. 2018, 627, 57–66. [Google Scholar] [CrossRef]
- Szymańska, M.; Burandt, P.; Bąkowska, M.; Sowiński, P.; Mrozińska, N.; Obolewski, K. Long-term effects of hydromorphological stream restoration on changes in microhabitats of Ephemera danica (Ephemeroptera) and its population. Ecol. Indic. 2020, 109, 105810. [Google Scholar] [CrossRef]
- Xu, M.; Wang, Z.; Duan, X.; Pan, B. Effects of pollution on macroinvertebrates and water quality bio-assessment. Hydrobiologia 2014, 729, 247–259. [Google Scholar] [CrossRef]
- Chen, Y.; Viadero, R.C.; Wei, X.; Fortney, R.; Hedrick, L.B.; Welsh, S.A.; Anderson, J.T.; Lin, L.-S. Effects of Highway Construction on Stream Water Quality and Macroinvertebrate Condition in a Mid-Atlantic Highlands Watershed, USA. J. Environ. Qual. 2009, 38, 1672–1682. [Google Scholar] [CrossRef]
- Bilotta, G.S.; Brazier, R.E. Understanding the influence of suspended solids on water quality and aquatic biota. Water Res. 2008, 42, 2849–2861. [Google Scholar] [CrossRef]
- Dalu, T.; Wasserman, R.J.; Tonkin, J.D.; Mwedzi, T.; Magoro, M.L.; Weyl, O.L.F. Water or sediment? Partitioning the role of water column and sediment chemistry as drivers of macroinvertebrate communities in an austral South African stream. Sci. Total Environ. 2017, 607–608, 317–325. [Google Scholar] [CrossRef] [PubMed]
- Leitner, P.; Hauer, C.; Ofenböck, T.; Pletterbauer, F.; Schmidt-Kloiber, A.; Graf, W. Fine sediment deposition affects biodiversity and density of benthic macroinvertebrates: A case study in the freshwater pearl mussel river Waldaist (Upper Austria). Limnologica 2015, 50, 54–57. [Google Scholar] [CrossRef]
- Feeley, H.B.; Davis, S.; Bruen, M.; Blacklocke, S.; Kelly-Quinn, M. The impact of a catastrophic storm event on benthic macroinvertebrate communities in upland headwater streams and potential implications for ecological diversity and assessment of ecological status. J. Limnol. 2012, 71, e32. [Google Scholar] [CrossRef]
- Stubbington, R.; Greenwood, A.M.; Wood, P.J.; Armitage, P.D.; Gunn, J.; Robertson, A.L. The response of perennial and temporary headwater stream invertebrate communities to hydrological extremes. Hydrobiologia 2009, 630, 299–312. [Google Scholar] [CrossRef]
- Woodward, G.; Bonada, N.; Feeley, H.B.; Giller, P.S. Resilience of a stream community to extreme climatic events and long-term recovery from a catastrophic flood. Freshw. Biol. 2015, 60, 2497–2510. [Google Scholar] [CrossRef]
- Woods, T.; Kaz, A.; Giam, X. Phenology in freshwaters: A review and recommendations for future research. Ecography 2021. [Google Scholar] [CrossRef]
- Bis, B.; Mikulec, A. Przewodnik do Oceny Stanu Ekologicznego rzek Polski na Podstawie Makrobezkręgowców Bentosowych [The Outline of the Ecological Status Assessment of Rivers in Poland Based on the Benthic Macroinvertebrates Assemblages]; Inspekcja Ochrony Środowiska: Warsaw, Poland, 2013. [Google Scholar] [CrossRef]
- Królak, M.; Korycińska, M. Taxonomic Composition of Macroinvertebrates in the Liwiec River and its Tributaries (Central and Eastern Poland) on the Basis of Chosen Physical and Chemical Parameters of Water and Season. Pol. J. Environ. Stud. 2008, 17, 39–50. [Google Scholar]
- Medupin, C. Spatial and temporal variation of benthic macroinvertebrate communities along an urban river in Greater Manchester, UK. Environ. Monit. Assess. 2020, 192, 84. [Google Scholar] [CrossRef]
- Álvarez-Cabria, M.; Barquín, J.; Juanes, J.A. Macroinvertebrate community dynamics in a temperate European Atlantic river. Do they conform to general ecological theory? Hydrobiologia 2011, 658, 277–291. [Google Scholar] [CrossRef]
- Lake, P.S. Disturbance, patchiness, and diversity in streams. J. N. Am. Benthol. Soc. 2000, 19, 573–592. [Google Scholar] [CrossRef]
- Jähnig, S.C.; Kuemmerlen, M.; Kiesel, J.; Domisch, S.; Cai, Q.; Schmalz, B.; Fohrer, N. Modelling of riverine ecosystems by integrating models: Conceptual approach, a case study and research agenda. J. Biogeogr. 2012, 39, 2253–2263. [Google Scholar] [CrossRef]
- Wyżga, B.; Kundzewicz, Z.W.; Konieczny, R.; Piniewski, M.; Zawiejska, J.; Radecki-Pawlik, A. Comprehensive approach to the reduction of river flood risk: Case study of the Upper Vistula Basin. Sci. Total Environ. 2018, 631–632, 1251–1267. [Google Scholar] [CrossRef] [PubMed]


| Variable | Mean | Range |
|---|---|---|
| Channel width 1 (m) | 7 | 5–10 |
| Channel depth 2 (m) | 0.6 | 0.3–1.15 |
| Dominant substrate 1 | Mud, sand | |
| Catchment area (km2) | Whole catchment: 989; Flow gauge Piaseczno: 683; Studied reach: 382 | |
| Mean annual flow 3 (m3/s) | 2.7 | 0.1–58.3 |
| 100-year flood 3 (m3/s) | 51.9 | |
| 10-year flood 3 (m3/s) | 32 | |
| Date | hm (m) | vm (m/s) | vcr (m/s) |
|---|---|---|---|
| 26.03.2020 | 0.65 | 0.277 | 0.309 |
| 03.07.2020 | 1.45 | 0.388 | 0.338 |
| 19.08.2020 | 0.37 | 0.249 | 0.289 |
Publisher’s Note: MDPI stays neutral with regard to jurisdictional claims in published maps and institutional affiliations. |
© 2021 by the authors. Licensee MDPI, Basel, Switzerland. This article is an open access article distributed under the terms and conditions of the Creative Commons Attribution (CC BY) license (http://creativecommons.org/licenses/by/4.0/).
Share and Cite
Chattopadhyay, S.; Oglęcki, P.; Keller, A.; Kardel, I.; Mirosław-Świątek, D.; Piniewski, M. Effect of a Summer Flood on Benthic Macroinvertebrates in a Medium-Sized, Temperate, Lowland River. Water 2021, 13, 885. https://doi.org/10.3390/w13070885
Chattopadhyay S, Oglęcki P, Keller A, Kardel I, Mirosław-Świątek D, Piniewski M. Effect of a Summer Flood on Benthic Macroinvertebrates in a Medium-Sized, Temperate, Lowland River. Water. 2021; 13(7):885. https://doi.org/10.3390/w13070885
Chicago/Turabian StyleChattopadhyay, Somsubhra, Paweł Oglęcki, Agata Keller, Ignacy Kardel, Dorota Mirosław-Świątek, and Mikołaj Piniewski. 2021. "Effect of a Summer Flood on Benthic Macroinvertebrates in a Medium-Sized, Temperate, Lowland River" Water 13, no. 7: 885. https://doi.org/10.3390/w13070885