
Assessment of MERRA-2 and ERA5 to Model the Snow Water Equivalent in the High Atlas (1981–2019)
by
 , ,
, ,
Mohamed Wassim Baba
1,*, 
Abdelghani Boudhar
1,2,
Simon Gascoin
3,
Lahoucine Hanich
1,4,
Ahmed Marchane
1 and
Abdelghani Chehbouni
1,3 1
Center for Remote Sensing Application (CRSA), Mohammed VI Polytechnic University (UM6P), Ben Guerir 43150, Morocco
2
Water Resources Management and Valorization and Remote Sensing Team (GEVARET), Faculty of Sciences and Technics, Sultan Moulay Slimane University, Beni Mellal 23000, Morocco
3
CESBIO, Université de Toulouse, CNES/CNRS/IRD/INRA/UPS, 31400 Toulouse, France
4
Laboratoire de Géosciences, Géoenvironnement et Génie Civil, Département des Sciences de la Terre, Faculté des Sciences et Techniques Guéliz /Université Cadi Ayyad, Av. A. Khattabi, BP 549, Marrakech 40000, Morocco
*
Author to whom correspondence should be addressed.
Water 2021, 13(7), 890; https://doi.org/10.3390/w13070890
Submission received: 18 February 2021
/
Revised: 21 March 2021
/
Accepted: 22 March 2021
/
Published: 24 March 2021
Abstract
:Melt water runoff from seasonal snow in the High Atlas range is an essential water resource in Morocco. However, there are only few meteorological stations in the high elevation areas and therefore it is challenging to estimate the distribution of snow water equivalent (SWE) based only on in situ measurements. In this work we assessed the performance of ERA5 and MERRA-2 climate reanalysis to compute the spatial distribution of SWE in the High Atlas. We forced a distributed snowpack evolution model (SnowModel) with downscaled ERA5 and MERRA-2 data at 200 m spatial resolution. The model was run over the period 1981 to 2019 (37 water years). Model outputs were assessed using observations of river discharge, snow height and MODIS snow-covered area. The results show a good performance for both MERRA-2 and ERA5 in terms of reproducing the snowpack state for the majority of water years, with a lower bias using ERA5 forcing.
1. Introduction
The Mediterranean region is one of the areas of the world that is most impacted by water scarcity due the growing human water demand and the limited accessibility to the water resources [1,2,3]. In many countries of the Mediterranean region, meltwater runoff from the seasonal snowpack that forms in mountainous areas is of great hydrological importance [2,3,4,5]. This is particularly the case in the High Atlas Mountains in Morocco where snowmelt was estimated to contribute between 15% and 45% of annual river flow in the High Atlas catchments [6]. Snowmelt also contributes to recharge groundwater [7]. Both surface runoff and groundwater are heavily exploited to irrigate crops in the semiarid plain of Morocco [8,9].
Despite its recognized importance, key physical properties of the High Atlas snowpack are still poorly known. In particular, the main variable of interest for hydrologists and water resource planners is the snow water equivalent (SWE). Assessing the spatial distribution of SWE in any mountain region is challenging, since the snowpack is sensitive to multiple meteorological variables such as precipitation, air temperature, humidity, radiation, wind speed, etc. which are notoriously difficult to estimate in mountainous regions [10]. In addition, there is currently no spaceborne sensor which can directly measure the SWE [10]. Previous studies have been conducted in the Atlas mountains to characterize the spatial and temporal variability of the snow cover area from remote sensing [11,12,13,14]. Their contribution is important to understand the snowpack evolution, but does not allow to to have an insight into the key variables of hydrology: the distribution of SWE and snowmelt. Boudhar et al. [15], Bouamri et al. [16] computed the SWE and melt over multiple years using in situ measurements but only at the point scale.
This lack of knowledge is mainly due to the scarcity and even absence of automatic weather stations (AWS) in the mid and high elevation areas. In addition, the difficult access to some high mountain regions of Morocco makes it challenging to carry out regular measurements. To solve this issue, Baba et al. [17], Baba et al. [18], Tuel et al. [19] used meteorological reanalyses instead of weather station data to simulate the snowpack evolution over specific catchments. However, the spatial resolution of current meteorological reanalyses is too coarse to represent the influence of topography on meteorological variables, which is crucial for snow modeling in mountainous regions [20]. In order to compensate for this gap, a downscaling approach is needed to derive reanalysis datasets in a fine spatial resolution using ground observations and topographic proprieties [17,18]. Hence reanalysis data were downscaled to resolutions of 250 m [17,18] or 1 km [19]. In the High Atlas, Baba et al. [18] suggested that model resolutions coarser than 500 m may not allow a correct representation of the snowpack energy balance as the influence of the terrain slope on the radiation budget is lost below such a resolution.
ERA5 [21] and MERRA-2 [22] are the two major state-of-the-art climate reanalysis that are currently freely available at global scale. Downscaled MERRA-2 or ERA5 data were already used to feed snowpack models in various mountain regions [17,23,24,25]. Both reanalyses provide multiple meteorological variables at the hourly timestep, with a spatial resolution (MERRA-2: ∼50 km, ERA5: ∼30 km) and temporal coverage (MERRA-2: 1980 onwards, ERA5: 1950 onwards). These characteristics make them useful for long term analysis of the snow cover variability in the past decades. In addition, both reanalysis are published with a short latency of two to three weeks (MERRA-2) and 5 days (ERA5) of real time, which makes them suitable for operational planning in snow-dominated catchments as suggested by Baba et al. [26]. However, to our best knowledge, there is no study comparing the performance of both datasets over the Atlas or even over a larger region like Morocco, North Africa or the Mediterranean. This assessment is important to decide which reanalysis should be used for the implementation of a snow data assimilation scheme in Morocco [26]. It may also be useful for many other applications like the characterization of droughts [27], crop yields prediction [28] or the assessment of wind power potential [29].
In this study, we simulated the snowpack evolution in the High Atlas mountains (Tensift catchment) from 1981 to 2019 using a distributed snowpack evolution model [30] [SnowModel] forced by ERA5 and MERRA-2 meteorological data. The results were evaluated using available in situ meteorological data, MODIS-derived snow-covered fraction (SCF) and observed discharge. We also evaluate SWE directly from the recently released ERA5-Land. ERA5-Land is a new land reanalysis dataset providing an estimation of several land variables at 0.1° × 0.1° of spatial resolution, and hourly temporal resolution [31].
2. Study Area and Data Source
2.1. Study Area
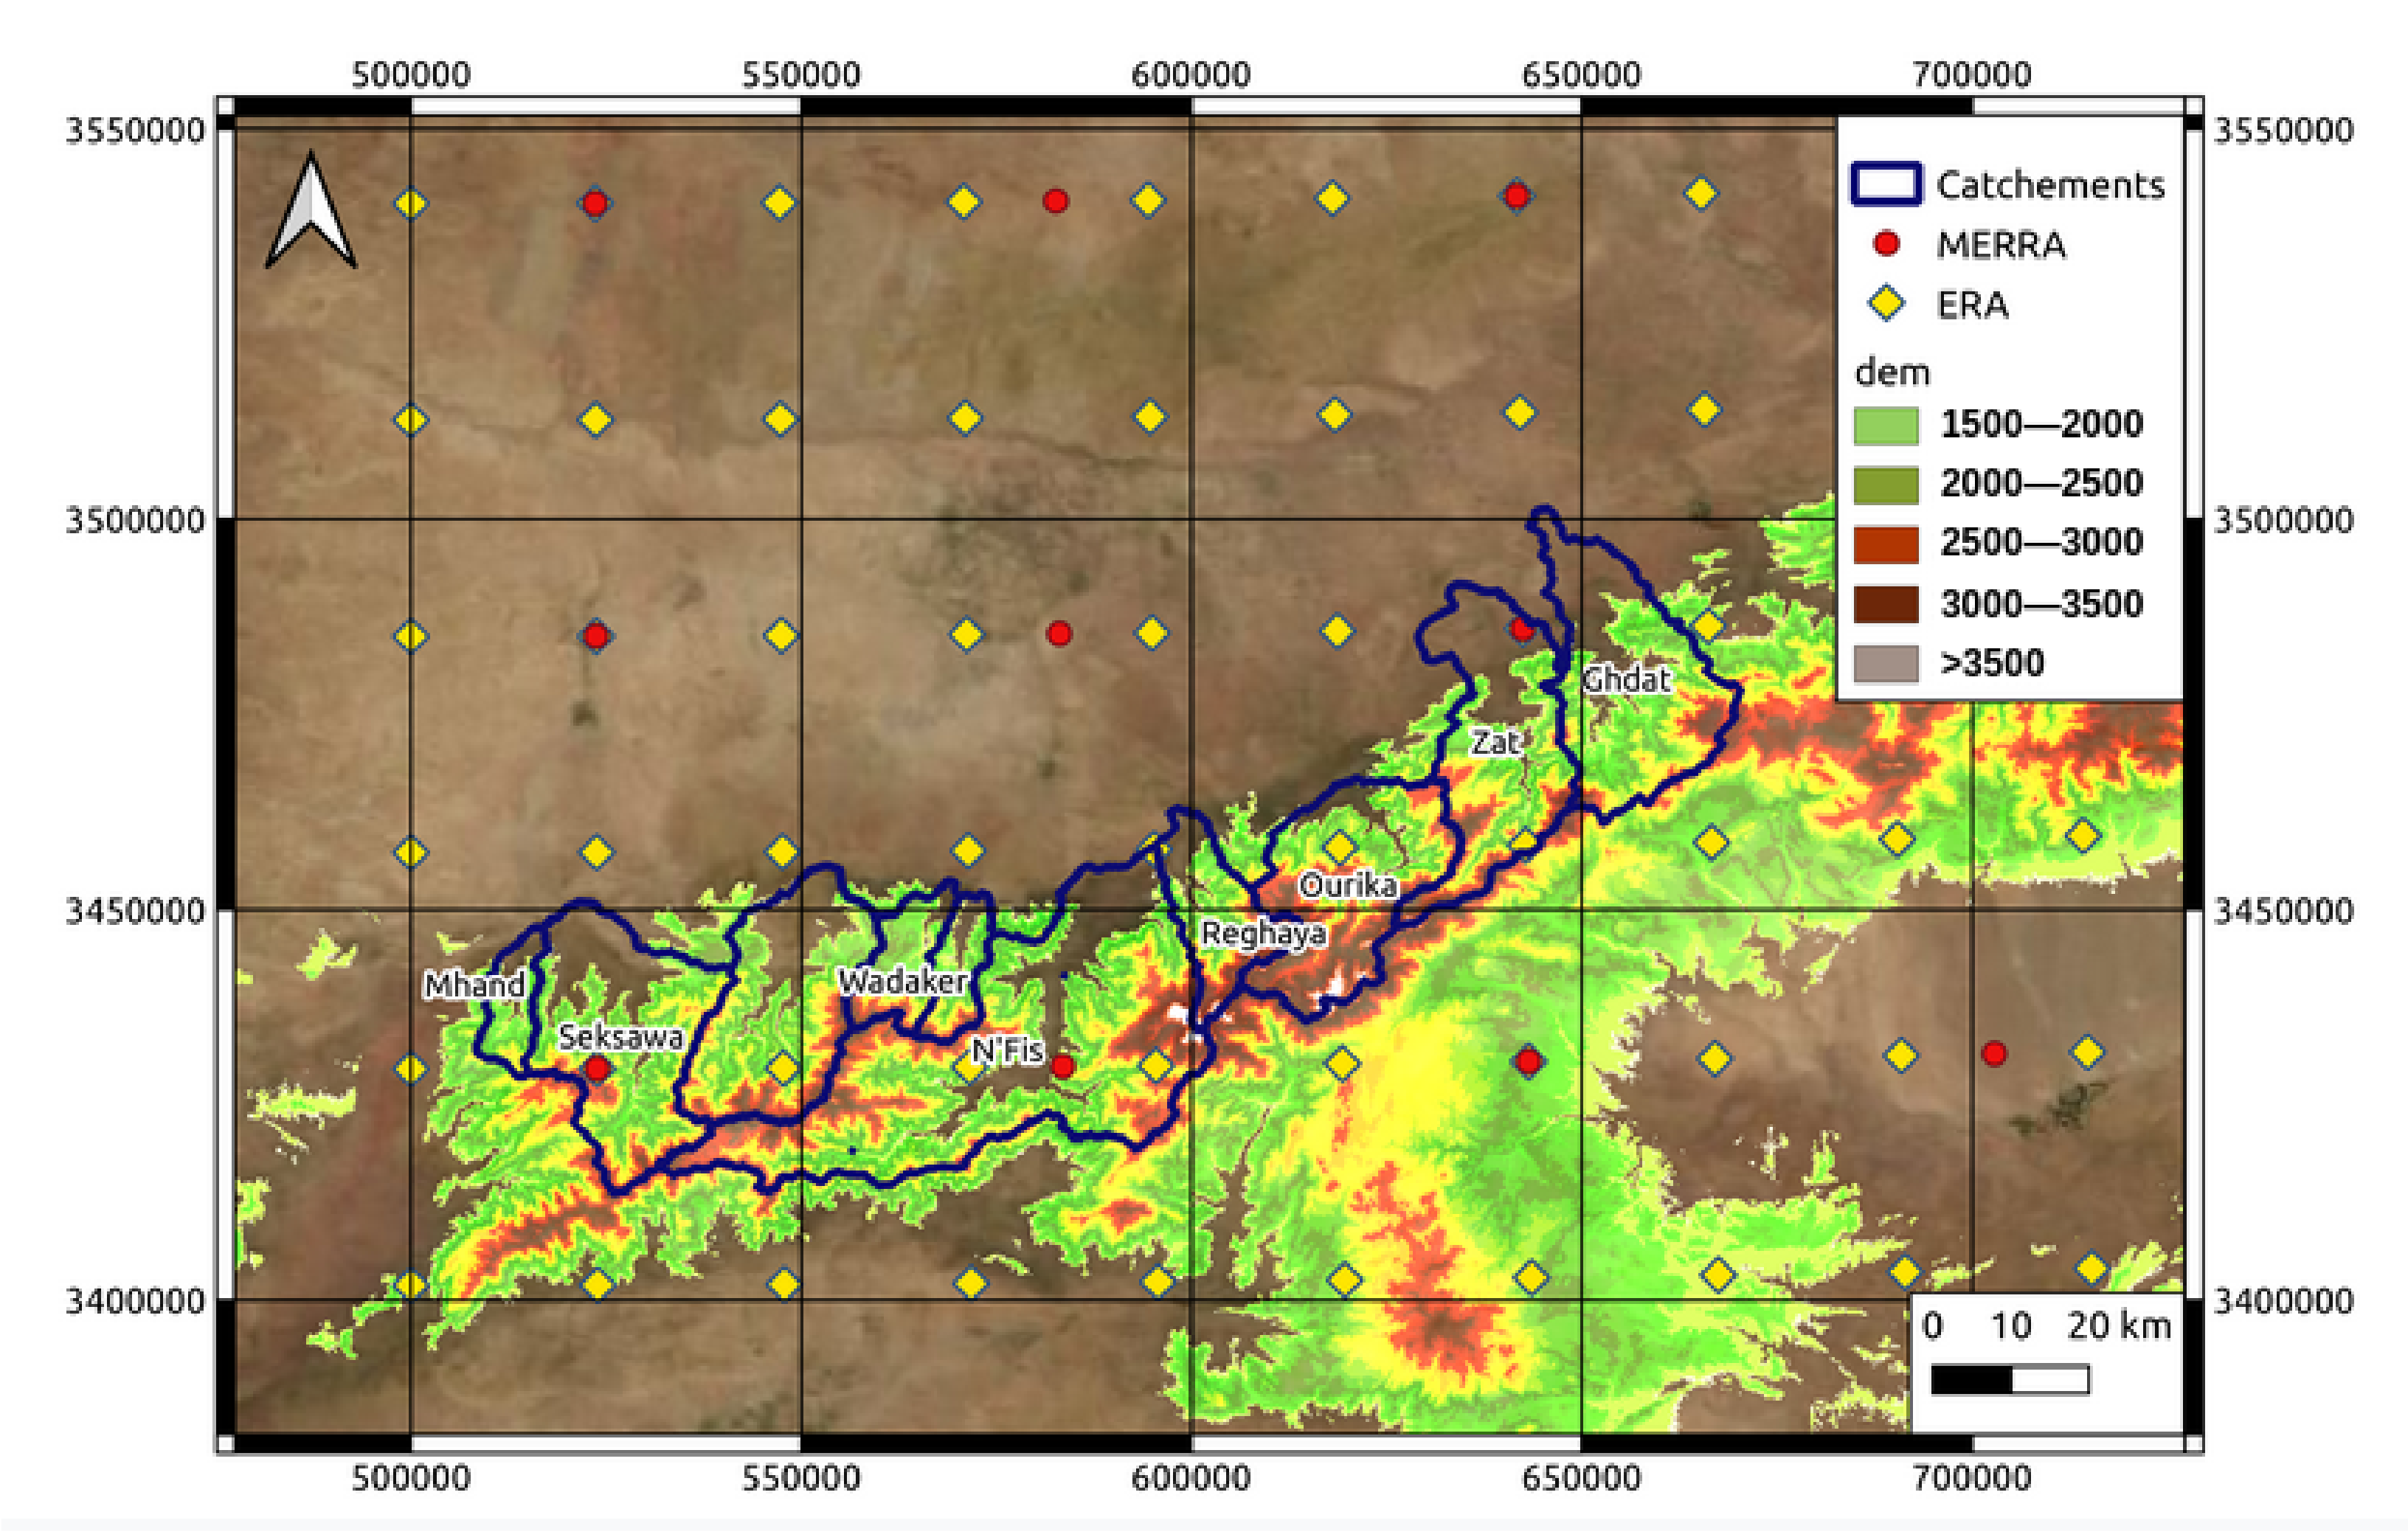
The study area comprises the upper catchments of the Tensift river basin on the northern slope of the High Atlas, including the Toubkal peak (4167 m.a.s.l), the highest summit in North Africa (Figure 1). The seasonal snow covers the study area in the middle and high altitudes above 1500 m.a.s.l in winter [6,13,18]. The studied sub-catchments of the Tensift basin provide a major source of freshwater for the Haouz plain, where the average annual precipitation varies between 150 mm and 200 mm, while it reaches 800 mm in high altitudes regions [6,32]. While the simulation domain covers all these sub-catchments in Figure 1, the evaluation was limited to some sub-catchments depending on the availability of observation data.
2.2. Merra-2 Reanalysis
The Modern-Era Retrospective Analysis for Research and Applications, Version 2 (MERRA-2), is provided by the National Aeronautics and Space Administration (NASA) Global Modeling and Assimilation Office (GMAO) from 1980 onward. MERRA-2 was the first long-term global reanalysis to assimilate space-based observations of aerosols and represent their interactions with other physical processes in the climate system [33]. All of MERRA-2 atmospheric variables are provided at 0.5° × 0.625° spatial resolution with hourly time-step.
2.3. Era5 Reanalysis
ERA5 is the fifth generation of atmospheric reanalyses of the global climate produced by the European Center for Medium-Range Weather Forecasts (ECMWF) [21]. It is a key element of the EU-funded Copernicus Climate Change Service (C3S). ERA5 provides a large number of atmospheric, land and oceanic climate variables at hourly step. ERA-5 have a high spatial resolution as well, with all of its atmospheric variables are interpolated at 0.25° × 0.25° spatial resolution.
2.4. Dem
A DEM of 200 m of spatial resolution was used for this study specifically. It was resampled by using bicubic interpolation from the Shuttle Radar Topography Mission Void Filled (SRTM-Void Filled Version 4.1) [34]. The choice of this resolution was based on a recent research in the High Atlas that suggest that 200–250 m resolutions are the best trade-off between the computational time and the reliability of the snowpack evolution simulation in the High Atlas [18].
2.5. Land Cover
The land cover map was derived from the European Space Agency Climate Change Initiative (ESA-CCI) classification map [35]. The bare soil is the predominant class over the study area.
2.6. Modis Snow Cover Area
We used an 18-year time series of daily gap-filled snow cover fraction (SCF) maps that were derived from MODIS snow products (NASA MOD10A1 collection 6). Each map provides the snow cover fraction per pixel with a spatial resolution of 500 m [36]. The method to retrieve SCF maps from MODIS and to interpolate cloud-masked pixels was described in [13,17]. We have computed the snow-covered area for each sub-catchment by using SCF products.
2.7. Hydro-Climatic Observations
We used annual river discharge data at the outlets of five rivers (Table 1). The discharge observations are available from 2000 to 2015.
2.8. Era5-Land Swe
We used daily SWE reanalysis datasets generated by the European Centre for Medium-Range Weather Forecasts (ECMWF) [31]. The SWE reanalysis are available from 1981 to present at 0.1° × 0.1° spatial resolution.
3. Methodology
3.1. Snowpack Evolution Modeling
We used the spatially distributed snow evolution modeling system (SnowModel) [30]. SnowModel is composed of 4 sub-models:
- Micromet computes the spatial distribution of meteorological data (precipitation, air temperature, relative humidity, wind speed, incoming solar radiation and incoming longwave radiation) over the model grid. This distribution can be done at daily, 3 hourly or daily scale depending on the temporal resolution of the input [37].
- EnBal computes the energy fluxes between the snowpack and the atmosphere. It simulates the surface temperature, internal energy, net radiation, sensible heat, latent heat, etc., using the MicroMet outputs. In addition, it simulates the latent and sensible heat fluxes and determines the potential amount of melt [30].
- Snowpack computes the evolution of the height of the snowpack (HS) based on the MicroMet and EnBal outputs.
- SnowTran-3D, this sub-model computes the redistribution of the snow due to wind transport and the blowing snow sublimation [38].
SnowModel has previously been tested with success in a wide range of climates [39], including semi-arid and Mediterranean mountains [17,40,41]. In this study we used the version: SnowModel_2020_05_14.
To spatialize the meteorological data from ERA5 and MERRA-2 centroids, a horizontal interpolation is performed using the Barnes objective analysis scheme, which applies a Gaussian distance-dependent weighting function to interpolate the station data to the model grid resolution. Thereafter, a horizontal distribution is applied to take into account the effect of elevation, slope and aspect on the gridded meteorological forcing. In the case of air temperature, a linear lapse rate correction is applied, while for the precipitation a non-linear lapse rate is applied for the correction. For further description of this distribution the reader can be referred to [17,30].
3.2. Evaluation Methodology
The first evaluation is based on a comparison of snow cover simulated by SnowModel and the MODIS snow cover data [42,43]. The simulated SWE at every day (MODIS revisit time) was converted to binary snow cover area (SCA) using a SWE threshold. This means that if the SWE value of a cell is greater than SWE, then the SCA is equal to 1, otherwise the SCA is equal to 0. SWE is optimized by Baba et al. [17] and set to 20 mm. The simulated SCA maps were converted to SCF by resampling to MODIS SCF resolution (Figure 2). The resampling method is the mean resampling method. For MODIS it provides snow cover fraction (SCF) for each pixel.
Then, we computed the daily mean SCF over the entire study area and compared it to the MODIS daily main SCF. This examination was conducted at the scale of each sub-catchment from 2000 to 2018. In addition, Snow cover duration which represents the number of days with snow cover is computed from both MODIS SCF and modeled SCF.
We also evaluated the simulations using the daily HS records observed at Oukaimeden station (3200 m.a.s.l) during 7 snow seasons. The evaluation was carried out by comparing the variations of each HS and by computing the root mean square error (RMSE) between modeled and observed HS.
SnowModel outputs were further assessed by comparing the total surface water input (defined as the liquid water leaving the snowpack, equal to rainfall rate in snow-free areas) over each sub-catchment to the observed discharge. We performed this comparison at a yearly time step and qualitatively only since several hydrological processes which are involved to convert the surface water input to discharge are not taken into account in this study. The comparison consists on comparing the variation of the observed discharge with 30–50% of the modeled surface water input (the sum of the precipitation and snowmelt that could contributes to the discharge).
Moreover, we evaluated the modeled precipitation at Oukaimeden based on precipitation observation, and the air temperature at four different stations (CAF, Neltner, Oukaimeden and Tahanaout). They are all located at Rheraya catchment. Ground observations are from a research weather station that is not part of an operational network hence are not assimilated in ERA5 or MERRA-2 reanalyses.
Finally, we have compared the daily SWE derived from ERA5-Land to the modeled SWE. The comparison was performed by comparing the evolution of each SWE by computing the root mean square error (RMSE) between modeled and observed total SWE (mm) in the study area. The main purpose of this comparison is to assess the performance of ERA5-Land in terms of SWE.
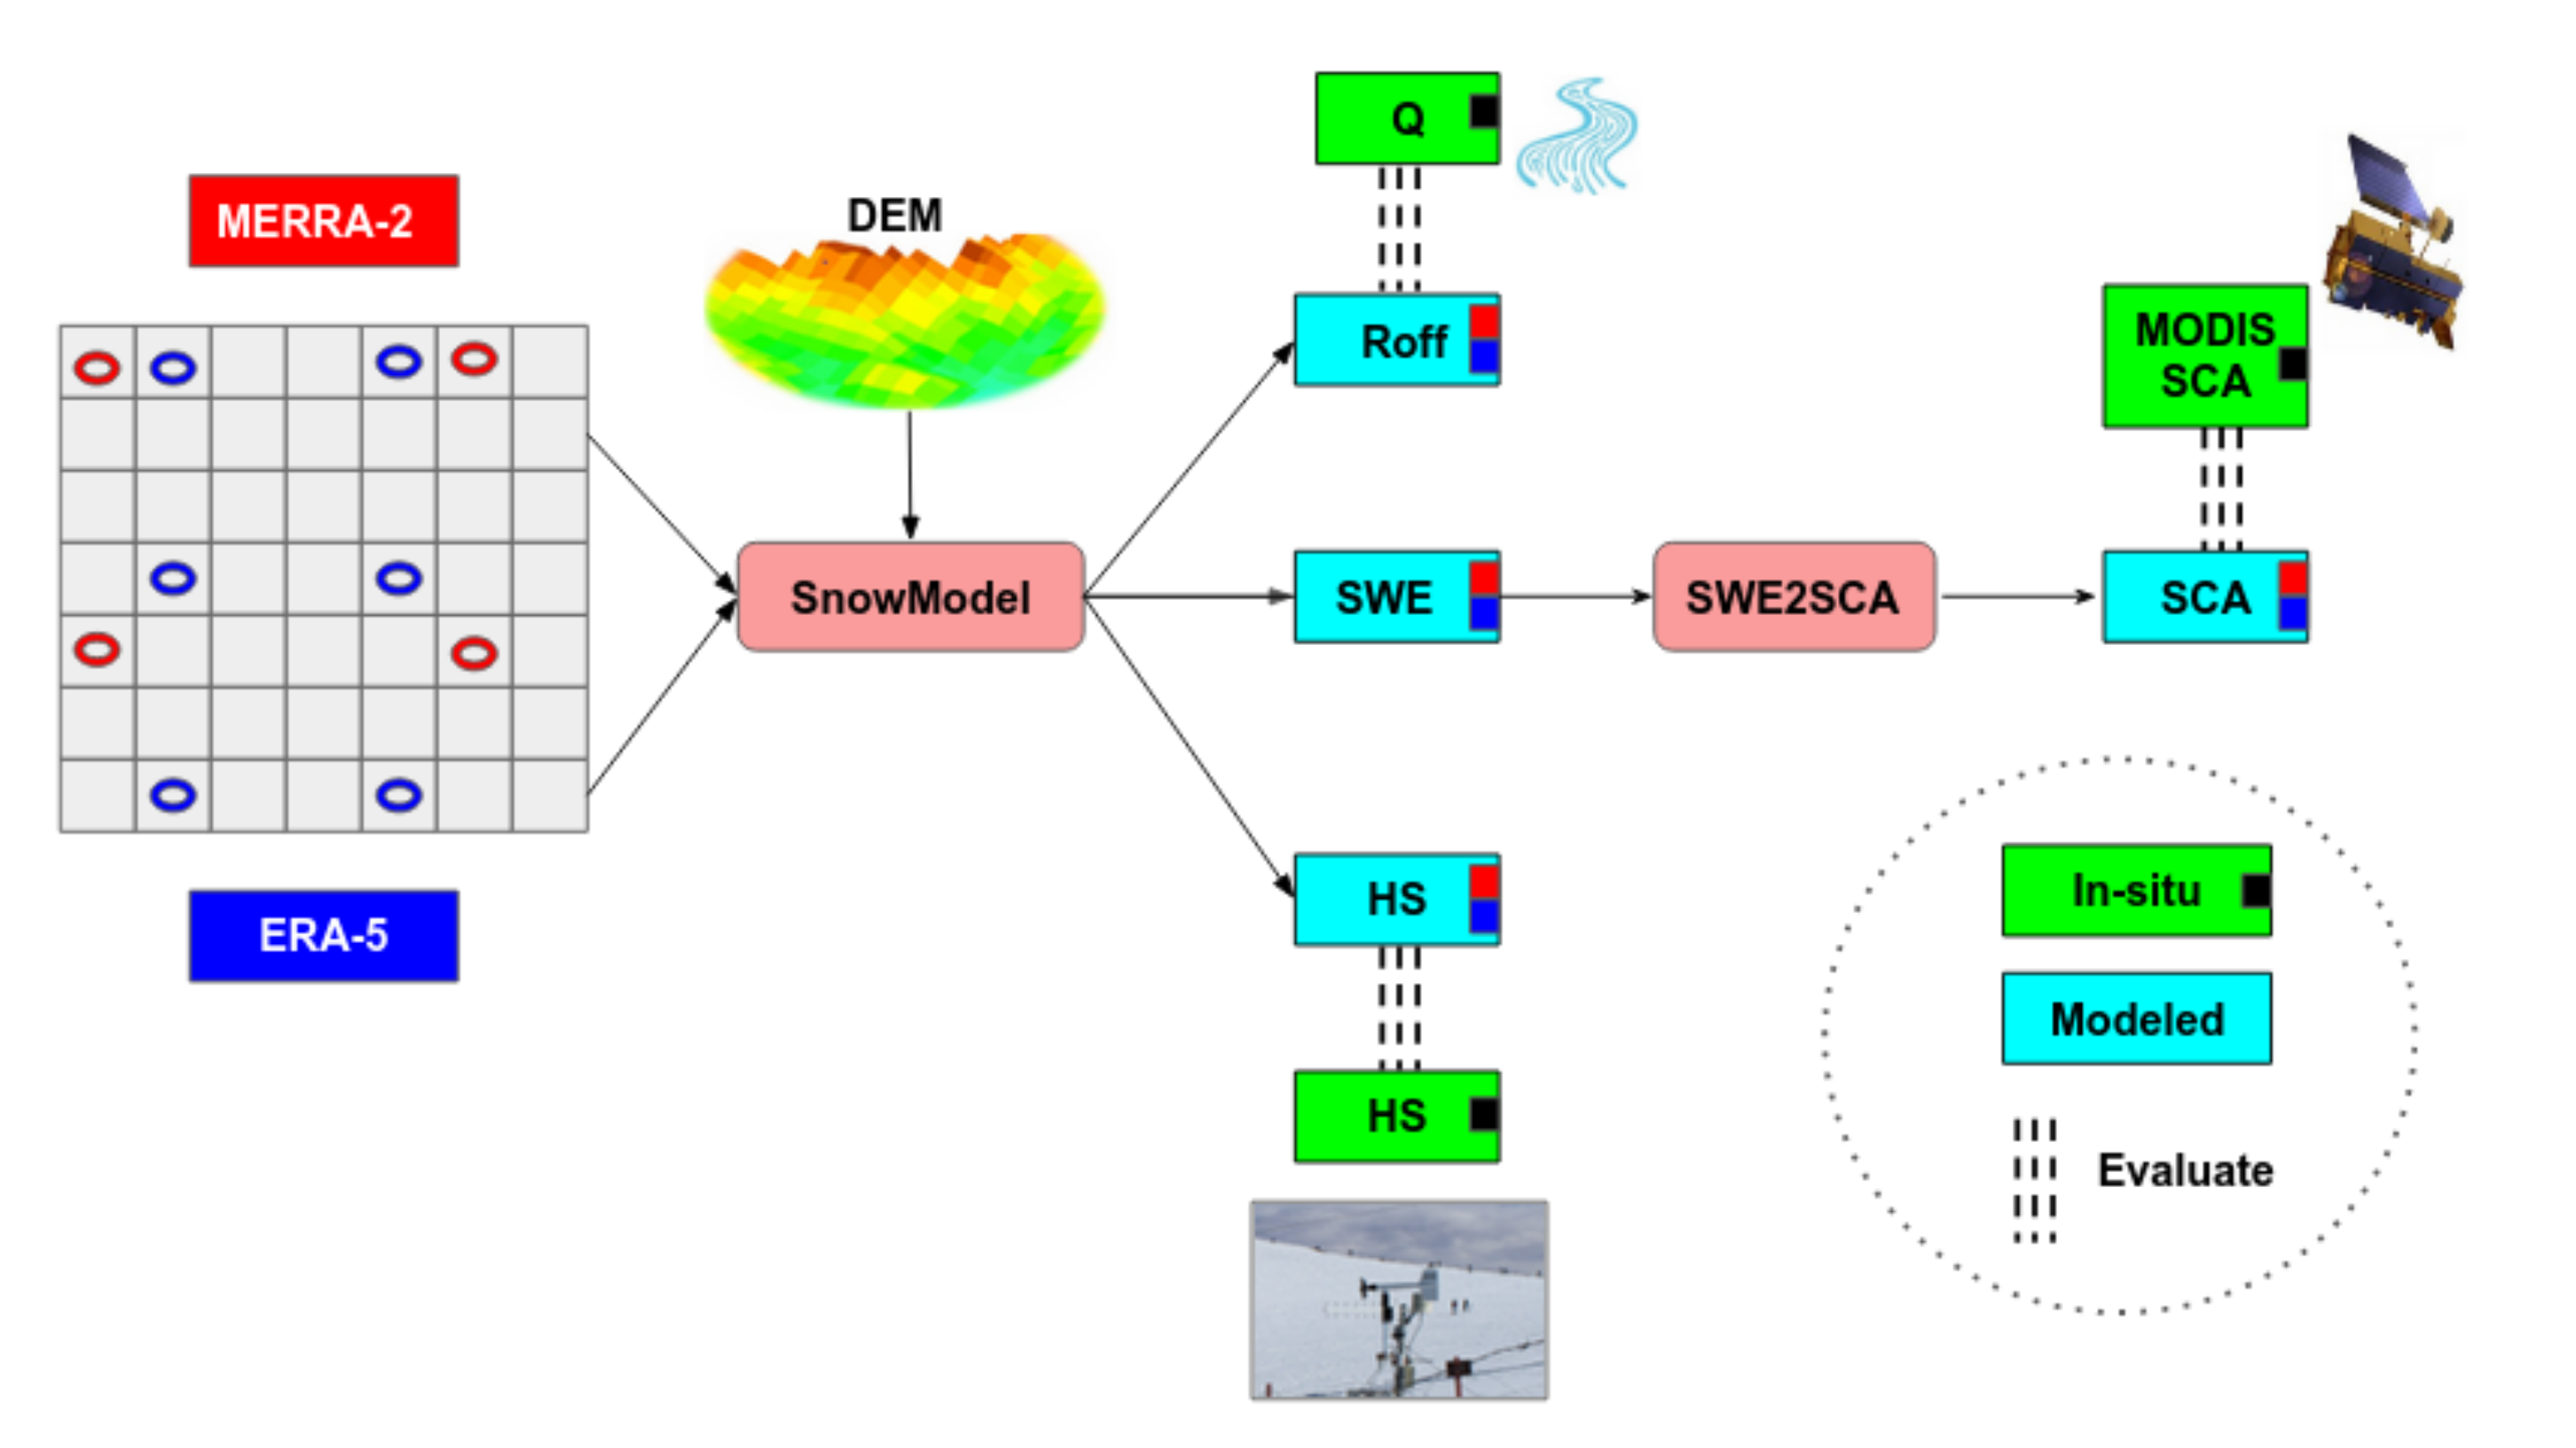
These methods of evaluation are summarized in Figure 2.
4. Results
4.1. Hs Evaluation
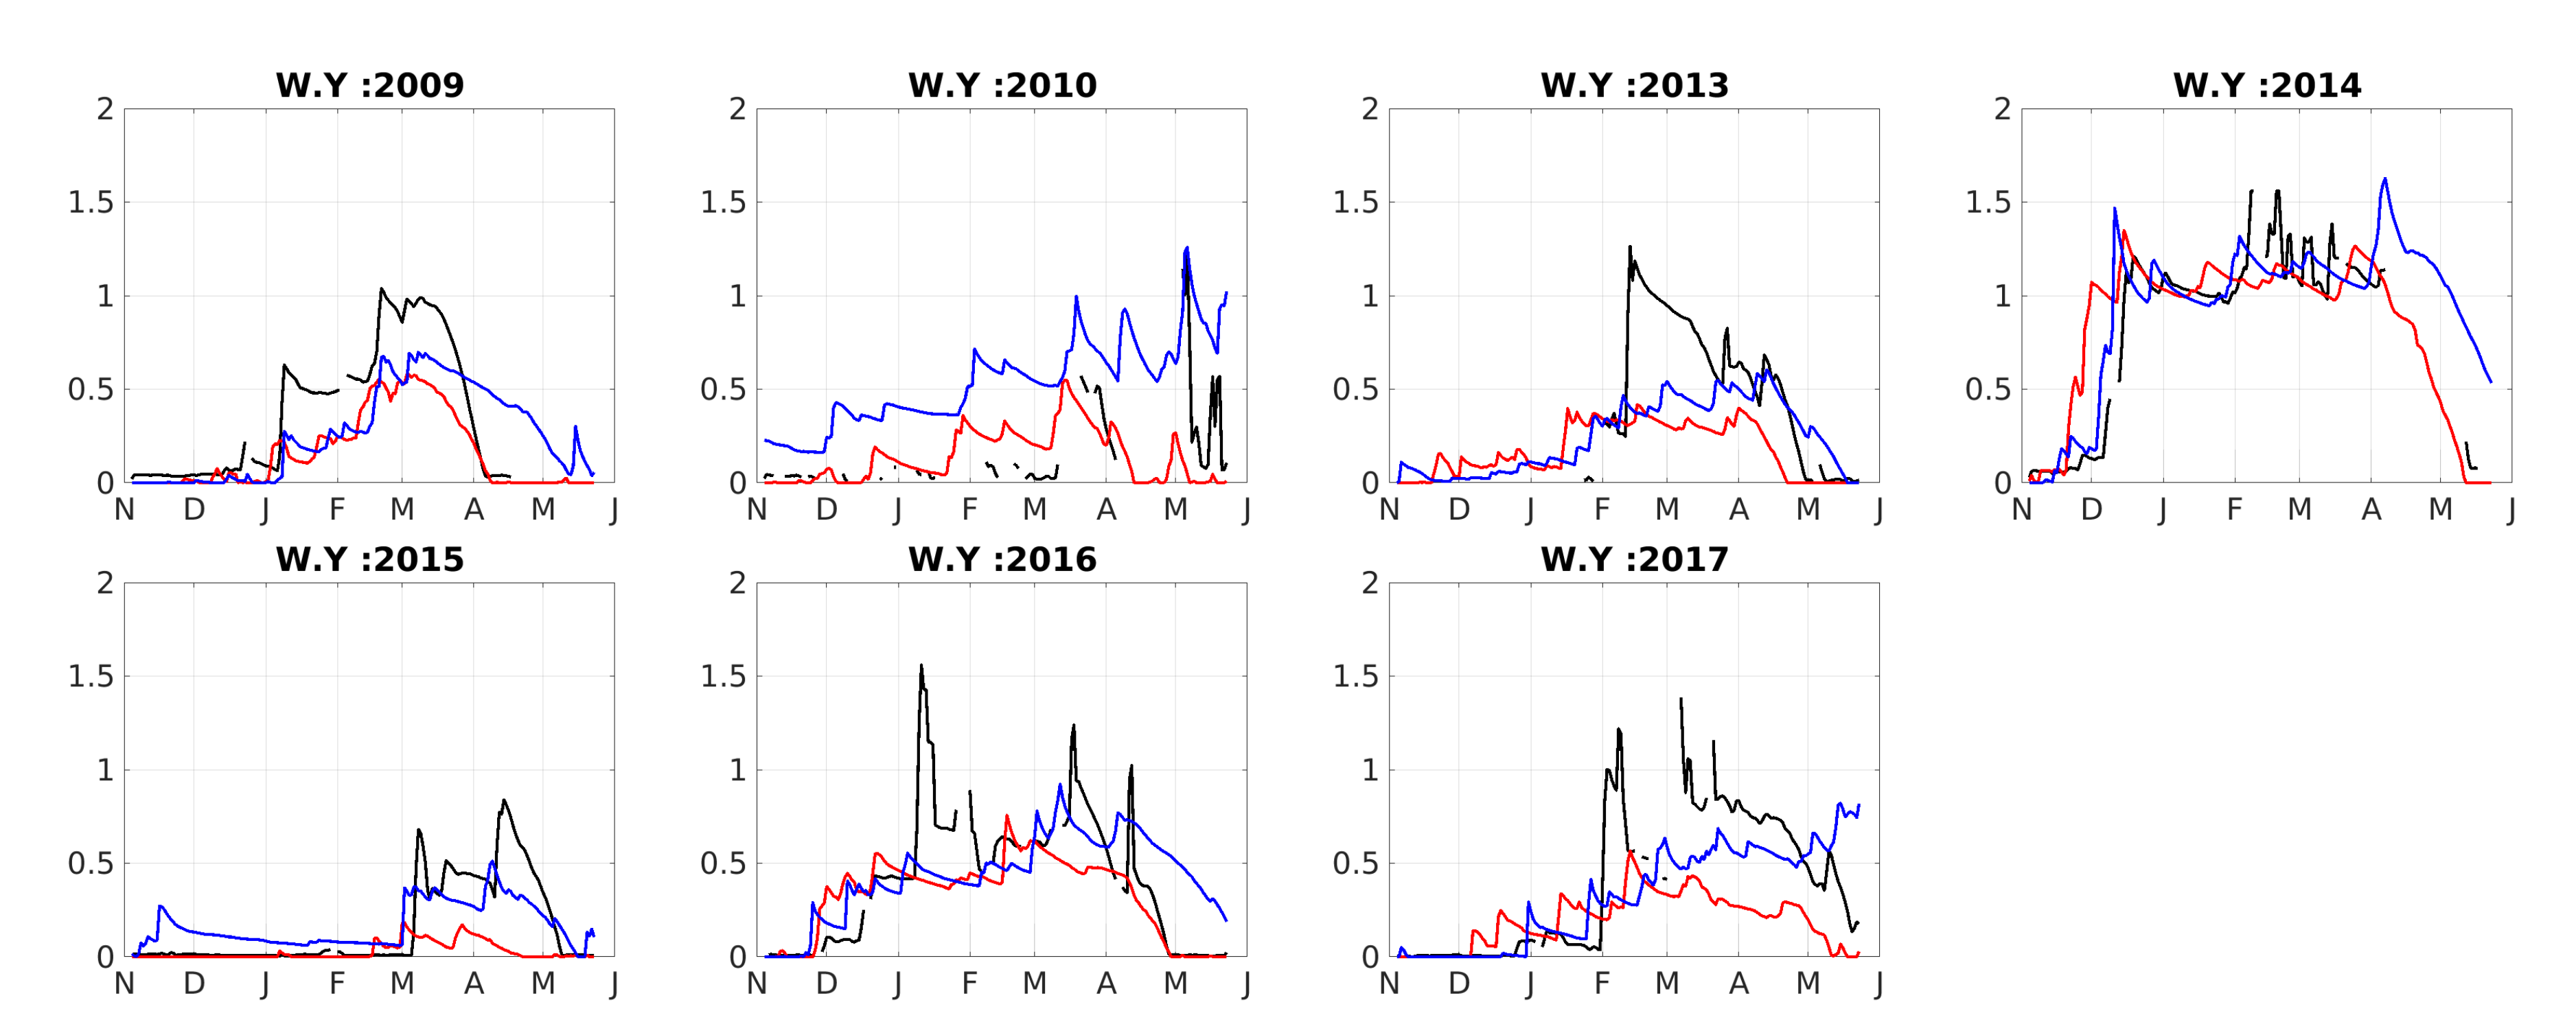
The evolution of modeled and observed daily snow height at Oukaimeden is shown in Figure 3. The evaluation of this evolution generally shows that SnowModel forced by both ERA5 and MERRA-2 performs well in terms of event detection (snowfall and melt). To complete the comparison we present the differences between modeled and observed HS in Table 2. The mean RMSE compared to observed HS is equal to 27.76 cm for ERA5 simulations and 29.61 cm for MERRA-2 simulations. In some seasons (e.g., 2010 and 2017) the model did not perform well. For these years, the RMSE is respectively.equal to 43.71 cm, 26.70 cm (ERA5), 26.29 cm, 34.93 cm (MERRA-2). Therefore in most cases ERA5 performs better than MERRA-2 in modeling the snow height evolution at Oukaimeden.
4.2. Scf Evaluation
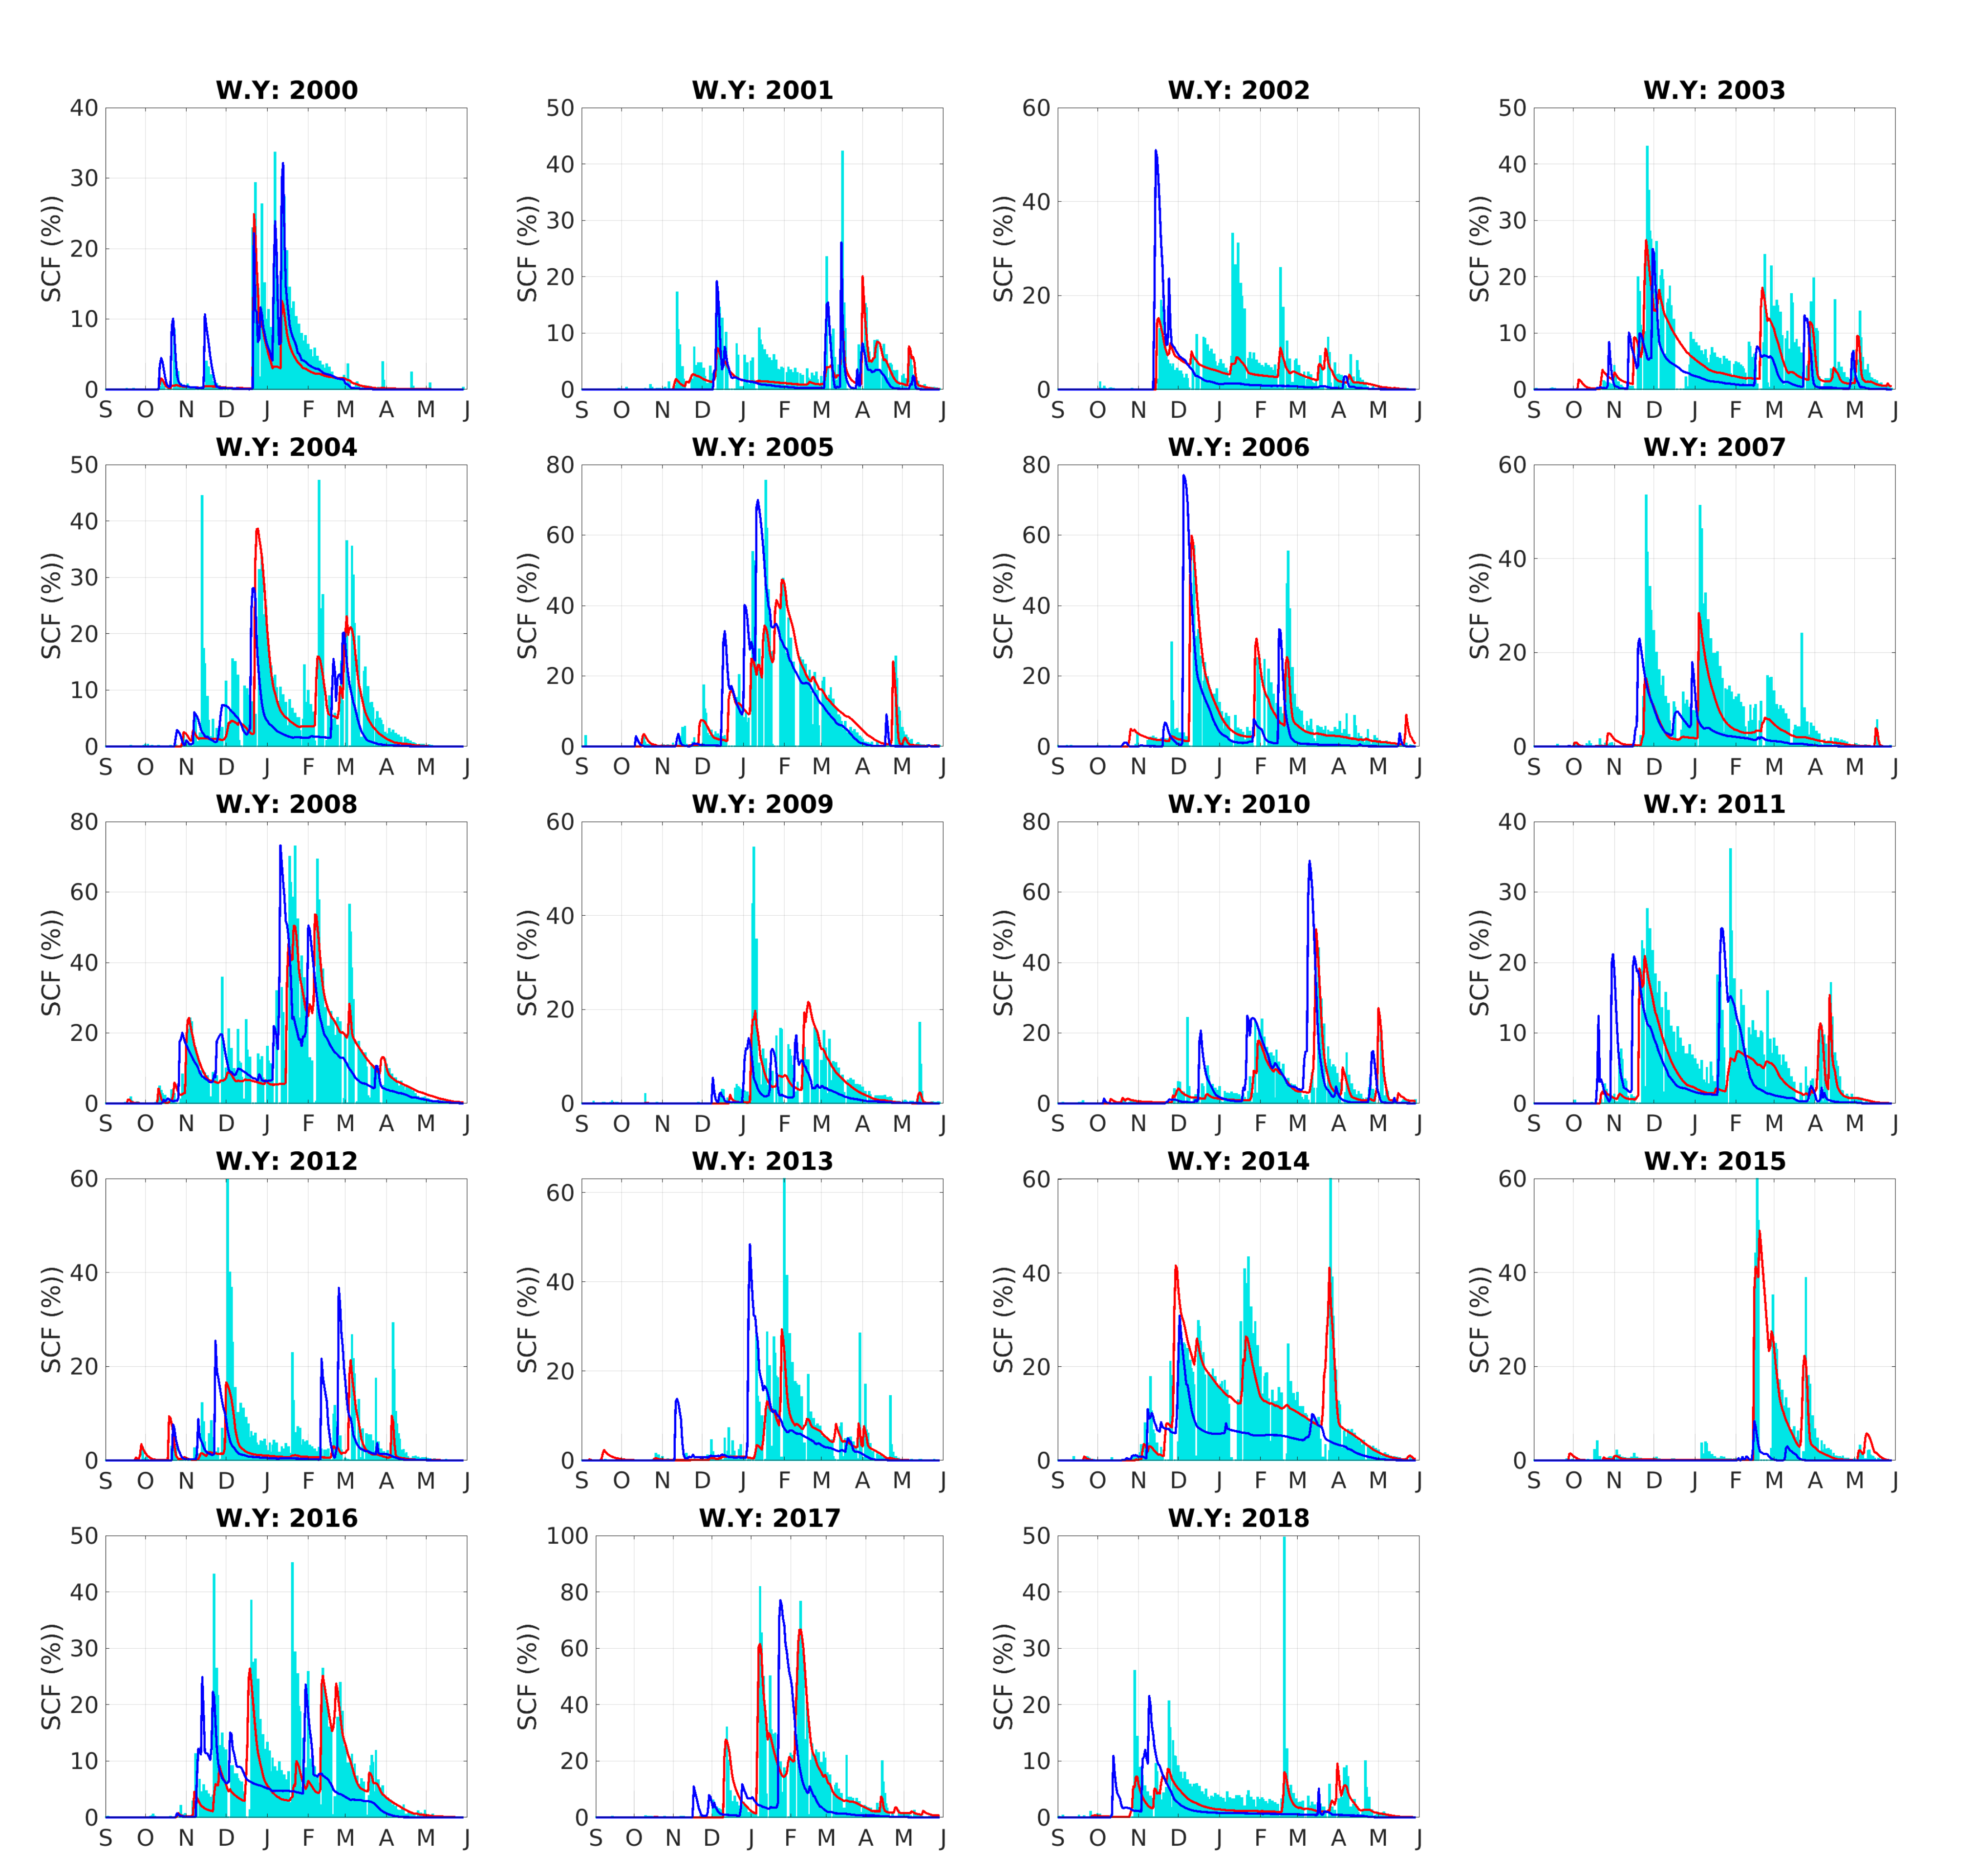
Considering the SCF evolution with respect to MODIS data (Figure 4), we find that SnowModel driven by ERA5 outperforms SnowModel forced by MERRA-2. This is confirmed by statistical metrics, such as the the adjusted R-squared (R) of the mean of daily SCF R (MODIS, ERA5) and R (MODIS, MERRA-2) are respectively equal to 0.82 and 0.66. Moreover, the same indices calculated at catchment scale show a similarly good performance of both simulation with a slight superiority of ERA5 simulation (Table 3).
The comparison of the snow cover duration (SCD) from the model output and the MODIS data shows that both model configurations reproduce well the duration of snow cover with a mean error of 15% (ERA5) and 10% (MERRA-2). It is in line with the mean error between modeled HS and observed HS at Oukaimeden (Table 2), the bias is generally positive.
4.3. Discharge Evaluation
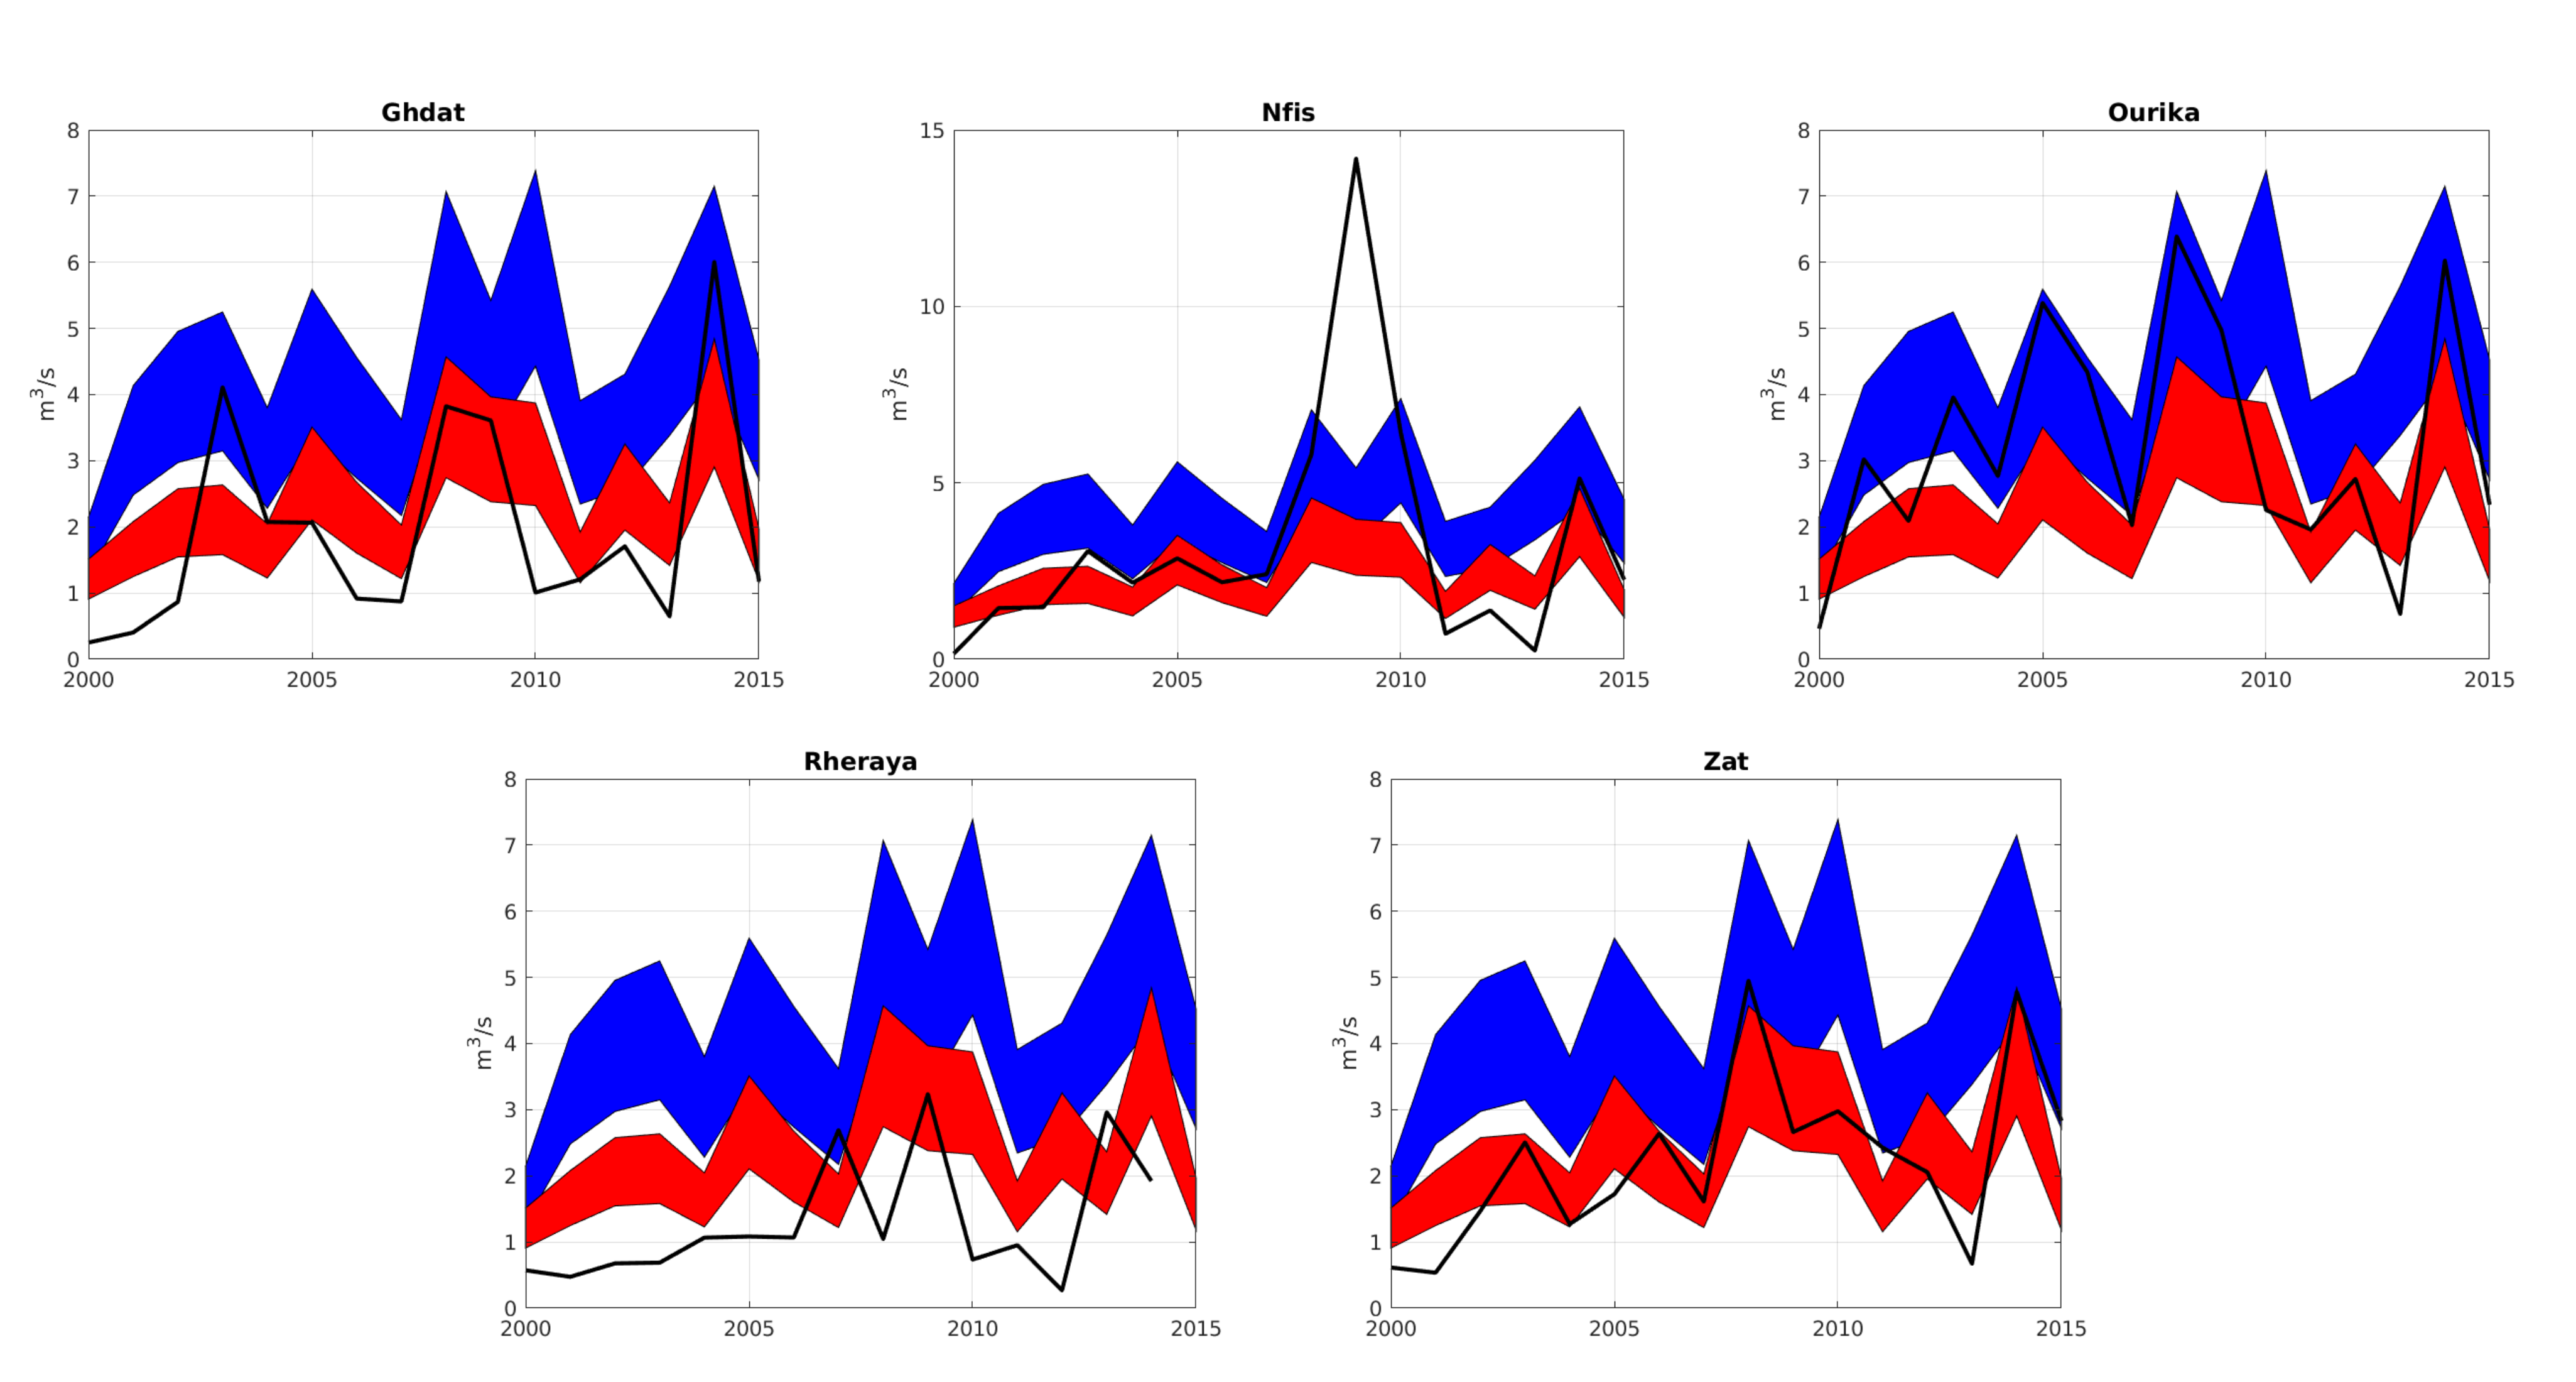
The comparison of the observed annual mean instantaneous discharge (m/s) with 30–50% of modeled surface water input shows that the models reproduce well the inter-annual variability of the annual surface water input with a correlation varying from 0.73 to 0.87 for ERA5 simulations and 0.65 to 0.82 for MERRA-2 (Figure 5 and Table 3) Some water years are poorly simulated (e.g., WY 2009 for NFIS, WY 2012 for Rheraya (Figure 5)). We also observe that the magnitude of the inter-annual variability of the annual surface water input is quite biased.
4.4. In Situ Precipitation
The comparison of the evolution of cumulative precipitation at Oukaimeden shows that the RMSE between both ERA5, MERRA-2 and the observed cumulative precipitation is suitable (90 mm for ERA5 and 106 mm for MERRA-2). However, in some years such as WY 2012 a few anomalies of precipitation are and many events are not detected as shown in (Figure 6). More, we computed the Mean R scores between the cumulative precipitations and it is equal to 0.96 and 0.92 for ERA5 and MERRA-2 respectively.
4.5. Air Temperature
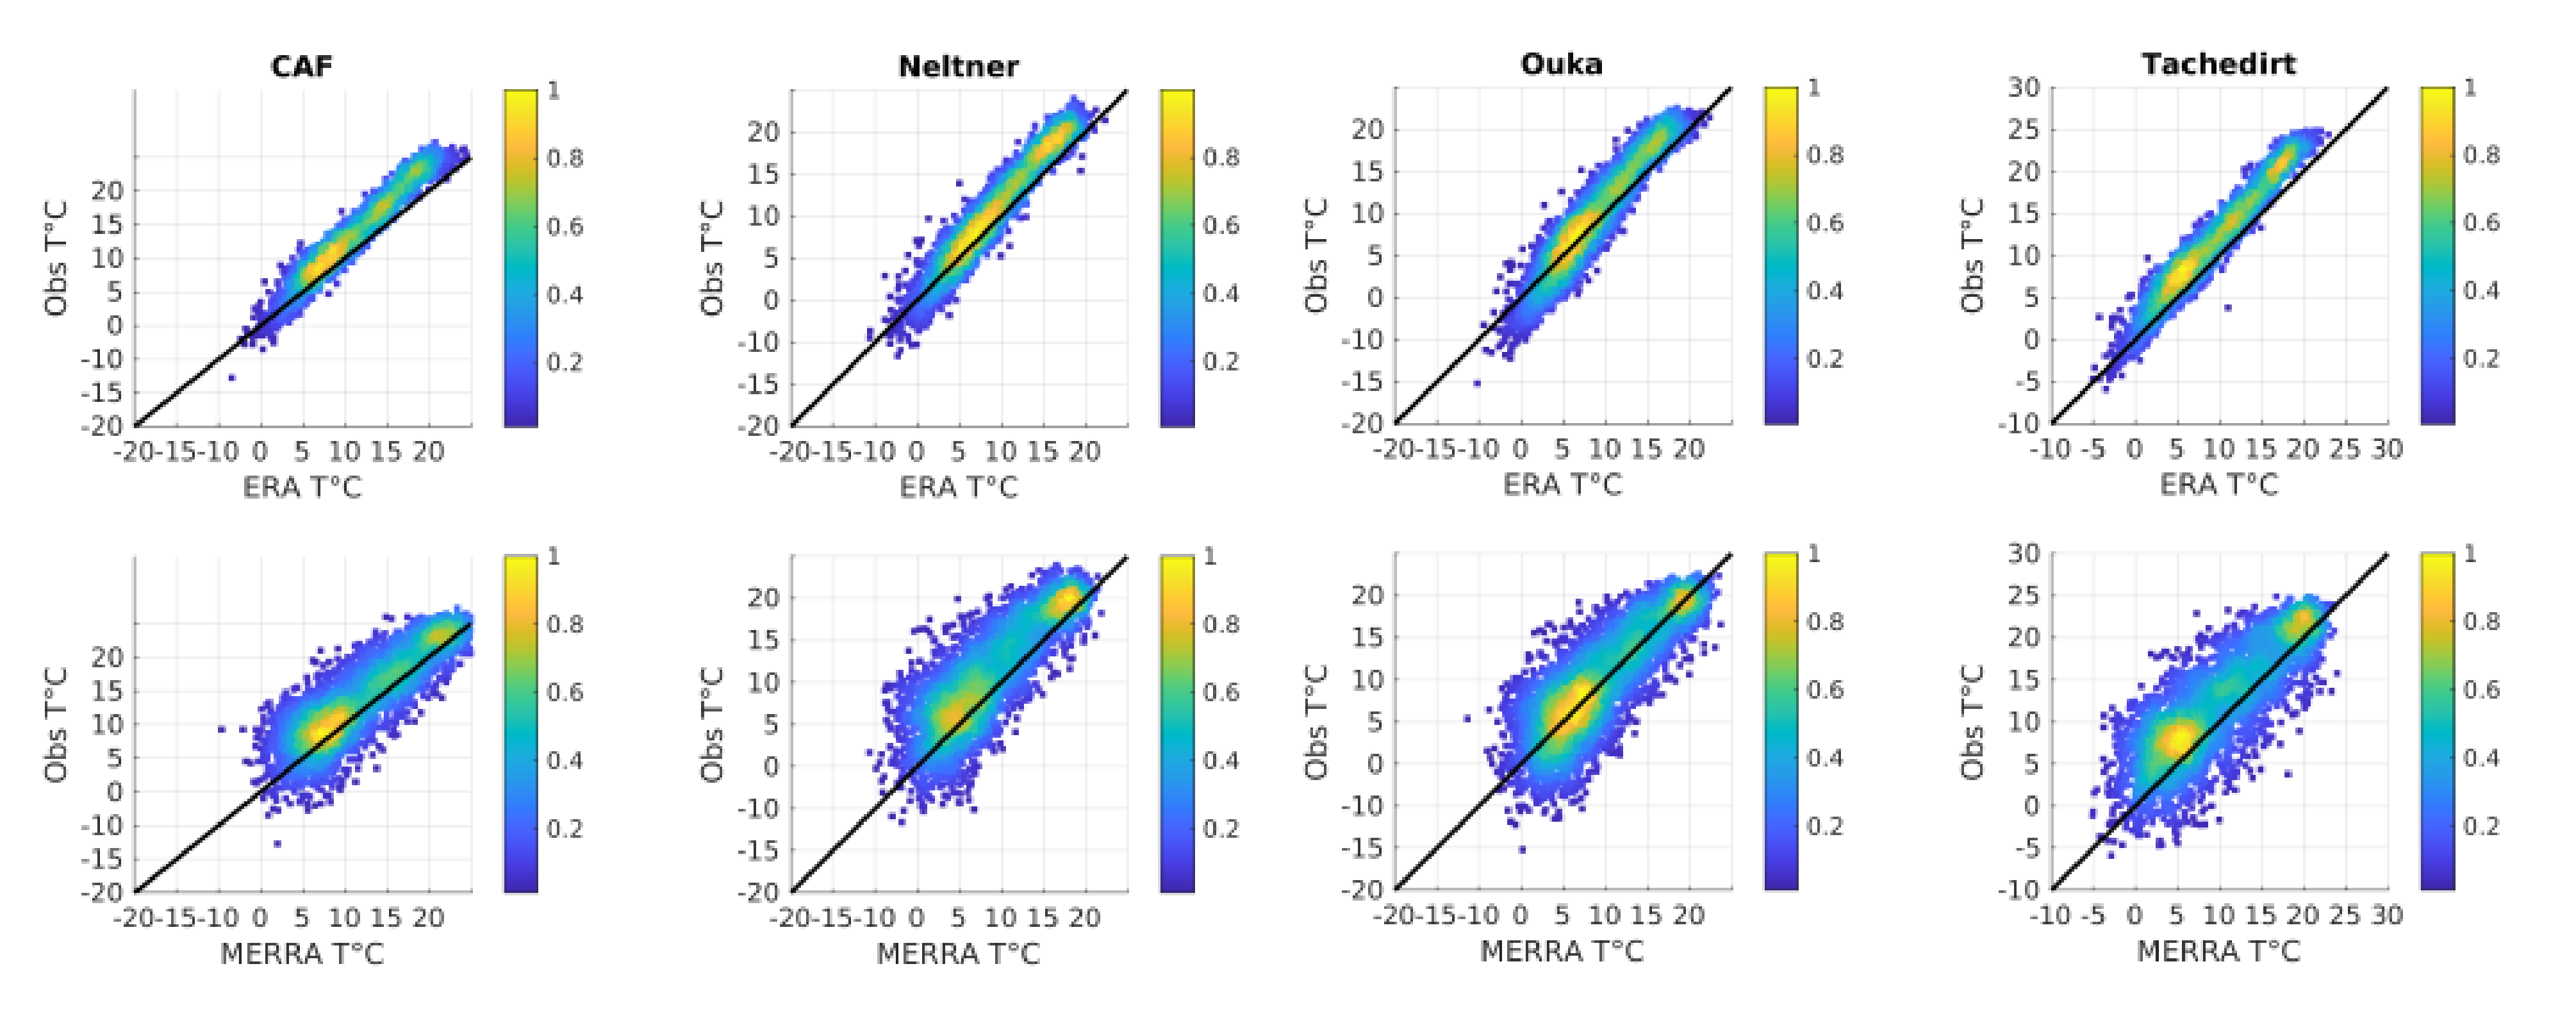
The air-temperature (T) comparison was established in four regions at the Rheraya catchment. The results confirm that the ERA5 daily average temperature (from 2002 to 2016) is closer to the observations compared to MERRA-2 (Table 4). These results could be confirmed visually in Figure 7. The distribution of daily observed temperature versus modeled ones for four different stations shows that the standard deviation for between observed temperature and ERA5 temperature is much lower than the standard deviation between observed temperature and MERRA-2 temperature.
4.6. Era5-Land Swe
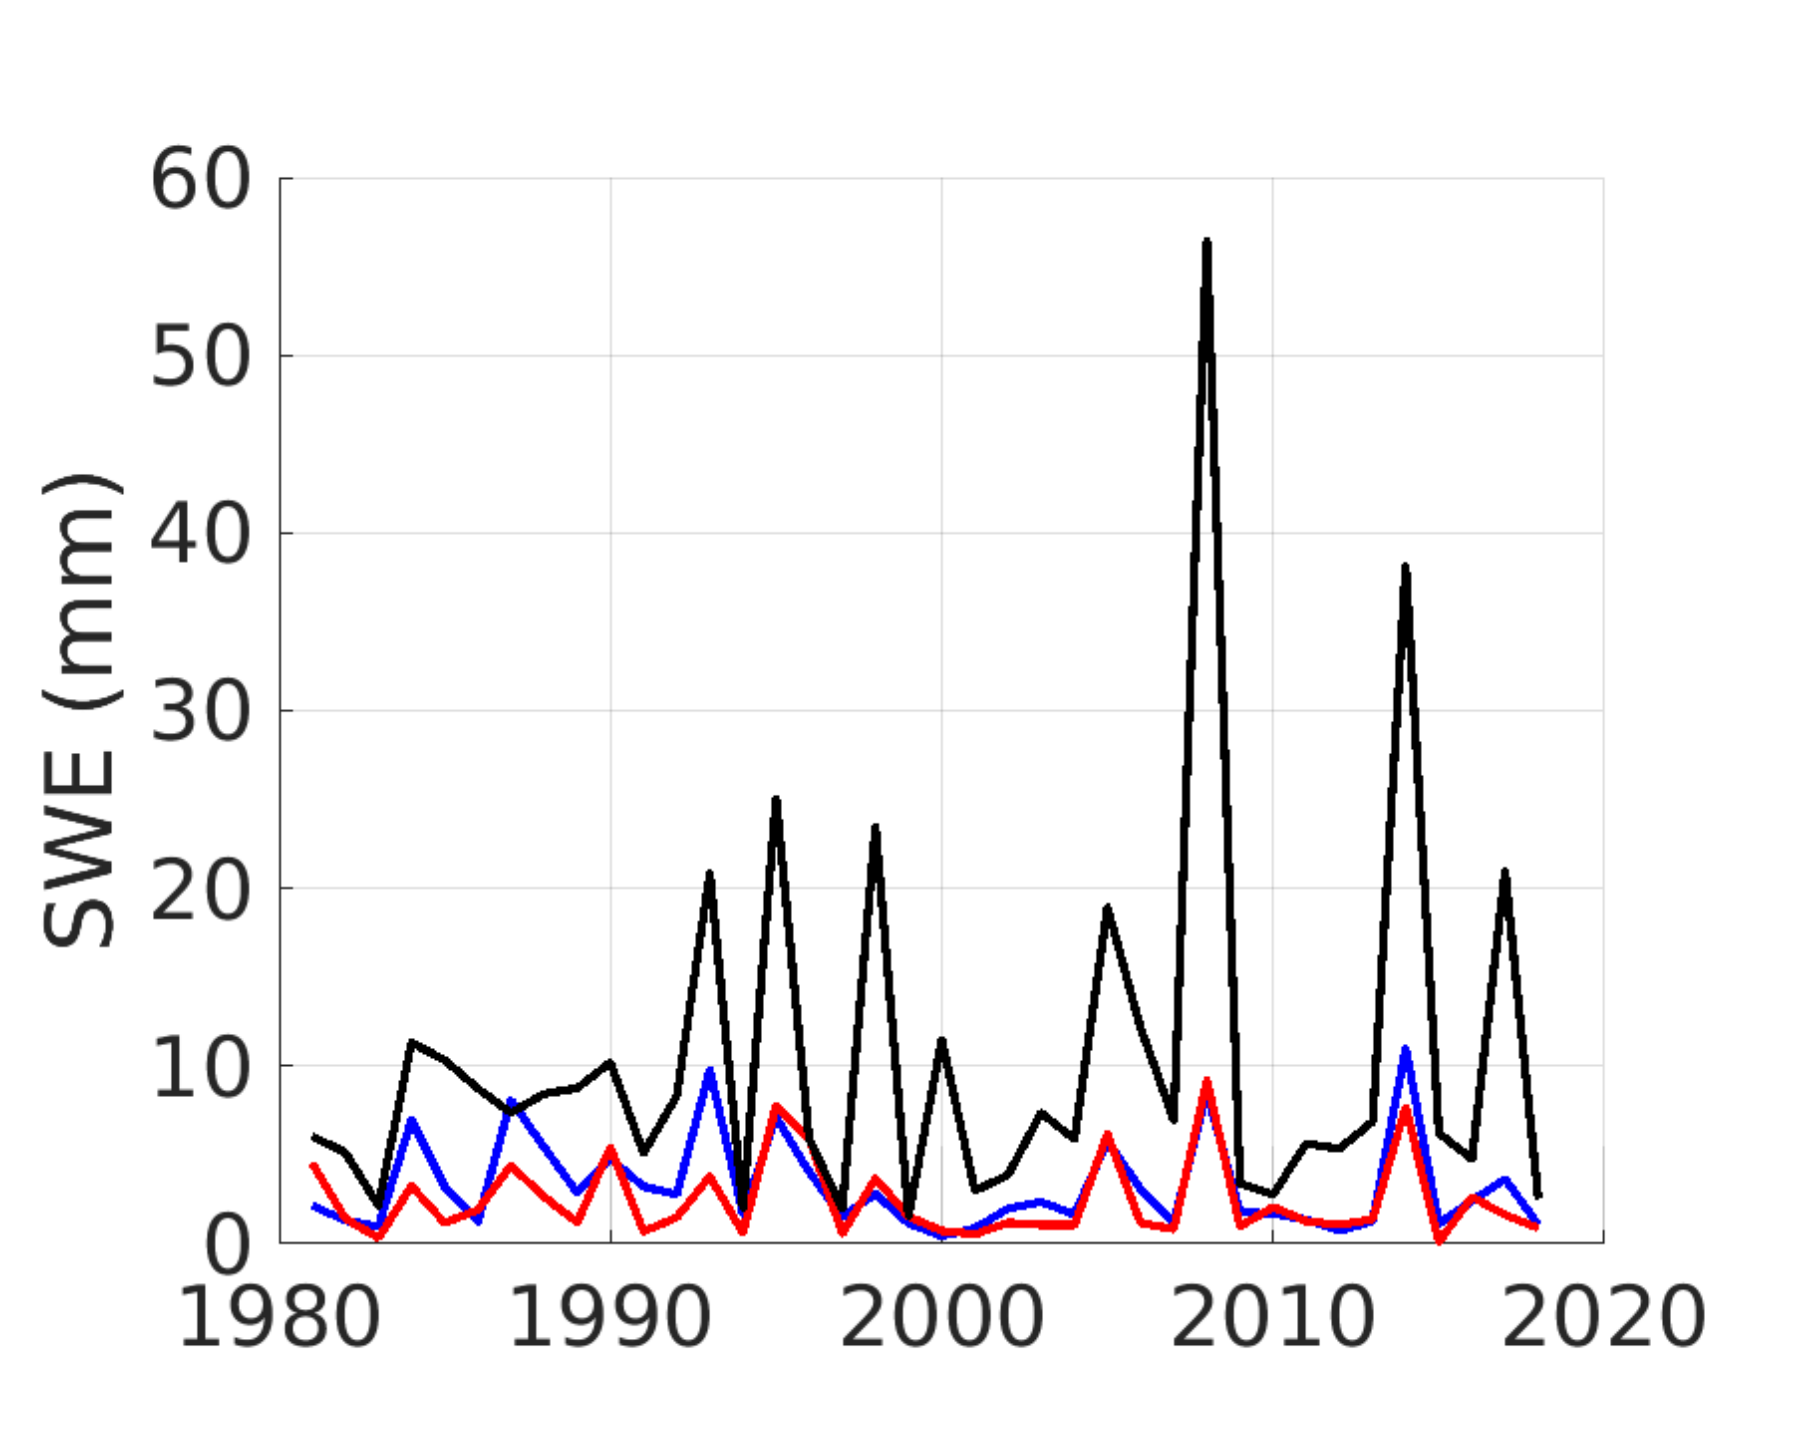
The comparison of the evolution of total SWE at the study area shows that the mean R between modeled SWE and ERA5-Land SWE is equal to 0.56 for ERA5 and 0.46 for MERRA-2. Figure 8 shows the interannual variation of the annual mean SWE averaged for the High Atlas mountains from the different outputs. The ERA5-Land SWE is considerably overestimating the SWE compared with the simulations. The mean of SWE averaged for the different products is equal to 3.24 mm, 2.47 mm and 10.40 mm for modeled SWE with ERA5, modeled SWE with MERRA-2 and ERA-Land SWE respectively.
5. Discussion
This study provides an evaluation of ERA5 and MERRA-2 to force a model of the snowpack evolution in a the High Atlas of Morocco. In this study, the snowpack evolution model SnowModel was forced by a the reanalysis for the 1981–2018 period. Given the initial coarse resolution of the meteorological reanalysis, the evaluation of the different outputs shows that SnowModel performs well with ERA5 and MERRA-2. Indeed, we assume that ERA5 has a better estimation of the key meteorological data (precipitation and temperature) when using MicroMet as downscaling scheme. In this case, it subsequently impacts the estimation of the key variables of hydrology (snow water equivalent, snow depth and surface water input). Thus, even the evaluation of the snow depth and the surface water input shows a higher quality for ERA5 simulations. These results were expected since the spatial resolution of ERA5 is lesser than MERRA-2 and therefore should give a better representation and distribution of the meteorological data. It is highly encouraged to assess this hypothesis with other downscaling techniques.
Despite the good quality of the simulations with ERA5, some discrepancies were found for some years. As an example, comparing the modeled and the observed snow height at Oukaimeden in January 2009 and February 2013 (Figure 3) show an important bias. This is mainly due to the absence of certain of snowfall events. These failures of the model are normal and also expected since it is difficult to catch local events. To this date, the estimation of precipitation and snowfall by numerical models is very challenging in mountainous regions [25,44,45]. We note also that the comparison of precipitation has been carried out over very complex terrain (Oukaimeden) where the altitude varies from 2400 m to 3200 m in less than 3 km. Thus, we believe that the focus of future work should be on the correction of precipitation using data assimilation techniques [26,46].
This study shows also that the modeled snow-covered area reproduces that observed by MODIS relatively well, but with a few differences. These differences enable us to better understand some possible sources of model and forcing errors. In the January 2009 we notice that the modeled SCF is approximately equal to the half of the observed one Figure 4. Similar underestimation is shown in the HS evolution, the observed HS is approximately equal to the double simulated Figure 3 for both ERA5 and MERRA-2. Similar underestimation could be observed also in February 2013. We also note that for many years where the SCF is adequately reproduced, the snow height is also faithfully simulated at Oukaimeden. In the High Atlas there is not much vegetation and forests especially in the middle and high altitudes where the snowpack is present for several months. Therefore, we think that MODIS limitations because of the vegetation will not affect the quality of the derived SCF [47,48] . Thus we think that the model reproduce well the SCF since the validation data are reliable.
Both modeled and observed outputs highlight the large interannual variability of the snowpack evolution, in term of amount of snow and of duration of the snowpack. There are several water years that the SCF exceeds 25% km for more than 30 days (e.g., 2005, 2011, 2014, 2016), and some water years where the SCF barely exceeds 25% (e.g., 2009, 2012, 2018) (Figure 4. HS evolution show that in the high elevated areas (Oukaimeden 3200 m.a.s.l) the snowpack generally is evaluating between December and May of each water year, with a height varying from 50 cm to 150 cm (Figure 3). With an exception for 2015 W.Y where the snow season started in March and lasted only two month (Figure 3). This anomaly of the snow season is reproduced by both simulations of HS and SCA, and by the observations of HS and SCA. This is confirmation that the reanalysis can represent extreme events well. Therefore, it could be a good resource to better understand the snowpack evolution given the lack of in situ measurements.
We conducted an intercomparison of three SWE products: ERA5-Land SWE and modeled SWE using SnowModel with ERA5 and MERRA-2. We have noticed that the modeled SWE are relatively close in terms of the interanual variation of the mean SWE averaged for the zone of interest. While, ERA5-Land SWE is overestimating the SWE compared to the modeling SWE. Given the previously proven quality of the simulations and the high value of the annual mean SWE derived from ERA5-Land (10.40 mm) we assume that ERA-Land is overestimating the SWE in the High Atlas mountains.
6. Conclusions
We presented a methodology to assess the ability of MERRA-2 and ERA5 to be downscaled and used as forcing in an independent (offline) snowpack model (SnowModel) in the High Atlas from 1981 to 2019. The results showed both reanalysis using SnowModel allow the reproduction of the snowpack state with the ERA5-driven simulations being superior. This might be related to the fact that ERA5 data are approximately four times denser than MERRA-2 data. These results suggest that ERA5 reanalysis could be used to simulate SWE distribution in the High Atlas. This leads us to think that a good estimation of SCF has a positive impact on the estimation of HS, SWE and the other variables.
However, there remain biases in the ERA5 meteorological reanalyses, which could be significantly reduced by assimilating remote sensing snow cover area products (e.g., Sentinel-2 or MODIS) [25,49]. Indeed, assimilation snow cover area derived from remote sensing products in hydrological and snowpack evolution models has shown a great added value in the literature. Andreadis and Lettenmaier [50] updated the SWE state based on MODIS observation and they noticed that their assimilation scheme improvement was evident in lower and middle elevations, especially during melt period. Thus we believe that the assimilation will lead to a better estimate of the state of the snowpack in the High Atlas mountains. Remote sensing snow cover area products could also be used to reduce uncertainty in hydrological modelling [43,51] and on correct the estimation of snowfall spatial distribution in mountainous area [52].
At the same time, the results should be complemented with more in-situ observations. Indeed, planning two or three drone acquisition in pilot catchment (e.g Rheraya or Ourika) could provide an accurate estimation of the snow height with a distributed manner (<1 m of spatial resolution). The obtained HS maps would provide a stronger evaluation criteria of the models performance.
Finally, we compared the simulated SWE with reanalyses against ERA5-Land SWE. The results obtained show important discrepancies between the simulated outputs and ERA-Land SWE dataset. This leads us to suppose that ERA5-Land SWE is not suitable for the High Atlas mountains, and a move to more detailed modeling is recommended to better reproduce the snowpack state.
Author Contributions
M.W.B. and S.G. designed the study with the help of A.B. and L.H., M.W.B. took care of the IT side and ran the model. A.M. processed remote sensing images. M.W.B., S.G., and A.B. analyzed the results. Project administration, A.C. and A.B. M.W.B. and S.G. wrote the paper with inputs from all the co-authors. All authors have read and agreed to the published version of the manuscript.
Funding
This research was funded by the research program “MorSnow-1”(Accord spécifique n39 entre OCP S.A et UM6P).
Conflicts of Interest
The authors declare no conflict of interest.
Abbreviations
The following abbreviations are used in this manuscript:
| HS | snow height |
| SCA | snow cover area |
| SCF | snow cover fraction |
| SWE | snow water equivalent |
| P | precipitation |
| T | Temperature |
References
- Agence Japonaise de Coopération Internationale. Etude du Plan de Gestion Integrée des Ressources en Eau dans la Plaine du Haouz; Agence Japonaise de Coopération Internationale: Tokyo, Japan, 2008. [Google Scholar]
- Viviroli, D.; Dürr, H.H.; Messerli, B.; Meybeck, M.; Weingartner, R. Mountains of the world, water towers for humanity: Typology, mapping, and global significance. Water Resour. Res. 2007, 43. [Google Scholar] [CrossRef] [Green Version]
- Fayad, A.; Gascoin, S.; Faour, G.; Fanise, P.; Drapeau, L.; Somma, J.; Fadel, A.; Bitar, A.A.; Escadafal, R. Snow observations in Mount Lebanon (2011–2016). Earth Syst. Sci. Data 2017, 9, 573–587. [Google Scholar] [CrossRef] [Green Version]
- Iglesias, A.; Garrote, L.; Flores, F.; Moneo, M. Challenges to manage the risk of water scarcity and climate change in the Mediterranean. Water Resour. Manag. 2007, 21, 775–788. [Google Scholar] [CrossRef]
- Nogués-Bravo, D.; Araújo, M.B.; Errea, M.; Martinez-Rica, J. Exposure of global mountain systems to climate warming during the 21st Century. Glob. Environ. Change 2007, 17, 420–428. [Google Scholar] [CrossRef]
- Boudhar, A.; Hanich, L.; Boulet, G.; Duchemin, B.; Berjamy, B.; Chehbouni, A. Evaluation of the snowmelt runoff model in the Moroccan High Atlas Mountains using two snow-cover estimates. Hydrol. Sci. J. 2009, 54, 1094–1113. [Google Scholar] [CrossRef]
- N’da, A.B.; Bouchaou, L.; Reichert, B.; Hanich, L.; Brahim, Y.A.; Chehbouni, A.; Beraaouz, E.H.; Michelot, J.L. Isotopic signatures for the assessment of snow water resources in the Moroccan high Atlas mountains: Contribution to surface and groundwater recharge. Environ. Earth Sci. 2016, 75, 755. [Google Scholar] [CrossRef]
- Jarlan, L.; Khabba, S.; Er-Raki, S.; Le Page, M.; Hanich, L.; Fakir, Y.; Merlin, O.; Mangiarotti, S.; Gascoin, S.; Ezzahar, J.; et al. Remote sensing of water resources in semi-arid Mediterranean areas: The joint international laboratory TREMA. Int. J. Remote Sens. 2015, 36, 4879–4917. [Google Scholar] [CrossRef]
- Chehbouni, A.; Escadafal, R.; Duchemin, B.; Boulet, G.; Simonneaux, V.; Dedieu, G.; Mougenot, B.; Khabba, S.; Kharrou, H.; Maisongrande, P.; et al. An integrated modelling and remote sensing approach for hydrological study in arid and semi-arid regions: The SUDMED Programme. Int. J. Remote Sens. 2008, 29, 5161–5181. [Google Scholar] [CrossRef] [Green Version]
- Dozier, J.; Bair, E.H.; Davis, R.E. Estimating the spatial distribution of snow water equivalent in the world’s mountains. Wiley Interdiscip. Rev. Water 2016, 3, 461–474. [Google Scholar] [CrossRef]
- Chaponniere, A.; Maisongrande, P.; Duchemin, B.; Hanich, L.; Boulet, G.; Escadafal, R.; Elouaddat, S. A combined high and low spatial resolution approach for mapping snow covered areas in the Atlas mountains. Int. J. Remote Sens. 2005, 26, 2755–2777. [Google Scholar] [CrossRef] [Green Version]
- Boudhar, A.; Duchemin, B.; Hanich, L.; Jarlan, L.; Chaponnière, A.; Maisongrande, P.; Boulet, G.; Chehbouni, A. Long-term analysis of snow-covered area in the Moroccan High-Atlas through remote sensing. Int. J. Appl. Earth Obs. Geoinf. 2010, 12, S109–S115. [Google Scholar] [CrossRef] [Green Version]
- Marchane, A.; Jarlan, L.; Hanich, L.; Boudhar, A.; Gascoin, S.; Tavernier, A.; Filali, N.; Le Page, M.; Hagolle, O.; Berjamy, B. Assessment of daily MODIS snow cover products to monitor snow cover dynamics over the Moroccan Atlas mountain range. Remote Sens. Environ. 2015, 160, 72–86. [Google Scholar] [CrossRef]
- Baba, M.W.; Gascoin, S.; Hagolle, O.; Bourgeois, E.; Desjardins, C.; Dedieu, G. Evaluation of Methods for Mapping the Snow Cover Area at High Spatio-Temporal Resolution with VENµS. Remote Sens. 2020, 12, 3058. [Google Scholar] [CrossRef]
- Boudhar, A.; Boulet, G.; Hanich, L.; Sicart, J.E.; Chehbouni, A. Energy fluxes and melt rate of a seasonal snow cover in the Moroccan High Atlas. Hydrol. Sci. J. 2016, 61, 931–943. [Google Scholar] [CrossRef]
- Bouamri, H.; Boudhar, A.; Gascoin, S.; Kinnard, C. Performance of temperature and radiation index models for point-scale snow water equivalent (SWE) simulations in the Moroccan High Atlas Mountains. Hydrol. Sci. J. 2018, 63, 1844–1862. [Google Scholar] [CrossRef]
- Baba, M.W.; Gascoin, S.; Jarlan, L.; Simonneaux, V.; Hanich, L. Variations of the Snow Water Equivalent in the Ourika catchment (Morocco) over 2000–2018 using downscaled MERRA-2 data. Water 2018, 10, 1120. [Google Scholar] [CrossRef] [Green Version]
- Baba, M.W.; Gascoin, S.; Kinnard, C.; Marchane, A.; Hanich, L. Effect of digital elevation model resolution on the simulation of the snow cover evolution in the High Atlas. Water Resour. Res. 2019, 55, 5360–5378. [Google Scholar] [CrossRef]
- Tuel, A.; Chehbouni, A.; Eltahir, E.A. Dynamics of seasonal snowpack over the High Atlas. J. Hydrol. 2020, 125657. [Google Scholar] [CrossRef]
- Raimonet, M.; Oudin, L.; Thieu, V.; Silvestre, M.; Vautard, R.; Rabouille, C.; Moigne, P.L. Evaluation of Gridded Meteorological Datasets for Hydrological Modeling. J. Hydrometeorol. 2017, 18, 3027–3041. [Google Scholar] [CrossRef]
- Hersbach, H.; Bell, B.; Berrisford, P.; Hirahara, S.; Horányi, A.; Muñoz-Sabater, J.; Nicolas, J.; Peubey, C.; Radu, R.; Schepers, D.; et al. The ERA5 global reanalysis. Q. J. R. Meteorol. Soc. 2020, 146, 1999–2049. [Google Scholar] [CrossRef]
- Gelaro, R.; McCarty, W.; Suárez, M.J.; Todling, R.; Molod, A.; Takacs, L.; Randles, C.A.; Darmenov, A.; Bosilovich, M.G.; Reichle, R.; et al. The modern-era retrospective analysis for research and applications, version 2 (MERRA-2). J. Clim. 2017, 30, 5419–5454. [Google Scholar] [CrossRef]
- Mernild, S.H.; Liston, G.E.; Hiemstra, C.A.; Yde, J.C.; McPhee, J.; Malmros, J.K. The Andes Cordillera. Part II: Rio Olivares Basin snow conditions (1979–2014), central Chile. Int. J. Climatol. 2017, 37, 1699–1715. [Google Scholar] [CrossRef]
- Margulis, S.A.; Liu, Y.; Baldo, E. A joint Landsat-and MODIS-based reanalysis approach for midlatitude montane seasonal snow characterization. Front. Earth Sci. 2019, 7, 272. [Google Scholar] [CrossRef]
- Alonso-Gónzalez, E.; Gutmann, E.; Aalstad, K.; Fayad, A.; Gascoin, S. Snowpack dynamics in the Lebanese mountains from quasi-dynamically downscaled ERA5 reanalysis updated by assimilating remotely-sensed fractional snow-covered area. Hydrol. Earth Syst. Sci. Discuss. 2020, 1–31. [Google Scholar] [CrossRef]
- Baba, M.W.; Gascoin, S.; Hanich, L. Assimilation of Sentinel-2 data into a snowpack model in the High Atlas of Morocco. Remote Sens. 2018, 10, 1982. [Google Scholar] [CrossRef] [Green Version]
- Zkhiri, W.; Tramblay, Y.; Hanich, L.; Jarlan, L.; Ruelland, D. Spatiotemporal characterization of current and future droughts in the High Atlas basins (Morocco). Theor. Appl. Climatol. 2019, 135, 593–605. [Google Scholar] [CrossRef]
- Lehmann, J.; Kretschmer, M.; Schauberger, B.; Wechsung, F. Potential for early forecast of Moroccan wheat yields based on climatic drivers. Geophys. Res. Lett. 2020, 47, e2020GL087516. [Google Scholar] [CrossRef]
- Jourdier, B. Evaluation of ERA5, MERRA-2, COSMO-REA6, NEWA and AROME to simulate wind power production over France. Adv. Sci. Res. 2020, 17, 63–77. [Google Scholar] [CrossRef]
- Liston, G.E.; Elder, K. A distributed snow-evolution modeling system (SnowModel). J. Hydrometeorol. 2006, 7, 1259–1276. [Google Scholar] [CrossRef] [Green Version]
- ERA5-Land Hourly Data from 1981 to Present. Copernicus Climate Change Service (C3S) Climate Data Store (CDS). Available online: https://cds.climate.copernicus.eu/cdsapp#!/dataset/10.24381/cds.e2161bac?tab=overview (accessed on 14 February 2021).
- Simonneaux, V.; Hanich, L.; Boulet, G.; Thomas, S. Modelling runoff in the Rheraya Catchment (High Atlas, Morocco) using the simple daily model GR4J. Trends over the last decades. In In Proceedings of the 13th IWRA World Water Congress, Montpellier, France, 1–4 September 2008. [Google Scholar]
- Modern-Era Retrospective Analysis for Research and Applications, Version 2. Available online: https://gmao.gsfc.nasa.gov/reanalysis/MERRA-2/ (accessed on 16 January 2021).
- Jarvis, A.; Reuter, H.I.; Nelson, A.; Guevara, E. Hole-Filled SRTM for the Globe Version 4. CGIAR-CSI SRTM 90m Database. 2008, 15, 25–54. Available online: http://srtm.Csi.Cgiar.Org (accessed on 23 March 2021).
- ESA. Land Cover CCI Product User Guide Version 2. Techical Report. 2017. Available online: maps.elie.ucl.ac.be/CCI/viewer/download/ESACCI-LC-Ph2-PUGv22.0.pdf (accessed on 17 March 2021).
- Hall, D.; Riggs, G.; Salomonson, V. MODIS/Terra Snow Cover Daily L3 Global 500 m Grid, Version 6; NASA National Snow and Ice Data Center Distributed Active Archive Center: Boulder, CO, USA, 2016. [Google Scholar]
- Liston, G.E.; Elder, K. A meteorological distribution system for high-resolution terrestrial modeling (MicroMet). J. Hydrometeorol. 2006, 7, 217–234. [Google Scholar] [CrossRef] [Green Version]
- Liston, G.E.; Haehnel, R.B.; Sturm, M.; Hiemstra, C.A.; Berezovskaya, S.; Tabler, R.D. Simulating complex snow distributions in windy environments using SnowTran-3D. J. Glaciol. 2007, 53, 241–256. [Google Scholar] [CrossRef] [Green Version]
- Liston, G.E.; Itkin, P.; Stroeve, J.; Tschudi, M.; Stewart, J.S.; Pedersen, S.H.; Reinking, A.K.; Elder, K. A Lagrangian Snow-Evolution System for Sea-Ice Applications (SnowModel-LG): Part I—Model Description. J. Geophys. Res. Ocean. 2020, 125, e2019JC015913. [Google Scholar] [CrossRef]
- Gascoin, S.; Lhermitte, S.; Kinnard, C.; Bortels, K.; Liston, G.E. Wind effects on snow cover in Pascua-Lama, Dry Andes of Chile. Adv. Water Resour. 2013, 55, 25–39. [Google Scholar] [CrossRef] [Green Version]
- Fayad, A.; Gascoin, S. The role of liquid water percolation representation in estimating snow water equivalent in a Mediterranean mountain region (Mount Lebanon). Hydrol. Earth Syst. Sci. 2020, 24, 1527–1542. [Google Scholar] [CrossRef] [Green Version]
- Parajka, J.; Blöschl, G. The value of MODIS snow cover data in validating and calibrating conceptual hydrologic models. J. Hydrol. 2008, 358, 240–258. [Google Scholar] [CrossRef]
- Di Marco, N.; Avesani, D.; Righetti, M.; Zaramella, M.; Majone, B.; Borga, M. Reducing hydrological modelling uncertainty by using MODIS snow cover data and a topography-based distribution function snowmelt model. J. Hydrol. 2021, 126020. [Google Scholar] [CrossRef]
- Gottardi, F.; Obled, C.; Gailhard, J.; Paquet, E. Statistical reanalysis of precipitation fields based on ground network data and weather patterns: Application over French mountains. J. Hydrol. 2012, 432, 154–167. [Google Scholar] [CrossRef]
- Nepal, S.; Krause, P.; Flügel, W.A.; Fink, M.; Fischer, C. Understanding the hydrological system dynamics of a glaciated alpine catchment in the Himalayan region using the J2000 hydrological model. Hydrol. Process 2014, 28, 1329–1344. [Google Scholar] [CrossRef]
- Margulis, S.A.; Cortés, G.; Girotto, M.; Durand, M. A Landsat-era Sierra Nevada snow reanalysis (1985–2015). J. Hydrometeorol. 2016, 17, 1203–1221. [Google Scholar] [CrossRef]
- Gascoin, S.; Hagolle, O.; Huc, M.; Jarlan, L.; Dejoux, J.F.; Szczypta, C.; Marti, R.; Sánchez, R. A snow cover climatology for the Pyrenees from MODIS snow products. Hydrol. Earth Syst. Sci. 2015, 19, 2337–2351. [Google Scholar] [CrossRef] [Green Version]
- Di Marco, N.; Righetti, M.; Avesani, D.; Zaramella, M.; Notarnicola, C.; Borga, M. Comparison of MODIS and Model-Derived Snow-Covered Areas: Impact of Land Use and Solar Illumination Conditions. Geosciences 2020, 10, 134. [Google Scholar] [CrossRef] [Green Version]
- Fiddes, J.; Aalstad, K.; Westermann, S. Hyper-resolution ensemble-based snow reanalysis in mountain regions using clustering. Hydrol. Earth Syst. Sci. 2019, 23, 4717–4736. [Google Scholar] [CrossRef] [Green Version]
- Andreadis, K.M.; Lettenmaier, D.P. Assimilating remotely sensed snow observations into a macroscale hydrology model. Adv. Water Resour. 2006, 29, 872–886. [Google Scholar] [CrossRef]
- Riboust, P.; Thirel, G.; Le Moine, N.; Ribstein, P. Revisiting a simple degree-day model for integrating satellite data: implementation of SWE-SCA hystereses. J. Hydrol. Hydromech. 2019, 67, 70–81. [Google Scholar] [CrossRef] [Green Version]
- Shrestha, M.; Wang, L.; Koike, T.; Tsutsui, H.; Xue, Y.; Hirabayashi, Y. Correcting basin-scale snowfall in a mountainous basin using a distributed snowmelt model and remote-sensing data. Hydrol. Earth Syst. Sci. 2014, 18, 747–761. [Google Scholar] [CrossRef] [Green Version]
Figure 1.
Map of the study area map showing MERRA-2 (red dots) and ERA5 (yellow stars) centroid coordinates. Blue lines indicate the boundaries of each sub-catchment. A DEM of areas where elevations are higher than 1500 m.a.s.l, where snowfall generally occur, is also shown.
Figure 1.
Map of the study area map showing MERRA-2 (red dots) and ERA5 (yellow stars) centroid coordinates. Blue lines indicate the boundaries of each sub-catchment. A DEM of areas where elevations are higher than 1500 m.a.s.l, where snowfall generally occur, is also shown.

Figure 2.
Flowchart of the method used to evaluate the performance of the model forced with ERA5 (in blue) and MERRA-2 (red).
Figure 2.
Flowchart of the method used to evaluate the performance of the model forced with ERA5 (in blue) and MERRA-2 (red).

Figure 3.
Comparison the daily HS at Oukaimeden (3200 m.a.s.l): black: observed HS, blue: modeled HS with ERA5 and red: modeled HS with MERRA-2.
Figure 3.
Comparison the daily HS at Oukaimeden (3200 m.a.s.l): black: observed HS, blue: modeled HS with ERA5 and red: modeled HS with MERRA-2.

Figure 4.
Comparison of total daily snow cover area (km) at Tensift catchment. The blue curves represent ERA5 modeled SCF, and the red ones represent MERRA-2 modeled SCF.
Figure 4.
Comparison of total daily snow cover area (km) at Tensift catchment. The blue curves represent ERA5 modeled SCF, and the red ones represent MERRA-2 modeled SCF.

Figure 5.
Comparison between observed mean annual discharge (black) and modeled mean daily surface water input (m/s). The blue windows represent ERA5 modeled surface water input (30% to 50%), and the red ones represent MERRA-2 modeled surface water input (30% to 50%).
Figure 5.
Comparison between observed mean annual discharge (black) and modeled mean daily surface water input (m/s). The blue windows represent ERA5 modeled surface water input (30% to 50%), and the red ones represent MERRA-2 modeled surface water input (30% to 50%).

Figure 6.
Example of 10-days cumulative precipitation at Oukaimeden from September 2012 to May 2013. Black: observed, blue: ERA5 and red: MERRA-2.
Figure 6.
Example of 10-days cumulative precipitation at Oukaimeden from September 2012 to May 2013. Black: observed, blue: ERA5 and red: MERRA-2.

Figure 7.
Observed air temperature from AWS (left) versus modeled air temperature at the same location (right). Upper figures represent ERA5 comparison and MERRA-2.
Figure 7.
Observed air temperature from AWS (left) versus modeled air temperature at the same location (right). Upper figures represent ERA5 comparison and MERRA-2.

Figure 8.
Interannual variation of the annual mean SWE averaged for the High Atlas in different datasets. Black: ERA5-Land SWE, blue: modeled SWE with ERA5 and red: modeled SWE with MERRA-2.
Figure 8.
Interannual variation of the annual mean SWE averaged for the High Atlas in different datasets. Black: ERA5-Land SWE, blue: modeled SWE with ERA5 and red: modeled SWE with MERRA-2.


Table 1.
The outlet of each catchment.
| Catchment | Rdat | Zat | Ourika | Rheraya | Nfis |
|---|---|---|---|---|---|
| Outlet | Sidi Rahal | Taferiat | Aghbalou | Tahanaout | Iguir Nkouris |
| Area (Km | 552 | 525.9 | 502.6 | 225.3 | 823.8 |
| Max elevation (m) | 3476 | 3847 | 3996 | 4098 | 4088 |
| Mean elevation (m) | 1718.7 | 1831.7 | 2444.5 | 2165.8 | 2202.1 |
Table 2.
Comparisons between modeled and observed HS (cm) (RMSE and mean error).
| RMSE | 2009 | 2010 | 2013 | 2014 | 2015 | 2016 | 2017 |
|---|---|---|---|---|---|---|---|
| ERA5 | 24.46 | 43.71 | 32.01 | 21.83 | 15.10 | 28.94 | 26.70 |
| MERRA-2 | 25.53 | 26.29 | 40.46 | 28.34 | 24.79 | 26.99 | 34.93 |
| Mean Error | 2009 | 2010 | 2013 | 2014 | 2015 | 2016 | 2017 |
| ERA5 | −11.35 | 38.58 | 14.09 | 4.62 | 1.25 | 2.57 | 5.45 |
| MERRA-2 | 18.64 | 4.46 | −28.74 | 6.52 | 12.65 | 8.91 | 18.69 |
Table 3.
Mean R scores from 2000 to 2018 between modeled and observed SCF for each sub-catchment area of Tensift.
Table 3.
Mean R scores from 2000 to 2018 between modeled and observed SCF for each sub-catchment area of Tensift.
| Catchment | Ghdat | Nfis | Ourika | Rheraya | Zat | Seksawa | Mhand | Assif |
|---|---|---|---|---|---|---|---|---|
| Mean R ERA5 | 0.83 | 0.77 | 0.82 | 0.81 | 0.74 | 0.74 | 0.79 | 0.89 |
| Mean R MERRA-2 | 0.70 | 0.67 | 0.85 | 0.79 | 0.65 | 0.67 | 0.75 | 0.76 |
Table 4.
Indicators to evaluate MERRA-2 and ERA5 reanalysis with observed temperature (RMSE and R).
| Oukaimeden | Tachedirt | Neltner | CAF | |
|---|---|---|---|---|
| ERA5 RMSE (C) | 1.84 | 2.45 | 2.37 | 2.02 |
| MERRA-2 RMSE (C) | 3.73 | 2.77 | 3.73 | 3.92 |
| ERA-2 R | 0.90 | 0.95 | 0.93 | 0.94 |
| MERRA-2 | 0.78 | 0.82 | 0.77 | 0.79 |
Publisher’s Note: MDPI stays neutral with regard to jurisdictional claims in published maps and institutional affiliations. |
© 2021 by the authors. Licensee MDPI, Basel, Switzerland. This article is an open access article distributed under the terms and conditions of the Creative Commons Attribution (CC BY) license (http://creativecommons.org/licenses/by/4.0/).
Share and Cite
MDPI and ACS Style
Baba, M.W.; Boudhar, A.; Gascoin, S.; Hanich, L.; Marchane, A.; Chehbouni, A. Assessment of MERRA-2 and ERA5 to Model the Snow Water Equivalent in the High Atlas (1981–2019). Water 2021, 13, 890. https://doi.org/10.3390/w13070890
AMA Style
Baba MW, Boudhar A, Gascoin S, Hanich L, Marchane A, Chehbouni A. Assessment of MERRA-2 and ERA5 to Model the Snow Water Equivalent in the High Atlas (1981–2019). Water. 2021; 13(7):890. https://doi.org/10.3390/w13070890
Chicago/Turabian StyleBaba, Mohamed Wassim, Abdelghani Boudhar, Simon Gascoin, Lahoucine Hanich, Ahmed Marchane, and Abdelghani Chehbouni. 2021. "Assessment of MERRA-2 and ERA5 to Model the Snow Water Equivalent in the High Atlas (1981–2019)" Water 13, no. 7: 890. https://doi.org/10.3390/w13070890
Note that from the first issue of 2016, this journal uses article numbers instead of page numbers. See further details here.