Article

Development of the Indus River System Model to Evaluate Reservoir Sedimentation Impacts on Water Security in Pakistan

by
Geoffrey M. Podger
1,
Mobin-ud-Din Ahmad
1,*,
Yingying Yu
1,
Joel P. Stewart
1,
Syed Muhammad Mehar Ali Shah
2 and
Zarif Iqbal Khero
3
1
CSIRO Land and Water, Canberra, ACT 2601, Australia
2
Ministry of Water Resources, Islamabad 44000, Pakistan
3
Irrigation Department, Government of Sindh, Karachi 74400, Pakistan
*
Author to whom correspondence should be addressed.
Water 2021, 13(7), 895; https://doi.org/10.3390/w13070895
Submission received: 19 February 2021 / Revised: 19 March 2021 / Accepted: 23 March 2021 / Published: 25 March 2021
(This article belongs to the Section Water Resources Management, Policy and Governance)

Abstract

:
Pakistan’s society and economy are highly dependent on the surface and groundwater resources of the Indus River basin. This paper describes the development and implementation of a daily Indus River System Model (IRSM) for the Pakistan Indus Basin Irrigation System (IBIS) to examine the potential impact of reservoir sedimentation on provincial water security. The model considers both the physical and management characteristics of the system. The model’s performance in replicating provincial allocation ratios is within 0.1% on average and the modeling of water flow at barrages and delivered to irrigation canal commands is in agreement with recorded data (major barrage NSE 0.7). The average maximum volumetric error for the Tarbela and Mangla reservoirs are respectively 5.2% and 8.8% of mean annual inflow. The model showed that a 2.3 km3 reduction in storage volume since 1990 equates to approximately 1.3 km3 i.e., a 4–5% reduction in irrigation deliveries, respectively, for Punjab and Sindh in the dry (Rabi) season. This decline indicates that without further augmentation of system storage, the Rabi season supplies will continue to be further impacted in the future. This paper demonstrates the suitability of IRSM for exploring long term planning and operational rules and the associated impacts on water, food and energy security in Pakistan.

1. Introduction

Pakistan is facing severe challenges related to water, food and economic security. It relies utterly on the water of the River Indus and the associated groundwater systems. It operates the world’s largest continuous irrigation system, the Indus Basin Irrigation System (IBIS), which supports food production, energy generation, as well as stock, domestic and industrial supply for the nation [1]. Predicting future seasonal inflows and the subsequent seasonal allocation, delivery and distribution of surface water resources throughout the IBIS is a laborious and complex process for water managers [2,3]. Water security issues in the basin include changing resource availability [4,5,6,7,8,9,10,11,12,13], growth in demand from competing users [14,15,16,17,18] and the loss of storage capacity through sedimentation [4,19]. The 2012 Friends of Democratic Pakistan Water Sector Task Force report [20] highlighted the need to build the knowledge and capacity to manage the current and future water security needs of Pakistan, with Young, et al. [21] highlighting the need to model the system accurately and transparently as a means to better manage water security risks. This study focusses on modelling both the physical and water-sharing arrangements of the IBIS to investigate the potential impacts on seasonal water supply security resulting from the loss of storage capacity through reservoir sedimentation.
There are few river system models of the IBIS, particularly with the capability needs described by Young et al. [21], that include water management responses (water-sharing rules) to changing resource availability. Wada et al. [22] developed a framework with stakeholders that considers water, energy and food resource assessments in the Indus river basin to support transformative solutions. Although this model can be used to explore broad regional options, it has limited interpretation and inclusion of the intra-country water-sharing arrangements of the 1991 Water Apportionment Accord (the Accord), as well as limited representation of link canal operations in Pakistan. Likewise, Eastham, et al. [23] developed a water accounting basin model, with rainfall-runoff, streamflow and irrigation demand components; however, the daily and 10-day planning and operational decisions as per the Accord cannot be represented in this monthly time-step model. The Indus Basin within Pakistan, excluding the upper catchments, have been modelled by the Indus Basin Model (IBM) [24] and its derivatives, the Indus Basin Model Revised (IBMR) [11,25,26] and the Regional Water System Model (RWSM) [27]. The IBM and IBMR are integrated hydro-economic models intended to explore infrastructure investment and water allocation planning options. There are also several published hydrology models for parts of the basin, including those reviewed in van Waijje, et al. [28] and Johnston and Smakhtin [29], and more recently in Khan et al. [30].
Several water management issues important to the Pakistan part of the Indus Basin [31] are not adequately addressed by the available models. These issues include modelling the implemented seasonal water availability planning system and subsequent allocation to provinces and then to canal commands, and river operations that can be used to manage water security risks, such as reservoir sedimentation, climate change, growth in use, competing use between rural and urban populations, as well as assessing future infrastructure development.
The river system model discussed in this paper aims to address this capability gap by capturing the undocumented operational rules and expert knowledge, through intensive consultations with key federal and provincial stakeholders, in the estimation of seasonal water allocation and the distribution of water resources to canal commands. This paper details the development of the Indus River System Model (IRSM), including basin physical and operational characteristics, model conceptualisation, calibration and performance, and then uses this model to investigate the potential impacts of storage sedimentation on provincial water security. Finally, conclusions are made on the suitability and adequacy of the model for future investigations.

2. Materials and Methods
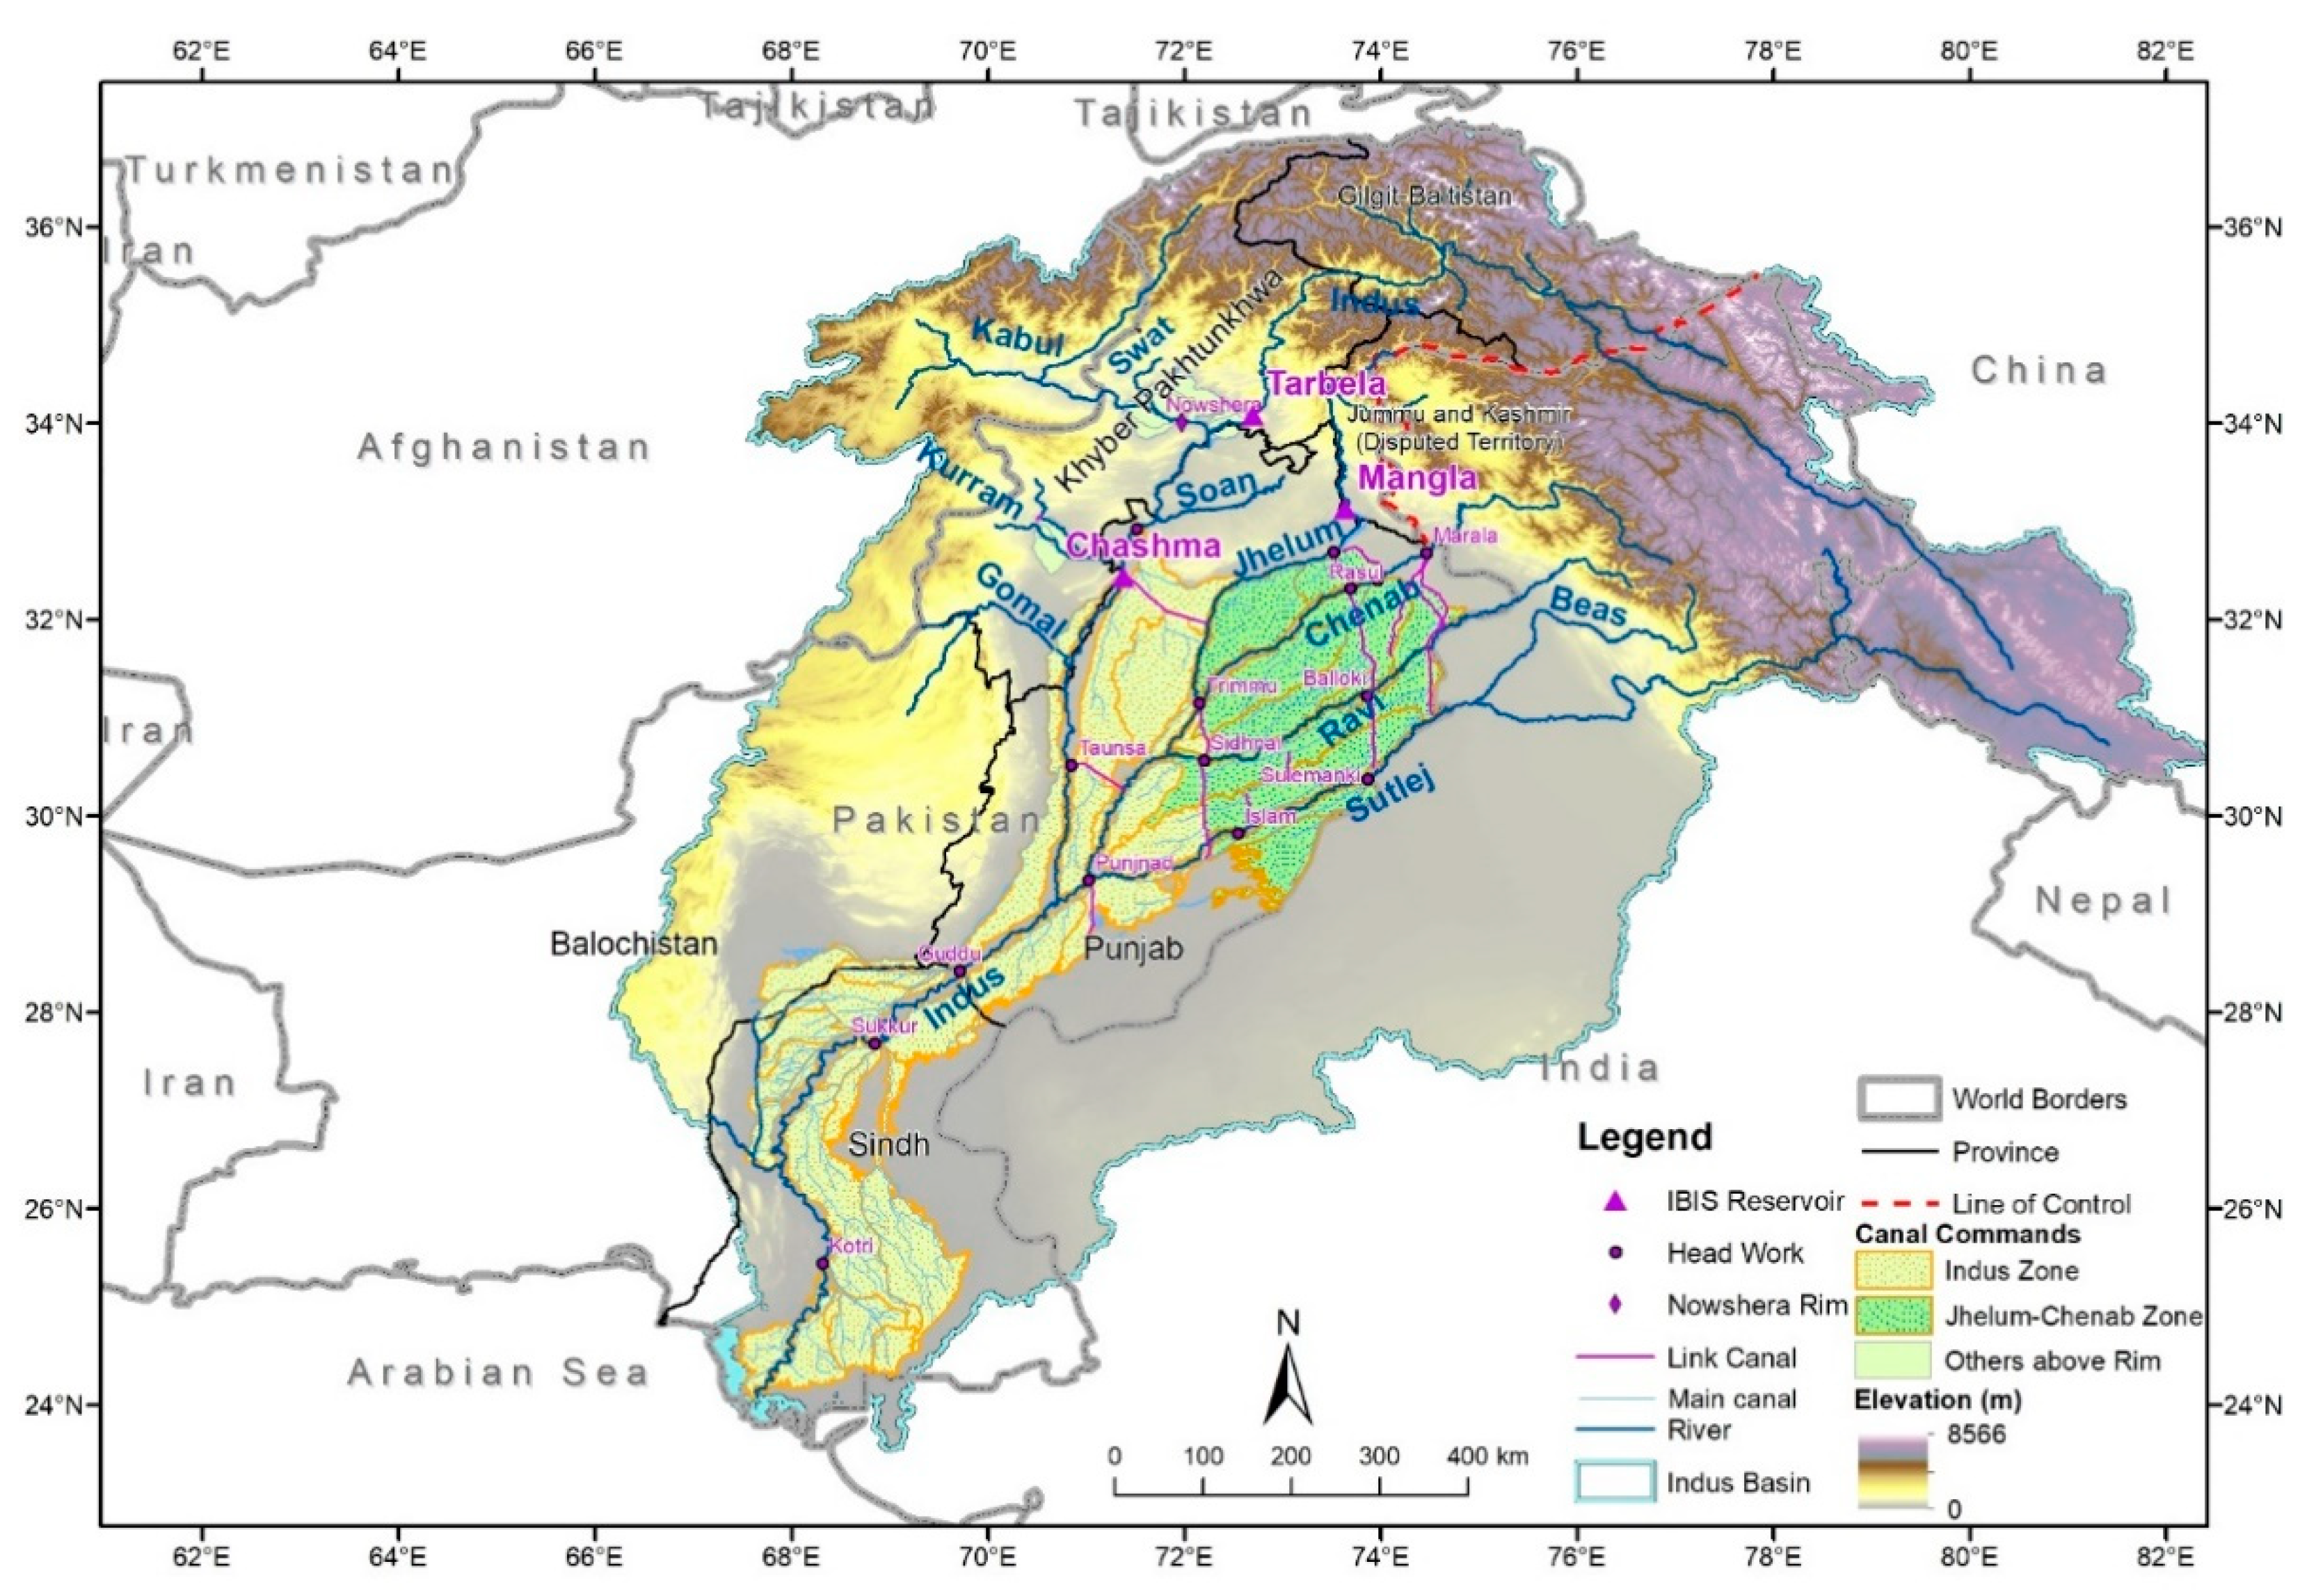
2.1. Study Area

2.1.1. Physical Description

This study was conducted on the Indus river basin, with a specific focus on the IBIS in Pakistan. The Indus basin has a total area of approximately 1,127,000 km2, which is shared by Pakistan, India, Afghanistan and China. The Hindu-Kush, Karakoram and Western Himalayan mountain ranges generate most of the inflow to the main Indus River and its six major tributaries (Figure 1)—Kabul, Jhelum, Chenab, Ravi, Beas and Sutlej. The Indus River flows into the Arabian Sea near Karachi.
The 1947 partition of India and Pakistan gave approximately two-thirds of the area of the IBIS to Pakistan, which was heavily dependent on surface inflows from outside country borders. Thus, after partition, the Pakistan IBIS relied on surface water supplies that it had no control over. The 1960 Indus Waters Treaty (IWT) gave Pakistan the surface water of the Indus, Jhelum and Chenab rivers, contributing 75% of the water of the basin. The Ravi, Beas and Sutlej rivers were given to India [32,33]. The IWT does not include the sharing of groundwater resources from the large unconfined transboundary aquifer between India and Pakistan. There are no other water treaties between Pakistan and the neighboring countries of Afghanistan and China. The allocation of Indus water sources in the 1960 treaty precipitated construction of the two major reservoirs and numerous link canals in Pakistan to ensure that irrigation areas in southern Punjab traditionally supplied by the eastern rivers could now be supplied from western rivers (Figure 1).
For Pakistan, the Indus River and the associated groundwater system is the main source of water supply. Approximately 71% of the 167 km3 (1976–2020) mean annual inflow to the IBIS is used for agriculture and to a lesser extent for industrial and domestic consumption. Surface water contributes approximately 60% of the irrigation water use in Pakistan [12], with the remainder being made up from groundwater, predominantly in Punjab and in isolated pockets of Sindh province [34], where groundwater supplies are fresh.

2.1.2. Climate and Seasons

The climate of this region is derived from the South Asian monsoon and western disturbances (WDs) [35]. The monsoon occurs during the June to September period and is responsible for most of Pakistan’s precipitation. This period also coincides with the period of maximum snow and glacier melting in the Upper Indus Basin (UIB).
Most of the agriculture is practiced in the lower Indus plains. Summer spans April through to September, with maximum temperature ranging from 21 °C to 49 °C. Winter extends from December to February, with maximum air temperature ranging from 25 °C to 27 °C during day, with colder overnight temperatures. The mean annual rainfall in this area is about 250 mm/year, of which about 75% occurs between June to September. There are two distinct cropping seasons in Pakistan—Kharif (April to September) and Rabi (October to March). The dominant crop in the dry (winter) Rabi season is wheat, whereas cotton, rice and maize are the predominant crops during the wet Kharif (summer) season. Sugarcane and different fodder crops are grown throughout the year [36].

2.1.3. IBIS Infrastructure

There are 6 main remote inflow measurement (rim) stations in the IBIS—Kabul River at Nowshera, Indus River at Tarbela, Jhelum River at Mangla, Chenab River at Marala, Ravi River at Balloki and Sutlej River at Sulemanki. The system’s operation relies on two large supply reservoirs, Tarbela and Mangla, and a network of regulating infrastructure, consisting of Chashma reservoir with 0.34 km3 storage and 15 river barrages (Figure 1).
Tarbela reservoir is located on the Indus River and can store about 12% of the mean annual flow. This reservoir has been operational since 1976. Originally, it had 12 km3 of live storage capacity, however after 44 years of operations and sedimentation, the live storage in 2020 has been reduced to 7.38 km3.
Mangla reservoir can store up to 36% of the mean annual flow of the Jhelum River. This reservoir has been operational since 1965 and the initial live storage of this reservoir was 7.25 km3 in 2005, although due to sedimentation, the reservoir capacity was reduced to 5.77 km3. The reservoir was subsequently raised in 2009 to provide 9.12 km3 storage. According to a recent (2018) available survey [37], the Mangla reservoir capacity is now at 9.08 km3.
River flows and reservoir releases are regulated to irrigation command areas through command canals that offtake from river barrages. Transfers between rivers also take place at barrages through link canals. From a water management perspective, the management system is broken into two sub-systems—Indus and Jhelum-Chenab (J-C).

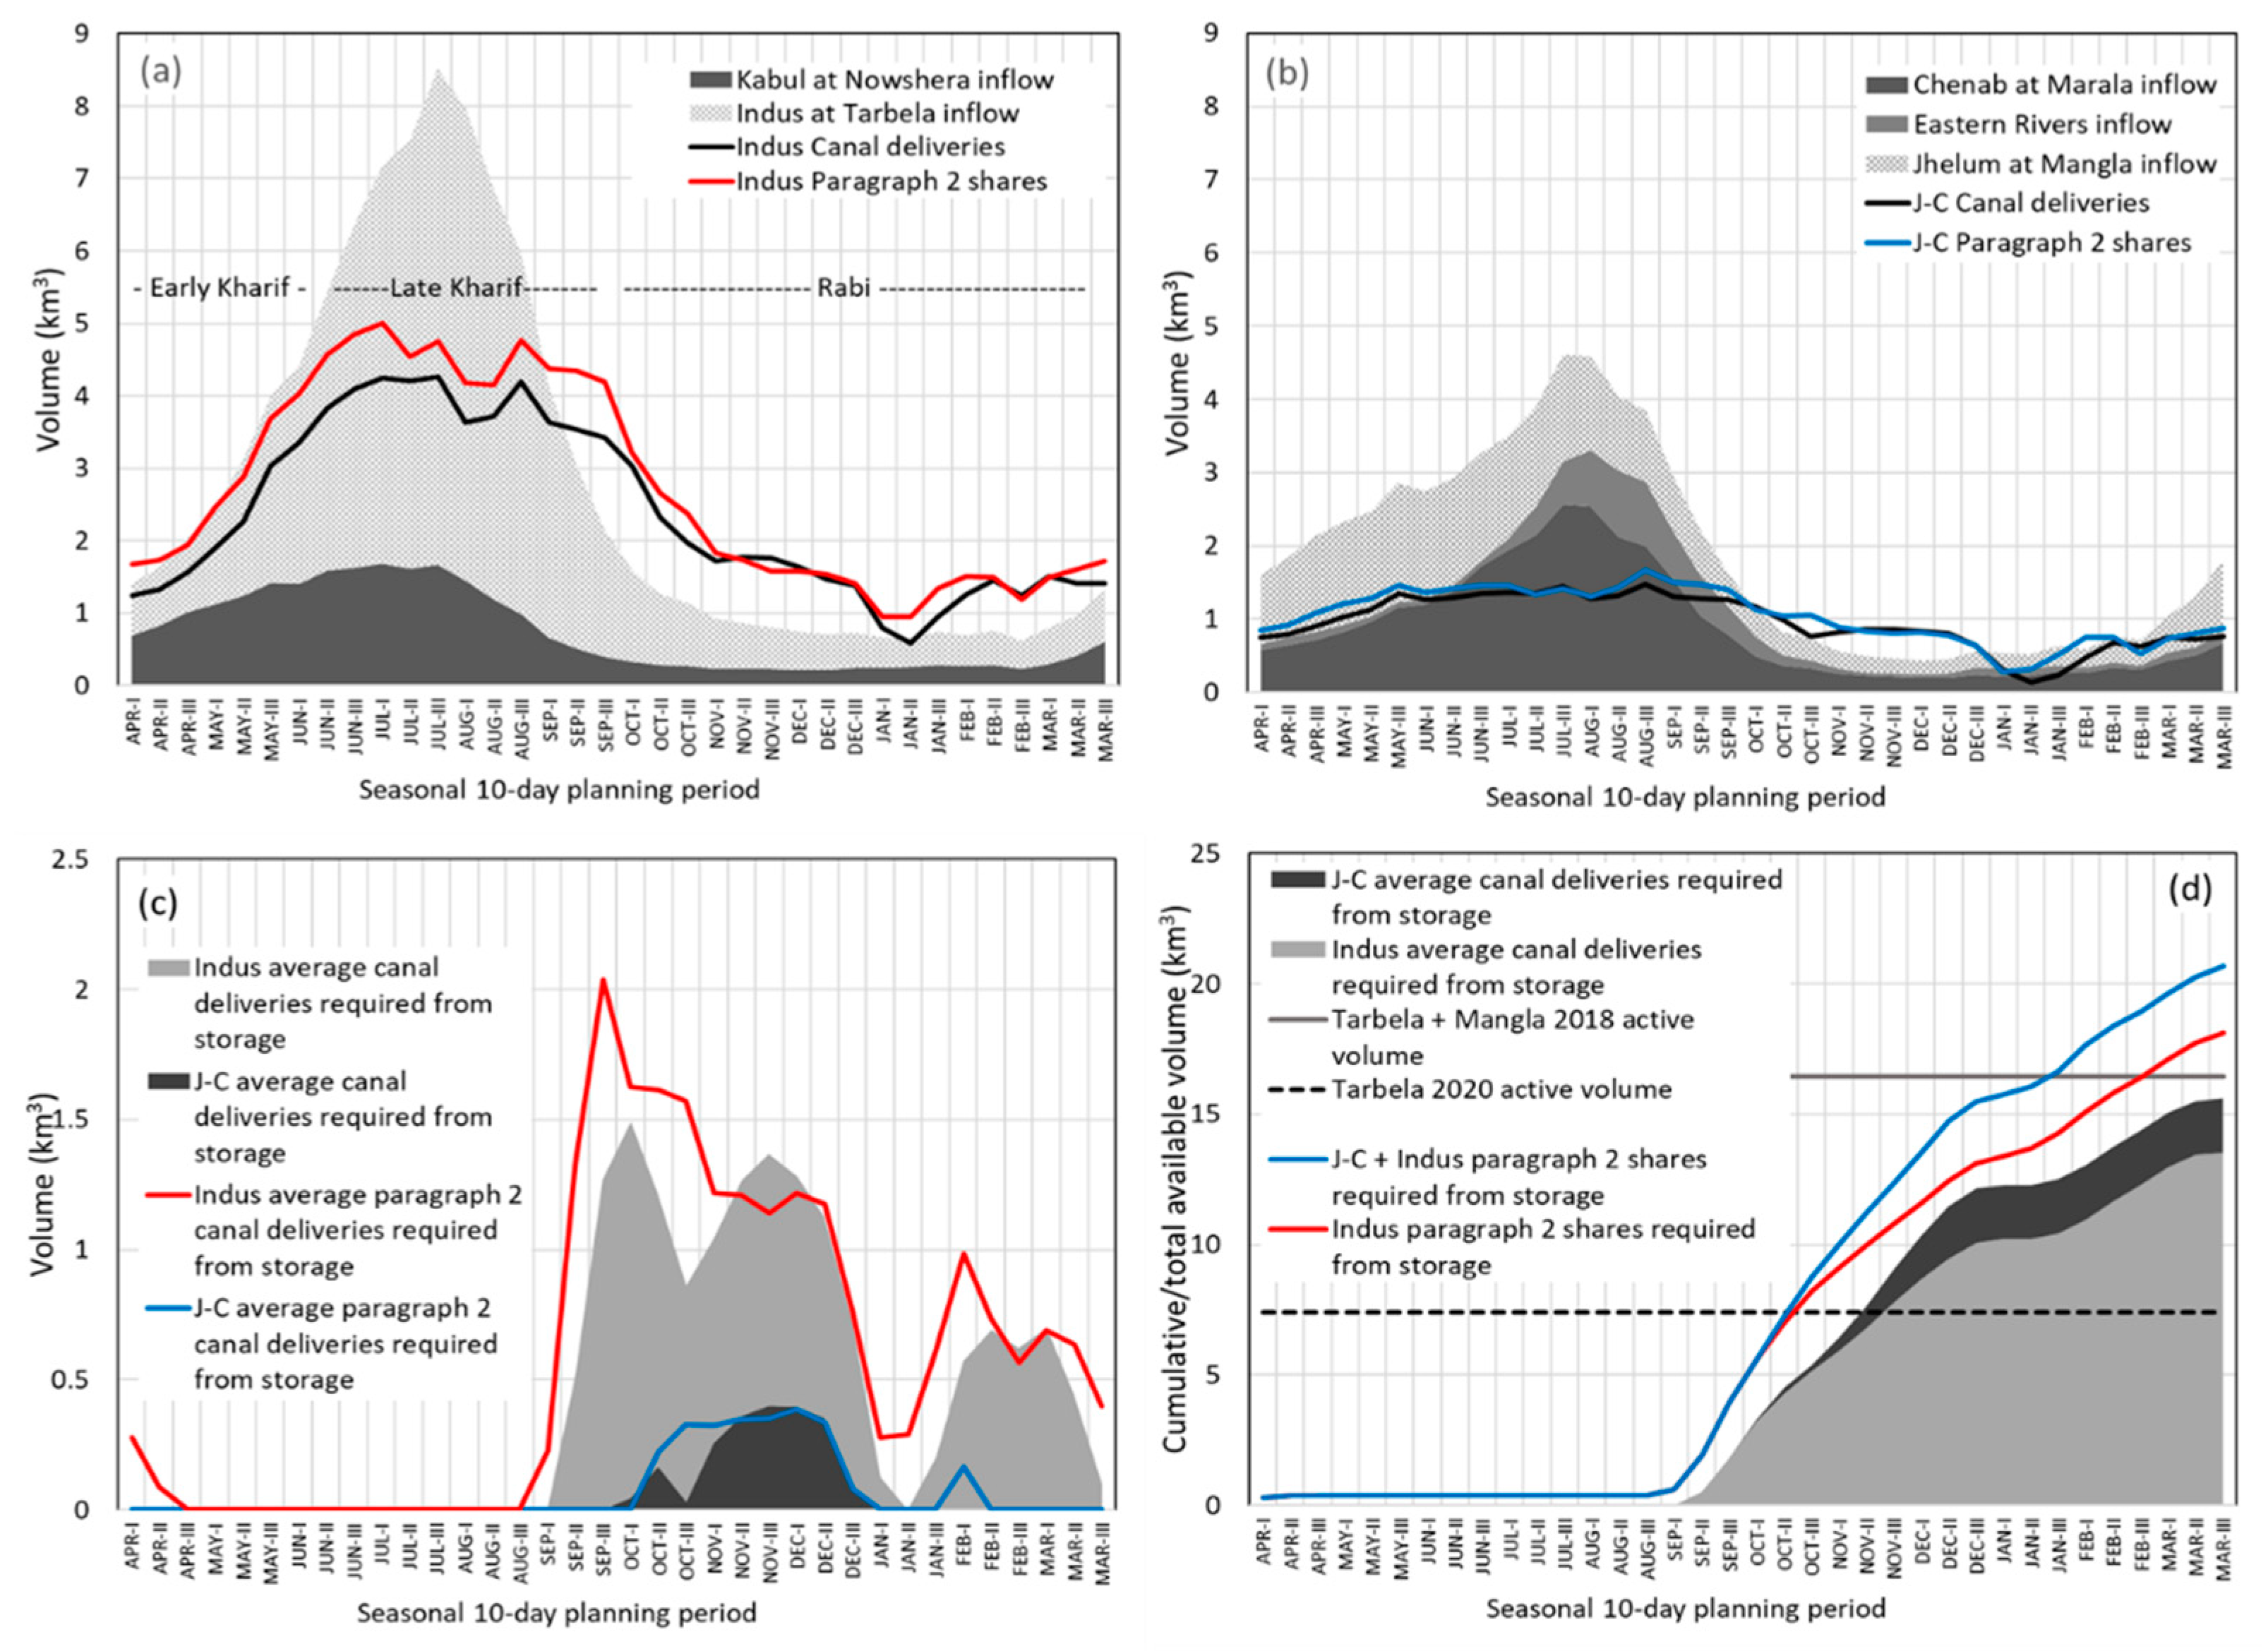
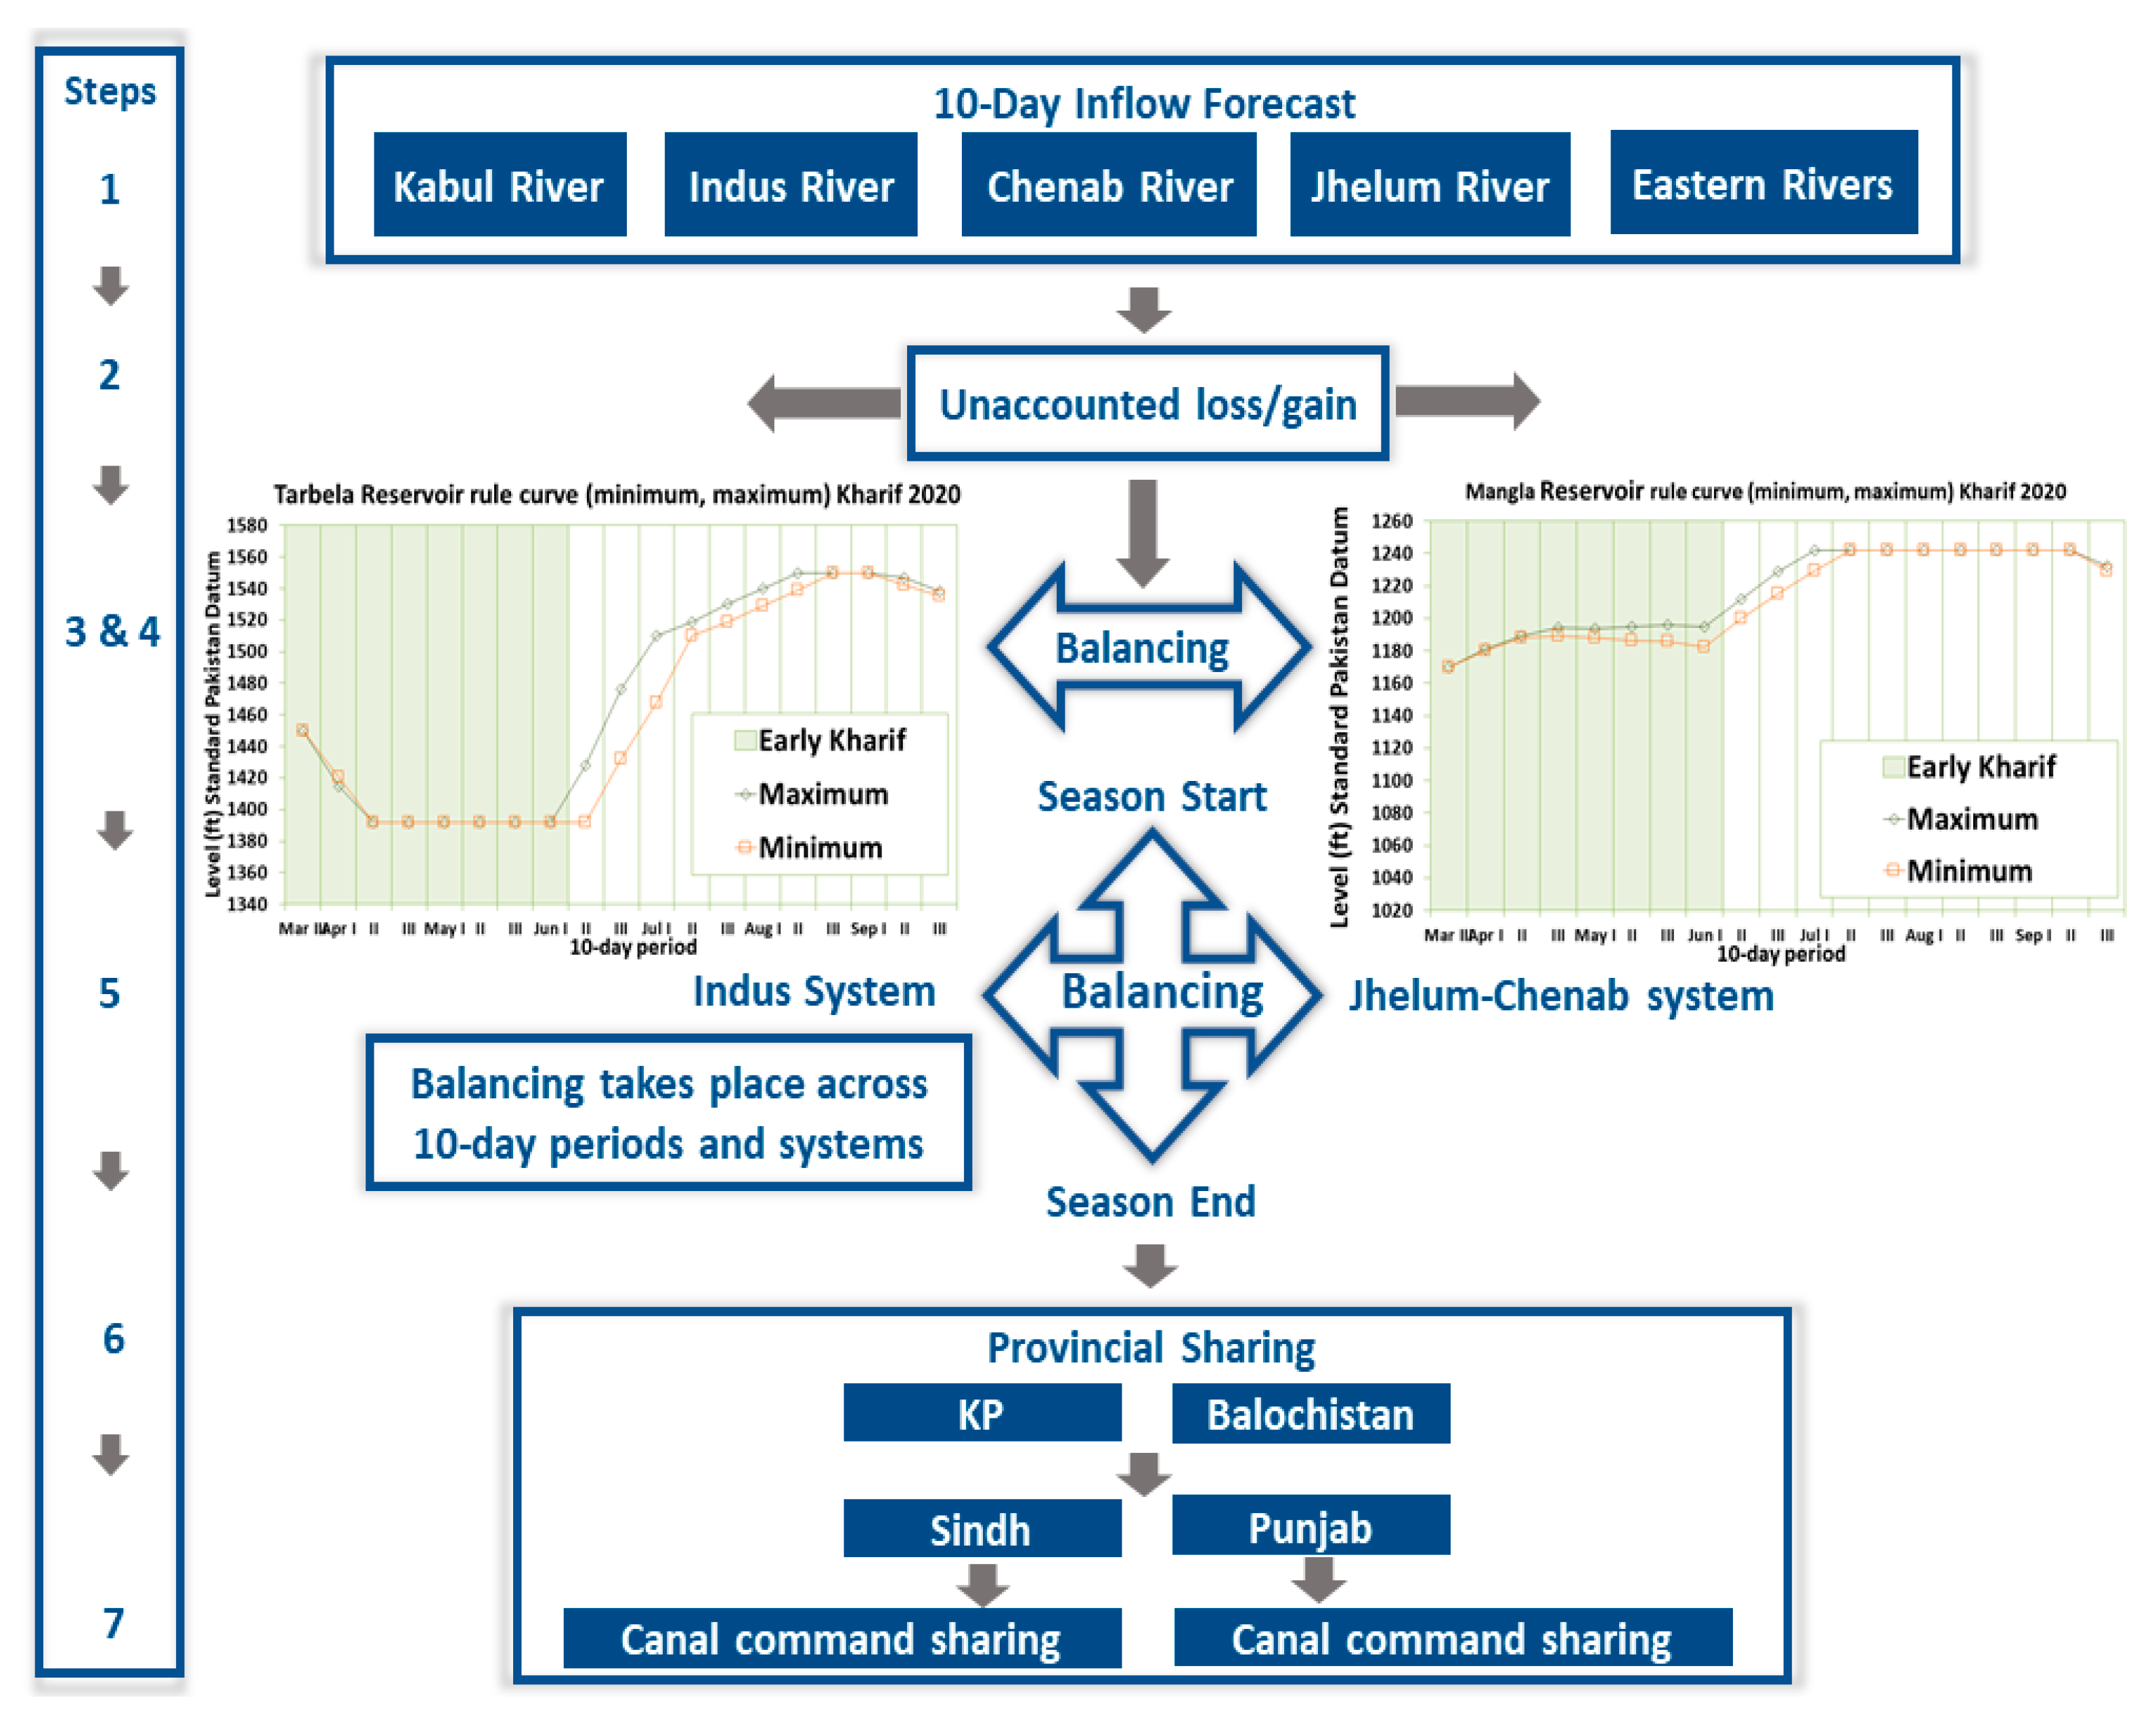
2.1.4. Water Inflow Forecast, Allocation and Sharing Methodology

Due to variations in flow regime in the different tributaries of the Indus and limited storage capacity in Tarbela and Mangla reservoirs, a complex planning process is undertaken on a seasonal basis to equitably share the water. Figure 2 shows the mean 10-day inflow and demand patterns for (a) the Indus system and (b) Jhelum-Chenab (J-C) system. The mean canal water requirements and associated share allocations that need to be met from stored water are shown in Figure 2c, highlighting the typical quantity and timing differences between the two systems that must be balanced. Figure 2d shows the cumulative stored water requirements to meet actual canal deliveries and share requirements throughout a year, in addition to current available storage volume in Tarbela and Mangla. The figure shows that the IBIS typically needs water stored in both Tarbela and Mangla reservoirs to meet the Rabi seasonal demand. Without considering delivery losses, the current available storage is only sufficient to meet typical Rabi season demand patterns, provided both reservoirs are operated in harmony with an extensive link canal system to capture and distribute water equitably. The current available storage volume is insufficient to meet the water sharing requirements of the 1991 Water Apportionment Accord (the Accord).
A complex seasonal inflow forecast, and storage operational planning process is undertaken on the IBIS at the start of every season to meet Indus and J-C system allocation demand patterns, while maintaining equitable sharing between provinces and then command canals as laid out in the Accord. The Accord is the agreement that describes the distribution of the water resources of the Indus between the 4 provinces of Punjab, Sindh, Balochistan and Khyber Pakhtunkhwa (KP). In 14 paragraphs, the Accord outlines how the water resources are to be shared on a seasonal and 10-day basis [38]. There are 3 paragraphs that are relevant to the sharing arrangements (Appendix A)—Paragraphs 14(b), 2 and 4. Paragraph 14(b) provides seasonal totals based on observed average use for the period 1977–1982. Paragraph 2 considers accepted water distributional principles and details shares on a provincial and seasonal basis (Figure 2a,b) and Paragraph 4 is used to balance supplies above Paragraph 2 from floods and future storages. The precise interpretation and subsequent practical implementation of the Accord paragraphs are not documented [20,21] and extensive consultation with Indus River System Authority (IRSA) operators to elicit these operational rules was required for this modelling study. This component is essential for any simulation of allocation and subsequent distribution of water within the IBIS and is outlined below.
The allocation process is undertaken at the start of Kharif and Rabi seasons, with the Kharif season being sub-divided into the early (1 April–10 June) and late Kharif (11 June–30 September). The primary objective of the allocation process is to maximise resource allocation while maintaining 10-day provincial shares, as specified in the Accord. This is done while balancing water between two supply sub-systems—Indus and J-C. Operationally, the provincial shares determined at the start of the water year are managed during the season with adjustments, as the observed inflows differ from forecasts. The aim of the adjustments is to achieve the total seasonal provincial share proportions calculated at the start of the season. Provincial sharing to command canals is based on defined ratios that vary due to operational constraints, such as canal closures and is undertaken at a provincial level.
There are 7 components to the resource assessment and allocation process (Figure 3); (i) 10-day inflow forecasts at 5 rim stations (Kabul, Indus, Jhelum, Chenab and Eastern Rivers); (ii) unaccounted loss/gain estimation for J-C and Indus systems; (iii) minimum and maximum 10-day storage level targets for Tarbela and Mangla reservoirs; (iv) reservoir balancing; (v) resource balancing across 10-day periods and supply systems; (vi) provincial resource sharing and (vii) sharing to provincial command canals.
Currently, IRSA uses a probabilistic method for the inflow forecast in the western rivers (Kabul, Indus, Jhelum and Chenab). The eastern river forecasts (Ravi and Sutlej) are based on recent observed inflow history. Other forecast methods are being trialed within the IBIS and provision has been made in the model to include these when they are adopted.
The western river forecasts are based on using the respective previous season inflow volume as an indicator of the forthcoming season inflows. Historic (from 1976) previous seasons’ inflow volumes that are within 5% of the current previous season inflow provide a list of forthcoming season probabilities that are averaged to the nearest 5 percentile to provide a forthcoming season probability (Rabi, early and Late Kharif). Then, using probabilities of 10% more and less, the 10-day inflow values are selected for the respective minimum and maximum inflow forecasts.
The eastern river forecast is based on the last five years of corresponding seasonal inflow, with the largest and smallest being the respective maximum and minimum 10-day inflow sequence. The eastern river component of the overall forecast is small and is dependent on river operations outside of Pakistan. Although other forecasting methods may be available, the last-five-years method has been adopted as suitable by IRSA and has therefore been implemented in this modelling study.
Unaccounted loss/gain proportions for Rabi, early and late Kharif are worked out separately for the Indus and J-C systems and are based on the average over the most recent 10 years. For the Indus system, it is the change in Tarbela and Chashma storage volume plus Indus canal withdrawals and below Kotri flows, minus the total Indus inflow (Kabul and Indus inflows plus river releases from Rasul, Qadirabad, Balloki and Sulemanki barrages), divided by the Indus system inflow. The J-C system is the change in Mangla storage volume plus J-C canal withdrawals and river releases from Rasul, Qadirabad, Balloki and Sulemanki barrages minus the J-C inflow (Jhelum, Chenab, Ravi and Sutlej inflows), divided by the J-C system inflow.
There are seasonal 10-day minimum and maximum storage level targets for Tarbela and Mangla. The Kharif filling targets ensure a minimum Tarbela filling rate (between 0 and 0.03048 m/day) and a maximum filling rate of 0.3048 m/day past 460 m reservoir elevation. Mangla is constrained to release at least 227 m3/s for Rasul hydro canal operation, with an 80% filling target by the 30 June. Tarbela is to be filled by the 20th and 31st of August for respective maximum and minimum inflow scenarios and Mangla is to be filled by the end of August. There is a 10% drawdown of Tarbela and Mangla volume at the end of September. Rabi has storage drawdown targets for the end of December (10%) and March 20th (empty). Filling rates and storage targets consider reservoir capacity reductions through time due to sedimentation.
Provincial sharing is based on 10-day patterns specified in the 1991 Accord paragraphs. Paragraph 14(b) patterns are used in Rabi and Paragraph 2 patterns are used in Kharif. The calculation of the available resource is done for each of the systems. Any shortages to meet these constraints are equalised between sub-systems and across 10-day periods by managing outflows from the J-C to Indus system. The method ensures that at the end of the allocation process, flows below Kotri Barrage (the end of the system) are minimised, reservoirs have identical volume proportions for each 10-day period and Indus and J-C systems have identical shortages for users in these sub-systems.
Once the 10-day available resource is determined, the water is shared firstly to KP and Balochistan, with the remaining resource shared to Punjab and Sindh according to a 3 tier approach on a 10-day basis and reconciled for the season. If the resource is less than the Paragraph 14(b) Punjab and Sindh total share, then it is shared according to paragraph 14(b); if it is between the Paragraph 14(b) and 2 Punjab and Sindh total share, the resource above 14(b) is shared based on an interpolated ratio until it reaches the Paragraph 2 value, whereby it is shared according to Paragraph 2. The provincial shares are then distributed to canals based on provincial canal shares. When surplus water is available above Paragraph 2, provinces can request additional supplies according to Paragraph 4.

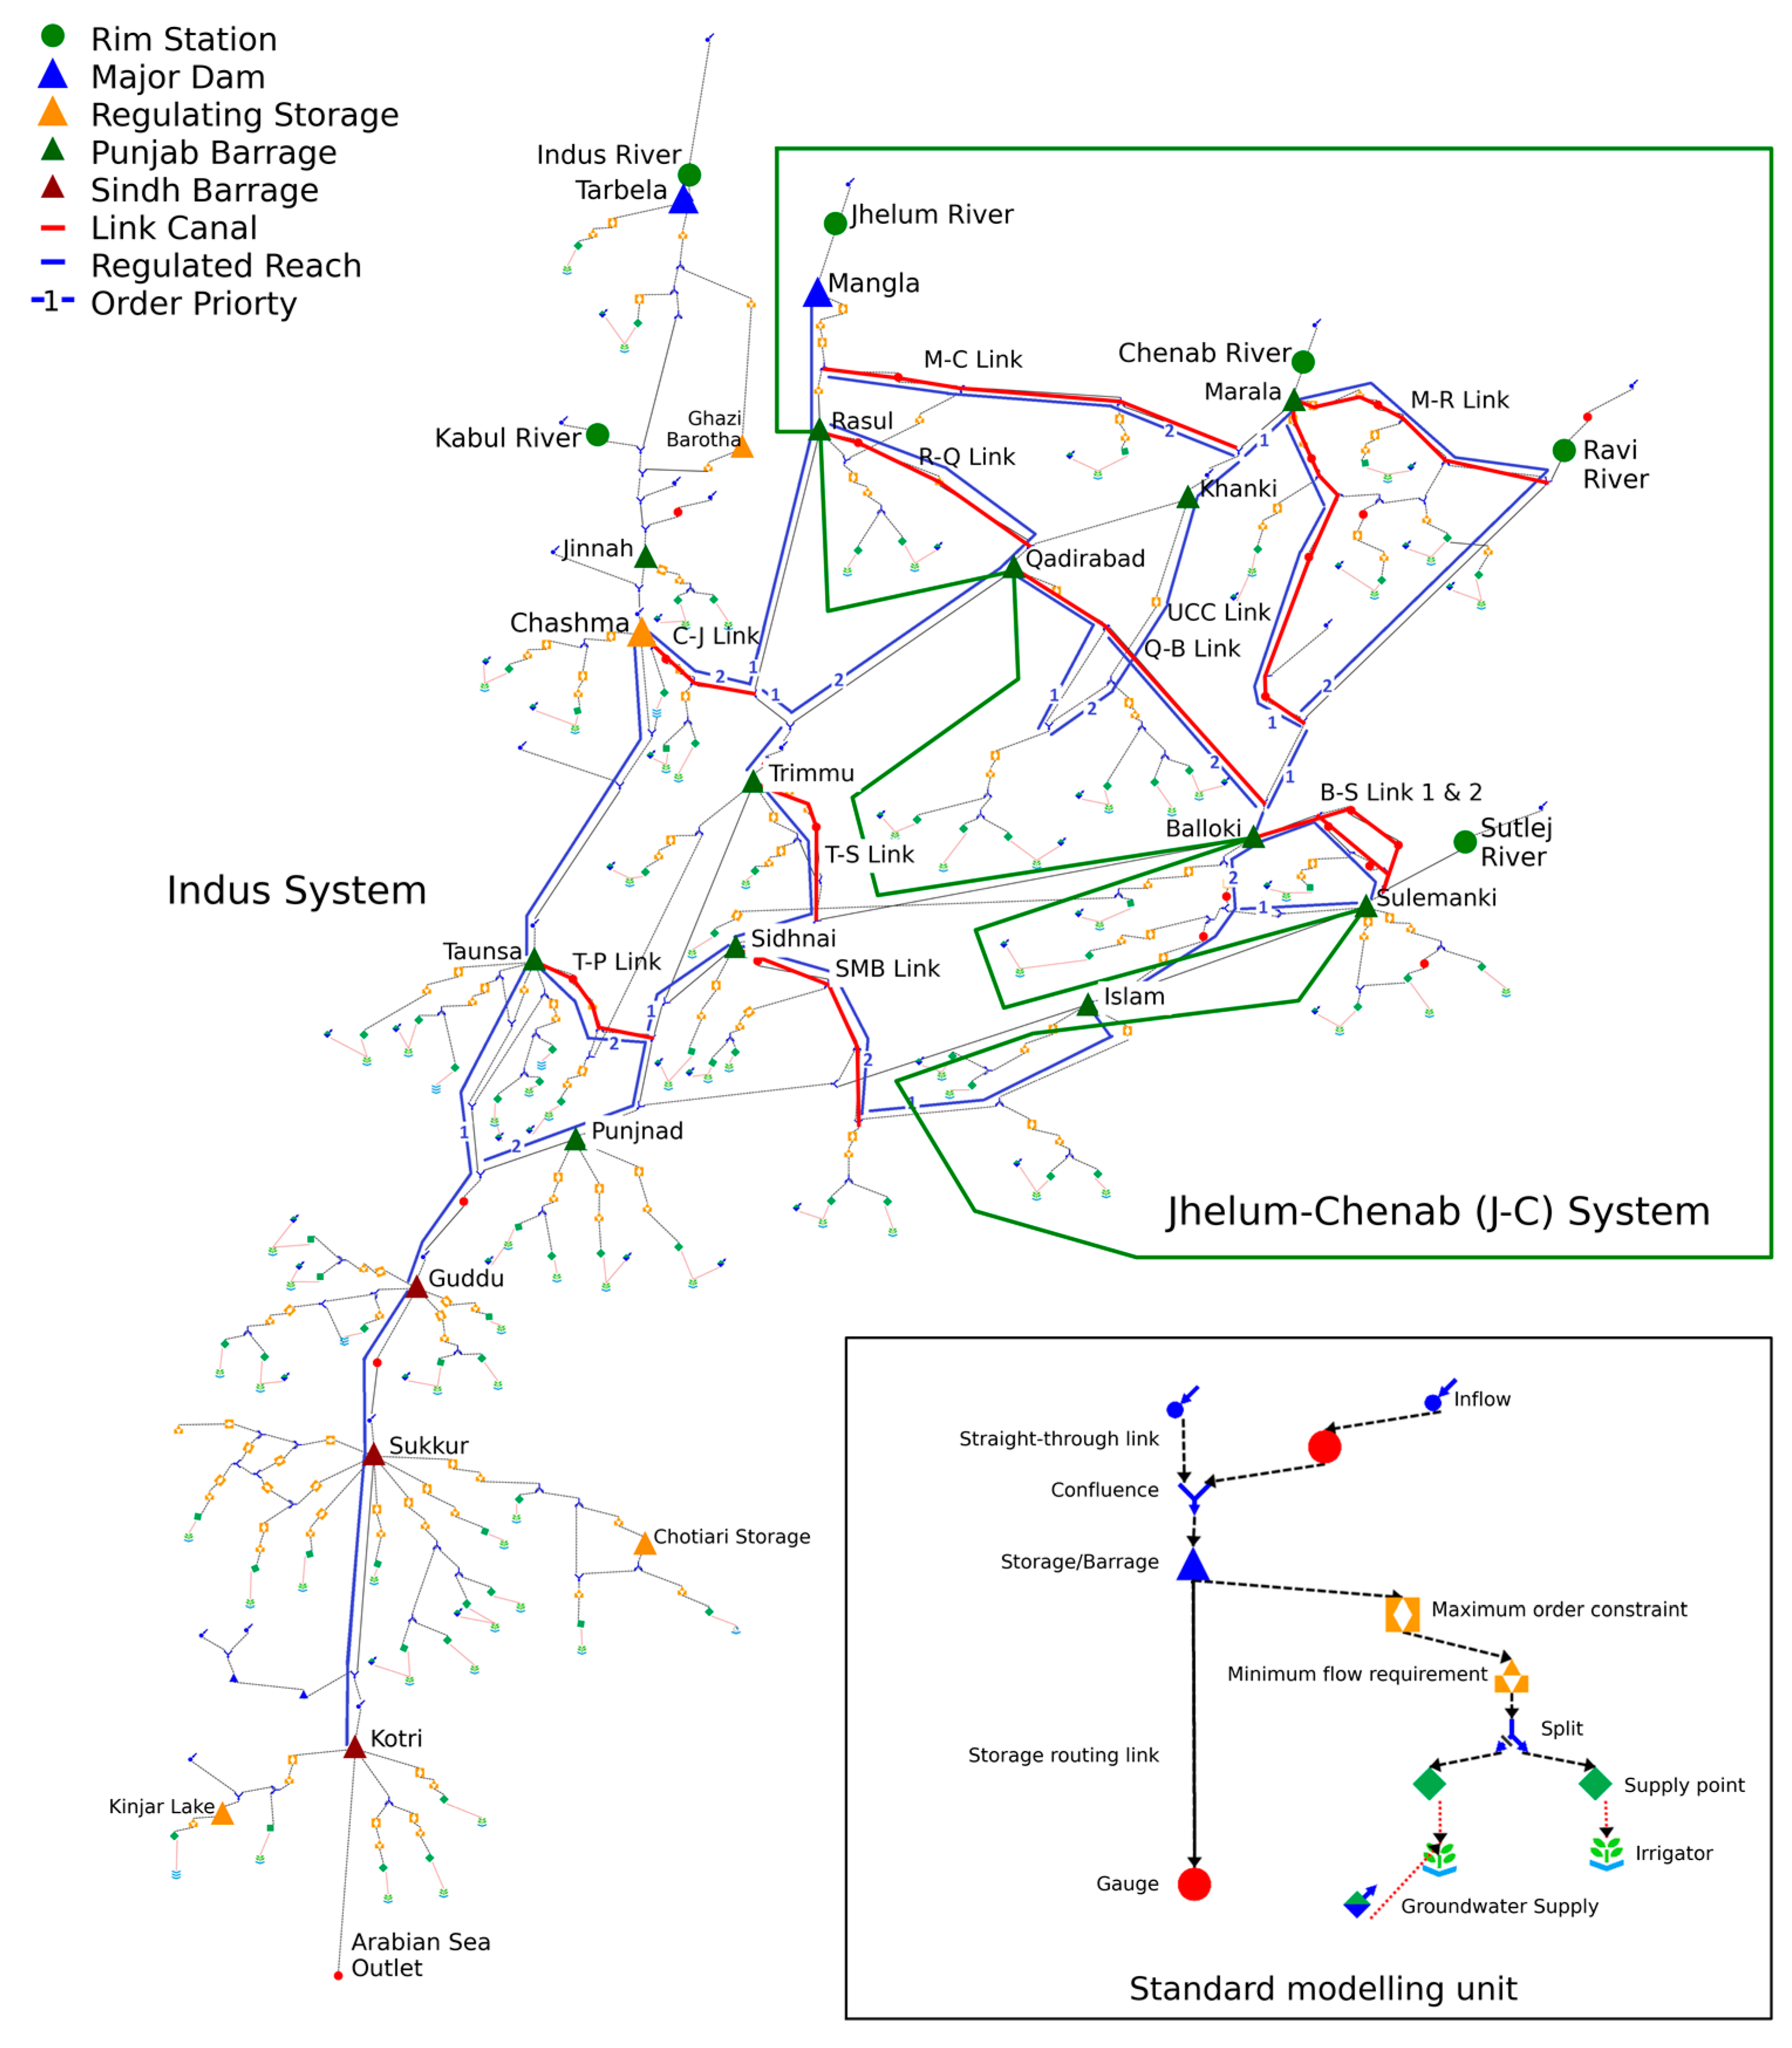
2.2. Model Conceptualisation

2.2.1. Modelling Platform

Considering the physical complexities and rule-based water distribution procedures in IBIS, the eWater Source framework was adopted to construct IRSM, as it contains mechanisms to simulate planning and decision-making aspects of seasonal water demand. The eWater Source modelling framework allows catchment-scale rainfall runoff modelling (using a geographic interface) and rule-based mass balance modelling through a schematic node-link network with flow routing [39,40,41,42]. The eWater Source modelling framework is used extensively throughout Australia [43], as well as in major international river basins. For this study, observed rim flows were used, rather than simulated upper Indus flows. For the lower Indus basin, a node-link structure was constructed to facilitate simulation of the water flow through the key IBIS infrastructure, whereas a series of custom functions was implemented to simulate the water-sharing system. As shown in Figure 4, there are 52 main canal commands in the IBIS with offtakes from barrages supplying 72 irrigation areas. The conceptualisation of the supply-based system includes the physical dimensions of the barrage and canal infrastructure that is needed to constrain water deliveries. Full details of barrage and offtake canal configurations can be found in Stewart et al. [44]. Groundwater can also be drawn upon to meet irrigation shortfalls if the groundwater is of sufficient quality. The IRSM is described in detail in Stewart et al. [44]. For this study, a more accurate representation of the seasonal allocation planning procedure of IRSA was required that accounted for the change in available storage in the planning phase of seasonal operations and allocation; therefore, an external seasonal forecast as described in Section 2.1.4 was generated to drive the provincial water-sharing functions in the IRSM, which then applied these forecasts and share ratios to canal commands in the model domain to drive the water ordering system functions in the IRSM.
The availability of data described in Appendix B influenced the conceptualisation of the model in terms of the storages, barrages and reaches included in the model. Demand data constrained the model to the command canal level, with groundwater data identifying areas of conjunctive use.

2.2.2. Water Allocation and Distribution System

The Accord water-sharing is implemented in Source via a series of functions [45] that take input from the provincial scale forecasting and sharing, as described in Section 2.1.4, which is currently undertaken outside of the Source modelling framework in the Pakistan Water Apportionment Accord (WAA) tool [46,47]. Previous IRSM simulations [44] implemented a simplified provincial allocation system entirely in Source functions; however, this did not capture the iterative storage balancing required or the updating of the probabilistic forecasting approach as the model progresses through each year of simulation.
In the model described in this paper, the provincial forecasting and sharing is undertaken outside of Source at the beginning of each season (Kharif and Rabi). Rim station inflows from each subsequent year of simulation are used to rebuild the probability tables underpinning the seasonal forecasting and generate forecasts for the forthcoming season. The resultant seasonal provincial allocation is then input to Source, where a series of functions disaggregate the forecast allocations to create time-series demands at individual canal commands, implemented at minimum flow requirement nodes (Figure 4 inset). The Source ordering priority pathways (Figure 4) are then used to distribute the collated provincial allocations to reservoirs, adding travel time and associated instream losses along the way to ensure that sufficient water can be released. If insufficient water is available to be released at any given time to meet orders, all orders are proportionally reduced. The link canals of C-J Link and T-P link offer the choice of switching ordering priority pathways between Tarbela and Mangla reservoirs. Functions based on average behavior are installed to look up relative reservoir volumes and select the pathway to attempt to harmonise the storages. Finally, reservoir, barrage and offtake canal and link canal capacities provide a further limiting capacity for both the ordering network and the delivery network.

2.3. Calibration and Validation Methodology

A stepwise manual calibration approach was used for the calibration of individual reaches to account for river routing and unaccounted losses and gains. For operational decisions and water allocation and sharing aspects, interview/data assimilation techniques were adopted [48]. The identification of priority flow pathways (Figure 4) combined with water allocation to canal commands has by far the largest influence on the performance of this model at barrages and canal command offtakes. Although automated calibration techniques could potentially have been used to determine these priority pathways and water-sharing arrangements, interviews with the appropriate water managers was considered a more representative method of replicating actual behavior. Therefore, the calibration approach was deemed to be appropriate for the operational decision-making.
The IRSM was calibrated using streamflow and level-volume data from 2007 to 2013. This period represented approximately half of the detailed data set available to the study team, including daily canal water delivery data. The calibration period contained both wet and dry years and was considered long enough to identify the priority flow pathways enacted by river managers. Model validation was for the period of 2002 to 2007 and an extended simulation period of 1990 to 2013 was used for long-term model validation.
Calibration metrics used for flows at barrages and canal command heads were the daily Nash–Sutcliffe coefficient of efficiency (NSE) [49] and overall bias (%). For river routing, piecewise linear routing [50,51] is used. For each reach with observed upstream and downstream flows a piecewise flow-versus-travel-time relationship is assigned based on observed peak travel times. Following assignment of the piecewise table, reach unaccounted differences were estimated by forcing upstream flows in the reach and routing these flows to the downstream observation location and comparing the observed and modelled flow duration curves. The mean difference between the curves was used to form a flow-versus-unaccounted-difference relationship for the reach. Reach routing and unaccounted differences were then combined and optimised for overall bias and daily NSE correlation. Reach models were then combined (stitched) in the IRSM and fine-tuned where appropriate. All results in this paper reflect stitched model results.
For operational decisions, interviews with IRSA, Water and Power Development Authority (WAPDA), Punjab and Sindh Irrigation Department personnel were consulted to determine preferred flow pathways and storage/barrage operational data [52]. Water orders generated from the seasonal allocation process are passed from most canal commands up the river/canal pathways to Chashma and Mangla. These orders accumulated travel times and losses so that the correct amount of water was released to arrive at the destination in time. For Eastern Canal Commands, orders can only be met by Marala (Figure 4). The identified water order priority pathways give the model options to source water from different storages in the model, depending on availability. Orders passed up through T-P link and C-J link canals are dependent on the modelled available storage levels in Mangla and Tarbela, with the order directed to the storage with the most available water. Water arriving from unregulated tributaries or canal branches are used to reduce orders to storages.
Depending on inflows, barrage water levels are generally allowed to fluctuate in the model throughout the season; however, some barrages have specific operational heads assigned throughout the year. In such cases, the operational head is set based on the analysis of historic water levels at the barrage for different times of the year.
For water allocation and sharing, the processes adopted by IRSA, as described in Section 2.1.4, were adopted in the model and comparisons between overall modelled and observed share ratios were used to assess model performance of water allocation and sharing components, in addition to overall bias between observed and modelled canal extractions.

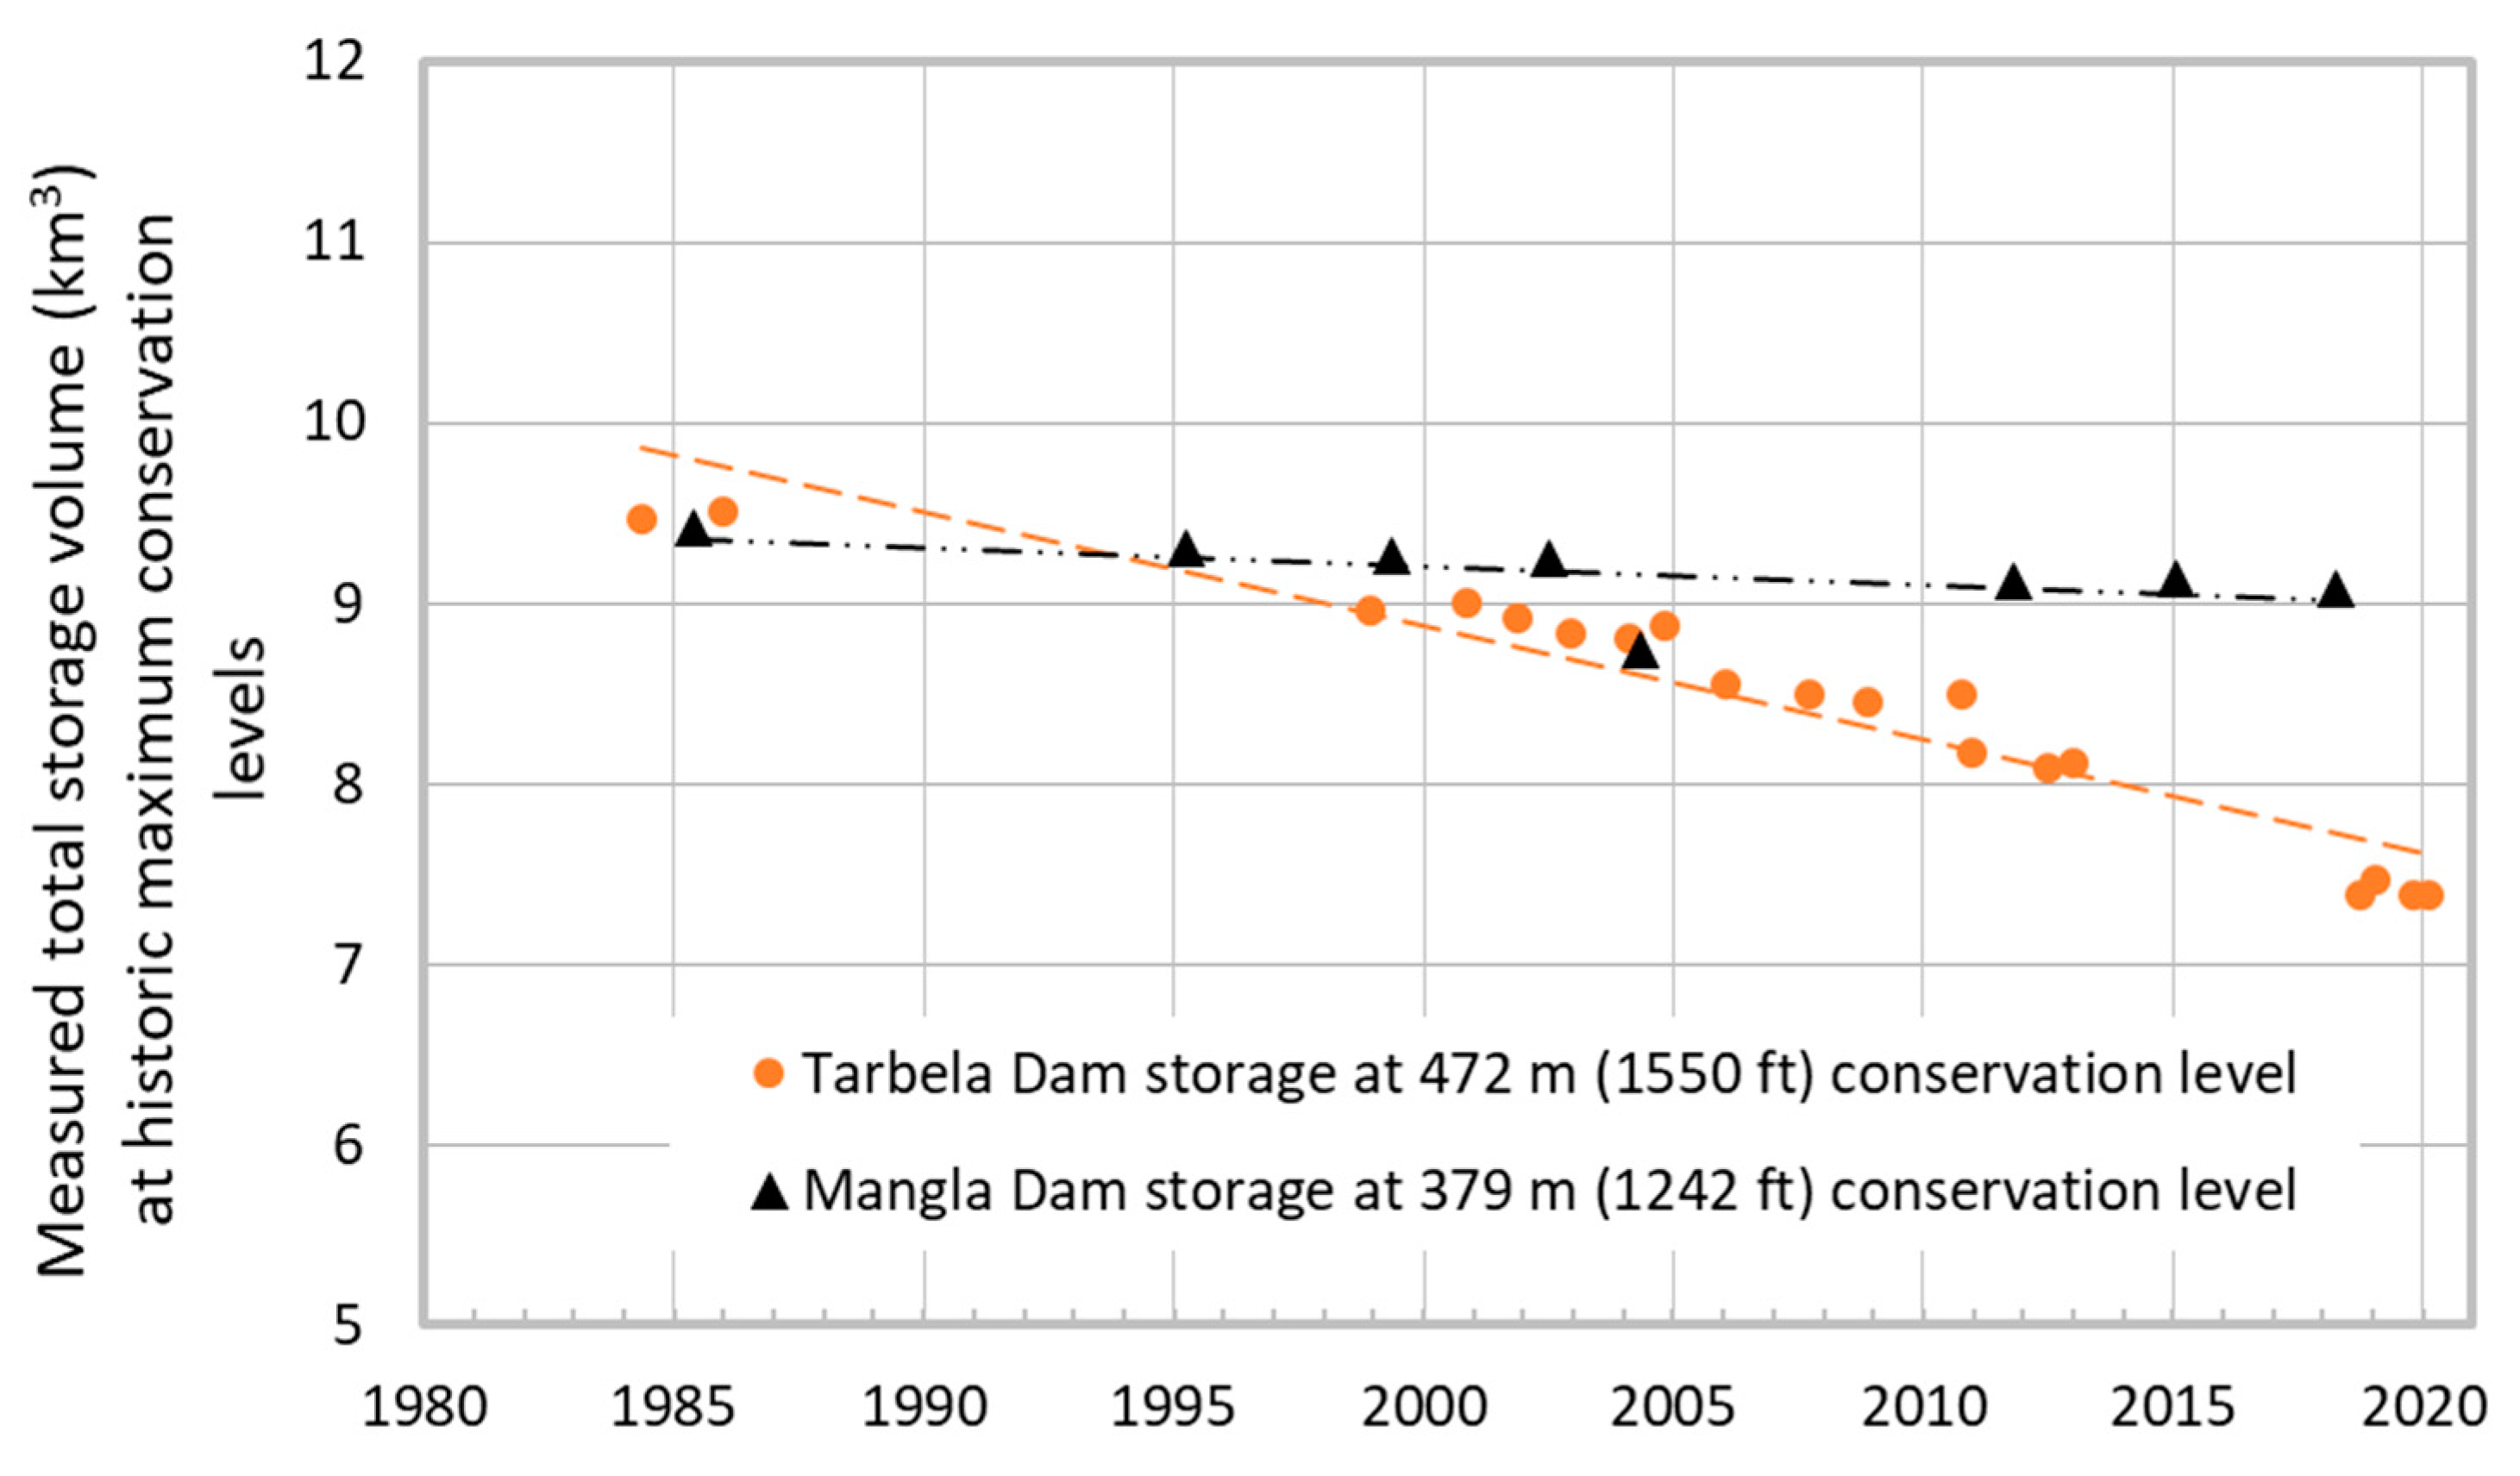
2.4. Sedimentation Scenario

The observed reduction in storage volume resulting from sedimentation through time for Tarbela and Mangla is shown in Figure 5. To investigate these impacts of reservoir sedimentation on water resource availability, two scenarios are considered. The 2020 scenario represents current infrastructure and water-sharing rules with current levels of sedimentation, Tarbela and Mangla capacities are respectively 7.38 km3 (in 2020) and 9.08 km3 (2018). The 1990 scenario considers the current conditions of the model with 1990 levels of sedimentation.

2.4.1. Scenario 1: Current Conditions (2020)

This scenario adopts provincial shares under 2020 reservoir operational capacities with the current sedimentation volume using the historic inflow regime from 1990–2017. Using this configuration of sedimentation, the Tarbela and Mangla capacities are respectively 7.38 (in 2020) and 9.08 km3 (2018).

2.4.2. Scenario 2: Current Conditions with 1990 Sediment Levels

This scenario adopts provincial shares under 2020 water reservoir capacities but with 1990 sedimentation volumes (i.e., greater operational capacity of the reservoirs) using the historic inflow regime from 1990–2017. The capacities of Tarbela and Mangla for this scenario are 9.50 km3 and 9.36 km3, respectively. Note that this scenario does not represent 1990 levels of infrastructure, e.g., Mangla capacity prior to enlargement in 2009.

3. Results

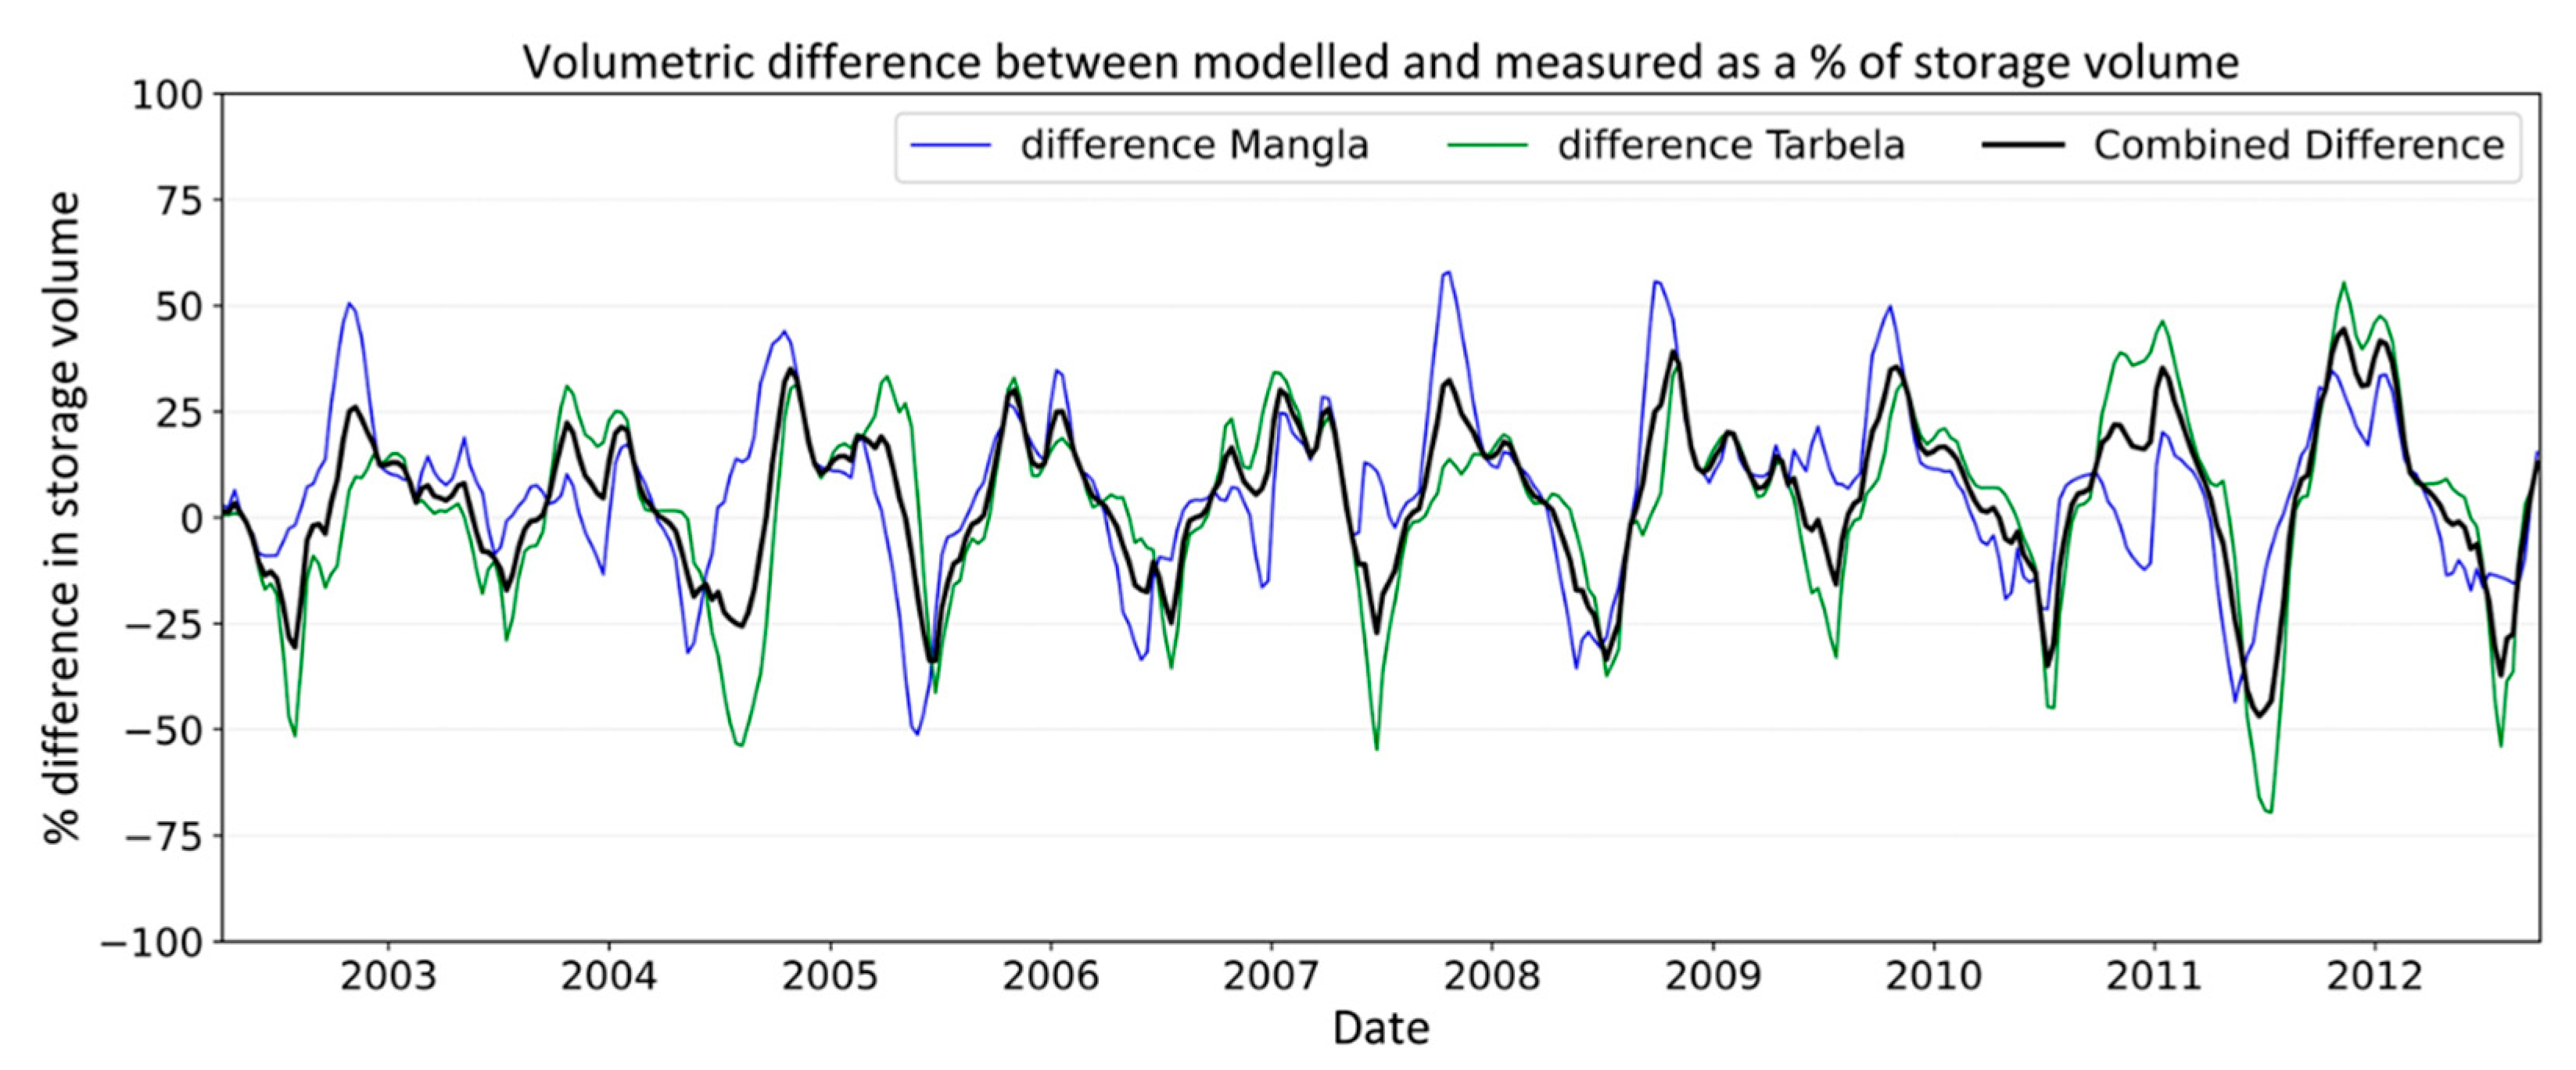
3.1. Model Performance

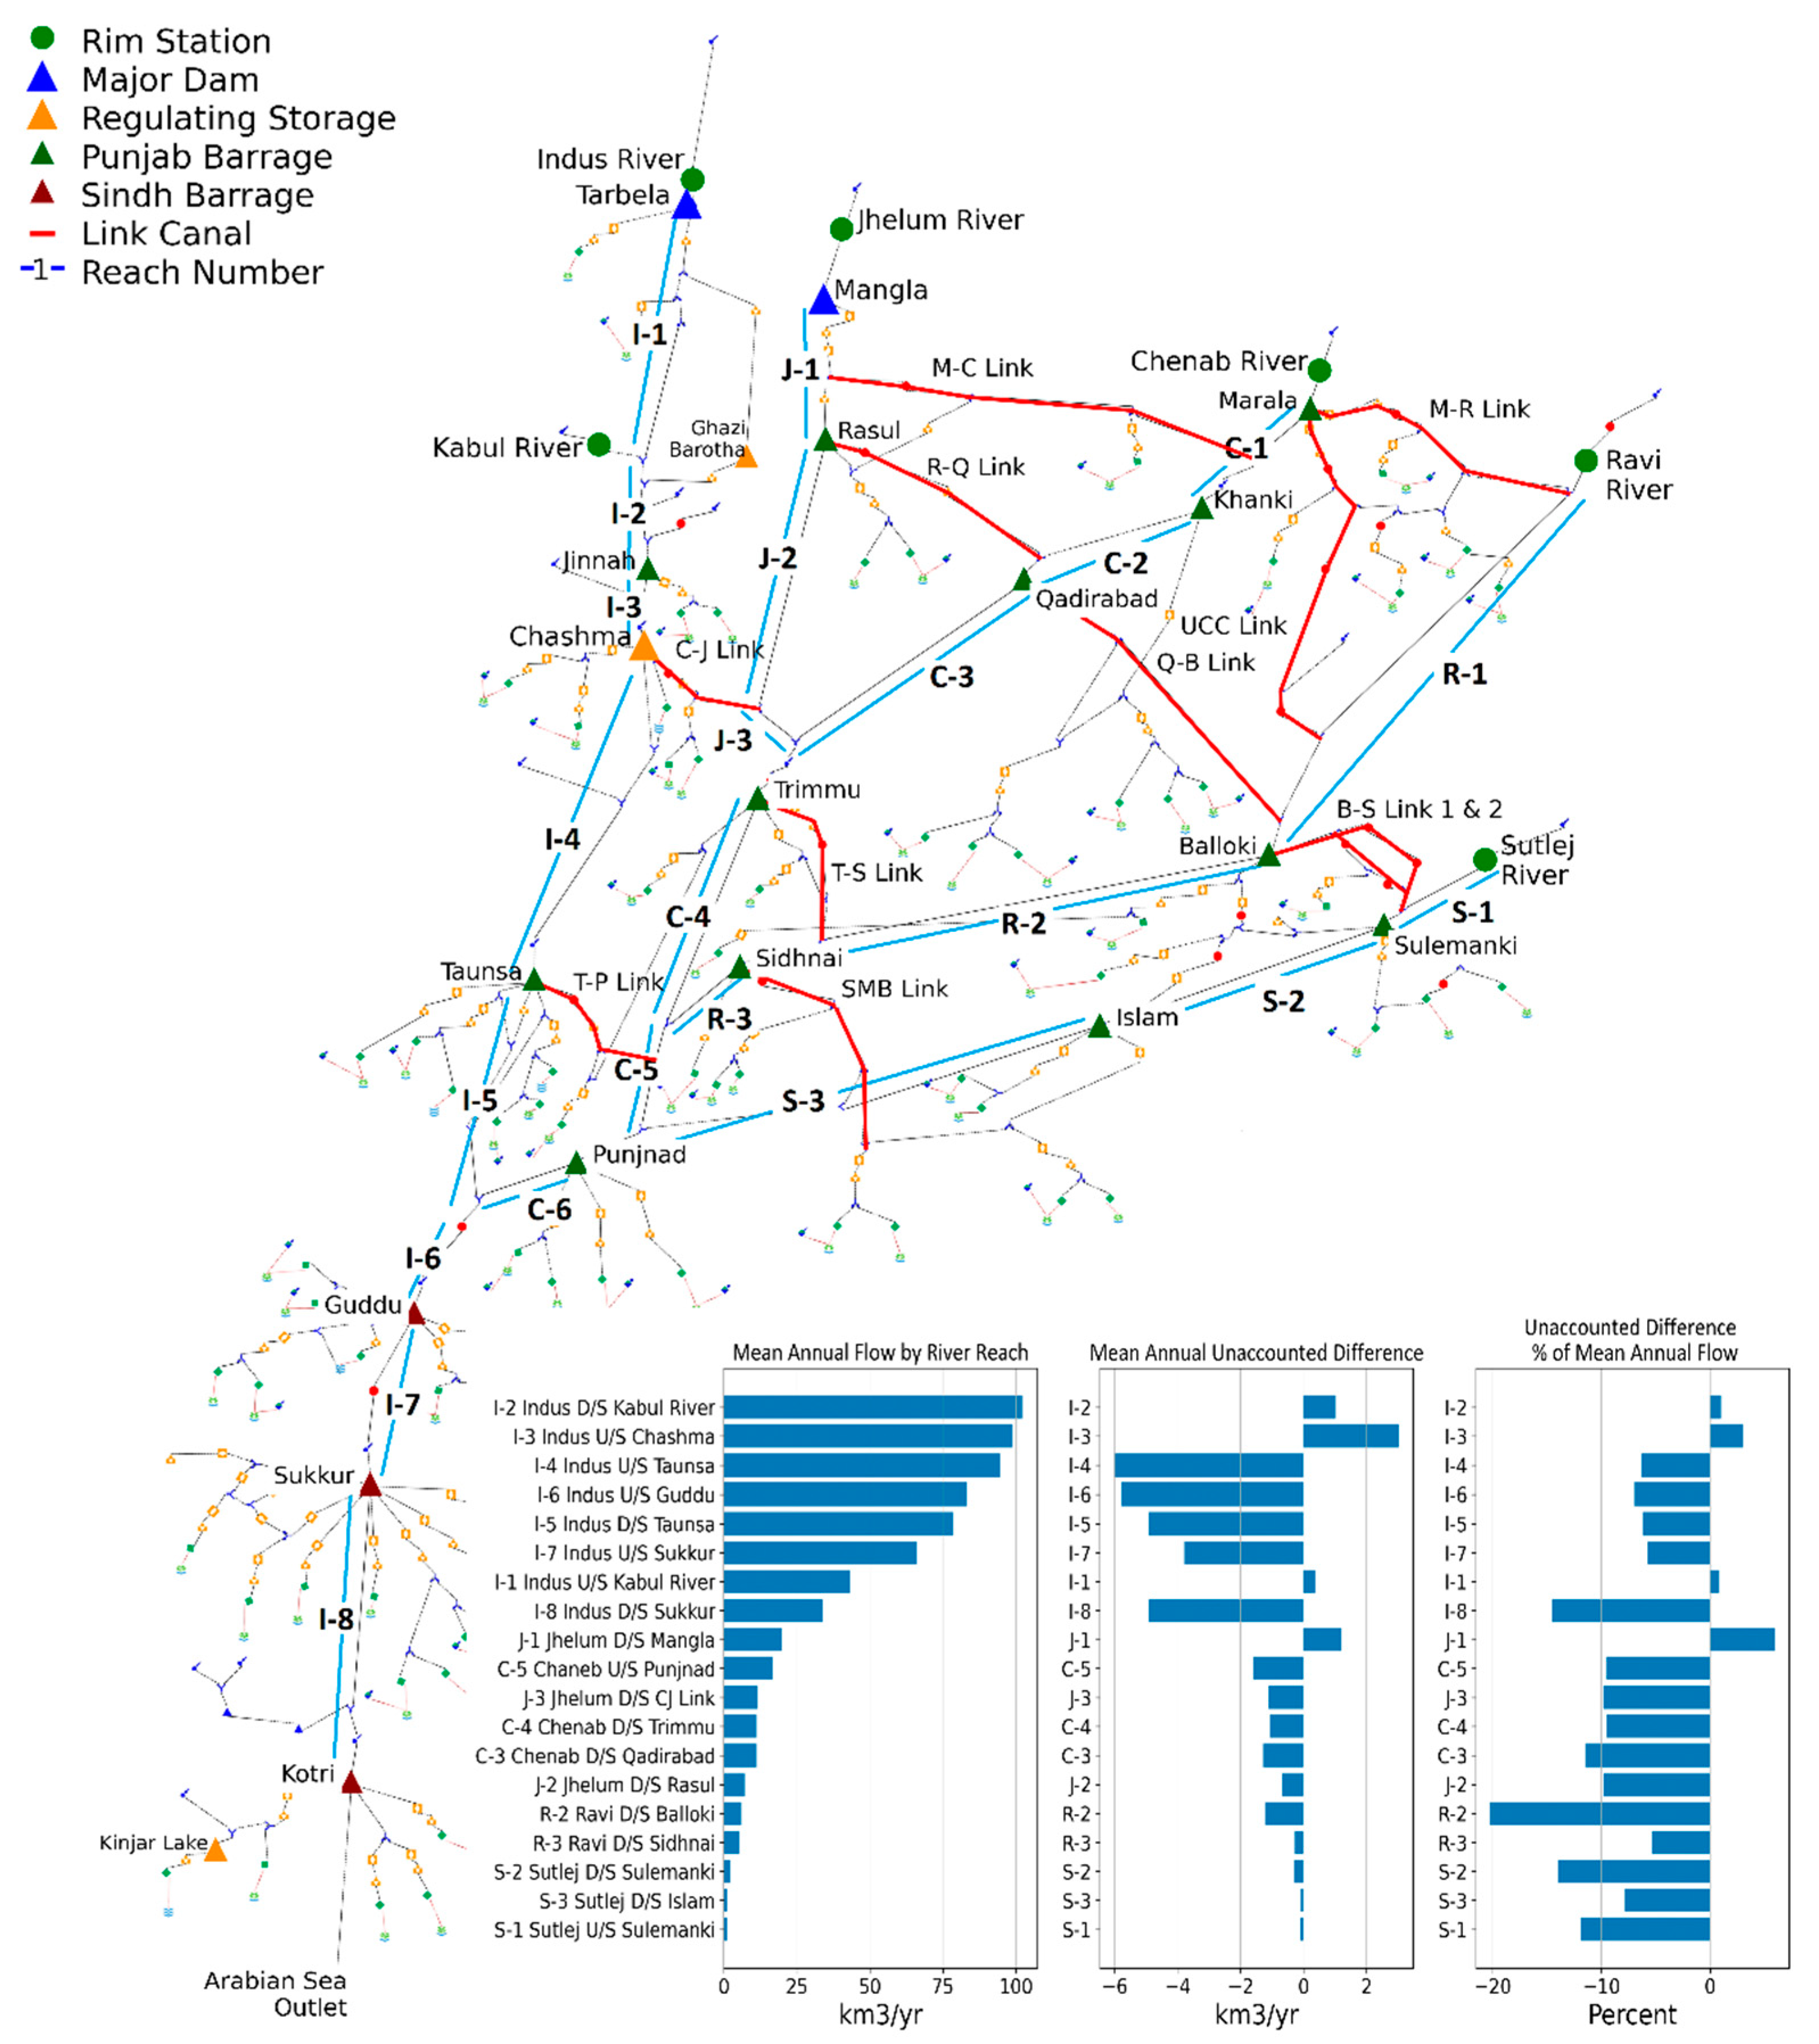
3.1.1. Physical System Performance

Figure 6 shows the mean annual unaccounted difference for river reaches, where both routing and unaccounted difference were modelled, and highlights the lower Indus reaches where the largest unaccounted differences were. These reaches, however, are generally not those with the highest proportional unaccounted differences, which are generally associated with the eastern rivers.
In matching observed flows at barrages, daily operational decisions and the setting of preferential flow paths for water orders were found to have the greatest influence on model performance. After accounting for these operational decisions in the model based on average or most common behaviour, the mean annual relative error (bias)—expressed as a percentage of mean annual river flow for each reach (denoted by downstream barrage location)—is presented in Figure 7 and associated daily NSE, shown in Figure 8.
The river section results showed that:
  • River reaches with the highest flows had the lowest relative error percentage and the best daily NSE correlation.
  • The daily NSE correlation was generally high but diminished with increasing distance from the original water source (i.e., Sidhnai and Islam Barrages). The poor performance at Rasul Barrage was due to a poor correlation with observed releases from Mangla Reservoir.
  • Barrages with low inflows and most of the water being diverted to canals such as Sidhnai, Balloki, Khanki and Punjnad performed the worst because small or moderate errors in either the daily correlation associated with the upstream barrage or volume were amplified in the small downstream releases.
  • Simulated flows exhibited a positive bias upstream of Guddu barrage at Punjnad and Sidhnai. This performance issue was associated with the distribution of water between Indus and J-C systems via TP link canal and corresponding positive bias at Balloki. A greater proportion of water was distributed through eastern link canals in the model, resulting in a negative bias at Guddu Barrage, which was exacerbated further downstream.
  • The simulated Indus flows exhibited an additional negative bias downstream of Sukkur Barrage, which may be due to confusion around whether Balochistan deliveries and the Karachi water supplies from Kotri were included in observed Sindh withdrawals.
Figure 9 shows that there was an average canal error of 5%, with the worst performance at Taunsa T-P Link at 15%. This is the canal that is used to balance usage between Mangla and Tarbela and is difficult to match daily operational decisions. The data shows that most canals exhibited less than 10% bias, which is well within the measurement error.
Figure 10 shows that the maximum percentage volumetric errors in Tarbela and Mangla were as large as 50%. The figure also shows that an error in one reservoir is typically offset by a similar magnitude negative error in the other. This finding indicates that the model balances the reservoirs differently compared with observed operational behaviour. When combined, the overall storage volume error oscillates between positive (maximum 31%) and negative (minimum −30%), indicating no bias toward retaining or releasing too much water. As the storage capacities of the dams are much less than the mean annual flow in the rivers, the dam storage volumetric error, expressed as a percentage of mean annual flow is relatively small. For the calibration period, the Mangla, Tarbela and combined respective storage volume errors relative to inflows are −6.4% to 8.8%, −5.2% to 3.6% and −4.3% to 4.5% for the combined system.
The model is configured to match average behaviour and does not capture all daily operational decisions and consequently an exact match with observed behaviour is not possible. Most of the model’s uncertainty is caused by daily operational decisions. The model is unable to simulate subjective decisions, but it tried to replicate the average of balancing of reservoirs and distributions of water between systems across the historical period. As the inflows are considerably larger than the stored resource, the allocation process is more sensitive to the inflows than where the stored resource resides. Therefore, it is not sensitive to average operational behaviour assumptions. However further refinement of storage target levels and order distribution between Indus and J-C systems could improve modelled storage performance in the model, but this would be outside of the agreed average operational behaviour. On this basis, the average behaviour over the modelling period was reasonably good and is a considerable improvement on existing models that do not accurately represent the sharing and distribution rules.

3.1.2. Water Allocation and Sharing Performance

The modelled provincial flow proportions are a close match to historic allocations across both the calibration and validation period. Figure 11 shows that the model replicated the average water-sharing between Sindh and Punjab within 0.1% with seasonal error (not shown) less than 1%.
Figure 12 shows the time series of modelled and observed total canal withdrawals for Punjab and Sindh provinces. The match is reasonably good, considering that the model does not consider specific operational decisions such as temporary canal closures for maintenance or closures during flood periods (i.e., 2010).

3.2. Reservoir Sedimentation Impacts

The operational capacities of Tarbela and Mangla reservoirs are being reduced due to sedimentation; however, the water-sharing policies are based on fixed shares. The IRSM model was run with current (2020) level-volume relationships for Tarbela and Mangla and with previous relationships for 1990 and run for the historic period of 1990–2017 (26 complete years) to assess the change in available resources and the shares to Punjab and Sindh. Table 1 shows the modelled change in seasonal shares and resources for the two scenarios. Balochistan and KP have high security shares that do not change.
Table 1 shows that for a 2.4 km3 reduction in storage capacity there is an annual reduction of 0.95 km3 of supplied resource, which is predominantly in Rabi. In early Kharif there is a slight increase in resources for Punjab and Sindh in the 2020 scenario. This is because less water is being set aside for reservoir filling and can therefore be allocated. However, in late Kharif, where spilling is increased due to sedimentation, Sindh may be able to opportunistically take unregulated water to fulfil share requirements.
In percentage terms, the Rabi supply for Punjab and Sindh combined is respectively reduced on average by between 4% and 5% across equivalent years of simulation (Figure 13), whereas the average increase in Early Kharif and Kharif flows is less than 1% across equivalent years. In some years, the modelling indicates larger Kharif percentage changes in canal deliveries, but generally not lower canal deliveries. All 26 years of model simulation show a decrease in total Rabi deliveries, with the largest percentage reductions in deliveries occurring in the late October to early December period.

4. Discussion

The modelled scenario shows that the reduction in storage capacity does not equate to an equivalent reduction in canal deliveries. The Rabi season canal deliveries see the greatest percentage decline between the 1990 and 2020 scenarios of between 4% and 5% or approximately 1.26 km3 of canal deliveries per year. This difference is due to the system harvesting opportunistic (unregulated) water to meet supply share requirements. The most heavily impacted period of the Rabi is late October to early December, i.e., the crop sowing period, when stored water supplies run out. The month of January, however, coincides with canal closures and is associated with the lowest canal delivery period. During February and March, opportunistic water can be taken (provided the water is not stored), further reducing the difference between scenarios at this time of the year. Although many studies may look at potential changes to inflows to the IBIS from climate change or potential upstream development, which are uncertain, this study has focused on a historic decrease in available storage through sedimentation, which has shown remarkably consistent trends that will continue. This would indicate that without further augmentation of system storage, the Rabi season supplies will continue to be further impacted in the future. An essential component of assessing these future supply scenarios will be the potential changes to inflows and associated sediment load because of climate change. This study is limited in that it does not yet consider these potential future impacts. The model also does not attempt to identify the associated increase in crop failures or critical supply thresholds; however, these limitations may be considered in future modelling studies.
The unaccounted flow differences highlighted in Figure 6 are a large component of the water balance and are consequently an area of concern for water managers. The model calibration uses average unaccounted difference estimates for each of the reaches and calibration for overall bias in a reach did not identify a need for changes to the non-linear flow vs. unaccounted difference tables over time. However, considerable debate is ongoing in Pakistan over possible trends in unaccounted differences. We suggest that perceived changes to unaccounted differences may in part be explained by changes in internal and external flows which are captured by the model through the non-linear flow vs. unaccounted difference tables. In many reaches of the IRSM, the derived unaccounted difference term diminishes as a proportion of flow as flows increase until out-of-bank (flood) flow conditions are met. These relationships suggest that in low flow years, unaccounted differences as a proportion of flow rate may increase, although further research is required to confirm this.
Few river modelling frameworks have sufficient flexibility to include a seasonal planning phase as complex as that used in the IBIS. The IRSM originally contained functions that approximated the seasonal planning calculations; however, to capture a more complete process, the seasonal forecast calculations were undertaken outside of the IRSM. This is a key limitation of the current version of IRSM and work is currently underway to better integrate the planning phase of the IBIS through a software plugin to Source. The current model has, however, demonstrated key operational aspects of the IBIS that are not addressed by other models, namely, seasonal water allocation and distribution to canal commands and river operations to link canals and canal commands. The IRSM captures previously undocumented operational rules and expert knowledge essential to the representation of the IBIS.
Finally, other current limitations of the IRSM include no allowance for urban population growth over time and incomplete representation of hydropower production. In many cases, urban surface water supplies are small in relation to unaccounted differences and this does not impact model accuracy. However, Karachi extracts a significant amount of water from the Indus and has significant population growth [53]. Future model studies could be improved by a better conceptualisation of the Karachi water supply. Hydropower production has been explored by the model; however, as Figure 10 demonstrates, hydropower production may prove difficult to match without first achieving a closer match with reservoir storage operations.

5. Conclusions

In response to the Water Sector Task Force Report of 2012, the IRSM has been built to replicate both the physical and management (allocation, sharing and distribution) processes in the Pakistan IBIS. The purpose of this study was to assess the capability and suitability of the IRSM to model the system’s operation and assess the impacts of reservoir sedimentation on water resource security and sharing.
Model calibration results for the period 2002–2012 show that provincial allocation ratios agree with historic water deliveries (0.1% error in sharing) and that water delivered to barrages and then on to canal commands is also in agreement with recorded data (major barrages with a daily NSE of 0.7). Storage behaviour simulated by the model indicates some scope for improving the balancing of stored water resources between storages. The average maximum volume errors with respect to the mean annual inflow for Tarbela and Mangla are respectively 5.2% and 8.8%. This performance demonstrates that the IRSM is capable of modelling water-sharing and allocations to replicate the historic allocation of water in the IBIS. Furthermore, the model can also be used to investigate the unaccounted water in the system and to ensure necessary efficiency in the water distribution. Based on this performance, the model is suitable to investigate the impact of climate change and reservoir sedimentation on canal command water balance analysis and future provincial water security in Pakistan [53,54]. In addition to impact assessment, this modelling framework can be enhanced to investigate the whole of the system and canal-command-scale current and future water planning and management decisions.
The reservoir sedimentation study showed that a 2.3 km3 reduction in storage volume equates to a 1.26 km3 reduction in water supplied in the Rabi season. It also showed that the impact is not equitable between provinces, with KP and Balochistan not being affected in similar way to Punjab and Sindh. This problem will exacerbate over time as the storages continue to fill with sediment and changes to water-sharing arrangements will be required in response to this. This study found that the potential reduction in Rabi canal deliveries resulting from reservoir sedimentation were partly offset by small increases in Kharif canal deliveries; however, the model also indicated that some parts of the Rabi season experienced more severe shortages that may reach critical points in the future as reservoir sedimentation continues.

Author Contributions

Conceptualisation, G.M.P., M.-u.-D.A. and J.P.S.; formal analysis, G.M.P. and J.P.S.; project administration, M.-u.-D.A.; writing–original draft, G.M.P., M.-u.-D.A. and J.P.S.; writing–review and editing, G.M.P., M.-u.-D.A., Y.Y., J.P.S., S.M.M.A.S. and Z.I.K. All authors have read and agreed to the published version of the manuscript.

Funding

This research was funded by the Australian Department of Foreign Affairs and Trade (Sustainable Development Investment Portfolio and Water Apportionment Accord Tool projects in Pakistan) and the Commonwealth Scientific Industrial Research Organisation (CSIRO).

Institutional Review Board Statement

Not applicable.

Informed Consent Statement

Not applicable.

Data Availability Statement

The data that support the findings of this study are available from the relevant Pakistan Government organisation. Restrictions apply to the availability of these data, which were used under license for this study. Data are available from the authors with the permission of relevant Pakistan Government organisation.

Acknowledgments

We thank collaborating agencies from Pakistan especially the Ministry of Water Resources (MoWR), Indus River System Authority (IRSA), Water and Power Development Authority (WAPDA), Pakistan Meteorological Department (PMD) and provincial irrigation departments of Punjab (PID), Sindh (SID), Balochistan (BID) and Khyber Pakhtunkhwa (KPID) for the provision of data, technical advice and feedback.

Conflicts of Interest

The authors declare no conflict of interest. The funders had no role in the design of the study, and in the collection, analyses, or interpretation of data.

Appendix A. Pakistan Inter-Provincial Water Apportionment Accord Paragraphs

Table A1. Pakistan inter-provincial Water Apportionment Accord * Paragraph 14(b), 2 and 4.
ProvincesParagraph 14(b)Paragraph 2Paragraph 4
Punjab53.06%48.92%37.00%
Sindh42.37%42.64%37.00%
Khyber Pakthunkhwa (KP)2.98%5.06%14.00%
Balochistan1.59%3.39%12.00%
* Adopted from Government of Pakistan [38], and Khan [55].

Appendix B. Available Data Sources

Appendix B.1. Climate

Observed climate data were obtained from PMD and WAPDA and interpolated using ANUSPLIN version 3.2 [56] to generate gridded rainfall, temperature, and evapotranspiration data. These were used to derive relevant climate information for key areas within the model.

Appendix B.2. Streamflow Data

Gauged water level and flow time series data were obtained from WAPDA, PID and SID. Basic quality checking was conducted using double mass plots, confirming no unexpected behavior between neighboring flow gauges. The gauged rim station flow time series define the upper extent of IRSM (Figure 1 and Figure 2).

Appendix B.3. Irrigated Crop Area

Irrigated crop areas for each canal were derived by disaggregating district crop statistics to canal command boundaries through Geographic Information System (GIS) overlay analysis [12,57].

Appendix B.4. Other Water Demands

Hydropower plant design and operational capacities were obtained from WAPDA. Small stock and domestic, industrial and mining demands were not included in the model as information was not available. The model includes town water supplies for Muzaffargarh, DG Khan and Karachi.

Appendix B.5. Infrastructure Data

Time series of level and volume data for Tarbela, Chashma and Mangla storages were provided by IRSA and WAPDA. These were included in the model to consider historic sedimentation. Volume time series and level-volume relationships are available for barrages and storage capacity was assumed to be equivalent of at least 2 days’ supply to off-taking canals to ensure model numerical stability.
Link and irrigation canal capacities were obtained from PID and SID and were used to constrain the maximum delivery model capacity for each canal [44].

Appendix B.6. Water Management Data

Water shares at the canal command were determined in the model from a series of functions which break down the provincial sharing data, determined according to the principles outlined in Section 2.1.4. Historical usage patterns for all canal commands in a province were used to create daily canal command deliveries as a proportion of total provincial shares. These deliveries were used in the model as minimum flow requirements (orders) at canal command heads.

References

  1. Briscoe, J.; Qamar, U.; Contijoch, M.; Amir, P.; Blackmore, D. Pakistan’s water economy: Running dry. In Water P-Notes; World Bank: Washington, DC, USA, 2005. [Google Scholar]
  2. Ahmad, M.D.; Stewart, J.; Podger, G. Indus River System Model: A Planning Tool to Explore Water-Energy-Food Nexus for Pakistan. In Proceedings of the Managing Systems Under Stress: Science for Solutions in the Indus Basin, 3rd Indus Knowledge Forum, Laxenburg, Austria, 31 May–2 June 2018. [Google Scholar]
  3. Ahmad, M.D.; Stewart, J.P.; Podger, G.M. Modelling the surface water allocations and deliveries in the world’s largest continuous irrigation system, Indus Basin Pakistan. In Proceedings of the EGU General Assembly, Vienna, Austria, 7–12 April 2018; p. 1633. [Google Scholar]
  4. Archer, D.R.; Forsythe, N.; Fowler, H.J.; Shah, S.M. Sustainability of water resources management in the Indus Basin under changing climatic and socio-economic conditions. Hydrol. Earth Syst. Sci. 2010, 14, 1669–1680. [Google Scholar] [CrossRef] [Green Version]
  5. Immerzeel, W.W.; Bierkens, M.F.P. Asia’s water balance. Nat. Geosci. 2012, 5, 841–842. [Google Scholar] [CrossRef]
  6. Khan, A.J.; Koch, M.; Tahir, A.A. Impacts of Climate Change on the Water Availability, Seasonality and Extremes in the Upper Indus Basin (UIB). Sustainability 2020, 12, 1283. [Google Scholar] [CrossRef] [Green Version]
  7. Laghari, A.N.; Vanham, D.; Rauch, W. The Indus basin in the framework of current and future water resources management. Hydrol. Earth Syst. Sci. 2012, 16, 1063–1083. [Google Scholar] [CrossRef] [Green Version]
  8. Lutz, A.F.; Immerzeel, W.W.; Kraaijenbrink, P.D.A.; Shrestha, A.B.; Bierkens, M.F.P. Climate Change Impacts on the Upper Indus Hydrology: Sources, Shifts and Extremes. PLoS ONE 2016, 11, e0165630. [Google Scholar] [CrossRef] [PubMed] [Green Version]
  9. Nepal, S.; Shrestha, A.B. Impact of climate change on the hydrological regime of the Indus, Ganges and Brahmaputra river basins: A review of the literature. Int. J. Water Resour. Dev. 2015, 31, 201–218. [Google Scholar] [CrossRef] [Green Version]
  10. Rajbhandari, R.; Shrestha, A.B.; Kulkarni, A.; Patwardhan, S.K.; Bajracharya, S.R. Projected changes in climate over the Indus river basin using a high resolution regional climate model (PRECIS). Clim. Dyn. 2015, 44, 339–357. [Google Scholar] [CrossRef] [Green Version]
  11. Yu, W.; Yang, Y.-C.; Savitsky, A.; Alford, D.; Brown, C.; Wescoat, J.; Debowicz, D.; Robinson, S. The Indus Basin of Pakistan: The Impacts of Climate Risks on Water and Agriculture; World Bank: Washington, DC, USA, 2013. [Google Scholar]
  12. Ahmad, M.D.; Peña-Arancibia, J.L.; Stewart, J.P.; Kirby, J.M. Water balance trends in irrigated canal commands and its implications for sustainable water management in Pakistan: Evidence from 1981 to 2012. Agric. Water Manag. 2021, 245, 106648. [Google Scholar] [CrossRef]
  13. Al-Saidi, M.; Elagib, N.A. Towards understanding the integrative approach of the water, energy and food nexus. Sci. Total Environ. 2017, 574, 1131–1139. [Google Scholar] [CrossRef]
  14. Kirby, M.; Ahmad, M.D.; Mainuddin, M.; Khaliq, T.; Cheema, M.J.M. Agricultural production, water use and food availability in Pakistan: Historical trends, and projections to 2050. Agric. Water Manag. 2017, 179, 34–46. [Google Scholar] [CrossRef]
  15. Qureshi, A.S. Groundwater Governance in Pakistan: From Colossal Development to Neglected Management. Water 2020, 12, 3017. [Google Scholar] [CrossRef]
  16. Watto, A.; Mugera, A. Groundwater depletion in the Indus Plains of Pakistan: Imperatives, repercussions and management issues. Int. J. River Basin Manag. 2016, 14, 447–458. [Google Scholar] [CrossRef]
  17. Yang, Y.-C.E.; Brown, C.; Yu, W.; Wescoat, J.; Ringler, C. Water governance and adaptation to climate change in the Indus River Basin. J. Hydrol. 2014, 519, 2527–2537. [Google Scholar] [CrossRef] [Green Version]
  18. Lankford, B.; Bakker, K.; Zeitoun, M.; Conway, D. Water Security: Principles, Perspectives and Practices; Routledge: Abingdon, UK, 2013. [Google Scholar]
  19. Raza, R.A.; Rehman, H.U.; Khan, N.; Akhtar, M. Exploring sediment management options of Mangla reservoir using REASSESS. Sci. Int. 2015, 27, 3347–3352. [Google Scholar]
  20. FODP-WSTF. A Productive and Water-Secure Pakistan: Infrastructure, Institutions, Strategy, the Report of the Water Sector Task Force of the Friends of Democratic Pakistan; Pakistan Ministry of Water and Power and Asian Development Bank: Islamabad, Pakistan, 2012.
  21. Young, W.; Anwar, A.; Bhatti, T.; Borgomeo, E.; Davies, S.; Garthwaite, W.R., III; Gilmont, M.; Leb, C.; Lytton, L.; Makin, I.; et al. Pakistan: Getting More from Water; World Bank: Washington, DC, USA, 2019. [Google Scholar] [CrossRef]
  22. Wada, Y.; Vinca, A.; Parkinson, S.; Willaarts, B.A.; Magnuszewski, P.; Mochizuki, J.; Mayor, B.; Wang, Y.; Burek, P.; Byers, E.; et al. Co-designing Indus Water-Energy-Land Futures. One Earth 2019, 1, 185–194. [Google Scholar] [CrossRef] [Green Version]
  23. Eastham, J.; Kirby, M.; Mainuddin, M.; Thomas, M. Water-use accounts in CPWF basins: Simple water-use accounting of the Indus Basin. CPWF Work. Pap. BFP07 2010, 27. Available online: https://hdl.handle.net/10568/4696 (accessed on 20 March 2021).
  24. O’Mara, G.T.; Duloy, J.H. Modeling efficient water allocation in a conjunctive use regime: The Indus Basin of Pakistan. Water Resour. Res. 1984, 20, 1489–1498. [Google Scholar] [CrossRef]
  25. World Bank. Water Sector Investment Planning Study: Guide to the Indus Basin Model Revised; World Bank Group: Washington, DC, USA, 1990. [Google Scholar]
  26. Yang, Y.-C.E.; Brown, C.M.; Yu, W.H.; Savitsky, A. An introduction to the IBMR, a hydro-economic model for climate change impact assessment in Pakistan’s Indus River basin. Water Int. 2013, 38, 632–650. [Google Scholar] [CrossRef]
  27. Robinson, S.; Gueneau, A. CGE-W: An Integrated Modeling Framework for Analyzing Water-Economy Links Applied to Pakistan. In Proceedings of the 16th Annual Conference on Global Economic Analysis, Shanghai, China, 12–14 June 2013. [Google Scholar]
  28. Van Waijjen, E.G.; Hart, W.W.H.; Kuper, M.; Brouwer, R. Using a hydro-dynamic flow model to plan maintenance activities and improve irrigation water distribution: Application to the Fordwah distributary in Punjab, Pakistan. Irrig. Drain. Syst. 1997, 11, 367–386. [Google Scholar] [CrossRef]
  29. Johnston, R.; Smakhtin, V. Hydrological Modeling of Large river Basins: How Much is Enough? Water Resour. Manag. 2014, 28, 2695–2730. [Google Scholar] [CrossRef] [Green Version]
  30. Khan, A.D.; Ghoraba, S.; Arnold, J.G.; Di Luzio, M. Hydrological modeling of upper Indus Basin and assessment of deltaic ecology. Int. J. Mod. Eng. Res. 2014, 4, 73–85. [Google Scholar]
  31. Kirby, M.; Ahmad, M.D. Water Resources Management in Developing Countries: The Role of Hydrology—Economic Modelling; CSIRO: Canberra, ACT, Australia, 2014.
  32. Condon, M.; Kriens, D.; Lohani, A.; Sattar, E. Challenge and response in the Indus Basin. Water Policy 2014, 16, 58–86. [Google Scholar] [CrossRef]
  33. United Nations. The Indus Waters Treaty 1960 between the Government of India, the Government of Pakistan and the International Bank for Reconstruction and Development; United Nations: New York, NY, USA, 1960; Volume V419, p. 125. [Google Scholar]
  34. Ahmad, M.D.; Masih, I.; Giordano, M. Constraints and opportunities for water savings and increasing productivity through Resource Conservation Technologies in Pakistan. Agric. Ecosyst. Environ. 2014, 187, 106–115. [Google Scholar] [CrossRef]
  35. Charles, S. Hydroclimate of the Indus: Synthesis of the Literature Relevant to Indus Basin Hydroclimate Processes, Trends, Seasonal Forecasting and Climate Change; CSIRO Land and Water: Floreat, WA, Australia, 2016.
  36. Ahmad, M.D.; Kirby, J.M.; Cheema, M.J.M. Impact of agricultural development on evapotranspiration trends in the irrigated districts of Pakistan: Evidence from 1981 to 2012. Water Int. 2019, 44, 51–73. [Google Scholar] [CrossRef]
  37. WAPDA. Reservoir Capacity Tables; Water and Power Development Authority: Lahore, Pakistan, 2020. (in press)
  38. Government of Pakistan. Apportionment of Waters of Indus River System between the Provinces of Pakistan, Agreement 1991 (A Chronological Expose); Government of Pakistan: Islamabad, Pakistan, 1991.
  39. Carr, R.; Podger, G. eWater Source-Australia’s next generation IWRM modelling platform. In Proceedings of the Hydrology and Water Resources Symposium 2012, Sydney, NSW, Australia, 19–22 November 2012; p. 742. [Google Scholar]
  40. eWater. Source Model. Available online: https://ewater.org.au/products/ewater-source/ (accessed on 4 November 2018).
  41. Welsh, W.D.; Vaze, J.; Dutta, D.; Rassam, D.; Rahman, J.M.; Jolly, I.D.; Wallbrink, P.; Podger, G.M.; Bethune, M.; Hardy, M.J.; et al. An integrated modelling framework for regulated river systems. Environ. Model. Softw. 2013, 39, 81–102. [Google Scholar] [CrossRef]
  42. Dolk, M.; Penton, D.J.; Ahmad, M.D. Amplification of hydrological model uncertainties in projected climate simulations of the Upper Indus Basin: Does it matter where the water is coming from? Hydrol. Process. 2020, 34, 2200–2218. [Google Scholar] [CrossRef]
  43. Wallbrink, P. A new national river modelling platform. Water 2008, 35, 6–8. [Google Scholar]
  44. Stewart, J.; Podger, G.; Ahmad, M.D.; Shah, S.M.; Bodla, H.; Khero, Z.; Rana, M. Indus River System Model (IRSM)—A Planning Tool to Explore Water Management Options in Pakistan: Model Conceptualisation, Configuration and Calibration; CSIRO: Canberra, ACT, Australia, 2018.
  45. Dutta, D.; Wilson, K.; Welsh, W.D.; Nicholls, D.; Kim, S.; Cetin, L. A new river system modelling tool for sustainable operational management of water resources. J. Environ. Manag. 2013, 121, 13–28. [Google Scholar] [CrossRef]
  46. Ahmad, M.D.; Yu, Y.; Cuddy, S.; Freebairn, A.; Perraud, J.-M.; Podger, G.; Seaton, S. Bringing Transparency and Consistency in Pakistan’s Inter-Provincial Seasonal Water Planning Decisions: Water Apportionment Accord (WAA) Tool; CSIRO Land and Water: Floreat, WA, Australia, 2021.
  47. Indus River System Authority. IRSA Press Release 8th December 2020. Available online: http://pakirsa.gov.pk/Doc/IRSA_press.pdf (accessed on 20 March 2021).
  48. Barrett, D.; Kuzmin, V.; Walker, J.; McVicar, T.; Draper, C. Improving Stream Flow Forecasting by Integrating Satellite Observations, In Situ Data and Catchment Models Using Model-Data Assimilation Methods; eWater Cooperative Research Centre: Canberra, ACT, Australia, 2008. [Google Scholar]
  49. Nash, J.E.; Sutcliffe, J.V. River flow forecasting through conceptual models part I—A discussion of principles. J. Hydrol. 1970, 10, 282–290. [Google Scholar] [CrossRef]
  50. Close, A. A new daily model of flow and solute transport in the River Murray. In Proceedings of the Hydrology and Water Resources Symposium 1996: Water and the Environment, Hobart, Tas, Australia, 21–24 May 1996; pp. 173–178. [Google Scholar]
  51. Koussis, A.D. Assessment and review of the hydraulics of storage flood routing 70 years after the presentation of the Muskingum method. Hydrol. Sci. J. 2009, 54, 43–61. [Google Scholar] [CrossRef]
  52. Wu, W.; Maier, H.R.; Dandy, G.C.; Leonard, R.; Bellette, K.; Cuddy, S.; Maheepala, S. Including stakeholder input in formulating and solving real-world optimisation problems: Generic framework and case study. Environ. Model. Softw. 2016, 79, 197–213. [Google Scholar] [CrossRef]
  53. Ahmad, M.D.; Stewart, J.; Pena Arancibia, J.; Kirby, M. Sindh Water Outlook: Impacts of Climate Change, Dam Sedimentation and Urban Water Supply on Irrigated Agriculture; CSIRO: Canberra, ACT, Australia, 2020.
  54. Ahmad, M.D.; Stewart, J.; Pena Arancibia, J.; Kirby, M. Punjab Water Outlook: Impacts of Climate Change and Dam Sedimentation on Water for Irrigated Agriculture; CSIRO: Canberra, ACT, Australia, 2020.
  55. Khan, R.I.A. (i) Historical Perspectives on Indus Water Treaty; (ii) Water Availability, Conservation and Distribution in Pakistan; Lahore University of Management Sciences (LUMS): Lahore, Pakistan, 2016. [Google Scholar]
  56. Hutchinson, M.F. Interpolation of rainfall data with thin plate smoothing splines. Part II: Analysis of topographic dependence. J. Geogr. Inf. Decis. Anal. 1998, 2, 152–167. [Google Scholar]
  57. Kirby, M.; Ahmad, M.D. Time Series (1980–2012) Crop. Areas and Production in the Districts and Canal Commands of Pakistan; CSIRO: Canberra, ACT, Australia, 2016; p. 21.
Figure 1. The Indus River system, showing major reservoirs, headworks, provincial boundaries, the Indus Basin Irrigation System (IBIS) and the Indus and Jhelum-Chenab (J-C) management zones (systems) in Pakistan. Tarbela, Mangla, Marala, Nowshera, Balloki and Sulemanki are considered remote inflow measurement (rim) stations for IBIS. For a detailed schematic diagram of the IBIS (depicting the current storage and canal system as of 2020), refer to Figure A1 in Ahmad et al. [12].
Water 13 00895 g001
Figure 2. (a) Mean 10-day inflow and water delivery patterns in the Indus system. (b) Mean 10-day inflow and water delivery patterns in the J-C system. (c) Mean 10-day canal deliveries and Paragraph 2 shares required from stored water for the Indus and J-C systems and (d) mean cumulative deliveries and shares required from stored water and 2018–2020 available IBIS storage volume.
Water 13 00895 g002
Figure 3. Schematic representation of seasonal water allocation planning in the J-C and Indus systems.
Water 13 00895 g003
Figure 4. Indus River System Model (IRSM) schematic as implemented in the eWater Source, showing water ordering priority pathways in IBIS. Inset: standard modelling nodes and typical layout.
Water 13 00895 g004
Figure 5. The observed sedimentation of Tarbela and Mangla storages through time. Data source: Water and Power Development Authority (WAPDA) [37].
Water 13 00895 g005
Figure 6. IRSM reach-based flows and proportion of modelled unaccounted differences. Numbering shows river reaches modelled with routing. Inset figure shows river reaches with routing and associated estimated unaccounted differences.
Water 13 00895 g006
Figure 7. Mean annual modelled relative error % (2002–2012) upstream of barrages.
Water 13 00895 g007
Figure 8. Daily model Nash–Sutcliffe coefficient of efficiency (NSE) (2002–2012) upstream of barrages.
Water 13 00895 g008
Figure 9. Mean annual modelled relative volumetric error (%) for 2002–2012 at canals and offtakes.
Water 13 00895 g009
Figure 10. Volumetric difference between modelled and measured as a percentage of storage volume.
Water 13 00895 g010
Figure 11. Modelled and observed water-sharing between Punjab Irrigation Department (PID) and Sindh Irrigation Department (SID) from 2002–2012.
Water 13 00895 g011
Figure 12. Total observed and modelled canal withdrawals, 2002–2012.
Water 13 00895 g012
Figure 13. Estimated percentage change in seasonal canal deliveries to Punjab and Sindh between 1990 and 2020 sedimentation level scenarios.
Water 13 00895 g013
Table 1. 1990 and 2020 scenario reservoir sedimentation shares of available resources.
SeasonScenarioPunjab (km3)Sindh (km3)Balochistan and KP (km3)Total Resource (km3)
Early Kharif1990 sediment levels12.337.310.9920.63
2020 sediment levels12.427.370.9920.78
Late Kharif1990 sediment levels29.1529.293.5562.14
2020 sediment levels29.0429.553.5561.99
Rabi1990 sediment levels16.0013.152.1231.27
2020 sediment levels15.2712.622.1230.01
Total1990 sediment levels57.4849.756.66113.89
2020 sediment levels56.7349.546.66112.94
Publisher’s Note: MDPI stays neutral with regard to jurisdictional claims in published maps and institutional affiliations.

