
Water Temperature Simulation in a Tropical Lake in South China


1
College of Hydrology and Water Resources, Hohai University, Nanjing 210098, China
2
China Renewable Energy Engineering Institute, Beijing 100011, China
3
Appraisal Center for Environment and Engineering, The Ministry of Ecology and Environment of China, Beijing 100012, China
4
Jiangxi Provincial Water Conservancy Planning Design and Research Institute, Nanchang 330029, China
5
Jinling Institute of Technology, Nanjing 211169, China
*
Authors to whom correspondence should be addressed.
Water 2021, 13(7), 913; https://doi.org/10.3390/w13070913
Submission received: 24 January 2021
/
Revised: 21 March 2021
/
Accepted: 23 March 2021
/
Published: 27 March 2021
(This article belongs to the Special Issue Integrated Ecohydrological Models and Aquatic Ecosystem Management)
Abstract
:To study the vertical water temperature structure and thermodynamic characteristics of tropical lake-like reservoirs, a water temperature model was developed by a vertical one-dimensional numerical model for Songtao Reservoir in Hainan Province, China. The model was verified by the measured water temperature data, and sensitivity analysis of key model parameters was carried out. The results show that water temperature simulated by the model in Songtao Reservoir agreed with the observations quite well, and the model is feasible for water temperature simulations in large reservoirs in tropical zones. The sensitivity of vertical water temperature structure to different model parameters varied. For example, the extinction coefficient greatly affected surface water temperature, which is important for the formation and development of the surface water temperature hybrid layer. The vertical mixing coefficient significantly influenced the inflection point position and thickness of the thermocline. The vertical water temperature structure in Songtao Reservoir was stratified. Reservoir surface water temperature varied from 19.4 °C to 33.8 °C throughout a year. The hypolimnion mainly appeared in elevation below 150 m, where the water temperature is basically maintained at 19 °C throughout the year. This study also found that the surface water temperature of Songtao Reservoir in the tropical zone was higher than the air temperature throughout a year, with an annual average of 3.5 °C higher than that of air temperature. The preliminary analysis found out that the higher surface water temperature may be caused by the strong air temperature and solar radiation in tropical zones, in addition to the enhanced capacity of heat absorption and heat storage due to the slow water flow in the reservoir.
1. Introduction
Reservoir water temperature has been studied in China since the 1960s. With a deep understanding of reservoir water temperature mechanism, hydropower resources development at present focuses on solving a series of environmental problems caused by reservoir water temperature stratification [1,2], and many studies on reservoir water temperature simulation and mitigation measures have been carried out. The cases of reservoir water temperature simulations were mainly studied in subtropical, temperate, and plateau mountainous climate regions in China. By contrast, studies on the distribution of reservoir water temperature in tropical zones are less common. Previous studies in different regions showed that air temperature [3,4] and solar radiation have a positive correlation with water temperature [5]. However, the studied water bodies (lakes and reservoirs) are located in different climatic regions, and their morphologies, depths, and water quality are different, which leads to large differences in the spatiotemporal characteristics of water temperature [6,7].
Reservoir water temperature is an important factor in reservoir water resources management in China. Reservoir water temperature presents seasonal stratification in the vertical direction, and there is a great difference between surface water temperature and bottom water temperature. In the situation in which the location of reservoir water intakes is low, the low-temperature water discharge from the reservoir affects normal habitat and breeding of downstream aquatic organisms. To mitigate the impact of low-temperature water discharge, layered water intake structures are often adopted at hydropower stations according to the vertical water temperature structure. Therefore, accurately capturing the vertical structure of water temperature is key to understanding the design of intake structures. Experts in related industries also pay great attention to the research in this aspect and have carried out many studies in different climatic zones. According to the existing water temperature observation data of the reservoir, the range of reservoir water temperature change in different climatic zones in China is approximately 15 °C. The reservoir bottom water temperature is approximately 4.0 °C in Fengman Reservoir in Jilin Province [8,9], 6.0 °C in Longyangxia Reservoir in Qinghai Province [10,11], 10 °C in Xinanjiang Reservoir in Zhejiang Province [12,13], 10–11.5 °C in Ertan Reservoir in Sichuan Province [14,15], 16 °C in Guangzhao Reservoir in Guizhou Province [16], and 17 °C in Nuozhadu Reservoir in Yunan Province [17,18]. However, the bottom water temperature of Songtao Reservoir in Hainan Province located in the southern tropical zone of China is approximately 19 °C, which is obviously higher than those in other regions. Influenced by the unique climatic conditions in tropical zones, water temperature structure and thermodynamic characteristics of reservoirs in tropical zones might be different from those in other regions. Therefore, reservoir water temperature simulation in tropical areas can further reveal the distribution of reservoir water temperature in tropical areas.
Based on a few laboratory and field findings, the dynamic reservoir simulation model (DYRESM) provides a complete set of optional parameters. Thus, this model has been widely used all over the world. Han et al. [19] simulated three-year water temperature change in Sau Reservoir in northeast Spain by the DYRESM model. Gideon et al. [20] used the DYRESM model to simulate the changes in water temperature and salinity in a period of 45 months in Kinneret Lake in northern Israel. Laurie et al. [21] simulated the seasonal change of water temperature and salinity in Dexter Pit Lake in Nevada, USA. David et al. [22] simulated three-year water quality change in Rotorua Lake in northern New Zealand by coupling DYRESM with the computational aquatic ecosystem dynamics model (CAEDYM), and Asaeda et al. [23] simulated the mechanism of two vertical curtains in Terauchi Reservoir in Japan with the DYRESM model to reduce algae outbreak. In China, the DYRESM model has also been widely used. Chen et al. [24] simulated the annual water temperature change in Taihu Lake in 2005, and the modeling results well reflected the daily water temperature change in Taihu Lake. Xie et al. [25] established a DYRESM–CAEDYM one-dimensional (1D) water quality model for Chaohu Lake, calibrated the model parameters using measured data of water quality, hydrology, and meteorology and put forward the water quality model parameters suitable for characterizing the water environment in Chaohu Lake. Chen [26] used the DYRESM model to investigate the stratification and other thermodynamic conditions in Lugu Lake in southwest China.
In this study, Songtao Reservoir in Hainan Province, China, was selected as the study area. Subsequently, a reservoir water temperature model was established to investigate the water temperature distribution in a tropical reservoir. Finally, the thermodynamic characteristics of water temperature in Songtao Reservoir were analyzed. The findings of this study are expected to provide scientific guidelines for formulating ecological environmental protection measures according to local conditions.
2. Materials and Methods
2.1. Study Area and Temperature Monitoring
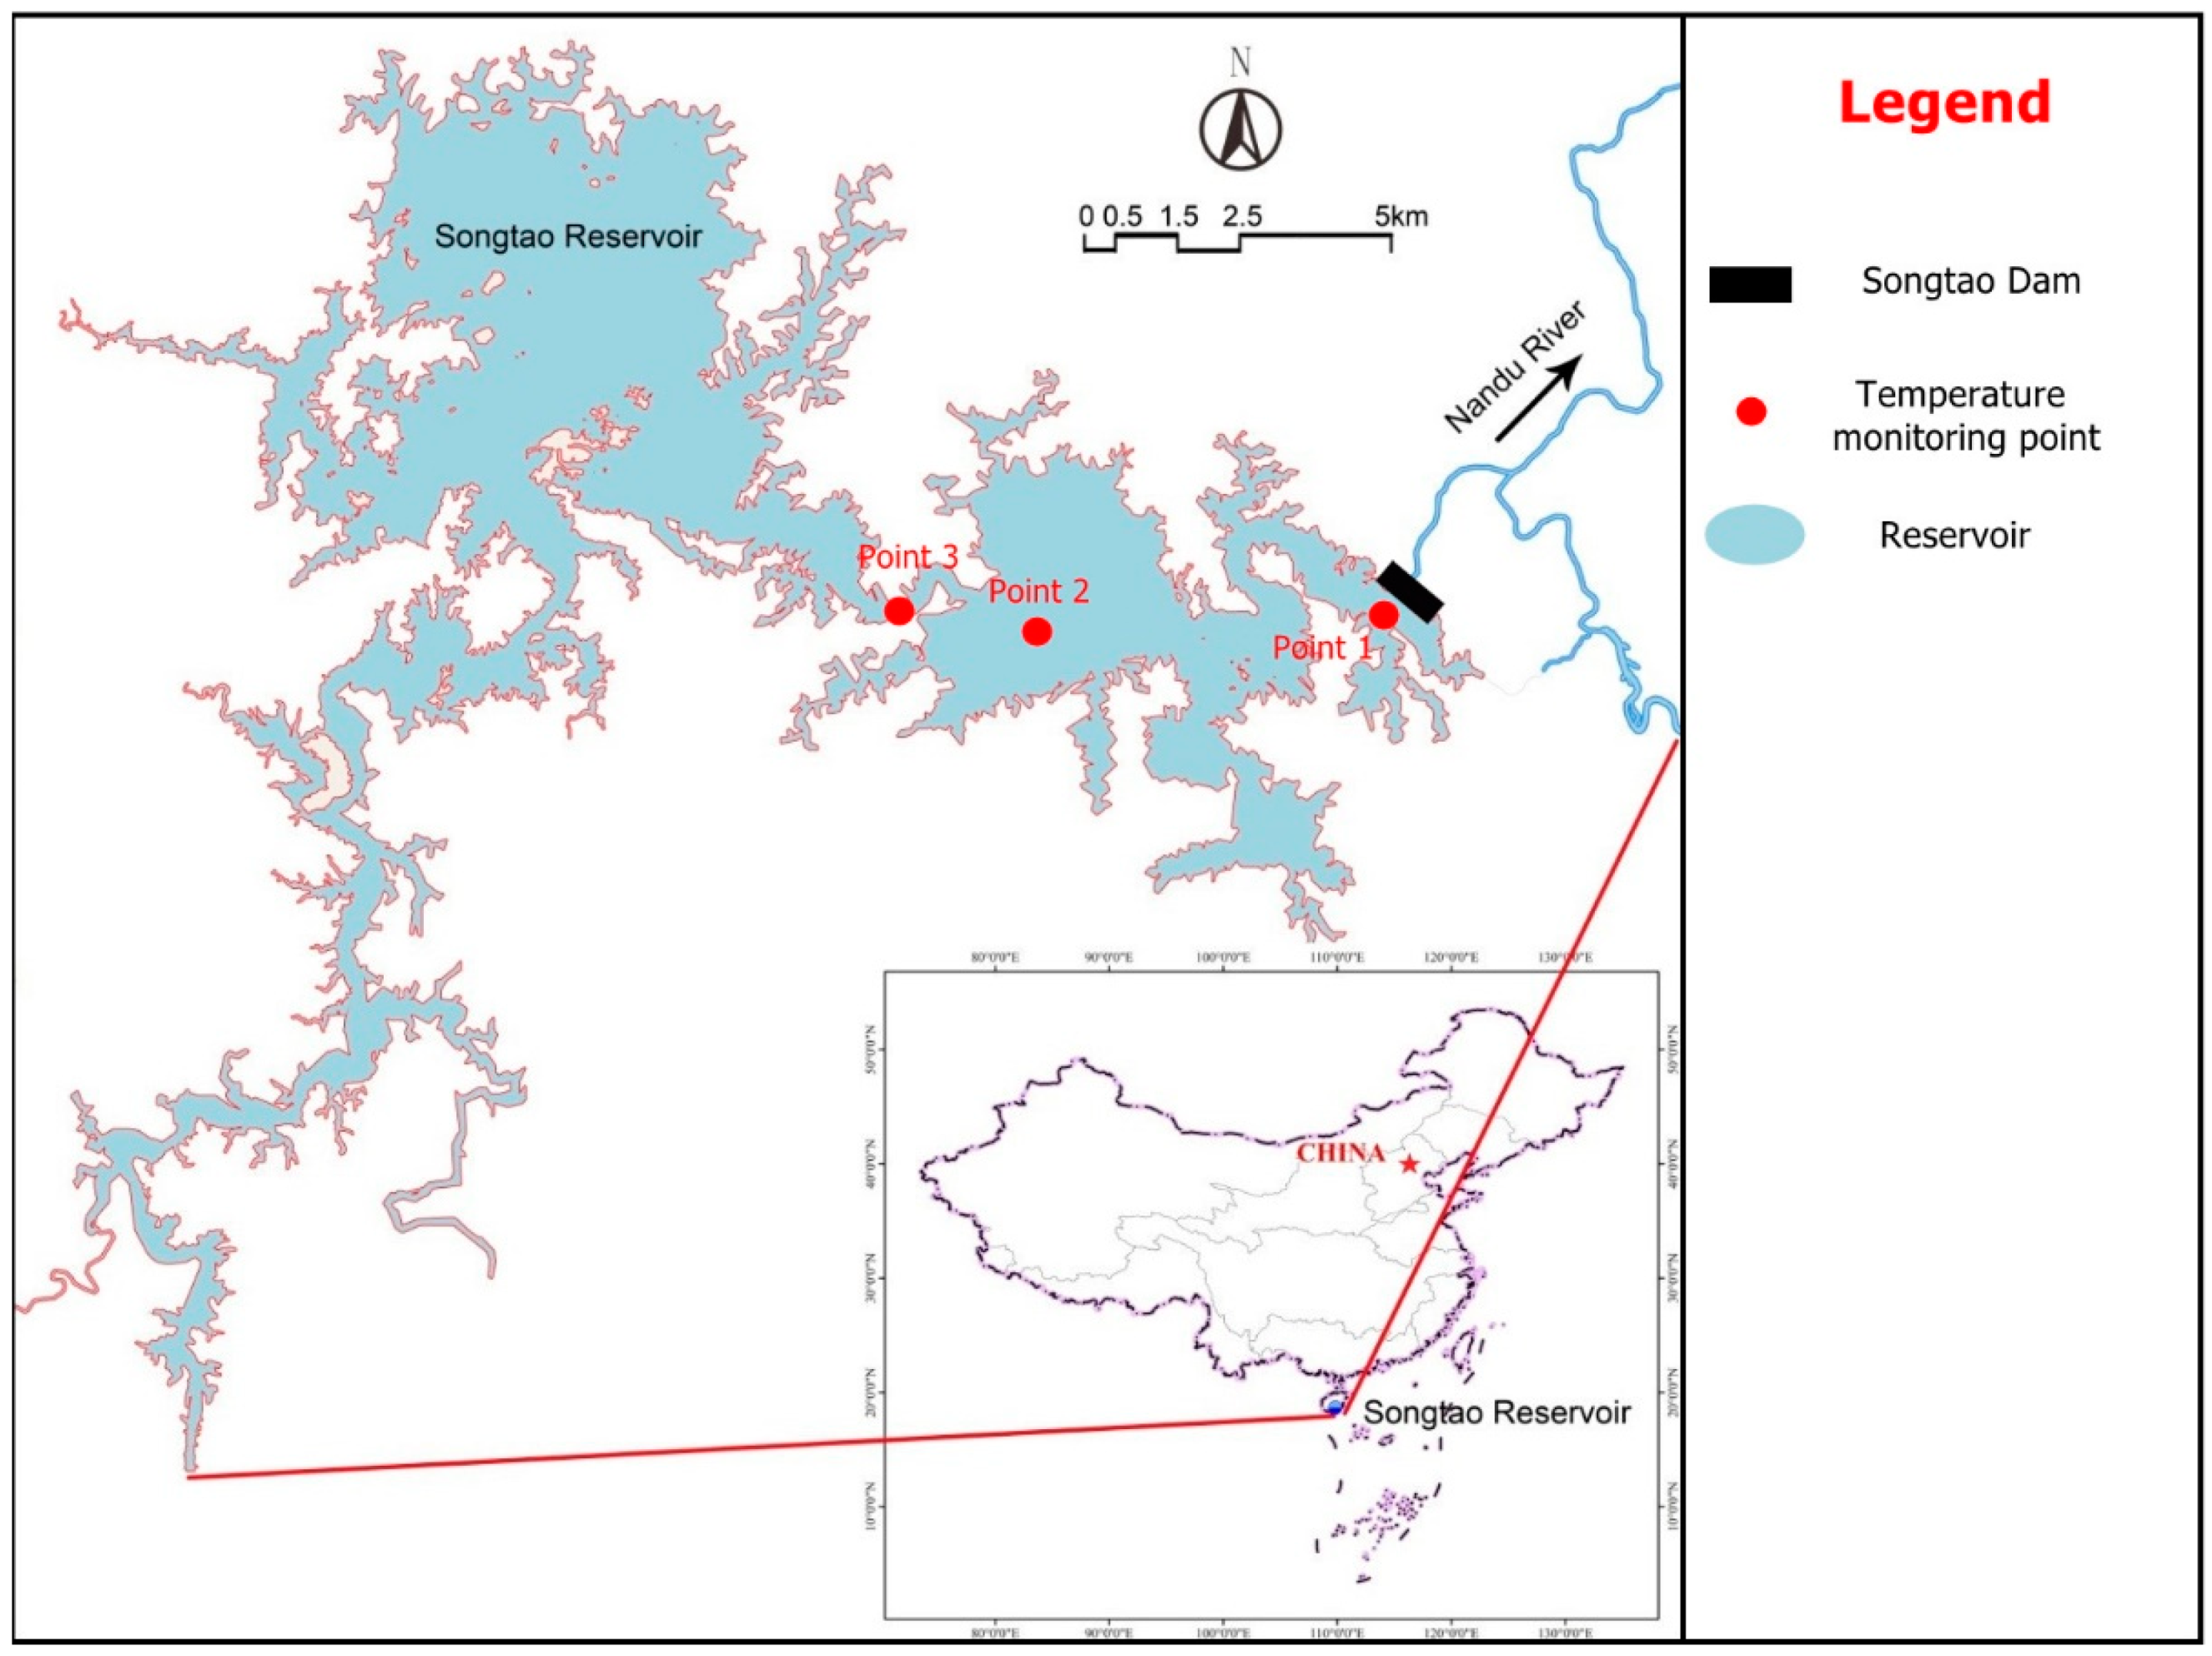
Songtao Reservoir, located in Danzhou City, Hainan Province, is the earliest large-scale water-control project developed in the Nandu River basin (Figure 1). The main use for this reservoir is irrigation needs. Moreover, the reservoir has comprehensive benefits such as power generation, flood control, and water supply. The reservoir was started in 1958 and was completed in 1968, and the entire reservoir was finished in 1970. Songtao Reservoir is in multi-year regulation mode, with a mean annual runoff of 1.622 × 10⁹ m3 and a total reservoir capacity of 3.345 × 10⁹ m3. Its normal water level is 190 m, the maximum dam height is 80.1 m, and the installed capacity is 44.85 MW. After Songtao Reservoir began to store water, a lake with a water surface area of approximately 144 km2 and a backwater length of approximately 51 km was formed in the upper reach of the Nandu River.
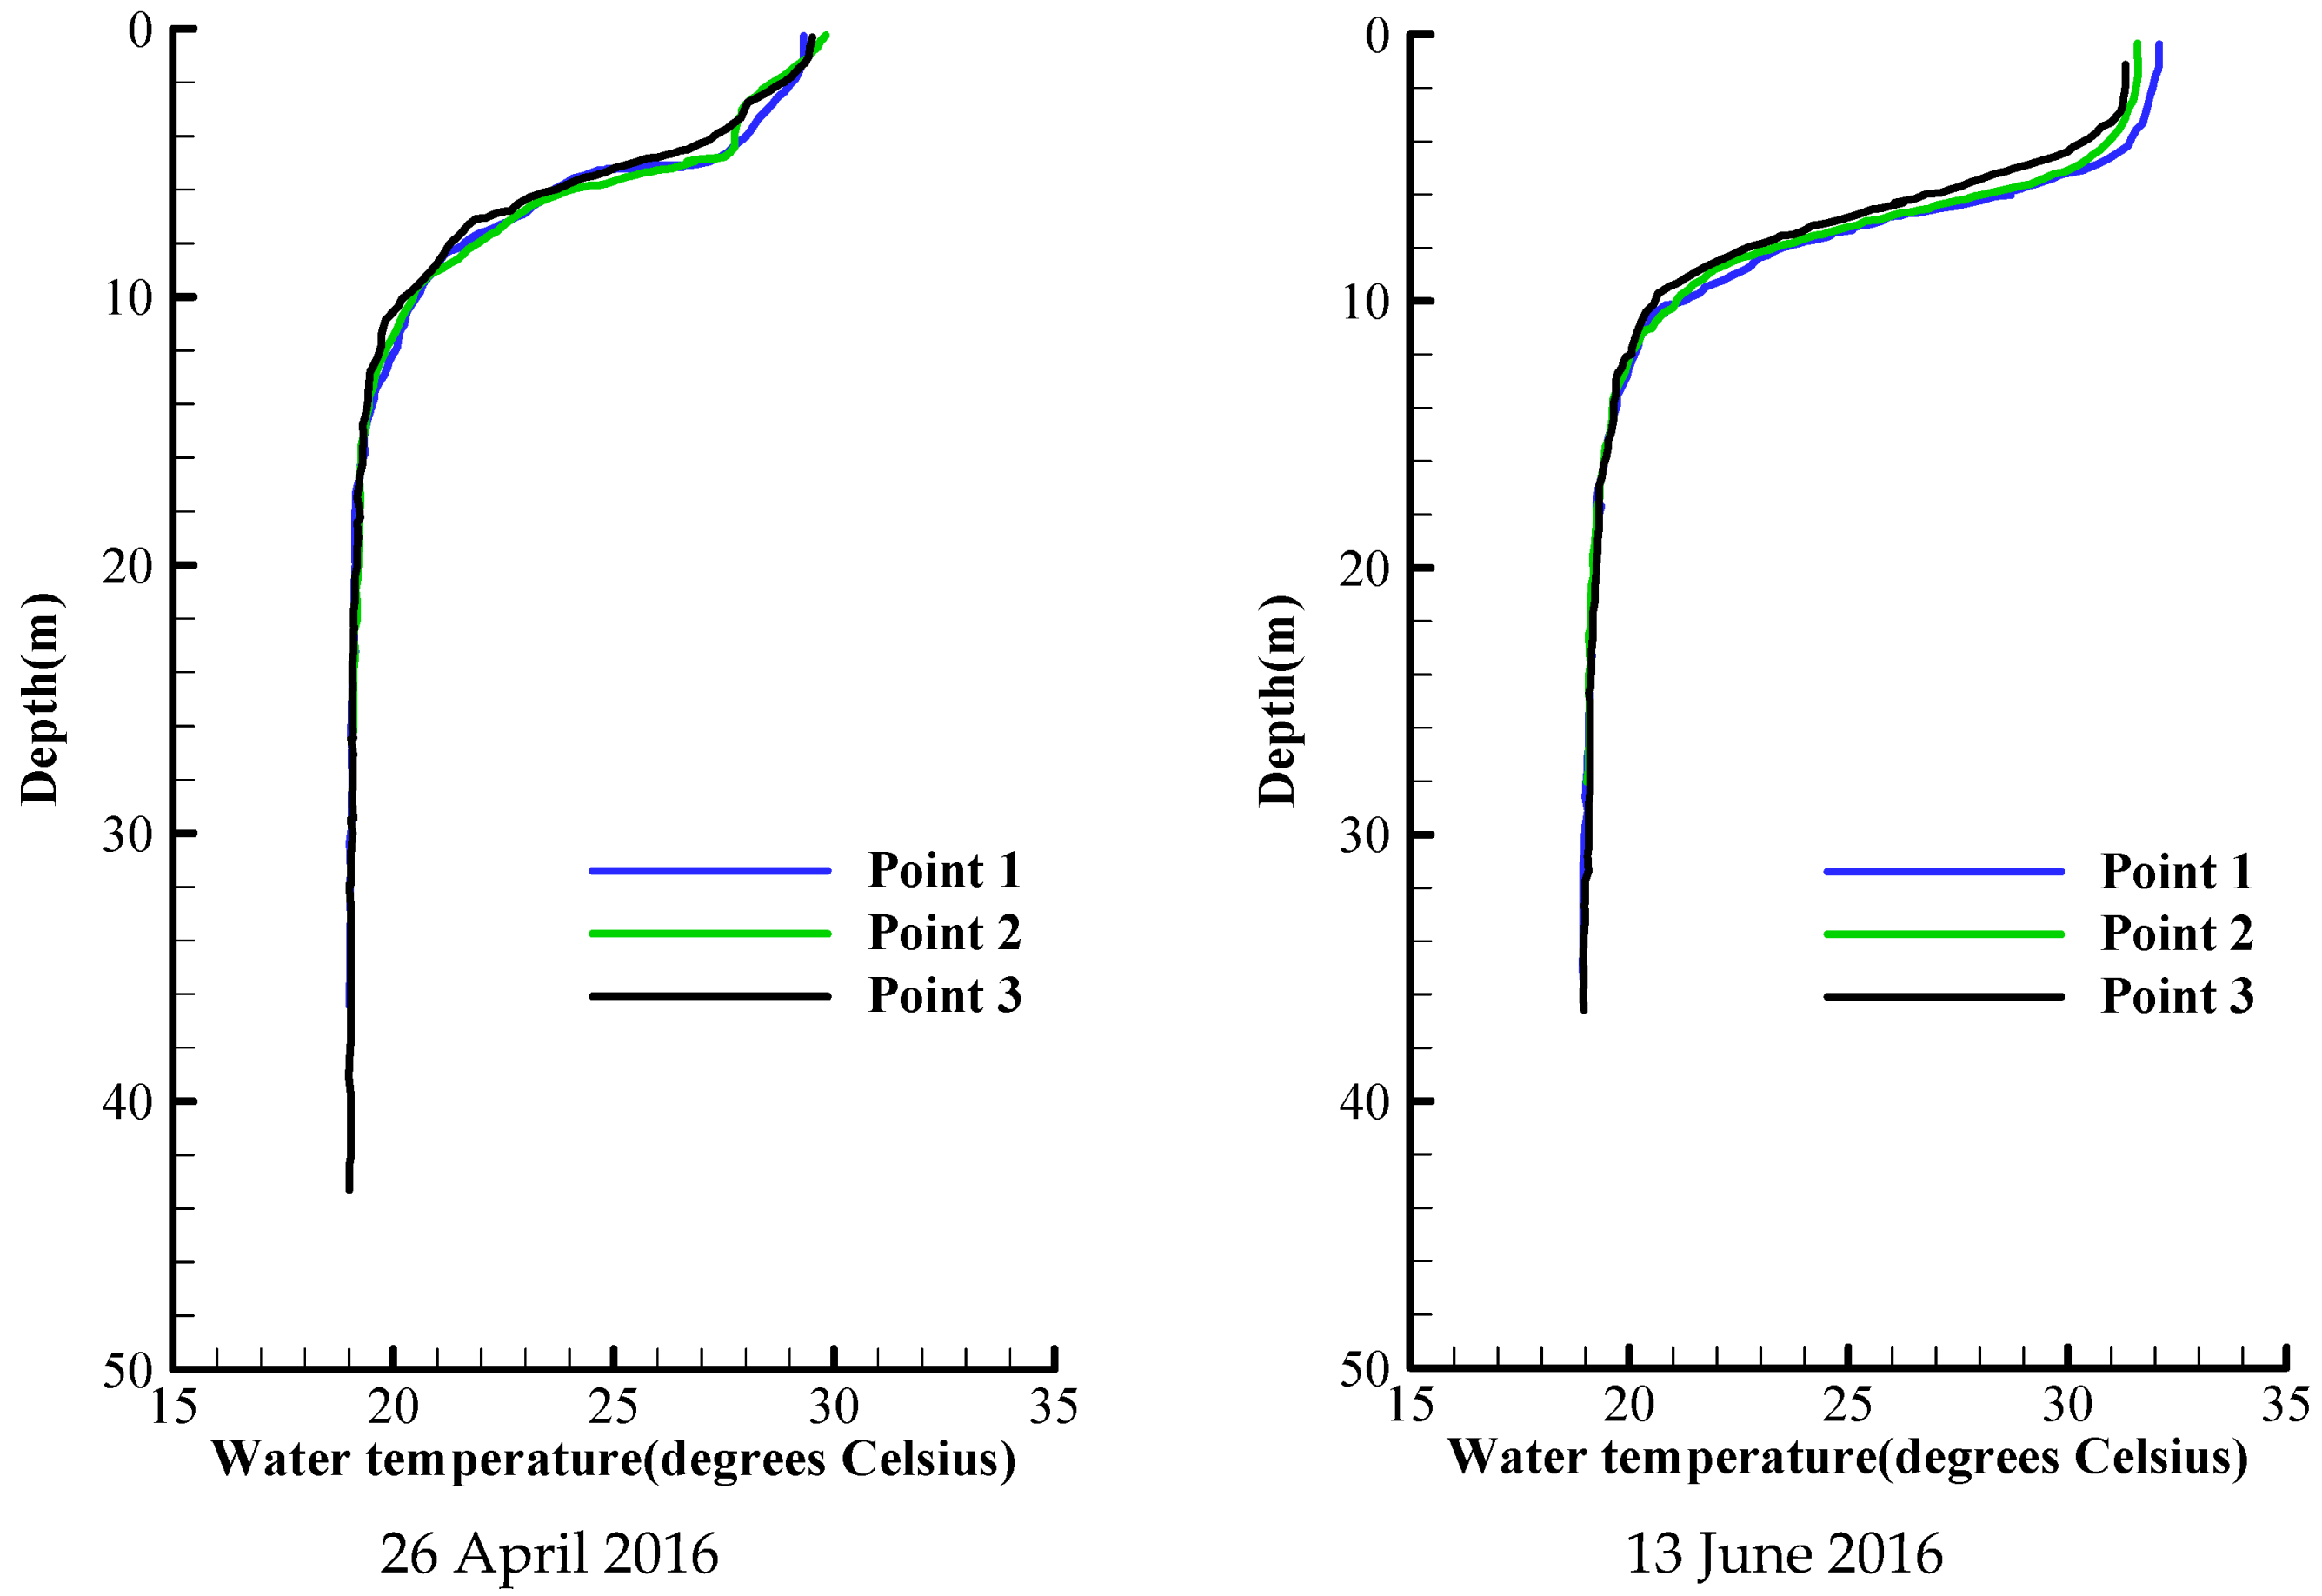
To conduct a scientific study on the vertical structure of water temperature in Songtao Reservoir, three vertical water temperature observation lines were set up in different regions of Songtao Reservoir on 26 April 2016 and 13 June 2016. The monitoring points are shown in Figure 1. Figure 2 demonstrates the measured vertical water temperature at the three observation lines. The measured data show that water temperature in Songtao Reservoir basically presented an isothermal distribution in the same horizontal plane, and water temperature stratification only appeared in the vertical direction.
2.2. Reservoir Water Temperature Model
2.2.1. Model Selection
Compared with physical models, numerical models are more convenient to rationally investigate the pattern of reservoir water temperature change. Reservoir water temperature models include vertical 1D, cross-sectional two-dimensional, and three-dimensional models. According to reservoir morphological characteristics, regulation mode, and hydrodynamic conditions, a suitable model with satisfactory accuracy and high calculation efficiency should be selected [27]. Given that Songtao Reservoir is a typical lake-like reservoir in a multi-year regulation mode with relatively slow water flow in the reservoir area, the vertical 1D models with good accuracy and high calculation efficiency are suitable for water temperature prediction in such reservoirs. As shown in Figure 2, the water temperature of Songtao Reservoir basically presents an isothermal distribution in the same horizontal plane, and water temperature stratification only appears in the vertical direction. Therefore, it is reasonable to use the vertical 1D models to simulate the vertical water temperature change in Songtao Reservoir.
The vertical 1D numerical models usually divide a reservoir into several horizontal thin layers along the vertical direction. These models assume that water temperature in each layer is evenly distributed, and the change of vertical water temperature structure is described by the transformation of the wind-mixing turbulent kinetic energy and water potential energy. The 1D models comprehensively consider the influence of reservoir inflow and outflow, wind mixing, and water surface heat exchange on reservoir water temperature stratification. The assumption of horizontal isothermal layers has been proved by many measured data. These models can produce good simulation results when model parameters are accurately calibrated. Typical vertical 1D water temperature models include the water resources engineering model (WRE) [28], the Massachusetts Institute of Technology model (MIT) [29], and the DYRESM model [30,31]. In this study, the DYRESM model was used to simulate water temperature in Songtao Reservoir.
2.2.2. Model Theory
DYRSEM is a 1D hydrodynamic model for lakes and reservoirs, which was developed by the Water Research Center of the University of Western Australia. Based on the assumption that vertical changes in water temperature and water quality are dominant, the DYRESM model can simulate vertical changes and structural characteristics of water temperature, salinity, and density in lakes and reservoirs [32]. The DYRESM model adopts the Lagrangian layered mode with variable layer thickness, which can adapt to the vertical structure of the lake. This is an advantage of this model in simulating the vertical changes of water temperature and water quality, and users may adjust the vertical layer number of lakes and reservoirs according to their own needs [33].
The DYRESM model mainly uses the laws of water balance and heat balance. The model assumes that lakes and river beds are adiabatic with no heat transfer to the water body. It mainly considers the heat transfer caused by vertical flow, heat exchange at water–air interface, molecular and turbulent diffusion, heat transfer caused by inflow and outflow, and solar radiation absorbed by water. The governing equations of the model are as follows (1):
where t denotes time, z is elevation, B is the average width of horizontal stratification layers, T is the temperature of horizontal stratification layers, A is the horizontal area at the elevation z, QV is the vertical convective flow through the upper boundary of horizontal stratification layers, ρ is the density of stratification layers, CP is the specific heat of water (4184 J/(kg·°C), Dm is the molecular diffusion coefficient, E is the vertical turbulent diffusion coefficient, ui is the inflow velocity, uo is the outflow velocity, Ti is the inflow water temperature, and φz is the solar radiation absorbed by water body. QV can be obtained by the mass balance of horizontal stratification as follows (2):
Water balance demonstrates the change of water level and storage capacity caused by the imbalance of inflow and outflow. In unit time, the change of water storage in a certain layer is inflow minus outflow, and the vertical convective flow is also considered. The water balance formula is as follows (3):
where N is the layer number, Qi,N is the inflow of the layer N, Qo,N is the outflow of the layer N, and Qv,N-1 is the vertical flow through the N and N-1 layers.
2.3. Modeling Scheme
2.3.1. Boundary Conditions
The model mainly requires inflow, outflow, inflow water temperature, and meteorological data as the boundary conditions. The simulation period was from 2 March 2016 to 1 March 2017. The inflow, outflow, and inflow water temperature of Songtao Reservoir were collected as the hydrological and water temperature boundary conditions for the model. The meteorological data included six input variables—short-wave radiation, long-wave radiation, air temperature, vapor pressure, wind speed, and precipitation. Long-wave radiation was calculated by cloud cover, and vapor pressure was estimated by relative humidity and air temperature. The meteorological data were downloaded from the National Meteorological Science Sharing Service Network of China (http://data.cma.cn, accessed on: 16 September 2019 to 30 November 2019). The model used daily intervals, and the input data were daily average or daily accumulated values. The meteorological data were obtained at the Danzhou meteorological station, which is nearest to the reservoir.
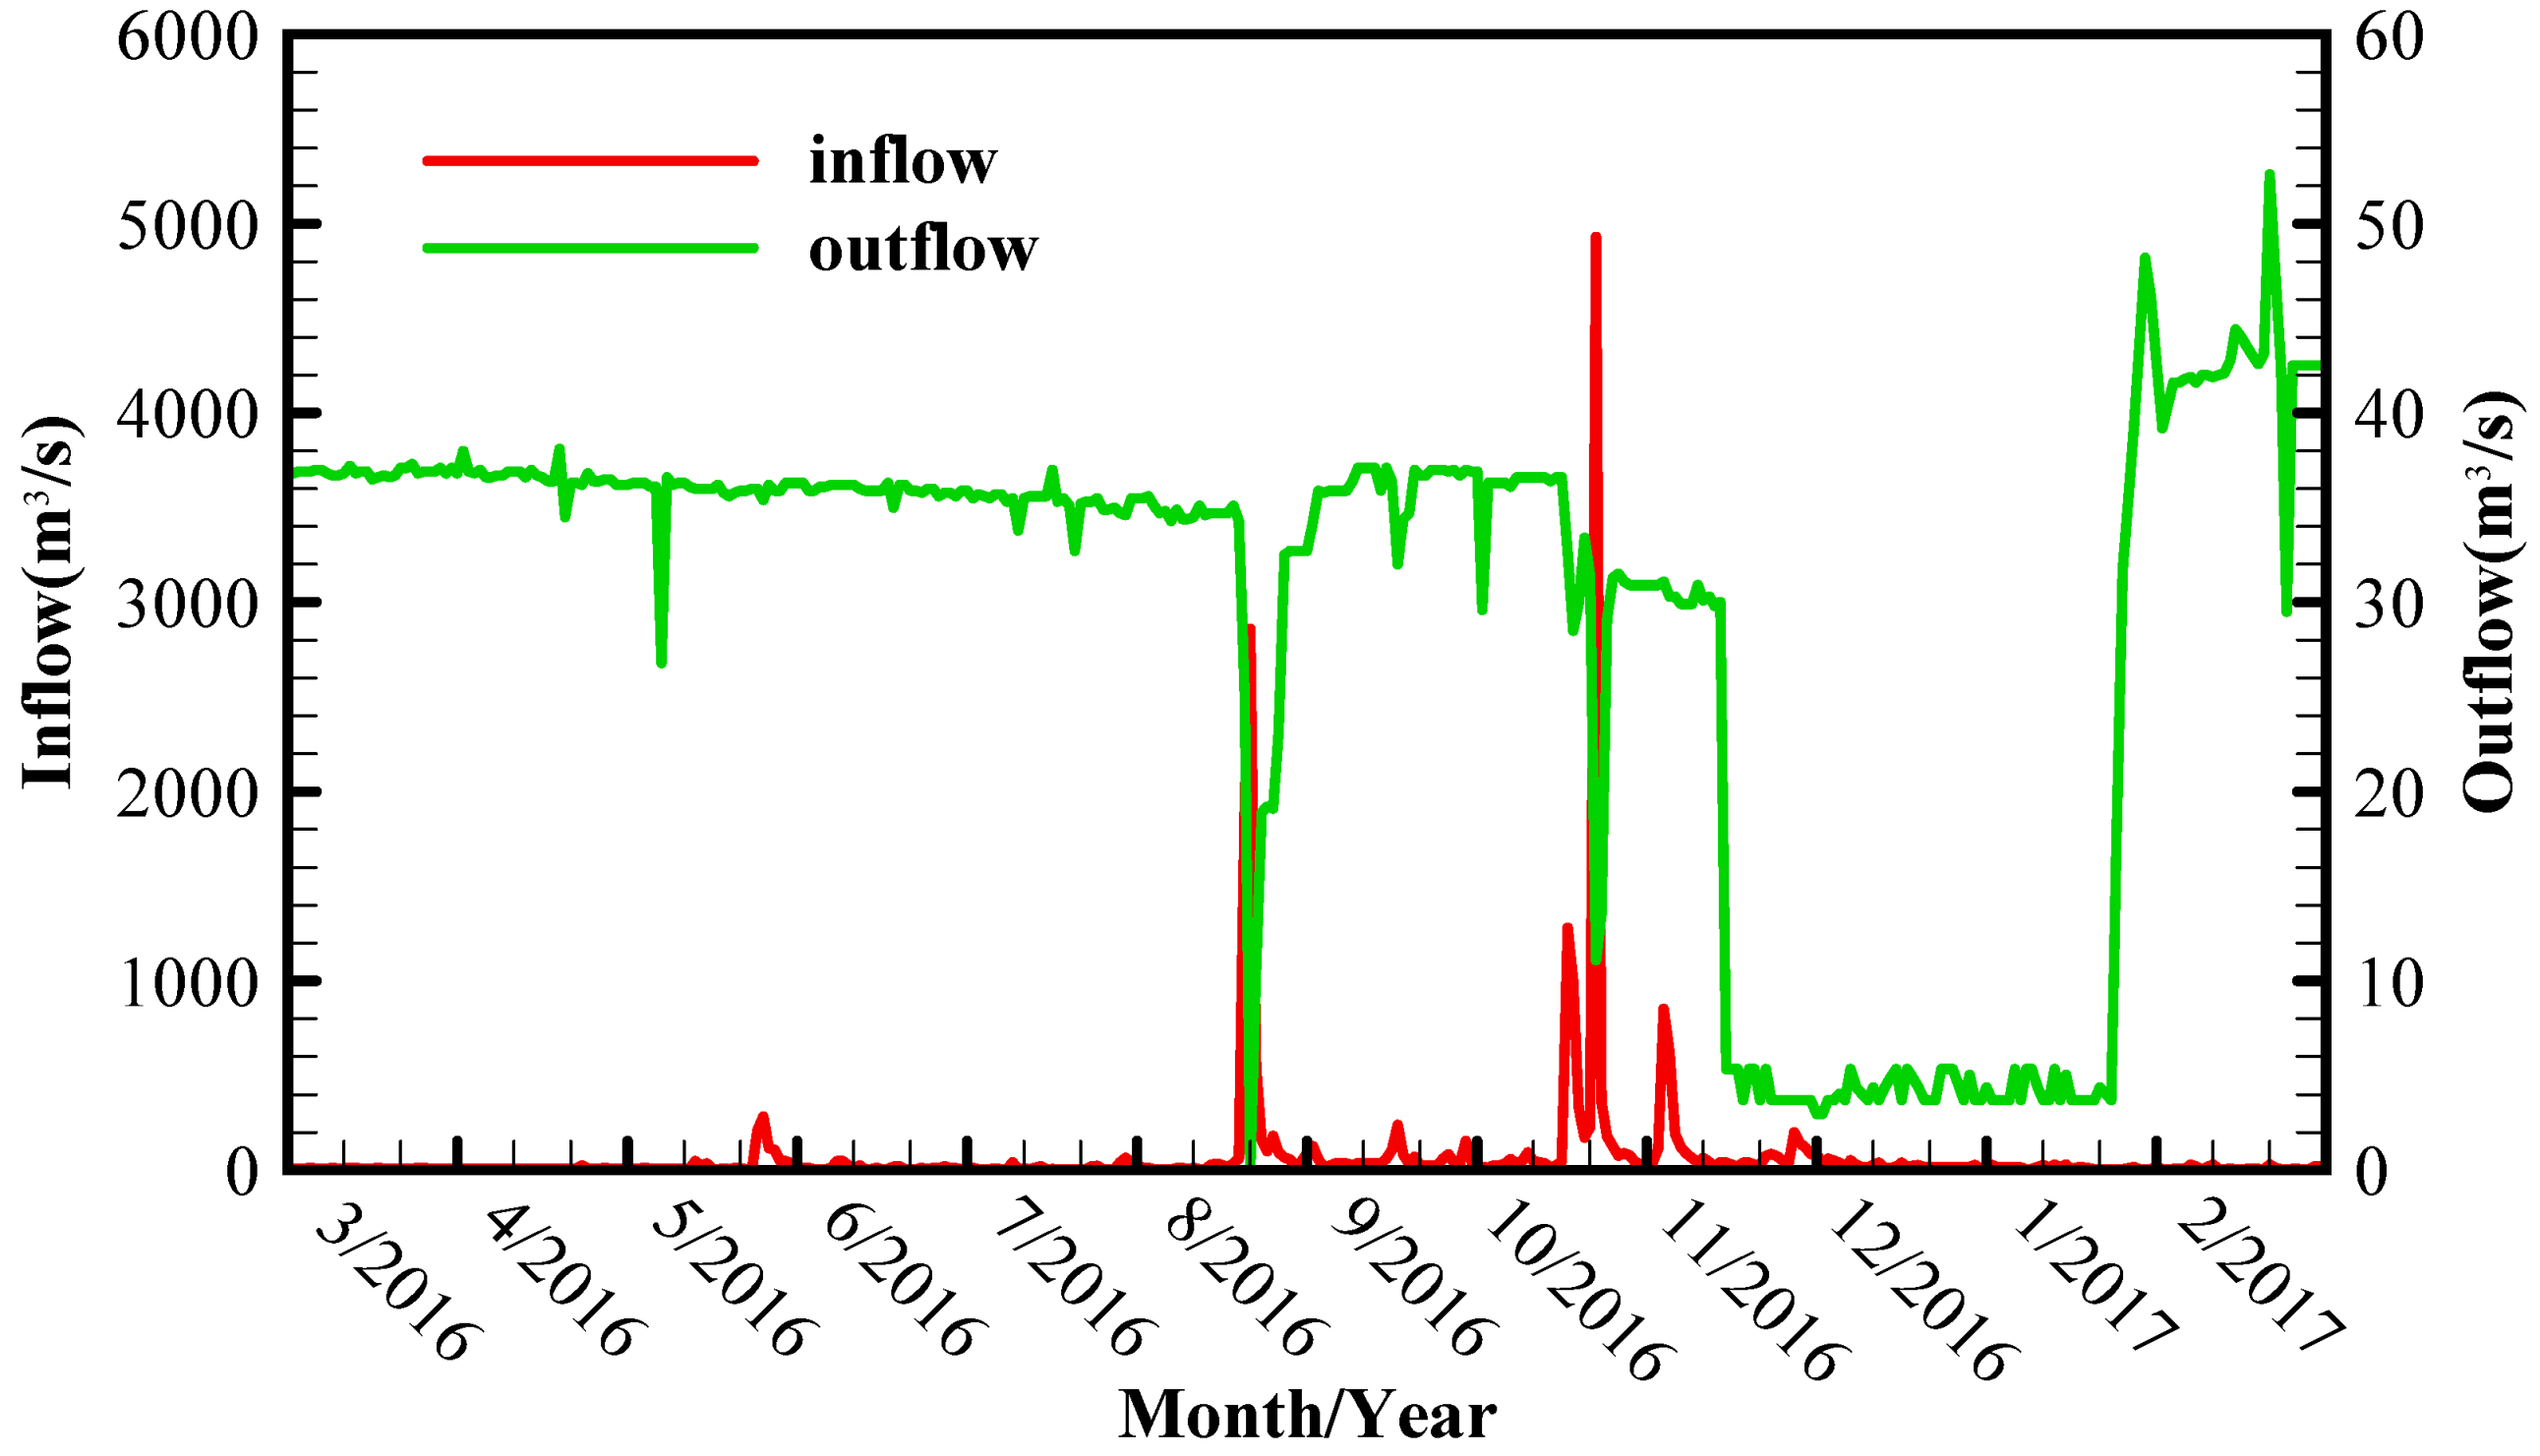
The measured inflow and outflow from 2 March 2016 to 1 March 2017 were selected as the boundary conditions of the model. As shown in Figure 3, on 17–19 August 2016 and 13–19 October 2016, inflow sharply increased. It was much larger than the annual average flow, and the maximum flow was 4930 m3/s on 18 October 2016. Under the regulation of Songtao Reservoir, the outflow process was relatively flat, and the maximum discharge was 52.6 m3/s on 14 February 2017.
2.3.2. Initial Conditions
In terms of initial profile data, a set of elevation–water temperature relationship arrays from reservoir bottom to water surface (initial water surface height) was needed. The measured water temperature in Songtao Reservoir on 2 March 2016 was used as the initial input condition. Figure 4 demonstrates the initial water temperature distribution. It shows that water temperature stratification appeared in Songtao Reservoir in early March. The thermocline was from the water surface to the water depth of 8.81 m, and the water temperature decline rate was 0.13 °C/m.
2.3.3. Model Parameters
The DYRESM model has many parameters, but most parameters are universal to a certain extent. A total of 15 model parameters require calibration. These parameters are aerodynamic transmission coefficients (CL, CS, and CM), average water surface albedo , extinction coefficient ηA, etc. Satisfactory simulation results can be obtained by using the default model parameters [24]. The model can provide accurate simulations of water temperature structure in medium and small reservoirs [34,35]. However, for the simulations in large reservoirs, parameters such as vertical mixing coefficient C, allowable maximum layer thickness, minimum layer thickness, and turbulence kinetic energy conversion efficiency require recalibration [36]. Given that the DYRESM model is less used to simulate water temperature in tropical zones, model parameters were calibrated using the measured water temperature data in Songtao Reservoir. Table 1 demonstrates the calibrated model parameter values.
2.4. Parameter Sensitivity Analysis
Extinction coefficient ηA, also called attenuation coefficient, refers to the attenuation degree of solar radiation entering the water body along its depth, and it was calculated by the Beer–Lambert formula. This coefficient directly affects the distribution of solar radiation along its depth, controls the on-way attenuation of heat after entering the water body, and further impacts the vertical structure of reservoir water temperature.
Vertical mixing coefficient C is a non-universal parameter, and it is a constant in the relational expression between effective vertical diffusion and lake index LN in the thermocline, which is expressed by (4):
where is the effective vertical diffusion coefficient, LN is the lake index [37,38], KM is the molecular thermal diffusion coefficient (1.4 × 10⁻⁷ m2/s), and C is the vertical mixing coefficient. Given LN, the value of vertical mixing coefficient C affects the effective vertical diffusion intensity of thermocline. For simulations in a different lake, the value of this coefficient is different. For example, the calibrated value for Kinneret Lake was 200 [37], those for Wanaka and Wakaitipu Lakes were 1500 [39], and the value for Geneva Lake was 700 [35]. In this study, many parameter values were selected for calibration, and the best calibrated vertical mixing coefficient for Songtao Reservoir was 50.
The model controls the vertical grid size by defining the maximum layer thickness Hmax and minimum layer thickness Hmin. In the simulation, if the grid size of a certain layer is lower than the defined minimum layer thickness, this layer is merged with the adjacent layer. On the contrary, if the grid size of a layer is larger than the maximum allowable layer thickness, this layer is divided into several layers with the same temperature, and the thickness of new layers should be within the allowable layer thickness. The maximum and minimum layer thickness follows the principle of Hmax > 2Hmin. Layer thickness is very important to the simulation of the thermocline. If layer thickness is too large, the simulated water temperature is vertically homogenized, and the inflection point of thermocline may not be accurately simulated. This further affects the vertical water temperature structure. However, if the layer thickness is defined to be too small, the model efficiency is affected.
3. Results
3.1. Model Verification
3.1.1. Water Level
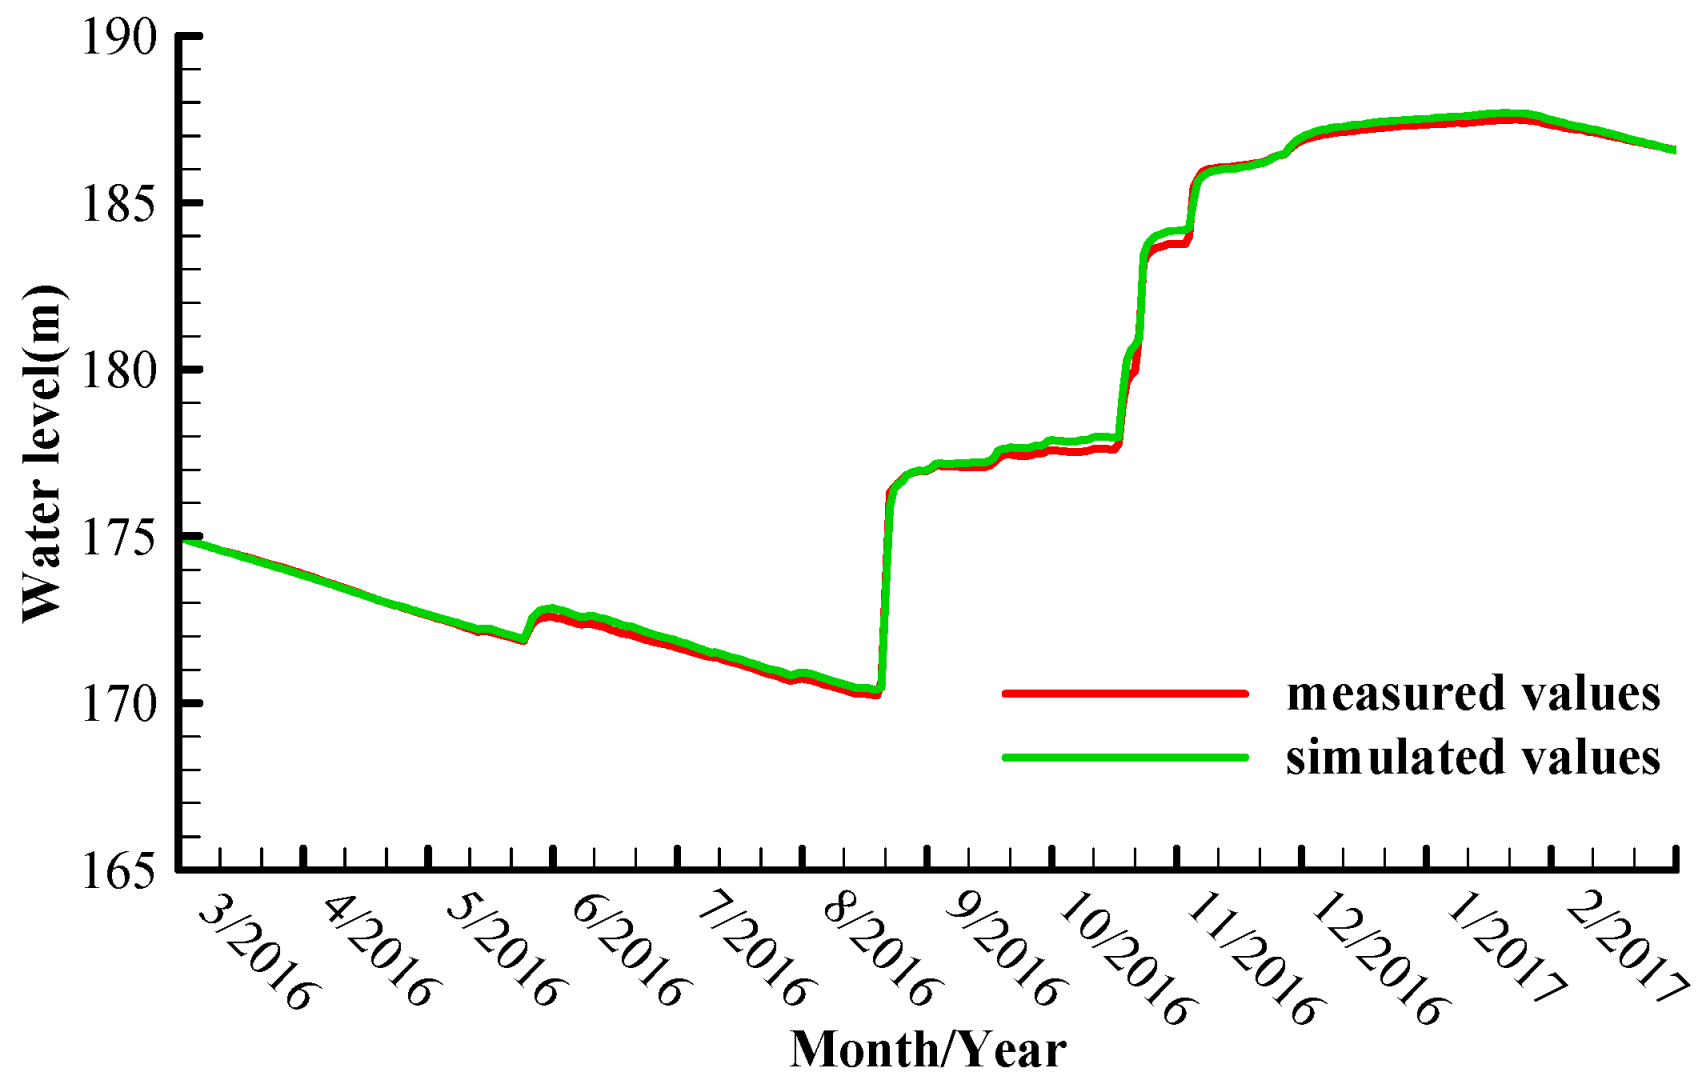
The observed reservoir inflow and outflow from 2 March 2016 to 1 March 2017 were used as the hydrological boundaries (Figure 3). Figure 5 demonstrates the measured and simulated water levels in the simulation period. The figure shows that the simulated water level process agreed with the observations quite well, with a root mean square error of 0.18 m. Water level verification shows that under the measured inflow and outflow conditions, the simulated reservoir operation, and the regulation process were in line with the actual situation, and the inflow water volume was balanced with the outflow. Therefore, the model can accurately simulate the water quantity and water level processes in Songtao Reservoir.
3.1.2. Water Temperature
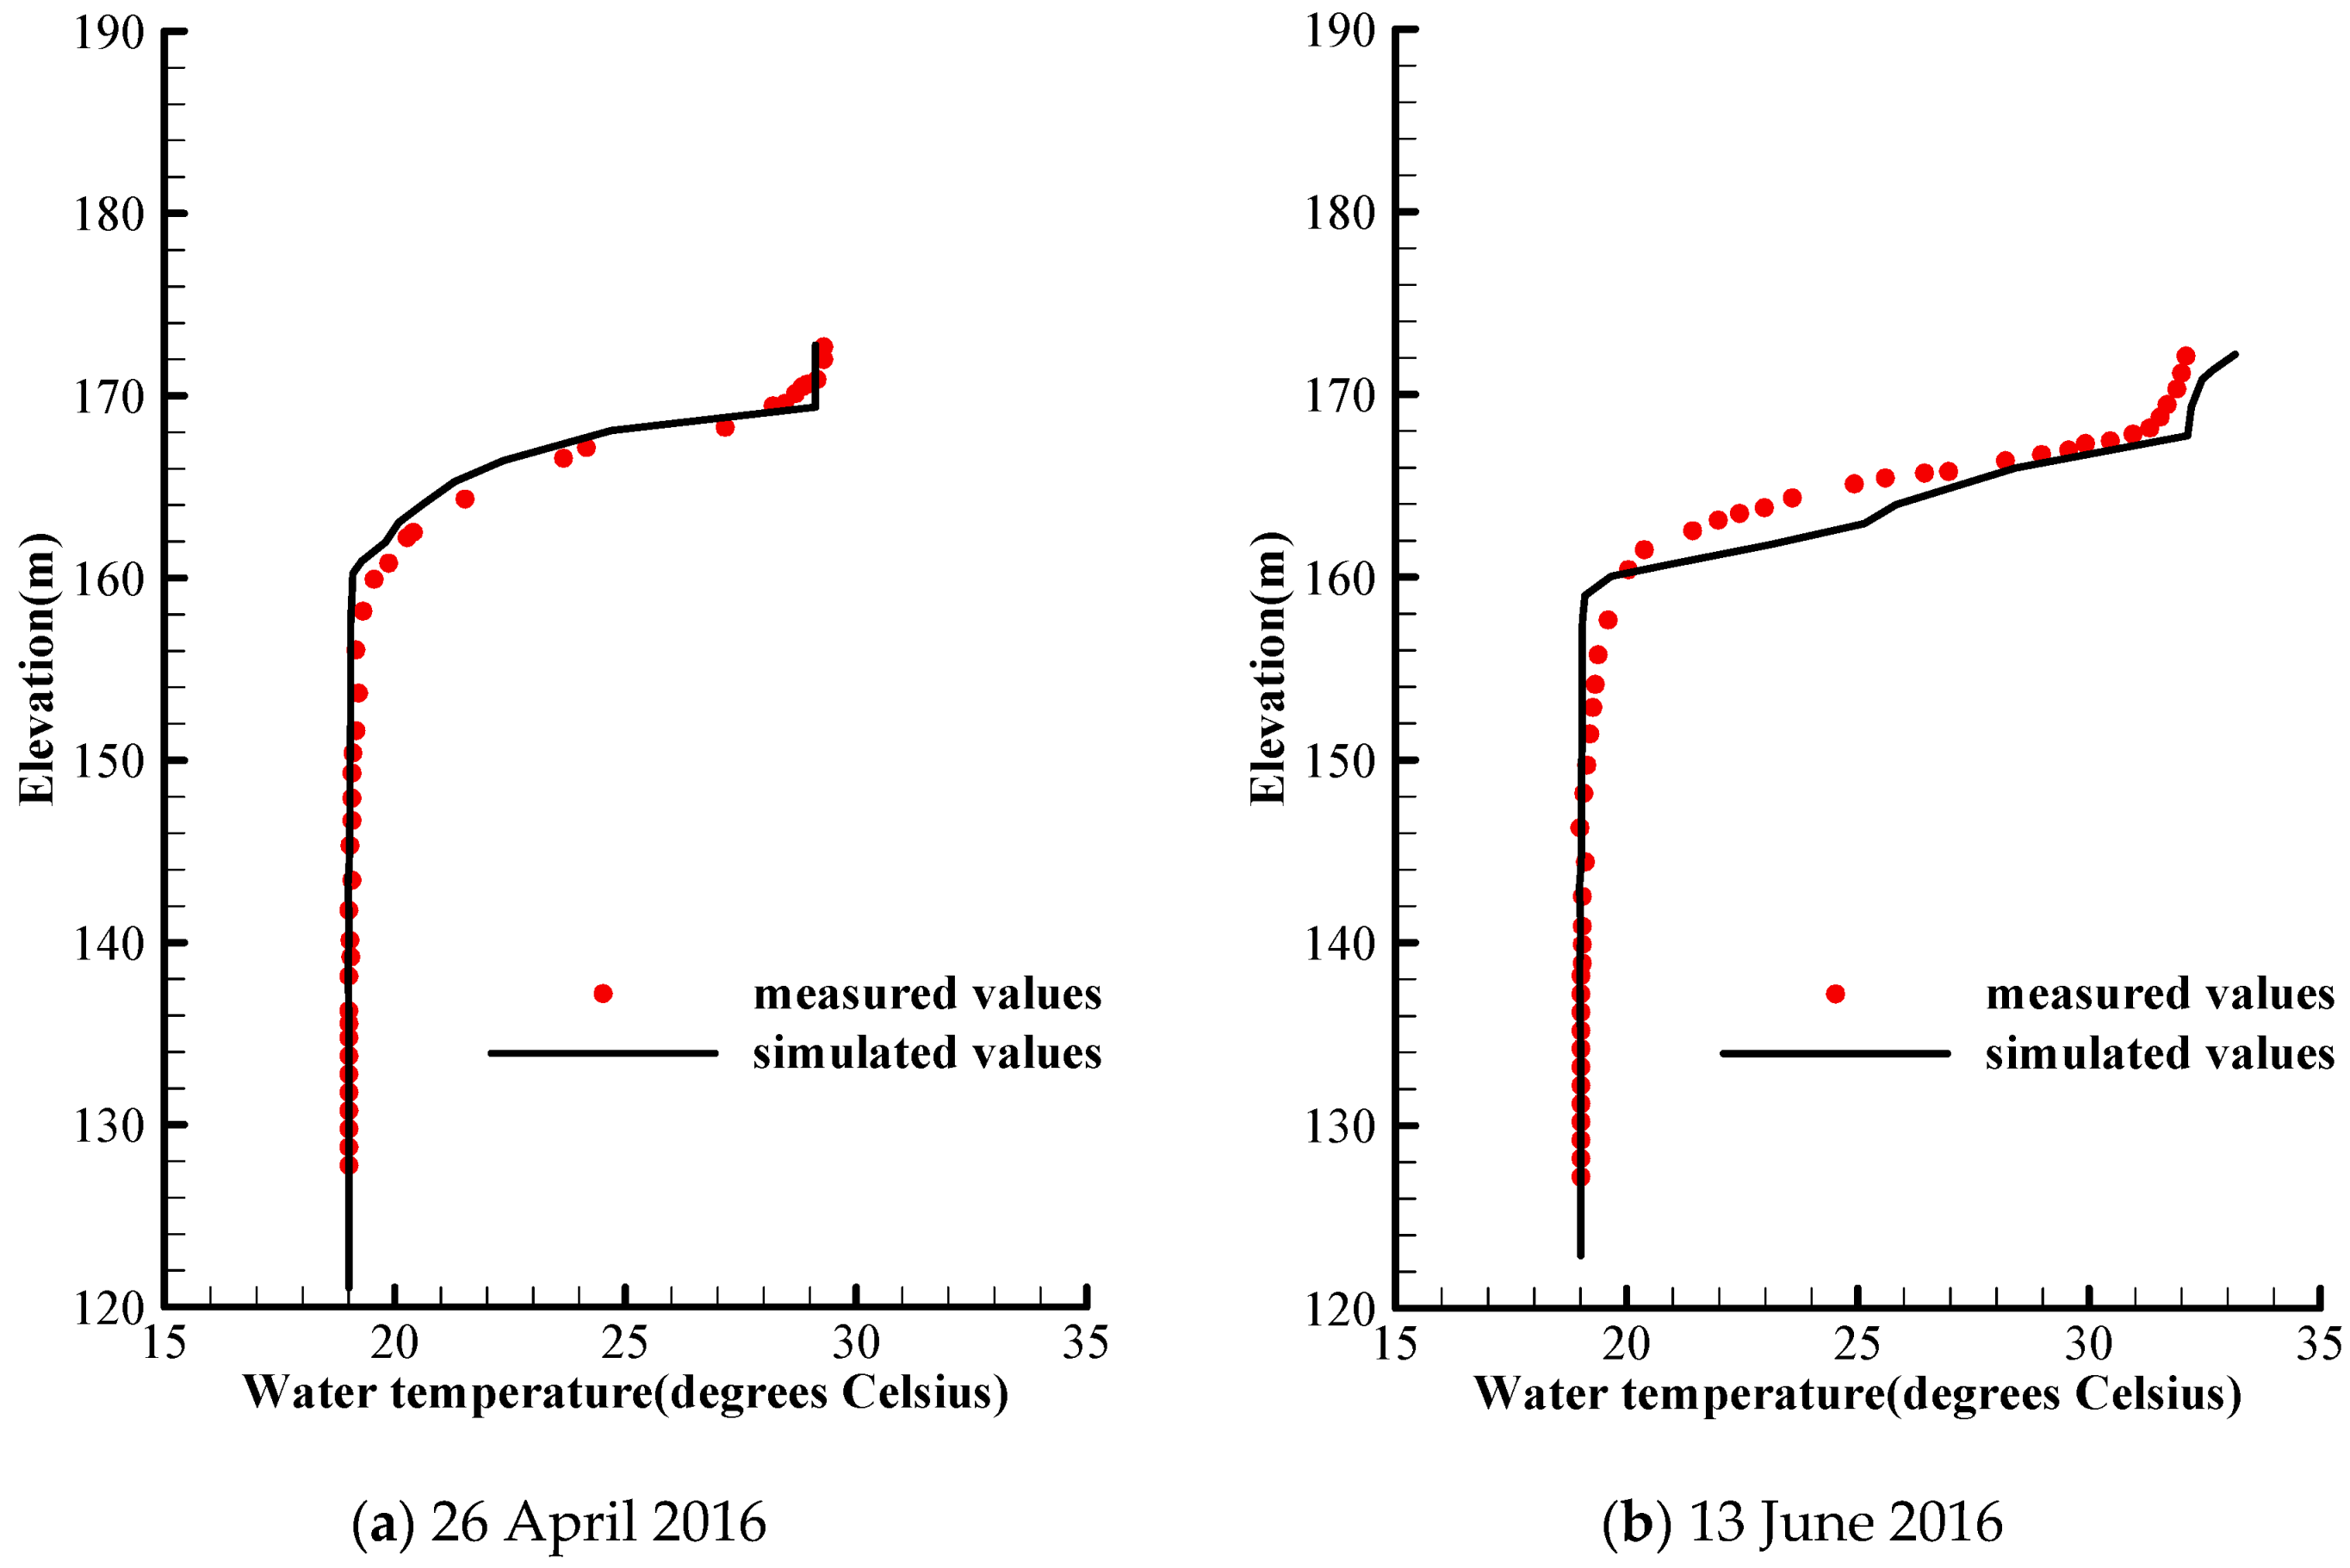
The observed water temperature data in Songtao Reservoir on 26 April 2016 and 13 June 2016 were used to verify the simulated water temperature. Figure 6 compared the simulated vertical water temperature structure with the observations. It shows that the model simulated the vertical water temperature stratification characteristics in Songtao Reservoir quite well and had a good fit to the observed water temperature structure.
To analyze the accuracy of the simulated water temperature further, the thickness and water temperature of surface temperature layer, thermocline depth, the temperature gradient of the thermocline, and water temperature of hypolimnion were selected as the characteristic values of vertical water temperature distribution, and the simulated values were compared with the observations. As shown in Table 2, the overall error was low for all the five vertical water temperature distribution characteristic values, and the calibrated vertical 1D numerical model had a satisfactory performance on water temperature simulations in Songtao Reservoir. The simulated surface layer, thermocline, and hypolimnion were basically consistent with the measured values, and the model could reveal the characteristics and trend of water temperature distribution in Songtao Reservoir.
3.2. Vertical Water Temperature Structure
Figure 7 shows the vertical water temperature distribution and its inter-annual variation process in Songtao Reservoir. The simulated water temperature on the 15th day of each month during the simulation period of 2 March 2016–1 March 2017 was used for analysis. This figure indicated that water temperature in Songtao Reservoir has a distinct vertical stratification structure. Surface water temperature largely varied on the inter-annual scale, ranging from 19.4 °C to 33.8 °C, with a range of variation of 14.4 °C. The lowest surface water temperature appeared in February, and the highest surface water temperature was found in June. Hypolimnion was located in the regions with the elevation below 150 m, where the water temperature was stable throughout the year, basically maintained at 19 °C.
According to Figure 7, the vertical temperature difference and temperature gradient of each month were analyzed. Large vertical temperature differences mainly occurred in June and July, with the vertical temperature difference of 14.8 °C and 14.3 °C, respectively, and the temperature gradient in both months was 0.27 °C/m. As shown in Figure 7, vertical water temperature stratification was most obvious in June and July. In January and February, the vertical temperature difference was low, with a vertical temperature difference of 1.0 °C and 0.4 °C, respectively, and the temperature gradient was 0.01 °C/m. This indicates that vertical water temperature stratification was the weakest in January and February, basically in a mixed structure.
3.3. Parameter Sensitivity Analysis
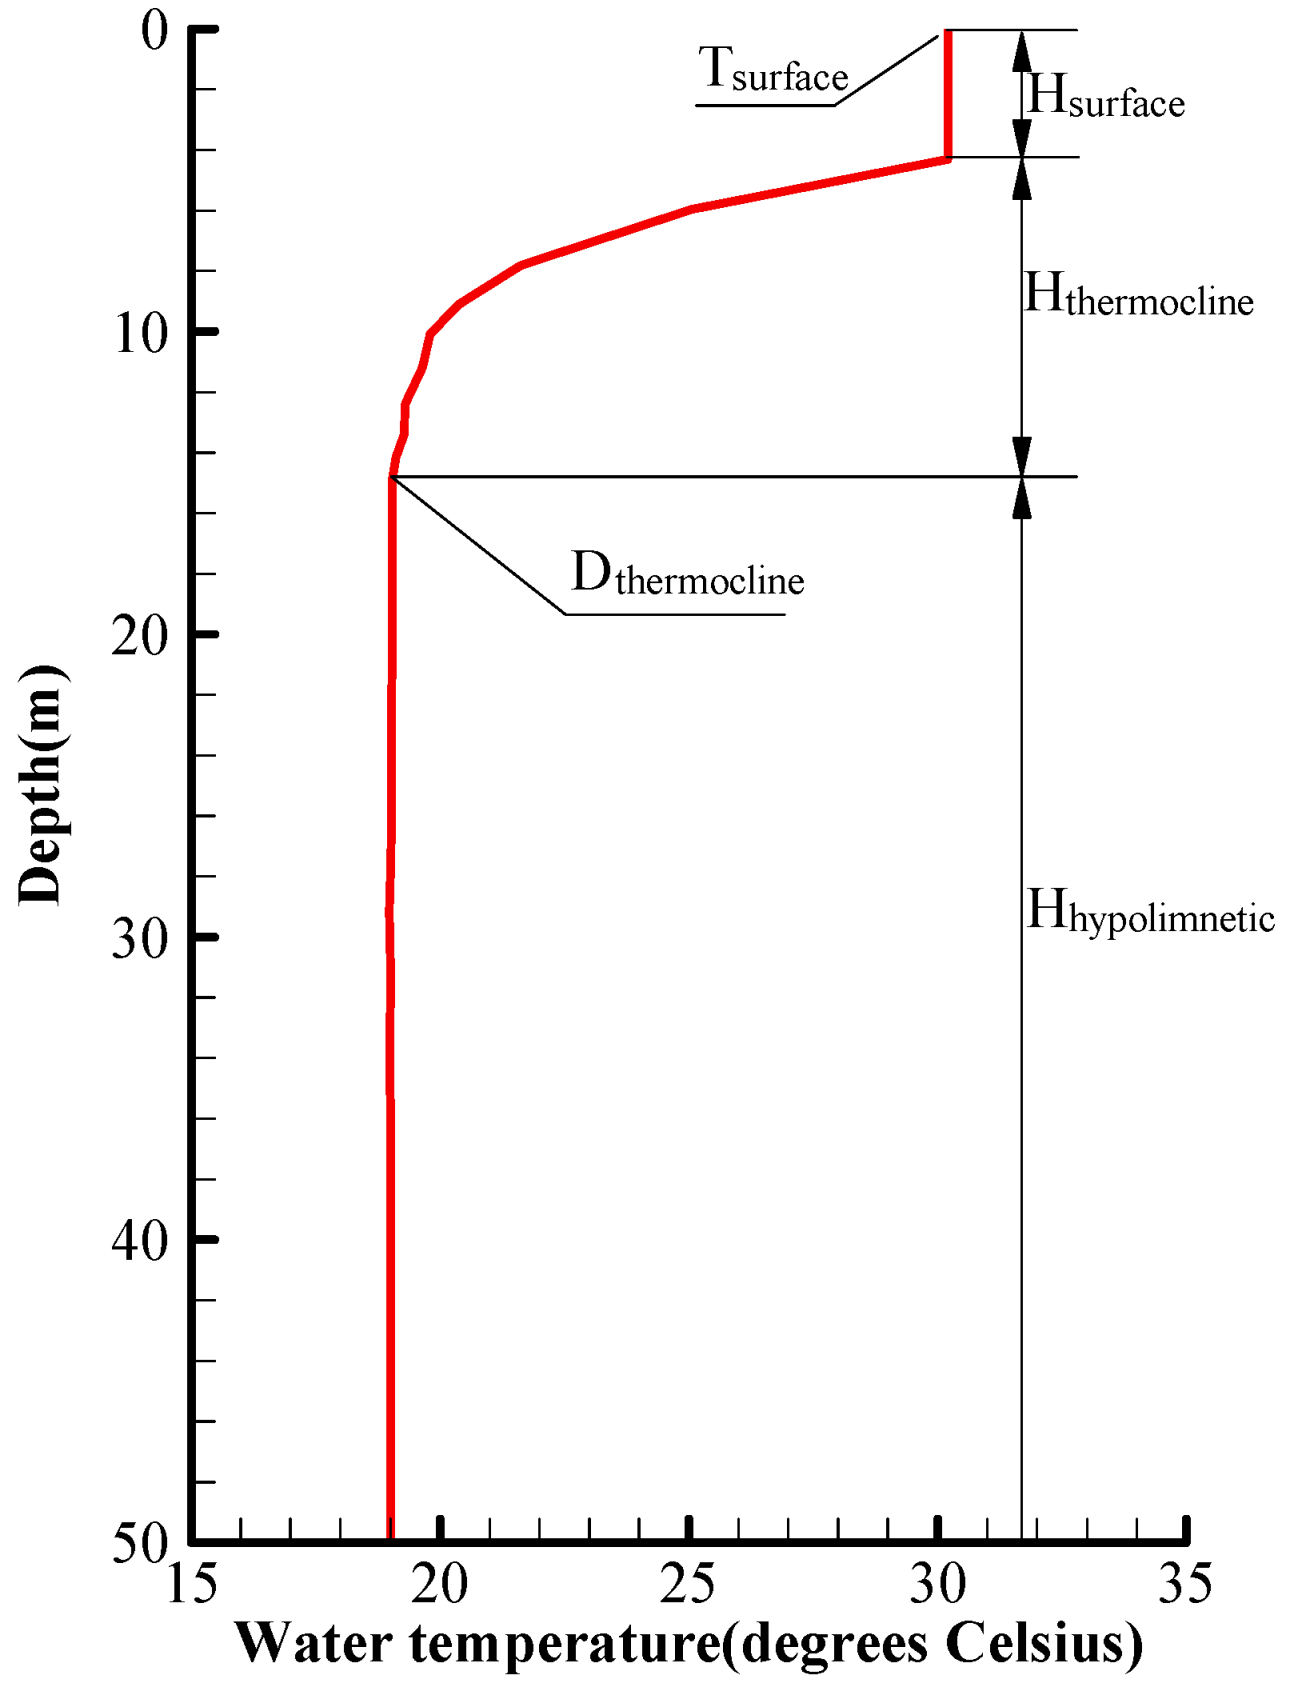
Totally, 15 model parameters were calibrated. During model parameter calibration, it was found that the water temperature structure in Songtao Reservoir was sensitive to extinction coefficient, vertical mixing coefficient, and maximum layer thickness. In all 15 modes, this study mainly focused on analyzing the sensitivity of these three parameters to water temperature structure. Five characteristic values reflecting water temperature structure change were selected. They are surface water temperature Tsurface, the thickness of surface water temperature hybrid layer Hsurface, depth of thermocline inflection point Dthermocline, thermocline thickness Hthermocline, and hypolimnion thickness Hhypolimnetic. Figure 8 shows the positions of characteristic values.
3.3.1. Extinction Coefficient
The extinction coefficient ηA was defined as 0.2, 0.4, 0.9, and 2.0. The simulation results using these parameter values were compared with that under the baseline operating condition (ηA = 0.7). Figure 9 demonstrates the simulated water temperature using different extinction coefficient values.
Figure 9 indicates that the greater the extinction coefficient, the higher the surface water temperature, and the smaller the thickness of surface water temperature hybrid layer. When the extinction coefficient was defined as 2, the surface water temperature was the highest (33.7 °C), and it was 1.3 °C higher than that in the baseline operating condition (ηA = 0.7). In this situation, almost no water temperature hybrid layer appeared on the surface. In the case of the extinction coefficient of 0.2, the reservoir’s surface water temperature was the lowest (32.0 °C), and it was 0.4 °C lower than that in the baseline operating condition. The thickness of the surface water temperature hybrid layer was the largest (13.1 m). The inflection point of thermocline was the deepest (28.7m), and it was 14.0 m lower than that in the baseline operating condition. Under other working conditions, excluding ηA = 0.2, the position of the thermocline inflection point remained almost unchanged with a slightly different thickness of the thermocline layer, and the hypolimnion thickness was basically the same.
According to the analysis results, the extinction coefficient mainly affects surface water temperature, and it also has certain impacts on the position of the thermocline. However, it does not basically change the water temperature of the hypolimnion. When the extinction coefficient is large, more heat is absorbed by the upper water body with higher surface water temperature. Meanwhile, heat is rapidly attenuated with depth, leading to a thinner surface water temperature hybrid layer, and hence the rise of the thermocline. However, when the extinction coefficient is very small (e.g., 0.2), more heat is transferred to the lower water body, and the position of hypolimnion descends with the decreased layer thickness. This conclusion is basically consistent with the finding of Gal et al. [20], who investigate the water temperature structure in Kinneret Lake.
3.3.2. Vertical Mixing Coefficient
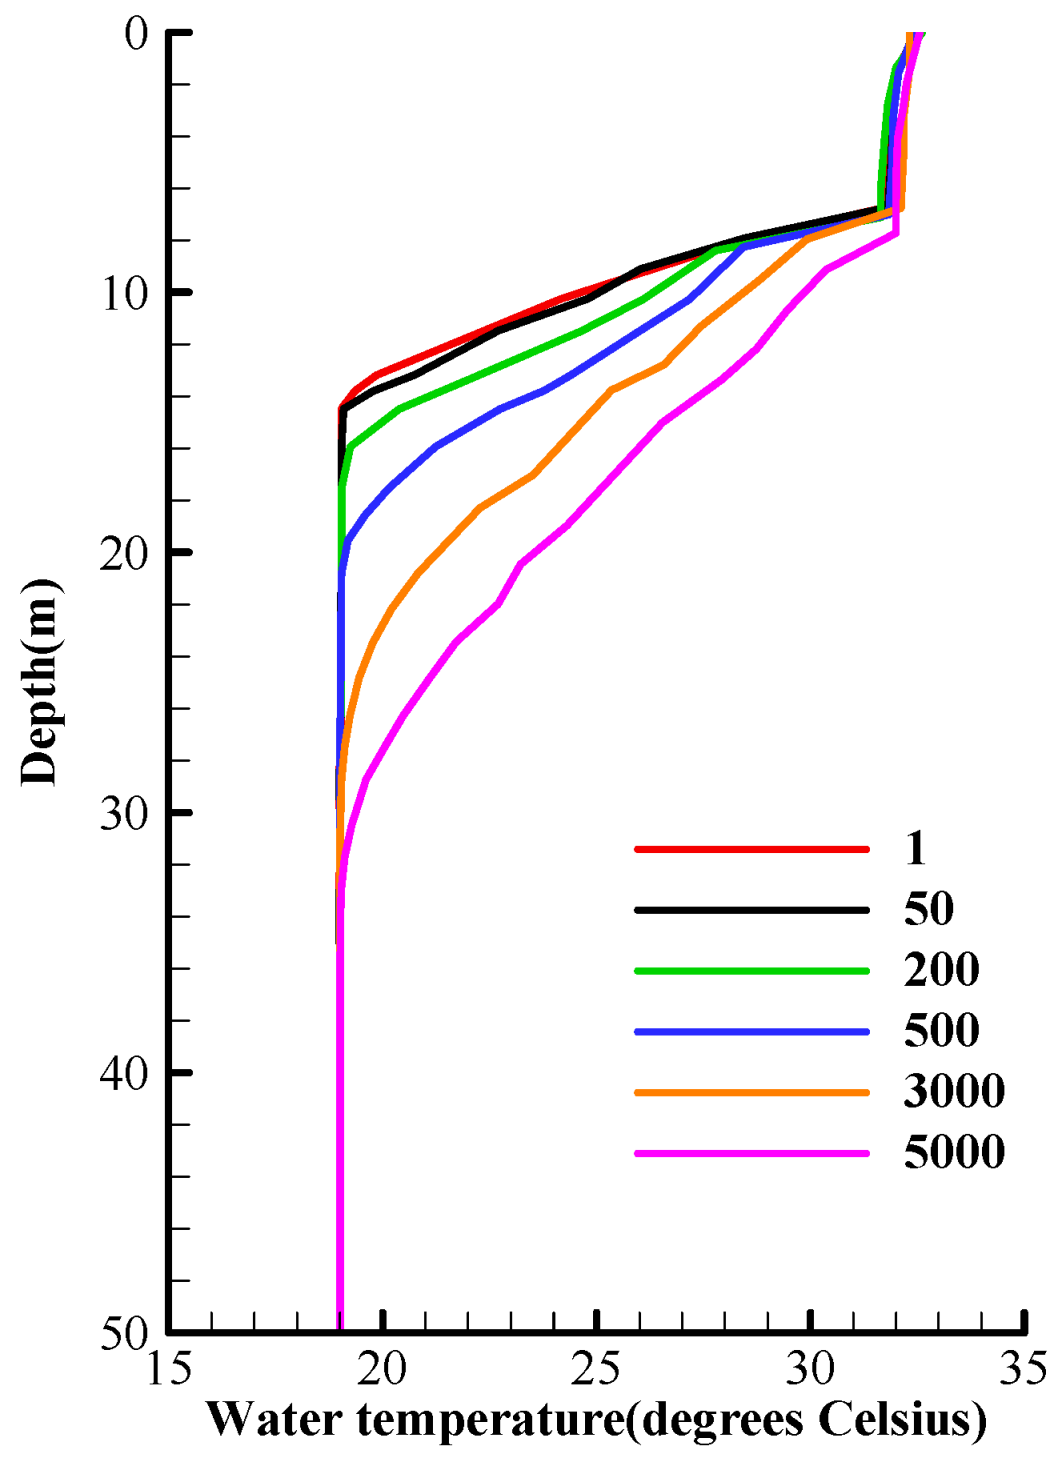
Different vertical mixing coefficient values (1, 200, 500, 3000, and 5000) were selected and compared with the simulation results in the baseline operating condition (C = 50).
Figure 10 show that the vertical mixing coefficient C had no obvious influence on surface water temperature and the thickness of the surface water temperature hybrid layer. However, it significantly affects the inflection point position and thickness of the thermocline. With the increase of vertical mixing coefficient C, the inflection points of thermocline descended with a range of 0.0–18.3m, and the thickness of thermocline increased with a range of 0.0–17.3m. When the vertical mixing coefficient was defined as 5000, the depth of inflection point (32.8 m) and thickness of thermocline (25.1 m) were the largest, and they were, respectively, 18.3 m and 17.3 m higher than those in the baseline operating condition.
This analysis shows that the vertical mixing coefficient has no obvious impact on surface water temperature, and it mainly affects the structure of the thermocline. A larger vertical mixing coefficient leads to a stronger effective vertical mixing in the thermocline, deeper inflection points of the thermocline, and a thicker thermocline. Meanwhile, the temperature gradient of the thermocline decreases correspondingly, and the slope of the temperature curve vertically decreases. This coefficient is inversely proportional to the thickness of hypolimnion. The thickness of hypolimnion tends to decrease with the increase of this parameter.
3.3.3. Maximum Allowable Layer Thickness
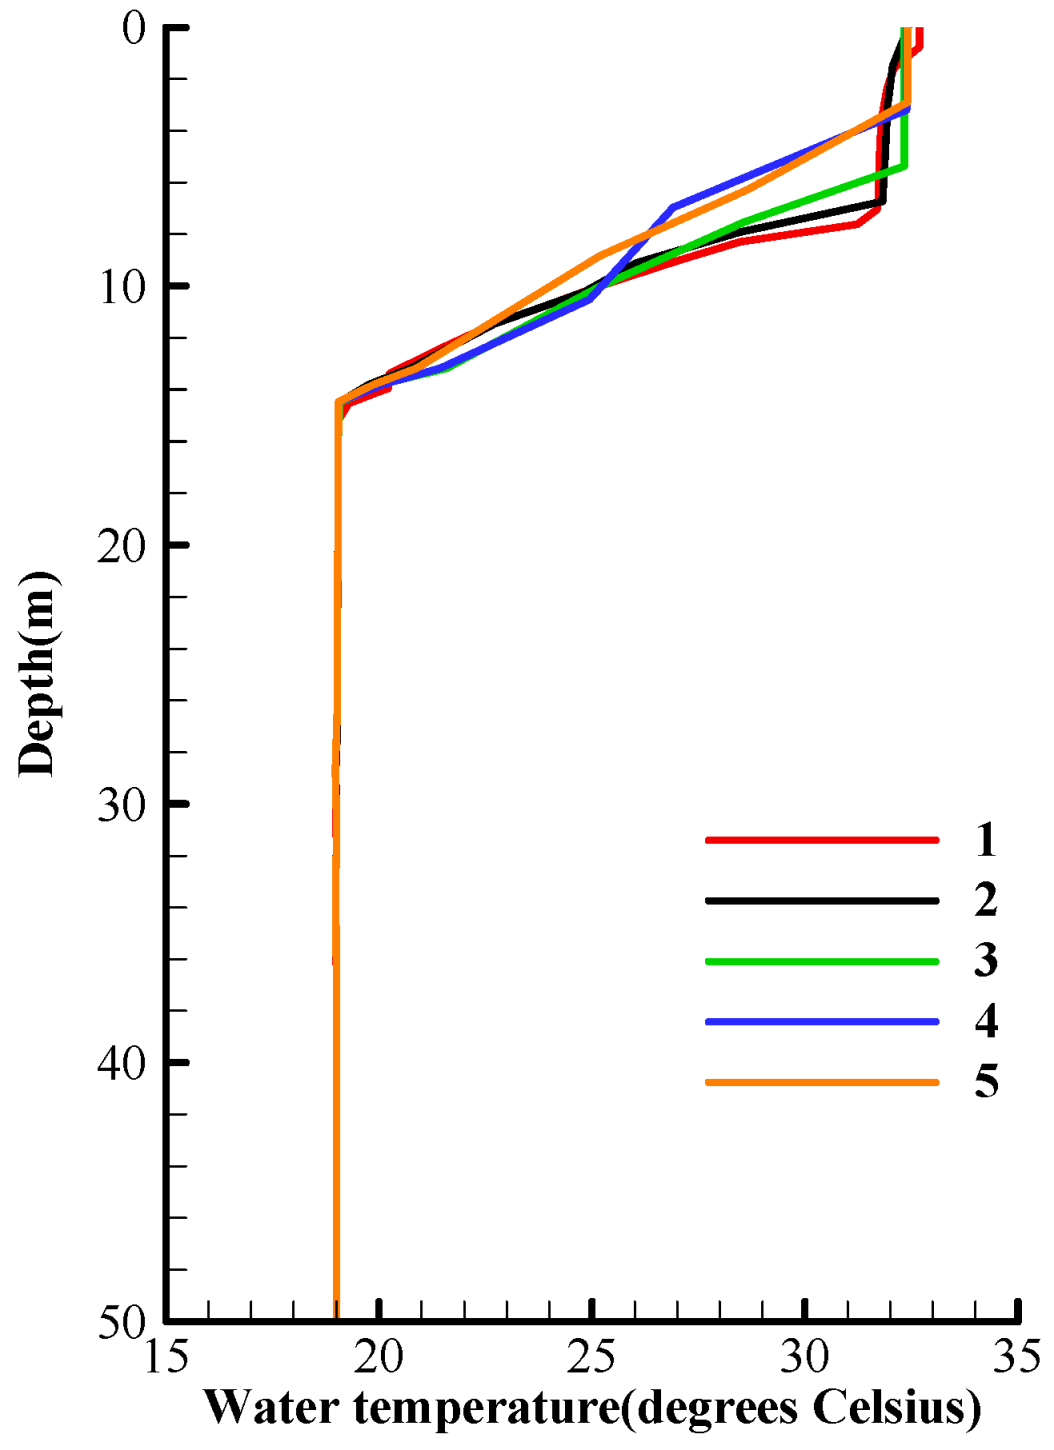
The maximum allowable layer thickness of 1.0 m, 3.0 m, 4.0 m, and 5.0 m were selected and compared with the simulation results in the baseline operating condition (Hmax = 2.0). To analyze the sensitivity of maximum allowable layer thickness, the minimum layer thickness was taken as 0.5 m.
The analysis shows that the maximum allowable layer thickness affected the thickness of the surface water temperature hybrid layer and thermocline layer (Figure 11). With the increase of maximum allowable layer thickness, the thickness of surface water temperature hybrid layer decreased with a range of −1.4–3.8 m), and the thickness of thermocline increased with a range of 1.4–3.8 m). However, the inflection point position of thermocline basically remained unchanged, and it had little effect on the thickness of hypolimnion.
This analysis indicates that the effect of maximum allowable layer thickness on water temperature and the thickness of hypolimnion can be ignored, and it mainly affects water temperature and the thickness of surface water temperature hybrid layer and thermocline. A smaller maximum allowable layer thickness decreases the spatial iteration step of numerical simulations and gives a finer description of layer-to-layer convective diffusion and vertical water temperature structure. However, it increases the computational time.
3.4. Thermodynamic Characteristics of the Reservoir
Figure 12 shows the monthly mean air temperature, inflow water temperature, and surface water temperature in Songtao Reservoir from 2 March 2016 to 1 March 2017. It demonstrates that these three variables were in a consistent trend. January−July was the period of temperature rise, and water temperature increased with the rise of air temperature. Subsequently, a cooling period appeared. As air temperature decreased, water temperature also decreased. According to the correlation analysis, the correlation coefficient between air temperature and the inflow water temperature was 0.98, and that between air temperature and reservoir surface water temperature was 0.97. As expected, a strong correlation existed between air temperature and water temperature. During this period, the monthly maximum, monthly minimum, and annual mean air temperatures were 28.1 °C (in June), 17.8 °C (in January), and 23.7 °C, respectively. The monthly maximum, monthly minimum, and annual mean inflow water temperatures were 28.2 °C (in July), 19.3 °C (in January), and 24.7 °C, respectively. Those for the reservoir’s surface water temperature were 32.9 °C (in July), 20.3 °C (in January), and 27.2 °C, respectively. The inflow water temperature was 1.0 °C higher than the air temperature, and the annual variation processes of these two variables were similar. The reservoir’s surface water temperature was much higher than the air temperature, which was 4.9 °C, 2.5 °C, and 3.5 °C higher than the monthly maximum, monthly minimum, and annual mean air temperatures, respectively. Therefore, heat sources of reservoirs in tropical zones are from air temperature, inflow water temperature, and other meteorological elements such as solar radiation, wind speed, cloud cover, and sunshine hours. In addition, after reservoir construction is complete, the flow rate decreases with longer water exchange time. The water body is exposed to strong air temperature and solar radiation for a long time. This enhances the capacity of heat absorption and heat storage. Therefore, high water temperature is maintained all year round.
Under the thermal effects of air temperature and water temperature, the vertical water temperature structure of Songtao Reservoir changed periodically. From February to July, with the increase of air temperature and solar radiation, heat absorbed by the surface layer of the reservoir increased continuously, and water temperature increased gradually. However, the reservoir has poor fluidity and weak vertical diffusion capacity, and heat absorbed by the upper water body cannot be transferred to the lower water body. The water temperature of the lower water body was maintained at 19 °C, and the vertical water temperature stratification structure was continuously strengthened, reaching the strongest stage in June and July. In August, air temperature and solar radiation began to decrease, and inflow water temperature also decreased. The surface water body of the reservoir entered the heat-losing stage, and the surface water temperature gradually decreased. Meanwhile, the upper and lower water bodies began to mix vertically and exchange heat. As shown in Figure 7, in October, November, and December, a water temperature hybrid layer of approximately 15–30 m appeared below the reservoir surface layer. In January and February, surface water temperature is close to reservoir bottom water temperature, and vertical water temperature structure is mixed.
4. Discussions
4.1. Model Verification and Thermodynamic Characteristics of the Reservoir
Water temperature simulation using the vertical 1D numerical model agreed with the observations quite well, with accurate simulated water temperature in Songtao Reservoir. The error between the measured and simulated surface water temperature was 0 °C (on 26 April 2016) and 1.4 °C (on 13 June 2016). The error between the measured and simulated hypolimnion water temperature was 0 °C (on 26 April 2016) and −0.1°C (on 13 June 2016). Although the error of thermocline temperature gradient was 0.2 m and 0.3 m, the largest relative error appeared in the simulation results, which were −19.2% and 19.3%. This reflects that the model has considerable uncertainty in simulating the position, thickness, and temperature difference of the thermocline. Satisfactory simulations of the surface temperature layer and hypolimnion were obtained in this study, and the temperature gradient of thermocline tended to be overestimated. This is a common problem in reservoir water temperature simulation by the DYRESM model [35,39,40,41], probably due to the problem of model structure.
The DYRESM model assumes that the extinction coefficient is a static constant. By contrast, hydrological, meteorological, and other boundary conditions are assumed to change with time. Therefore, the constant extinction coefficient might produce errors in the simulation of reservoir water temperature structure. In this study, the extinction coefficient ηA was defined as a constant value of 0.7, and it might impact the simulation results. The thermocline depth is affected by the internal wave motion and diurnal temperature difference [42,43]. The internal wave motion can cause the temporary offset of the thermocline. DYRESM is more effective in water temperature structure simulations in small- and medium-sized reservoirs [44]. This is because the horizontal temperature difference in small reservoirs is low, which satisfied the assumption of 1D models. The spatial changes of wind stress and heat source input can cause obvious horizontal water temperature differences in large reservoirs.
The thermal response of rivers depends on spatiotemporal scales, and its short-term response relationship is more complex [45]. However, a certain correlation exists between water temperature and air temperature in annual cycles, and it is usually assumed that air temperature is the main driving factor of water temperature change [46,47,48]. Therefore, ignoring the influence of air temperature may lead to the deviation of simulated reservoir water temperature [49]. Given that meteorological conditions in different geographical dimensions are quite different, it is not easy to quantitatively analyze the contribution of air temperature to reservoir heat. In addition to air temperature, meteorological conditions such as solar radiation, evaporation, wind speed, flow rate, and inflow water temperature also have thermal effects on the water body. It is generally believed that water temperature change is delayed after air temperature variations, and water temperature is slightly higher than air temperature [50,51].
4.2. Parameter Sensitivity
This study mainly focused on the sensitivity of extinction coefficient, vertical mixing coefficient, and maximum allowable layer thickness. Each parameter had different effects on vertical water temperature structure. The extinction coefficient largely affects surface water temperature. This is important for the formation and development of the surface water temperature hybrid layer. For example, when ηA was defined as the maximum value of 2, the surface water temperature was the highest among all sensitive analysis conditions for extinction coefficient, and almost no water temperature hybrid layer appeared on the surface. In the case of ηA less than 2, the surface water temperature hybrid layer began to form and develop and reached 13 m (ηA = 0.2). The vertical mixing coefficient significantly influences the inflection point and thickness of the thermocline. With the increase of vertical mixing coefficient, the thermocline inflection point descends, and the thermocline thickness increases. The maximum allowable layer thickness has certain effects on the thickness of surface water temperature hybrid layer and thermocline. However, compared with the extinction coefficient and vertical mixing coefficient, this parameter is less sensitive to the vertical water temperature structure.
Certain parameters are often associated with other physical and biochemical processes. For example, the extinction coefficient is related to phytoplankton content, suspended solids, etc. To simulate phytoplankton content and suspended solids, a water quality model should be added. When the hydrodynamic module DYRESM and the water quality module CAEDYM are coupled, the extinction coefficient can be simulated by the concentration of phytoplankton and suspended solids to obtain the time-varying values. In this study, the water quality module of CAEDYM was not included, and the coupling study of parameters in physical and biochemical processes was not carried out. Instead, the extinction coefficient was directly given in the model configuration file.
In addition, the influence of fundamental modeling data and model input conditions on water temperature simulation cannot be ignored. Fundamental modeling data normally include terrain, water intake position, reservoir regulation process, etc. Model input conditions include reservoir inflow, outflow, inflow water temperature, air temperature, cloud cover, water vapor pressure, solar radiation, wind speed, precipitation, etc. To ensure the model’s accuracy, the hydrological and meteorological data measured in Songtao Reservoir were collected and analyzed as the model input conditions. However, further analysis on the sensitivity of input conditions is still needed.
5. Conclusions
In this study, Songtao Reservoir in Hainan Province, China, was selected as the study area to quantify water temperature structure and thermodynamic characteristics of reservoirs in tropical zones by a vertical 1D numerical model. The constructed model was verified by the measured data, and sensitivity analysis of critical model parameters was performed. The main conclusions are summarized as follows:
(1) Water temperature simulated by the vertical 1D numerical model agreed with the observations quite well, with convincing simulated vertical water temperature in Songtao Reservoir. The model is suitable for water temperature structure simulations for large reservoirs in tropical zones with accurate results;
(2) The parameter sensitivity analysis shows that the extinction coefficient greatly affected surface water temperature, which is important for the formation and development of the surface water temperature hybrid layer. The vertical mixing coefficient significantly affected the position of the inflection point and the thickness of the thermocline. The vertical water temperature structure was sensitive to these two parameters. Therefore, these parameters require deliberate calibration in the application of vertical 1D numerical models;
(3) The vertical water temperature structure in Songtao Reservoir was stratified. Reservoir surface water temperature varied in the range of 19.4–33.8 °C within a year. The hypolimnion of the reservoir was located at the elevation below 150 m, where the water temperature was basically maintained at 19 °C throughout the year;
(4) As expected, the correlation between air temperature and water temperature in tropical zones is similar to that in other regions. However, the air temperature and surface water temperature data in Songtao Reservoir showed that surface water temperature was higher than air temperature all year round, and the annual mean difference between them was 3.5 °C. The unique climate in the tropical zone has a strong heating effect on the reservoir water body. In addition, water flow in the reservoir is slow. Thus, the water body can continuously receive heat.
Author Contributions
Conceptualization, H.G. and B.L.; methodology, H.G.; software, C.Q.; validation, H.G., C.Q., and S.X.; investigation, B.L. and W.S.; resources, H.G.; data curation, C.Q.; writing—original draft preparation, H.G.; writing—review and editing, C.Q., W.S. and L.M.; supervision, B.L. All authors have read and agreed to the published version of the manuscript.
Funding
This research was funded by the National Key Research and Development Program of China (2018YFC1508200) and Key Problems Research for Water Pollution Monitoring and Its Rapid Treatments of Water Resources Allocation Engineering Project in the Pearl River Delta Region of Guangdong Hydropower Planning & Design Institute Co., Ltd. (WW2018233).
Institutional Review Board Statement
Not applicable.
Informed Consent Statement
Not applicable.
Data Availability Statement
The data presented in this study are available on request from the corresponding author.
Conflicts of Interest
The authors declare no conflict of interest.
References
- Yang, M.F.; Li, L.; Li, J. Prediction of water temperature in stratified reservoir and effects on downstream irrigation area: A case study of Xiahushan reservoir. Phys. Chem. Earth Parts A/B/C 2012, 53–54, 38–42. [Google Scholar] [CrossRef]
- Qi, C.J.; Zhai, Y.; Lu, B.H.; Wang, Q.G. Research on vertical distribution of water temperature in different regulation reservoirs. Adv. Mater. Res. 2014, 955–959, 3190–3197. [Google Scholar] [CrossRef]
- Wan, W.; Li, H.; Xie, H.; Hong, Y.; Long, D.; Zhao, L.; Han, Z.; Cui, Y.; Liu, B.; Wang, C.; et al. A comprehensive data set of lake surface water temperature over the Tibetan Plateau derived from MODIS LST products 2001–2015. Sci. Data 2017, 4. [Google Scholar] [CrossRef]
- Schmid, M.; Hunziker, S.; Wüest, A. Lake surface temperatures in a changing climate: A global sensitivity analysis. Clim. Chang. 2014, 124, 301–315. [Google Scholar] [CrossRef]
- Chen, Q.; Han, H.; Zhai, S.; Hu, W. Influence of solar radiation and water temperature on chlorophyll-a levels in Lake Taihu, China. Acta Sci. Circumstantiae 2009, 29, 199–206. [Google Scholar] [CrossRef]
- Sharma, S.; Jackson, D.A.; Minns, C.K. Quantifying the potential effects of climate change and the invasion of smallmouth bass on native lake trout populations across Canadian lakes. Ecography 2009, 32, 517–525. [Google Scholar] [CrossRef]
- Wang, H.D. Lakes in China; The Commercial Press: Beijing, China, 1996. [Google Scholar]
- Zheng, T.G.; Sun, S.K.; Liu, H.T.; Jiang, H.; Li, G.N. Effect of the elevation of old dam gap on water temperature discharged for Fengman rebuilt project. In Proceedings of the 4th International Conference on Mechanical Materials and Manufacturing Engineering, Wuhan, China, 15–16 October 2016; Volume 79, pp. 372–375. [Google Scholar] [CrossRef]
- Tuo, Y.; Deng, Y.; Li, J.; Li, N.; Li, K.; Wei, L.; Zhao, Z. Effects of dam reconstruction on thermal-ice regime of Fengman Reservoir. Cold Reg. Sci. Technol. 2017, 146, 223–235. [Google Scholar] [CrossRef]
- Ren, L.; Wu, W.; Song, C.; Zhou, X.; Cheng, W. Characteristics of reservoir water temperatures in high and cold areas of the Upper Yellow River. Environ. Earth Sci. 2019, 78. [Google Scholar] [CrossRef]
- Quan, Q.; Wang, Y. The Multi-Level intake structure of High-Altitude reservoirs in aquatic environments. J. Residuals Sci. Technol. 2016, 1, 155–165. [Google Scholar] [CrossRef]
- Wang, F.; Maberly, S.C.; Wang, B.; Liang, X. Effects of dams on riverine biogeochemical cycling and ecology. Inland Waters 2018, 8, 130–140. [Google Scholar] [CrossRef] [Green Version]
- Zhang, Y.; Wu, Z.; Liu, M.; He, J.; Shi, K.; Wang, M.; Yu, Z. Thermal structure and response to long-term climatic changes in Lake Qiandaohu, a deep subtropical reservoir in China. Limnol. Oceanogr. 2014, 59, 1193–1202. [Google Scholar] [CrossRef]
- Qi, C.J.; Lu, B.H. Study of the temporal and spatial distribution of water temperature in ertan reservoir based on prototype observation. Adv. Mater. Res. 2013, 864–867, 2278–2287. [Google Scholar] [CrossRef]
- Lu, B.H.; Kang, Y.; Zhang, H.W.; Gu, H.H.; Jiang, S.T.; Hui, X.J.; Cao, Z.; Tung, Y.K. Field observation of water temperature profiles in large reservoirs with different features. In Proceedings of the 5th International Symposium on Integrated Water Resources Management, IWRM 2010 and the 3rd International Symposium on Methodology in Hydrology, Nanjing, China, 19–21 November 2010; pp. 359–368. [Google Scholar] [CrossRef]
- Chen, D.; Chen, G.; Zhao, Z.; Xu, H.; Xia, H.; Guo, Y.; Fan, X. Effect examination of stoplog stratified intake structure in guangzhao hydropower station in Guizhou—A case study of the pearl river basin Guangzhao hydropower station. Environ. Impact Assess. 2016, 38, 45–48. [Google Scholar] [CrossRef]
- Wang, F.; Ni, G.; Riley, W.J.; Tang, J.; Zhu, D.; Sun, T. Evaluation of the WRF lake module (v1.0) and its improvements at a deep reservoir. Geosci. Model Dev. 2019, 12, 2119–2138. [Google Scholar] [CrossRef] [Green Version]
- Jiang, B.; Wang, F.; Ni, G. Heating impact of a tropical reservoir on downstream water temperature: A case study of the jinghong dam on the lancang river. Water 2018, 10, 951. [Google Scholar] [CrossRef] [Green Version]
- Han, B.; Armengol, J.; Carlos Garcia, J.; Comerma, M.; Roura, M.; Dolz, J.; Straskraba, M. The thermal structure of Sau Reservoir (NE: Spain): A simulation approach. Ecol. Model. 2000, 125, 109–122. [Google Scholar] [CrossRef]
- Gal, G.; Imberger, J.; Zohary, T.; Antenucci, J.; Anis, A.; Rosenberg, T. Simulating the thermal dynamics of Lake Kinneret. Ecol. Model. 2003, 162, 69–86. [Google Scholar] [CrossRef]
- Laurie, S.B.; Tempel, R.N.; Stillings, L.L.; Shevenell, L.A. Modeling spatial and temporal variations in temperature and salinity during stratification and overturn in Dexter Pit Lake, Tuscarora, Nevada, USA. Appl. Geochem. 2006, 21, 1184–1203. [Google Scholar] [CrossRef]
- David, F.B.; Hamilton, D.P.; Pilditch, C.A. Modelling the relative importance of internal and external nutrient loads on water column nutrient concentrations and phytoplankton biomass in a shallow polymictic lake. Ecol. Model. 2008, 211, 411–423. [Google Scholar] [CrossRef]
- Asaeda, T.; Pham, H.S.; Nimal Priyantha, D.G.; Manatunge, J.; Hocking, G.C. Control of algal blooms in reservoirs with a curtain: A numerical analysis. Ecol. Eng. 2001, 16, 395–404. [Google Scholar] [CrossRef]
- Chen, L.; Qian, X.; Yang, Y.; Zhang, Y.; Qian, Y. Water-temperature simulation of Taihu lake based on DYRESM model and its application in the fore-warning of cyanobacteria-bloom. Environ. Prot. Sci. 2009, 35, 18–21. [Google Scholar] [CrossRef]
- Xie, X.; Qian, X.; Zhang, Y.; Qian, Y.; Tian, F. Effect on Chaohu Lake Water Environment of Water Transfer from Yangtze River to Chaohu Lake. Res. Environ. Sci. 2009, 22, 897–901. [Google Scholar] [CrossRef]
- Chen, D. A Preliminary Numerical Simulation of the Thermodynamic Conditions of Lugu Lake in Recent Years. Ph.D. Thesis, Jinan University, Guangzhou, China, 2015. [Google Scholar]
- Qi, C.; Chen, K.; Cao, X.; Zhai, Y.; Wu, L. Prediction of impact on water temperature by hydraulic and hydro-power engineering and key points in technical review. Environ. Impact Assess. Rev. 2016, 38, 1–4. [Google Scholar] [CrossRef]
- Orlob, G.T.; Selna, L.G. Temperature variations in deep reservoirs. J. Hydraul. Div. 1970, 96, 391–410. [Google Scholar] [CrossRef]
- Huber, W.C.; Harleman, D.R.F.; Ryan, P.J. Temperature prediction in stratified reservoirs. J. Hydraul. Div. 1972, 98, 645–666. [Google Scholar] [CrossRef]
- Luo, L.; Hamilton, D.; Lan, J.; McBride, C.; Trolle, D. Autocalibration of a one-dimensional hydrodynamic-ecological model (DYRESM 4.0-CAEDYM 3.1) using a Monte Carlo approach: Simulations of hypoxic events in a polymictic lake. Geosci. Model Dev. 2018, 11, 903–913. [Google Scholar] [CrossRef] [Green Version]
- Luo, L.; Hamilton, D.; Han, B. Estimation of total cloud cover from solar radiation observations at Lake Rotorua, New Zealand. Sol. Energy 2010, 84, 501–506. [Google Scholar] [CrossRef]
- Takkouk, S.; Casamitjana, X. Application of the DYRESM—CAEDYM model to the Sau Reservoir situated in Catalonia, Spain. Desalin. Water Treat. 2015, 57, 12453–12466. [Google Scholar] [CrossRef]
- Imberger, J.; Patterson, J.C. A dynamic reservoir simulation model—DYRESM: 5. In Transport Models for Inland and Coastal Waters; Fischer, H.B., Ed.; Academic Press: San Diego, CA, USA, 1981; pp. 310–361. [Google Scholar]
- Rinke, K.; Yeates, P.; Rothhaupt, K. A simulation study of the feedback of phytoplankton on thermal structure via light extinction. Freshw. Biol. 2010. [Google Scholar] [CrossRef]
- Perroud, M.; Goyette, S.; Martynov, A.; Beniston, M.; Anneville, O. Simulation of multiannual thermal profiles in deep lake geneva: A comparison of One-Dimensional lake models. Limnol. Oceanogr. 2009, 54, 1574–1594. [Google Scholar] [CrossRef] [Green Version]
- Ralf, H. Numerical Modelling of Stratification in Lake Constance with the 1-D Hydrodynamic Model DYRESM. Master’s Thesis, University of Stuttgart, Stuttgart, Germany, 2003. [Google Scholar]
- Yeates, P.S.; Imberger, J. Pseudo two-dimensional simulations of internal and boundary fluxes in stratified lakes and reservoirs. Int. J. River Basin Manag. 2003, 1, 297–319. [Google Scholar] [CrossRef]
- Imberger, J.; Patterson, J.C. Physical limnology. Adv. Appl. Mech. 1989, 27, 303–475. [Google Scholar] [CrossRef]
- Bayer, T.K.; Burns, C.W.; Schallenberg, M. Application of a numerical model to predict impacts of climate change on water temperatures in two deep, oligotrophic lakes in New Zealand. Hydrobiologia 2013, 713, 53–71. [Google Scholar] [CrossRef]
- Weinberger, S.; Vetter, M. Using the hydrodynamic model DYRESM based on results of a regional climate model to estimate water temperature changes at Lake Ammersee. Ecol. Model. 2012, 244, 38–48. [Google Scholar] [CrossRef]
- Spigel, R.; Mckerchar, A. Lake Brunner Study: Modelling Thermal Stratification; NIWA Client Report: CHC2008—080; NIWA: Greymouth, New Zealand, 2008; p. 40. [Google Scholar]
- Peeters, F.; Livingstone, D.M.; Goudsmit, G.; Kipfer, R.; Forster, R. Modeling 50 years of historical temperature profiles in a large central European lake. Limnol. Oceanogr. 2002, 47, 186–197. [Google Scholar] [CrossRef] [Green Version]
- Schallenberg, M.; James, M.; Hawes, I.; Howard-Williams, C. External forcing by wind and turbid inflows on a deep glacial lake and implications for primary production. N. Zeal. J. Mar. Fresh. 1999, 33, 311–331. [Google Scholar] [CrossRef]
- Tanentzap, A.J.; Hamilton, D.P.; Yan, N.D. Calibrating the Dynamic Reservoir Simulation Model (DYRESM) and filling required data gaps for one-dimensional thermal profile predictions in a boreal lake. Limnol. Oceanogr. Methods 2007, 5, 484–494. [Google Scholar] [CrossRef]
- Toffolon, M.; Piccolroaz, S. A hybrid model for river water temperature as a function of air temperature and discharge. Environ. Res. Lett. 2015, 10, 114011. [Google Scholar] [CrossRef]
- Caissie, D.; El-Jabi, N.; Satish, M.G. Modelling of maximum daily water temperatures in a small stream using air temperatures. J. Hydrol. 2001, 251, 14–28. [Google Scholar] [CrossRef]
- Webb, B.W.; Clack, P.D.; Walling, D.E. Water-air temperature relationships in a Devon river system and the role of flow. Hydrol. Process. 2003, 17, 3069–3084. [Google Scholar] [CrossRef]
- Sahoo, G.B.; Schladow, S.G.; Reuter, J.E. Forecasting stream water temperature using regression analysis, artificial neural network, and chaotic non-linear dynamic models. J. Hydrol. 2009, 378, 325–342. [Google Scholar] [CrossRef]
- Wang, Y.; Zhang, N.; Wang, D.; Wu, J. Impacts of cascade reservoirs on Yangtze River water temperature: Assessment and ecological implications. J. Hydrol. 2020, 590, 125240. [Google Scholar] [CrossRef]
- Zhu, B.F. Prediction of water temperature in reservoirs. J. Hydraul. Eng. 1985, 2, 12–21. [Google Scholar]
- Mullin, C.A.; Kirchhoff, C.J.; Wang, G.; Vlahos, P. Future projections of water temperature and thermal stratification in Connecticut reservoirs and possible implications for cyanobacteria. Water Resour. Res. 2020, 56. [Google Scholar] [CrossRef]
Figure 1.
Study area and water temperature monitoring points.

Figure 2.
Distribution of measured water temperature in Songtao Reservoir.

Figure 3.
Inflow and outflow processes in simulation period.

Figure 4.
Initial water temperature distribution for water temperature simulations.

Figure 5.
Observed and simulated water level processes in Songtao Reservoir.

Figure 6.
Verification of vertical water temperature structure in Songtao Reservoir: (a) Comparison of simulated water temperature and measured water temperature on 26 April 2016; (b) Comparison of simulated water temperature and measured water temperature on 13 June 2016.
Figure 6.
Verification of vertical water temperature structure in Songtao Reservoir: (a) Comparison of simulated water temperature and measured water temperature on 26 April 2016; (b) Comparison of simulated water temperature and measured water temperature on 13 June 2016.

Figure 7.
Simulated vertical water temperature distribution in Songtao Reservoir on the 15th day of each month.
Figure 7.
Simulated vertical water temperature distribution in Songtao Reservoir on the 15th day of each month.

Figure 8.
Schematic diagram of characteristic values for parameter sensitivity analysis.

Figure 9.
Vertical water temperature distribution using different extinction coefficients.

Figure 10.
Simulated water temperature distribution structure using different vertical mixing coefficients.
Figure 10.
Simulated water temperature distribution structure using different vertical mixing coefficients.

Figure 11.
Simulated water temperature distribution structure using different maximum allowable layer thickness.
Figure 11.
Simulated water temperature distribution structure using different maximum allowable layer thickness.

Figure 12.
Annual cycle of air temperature, inflow water temperature, and surface water temperature in Songtao Reservoir.
Figure 12.
Annual cycle of air temperature, inflow water temperature, and surface water temperature in Songtao Reservoir.


Table 1.
Calibrated model parameter values in Songtao Reservoir.
| No. | Parameters | Unit | Calibration Value |
|---|---|---|---|
| 1 | Aerodynamic transmission coefficients (CL, CS, CM) | / | 1.5 × 10⁻³ |
| 2 | Average water surface albedo | / | 0.09 |
| 3 | Long-wave emissivity at water surface εw | / | 0.96 |
| 4 | Critical wind speed Ucir | m/s | 3.00 |
| 5 | Entrainment coefficient constant ε | / | 0.05 |
| 6 | Light plume entrainment coefficient α | / | 0.083 |
| 7 | Coefficient of shear energy generation efficiency ηk | / | 0.06 |
| 8 | Coefficient of potential energy mixing efficiency ηp | / | 0.5 |
| 9 | Coefficient of wind disturbance efficiency ηs | / | 0.85 |
| 10 | Coefficient of effective surface area AC | m2 | 107 |
| 11 | Top diffusion coefficient KBBL | m2/s | 1.4 × 10⁻⁵ |
| 12 | Vertical mixing coefficient C | / | 50 |
| 13 | Minimum layer thickness Hmin | m | 0.5 |
| 14 | Maximum layer thickness Hma | m | 2 |
| 15 | Extinction coefficient ηA | m−1 | 0.70 |
Table 2.
Observed and simulated characteristic values of vertical water temperature distribution.
| Characteristics of Water Temperature | 26 April | 13 June | ||||
|---|---|---|---|---|---|---|
| Measured Value | Simulated Value | Error | Measured Value | Simulated Value | Error | |
| Thickness of surface temperature layer (m) | 3.2 | 3.4 | 0.2 | 4.0 | 4.2 | 0.2 |
| Water temperature of surface temperature layer (°C) | 29.1 | 29.1 | 0.0 | 32.1 | 33.5 | 1.4 |
| Thermocline depth (m) | 9.7 | 9.1 | −0.6 | 9.0 | 8.4 | −0.6 |
| Temperature gradient of thermocline (°C/m) | 0.9 | 1.1 | 0.2 | 1.3 | 1.6 | 0.3 |
| Water temperature of hypolimnion (°C) | 19.0 | 19.0 | 0.0 | 19.1 | 19.0 | −0.1 |
Publisher’s Note: MDPI stays neutral with regard to jurisdictional claims in published maps and institutional affiliations. |
© 2021 by the authors. Licensee MDPI, Basel, Switzerland. This article is an open access article distributed under the terms and conditions of the Creative Commons Attribution (CC BY) license (http://creativecommons.org/licenses/by/4.0/).
Share and Cite
MDPI and ACS Style
Gu, H.; Lu, B.; Qi, C.; Xiong, S.; Shen, W.; Ma, L. Water Temperature Simulation in a Tropical Lake in South China. Water 2021, 13, 913. https://doi.org/10.3390/w13070913
AMA Style
Gu H, Lu B, Qi C, Xiong S, Shen W, Ma L. Water Temperature Simulation in a Tropical Lake in South China. Water. 2021; 13(7):913. https://doi.org/10.3390/w13070913
Chicago/Turabian StyleGu, Hongbin, Baohong Lu, Changjun Qi, Si Xiong, Wenlong Shen, and Lejun Ma. 2021. "Water Temperature Simulation in a Tropical Lake in South China" Water 13, no. 7: 913. https://doi.org/10.3390/w13070913
Note that from the first issue of 2016, this journal uses article numbers instead of page numbers. See further details here.