
Modeling Flood Peak Discharge Caused by Overtopping Failure of a Landslide Dam


1
Key Laboratory of Mountain Hazards and Surface Processes, CAS/Institute of Mountain Hazards and Environment, CAS, Chengdu 610041, China
2
University of Chinese Academy of Science, Beijing 100000, China
3
CAS Center for Excellence in Tibetan Plateau Earth Sciences, Beijing 100101, China
*
Author to whom correspondence should be addressed.
Water 2021, 13(7), 921; https://doi.org/10.3390/w13070921
Submission received: 2 March 2021
/
Revised: 19 March 2021
/
Accepted: 24 March 2021
/
Published: 27 March 2021
(This article belongs to the Section Hydrology)
Abstract
:Overtopping failure often occurs in landslide dams, resulting in the formation of strong destructive floods. As an important hydraulic parameter to describe floods, the peak discharge often determines the downstream disaster degree. Based on 67 groups of landslide dam overtopping failure cases all over the world, this paper constructs the calculation model for peak discharge of landslide dam failure. The model considers the influence of dam erodibility, breach shape, dam shape and reservoir capacity on the peak discharge. Finally, the model is compared with the existing models. The results show that the new model has a higher accuracy than the existing models and the simulation accuracy of the two outburst peak discharges of Baige dammed lake in Jinsha River (10 October 2018 and 3 November 2018) is higher (the relative error is 0.73% and 6.68%, respectively), because the model in this study considers more parameters (the breach shape, the landslide dam erodibility) than the existing models. The research results can provide an important reference for formulating accurate and effective disaster prevention and mitigation measures for such disasters.
1. Introduction
Landslide is a common mountain hazard, which is widely distributed in the steep mountain gorge area [1,2]; it often has the characteristics of high location, high speed, long distance of movement [3]. In particular, the frequency of large-scale landslides is higher under the action of heavy rainfall or high-intensity earthquake [1]. When there are rivers in the direction of landslide movement, the landslide is easy to accumulate into the river and form a dam to block up the upstream water level. Once a dam failure occurs, it will also cause a huge flood disaster in the downstream and enlarge the scope and scale of the hazard [2,4,5,6,7,8,9,10,11]. For example, in 1786, a strong M = 7.75 earthquake in Luding-Kangding area, Sichuan Province, southwestern China, formed a landslide dam and the flood caused by the landslide dam failure killed more than 100,000 people [12]. In addition, Yigong Landslide dammed lake (9 April 2000) [13], Tangjiashan landslide dammed lake (12 May 2008) [14] and Baige landslide dammed lake (10 October 2018 and 3 November 2018) [15] occurred in recent years, which caused serious life and property losses of upstream reservoir inundation and downstream extraordinary outburst flood.
Landslide dam is a kind of natural earth rock dam without special design and specific spillway. Its geometry, material composition and internal structure are significantly different from those of artificial earth rock dam [16] and its failure probability is much higher than that of artificial earth rock dam [17,18,19]. According to statistical data [19], the service life of landslide dams ranges from a few minutes to thousands of years, with 87%, 83%, 71%, 51% and 34% of them less than one year, half a year, one month, one week and one day, respectively. Most of the cases (91%) were overtopping and only a few landslide dams were piping failure (8%) and slope instability. This kind of “short life, multiple overtopping failure” nature creates the high risk of a landslide dam, which is closely related to the shape, material composition, internal structure, main river shape and hydraulic characteristics of a landslide dam [2,8,10,19]. Therefore, the failure mechanism of landslide dams has become an important scientific problem.
Several numerical models of overtopping dam break based on physical processes have been proposed, such as DAMBRK model [20], BREACH model [21], BEED model [22], BRES model [23], Tingsanchali and Chinnarasri’s model [24], HR-BREACH [25], SIMBA model [26,27], Wang and Bowles’s model [28], BRES-Zhu model [29], Faeh’s model [30], Wu and Wang’s model [31] and Gradual dam breaches model [32]. However, the above model is almost for artificial earth rock dam and it is difficult to be applied to landslide dam with complex natures. In addition, Zhong et al. [8] established a water soil coupling mathematical model to simulate the overtopping failure process of Tangjiashan dam. Chang and Zhang [33] proposed a landslide dam overtopping failure model based on physical process to simulate the effect of soil erodibility changing with depth on the erosion process. Shen et al. [2] considered not only the change of soil erodibility with depth, but also the erosion mode (unilateral dam failure and bilateral dam failure) and different material composition of landslide dam. Cao et al. [34] also established a two-dimensional model of landslide dam failure based on the traditional shallow water dynamic equation. Even so, the computational efficiency is greatly reduced and the reliability of the results is low due to the difficulties in obtaining the parameters required by the model, controlling the boundary conditions and over simplification of the model. Therefore, a rapid dam failure risk assessment method is needed.
As one of the most important parameters in the process of dam failure, the peak discharge of dam failure often determines the downstream disaster degree and the reliability of its prediction results determines the accuracy and effectiveness of disaster prevention and mitigation measures [35]. The simulation of flood peak discharge has been studied as early as the 1980s. At present, a large number of simulation models have emerged, such as Kirkpatrick’s model [36], Macdonald and Langridge-Monopolis’ model [37], Singh and Snorrason’s model [38], Costa’s model [39], Costa and Schuster’s model [17], Froehlich’s model [40], Webby’s model [41], Walder and O’Connor’s model [42], Pierce et al. model [43], Peng and Zhang’s model [19] and Hakimzadeh et al. model [44]. Among them, most of the models are only applicable to earth rock dams and most of the formulas are single independent variables, so the calculation results are uncertain and the existing models do not consider the impact of the breach shape on the peak discharge. In addition, because the breach flow is a strong unsteady flow when the dam failure, the upstream water level is complex and difficult to describe quantitatively, the height of water level drop (d) and the potential energy of the water body in the process of dam break (PE) is difficult to be measured, so the formula containing this parameter still has strong limitations. In fact, the breach shape determines the cross-section area of the outburst flood; the dam erodibility determines the duration of the outburst flood [45,46], so these two parameters still have an important impact on the peak discharge of the dam break flood.
The purpose of this study is to solve the shortcomings of the existing researches, such as the low simulation accuracy of the peak discharge of landslide dam failure and the incomplete consideration of the parameters. According to 67 groups of historical landslide dam failure cases with relatively complete data, the calculation model of the peak discharge of landslide dam failure is constructed on the basis of considering the final breach shape, dam body shape, dam erodibility and reservoir capacity and compared with the existing models. The Baige dammed lake (98°41′52.15″ E, 31°4′54.91″ N) outburst event in 2018 is used to further verify it. The model can provide reference for disaster prevention and mitigation of landslide dam failure.
2. Materials and Methods
2.1. Landslide Dam Failure Data
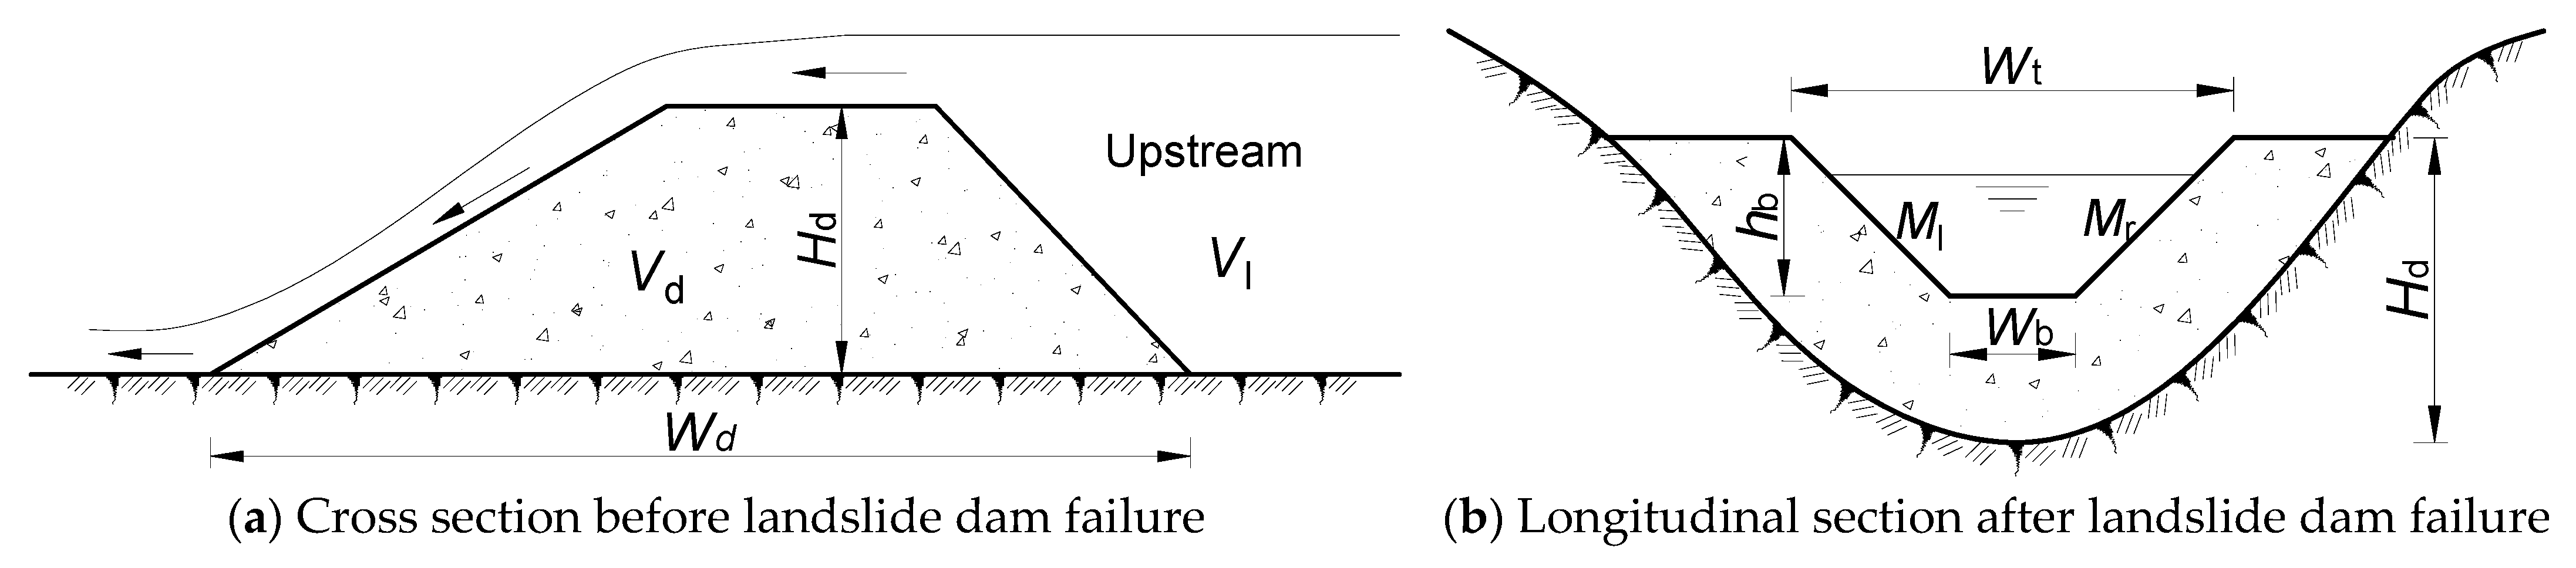
Based on the extensive collection of relevant literature, this paper obtains 67 groups of historical landslide dam failure data all over the world (Appendix A Table A1), including 45 groups of historical landslide dam failure data summarized in Peng et al. [19]. In Table A1, dam erodibility indicates the resistance of dam materials to the erosion action of water flow. Briaud (2008) [47] proposed six erosion categories (very high, high, medium, low, very low and non-erosive) according to erosion rate and breach velocity or flow shear stress. The higher the dam erodibility is, the greater the peak discharge is. However, the data of erosion rate, velocity and shear stress cannot be obtained before the dam break. Therefore, this paper refers to Zhang et al. (2019) [9] and Cui et al. (2008) [48] and divides the dam erodibility into three categories (high, medium, low) according to the particle composition of the landslide dam. The classification criteria are: when the landslide dam is dominated by large stones, it is low erodibility (L); when the landslide dam is dominated by soil, it is high erodibility (H); when the landslide dam contains a large number of stones and soil, it is medium erodibility (M). The meanings of other parameters are shown in Figure 1.
2.2. Modeling Dam-Break Peak Discharge
2.2.1. Calculation of Breach Size
Previous studies have shown that the width of the breach is most closely related to the storage capacity of the barrier lake [49,50,51]. Therefore, this study assumes that the width of the breach bottom is proportional to the 1/3 power of the storage capacity and then the expression of the final width of the breach (Wb) with the same dimension can be obtained:
where λ is a parameter determined by the erodibility of landslide dam; Vl is the capacity of barrier lake.
Secondly, Peng et al. [19] pointed out that the breach depth is closely related to the height of the barrier dam and the capacity of the barrier lake. Therefore, this paper uses the formula given by Peng et al. [19] for reference and assumes that the breach depth can be expressed as:
where, ξ, α and β are parameters determined by the erodibility of landslide dam, which reflects the influence of the erodibility of landslide dam on the depth of breach; Hr = 1 m; Vl is barrier lake capacity; hb is breach depth; Hd is landslide dam height.
A total of 67 groups data of landslide dam failure in Table A1 are fitted manually in a graph and analyzed by using Formulas (1) and (2) and the corresponding λ, ξ, α and β of three kinds of landslide dam erodibility are obtained, as shown in Table 1. In the future, new landslide cases should be added to further modify these parameters.
2.2.2. Calculation of Peak Discharge of Dam Failure
In order to consider the impact of breach shape on the peak discharge, this paper uses the semi analytical model proposed by Wang et al. [52] for reference. In this model, the cross-section shape of the breach is generalized as a trapezoid (Figure 1b) and then combinative parameter of the cross section is calculated according to Equation (3).
where q is combinative parameter of the cross section of breach, which is a parameter reflecting the shape of the breach. Wb is the bottom width of landslide dam breach. Ml and Mr are the slope ratio of left and right side of the breach, respectively; when landslide dam is overtopping failure, Ml = Mr = 1.0.
Then, the characteristic parameter (Wu) of final breach water depth is calculated by Equation (4).
Then, according to Equation (5), the characteristic parameter (W) of the breach water depth is calculated.
where G(Wu) and G(W) are two functions of Wu and W, respectively. x* is the dimensionless distance, x* = 0 at the breach.
The expressions of G(Wu) and G(W) are as follows:
According to Equations (4)–(7), the characteristic parameter (W) of breach water depth can be obtained, but the solution process needs to be obtained by trial calculation method, so the implicit expression of characteristic parameter (W) of breach water depth is transformed into approximate explicit expression (Equation (8).
In order to illustrate the accuracy and rationality of Formula (8), a point is taken every 0.01 interval in the interval Wu ∈ [0.02,3.00] and then Formulas (4)–(7) and Formula (8) are used to calculate the characteristic parameter (W) of breach water depth and then the calculation error of Formula (8) is compared. The results show that the average relative error is 0.067% and the maximum relative error is only 0.259%. In addition, Formula (8) is used to calculate 67 groups of landslide dam failure cases in Table A1. The minimum value of initial breach water depth characteristic parameter Wu is 0.28 and the maximum value is 1.53, which is far less than the calculation interval in Formula (8), so Formula (8) can meet the actual demand.
Finally, according to Formula (9), the peak discharge (Qp) of landslide dam failure is calculated.
where Qp is the peak discharge of landslide dam failure, m3/s; g is the acceleration of gravity, m/s2.
3. Results and Discusions
3.1. Model Verification and Comparison
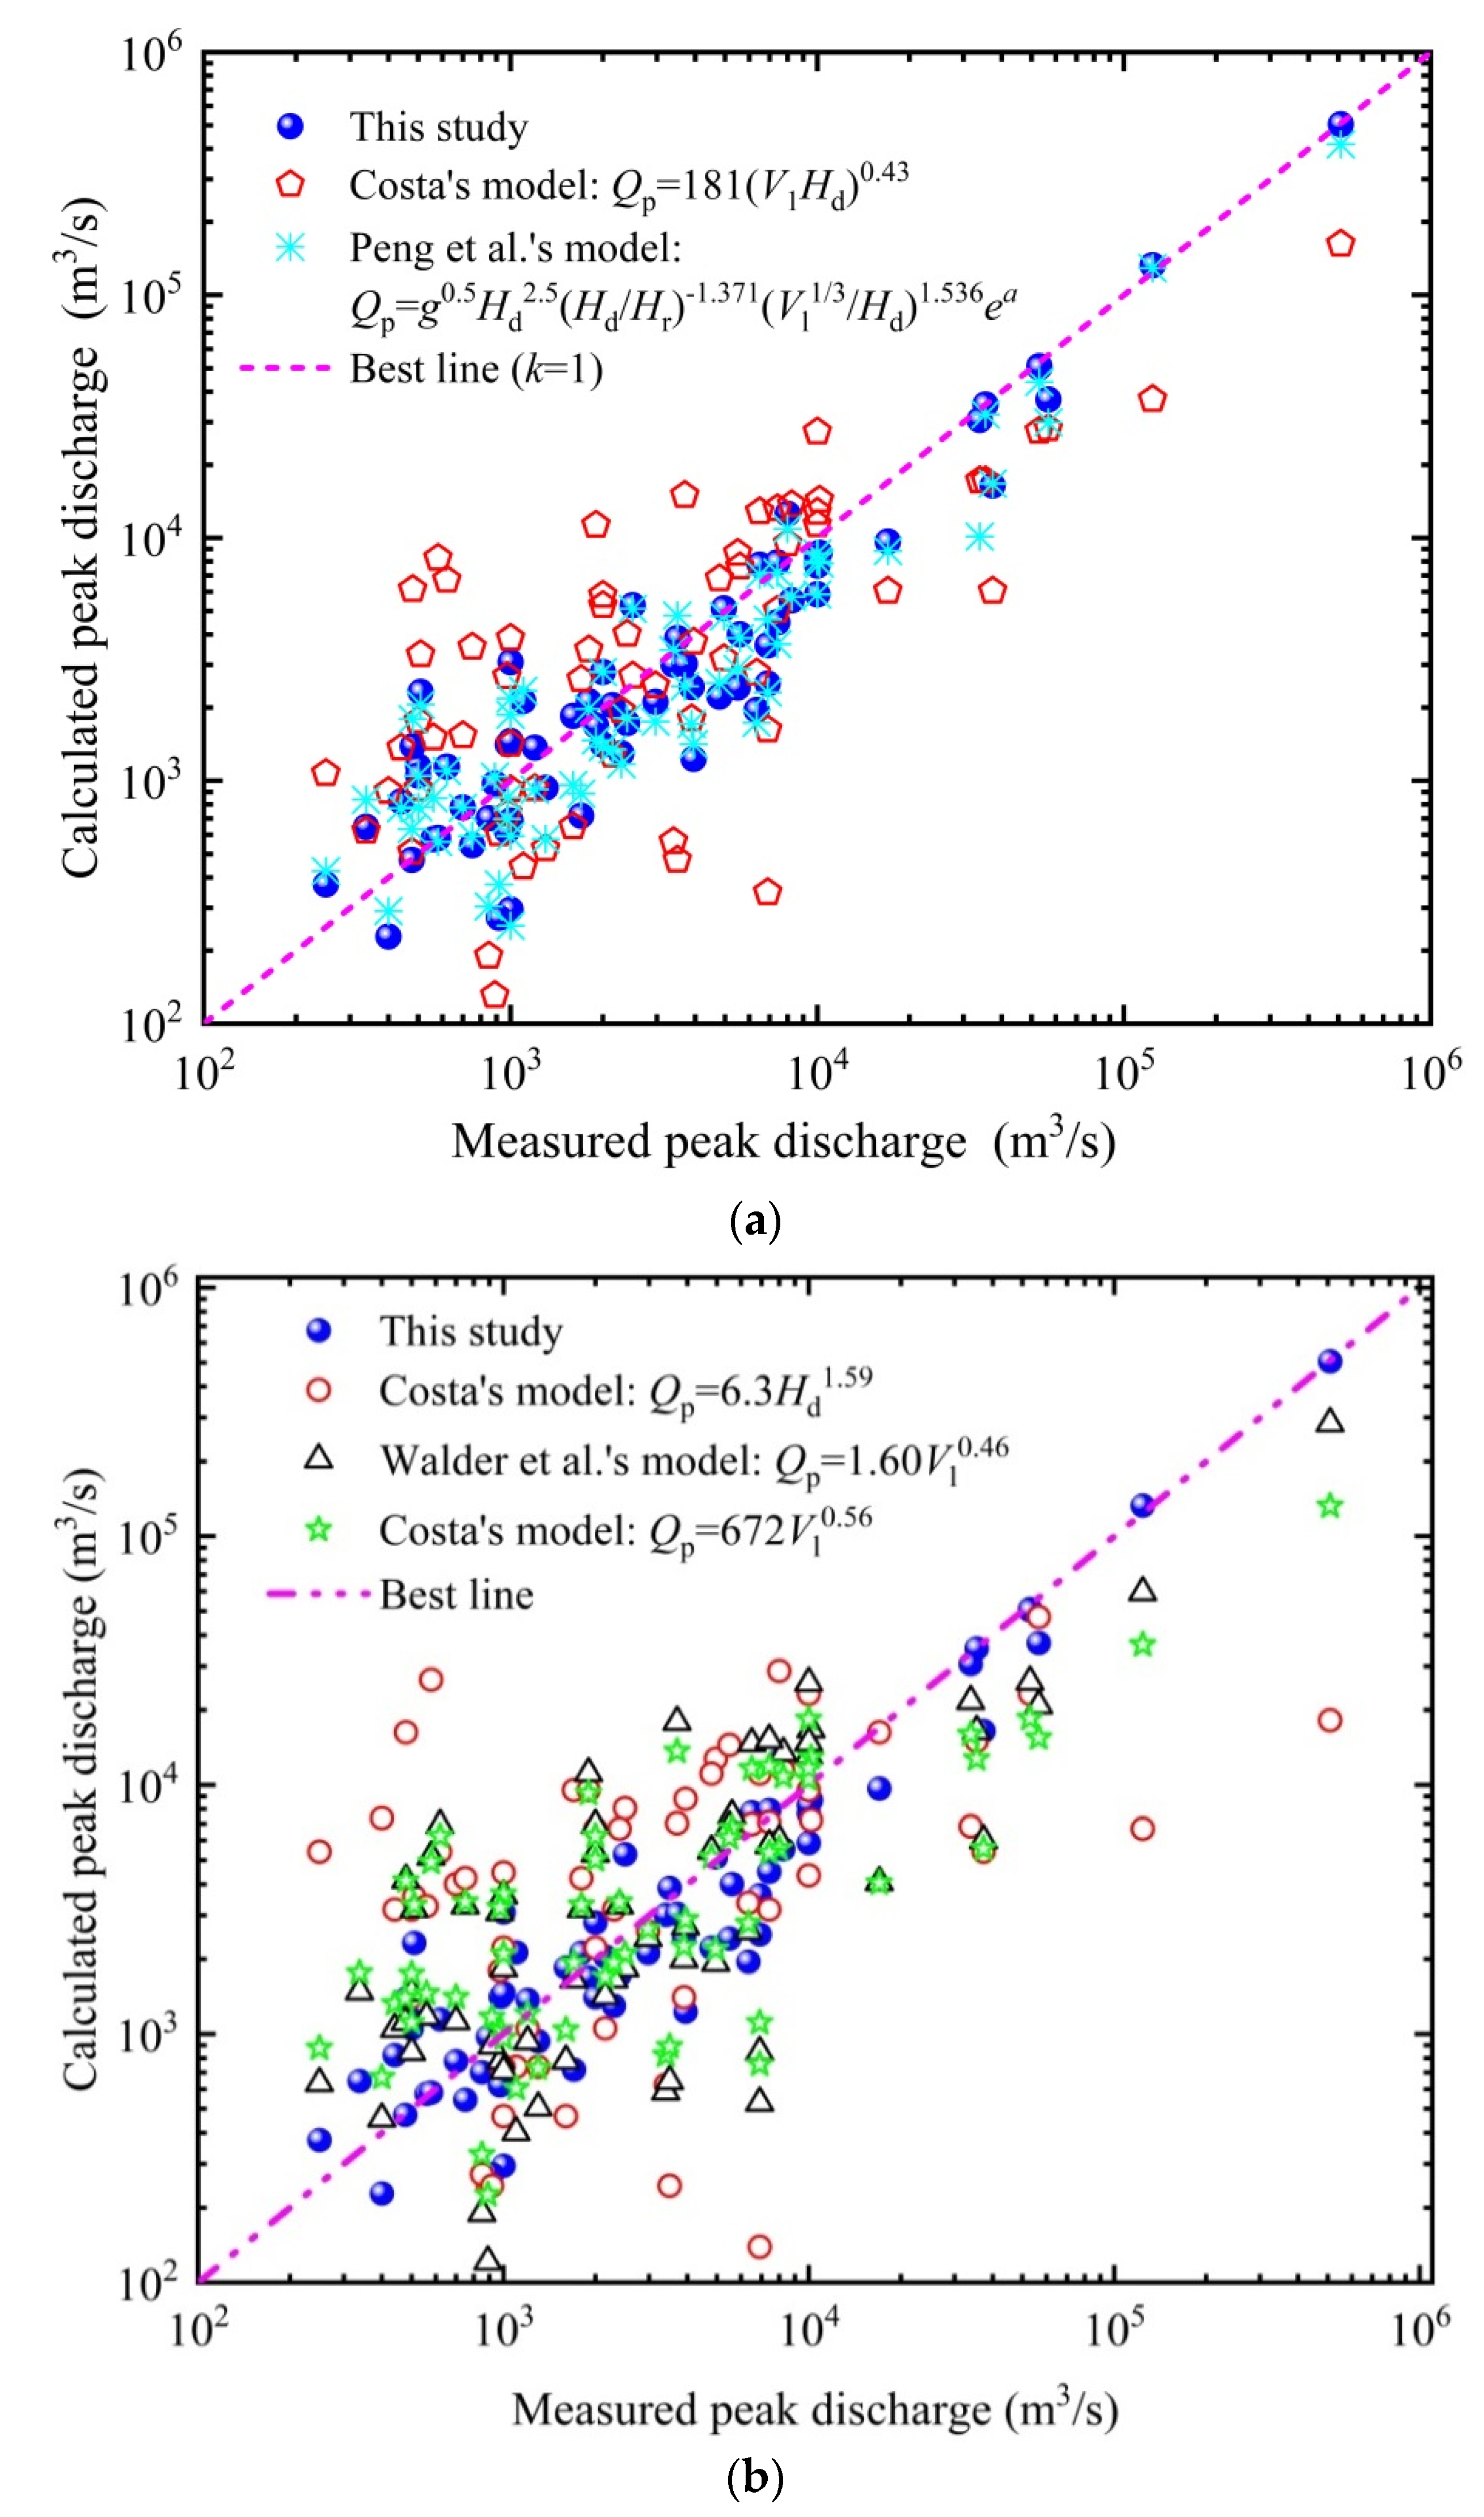
As the height of water level drop (d) and the potential energy (PE) of water are difficult to be measured in the process of dam failure, the calculated formula of peak discharge of landslide dam failure in Table 2 is selected for comparison with the model of this paper. The calculated results of each calculated model are shown in Figure 2.
It can be seen from Figure 2 that the reliability of the model proposed in this study and the model proposed by Peng et al. [19] is significantly higher than that of other models; compared with the model proposed by Peng et al. [19], when the measured peak discharge of landslide dam failure is less than 10,000 m3/s, the calculated peak discharge of this study model is similar to that of Peng et al. [19]. When the measured peak discharge of landslide dam failure is greater than 10,000 m3/s, the calculated peak discharge of this study model is closer to the optimal line than that of Peng et al. [19].
The mean relative error (MRE), root mean square error (RMSE) and coefficient of determination (R2) of the calculated peak discharge are further used to illustrate the calculated effect of the above model. The MRE reflects the average reliability or the average error rate of the calculated value. The RMSE reflects the precision of the calculated value because it is particularly sensitive to maximum and minimum values. The R2 reflects the correlation between the calculated value and the measured value. The simulation will be more accurate with smaller MRE and RMSE and larger R2. MRE, RMSE and R2 are as follows:
where Qcal,i is the simulation peak discharge of the ith landslide dam failure case (i = 1, 2, 3); Qobs,i is the measured peak discharge of the ith landslide dam failure case (i = 1, 2, 3,...), N = 67 in this paper; Qobsm is the mean of the measured peak discharges. According to the calculated results (Table 3), MRE, RMSE and R2 of this model are smaller than those of other models, indicating that the calculated effect of this model is the best.
3.2. Example Application
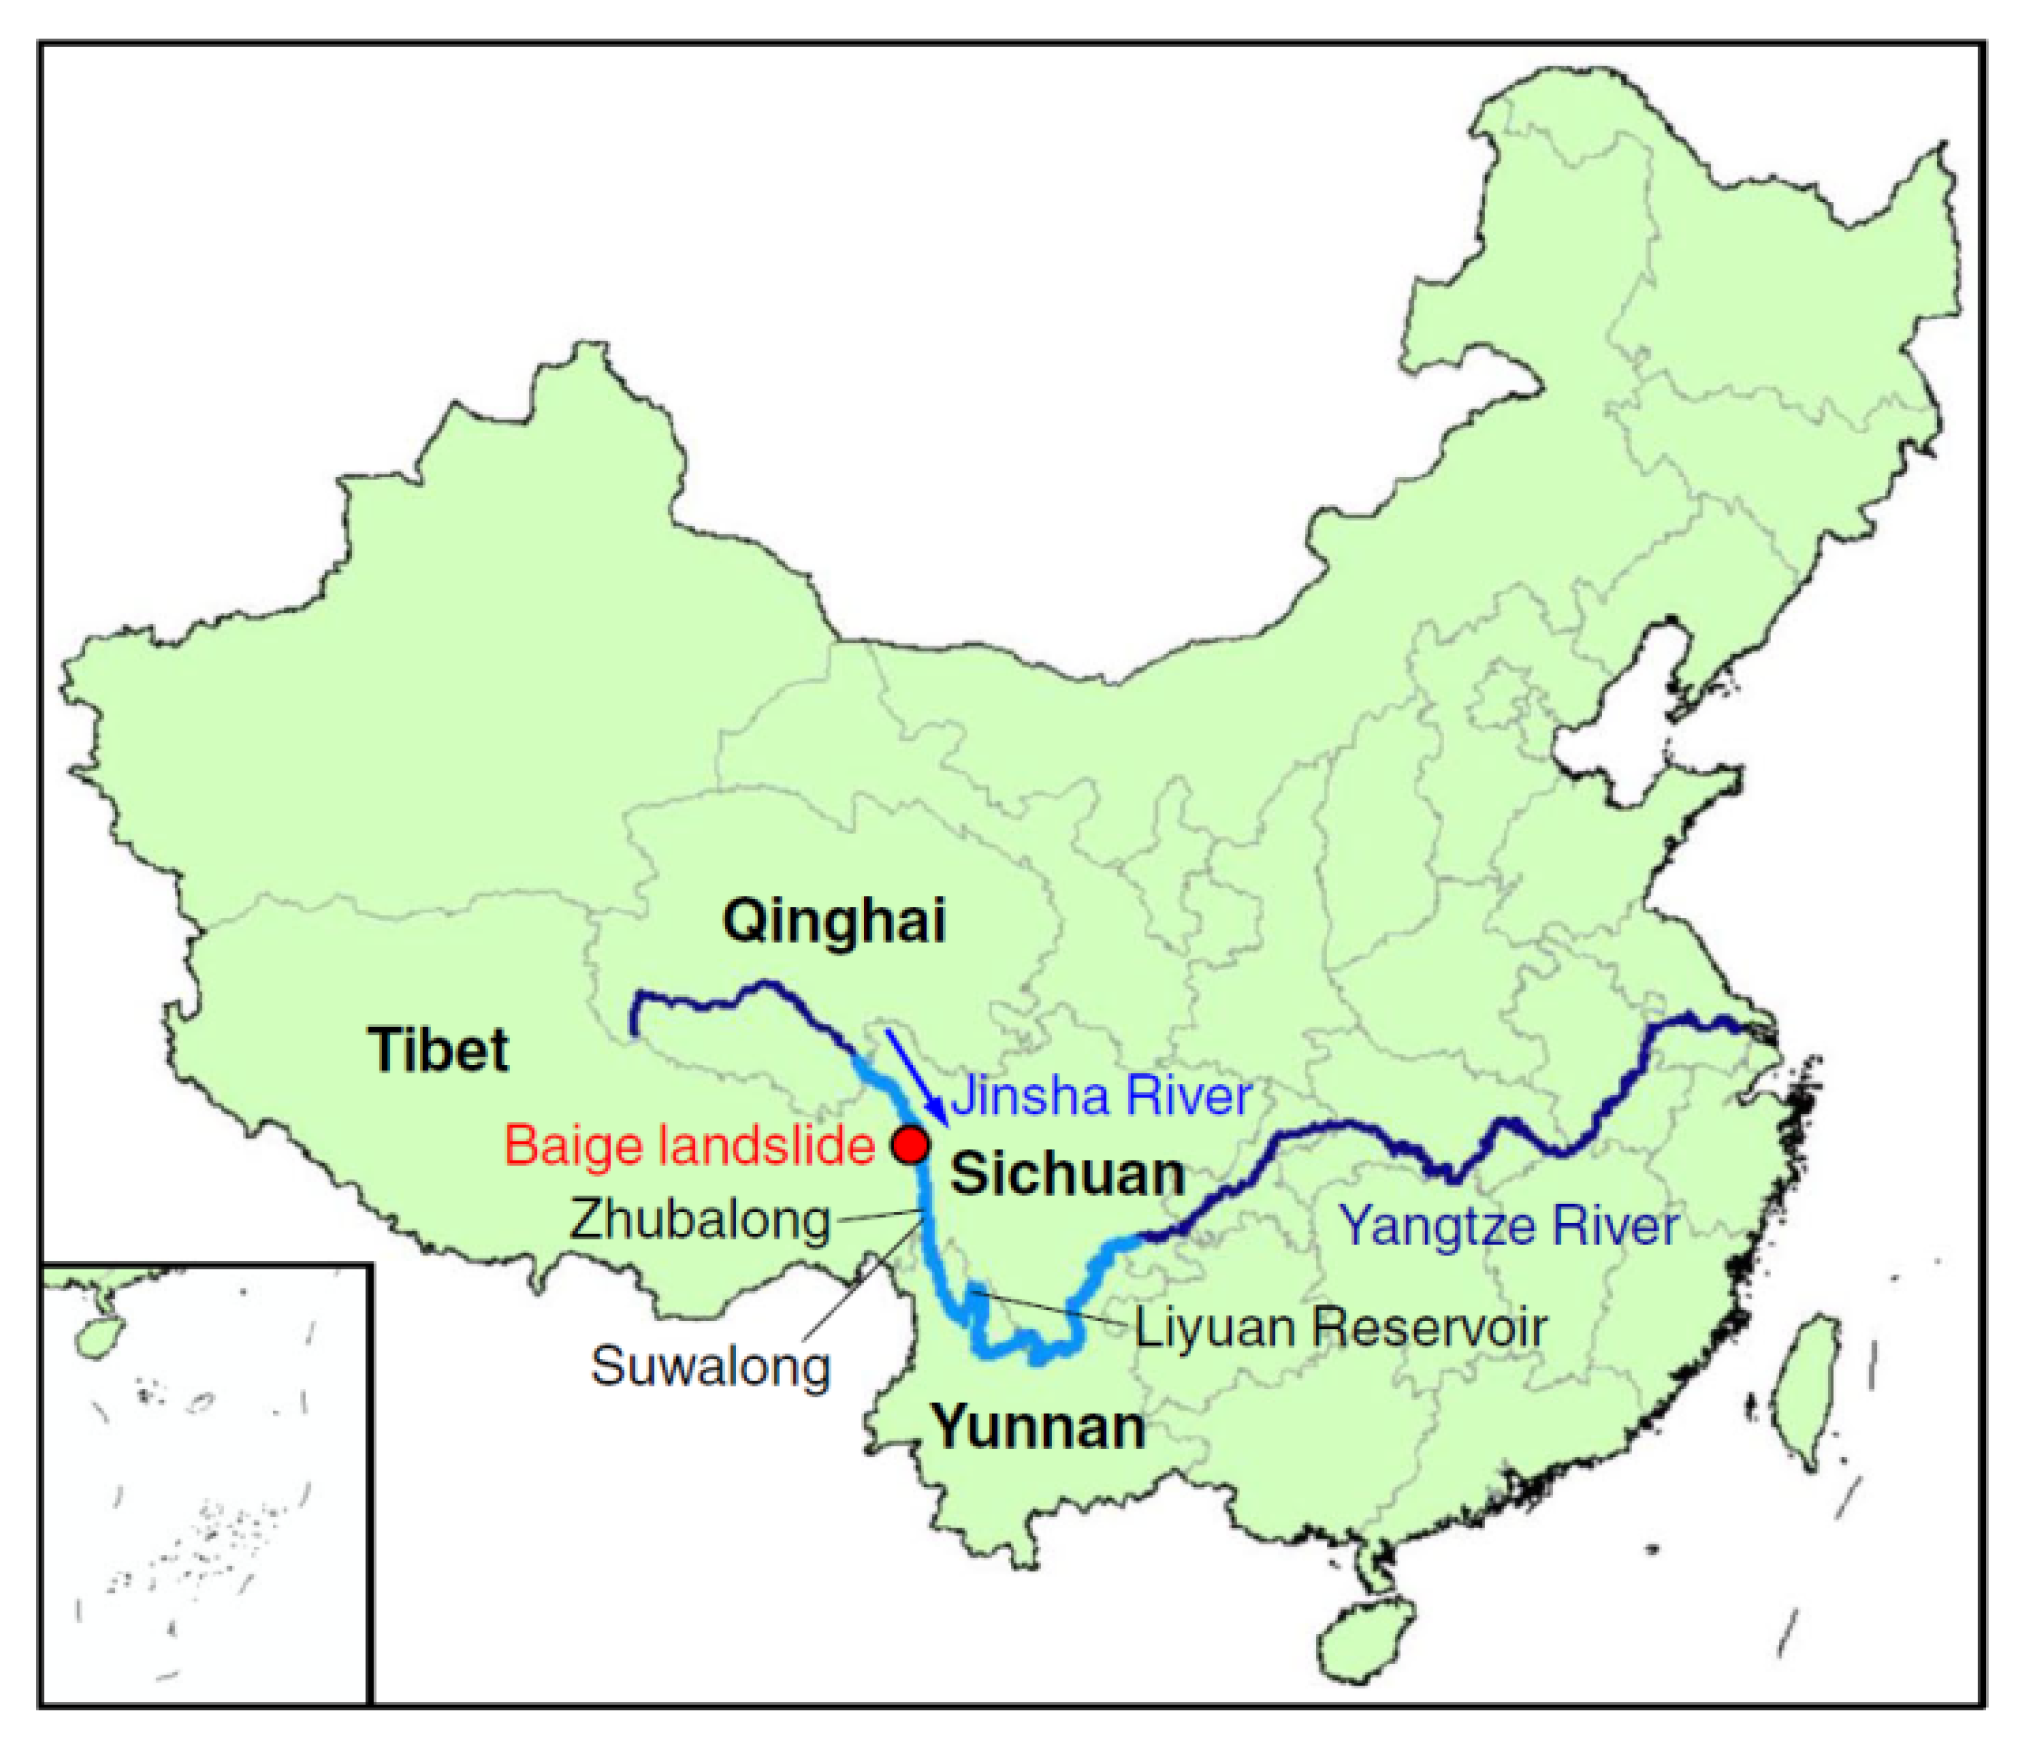
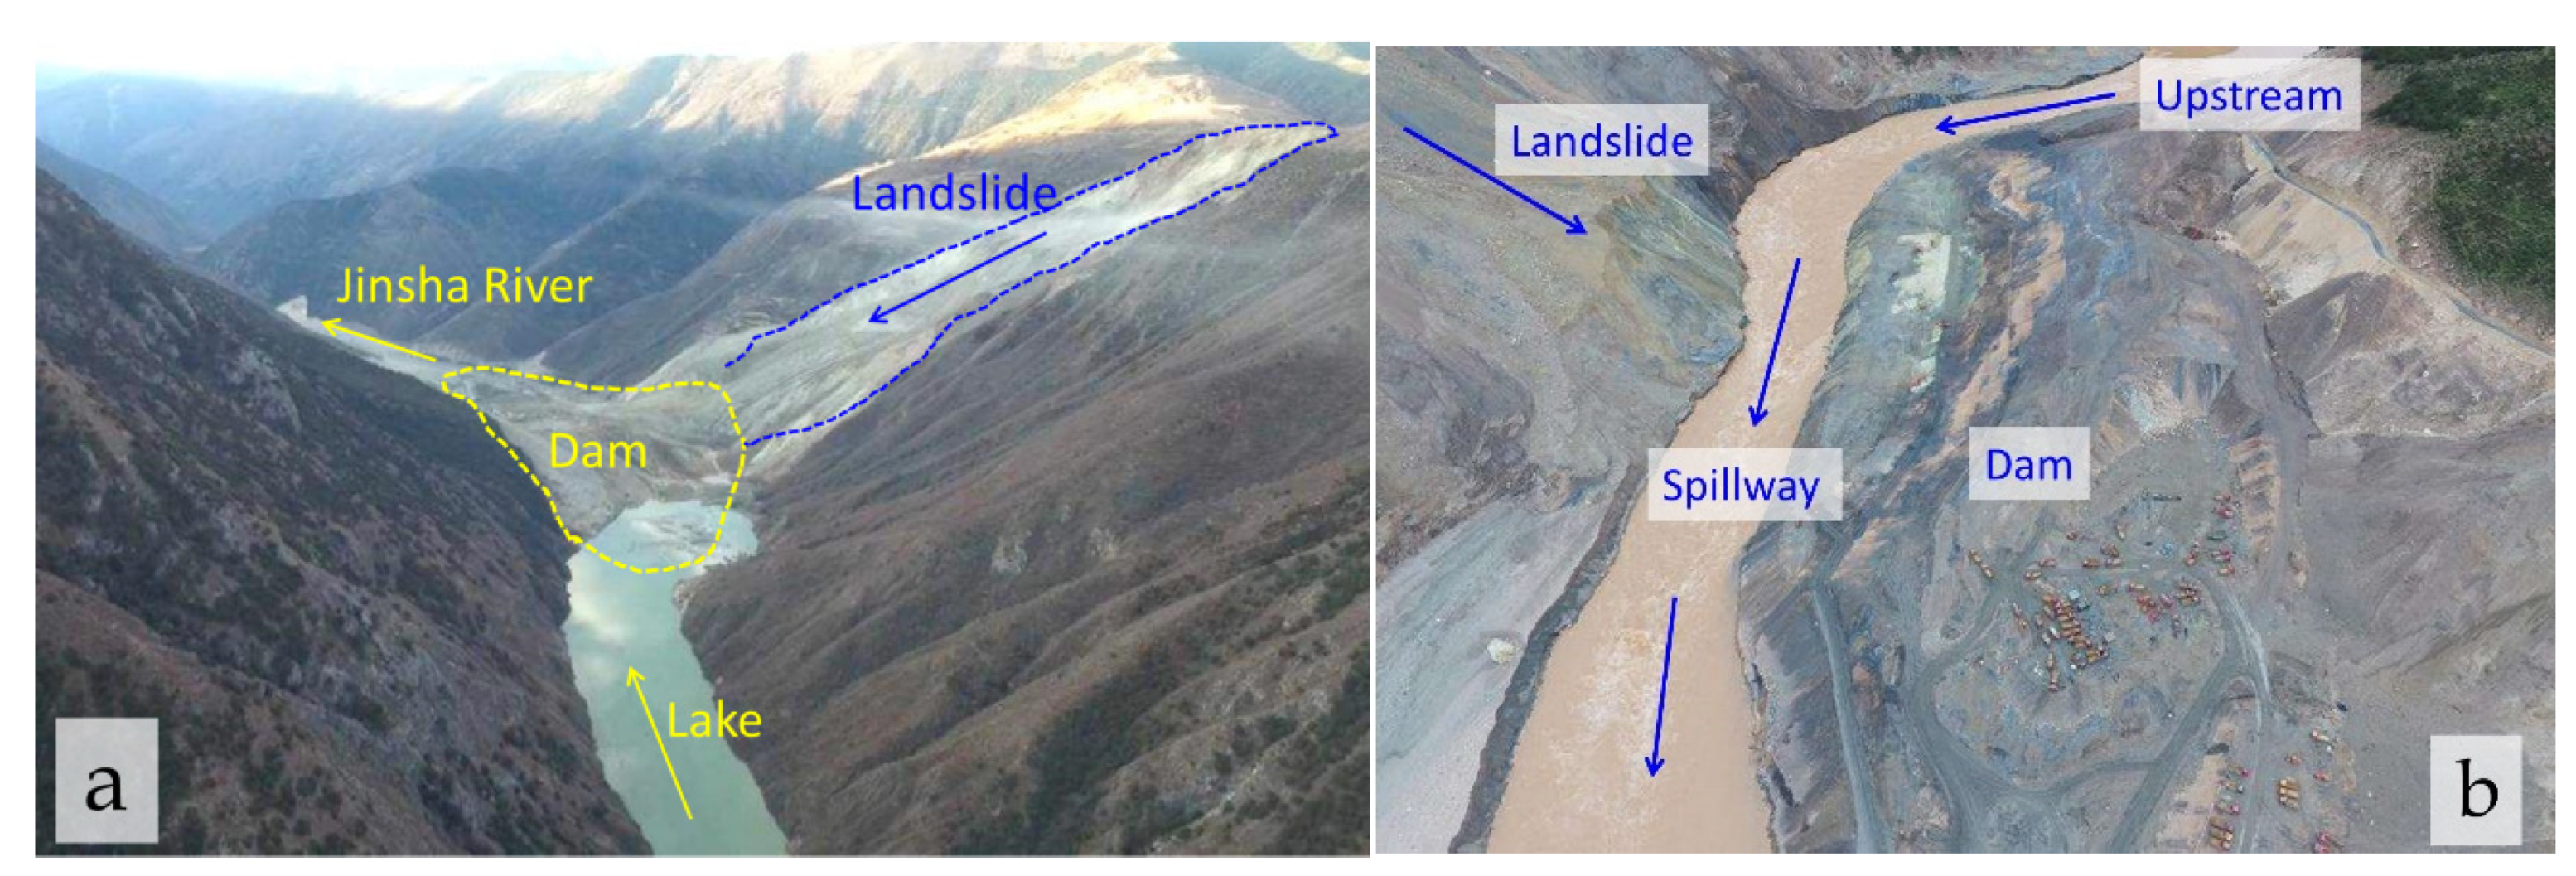
On 10 October 2018 and 3 November 2010, a large-scale landslide occurred in Baige (98°41′52.15″ E, 31°4′54.91″ N) within the boundaries of Jiangda County in Tibet and Baiyu County in Sichuan Province, blocking the main stream of Jinsha River and forming a barrier lake (Figure 3). After that, overtopping failure occurred (Figure 4), causing serious threat and loss to the upstream and downstream affected areas. Zhang et al. [9] investigated the two dam failure events of Baige landslide and obtained detailed dam failure data (Table 4).
This study model and models in Table 2 are used to simulate the peak discharge of two landslide dams. The simulated results are shown in Table 5. It can be seen from Table 5 that the simulated values of the peak discharge of this study model and Peng et al. [19] are more reasonable, but the simulated effect of this study model is still significantly better than that of Peng et al. [19], while there is a large gap between the simulated results of other models and the measured peak discharge, especially for the landslide dam failure event on 3 November, the simulated relative error is more than 90%.
4. Conclusions
The purpose of this study is to obtain the calculated model for peak discharge of landslide dam failure based on 67 historical landslide dam failure cases all over the world. The key conclusions are:
- (1)
- The calculated model for peak discharge of landslide dam failure is proposed, which can consider the dam erodibility, the final shape of the breach, the shape of the dam, the lake volume and other parameters at the same time.
- (2)
- Compared with other models, the calculated peak discharge of this model are more close to measured peak discharge. In addition, the model needs 12 parameters to calculate the breach depth, breach bottom width, breach top width and breach peak discharge, whereas the model proposed by Peng et al. needs 17 parameters.
- (3)
- The model proposed in this paper is used to simulate the peak discharge of two dam failure events of Baige landslide in Jinsha River (10 October 2018 and 3 November 2018). The relative error of peak discharge simulation of the two events is 0.73% and 6.68%, respectively, which is obviously better than other models, indicating that the simulated effect of the model is reasonable.
Finally, new cases of landslide dam failure should be added in the future study to further modify the model. This study can provide an important theoretical reference for disaster prevention and mitigation of landslide dam.
Author Contributions
Conceptualization, H.R., H.C. and T.W.; methodology, H.C., T.W. and J.C.; validation, H.R., H.C. and H.L.; formal analysis, H.R. and H.C.; investigation, H.R., J.C., T.W. and H.L.; writing—original draft preparation, H.R.; writing—review and editing, H.C. and T.W.; supervision, H.C.; project administration, H.C.; funding acquisition, H.C. All authors have read and agreed to the published version of the manuscript.
Funding
This research was funded by Key Research Program of Frontier Sciences, CAS (grant QYZDY-SSW-DQC006), the National Natural Science Foundation of China (grant 41731283, 41771045). and Foundation of Youth Innovation Promotion Association, CA S (grant 2017425).
Institutional Review Board Statement
The study did not involve humans or animals.
Informed Consent Statement
The study did not involve humans.
Data Availability Statement
The study did not report any data. All data used in the study are from Table A1.
Conflicts of Interest
All authors declare no conflict of interest.
Abbreviations
| Hd | Dam height |
| V1 | Volume of dammed lake |
| Wd | Dam width |
| Vd | Volume of landslide dam |
| hb | Breach depth |
| Wt | Breach top width |
| Wb | Breach bottom width |
| Qp | Peak discharge of landslide dam failure |
| PE | Potential energy of water |
| d | Height at which the water level drops during a dam outbreak |
| g | Acceleration of gravity |
| a | Erodibility coefficient of landslide dam |
| H | High erodibility of the landslide dam |
| M | Moderate erodibility of the landslide dam |
| L | Low erodibility of the landslide dam |
| Hr | Unit length, Hr = 1 m |
| q | Combinative parameter of the cross section of breach |
| Ml | Slope ratio of left side of the breach |
| Mr | Slope ratio of right side of the breach |
| Wu | Characteristic parameterof initial breach water depth |
| W | Characteristic parameter of the breach water depth |
| λ | Parameter determined by the erodibility of landslide dam |
| ξ | Parameter determined by the erodibility of landslide dam |
| α | Parameter determined by the erodibility of landslide dam |
| β | Parameter determined by the erodibility of landslide dam |
| MRE | Mean relative error |
| RMSE | Standard deviation |
| R2 | Coefficient of determination |
Appendix A

Table A1.
Historical case data of landslide dam failure. “H” refers to the high erodibility of the landslide dam, “M” refers to the moderate erodibility of the landslide dam, “L” refers to the low erodibility of the landslide dam.
Table A1.
Historical case data of landslide dam failure. “H” refers to the high erodibility of the landslide dam, “M” refers to the moderate erodibility of the landslide dam, “L” refers to the low erodibility of the landslide dam.
| No. | Name | Location | Data of Formation | Dam Height Hd (m) | Dam Width Wd (m) | Dam Volume Vd (×106 m3) | Lake Volume Vl (×106 m3) | Dam Erodbility | Breach Depth hb (m) | Breach Top Width Wt(m) | Breach Bottom Width Wb(m) | Peak Discharge Qp (m3/s) | References |
|---|---|---|---|---|---|---|---|---|---|---|---|---|---|
| 1 | Tsatichhu | Bhutan | 10 September 2003 | 110 | 700 | 5 | 1.5 | H | - | - | - | 6900 | [56] |
| 2 | Arida River, Hanazono Village | Papua New Guinea | 11 November 1985 | 200 | 3000 | 200 | 50 | H | 70 | - | - | 8000 | [57] |
| 3 | Bireh-Ganga River | India | 22 September 1983 | 274 | 2750 | 286 | 460 | H | 97.5 | - | - | 56,650 | [39,42] |
| 4 | Mantaro River | Peru | 16 August 1945 | 133 | 580 | 3.5 | 301 | H | 56 | - | - | 35,400 | [58] |
| 5 | Mt Adams | New Zealand | 6 October 1999 | 90 | 700 | 12.5 | 6 | H | 45 | 125 | 45 | 2500 | [59,60] |
| 6 | Nishi River, Totsugawa Village | Japan | 20 August 1889 | 20 | 120 | 0.63 | 0.4 | H | - | 1100 | [18,61] | ||
| 7 | Tanggudong | China | 8 June 1967 | 175 | 3000 | 68 | 680 | H | - | 55 | 53,000 | [62] | |
| 8 | Tegermach River | USSR | 1853 | 120 | 60 | 20 | 6.6 | H | - | 310 | 55 | 4960 | [39,63] |
| 9 | Totsu River, Daito Village | Japan | 20 August 1889 | 18 | 450 | 0.036 | 0.78 | H | - | - | - | 3400 | [18,61] |
| 10 | Totsu River, Daito VIllage | Japan | 20 August 1889 | 10 | 380 | 0.23 | 0.93 | H | - | - | - | 3500 | [18,61] |
| 11 | Totsu River, Nakatotsugawa Village | Japan | 20 August 1889 | 7 | 250 | 0.073 | 0.65 | H | - | - | - | 6900 | [18,61] |
| 12 | Arida River, Hanazono Village | Japan | 18 July 1953 | 10 | 150 | 0.18 | 0.047 | H | - | - | - | 890 | [18,61] |
| 13 | Yigong | China | 9 April 2000 | 80 | 2350 | 300 | 3000 | H | 58.39 | - | 128 | 124,000 | [64] |
| 14 | Tanggudong | China | 8 June 1967 | 175 | 3000 | 68 | 680 | H | 53,000 | [12] | |||
| 15 | Lantianwang | China | 10 June 1786 | 70 | 1400 | 40 | 50 | H | 37,345 | [12,65] | |||
| 16 | Cordillera de Santa Cruz | Argentina | November 2005 | 15 | 355 | 12 | 0.0041 | H | 1000 | [66] | |||
| 17 | Ambon Island | Indonesia | July 2012 | 140 | 1660 | 170 | 25 | H | 17,000 | [67] | |||
| 18 | Indus valleynear the Nanga Parbat | Pakistan | December 1840 | 150 | 30,000 | 30,000~50,000 | H | 509,000 | [68] | ||||
| 19 | Donghekou | China | 12 May 2008 | 20 | 750 | 12 | 6 | M | 10 | 25 | 15 | 1000 | [69] |
| 20 | East Fork Hood River | America | 25 December 1980 | 10.7 | 225 | 0.085 | 0.105 | M | - | - | - | 850 | [18,39] |
| 21 | Hime River | Japan | 9 August 1911 | 60 | 500 | 1.9 | 16 | M | - | - | - | 1800 | [18,61] |
| 22 | Hongshihe | China | 12 May 2008 | 50 | 500 | 18 | 4 | M | 10 | 9 | 500 | [69] | |
| 23 | Iketsu River | Japan | 19 August 1889 | 140 | 180 | 3.4 | 26 | M | - | - | - | 480 | [18,61] |
| 24 | Kaminirau River | America | 26 July 1788 | 50 | 500 | 2 | 2.2 | M | - | - | - | 440 | [18,61] |
| 25 | Kano River, Kitatotsugawa Village | Japan | 20 August 1889 | 15 | 130 | 0.094 | 1.3 | M | - | - | - | 1600 | [18,61] |
| 26 | Kano River, Totsugawa Village | Japan | 20 August 1889 | 20 | 120 | 0.1 | 0.6 | M | - | - | - | 1300 | [18,61] |
| 27 | La Josefina | Ecuado | 29 March 1993 | 100 | 1100 | 20 | 200 | M | 43 | - | - | 10,000 | [42,70] |
| 28 | Mantaro River | Peru | 25 April 1974 | 175 | 3800 | 1300 | 670 | M | 107 | 243 | - | 10,000 | [71] |
| 29 | Naka River, Kaminaka Town | Japan | 25 July 1892 | 80 | 330 | 3.3 | 75 | M | - | - | - | 5600 | [18,61] |
| 30 | Nishi River, Totsugawa Village | Japan | 20 August 1889 | 20 | 200 | 0.6 | 1.3 | M | - | - | - | 980 | [18,61] |
| 31 | Nishi River, Totsugawa Village | Japan | 20 August 1889 | 25 | 250 | 0.63 | 1.8 | M | - | - | - | 1200 | [18,61] |
| 32 | Pilsque River | Ecuado | 2 January 1990 | 58 | 450 | 1 | 2.5 | M | 30 | 50 | 700 | [42,72] | |
| 33 | Ram Creek | New Zealand | 24 May 1968 | 40 | 1200 | 2.8 | 1.1 | M | 30 | - | 30 | 1000 | [73] |
| 34 | Rio Paute | Ecuado | 29 March 1993 | 112 | 800 | 25 | 210 | M | - | - | 8250 | [74] | |
| 35 | Rio Toro River | Costa Rica | 13 June 1992 | 85 | 600 | 3 | 0.5 | M | 40 | 60 | - | 400 | [75] |
| 36 | Susobana River | Japan | 24 March 1847 | 54 | 250 | 1.2 | 16 | M | - | - | - | 510 | [18,61] |
| 37 | Tangjiashan | China | 12 May 2008 | 82 | 611.8 | 20.37 | 246.6 | M | 30 | 190 | 90 | 6500 | [4,76] |
| 38 | Totsu River, Amakawa Village | Japan | 20 August 1889 | 80 | 350 | 2.5 | 17 | M | - | - | - | 2400 | [18,61] |
| 39 | Totsu River, Daito Village | Japan | 21 August 1889 | 80 | 750 | 13 | 40 | M | - | - | - | 2000 | [18,61] |
| 40 | Totsu River, Kitatotsugawa Village | Japan | 20 August 1889 | 110 | 690 | 3.1 | 42 | M | - | - | - | 4800 | [18,61] |
| 41 | Unawaea Landslide Dam | New Zealand | 17 August 1991 | 70 | 550 | 4 | 0.9 | M | - | - | - | 250 | [42] |
| 42 | Upstream Xiaogangjian | China | 12 May 2008 | 95 | 300 | 2 | 12 | M | 30 | 80 | - | 3950 | [77] |
| 43 | Xiaojiaqiao | China | 12 May 2008 | 62 | 200 | 2.42 | 20 | M | 37.3 | 131.6 | 8 | 1000 | [78] |
| 44 | Zepozhu, Dong River | China | 27 October 1965 | 51 | 650 | 29 | 2.7 | M | - | - | - | 560 | [39,62] |
| 45 | Hongshiyan | China | 3 August 2014 | 83~96 | 262 | 12 | 260 | M | - | - | - | 7420 | [7] |
| 46 | Sunkoshi landslide dam | Nepal | 2 August 2014 | 52 | 300 | 2 | 11.1 | M | - | - | - | 6346 | [79] |
| 47 | Hsiaolin village | China | 9 August 2009 | 44 | 1500 | 15.4 | 9.9 | M | - | - | - | 2974 | [5] |
| 48 | Tsao-Ling | China | 21 September 1999 | 50 | 150 | 120 | 46 | M | - | - | - | 7422 | [80] |
| 49 | Xuelongnang | China | Ancient | 84 | 680 | - | 310 | M | 33 | - | - | 10,168~16,091 | [53] |
| 50 | Wenjaiba | China | 12 May 2008 | 50 | 700 | 6 | 5 | M | - | - | - | 2300 | [81] |
| 51 | Yibadao | China | 12 May 2008 | 25 | 100 | 0.15 | 3.79 | M | - | - | - | 2153/2355 | [82] |
| 52 | Laoyingyan | China | 12 May 2008 | 100 | 500 | 4.7 | 5 | M | - | - | - | 1700 | [83] |
| 53 | Qingyandong | China | 21 June 2005 | 30 | 0.3 | 1.5 | M | 6.5 | - | 30 | 500 | [84] | |
| 54 | Downstream Xiaogangjian | China | 12 May 2008 | 30 | 150 | 3.5 | 7 | M | - | 34.6 | - | 3900 | [85] |
| 55 | Hattian Bala Landslide Dam | Pakistan | 8 October 2005 | 130 | 1587 | 65 | 62 | M | - | - | - | 5500 | [6,86] |
| 56 | Baige 1 | China | 10 October 2018 | 61 | 1500 | - | 249 | M | - | - | - | 10,000 | [9] |
| 57 | Baige 2 | China | 3 November 2018 | 81 | 1000 | - | 494 | M-L | - | - | - | 33,900 | [9] |
| 58 | Arida River, Hanazono Village | Japan | 20 July 1953 | 60 | 500 | 2.6 | 17 | L | - | - | - | 750 | [18,61] |
| 59 | Jackson Creek Lake | America | 18 May 1980 | 4.5 | 302.5 | 0.77 | 2.47 | L | - | - | - | 477 | [18] |
| 60 | Ojika River | Japan | 1 August 1683 | 70 | 400 | 3.8 | 64 | L | - | - | - | 620 | [18,61] |
| 61 | Sai River | Japan | 24 March 1847 | 82.5 | 1000 | 21 | 350 | L | - | - | - | 3700 | [18,61] |
| 62 | Shiratani River, Totsugawa Village | Japan | 21 August 1889 | 190 | 500 | 10 | 38 | L | - | - | - | 580 | [18,61] |
| 63 | Sho River | Japan | 29 November 1586 | 100 | 600 | 19 | 150 | L | - | - | - | 1900 | [18,61] |
| 64 | Tangjiawang | China | 12 May 2008 | 35 | 800 | 4 | 7/15.2 | L | - | - | - | 974 | [87] |
| 65 | Suya | China | 17 July 2012 | 4.3 | 300 | 0.6 | 4.1 | L | - | - | - | 338 | [88] |
| 66 | Kuitun River | China | 15 July 1978 | 10 | 150 | 0.75 | 1.67 | L | - | - | - | 917 | [89] |
| 67 | Paree Chu | India | 26 June 2005 | 40 | 1100 | - | 64 | L | - | - | - | 2000 | [90] |
References
- Ali, R.; Kuriqi, A.; Kisi, O. Human-Environment Natural Disasters Interconnection in China: A Review. Climate 2020, 8, 48. [Google Scholar] [CrossRef] [Green Version]
- Shen, G.; Sheng, J.; Xiang, Y.; Zhong, Q.; Yang, D. Numerical Modeling of Overtopping-Induced Breach of Landslide Dams. Nat. Hazards Rev. 2020, 21, 04020002. [Google Scholar] [CrossRef]
- Singh, K. Rainfall Thresholds Triggering Landslides: A Review. In Sustainable Environment and Infrastructure; Springer: Berlin/Heidelberg, Germany, 2020. [Google Scholar]
- Hu, X.W.; Huang, R.; Shi, Y.B.; Lu, X.P.; Zhu, H.Y.; Wang, X.R. Analysis of blocking river mechanism of tangjiashan landslide and dam-breaking mode of its barrier dam. Chin. J. Rock Mech. Eng. 2009, 28, 181–189. [Google Scholar]
- Dong, J.-J.; Li, Y.-S.; Kuo, C.-Y.; Sung, R.-T.; Li, M.-H.; Lee, C.-T.; Chen, C.-C.; Lee, W.-R. The formation and breach of a short-lived landslide dam at Hsiaolin village, Taiwan—part I: Post-event reconstruction of dam geometry. Eng. Geol. 2011, 123, 40–59. [Google Scholar] [CrossRef]
- Konagai, K.; Sattar, A. Partial breaching of Hattian Bala Landslide Dam formed in the 8th October 2005 Kashmir Earthquake, Pakistan. Landslides 2011, 9, 1–11. [Google Scholar] [CrossRef]
- Wang, L.; Li, S.Y.; Yu, S.; Du, X.H.; Deng, G. Key techniques for the emergency disposal of Hongshiyan landslide dam. J. China Inst. Water Resour. Hydropower Res. 2015, 13, 284–289. [Google Scholar]
- Zhong, Q.; Chen, S.; Mei, S.; Cao, W. Numerical simulation of landslide dam breaching due to overtopping. Landslides 2018, 15, 1183–1192. [Google Scholar] [CrossRef]
- Zhang, L.; Xiao, T.; He, J.; Chen, C. Erosion-based analysis of breaching of Baige landslide dams on the Jinsha River, China, in 2018. Landslides 2019, 16, 1965–1979. [Google Scholar] [CrossRef]
- Zhong, Q.; Chen, S.; Shan, Y. Prediction of the overtopping-induced breach process of the landslide dam. Eng. Geol. 2020, 274, 105709. [Google Scholar] [CrossRef]
- Islam, A.R.M.; Talukdar, S.; Mahato, S.; Kundu, S.; Eibek, K.U.; Pham, Q.; Kuriqi, A.; Limh, N. Flood susceptibility modelling using advanced ensemble machine learning models. Geosci. Front. 2021, 12, 101075. [Google Scholar] [CrossRef]
- Dai, F.C.; Lee, C.F.; Deng, J.H.; Tham, L.G. The 1786 earthquake-triggered landslide dam and subsequent dam-break flood on the Dadu River, southwestern China. Geomorphology 2005, 65, 205–221. [Google Scholar] [CrossRef]
- Delaney, K.B.; Evans, S.G. The 2000 Yigong landslide (Tibetan Plateau), rockslide-dammed lake and outburst flood: Review, remote sensing analysis, and process modelling. Geomorphology 2015, 246, 377–393. [Google Scholar] [CrossRef]
- Xu, W.-J.; Xu, Q.; Wang, Y.-J. The mechanism of high-speed motion and damming of the Tangjiashan landslide. Eng. Geol. 2013, 157, 8–20. [Google Scholar] [CrossRef]
- Xiong, Z.; Feng, G.; Feng, Z.; Miao, L.; Wang, Y.; Yang, D.; Luo, S. Pre- and post-failure spatial-temporal deformation pattern of the Baige landslide retrieved from multiple radar and optical satellite images. Eng. Geol. 2020, 279, 105880. [Google Scholar] [CrossRef]
- Shi, Z.M.; Zhang, G.D.; Peng, M.; Liu, S.Y. Study on the pemeability and stability of landslide dam materials. J. Eng. Geol. 2017, 25, 1182–1189. [Google Scholar]
- Costa, J.; Schuster, R. Formation and failure of natural dams. Geol. Soc. Am. Bull. 1988, 100, 1054–1068. [Google Scholar] [CrossRef]
- Costa, J.E.; Schuster, R.L. Documented historical landslide dams from around the world. US Geol. Surv. Open File Rep. 1991, 91–239. [Google Scholar]
- Peng, M.; Zhang, L. Breaching parameters of landslide dams. Landslides 2012, 9, 13–31. [Google Scholar] [CrossRef]
- Fread, D.L. The Development and Testing of a Dam-Break Flood Forecasting Model. In Proceedings of the Dam-Break Flood Routing Model Workshop, Bethesda, MD, USA, 18–20 October 1977; pp. 164–197. [Google Scholar]
- Fread, D. BREACH: An Erosion Model for Earthen Dam Failures; US National Weather Service, Office of Hydrology: Silver Spring, MD, USA, 1988; p. 35.
- Singh, V.; Quiroga, C. A dam-breach erosion model: I. Formulation. Water Resour. Manag. 1987, 1, 177–197. [Google Scholar] [CrossRef]
- Visser, P. Breach growth in sand-dikes. Elibrary 1998, 98, 465. [Google Scholar]
- Tingsanchali, T.; Chinnarasri, C. Numerical modelling of dam failure due to flow overtopping. Hydrol. Sci. J. 2001, 46, 113–130. [Google Scholar] [CrossRef]
- Bowles, D. Estimating Life Loss for Dam Safety Risk Assessment—A Review and New Approach; Institute For Water Resources Us Army Corps Of Engineers: Washington, DC, USA, 2002. [Google Scholar]
- Hanson, G.J.; Cook, K.R.; Hunt, S.L. Physical modeling of overtopping erosion and breach formation of cohesive embankments. Trans. Am. Soc. Agric. Eng. 2005, 48. [Google Scholar] [CrossRef]
- Temple, D.M.; Hanson, G.J.; Neilsen, M.; Cook, K.R. Simplified breach analysis model for homogeneous embankments: Part I, Background and model components. In Proceedings of the 25th Annual USSD Conference, Denver, CO, USA, 6–10 June 2005; pp. 151–161. [Google Scholar]
- Wang, Z.; Bowles, D. Three-dimensional non-cohesive earthen dam breach model. Part 1: Theory and methodology. Adv. Water Resour. 2006, 29, 1528–1545. [Google Scholar] [CrossRef]
- Zhu, Y. Breach Growth in Clay Dikes. Trans. Am. Soc. Agric. Eng. 2005, 48. [Google Scholar] [CrossRef]
- Faeh, R. Numerical Modeling of Breach Erosion of River Embankments. J. Hydraul. Eng. Asce 2007, 133. [Google Scholar] [CrossRef]
- Wu, W.; Wang, S. One-Dimensional Modeling of Dam-Break Flow Over Movable Beds. J. Hydraul. Eng. Asce 2007, 133. [Google Scholar] [CrossRef]
- Ponce, V.; Tsivoglou, A. Modeling Gradual Dam Breaches. Asce J. Hydraul. Div. 1981, 107, 829–838. [Google Scholar] [CrossRef]
- Chang, D.S.; Zhang, L. Simulation of the Erosion Process of Landslide Dams Due to Overtopping Considering Variations in Soil Erodibility along Depth. Nat. Hazards Earth Syst. Sci. 2010, 10. [Google Scholar] [CrossRef] [Green Version]
- Cao, Z.; Yue, Z.; Pender, G. Landslide dam failure and flood hydraulics. Part I: Experimental investigation. Nat. Hazards 2011, 59, 1003–1019. [Google Scholar] [CrossRef]
- Liu, J. The investigation of earth dam-breaking sediment hydrograph (1)—Impact factors and secondary fluctuations. Chin. J. Appl. Mech. 2020, 37, 2257–2264. [Google Scholar]
- Kirkpatrick, G.W. Evaluation guidelines for spillway adequacy. Eval. Dam Saf. 1977, 3, 395–414. [Google Scholar]
- Macdonald, T.C.; Langridge-Monopolis, J. Breaching characteristics of dam failures. J. Hydraul. Eng. 1984, 110, 567–586. [Google Scholar] [CrossRef]
- Singh, K.; Snorrason, Á. Sensitivity of outflow peaks and flood stages to the selection of dam breach parameters and simulation models. J. Hydrol. 1984, 68, 295–310. [Google Scholar] [CrossRef]
- Costa, J.E. Floods from dam failures. Open File Rep. 1985, 5, 85–560. [Google Scholar]
- Froehlich, D.C.; Froehlich, D.C.; Froehlich, D. Peak Outflow from Breached Embankment Dam. J. Water Resour. Plan. Manag. 1995, 121, 90–97. [Google Scholar] [CrossRef]
- Webby, M.G. Discussion of Peak Outflow from Breached Embankment Dam by David, C. Froehlich. J. Water Resour. Plan. Manag. 1996, 122, 316–317. [Google Scholar] [CrossRef]
- Walder, J.; O’Connor, J. Methods for Predicting Peak Discharge of Floods Caused by Failure of Natural and Constructed Dams. Water Resour. Res. 1997, 33. [Google Scholar] [CrossRef]
- Pierce, M.W.; Thornton, C.I.; Abt, S.R. Predicting Peak Outflow from Breached Embankment Dams. J. Hydrol. Eng. 2010, 15, 338–349. [Google Scholar] [CrossRef] [Green Version]
- Hakimzadeh, H.; Nourani, V.; Amini, A.B. Genetic Programming Simulation of Dam Breach Hydrograph and Peak Outflow Discharge. J. Hydrol. Eng. 2014, 19, 757–768. [Google Scholar] [CrossRef]
- Zhou, G.G.D.; Zhou, M.; Shrestha, M.S.; Song, D.; Choi, C.E.; Cui, K.F.E.; Peng, M.; Shi, Z.; Zhu, X.; Chen, H. Experimental investigation on the longitudinal evolution of landslide dam breaching and outburst floods. Geomorphology 2019, 334, 29–43. [Google Scholar] [CrossRef]
- Zhou, M.-j.; Zhou, G.G.D.; Cui, K.F.E.; Song, D.-R.; Lu, X.-Q. Influence of inflow discharge and bed erodibility on outburst flood of landslide dam. J. Mt. Sci. 2019, 16, 778–792. [Google Scholar] [CrossRef]
- Briaud, J.-L. Case Histories in Soil and Rock Erosion: Woodrow Wilson Bridge, Brazos River Meander, Normandy Cliffs, and New Orleans Levees. J. Geotech. Geoenviron. Eng. 2008, 134, 1425–1447. [Google Scholar] [CrossRef]
- Cui, P.; Zhu, Y.-Y.; Han, Y.-S.; Chen, X.-Q.; Zhuang, J.-Q. The 12 May Wenchuan earthquake-induced landslide lakes: Distribution and preliminary risk evaluation. Landslides 2009, 6, 209–223. [Google Scholar] [CrossRef]
- Froehlich, D. Embankment dam breach parameters revisited. Int. Water Resour. Eng. Conf. Proc. 1995, 1, 887–891. [Google Scholar]
- Froehlich, D. Embankment Dam Breach Parameters and Their Uncertainties. J. Hydraul. Eng. Asce 2008, 134. [Google Scholar] [CrossRef]
- Elmazoghi, H. Fuzzy algorithm for estimating average breach widths of embankment dams. Nat. Hazards 2013, 68. [Google Scholar] [CrossRef] [Green Version]
- Wang, B.; Chen, Y.; Wu, C.; Dong, J.; Ma, X.; Song, J. A semi-analytical approach for predicting peak discharge of floods caused by embankment dam failures: Semi-Analytical Model for Predicting Peak Discharge of Dam-Break Flood. Hydrol. Process. 2016, 30. [Google Scholar] [CrossRef]
- Liu, H. The Numerical Simulation Study of Outburst Floodevolution for Xuelongnang Paleolandslide Dam; China University of Geosciences: Beijing, China, 2016. [Google Scholar]
- Tacconi Stefanelli, C.; Segoni, S.; Casagli, N.; Catani, F. Geomorphic indexing of landslide dams’ evolution. Eng. Geol. 2016, 208. [Google Scholar] [CrossRef] [Green Version]
- Tacconi Stefanelli, C.; Segoni, S.; Casagli, N.; Catani, F. Assessing Landslide Dams Evolution: A Methodology Review; Springer: Cham, Switerland, 2017; pp. 253–257. [Google Scholar]
- Dunning, S.; Rosser, N.; Petley, D.; Massey, C. Formation and failure of the Tsatichhu landslide dam, Bhutan. Landslides 2006, 3, 107–113. [Google Scholar] [CrossRef]
- King, J.; Loveday, I.; Schuster, R. The 1985 Bairaman landslide dam and resulting debris flow, Papua New Guinea. Q. J. Eng. Geol. Hydrogeol. 1989, 22, 257–270. [Google Scholar] [CrossRef]
- Snow, D.T. Landslide of Cerro Condor-Sencca, Department of Ayacucho, Peru. Geol. Soc. Am. Rev. Eng. Geol. 1964, 5, 1–6. [Google Scholar] [CrossRef]
- Becker, J.; Johnston, D.; Paton, D.; Hancox, G.; Davies, T.; McSaveney, M.; Manville, V. Response to Landslide Dam Failure Emergencies: Issues Resulting from the October 1999 Mount Adams Landslide and Dam-Break Flood in the Poerua River, Westland, New Zealand. Nat. Hazards Rev. 2007, 8. [Google Scholar] [CrossRef]
- Hancox, G.T.; McSaveney, M.J.; Manville, V.R.; Davies, T.R. The October 1999 Mt Adams rock avalanche and subsequent landslide dam-break flood and effects in Poerua river, Westland, New Zealand. N. Z. J. Geol. Geophys. 2005, 48, 683–705. [Google Scholar] [CrossRef] [Green Version]
- Tong, Y.X. Quantitative Analysis for Stability of Landslide Dams; National Central University: Taoyuan, Taiwan, 2008. (In Chinese) [Google Scholar]
- Li, T.C.; Schuster, R.L.; Wu, J.S. Landslide dams in south-central China. Landslide Dams Process. Risk Mitig. 1986, 3, 146–162. [Google Scholar]
- Glazyrin, G.Y.; Reyzvikh, V.N. Computation of the flow hydrograph for the breach of landslide lakes. Sov. Hydrol. 1968, 5, 592–596. [Google Scholar]
- Shang, Y.; Yang, Z.; Li, L.; Liu, D.a.; Liao, Q.; Wang, Y. A super-large landslide in Tibet in 2000: Background, occurrence, disaster, and origin. Geomorphology 2003, 54, 225–243. [Google Scholar] [CrossRef]
- Gu, J.; Wang, Y.S.; Cao, W.Z.; Zhang, L.; Huang, J.L.; He, J.X.; Liu, Y. Formation mechanism and motion process of lantianwan landslide triggered by the 1786 Moxi earthquake. Mt. Res. 2016, 34, 520–529. [Google Scholar]
- Perucca, L.P.; Esper Angillieri, M.Y. Evolution of a debris-rock slide causing a natural dam: The flash flood of Río Santa Cruz, Province of San Juan—12 November 2005. Nat. Hazards 2009, 50, 305–320. [Google Scholar] [CrossRef]
- Ishizuka, T.; Kaji, A.; Morita, K.; Mizuyama, T. Analysis for a Landslide Dam Outburst Flood in Ambon Island, Indonesia. Int. J. Eros. Control Eng. 2017, 10, 32–38. [Google Scholar] [CrossRef] [Green Version]
- Schneider, J.; Gruber, F.; Mergili, M. Recent Cases and Geomorphic Evidence of Landslide-Dammed Lakes and Related Hazards in the Mountains of Central Asia. Landslide Sci. Pract. Risk Assess. Manag. Mitig. 2013, 6. [Google Scholar] [CrossRef]
- Chang, D.S.; Zhang, L.; Xu, Y. Analysis of overtopping failure of Hongshihe Landslide dam after Wenchuan earthquake. J. Eng. Geol. 2009, 17, 51–55. [Google Scholar]
- Plaza, G.; Zevallos, O. The 1993 La Josefina rockslide and Rio Paute landslide dam, Ecuador. Landslide News 1994, 8, 4–6. [Google Scholar]
- Lee, K.L.; Duncan, J.M. Landslide of April 25, 1974, on the Mantaro River, Peru: Report of Inspection; The National Academies Press: Washington, DC, USA, 1975; p. 81. [Google Scholar] [CrossRef]
- Plaza-Nieto, G.; Yepes, H.; Schuster, R.L. Landslide dam on the Plsque river, northern Ecuador. Landslide News 1990, 4, 2–4. [Google Scholar]
- Nash, T.; Bell, D.; Davies, T.; Nathan, S. Analysis of the formation and failure of Ram Creek landslide dam, South Island, New Zealand. N. Z. J. Geol. Geophys. 2008, 51, 187–193. [Google Scholar] [CrossRef]
- Canuti, A.; Frassoni, A.; Natale, L. Failure of the Rio Paute landslide dam. Landslide News 1993, 8, 6–7. [Google Scholar]
- Mora Castro, S. The 1992 Río Toro landslide dam, Costa Rica. Landslide News 1993, 7, 19–22. [Google Scholar]
- Huang, M.H.; Jin, F.; Yang, W.J. Breaching flood simulation of tangjiashan landslide dam. In Proceedings of the 2008 Annual Conference of Chinese Hydraulic Engineering Society, Beijing, China, 4 July 2008; pp. 964–966. [Google Scholar]
- Liu, N.; Zhang, J.; Lin, W.; Cheng, W.; Chen, Z. Draining Tangjiashan Barrier Lake after Wenchuan Earthquake and the flood propagation after the dam break. Technol. Sci. 2009, 52, 801–809. [Google Scholar] [CrossRef]
- Liang, J. Formation of seismic barrier lake and its harnessing scheme. In Proceedings of the Analysis and Investigation on Seismic Damages to Projects Subjected to Wenchuan Earthquake, Wenchuan, China, 12 May 2009; pp. 1056–1061. [Google Scholar]
- Shrestha, B.B.; Nakagawa, H. Hazard assessment of the formation and failure of the Sunkoshi landslide dam in Nepal. Nat. Hazards 2016, 82, 2029–2049. [Google Scholar] [CrossRef]
- Li, M.-H.; Hsu, M.-H.; Hsieh, L.-S.; Teng, W.-H. Inundation Potentials Analysis for Tsao-Ling Landslide Lake Formed by Chi-Chi Earthquake in Taiwan. Nat. Hazards 2002, 25, 289–303. [Google Scholar] [CrossRef]
- Dai, R.Q.; Yan, K.A.; Zhou, F. Construction of emergency danger removal project of Wenjiaba barrier lake in Pingwu, Sichuan. Yangtze River 2008, 39, 7–8. [Google Scholar]
- Jiang, L.K.; Zhang, S.S.; Huang, L.W.; Liu, F. Preliminary study on engineering geology of yibadao barrier lake and its emergency treatment. In Proceedings of the Investigation and Analysis of Earthquake Damage in Wenchuan Earthquake Engineering, Wenchuan, China, 12 May 2009; pp. 1041–1049. [Google Scholar]
- He, X.R. Summary on emergency disposal of laoyingyan dammed lake in Anxian County. In Proceedings of the Investigation and Analysis of Earthquake Damage in Wenchuan Earthquake Engineering, Wenchuan, China, 8 January 2009; pp. 1019–1022. [Google Scholar]
- Xu, T.H. Example of danger removal of Qingyandong landslide dam in Daning River. Resour. Environ. Eng. 2008, 22, 162–163. [Google Scholar]
- He, B.S.; Wang, Y.J.; Wei, J.J.; Zhang, S.C. Site investigation and analysis of 14 barrier lakes in Sichuan earthquake stricken area. China Flood Drought Manag. 2010, 20, 36–42. [Google Scholar]
- Dunning, S.A.; Mitchell, W.A.; Rosser, N.J.; Petley, D.N. The Hattian Bala rock avalanche and associated landslides triggered by the Kashmir Earthquake of 8 October 2005. Eng. Geol. 2007, 93, 130–144. [Google Scholar] [CrossRef]
- Shi, D.G.; Wang, M.T.; Yin, D.L.; Li, Q.C.; Chen, S.Y. Formation mechanism and stability evaluation of Tangjiawan barrier dam. In Proceedings of the Investigation, Analysis and Research on Engineering Damage of Wenchuan Earthquake, Wenchuan, China, 5 February 2009; pp. 1066–1073. [Google Scholar]
- Bao, G.H. Hydrological emergency monitoring and thinking of Suya barrier lake in Mile County. In Proceedings of the 3rd 9th Council of Yunnan Water Conservancy Society and 2013 academic exchange meeting, Yuxi, China, 11 February 2013. [Google Scholar]
- Tang, S.Z. Preliminary study on sudden flood of “87.7” barrier lake in Kuitun River of Tianshan Mountain. Xinjiang Water Resour. 2011, 2011, 37–42. [Google Scholar]
- Vikram Gupta, M.P.S. Impact of flood discharge from a barrier lake across the Himalayas in the Satluj basin of Himachal Pradesh, India. Inf. Hydrogeol. Eng. Geol. Technol. 2008, 1, 1–8. [Google Scholar]
Figure 1.
Schematic diagram of dam shape.

Figure 2.
Comparison of calculated results of different models. (a,b) are separated from the same figure, because if all models are put into the same graph with too many data points, it is difficult to distinguish the calculation accuracy of each model.
Figure 2.
Comparison of calculated results of different models. (a,b) are separated from the same figure, because if all models are put into the same graph with too many data points, it is difficult to distinguish the calculation accuracy of each model.

Figure 3.
Location of Baige landslide. The figure comes from Zhang et al. (2019) [9].
Figure 3.
Location of Baige landslide. The figure comes from Zhang et al. (2019) [9].

Figure 4.
Baige landslide blocking the river on October 10, 2010. (a) is the panorama before the landslide dam break, and (b) is the top view of the dam crest when the landslide dam break.
Figure 4.
Baige landslide blocking the river on October 10, 2010. (a) is the panorama before the landslide dam break, and (b) is the top view of the dam crest when the landslide dam break.

Table 1.
Calculation parameters of peak discharge of landslide dam with different erodibility. “H” refers to the high erodibility of the landslide dam, “M” refers to the moderate erodibility of the landslide dam, “L” refers to the low erodibility of the landslide dam.
Table 1.
Calculation parameters of peak discharge of landslide dam with different erodibility. “H” refers to the high erodibility of the landslide dam, “M” refers to the moderate erodibility of the landslide dam, “L” refers to the low erodibility of the landslide dam.
| Dam Erodibility | λ | ξ | α | β |
|---|---|---|---|---|
| H | 0.27 | 4.554 | 0.283 | 0.433 |
| M | 0.15 | 5.641 | 0.047 | 0.532 |
| L | 0.07 | 0.7247 | 0.404 | 0.612 |
Table 2.
Empirical formula for peak discharge of landslide dam burst flood.
| Empirical Formula | Note | References |
|---|---|---|
| Hd: Dam height (m). | Costa (1985) [39] | |
| V1: Volume of dammed lake (m3). | Costa (1985) [39] | |
| Hd: Dam height (m). V1: Volume of dammed lake (m3). | Costa (1985) [39] | |
| Vl: Volume of dammed lake (m3). | Walder and O’Connor (1997) [42] | |
| g: The acceleration of gravity (m/s2). Hd: Dam height (m). Hr = 1 m; V1: Volume of dammed lake (m3). a: Erodibility coefficient. When the dam erodibility is high, medium and low, a is 1.236, −0.380 and −1.615 respectively. | Peng and Zhang (2012) [19] |
Table 3.
Comparison of calculated effects of flood peak discharge calculation model.
| Model | References | MRE | RMSE (m3/s) | R2 |
|---|---|---|---|---|
| This study | - | 0.48 | 4387 | 0.995 |
| Peng and Zhang (2012) [19] | 0.50 | 12,227 | 0.963 | |
| Costa (1985) [39] | 1.49 | 44,479 | 0.510 | |
| Costa (1985) [39] | 1.34 | 29,943 | 0.778 | |
| Costa (1985) [39] | 3.12 | 62,412 | 0.035 | |
| Walder and O’Connor (1997) [42] | 1.32 | 48,278 | 0.423 |
Table 4.
Parameters of Baige landslide dam on Jinsha River in 2018.
| Dam Failure Events | Dam Erodibility | Dam Height hd (m) | Volume of Dammed Lake Vl (×106 m3) | Data Sources |
|---|---|---|---|---|
| 10 October 2018 | M | 61 | 49 | Zhang et al. [9] |
| 3 November 2018 | M-H | 81 | 494 |
Table 5.
Simulated results of peak discharge of two dam breaks in Baige of Jinsha River in 2018.
| Prediction Model | Peak Discharge (m3/s) | Relative Error (%) | ||
|---|---|---|---|---|
| 10 October 2018 | 3 November 2018 | 10 October 2018 | 3 November 2018 | |
| This study | 9927 | 31,634 | 0.73 | 6.68 |
| 7999 | 30,528 | 20.01 | 9.95 | |
| 11,369 | 17,244 | 13.69 | 94.91 | |
| 14,765 | 21,670 | 47.65 | 93.61 | |
| 4345 | 6821 | 56.55 | 97.99 | |
| 11,651 | 15,967 | 16.51 | 95.29 | |
| Measured peak discharge | 10,000 | 33,900 | -- | -- |
Publisher’s Note: MDPI stays neutral with regard to jurisdictional claims in published maps and institutional affiliations. |
© 2021 by the authors. Licensee MDPI, Basel, Switzerland. This article is an open access article distributed under the terms and conditions of the Creative Commons Attribution (CC BY) license (http://creativecommons.org/licenses/by/4.0/).
Share and Cite
MDPI and ACS Style
Ruan, H.; Chen, H.; Wang, T.; Chen, J.; Li, H. Modeling Flood Peak Discharge Caused by Overtopping Failure of a Landslide Dam. Water 2021, 13, 921. https://doi.org/10.3390/w13070921
AMA Style
Ruan H, Chen H, Wang T, Chen J, Li H. Modeling Flood Peak Discharge Caused by Overtopping Failure of a Landslide Dam. Water. 2021; 13(7):921. https://doi.org/10.3390/w13070921
Chicago/Turabian StyleRuan, Hechun, Huayong Chen, Tao Wang, Jiangang Chen, and Huibin Li. 2021. "Modeling Flood Peak Discharge Caused by Overtopping Failure of a Landslide Dam" Water 13, no. 7: 921. https://doi.org/10.3390/w13070921
Note that from the first issue of 2016, this journal uses article numbers instead of page numbers. See further details here.