
Geometric Model of a Coastal Aquifer to Promote the Sustainable Use of Water. Manglaralto, Ecuador

 , , , and
Abstract
:1. Introduction
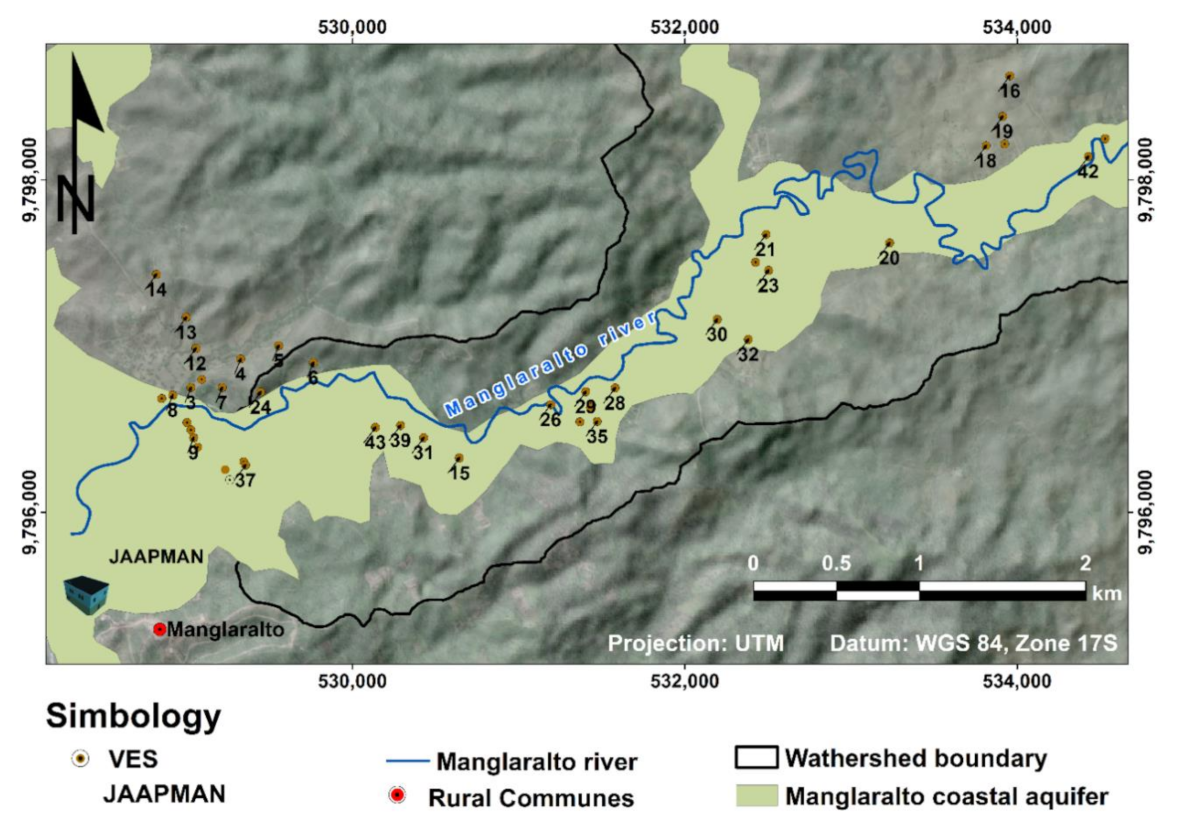
The Study Case
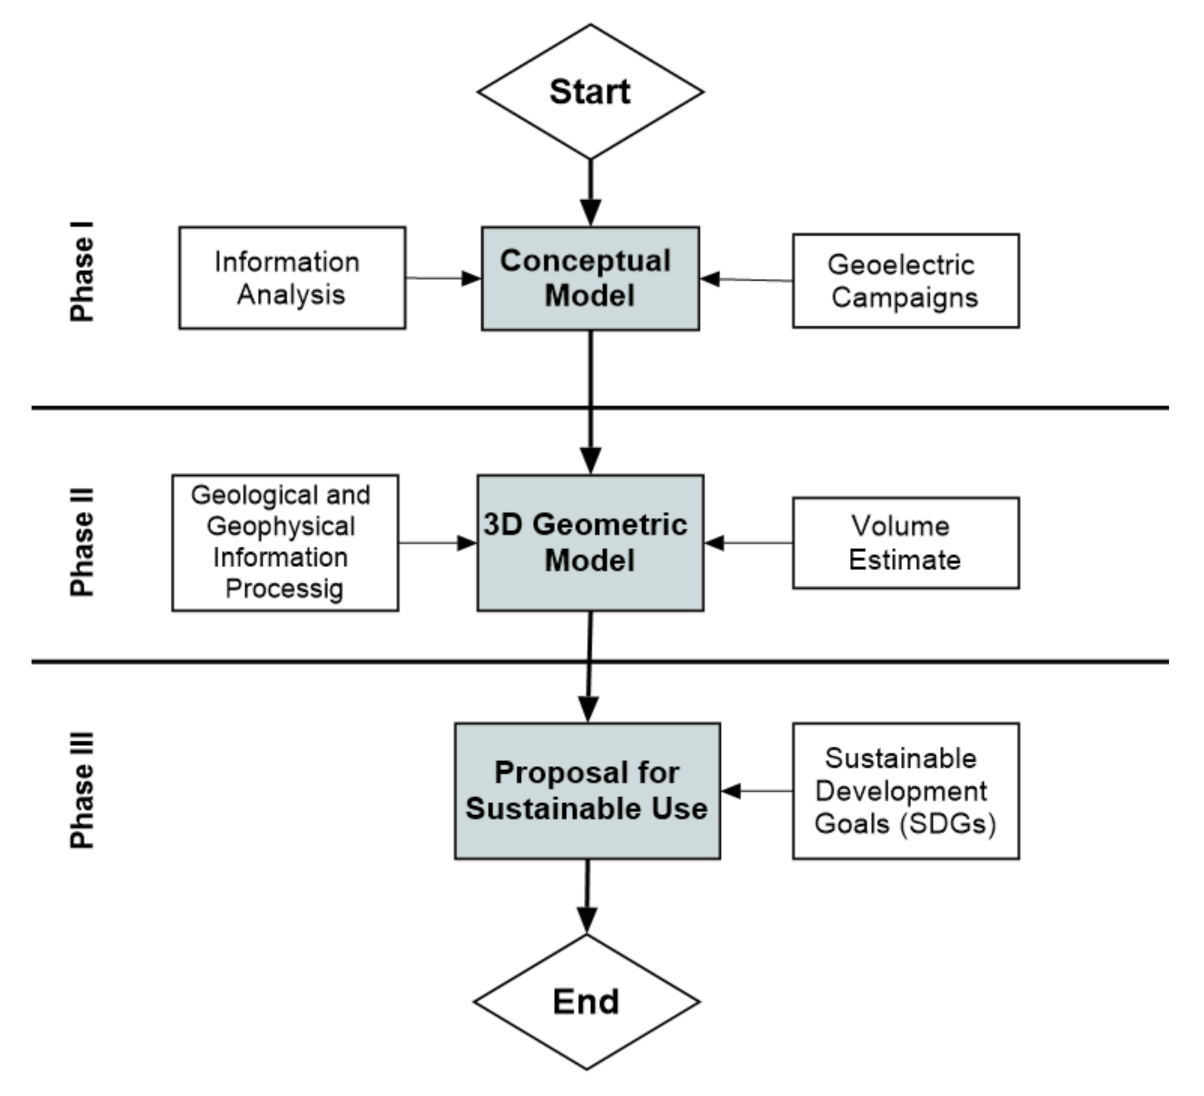
2. Materials and Methods
2.1. First Phase
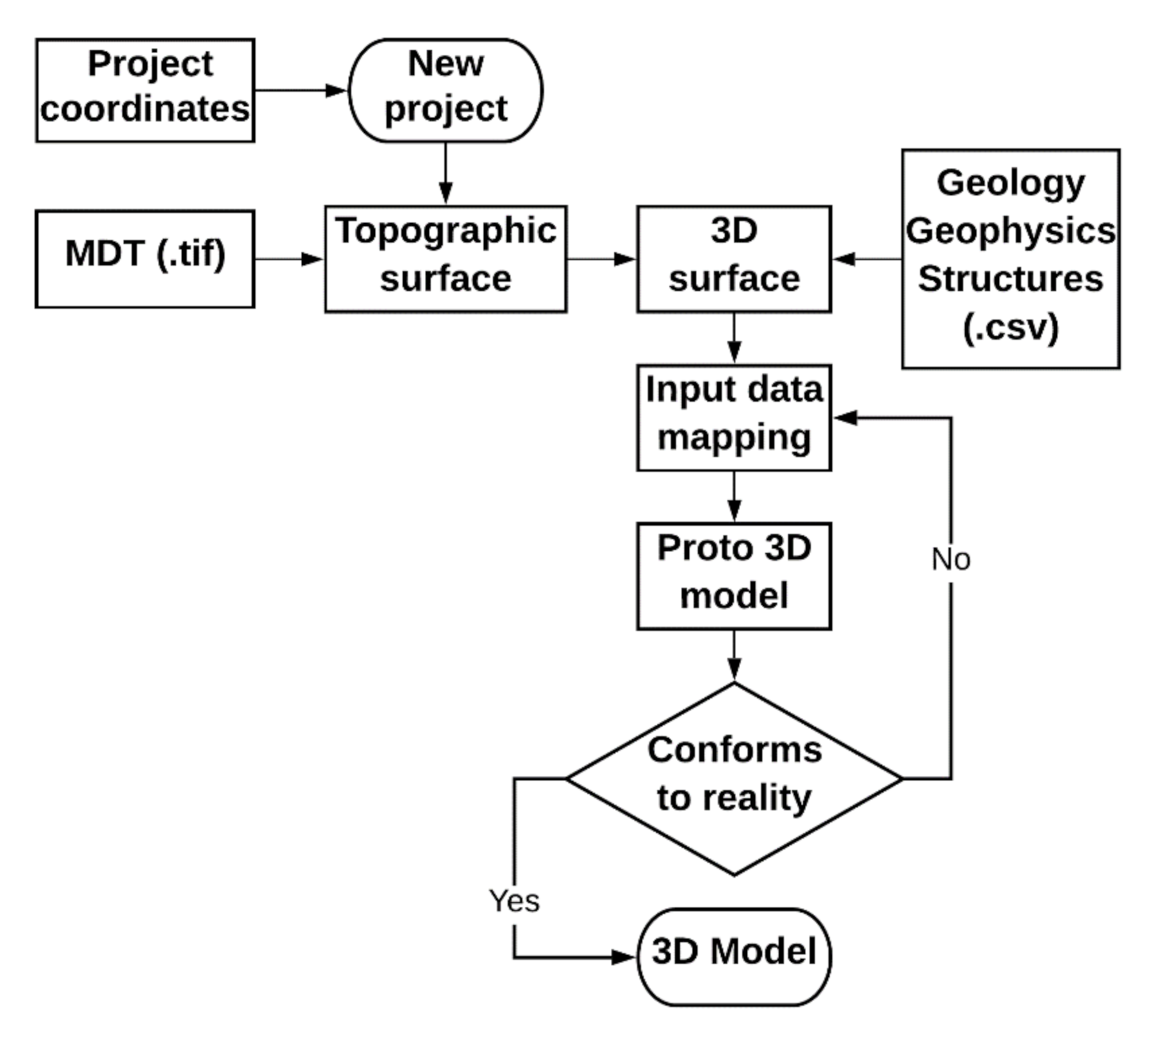
2.2. Second Phase
2.3. Third Phase
3. Results
3.1. Information Synthesis
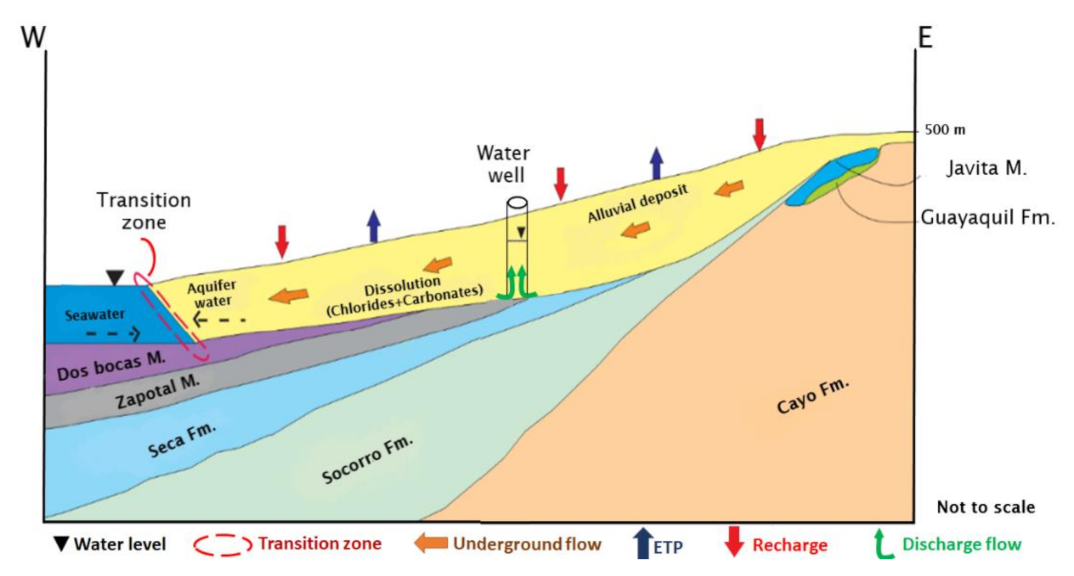
3.2. Geometric Model
3.3. Sustainable Use Proposals
- Goal 1: The Manglaralto sector is a rural area of poverty in Ecuador. Moreover, there is no government responsibility for water supply.
- Goal 6: Year after year, JAAPMAN has increased accessibility to essential services such as drinking water and sewerage, to the attached communities; besides which, the central socio-economic axis of the parish is the river–aquifer system.
- Goal 13: Due to changes in weather patterns, rising sea levels, and extreme weather events (droughts/floods), it is necessary to evaluate the conditions of the Manglaralto coastal aquifer.
- Goal 15: Manglaralto, because it depends economically on groundwater, is obliged to protect its basin. Reforestation projects have been undertaken throughout the basin once a year. Thanks to the Ministry of the Environment, the basin’s upper part (beginning) has been named a Reserve, which guarantees protected forests that help against climate change.
4. Discussion
5. Conclusions
Supplementary Materials
Author Contributions
Funding
Institutional Review Board Statement
Informed Consent Statement
Data Availability Statement
Acknowledgments
Conflicts of Interest
References
- Ge, L.; Anten, N.P.R.; van Dixhoorn, I.D.E.; Feindt, P.H.; Kramer, K.; Leemans, R.; Meuwissen, M.P.M.; Spoolder, H.; Sukkel, W. Why we need resilience thinking to meet societal challenges in bio-based production systems. Curr. Opin. Environ. Sustain. 2016, 23, 17–27. [Google Scholar] [CrossRef]
- Vannevel, R.; Goethals, P.L. Identifying Ecosystem Key Factors to Support Sustainable Water Management. Sustainability 2020, 12, 1148. [Google Scholar] [CrossRef] [Green Version]
- Jounaid, H.; Attou, T.; Remmal, T.; Bouaziz, A. Securing Access to Drinking Water in North-Eastern Morocco: The Example of the Taourirt-Oujda Corridor. Water 2020, 12, 928. [Google Scholar] [CrossRef] [Green Version]
- UNDAES (United Nations Department of Economic and Social Affairs). World Population Prospects: The 2017 Review, Key Findings and Advance Tables; Working Paper No. ESA/P/WP/248; UNDAES: New York, NY, USA, 2017. [Google Scholar]
- UNGWAP (UNESCO Global Water Assessment Programme). United Nations World Report on Water Development 2019: Leave No One Behind; UNESCO: Paris, France, 2019. [Google Scholar]
- Ceola, S.; Montanari, A.; Krueger, T.; Dyer, F.; Kreibich, H.; Westerberg, I.; Carr, G.; Cudennec, C.; Elshorbagy, A.; Savenije, H.; et al. Adaptation of water resources systems to changing society and environment: A statement by the International Association of Hydrological Sciences. Hydrol. Sci. J. 2016, 61, 2803–2817. [Google Scholar] [CrossRef] [Green Version]
- Intergovernmental Panel on Climate Change. Climate Change 2014: Impacts, Adaptation and Vulnerability. Working Group II Contribution to the IPCC Fifth Assessment Report. Available online: http://www.ipcc.ch/report/ar5/wg2 (accessed on 3 May 2020).
- Rodriguez-Sanchez, C.; Sarabia-Sanchez, F.J. Does Water Context Matter in Water Conservation Decision Behaviour? Sustainability 2020, 12, 3026. [Google Scholar] [CrossRef] [Green Version]
- WHO (World Health Organization). Guides for the Quality of Water for Human Consumption, 4th ed.; WHO Graphics: Geneva, Switzerland, 2017. [Google Scholar]
- Burek, P.; Satoh, Y.; Fischer, G.; Kahil, M.T.; Scherzer, A.; Tramberend, S.; Nava, L.F.; Wada, Y.; Eisner, S.; Flörke, M.; et al. Water Futures and Solution-Fast Track Initiative (Final Report); IIASA Working Paper: Laxenburg, Austria, 2016. [Google Scholar]
- Setegn, S.; Melesse, A.; Haiduk, A.; Webber, D.; Wang, X.; McClain, M. Modeling hydrological variability of fresh water resources in the Rio Cobre watershed, Jamaica. Catena 2014, 120, 81–90. [Google Scholar] [CrossRef]
- Duran-Llacer, I.; Munizaga, J.; Arumí, J.L.; Ruybal, C.; Aguayo, M.; Sáez-Carrillo, K.; Arriagada, L.; Rojas, O. Lessons to Be Learned: Groundwater Depletion in Chile’s Ligua and Petorca Watersheds through an Interdisciplinary Approach. Water 2020, 12, 2446. [Google Scholar] [CrossRef]
- Chatton, E.; Aquilina, I.; Pételet-Giraud, E.; Cary, I.; Bertrand, G.; Labasque, T.; Hirata, R.; Martins, V.; Montenegro, S.; Vergnaud, V.; et al. Glacial recharge, salinisation and anthropogenic contamination in the coastal aquifers of Recife (Brazil). Sci. Total Environ. 2016, 569–570, 1114–1125. [Google Scholar] [CrossRef]
- Famiglietti, J. The global groundwater crisis. Nat. Clim. Chang. 2014, 4, 945–948. [Google Scholar] [CrossRef]
- Lezzaik, K.; Milewski, A.; Mullen, J. The groundwater risk index: Development and application in the Middle East and North Africa region. Sci. Total Environ. 2018, 628–629, 1149–1164. [Google Scholar] [CrossRef]
- Ferguson, G.; Gleeson, T. Vulnerability of coastal aquifers to groundwater use and climate change. Nat. Clim. Chang. 2012, 2, 342–345. [Google Scholar] [CrossRef]
- Werner, A.D.; Bakker, M.; Post, V.E.A.; van den Bohede, A.; Lu, C.; Ataie-Ashtiani, B.; Simmons, C.T.; Barry, D.A. Seawater intrusion processes, investigation and management: Recent advances and future challenges. Adv. Water Resour. 2013, 5, 3–26. [Google Scholar] [CrossRef]
- Seyam, M.; Alagha, J.S.; Abunama, T.; Mogheir, Y.; Affam, A.C.; Heydari, M.; Ramlawi, K. Investigation of the Influence of Excess Pumping on Groundwater Salinity in the Gaza Coastal Aquifer (Palestine) Using Three Predicted Future Scenarios. Water 2020, 12, 2218. [Google Scholar] [CrossRef]
- Correa, G. Access to water, poverty, and development in Colombia. J. Univ. Salle 2017, 72, 27–46. [Google Scholar]
- Amer, R.; Ripperdan, R.; Wang, T.; Encarnación, J. Groundwater quality and management in arid and semi-arid regions: Case study, Central Eastern Desert of Egypt. J. Afr. Earth Sci. 2012, 69, 13–25. [Google Scholar] [CrossRef]
- Allow, A.K. The use of injection wells and a subsurface barrier in the prevention of seawater intrusion: A modelling approach. Arab. J. Geosci. 2012, 5, 1151–1161. [Google Scholar] [CrossRef]
- Dashora, Y.; Dillon, P.; Maheshwari, B.; Soni, P.; Dashora, R.; Davande, S.; Purohit, R.C.; Mittal, H.K. A simple method using measurements applied to estimate dam recharge in Rajasthan, India. Sustain. Water Resour. Manag. 2017, 4, 301–316. [Google Scholar] [CrossRef]
- Maheshwari, B.; Varua, M.; Ward, J.; Packham, R.; Chinnasamy, P.; Dashora, Y.; Dave, S.; Soni, P.; Dillon, P.; Purohit, R.; et al. The Role of Transdisciplinary Approach and Community Participation in Village Scale Groundwater Management: Insights from Gujarat and Rajasthan, India. Water 2014, 6, 3386–3408. [Google Scholar] [CrossRef] [Green Version]
- Gale, M.I. Techniques for management of aquifer recharge in arid and semi-arid regions. In Proceedings of the Regional Workshop on Management of Aquifer Recharge and Water Harvesting in Arid and Semi-arid Regions of Asia, Yazd, Iran, 27 November 2005. [Google Scholar]
- Brundtland, G. Our Common Future—Call for Action. Environ. Consevr. 1987, 14, 291–294. [Google Scholar] [CrossRef]
- United Nations (UN). The 2030 Agenda and the Sustainable Development Goals: An opportunity for Latin America and the Caribbean. Goals, Targets and Global Indicators; Economic Commission for Latin American and the Caribbean (ECLAC): Santiago, Chile, 2018. [Google Scholar]
- Thornton, J.; Mariethoz, G.; Brunner, P. A 3D geological model of a structurally complex Alpine region as a basis for interdisciplinary research. Sci. Data 2018, 5, 180238. [Google Scholar] [CrossRef]
- Calcagno, P.; Courrioux, G.; Guillen, A.; Fitzgerald, D.; McInerney, P. How 3D implicit geometric modeling helps to understand geology: The 3D GeoModeller Methodology. In XI International Congress, Society for Mathematical Geology; Université de Liège: Liège, Belgium, 2006. [Google Scholar]
- Calcagno, P.; Chilés, J.; Corrioux, G.; Guillen, A. Geological modelling from field data and geological knowledge, Part I—Modelling method coupling 3D potential-field interpolation and geological rules. Phys. Earth Planet. Inter. 2008, 171, 147–157. [Google Scholar] [CrossRef]
- Maxelon, M.; Renard, P.; Courrioux, G.; Brändli, M.; Mancktelow, N. A workflow to facilitate three-dimensional geometrical modelling of complex poly-deformed geological units. Comput. Geosci. 2009, 35, 644–658. [Google Scholar] [CrossRef] [Green Version]
- Moya, C.; Raiber, M.; Cox, M. Three-dimensional geological modelling of the Galilee and central Eromanga basins, Australia: New insights into aquifer/aquitard geometry and potential influence of faults on inter-connectivity. J. Hydrol. Reg. Stud. 2014, 2, 119–139. [Google Scholar] [CrossRef]
- Hassen, I.; Gibson, H.; Hamzaoui-Azaza, F.; Negro, F.; Rachid, K.; Bouhlila, R. 3D geological modeling of the Kasserine Aquifer System, Central Tunisia: New insights into aquifer-geometry and interconnections for a better assessment of groundwater resources. J. Hydrol. 2016, 539, 223–236. [Google Scholar] [CrossRef]
- Di Salvo, C.; Di Luzio, E.; Mancini, M.; Moscatelli, M.; Capelli, G.; Cavinato, G.P.; Mazza, R. GIS-based hydrostratigraphic modeling of the city of Rome (Italy): Analysis of the geometric relationships between a buried aquifer in the Tiber Valley and the confining hydrostratigraphic complexes. Hydrogeol. J. 2012, 20, 1549–1567. [Google Scholar] [CrossRef]
- Sakiyan, J.; Yazicigil, H. Sustainable development and management of an aquifer system in western Turkey. Hydrogeol. J. 2004, 12, 66–80. [Google Scholar] [CrossRef]
- Bingxian, L.; Liangchen, Z.; Guonian, L.; A-Xing, Z. 3D geological modelling based on 2D geological map. Ann. GIS 2018, 23, 117–129. [Google Scholar] [CrossRef] [Green Version]
- Massuel, S.; George, B.; Gaur, A.; Nune, R. Groundwater modeling for sustainable resource management in the Musi Catchment, India. In Proceedings of the International Congress on Modelling and Simulation, Christchurch, New Zealand, 10–13 December 2007. [Google Scholar]
- Nasrin, S.; Zhu, X.; Cartwright, I.; Ailleres, L. Visualization of aquifers for sustainable water management. Environ. Qual. Manag. 2010, 21, 253–274. [Google Scholar] [CrossRef]
- IAEA (International Atomic Energy Agency). Estudios de Hidrología Isotópica en América Latina 2006; Organismo Internacional de Energía Atómica: Vienna, Austria, 2009. [Google Scholar]
- Galárraga-Sánchez, R.; Taco Cañizares, L. Modelado de un acuífero regional andino para determinar sus características y vulnerabilidad: El caso del acuífero del río Cutuchi, Ecuador. In Manejo Integrado de Aguas Subterráneas, 1st ed.; Reynolds, J., Ed.; Universidad Estatal a Distancia (EUNED): San José, Costa Rica, 2002; Volume 1, pp. 189–202. [Google Scholar]
- Herrera, G. Estudio para un Modelo de Gestión de un Acuífero Costero, Mediante Metodologías Participativas y Análisis Geoestadístico en el Marco del Desarrollo Local. Manglaralto, Ecuador. Ph.D. Thesis, Universidad Politécnica de Madrid, Madrid, Spain, 2015. [Google Scholar]
- Carrión, P.; Herrera, G.; Briones, J.; Sánchez, C.; Limón, J. Practical adaptations of ancestral knowledge for groundwater artificial recharge management of Manglaralto coastal aquifer, Ecuador. WIT Trans. Ecol. Environ. 2018, 217, 375–386. [Google Scholar] [CrossRef]
- Valencia, J. Análisis Hidrogeológico de la Cuenca del río Manglaralto Para la Caracterización de Sus Sistemas Acuíferos. Bachelor’s Thesis, ESPOL Polytechnic University, Guayaquil, Ecuador, 2017. [Google Scholar]
- Saeteros, M. Estimación de la Tarifa del Agua de Los Acuíferos Costeros Para la Gestión Sostenible del Recurso. Caso de Estudio: Manglaralto, Santa Elena, Ecuador. Bachelor’s Thesis, ESPOL Polytechnic University, Guayaquil, Ecuador, 2014. [Google Scholar]
- Morante, F.; Montalván, J.F.; Carrión, P.; Herrera, G.; Heredia, J.; Elorza, F.J.; Pilco, D.; Solórzano, J. Hydrochemical and geological correlation to establish the salinity of groundwater of the coastal aquifer of the Manglaralto-Ecuador river basin. WIT Trans. Ecol. Environ. 2019, 229, 139–149. [Google Scholar] [CrossRef] [Green Version]
- Instituto Nacional de Estadísticas y Censo. Reporte de Pobreza por Consumo: Ecuador 2006–2014; Banco Mundial: Quito, Ecuador, 2015.
- Secretaría de Planificación Estratégica del Ecuador (SENPLADES). Plan de Desarrollo y Ordenamiento Territorial-Cantón Santa Elena 2014–2019; Gobierno Autónomo de Santa Elena: Santa Elena, Ecuador, 2015.
- Herrera, G.; Carrión, P.; Briones, J. Prácticas de gestión para una comunidad sostenible y su incidenciaen el desarrollo, Manglaralto-Santa Elena, Ecuador. In Proceedings of the 17th LACCEI International Multi-Conference for Engineering, Education, and Technology: “Industry, Innovation, and Infrastructure for Sustainable Cities and Communities”, Montego Bay, Jamaica, 21–26 July 2019. [Google Scholar]
- Herrera-Franco, G.; Carrión-Mero, P.; Aguilar-Aguilar, M.; Morante-Carballo, F.; Jaya-Montalvo, M.; Morillo-Balsera, M. Groundwater Resilience Assessment in a Communal Coastal Aquifer System. The Case of Manglaralto in Santa Elena, Ecuador. Sustainability 2020, 12, 8290. [Google Scholar] [CrossRef]
- Gricelda, H.F.; Paúl, C.M.; Niurka, A.M. Participatory Process for Local Development: Sustainability of Water Resources in Rural Communities: Case Manglaralto-Santa Elena, Ecuador. In Handbook of Sustainability Science and Research; Springer: Cham, Switzerland, 2018; pp. 663–676. [Google Scholar]
- Herrera, G.; Carrión, P.; Briones, J. Geotourism potential in the context of the geopark project for the development of Santa Elena Province, Ecuador. WIT Trans. Ecol. Environ. 2018, 217, 557–568. [Google Scholar]
- Herrera-Franco, G.; Montalván-Burbano, N.; Carrión-Mero, P.; Apolo-Masache, B.; Jaya-Montalvo, M. Research Trends in Geotourism: A Bibliometric Analysis Using the Scopus Database. Geosciences 2020, 10, 379. [Google Scholar] [CrossRef]
- Mata-Perelló, J.; Carrión, P.; Molina, J.; Villas-Boas, R. Geomining Heritage as a tool to promote the social development of rural communities. Geoheritage 2018, 167–177. [Google Scholar] [CrossRef]
- Herrera-Franco, G.; Carrión-Mero, P.; Alvarado, N.; Morante-Carballo, F.; Maldonado, A.; Caldevilla, P.; Briones-Bitar, J.; Berrezueta, E. Geosites and Georesources to Foster Geotourism in Communities: Case Study of the Santa Elena Peninsula Geopark Project in Ecuador. Sustainability 2020, 12, 4484. [Google Scholar] [CrossRef]
- Álvarez-García, J.; Durán-Sánchez, A.; Del Río-Rama, M.D.C. Scientific Coverage in Community-Based Tourism: Sustainable Tourism and Strategy for Social Development. Sustainability 2018, 10, 1158. [Google Scholar] [CrossRef] [Green Version]
- Gleeson, T.; Wada, Y.; Bierkens, M.; Van Beek, L. Water balance of global aquifers revealed by groundwater footprint. Nature 2012, 488, 197–200. [Google Scholar] [CrossRef] [PubMed]
- Richey, A.; Thomas, B.; Lo, M.; Famiglietti, J.; Swenson, S.; Rodell, M. Uncertainty in global estimates of groundwater storage in a framework of total groundwater stress. Water Resour. Res. 2015, 51, 5198–5216. [Google Scholar] [CrossRef] [PubMed]
- Rodriguez-Estrella, T. The problems of overexploitation of aquifers in semi-arid areas: The Murcia Region and the Segura Basin (South-east Spain) case. Hydrol. Earth Syst. Sci. Discuss. 2012, 9, 5729–5756. [Google Scholar] [CrossRef]
- Burbano, N.; Becerra, S.; Pasquel, E. Introduction to the Hydrogeology of Ecuador, 2nd ed.; INAHMI: Quito, Ecuador, 2015.
- Bacca, J.; Hernández, O.; Vasquez, L. Determinación de la geometría del acuífero de Morrosquillo y geología detallada del acuífero de Toluviejo, Sucre. Geol. Colomb. 2010, 35, 87–101. [Google Scholar] [CrossRef]
- Rey, C.; García, J.; Marín, C.; Reguera, M.; Jiménez, A. Desarrollos Metodológicos en Geología del Subsuelo Para la Caracterización de Recursos Hidrogeológicos Profundos de la Provincia de Alicante (HIDROPROAL); Instituto de Geológico y Minero de España (IGME): Alicante, Spain, 2013. [Google Scholar]
- Marín Lechado, C.; González, A.; Ruiz, A.; Cifuentes, V. El Modelo Geológico 3D del Acuífero de la Loma de Úbeda; SIAGA: Huelva, Spain, 2018. [Google Scholar]
- Gill, B.; Cherry, D.; Adelana, M.; Cheng, X.; Reid, M. Using three-dimensional geological mapping methods to inform sustainable groundwater development in a volcanic landscape, Victoria, Australia. Hydrogeol. J. 2011, 19, 1349–1365. [Google Scholar] [CrossRef]
- Vance, T.C.; Merati, N.; Mesick, S.M.; Moore, C.W.; Wright, D.J. GeoModeller. In Proceedings of the 15th annual ACM international symposium on Advances in geographic information systems-GIS ’07; ACM Press: New York, NY, USA, 2007; p. 1. [Google Scholar]
- UNESCO. Report of the World Commission on the Environment and Development (Brundtland Commission): Our Common Future; United Nations (UN): Washington, DC, USA, 2001. [Google Scholar]
- Statistical Commission on the 2030. Agenda for Sustainable Development. Framework of Global Indicators for the Sustainable Development Goals and 2030 Agenda Targets for Sustainable Development; UNSD: New York, NY, USA, 2017. [Google Scholar]
- Fascículo Provincial de Santa Elena. Available online: https://www.ecuadorencifras.gob.ec/wp-content/descargas/Manu-lateral/Resultados-provinciales/santa_elena.pdf (accessed on 20 April 2020).
- Santa María Suárez, G.; Molina Benavides, L.; Clery Aguirre, A.; Mera Cedeño, M. Mapa Estratégico de las Necesidades de la Provincia de Santa Elena, 1st ed.; Universidad Estatal Península de Santa Elena (UPSE): La Libertad, Ecuador, 2016. [Google Scholar]
- Junta de Agua Regional Valdivia; Corporación La Noble Guadua; Asociación del Manglar De Palmar; Junta de Agua Regional Olón and Fundación Brethren y Unida. Sistematización de la Asociación Para la Intervención en el Biocorredor Chongón Colonche en Busca de Buenvivir; Gobierno Autónomo Descentralizado de Santa Elena: Santa Elena, Ecuador, 2015.
- Ayerza, A. Water importance of the forests of the Chongón- Colonche mountain range for the arid lands of northwest Santa Elena. Zero Latitude Forests 2019, IX, 16–30. [Google Scholar]
- Herrera, G.; Carrión, P.; Yambay, K.; Briones, J. Educational considerations for conservation management and sustainable development of a watershed. Manglaralto, Santa Elena-Ecuador. In Proceedings of the INTED2019 Proceedings; IATED: Valencia, Spain, 2019; Volume 1, pp. 9243–9250. [Google Scholar]
- Gestión de Agua Potable y Alcantarillado. Available online: https://www.ecuadorencifras.gob.ec/documentos/web-inec/Encuestas_Ambientales/Municipios_2017/Agua_potable_alcantarillado-2017/Boletin%20tecnico%20APA%202017.pdf (accessed on 20 April 2020).
- Acosta, M.; Basani, M.; Solís, H. Practices and Knowledge in Community Water Management for Human Consumption; Inter-American Development Bank: Washington, DC, USA, 2019. [Google Scholar]
- Aiello, A.E.; Coulborn, R.M.; Perez, V.; Larson, E.L. Effect of hand hygiene on infectious disease risk in the community setting: A meta-analysis. Am. J. Public Health 2008, 98, 1372–1381. [Google Scholar] [CrossRef]
- Rodríguez-Estrella, T.; Martínenz, M.; Romero, A. Use of existing hydrological correction levees for refilling aquifers and proposed new ones in the Quipar River basin (Southeast of Spain). Ser. Hydrogeol. Undergr. Waters 2006, 17, 413–418. [Google Scholar]
- Cabrera-Estupiñán, E.; Hernández-Valdés, A. Regional groundwater modeling with a local mesh refinement. Algorithm presentation and validation. Tecnol. Cienc. Agua 2011, 2, 65–82. [Google Scholar]
- Van Meter, K.J.; Basu, N.B.; Tate, E.; Wyckof, J. Monsoon Harvests: The Living Legacies of Rainwater Harvesting. Environ. Sci. Technol. 2014, 48, 4217–4225. [Google Scholar] [CrossRef] [PubMed]
- Berndtsson, R.; Jebari, S.; Hashemi, H.; Wessels, J. Traditional water management techniques: Do they have a role in post arab spring middle east? In Hydrological Sciences Journal; Taylor & Francis: Abingdon, UK, 2014. [Google Scholar]
- Banihabib, M.; Hashemi, F.; Shabestari, M. A Framework for Sustainable Strategic Planning of Water Demand and Supply in Arid Regions. Sustain. Dev. 2017, 25, 254–266. [Google Scholar] [CrossRef]
- Ghafoori Kharanagh, S.; Banihabib, M.; Javadi, S. An MCDM-based social network analysis of water governance to determine actors’ power in water-food-energy nexus. J. Hydrol. 2020, 581, 124382. [Google Scholar] [CrossRef]
- Durán-Sánchez, A.; Álvarez-García, J.; Del Río-Rama, M.D.C. Sustainable Water Resources Management: A Bibliometric Overview. Water 2018, 10, 1191. [Google Scholar] [CrossRef] [Green Version]
- Gleitsmann, B.; Kroma, M.; Steenhuis, T. Analysis of a rural water supply project in three communities in Mali: Participation and sustainability. Nat. Resour. Forum 2007, 31, 143–150. [Google Scholar] [CrossRef]


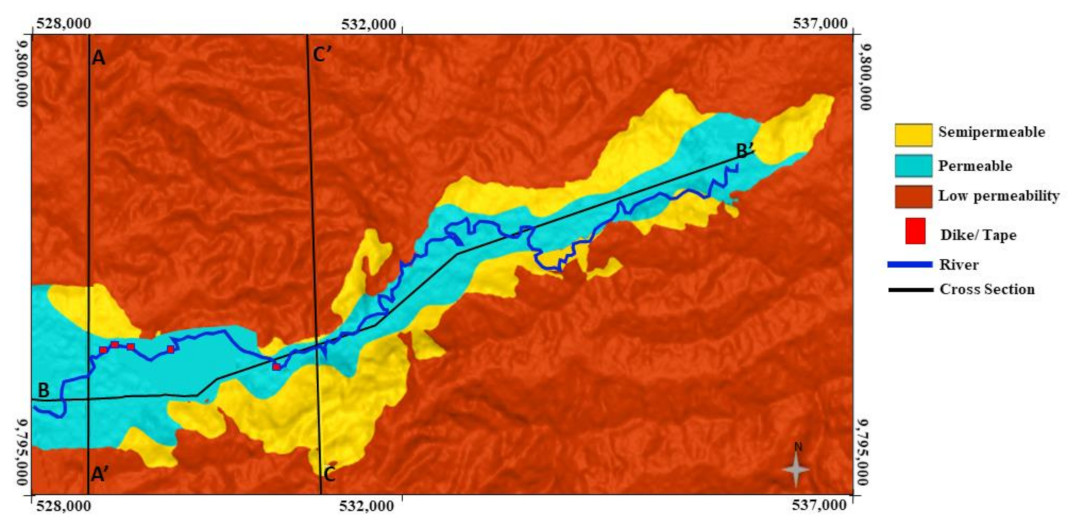
| Limits (UTM/ WGS 84 * Zone 17S) | Minimum (m) | Maximum (m) |
|---|---|---|
| Coordinates X | 528,000 | 537,000 |
| Coordinates Y | 9,795,000 | 9,800,000 |
| Manglaralto River Coastal Aquifer Data | |
|---|---|
| Static level (depth from the surface) | 1.2 to 9.7 m |
| The average porosity of the gravel/sand layer | 22% |
| Darcy’s permeability (“real”) | 1.59–5.15 m/day |
| Well-extraction flow | Rainy season: 12 L/s; dry season: 5 L/s |
| Resistivity (Ω·m) | Thickness (m) | Depth (m) |
|---|---|---|
| 32.2 | 2.5 | 2.5 |
| 5.59 | 30.3 | 32.8 |
| 14.4 | 37.5 | 70.3 |
| 1.07 |
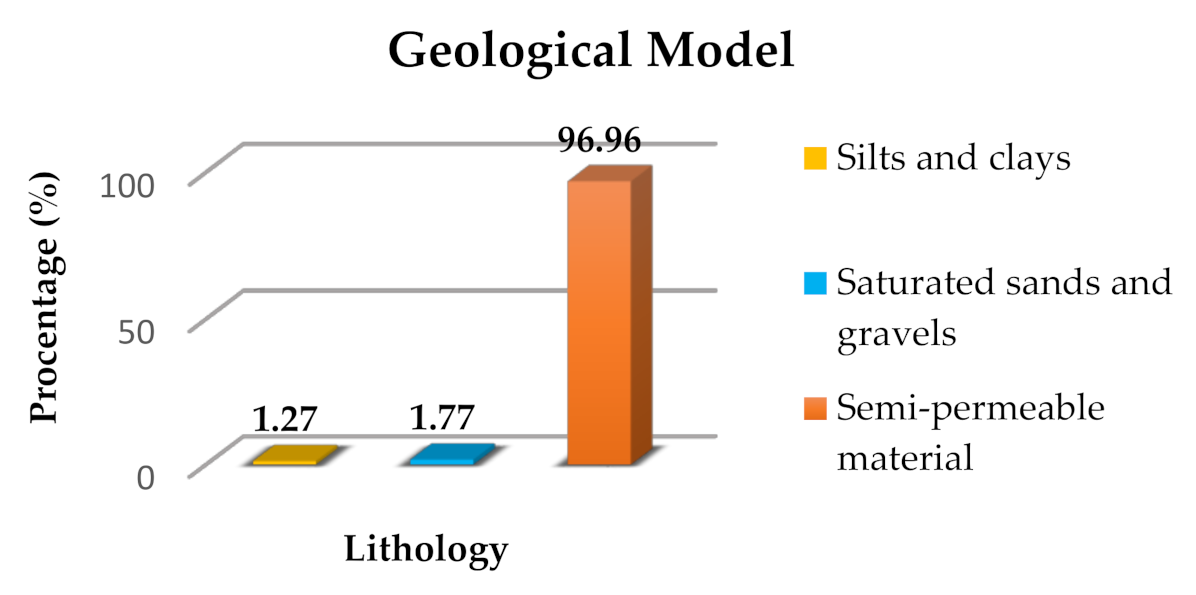
| Lithology | Volume (m3) | Percentage (%) |
|---|---|---|
| Silts and clays | 1.45 × 10⁸ | 1.27 |
| Saturated sands and gravels | 2.03 × 10⁸ | 1.77 |
| Semi-permeable material | 1.11 × 10¹⁰ | 96.96 |
| Factor | Indicator | Indicator Status |
|---|---|---|
| Environmental | Change in the efficient use of water resources over time. (6.4.1) | The geometric model provides an understanding of the aquifer’s horizons and estimates to control the incidence in its use. It is a community project with its members’ participation to control the quality of its waters [47]. |
| The proportion of good-quality water bodies. (6.3.2) | All the JAAPMAN wells (12) are currently located on the south bank of the river at less than 100 m apart. The intense exploitation and the proximity to the coastline have caused the closure of two of them, resulting in only 83% (10 wells) having extracted good-quality water. | |
| In two of the wells closest to the coastline, the extracted water presents high salinity due to marine intrusion caused by the coastal aquifer’s overexploitation [43]. The construction of ‘tapes’ has helped to control this situation. | ||
| The proportion of the population using health services‘ risk-free managed sanitation. (6.2.1) | According to population projections for 2020, 64% of the population attached to JAAPMAN (Montañita, Manglaralto, and Libertador Bolívar) will use the sewerage and wastewater treatment service, with oxidation pools [66,67]. | |
| Strengthened resilience and adaptive capacity to climate-related risks and natural disasters in all countries. (13.1) | Thanks to the joint work of JAAPMAN and the Escuela Superior Politécnica del Litoral (ESPOL) universities through CIPAT-ESPOL, the construction of dykes/’tapes’ has been achieved, which have helped to recharge the coastal aquifer since 2015, thereby gaining some resilience [41,48]. | |
| Cultural | Change in the efficient use of water resources over time. (6.4.1) | Through the construction of five ‘tapes’, shown in Figure 7, the commune’s ancestral knowledge has rescued, since they involve a technical–artisan construction. These retain rainwater and benefit the aquifer recharge [41,49]. |
| The proportion of sites important to terrestrial and freshwater biodiversity included in protected areas. (15.1.2) | Natural areas cover 44.03% of the Manglaralto parish territory natural areas (18,673 has) [45]. This parish has protected areas such as the Chongón–Colonche protective forest, the Dos Mangas nature reserve, and the Loma Alta reserve [68]. These zones allow recharging and help balance the aquifer ecosystem [69]. | |
| Improved education, awareness, and human and institutional capacity regarding climate change mitigation, adaptation, reduction of its effects, and early warnings. (13.3) | Socialization about the water resource’s sustainability and resilience is necessary to create a parish water culture, especially for the new generations [70]. | |
| Social | The population proportion living in households with access to essential services. (1.4.1) | Of the Manglaralto parish homes, 85.6% have electricity, and 92.7% have supplied water managed by the JAAPMAN (public network) [42,70]. |
| Change in the efficient use of water resources over time. (6.4.1) | For the year 2017, the water boards supplied 30.8% of Ecuador’s rural areas [71]. The control of the Manglaralto aquifer is given by JAAPMAN, which is a communal organization that involves the whole of society. Therefore, creating the geometric model allows them to approximate the aquifer horizons to improve management. | |
| Economic | The proportion population using safe, managed drinking water services. (6.1.1) | JAAPMAN complies with the norm of the Ecuadorian Institute of Standardization INEN 1108 (drinking water) and has water treatment for consumption [71]. It provides safe water to approximately 54.1% of the population of the Manglaralto parish (40,000 people including locals and tourists) [72,73]. |
| Level of water stress: freshwater withdrawal in proportion to available freshwater resources. (6.4.2) | An aquifer volume of 13.6 Hm3 has been estimated, with annual water extraction of approximately 685,000 m3. An annual increase of 9% is obtained due to the native and floating population (tourism). There is a deficit in recharging in the sector due to it being a semi-arid climate zone, which projects future water stress if aquifer conservation measures have not taken. |
Publisher’s Note: MDPI stays neutral with regard to jurisdictional claims in published maps and institutional affiliations. |
© 2021 by the authors. Licensee MDPI, Basel, Switzerland. This article is an open access article distributed under the terms and conditions of the Creative Commons Attribution (CC BY) license (http://creativecommons.org/licenses/by/4.0/).
Share and Cite
Carrión-Mero, P.; Quiñonez-Barzola, X.; Morante-Carballo, F.; Montalván, F.J.; Herrera-Franco, G.; Plaza-Úbeda, J. Geometric Model of a Coastal Aquifer to Promote the Sustainable Use of Water. Manglaralto, Ecuador. Water 2021, 13, 923. https://doi.org/10.3390/w13070923
Carrión-Mero P, Quiñonez-Barzola X, Morante-Carballo F, Montalván FJ, Herrera-Franco G, Plaza-Úbeda J. Geometric Model of a Coastal Aquifer to Promote the Sustainable Use of Water. Manglaralto, Ecuador. Water. 2021; 13(7):923. https://doi.org/10.3390/w13070923
Chicago/Turabian StyleCarrión-Mero, Paul, Ximena Quiñonez-Barzola, Fernando Morante-Carballo, F. Javier Montalván, Gricelda Herrera-Franco, and José Plaza-Úbeda. 2021. "Geometric Model of a Coastal Aquifer to Promote the Sustainable Use of Water. Manglaralto, Ecuador" Water 13, no. 7: 923. https://doi.org/10.3390/w13070923