
Grazing Effects on Bovine-Associated and Background Fecal Indicator Bacteria Levels in Edge-of-Field Runoff


1
Oklahoma Water Resources Center, Oklahoma State University, 139 Agricultural Hall, Stillwater, OK 74078, USA
2
Department of Soil and Crop Sciences, Texas A&M University, 370 Olsen Blvd., 2474 TAMU, College Station, TX 77843, USA
3
Center for Agricultural Resources Research, USDA—Agricultural Research Service, 2150 Centre Avenue, Fort Collins, CO 80526, USA
4
USDA—Natural Resources Conservation Service, 400 Community Park Boulevard, Dyersburg, TN 38024, USA
5
Texas A&M AgriLife Extension Service, Department of Soil and Crop Sciences, Texas A&M University, 370 Olsen Blvd., 2474 TAMU, College Station, TX 77843, USA
*
Author to whom correspondence should be addressed.
Water 2021, 13(7), 928; https://doi.org/10.3390/w13070928
Submission received: 29 December 2020
/
Revised: 9 March 2021
/
Accepted: 25 March 2021
/
Published: 29 March 2021
(This article belongs to the Section Water, Agriculture and Aquaculture)
Abstract
:Excessive levels of fecal indicator bacteria are a major cause of water quality impairment. Grazing and its management may significantly impact bacteria concentrations; however, other sources can contribute to water quality issues both in the presence and absence of cattle, thus confounding results. In this study, we utilize Bacteroides markers to evaluate bacteria loading from cattle versus background sources in runoff from rotationally grazed and ungrazed pastures and how grazing management, timing of runoff in relation to grazing events, and stocking rate affect Bacteroides marker (AllBac and BoBac) levels and ratios and their relation to E. coli concentrations in runoff at the small watershed scale. The data suggest that the AllBac and BoBac levels were not significantly impacted by grazing management or stocking rate; however, the timing of runoff events in relation to grazing events significantly impacted the levels of these markers found in runoff. Furthermore, the BoBac/AllBac ratio confirmed that fecal contamination present in runoff when sites were destocked for over two weeks largely originated from sources other than cattle. Thus, the magnitude and proportion of cattle impacts on fecal indicator bacteria in edge-of-field runoff were dramatically reduced shortly after de-stocking. However, background sources continued to contribute significant concentrations of E. coli.
Keywords:
Bacteroides; AllBac; BoBac; E. coli; microbial source tracking; grazing; runoff; water quality; bacteria loading; cattle1. Introduction
Pathogens are the number one cause of water quality impairment in the U.S. [1,2] and are a significant issue globally [3]. In the U.S., total maximum daily loads (TMDLs), TMDL implementation plans, and other watershed-based plans are being developed to address these impairments. However, watersheds can be affected by microbial pollution from a wide variety of sources [2]. Accurate fecal source identification is critical to implementation of best management practices aimed at improving or maintaining water quality [4]. Grazing cattle are often the most abundant species of livestock in impaired watersheds and as such are frequently identified as a source needing reduction [4]. Many papers [5,6,7,8,9] have evaluated the impacts of grazing management on water quality (E. coli); however, other sources can contribute to water quality issues, both in the presence and absence of cattle, thus confounding results.
Wildlife/background sources can be significant E. coli sources as well. Previous studies found that background fecal coliform concentrations in runoff from ungrazed pastures averaged 6600 to 10,000 organisms/100 mL [7,10]. Similarly, E. coli concentrations in runoff from control plots averaged 6800 mpn/100 mL [11]. Another study found that mean E. coli concentrations in runoff at ungrazed sites exceeded 5900 cfu per 100 mL showing that background E. coli sources were considerable [12]. Due to the potential regulatory implications of TMDLs, it is critical to accurately differentiate the potential bacterial contributions of livestock from those of wildlife or humans.
Computer models are frequently used to assess bacterial sources in watersheds; however, current models do not adequately evaluate wildlife contributions due to insufficient data on populations, distribution, and species-specific fecal loading data [12]. Use of microbial source tracking (MST) offers the potential to differentiate between cattle and background contributions and increase sensitivity/accuracy of determining direct grazing management impacts. A number of MST methods have been developed using polymerase chain reaction (PCR) assays, largely targeting members of the Bacteroidales order (Bacteroides species), to identify and quantify the sources of bacteria [13,14]. Bacteroides are non-spore forming, anaerobic bacteria found in high concentrations in intestinal tracts, and thus feces (i.e., >1 × 10¹⁰ cells per gram of feces), of warm-blooded animals [15]. As they are strict anaerobes, Bacteroides generally do not survive long in the environment, thus their presence provides a good indicator of recent fecal contamination of a water body [16,17]. Bacteroides also exhibit a high degree of host specificity [17,18] and moderate sensitivity [18]. Bacteroidales, like E. coli, exhibit a longer persistence with lower temperatures; however, unlike E. coli; they are more persistent with higher salinity. Further, predation is also a controlling factor of Bacteroidales decay, as it is for E. coli [15,16].
Previous MST studies have used Bacteroides markers to detect the presence or absence of Bacteroides and Prevotella spp. fecal bacteria specific to humans, ruminants (including cattle and deer), pigs, and horses by traditional PCR [19,20]. Studies have found the AllBac assay to be a suitable estimator of total fecal contamination and E. coli concentrations in water and the BoBac assay to be a reliable indicator of bovine fecal contamination [17]. Additionally, AllBac and E. coli load rates were found to be highly correlated at baseflow or near baseflow conditions [21].
In this study, we utilize Bacteroides markers to evaluate bacteria loading from cattle versus background sources in runoff from rotationally grazed and ungrazed pastures. Specifically, we evaluate how grazing management, timing of runoff in relation to grazing events, and stocking rate affect Bacteroides marker (AllBac and BoBac) levels and ratios and their relation to E. coli concentrations in runoff at the small watershed scale.
2. Materials and Methods
2.1. Site Descriptions
E. coli and the Bacteroides AllBac and BoBac markers were determined for each runoff event at seven small (approximately 1 hectare) watershed sites in Texas. Two sites, SW12 and SW17, were located at the USDA-ARS Grassland, Soil and Water Research Laboratory in Riesel, TX (Riesel), in the Blackland Prairies ecoregion [22]. These sites, which includes a remnant native prairie (SW12), have been some of the most intensively monitored hydrological research sites in the country since establishment in the 1930s [23]. Two sites, WWR1 and WWR3, were located at the 3156 hectares (7800 acres) Rob and Bessie Welder Wildlife Refuge (Welder), 13 km (8 miles) north of Sinton, TX, in the Western Gulf Coastal Plain ecoregion of Texas [22]. The Refuge has never been cultivated and has historically been managed for livestock [12]. Three sites, BB1, BB2, and BB3, were located at the Texas A&M University Beef Cattle Systems Center (BCSC), located west of College Station, TX in the East Central Texas Plains ecoregion [22]. The BCSC was used primarily for row crop production prior to this study when berms were constructed around three 1 hectare watershed sites and established to Tifton 85 bermudagrass. Precipitation averages 90 cm (36 inches) annually at Riesel and Welder sites and 102 cm (40 inches) at BCSC sites [12].
Three sites were ungrazed (SW12, WWR1, BB1), three were properly stocked (SW17, WWR3, BB2), and one (BB3) had double the stocking rate of the properly stocked BB2 [12]. Properly stocked sites were generally stocked once grass height exceeded 6 inches, and cattle were removed once grass height was reduced to 3 inches. Site BB3 was stocked on the same dates as BB2 but with twice the number of animals to yield the double stocking rate. Site SW12 is notable in that this ungrazed native prairie reference site has not been stocked with cattle or other livestock since the Riesel Research Center was established in 1937 [24]. Stocked sites were rotationally grazed with six to seven grazing events occurring at each site during the course of the study. Grass height was monitored monthly to determine timing of grazing. Properly stocked sites were generally stocked once grass height exceeded 15.2 cm, and cattle were removed once grass height was reduced to 7.6 cm as recommended by the USDA Natural Resources Conservation Service. Grazing periods ranged from an average of 7 days at BB2 and BB3, to 17 days at WWR3 and 76 days at SW17. Rest periods between grazing ranged from an average of 81 days at BB2 and BB3 to 90 days at SW17 and 182 days at WWR3 (due to severe drought during the project). These grazing events allowed evaluation of the impact of a wide range of stocking rates on E. coli runoff. Stocking rates averaged 1.1 animal units (AU)/hectare at SW17, 2.4 AU/hectare at WWR3, 8.8 AU/hectare at BB2, and 16.9 AU/hectare at BB3. It should be noted that electric fences failed on several occasions at the Beef Cattle Systems Center sites. These events were documented and considered in the data analysis. Further, to the extent possible, fecal pats were removed from the ungrazed site (BB1) once power to the fence was restored.
2.2. Edge of Field Sampling Procedures
Flow-weighted composite edge of field runoff samples from the seven watershed sites were collected using ISCO 6712 (ISCO Inc., Lincoln, NE, USA) full-size portable samplers with single bottle configuration into surface disinfected polyethylene 15 L (4 gallons) round bottles [25]. Flow from each watershed site was measured with ISCO 730 Module bubble flow meters. Flow data were downloaded at least monthly using an ISCO 581 Rapid Transfer Device (RTD). BB1, BB2, BB3, WWR1, and WWR3 were equipped with berms and 90° v-notch weirs to aid in collection and measurement of runoff, while SW12 and SW17 were monitored using 0.9 m (3 feet) H-flumes. Runoff was monitored for a period of two years at SW12, SW17, BB1, BB2, and BB3, and one year at WWR1 and WWR3 (due to a severe drought). The ISCO samplers at sites WWR1, WWR3, BB2, and BB3 were enabled when the water level exceeded 6 mm (0.02 feet) and sampled at 4.2 m3 (150 feet3) intervals. As the runoff volume at the ungrazed BB1 was substantially lower than the grazed sites, the ISCO sampler at BB1 was enabled when the water level exceeded 6 mm (0.02 feet) and sampled at 2.1 m3 (75 feet3) intervals. The ISCO samplers at SW12 and SW17 were enabled at 60 mm (0.20 feet.) and sampled at 16 m3 (566 feet3) intervals. All ISCO samplers were programmed to rinse sample tubing with ambient water prior to collection of each sample. Following each event, samples were retrieved within 24 h from the ISCO samplers and transported on ice to the lab [26].
2.3. E. coli Analysis
Analysis of all water samples for E. coli was conducted within six hours of retrieval from ISCO samplers. E. coli in water samples were enumerated using EPA Method 1603 [27] and reported as cfu (colony forming units)/100 mL.
2.4. Bacteroides Analysis
Within 6 h of retrieval, water samples were also filtered through a sterile Supor-200, 0.2 µM pore size filter (Pall Corporation, Ann Arbor, MI, USA). Filter volumes averaged 30 mL, but varied from 10 to 100 mL depending on the quantity of suspended solids in the sample (i.e., how much could be passed before the filter clogged). Filters were placed in sterile, Whirl-Pak® bags (Nasco, Fort Atkinson, WI, USA) containing 500 µL of guanidine isothiocyanate lysis buffer [28] and stored at −80 °C until DNA extraction. DNA was extracted directly from the filters using QIAamp DNA mini kits (QIAGEN, Valencia, CA, USA). Total DNA from corresponding filters was eluted in 100 µL of 0.01X TE (0.1 mM Tris-EDTA buffer, pH 8.0) into a sterile tube. To remove any residual alcohol, eluted samples were concentrated at 60 °C to a volume of 10 to 20 µL using an Eppendorf Vacufuge Plus (Eppendorf, Westbury, NY, USA), and their volumes were brought back to 100 µL with 0.01X TE. The DNA was quantified using both Quant-It™ Picogreen® assay (Invitrogen, Carlsbad, CA, USA) and a NanoDrop ND-1000 UV spectrophotometer (NanoDrop Technologies, Wilmington, DE, USA). The DNA extracts were stored at −80 °C until analyzed by qPCR.
2.5. Construction of Bacteroides 16S rRNA Gene Copy Standards
Bovine feces were collected aseptically from a pastured cow at the Texas A&M University, O. D. Butler, Jr., Animal Science Teaching, Research, and Extension Complex (College Station, TX, USA) using a sterile spatula, into a sterile, screw-cap polypropylene specimen tube. The fecal sample was immediately returned to the lab and mixed in a volume of sterile distilled water equal to the weight of the feces. The DNA was extracted from the bovine feces using a PowerSoil DNA Isolation Kit (Mo Bio Laboratories, Carlsbad, CA, USA) and purified using illustra MicroSpin S-400 HR Columns (GE Healthcare, Buckinghamshire, UK), according to the manufacturers’ recommendations.
Bacteroides-specific 16S rRNA genes (32F/708R), containing both the AllBac and BoBac regions, were amplified from fecal DNA extracts [18]. The 25 µL reactions contained 1X Failsafe Buffer A (Epicentre Biotechnologies, Madison, WI, USA), 15 pmol of forward and reverse primers (32F and 708R), 1.25 units of AmpliTaq Gold DNA Polymerase (Applied Biosystems, Foster City, CA, USA), and 1 µL of fecal community DNA. Thermocycling was conducted in an Eppendorf Mastercycler (Eppendorf, Hamburg, Germany) under the following conditions: 95 °C for 10 min, followed by 35 cycles of 95 °C for 30 s, 53 °C for 1 min, and 72 °C for 1 min; and a final extension of 72 °C for 10 min [18]. The PCR product was confirmed on an agarose gel stained with ethidium bromide, gel purified using QIAquick Gel Extraction Kit (QIAGEN, Valencia, CA, USA) and finally cloned into a pDrive Cloning Vector (QIAGEN, Valencia, CA, USA). Inserts in presumptive clones were extracted using PerfectPrep Spin Mini Kit (5 Prime, Gaithersburg, MD, USA) and verified by amplification with the AllBac and BoBac primer sets [17]. These 25 µL reactions contained 1X Failsafe Buffer A (Epicentre, Madison, WI, USA), 15 pmol of forward and reverse primers, 1.25 units of AmpliTaq Gold DNA Polymerase, and 1 µL of plasmid template. Thermocycling was conducted in an Eppendorf Mastercycler under the following conditions: 50 °C for 2 min, followed by 95 °C for 10 min and 50 cycles of 95 °C for 30 s, 57 °C (BoBac assay) or 60 °C (AllBac assay) for 45 s, and final extension at 72 °C for 1 min [17]. The PCR product was confirmed on an agarose gel stained with ethidium bromide. Plasmids were extracted using PerfectPrep Spin Mini Kit (5 Prime, Gaithersburg, MD, USA). The DNA was quantified using Quant-It™ Picogreen® assay (Invitrogen, Carlsbad, CA, USA) and normalized to 1 ng/µL with subsequent standards made using 10-fold dilutions of non-linearized plasmids in DNA-grade water to 10−7 [29].
2.6. Quantitative PCR Assays
Extracted DNA from runoff samples was tested for total (AllBac) and bovine-associated (BoBac) fecal markers [17]. Gene targets, as well as the probe and primer sequences and amplicon size for the two qPCR assays used in this study, have been previously described [17]. Oligonucleotide primers and 6-carboxyfluorescein (FAM)-BHQ probes were obtained from a commercial source (Integrated DNA Technologies, Inc., Coralville, IA, USA).
The qPCR was performed in 25 µL reactions containing 12.5 µL QuantiTect Probe PCR Master Mix (QIAGEN, Valencia, CA, USA), 5 µL template, 15 pmol (1 µL) each of forward and reverse primers, 5 pmol (0.5 µL) probe, 1 µL 0.01X TE or spike (2 × 10⁵ gene copies), and 4 µL PCR-grade water. Reactions were set up using a CAS-1200™ Precision Liquid Handling System (Corbett Life Science, Sydney, Australia). The PCR amplification and detection of the fluorescent signal was performed using the Rotor-Gene 6000 real-time rotary analyzer (Corbett Life Science, Sydney, Australia) under the following conditions: 50 °C for 2 min, followed by 95 °C for 10 min and 50 cycles of 95 °C for 30 s, 57 °C (BoBac assay) or 60 °C (AllBac assay) for 45 s, and 72 °C for 60 s [17].
For all qPCR runs, standards, negative controls (no DNA), samples and spiked samples were run in triplicate. Gene copy standards ranging in concentration from 2 × 101 to 2 × 10⁶ copies per reaction were used for calculating the concentration of total and bovine-associated Bacteroides gene copies in each sample. Results were expressed as gene copies per L of water. Cattle contribution was estimated by dividing the bovine-specific Bacteroides (BoBac) results by the total Bacteroides (AllBac) results for each runoff sample.
The potential for PCR inhibition was measured by spiking samples with 2 × 10⁵ copies of plasmid DNA. The amount of PCR inhibition was measured by determining the recovery of the copies in the presence of the runoff sample as calculated from the plasmid DNA standard curve (percent recovery = (measured copies in runoff sample spiked with 2 × 10⁵ plasmid copies—measured copies in unspiked runoff sample)/(measured copies in blank sample spiked with 2 × 10⁵ plasmid copies) × 100). The percentage of plasmid recovery measured in each runoff sample was then determined.
2.7. Statistical Analysis
The statistical software, Minitab (Minitab Inc., State College, PA, USA) was used for determining descriptive statistics (means, standard deviations, maximums, medians, etc.), calculating Pearson product moment correlation coefficients, conducting linear regression analyses on log10 transformed bacterial concentrations, and assessing differences in median concentrations between sites and treatments using the Mann–Whitney and Kruskal–Wallis tests. The Kolmogorov–Smirnov test indicated that data were not normally distributed (p < 0.010). Regression analysis was used to assess relationships of AllBac and BoBac gene copy concentrations to E. coli levels. An alpha level of 0.05 was accepted as a minimum level of significance; thus, results were considered statistically significant when p < 0.05.
3. Results and Discussion
3.1. Comparison of AllBac to Stocking Rate and Grazing Management
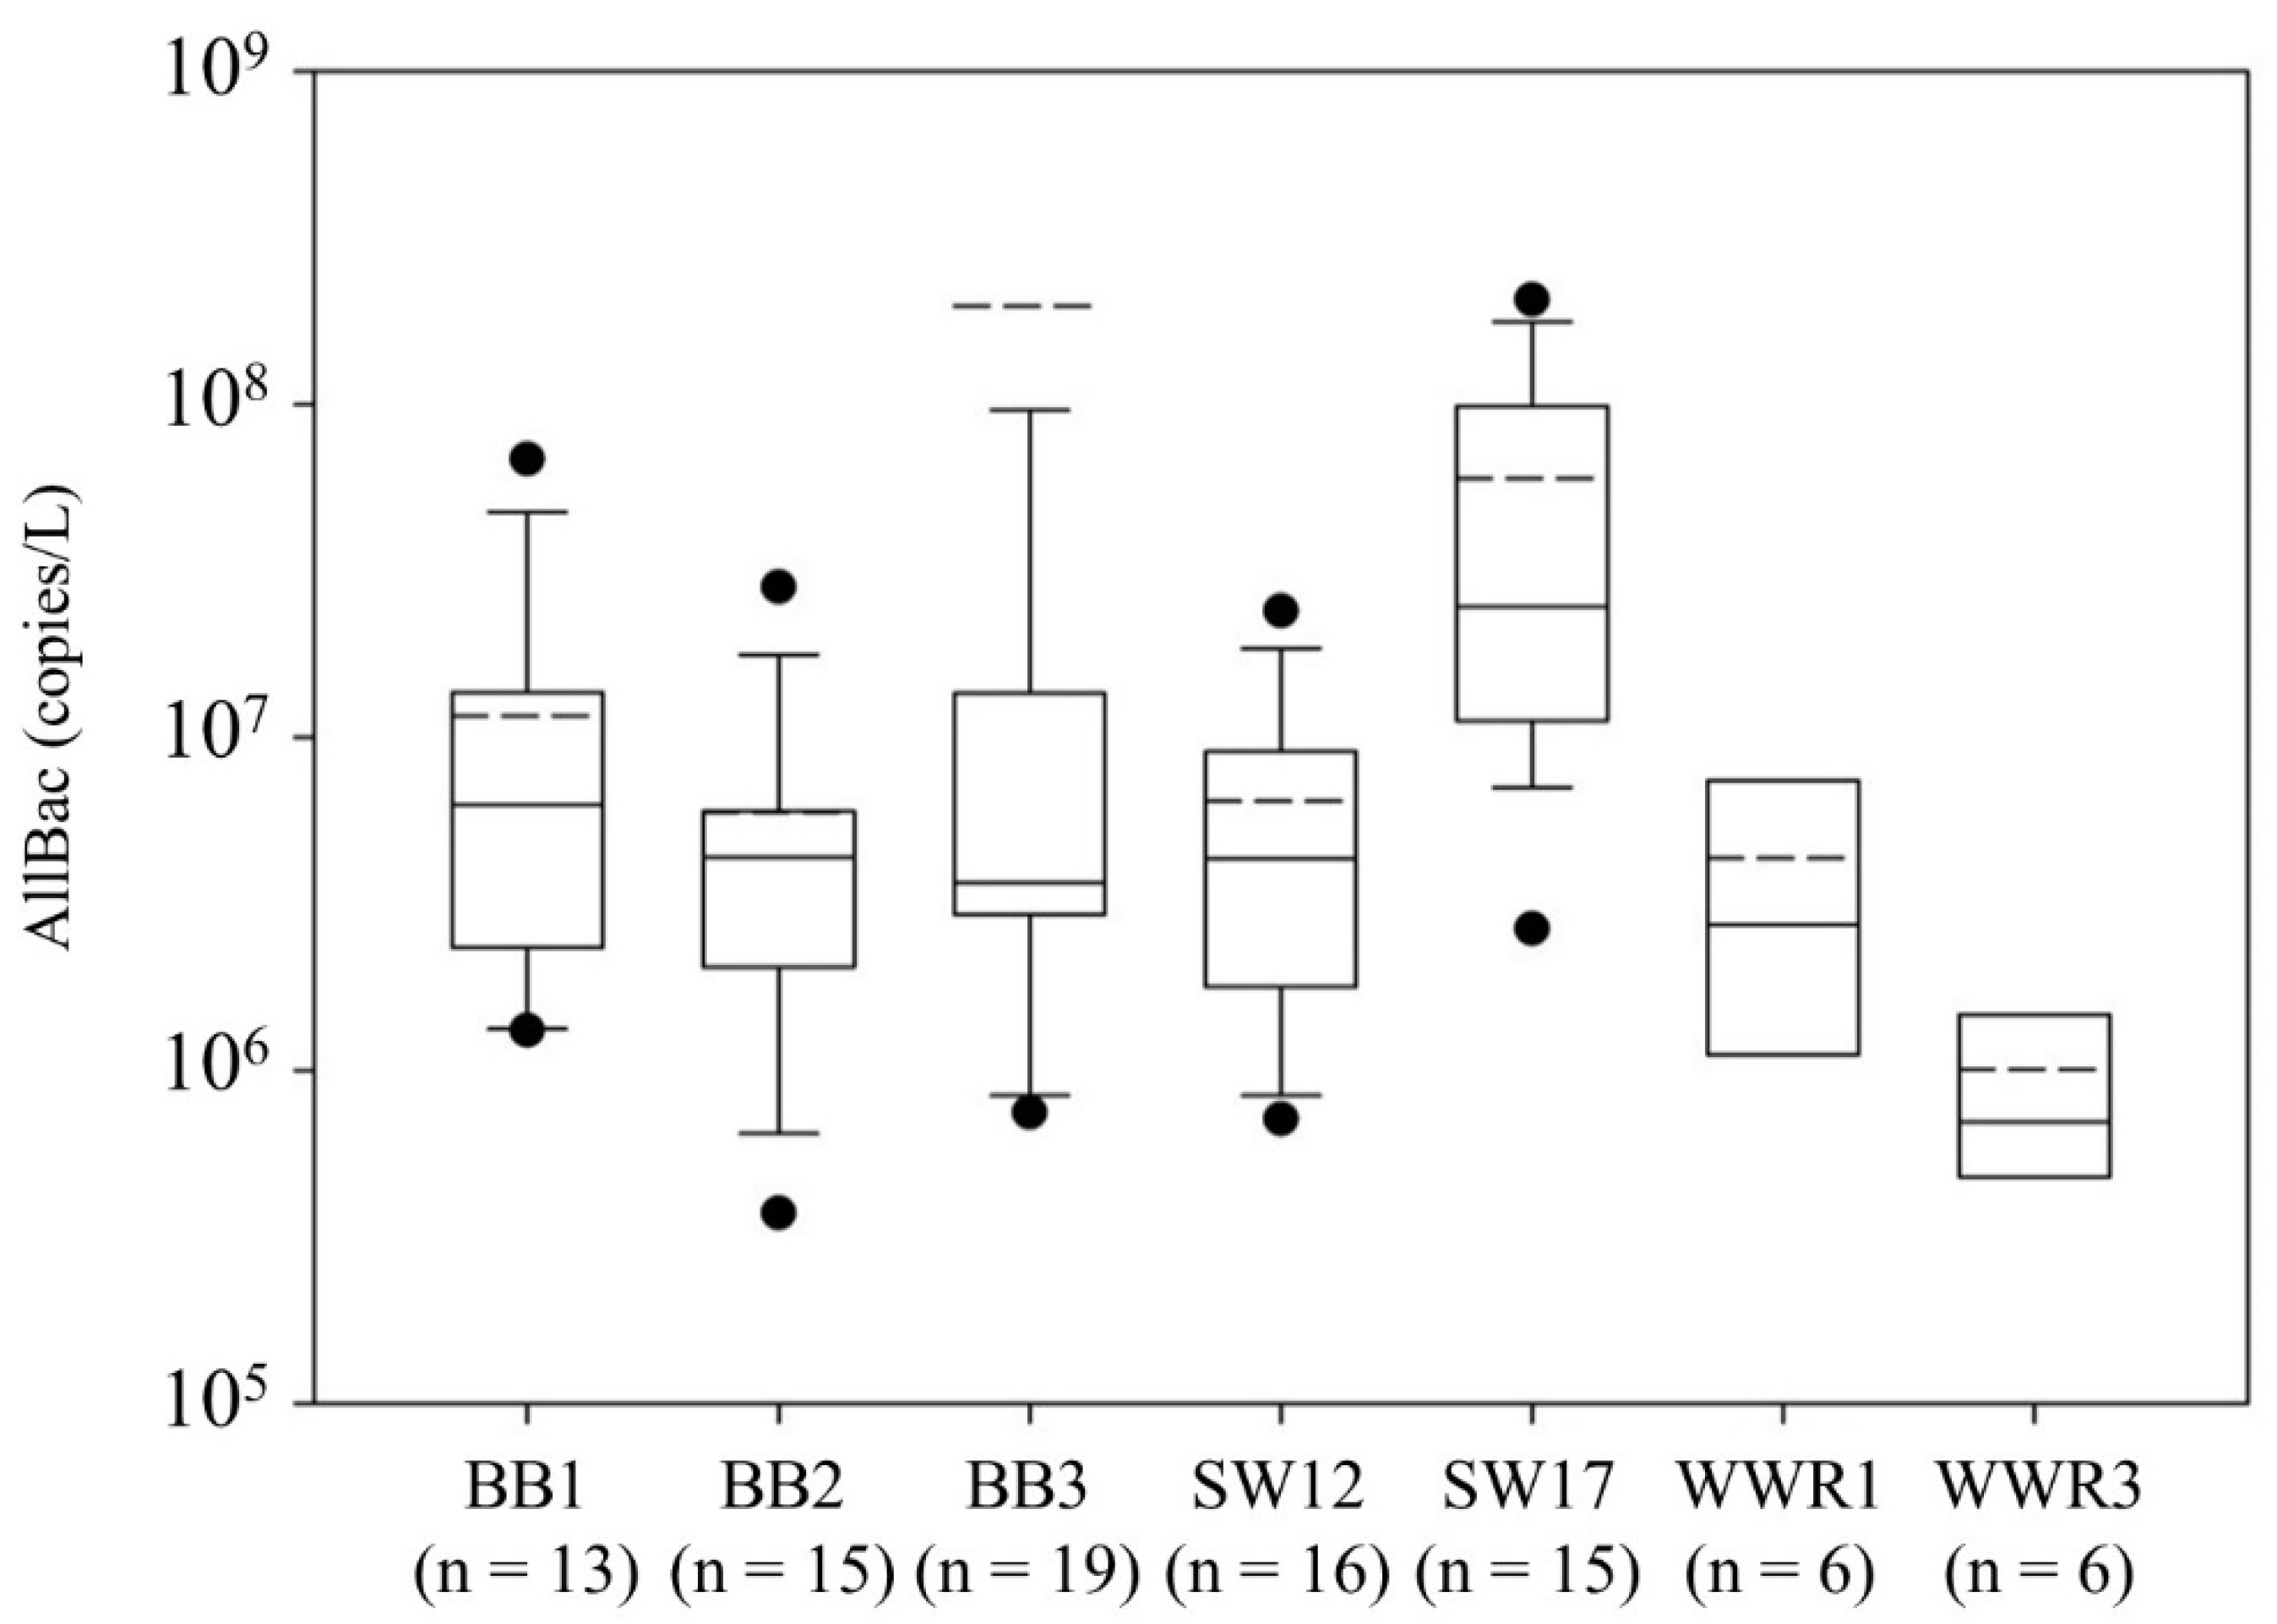
AllBac was detected in all samples and ranged in concentration from 3.5 × 10⁵ to 3.5 × 10⁹ gene copies/L. The Kruskal–Wallis test revealed no significant differences (p = 0.619) in median AllBac concentrations due to grazing treatment (ungrazed, properly stocked, and overgrazed sites). Further, median AllBac concentrations were not correlated to total stocking (AUD/hectare) occurring at each site (Pearson correlation = 0.29; p = 0.53). This indicates other factors besides grazing treatment and stocking rate contributed to the concentrations observed. The Kruskal–Wallis test revealed no statistically significant differences in AllBac concentrations at BB1, BB2, BB3, SW12, and WWR1 (p = 0.71; Figure 1); however, AllBac was significantly higher at SW17 (p < 0.01) and significantly lower at WWR3 (p < 0.01). The lower concentrations at WWR3 likely resulted from the minimal grazing that took place the year before the runoff events occurred as a result of a major two-year drought during the study. As such, WWR3 was more representative of an ungrazed site than a stocked site during the period samples were collected. In contrast, SW17 was the most extensively grazed site throughout the study, being grazed for over 14 months (out of 24 months), though at a lighter stocking rate than the other sites.
To further evaluate the data, annual median AllBac concentrations at each site (Table 1) were compared to annual stocking rate (AUD/hectare) and again found to be uncorrelated (Pearson correlation = 0.16; p = 0.62) indicating factors other than annual stocking rate are contributing to the observed concentrations. Upon further analysis, a significant correlation was observed between median annual AllBac concentrations and percentage of runoff events occurring while sites were stocked or had been stocked less than 2 weeks prior to runoff (p < 0.01; r2 = 0.52; data not shown). To state it another way, the higher the percentage of runoff events occurring while sites were stocked, the higher the observed AllBac concentration. A Mann–Whitney test further revealed that median AllBac concentrations when sites were stocked or recently grazed (median = 1.73 × 10⁷ copies/L) were significantly higher (p < 0.01) than concentrations when runoff occurred when sites were destocked (median = 3.58 × 10⁶ copies/L). This indicates AllBac concentrations were affected by recent fecal contamination from cattle at these locations. Other factors (e.g., persistence) and sources (e.g., wildlife) may impact AllBac concentrations as well since AllBac is a measure of total Bacteroides and differing persistence between fecal sources may exist between Bacteroidales markers [28].
3.2. Comparison of BoBac to Stocking Rate and Grazing Management
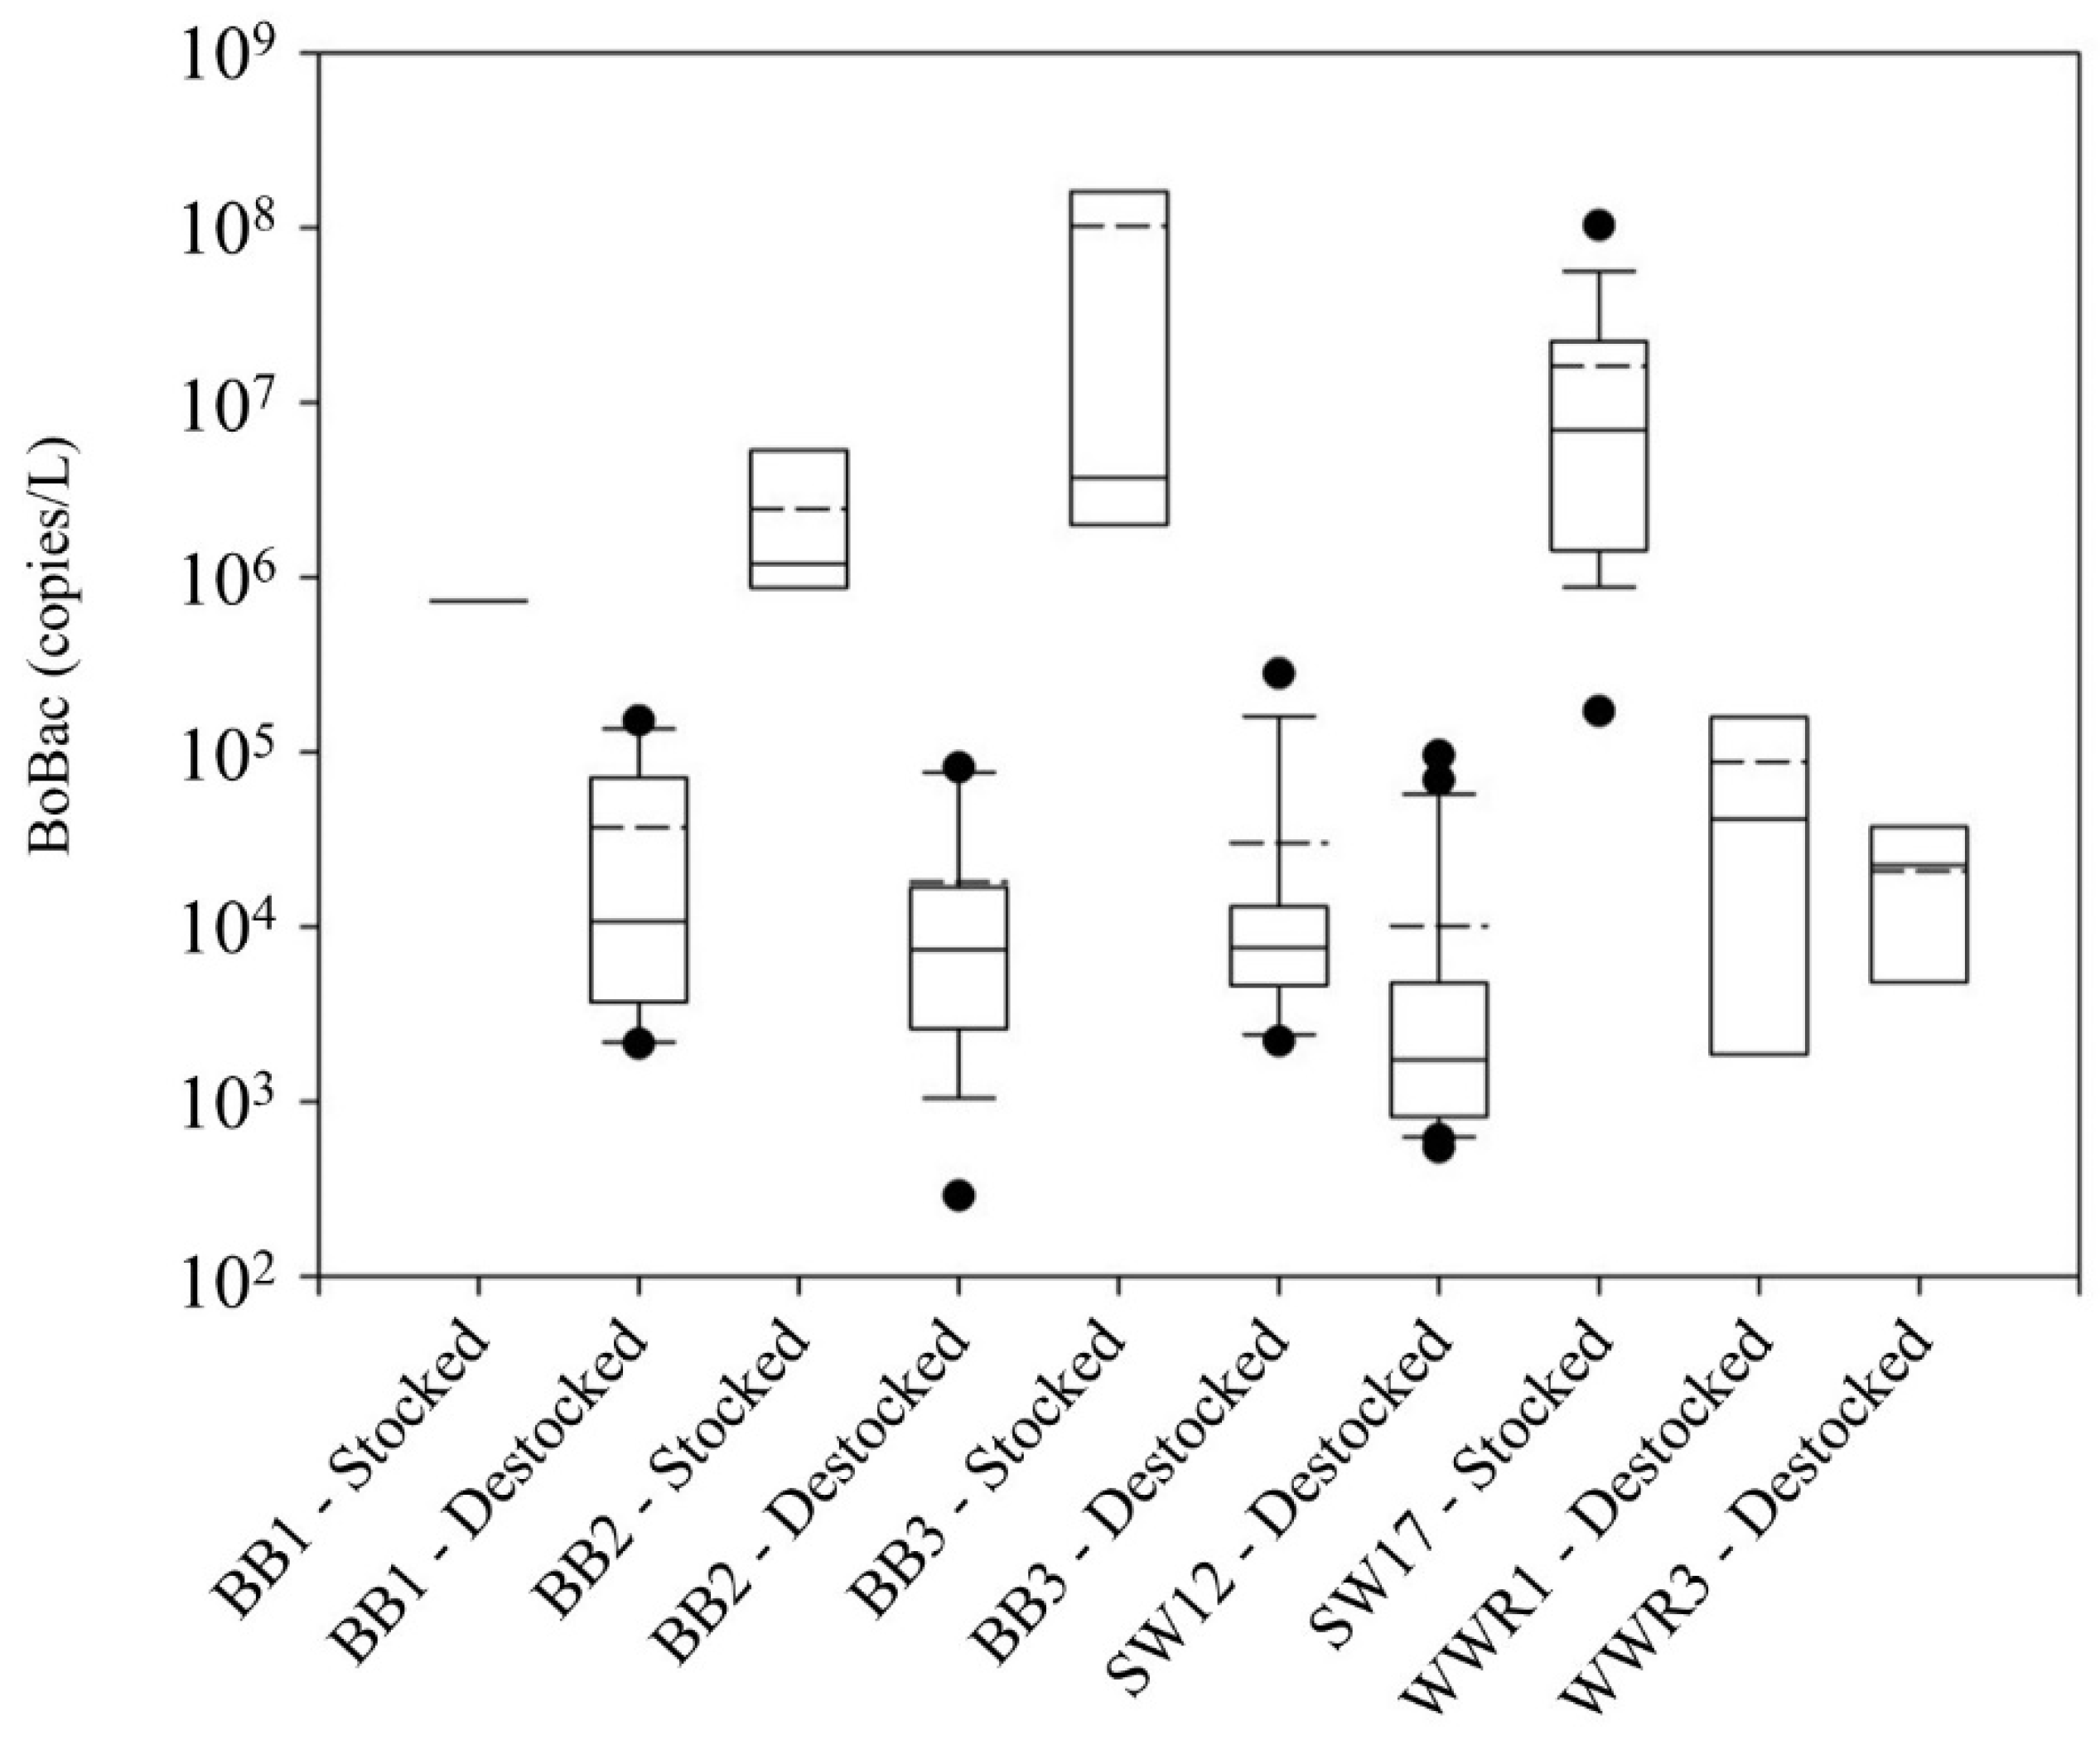
As with AllBac, BoBac was detected in all samples but in lower concentrations ranging from 2.9 × 10² to 5.9 × 10⁸ gene copies/L. This detection in all samples was not unexpected as BoBac is known to detect not only cattle but also other ruminant animals [3] such as deer which are present at varying densities in the study area. The Kruskal–Wallis test revealed that BoBac concentrations at BB1, BB2, B3, WWR1, and WWR3 (Table 2) were not significantly different (p = 0.84); however, BoBac at SW17 was significantly higher (p < 0.01) and concentrations at SW12 were significantly lower (p < 0.01) than other sites. Site SW17 likely had the highest concentrations since 100% of samples at SW17 were collected when the site had been recently or was actively being grazed. This appears to be confirmed by the finding that median BoBac concentrations (log10 transformed) were strongly correlated with the percentage of runoff events that occurred while sites were stocked or had been stocked less than 2 weeks prior to runoff occurring (p < 0.001; r2 = 0.88). Conversely, it is likely that the lower deer populations in the Blackland Prairie and lack of grazing at SW12 resulted in it having the lowest BoBac concentrations.
Annual median BoBac concentrations at each site (Table 2) were compared to annual stocking rate (AUD/hectare) and as opposed to AllBac, approached a statistically significant correlation (Pearson correlation = 0.50; p = 0.10). The Kruskal–Wallis test indicated grazing management significantly impacted BoBac concentrations (p < 0.01). Analysis using the Mann–Whitney test found that median BoBac concentrations at ungrazed sites (4.77 × 10³ copies/L) were significantly lower than concentrations at properly stocked (1.71 × 10⁵) and overstocked (1.31 × 10⁴) sites (p < 0.01 and p = 0.01, respectively). However, there was no significant difference between BoBac concentrations at properly stocked and overstocked sites (p = 0.28).
Further, BoBac concentrations were significantly higher, generally exceeding 105 copies/L, in runoff when cattle were actively grazing or had grazed the sites within 2 weeks of the runoff event (Figure 2) and generally 105 copies/L or less when sites were destocked. The Kruskal–Wallis test revealed that median BoBac concentrations were significantly higher (p < 0.01) when samples were collected when sites were actively/recently stocked (3.22 × 10⁶ copies/L) than those found when sites were destocked (6.13 × 10³ copies/L). The BoBac concentrations were not significantly different among the sites when they were stocked (Kruskal–Wallis test; p = 0.25). Similarly, with the exception of SW12, which exhibited significantly lower BoBac concentrations (Mann–Whitney test; p < 0.01) as previously discussed, BoBac levels were also not significantly different among the sites when they were destocked (Kruskal–Wallis test; p = 0.51). This analysis suggests that BoBac is reflective of recent/active grazing and is a suitable indicator of recent fecal contamination from cattle.
3.3. Comparison of AllBac and BoBac Gene Copy Concentrations to E. coli Levels
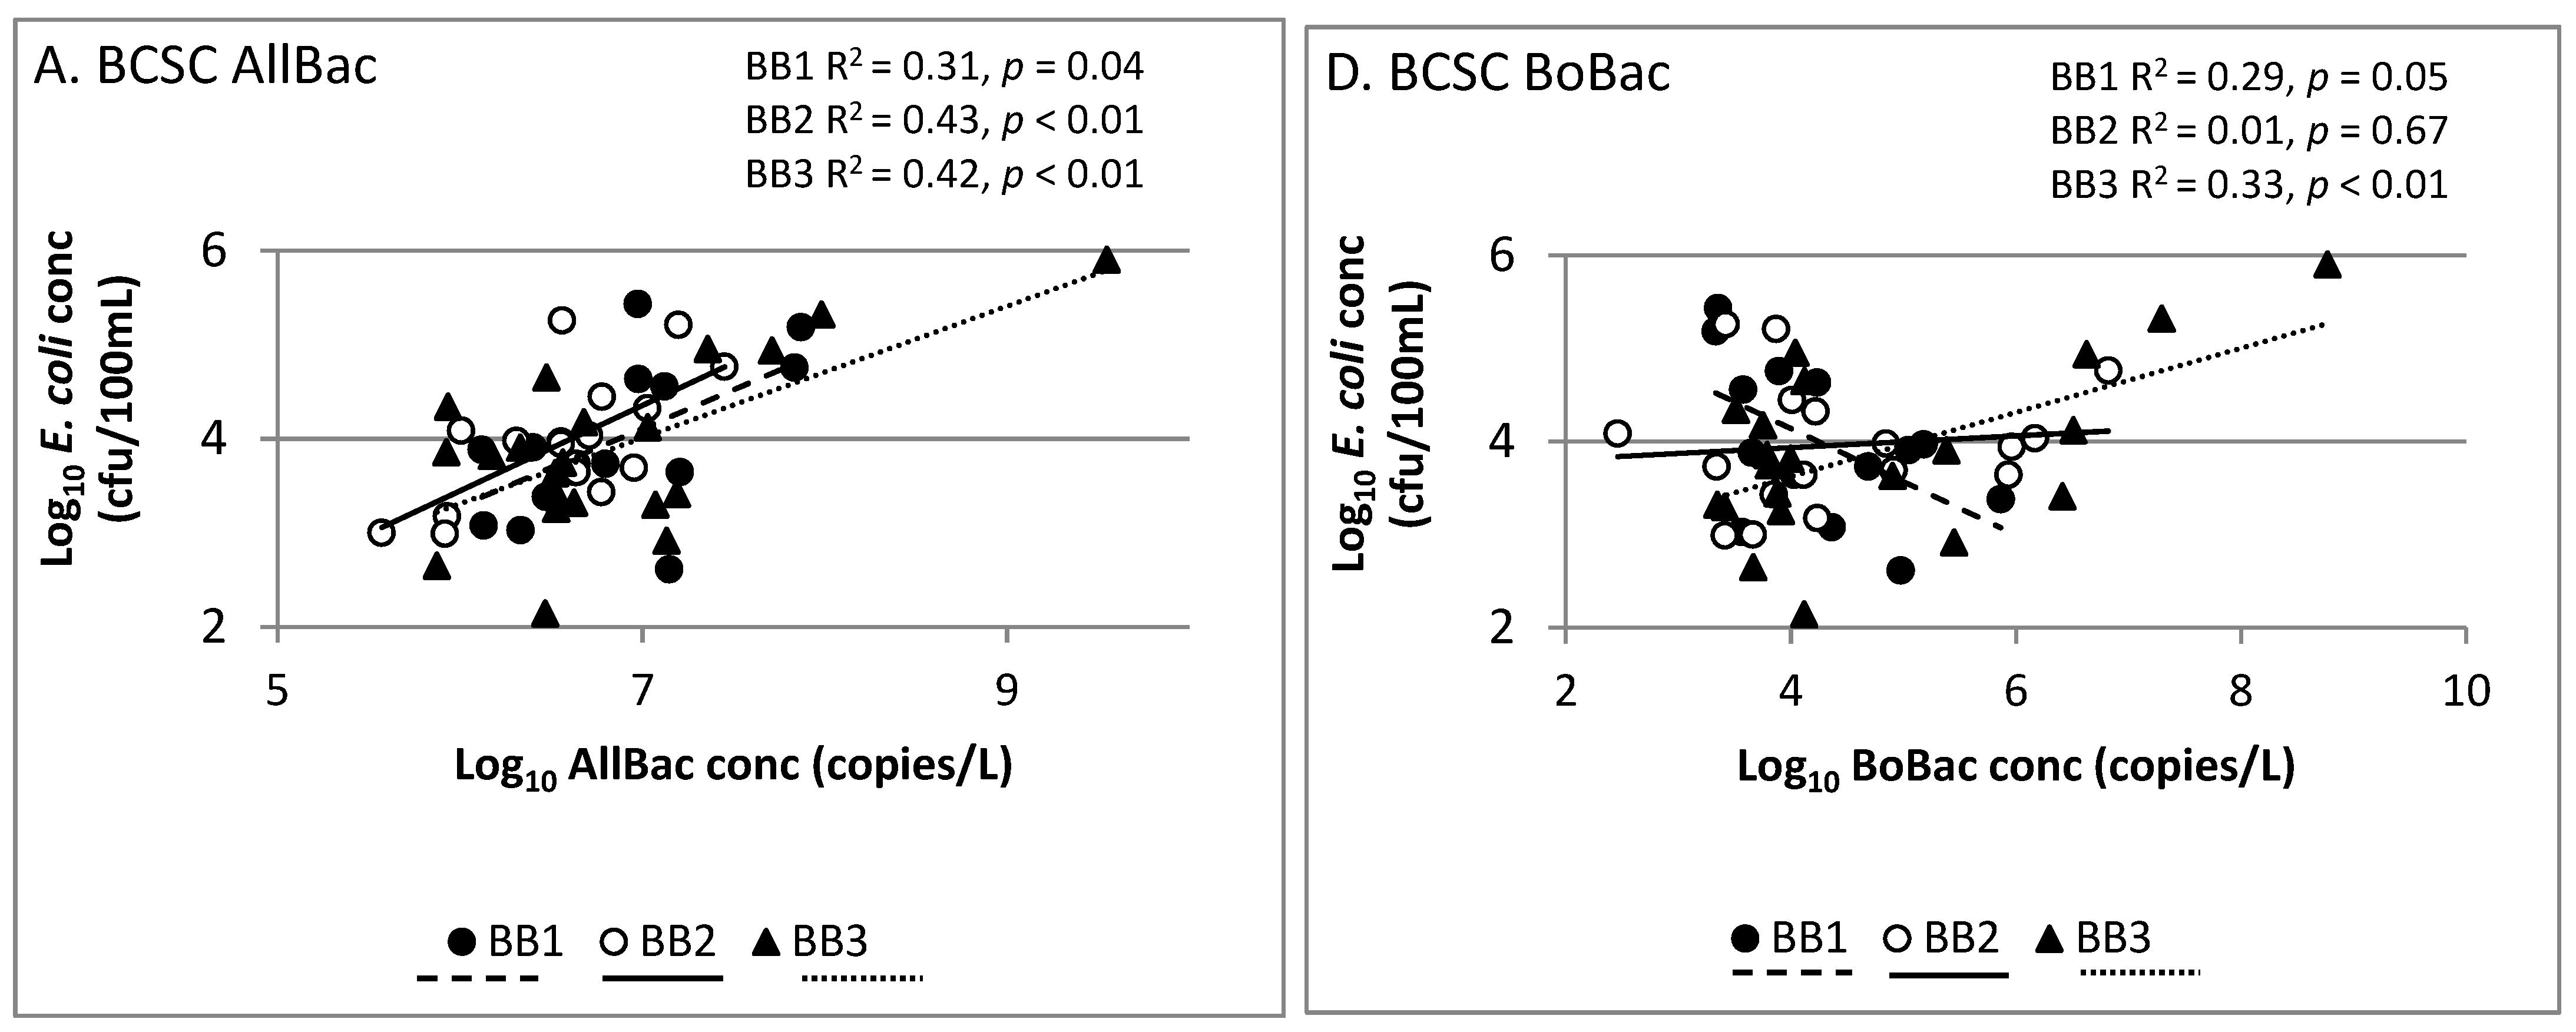
As compared to prior studies which found strong correlations between Bacteroides markers (including AllBac) and E. coli concentrations [14,17,30], our study found significant site-to-site variability in correlations between these parameters (Figure 3). The AllBac gene copy and E. coli concentrations were not correlated at Riesel (SW12, SW17) or Welder Wildlife Refuge (WWR1, WWR3) sites. In contrast, a moderate, statistically significant correlation was observed between AllBac gene copy concentrations and E. coli at all BCSC sites (BB1, BB2, BB3). This suggests that other factors are impacting the relationship at our sites. Correlations of Bacteroides markers and fecal indicator bacteria such as E. coli may be impacted by differences in detection methods (i.e., culture vs. molecular based) used for measuring each [14,15] and differences in survivability of each in the environment [31]. Quantitative PCR methods detect DNA from both culturable and unculturable or dead organisms, whereas the E. coli methods used detect only culturable cells [14,15]. This relationship is further complicated by variability in both the prevalence of these organisms in various animal hosts that may be present at the sites and the survival of these organisms and markers in the environment [31]. However, research has demonstrated that little difference exists in the decay rates of fecal Bacteroides 16S RNA genes in human, cattle, and pigs using both host-specific and general assays [31]. Research has also found that several Bacteroides markers, such as the HF-human fecal marker, decayed at similar or significantly faster rates than E. coli thus making them conservative predictors of E. coli [15]. However, it has been suggested that a reservoir of AllBac markers may persist and thus it may not be useful as an alternate indicator for E. coli [15].
It should be noted that the fecal matter used to generate the gene copy curves for this study was collected from the TAMU Animal Science facility located adjacent to the BCSC suggesting that use of local fecal samples for gene copy curves may lead to improved correlations. Although Bacteroides spp. are generally considered to have broad geographic stability, there is a possibility of some variation across sites [3,17] due to a variety of factors including differences in animal management practices among different locations [32].
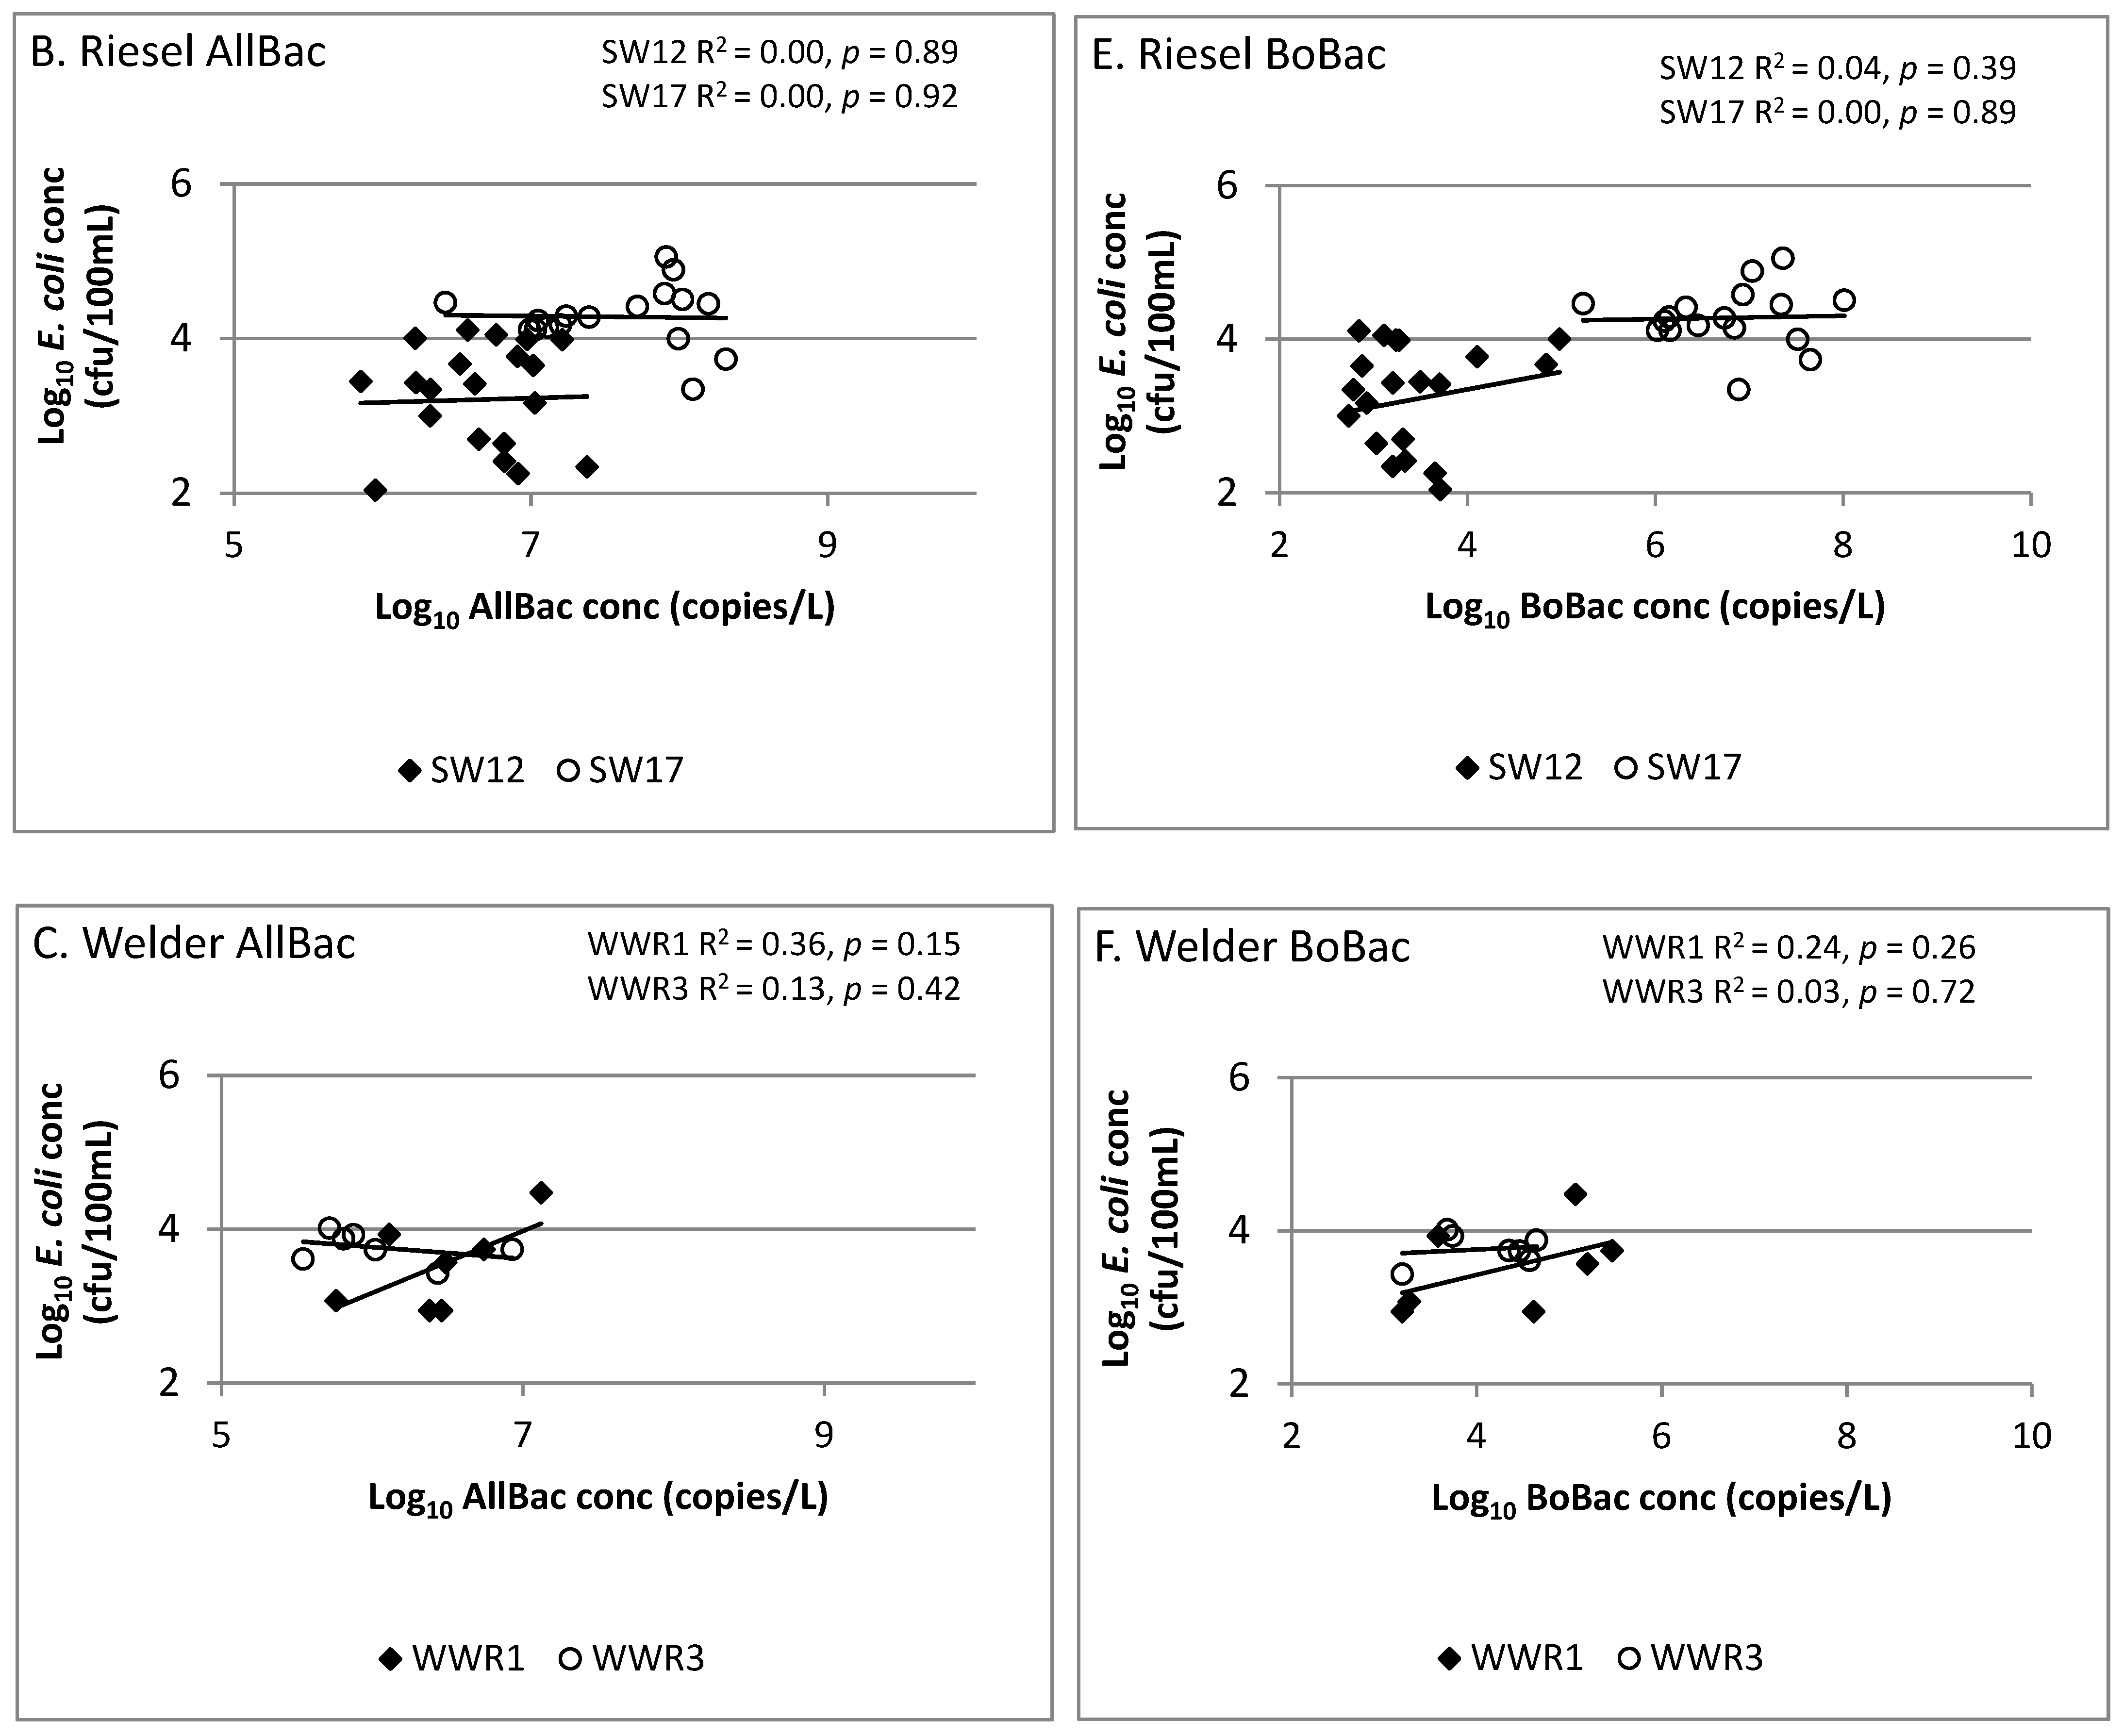
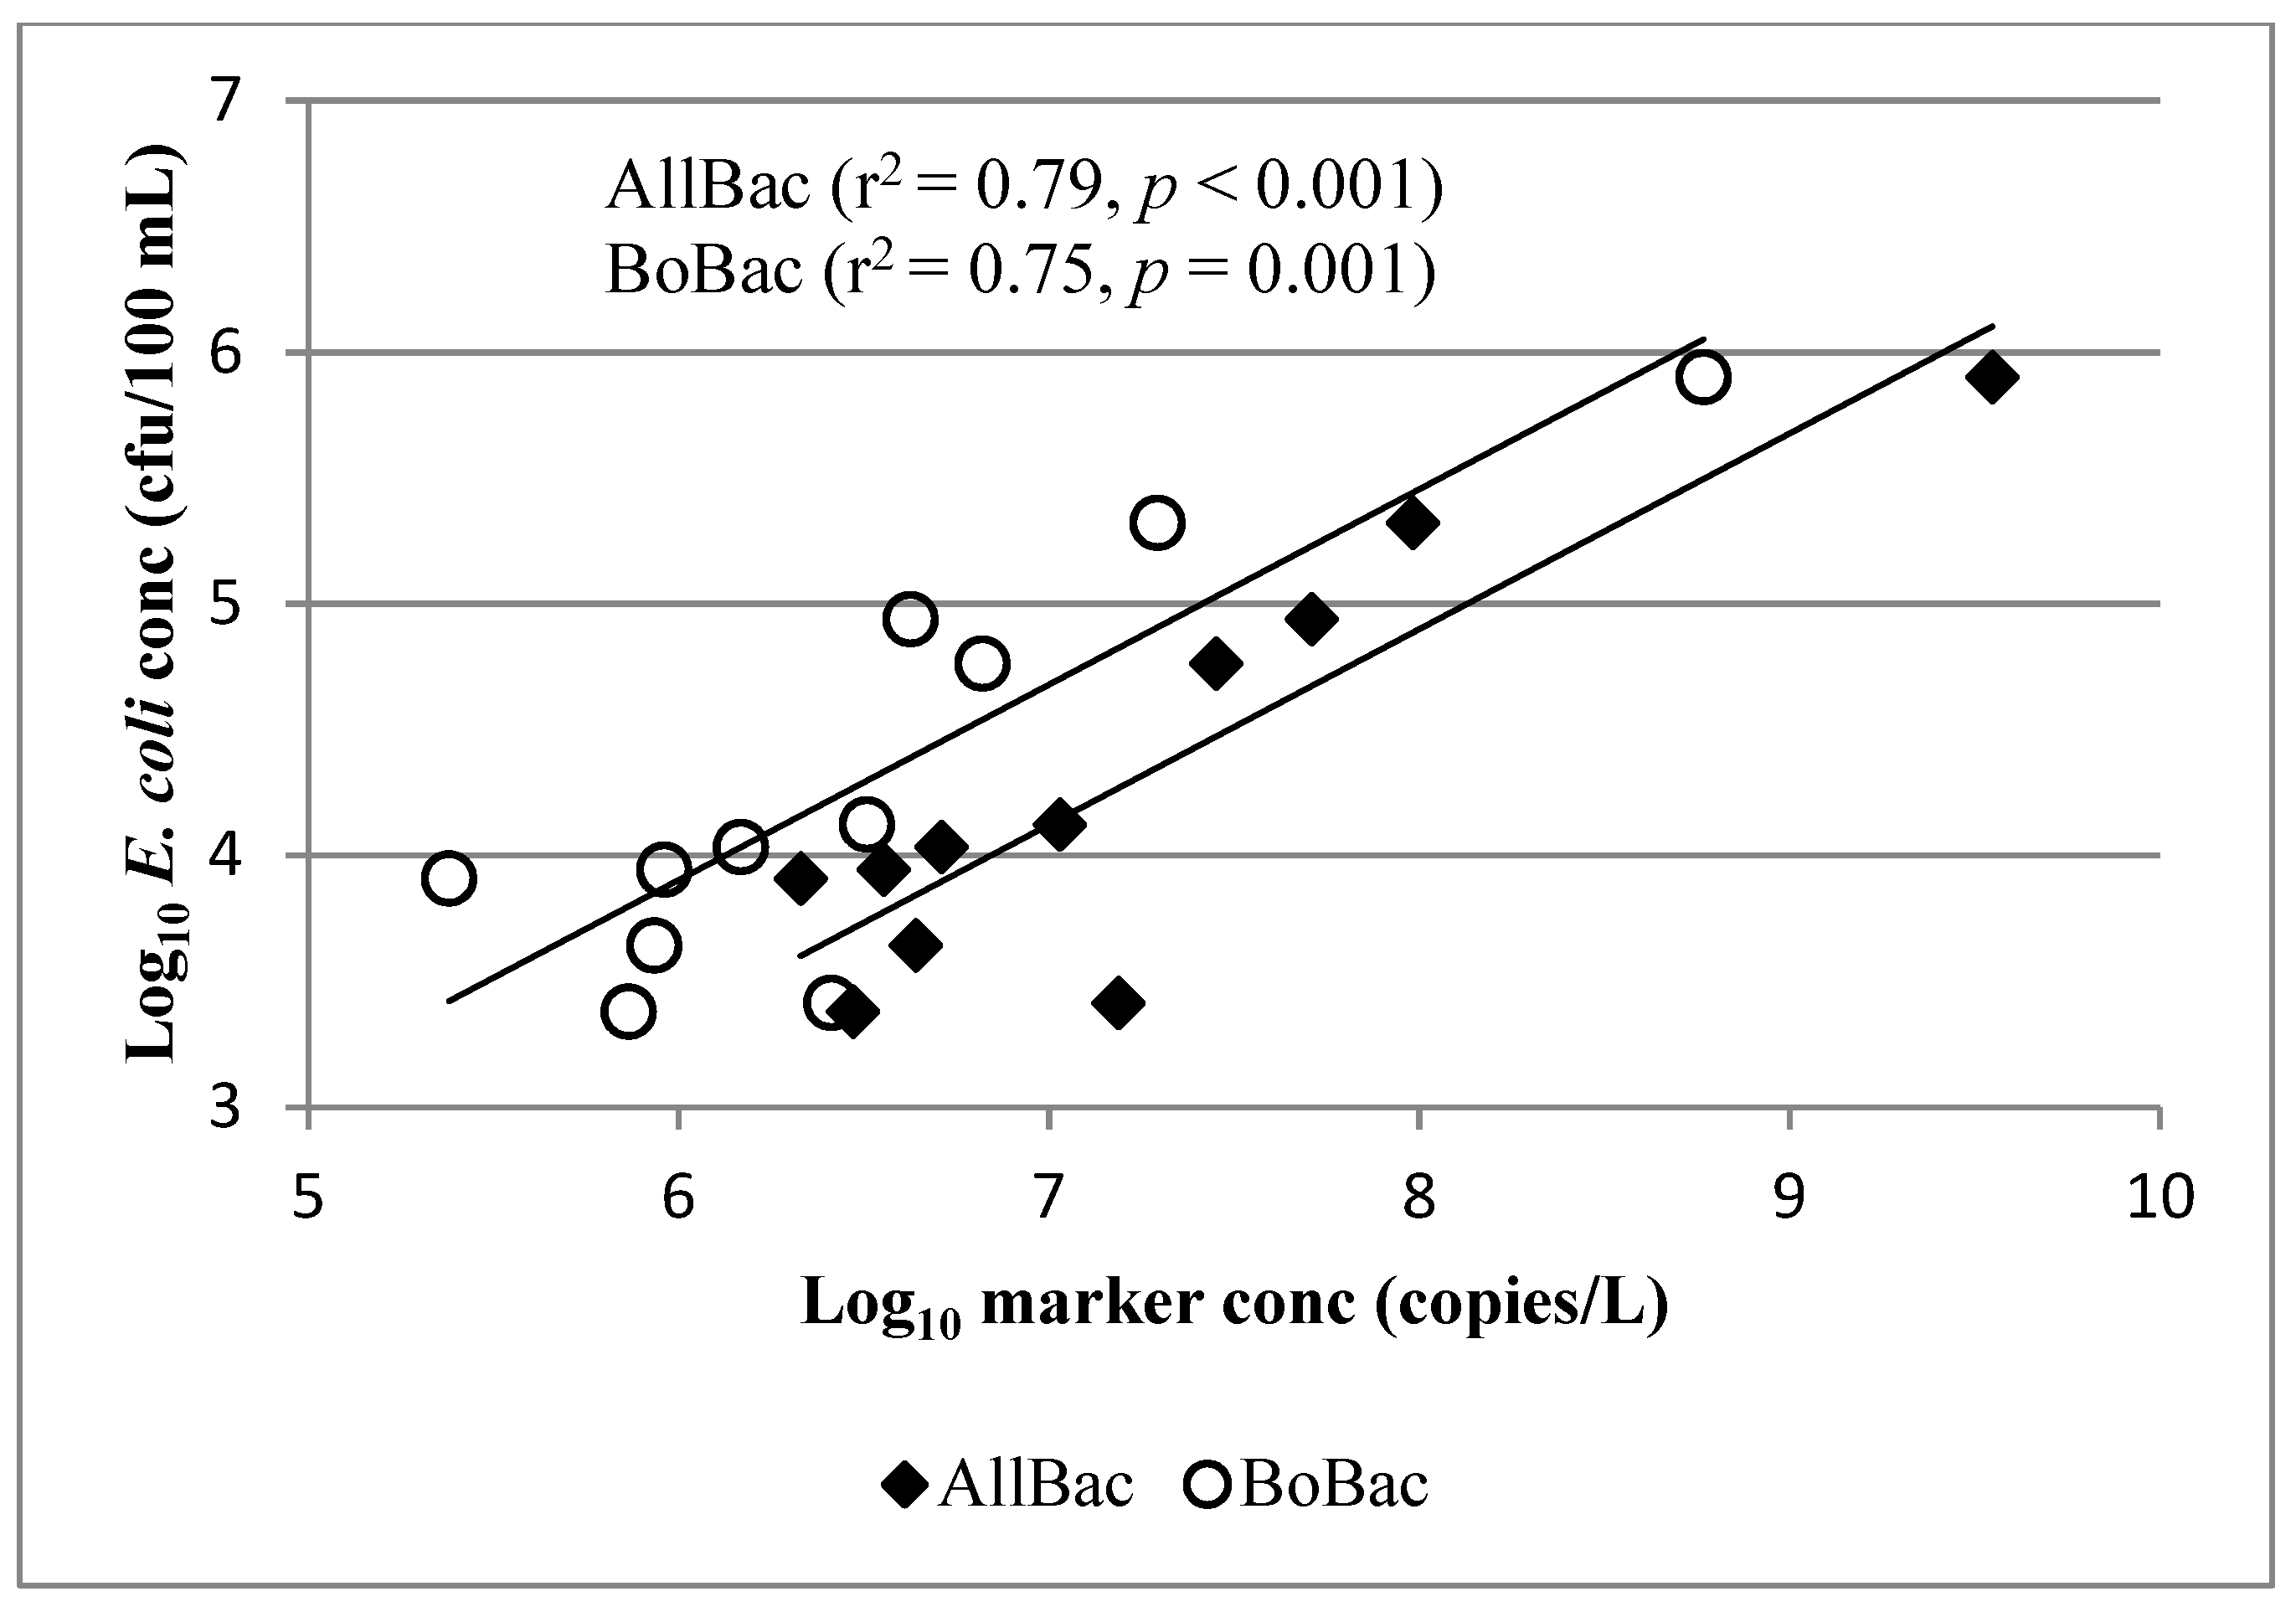
Finally, the correlation of E. coli to AllBac and BoBac when sites were stocked was evaluated. Again, we observed that at sites where local fecal samples were used for the development of gene copy curves (BCSC), E. coli was significantly correlated with both AllBac and BoBac when the sites were stocked (Figure 4). Conversely, at Riesel site SW17, where 100% of samples were collected while it was stocked, E. coli was not correlated with AllBac (Figure 3B) or BoBac (Figure 3E). This again indicates site-to-site variation and suggests that collection of local fecal samples for the development of gene copy curves may lead to improved correlations [3].
3.4. Evaluation of Cattle Contributions Using BoBac/AllBac
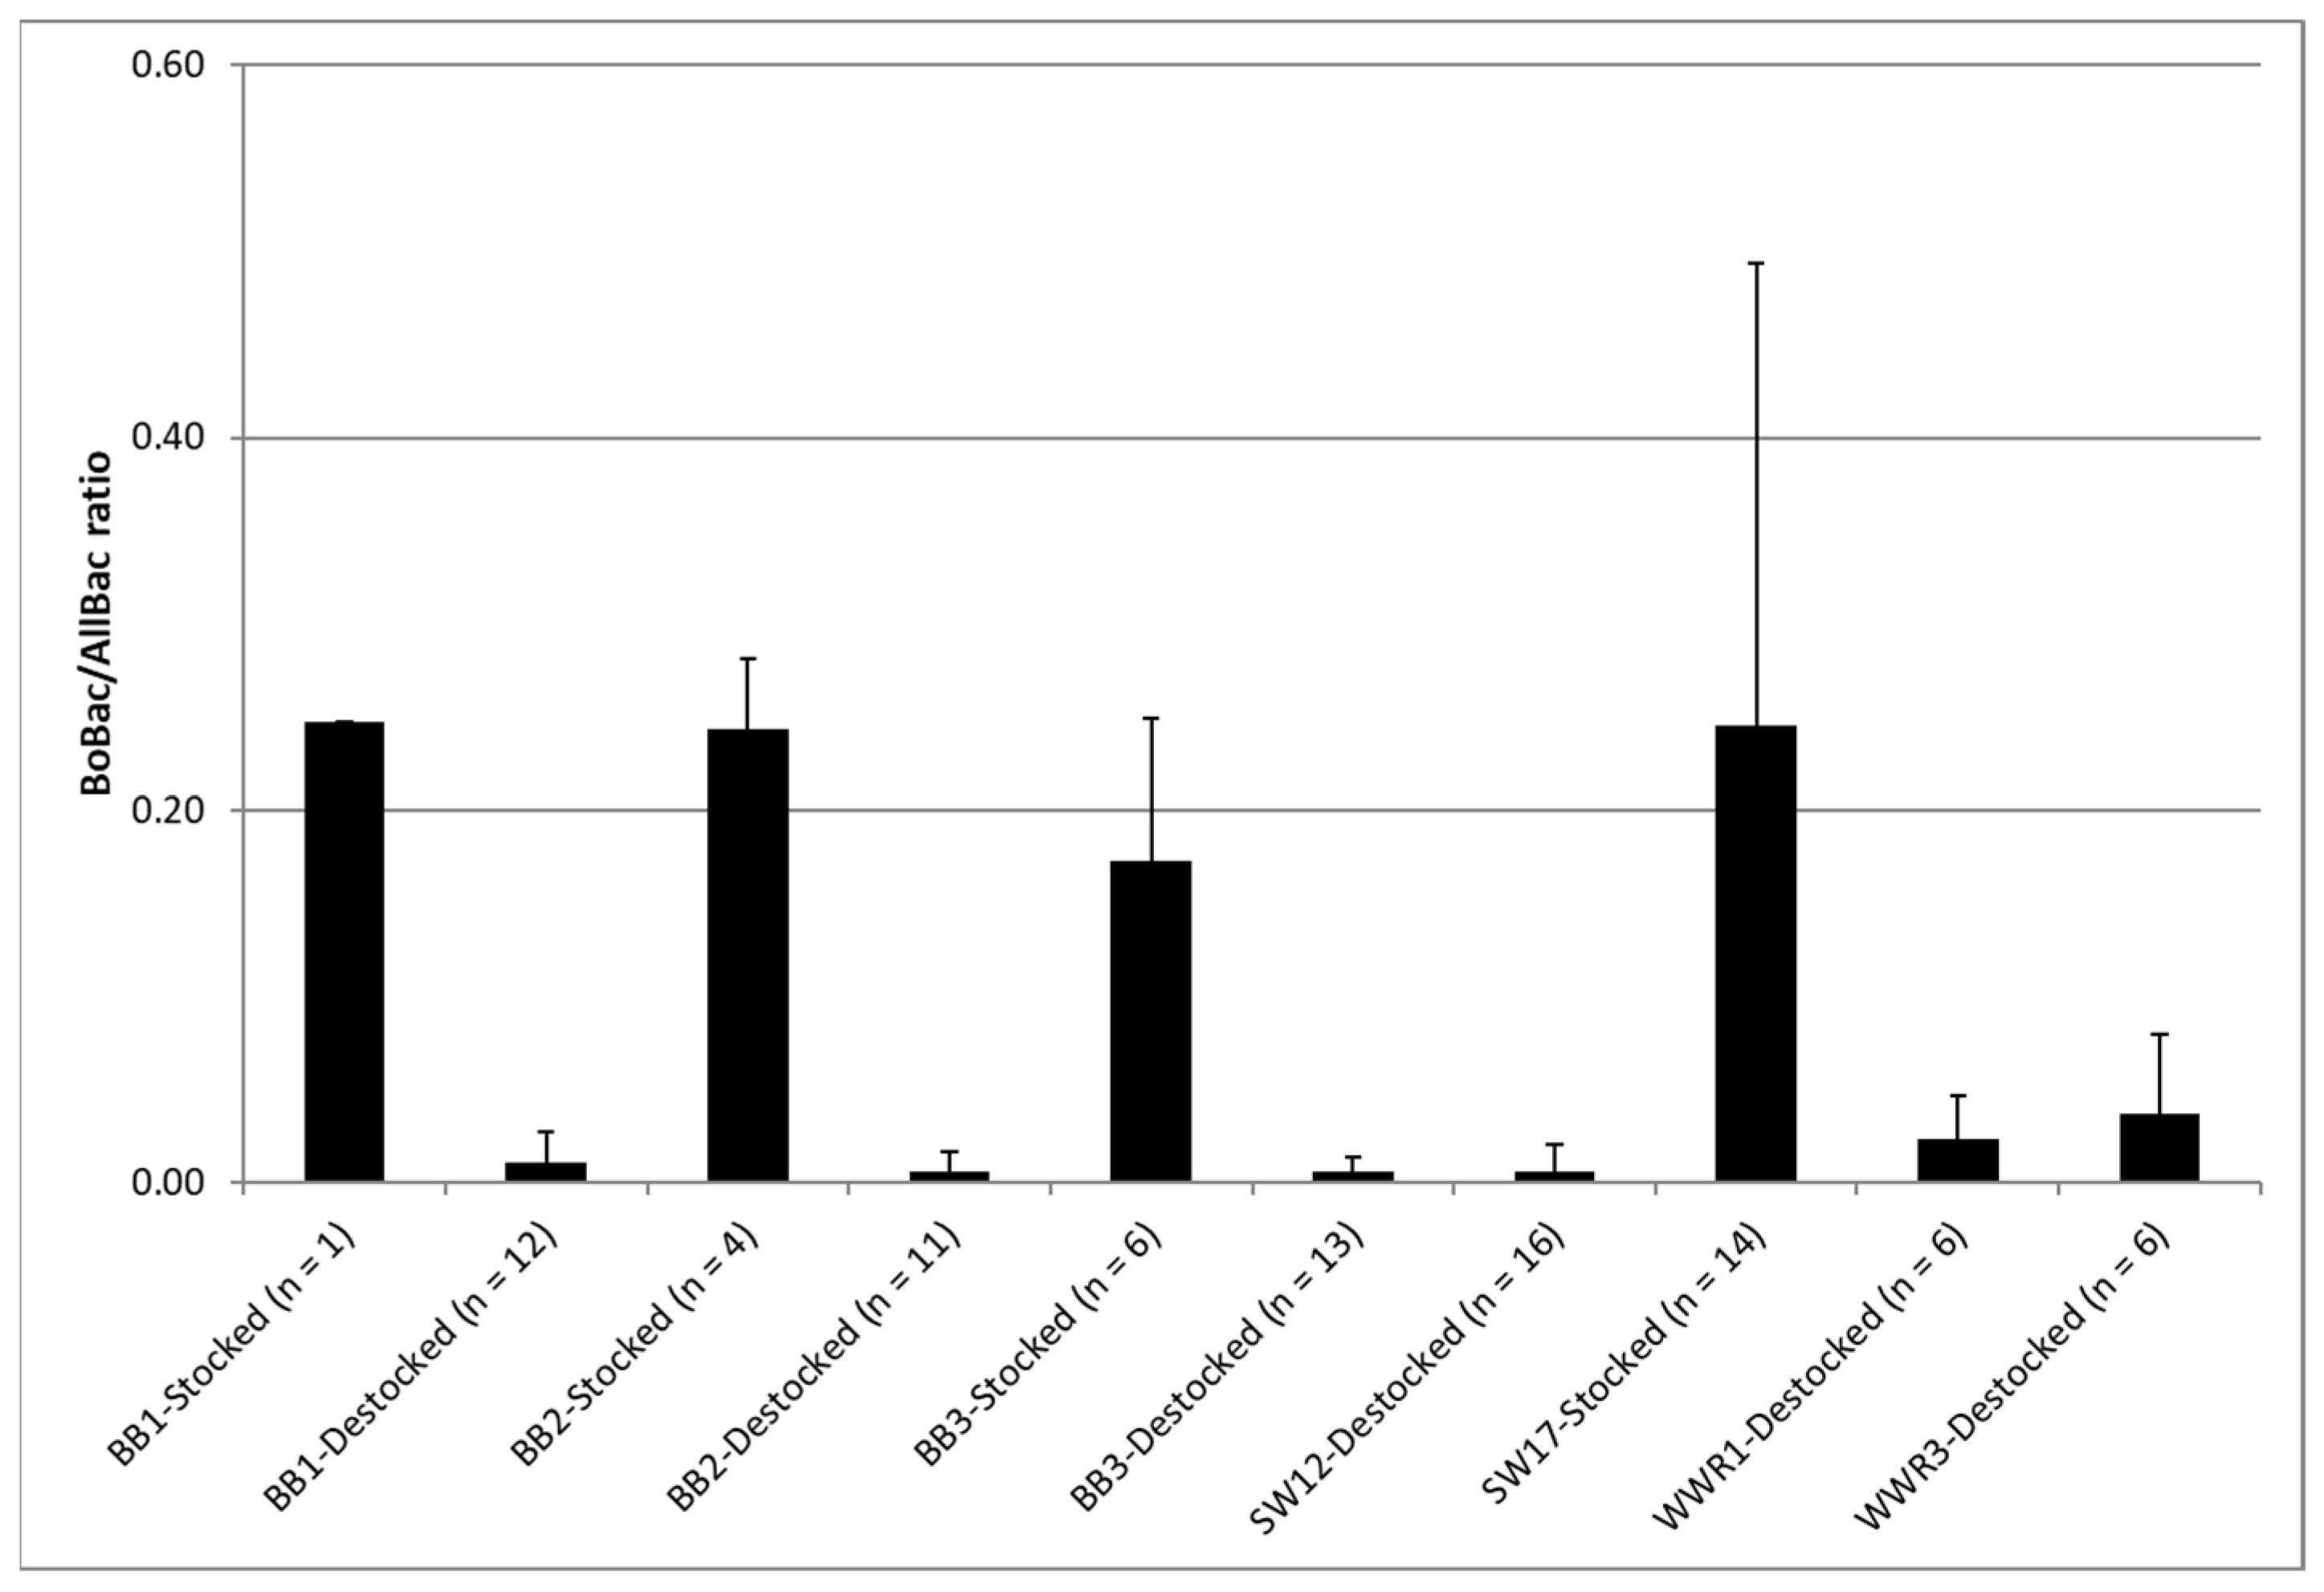
The BoBac/AllBac ratio was used to estimate the percentage of bovine-associated fecal contamination for each runoff event. When sites were destocked, the percentage of bovine-associated fecal contamination determined using BoBac/AllBac was low, averaging 0.01 (Figure 5). This validates that the origin of the bacteria found in the runoff was not from cattle when pastures were ungrazed or had been destocked for more than two weeks, thus suggesting that impacts of grazing on microbial indicators of water quality were not prolonged, under the tested conditions, once cattle were rotated.
Furthermore, when sites were stocked, the ratio of bovine-associated fecal contamination determined using BoBac/AllBac averaged 0.23. This was initially surprising as we expected a high BoBac/AllBac as a result of fecal loading from the actively grazing cattle. However, the results are within the range that would be expected when the findings of previous research regarding the BoBac/AllBac in raw cattle fecal samples are considered [3].
Prior research has found the ratio of BoBac concentrations to AllBac concentrations in cattle fecal samples collected from six continents varied from approximately 10–50% for most samples [3]. Considering this finding and extrapolating our results using this range of ratios observed in the raw fecal samples, over 46% to approaching 100% would be bovine-associated in runoff from stocked sites (0.23 {BoBac/AllBac in runoff}/(0.5 or 0.1 {range of BoBac/AllBac in cattle fecal samples}) × 100). In contrast, only 2–10% of the fecal contamination in runoff collected from our ungrazed and destocked sites would be bovine-associated based on these estimations. For the de-stocked sites, the relatively low levels of BoBac detected were likely due to cross-reactivity of the BoBac marker with fecal material from other ruminants (e.g., deer) [3].
It is interesting to note that large watershed scale microbial source tracking studies in Texas have reported low-moderate cattle contributions. For example, the nearby Big Elm Creek and Plum Creek watersheds found that cattle contributed approximately 6 and 23%, respectively [33]. However, these studies represent analysis of in-stream samples which differ substantially from edge-of-field runoff from small watersheds. The watershed-scale MST would also include contributions from pastures under a variety of stocking rates and other land uses, groundwater in-flows, and other contributions. In light of the previous research regarding the BoBac/AllBac in raw cattle fecal samples [3] and these MST studies conducted in Texas [33], the estimates provided by the BoBac/AllBac ratio seem reasonable.
However, to help further evaluate the results of this ratio, the BoBac/AllBac was compared to the percentage of bovine-associated contamination estimated using E. coli levels determined as follows. For each location (i.e., Welder, BCSC, Riesel), if the E. coli level at the grazed site was equal to or less than the average concentration observed at the ungrazed control site, then the percentage of E. coli from cattle was considered 0%. If the E. coli level at the grazed site exceeded the average concentration observed at the ungrazed control site, then the percentage of E. coli attributed to cattle was considered to be: ((E. coli concentration at grazed site − average E. coli concentration at ungrazed control site)/E. coli concentration at grazed site) × 100.
Utilizing this analysis of the E. coli data, we estimated that 2% of the bacterial loading, on average (ranged from 0–8%), resulted from cattle at ungrazed and destocked sites. This is similar to what we estimated using the BoBac/AllBac and further validates that the origin of the bacteria (i.e., both Bacteroides and E. coli) found in runoff when ungrazed or destocked for more than 2 weeks was from sources other than cattle. Furthermore, we estimated that 67% of the bacterial loading, on average (ranged from 64–70%), resulted from cattle when sites were stocked. This is in line with the extrapolated BoBac/AllBac results and appears reasonable considering the contributions found in large watersheds by other MST studies in Texas [33].
It should be noted that a variety of factors can impact PCR-marker based analysis. Co-extraction of substances can completely or partially inhibit PCR amplification of target markers in environmental samples [13] and result in underestimation of marker levels as observed using the BoBac/AllBac gene copy percentages. However, percent recoveries for both AllBac and BoBac gene copies in this study generally ranged from 70 to 130%, indicating that inhibition was likely not a major factor. Potential diversity in Bacteroides spp. [32], persistence of markers in recreational waters [15,34], and environmental sources of Bacteroidales of nonfecal origin [35] may also impact the accuracy of the BoBac/AllBac ratio and thus our results. However, the congruence of the BoBac/AllBac and E. coli results for stocked versus unstocked runoff samples indicate the BoBac and AllBac assays were good tools for assessing management impacts on recent cattle fecal contributions to runoff water quality.
4. Conclusions
Using host-specific markers can provide important information about sources of fecal pollution to impaired waters [2]. In this study, we evaluated how grazing management, timing of runoff in relation to grazing events, and stocking rate affect Bacteroides markers (AllBac and BoBac) levels and ratios and their relation to E. coli concentrations in runoff at the small watershed scale. The data show no significant differences in AllBac concentrations due to grazing treatment (ungrazed, properly stocked, and overgrazed sites) or correlation of AllBac concentrations to total stocking indicating other factors contributed to the AllBac concentrations observed. In contrast, BoBac concentrations were significantly higher at grazed sites and were correlated with stocking rate. Furthermore, significant correlation was observed between median annual marker concentrations (both AllBac and BoBac) and whether runoff events occurred while sites were actively or recently stocked, with median BoBac and AllBac concentrations being significantly higher when sites were stocked or recently grazed than concentrations when runoff occurred when sites were destocked. Both markers were significantly correlated with the percentage of runoff events that occurred while sites were stocked during or within 2 weeks of a runoff event. Together, these provide strong evidence that these markers provide suitable indicators of recent fecal contamination from cattle.
When sites were destocked, both the BoBac/AllBac ratio and analysis of E. coli data indicated that less than 10% of the fecal contamination originated from cattle. This finding indicates that (1) the impacts of cattle grazing on fecal loading diminish quickly when cattle are rotated to other pastures, but (2) background sources continue contributing significant concentrations of E. coli in runoff (exceeding 5900 cfu/100 mL in this study). Conversely, when sites were stocked, a large fraction of fecal contamination was bovine-associated, as indicated by both E. coli data and analysis of the BoBac/AllBac ratio in light of the prior findings regarding raw cattle fecal sample BoBac/AllBac ratios [3]. The previous findings that raw cattle fecal sample BoBac/AllBac ratios generally range from 10–50% [3] was an important consideration for interpreting our results. As such, we recommend that future studies also evaluate the BoBac/AllBac ratio in fecal samples from each watershed being assessed to assist in interpreting results.
Author Contributions
Conceptualization, K.L.W., T.J.G., R.D.H. and L.A.R.; methodology, K.L.W., T.J.G. and E.C.P.; formal analysis, K.L.W. and E.C.P.; writing—original draft preparation, K.L.W.; writing—review and editing, K.L.W., T.J.G., R.D.H. and L.A.R.; supervision, T.J.G. and L.A.R.; project administration, K.L.W.; funding acquisition, K.L.W., T.J.G. and L.A.R. All authors have read and agreed to the published version of the manuscript.
Funding
Funding for this project was provided by the Texas State Soil and Water Conservation Board, USDA-Natural Resources Conservation Service, and U.S. Environmental Protection Agency.
Institutional Review Board Statement
Analysis conducted under Texas A&M University Institutional Biosafety Committee Permit 2009030.
Acknowledgments
We recognize the Welder Wildlife Foundation, USDA-Agricultural Research Service Riesel Watersheds, Texas A&M University Soil and Aquatic Microbiology Laboratory, and Texas A&M University Beef Cattle Systems Center for all their cooperation and assistance throughout the project.
Conflicts of Interest
The authors declare no conflict of interest.
References
- Gregory, L.F.; Harmel, R.D.; Karthikeyan, R.; Wagner, K.L.; Gentry, T.J.; Aitkenhead-Peterson, J.A. Elucidating the Effects of Land Cover and Usage on Background Escherichia coli Sources in Edge-of-Field Runoff. J. Environ. Qual. 2019, 48, 1800–1808. [Google Scholar] [CrossRef]
- Weidhaas, J.L.; Macbeth, T.W.; Olsen, R.L.; Harwood, V.J. Correlation of quantitative PCR for a poultry-specific brevibacterium marker gene with bacterial and chemical indicators of water pollution in a watershed impacted by land application of poultry litter. Appl. Environ. Microbiol. 2011, 77, 2094–2102. [Google Scholar] [CrossRef] [Green Version]
- Reischer, G.H.; Ebdon, J.E.; Bauer, J.M.; Schuster, N.; Ahmed, W.; Astrom, J.; Blanch, A.R.; Bloschl, G.; Byamukama, D.; Coakley, T.; et al. Performance characteristics of qPCR assays targeting human and ruminant-associated bacteroidetes for microbial source tracking across sixteen countries on six continents. Environ. Sci. Technol. 2013, 47, 8548–8556. [Google Scholar] [CrossRef]
- Hinojosa, J.; Green, J.; Estrada, F.; Herrera, J.; Mata, T.; Phan, D.; Pasha, A.B.M.T.; Matta, A.; Johnson, D.; Kapoor, V. Determining the primary sources of fecal pollution using microbial source tracking assays combined with land-use information in the Edwards Aquifer. Water Res. 2020, 184, 116211. [Google Scholar] [CrossRef] [PubMed]
- Donnison, A.; Ross, C.; Thorrold, B. Impact of land use on the faecal microbial quality of hill-country streams. N. Z. J. Mar. Freshw. Res. 2004, 38, 845–855. [Google Scholar] [CrossRef]
- Doran, J.W.; Linn, D.M. Bacteriological quality of runoff water from pastureland. Appl. Environ. Microbiol. 1979, 37, 985–991. [Google Scholar] [CrossRef] [Green Version]
- Doran, J.W.; Schepers, J.S.; Swanson, N.P. Chemical and bacteriological quality of pasture runoff. J. Soil Water Conserv. 1981, 36, 166–171. [Google Scholar]
- Gary, H.L.; Johnson, S.R.; Ponce, S.L. Cattle grazing impact on surface water quality in a Colorado front range stream. J. Soil Water Conserv. 1983, 38, 124–128. [Google Scholar]
- Tiedemann, A.R.; Higgins, D.A.; Quigley, T.M.; Sanderson, H.R.; Marx, D.B. Responses of Fecal Coliform in Streamwater to Four Grazing Strategies. J. Range Manag. 1987, 40, 322–329. [Google Scholar] [CrossRef]
- Robbins, J.W.; Howells, D.H.; Kriz, G.J. Stream pollution from animal production units. J. Water Pollut. Control Fed. 1972, 44, 1536–1544. [Google Scholar]
- Guzman, A.J.; Fox, A.G.; Payne, B.J. Surface Runoff Transport of Escherichia coli after Poultry Litter Application on Pastureland. Trans. ASABE 2010, 53, 779–786. [Google Scholar] [CrossRef]
- Wagner, L.K.; Redmon, A.L.; Gentry, J.T.; Harmel, D.R. Assessment of Cattle Grazing Effects on E. coli Runoff. Trans. ASABE 2012, 55, 2111–2122. [Google Scholar] [CrossRef]
- Haugland, R.A.; Varma, M.; Sivaganesan, M.; Kelty, C.; Peed, L.; Shanks, O.C. Evaluation of genetic markers from the 16S rRNA gene V2 region for use in quantitative detection of selected Bacteroidales species and human fecal waste by qPCR. Syst. Appl. Microbiol. 2010, 33, 348–357. [Google Scholar] [CrossRef]
- Okabe, S.; Okayama, N.; Savichtcheva, O.; Ito, T. Quantification of host-specific Bacteroides-Prevotella 16S rRNA genetic markers for assessment of fecal pollution in freshwater. Appl. Microbiol. Biotechnol. 2007, 74, 890–901. [Google Scholar] [CrossRef]
- Dick, L.K.; Stelzer, E.A.; Bertke, E.E.; Fong, D.L.; Stoeckel, D.M. Relative decay of Bacteroidales microbial source tracking markers and cultivated Escherichia coli in freshwater microcosms. Appl. Environ. Microbiol. 2010, 76, 3255–3262. [Google Scholar] [CrossRef] [PubMed] [Green Version]
- Balleste, E.; Blanch, A.R. Persistence of Bacteroides species populations in a river as measured by molecular and culture techniques. Appl. Environ. Microbiol. 2010, 76, 7608–7616. [Google Scholar] [CrossRef] [PubMed] [Green Version]
- Layton, A.; McKay, L.; Williams, D.; Garrett, V.; Gentry, R.; Sayler, G. Development of Bacteroides 16S rRNA gene TaqMan-based real-time PCR assays for estimation of total, human, and bovine fecal pollution in water. Appl. Environ. Microbiol. 2006, 72, 4214–4224. [Google Scholar] [CrossRef] [PubMed] [Green Version]
- Field, K.G.; Chern, E.C.; Dick, L.K.; Fuhrman, J.; Griffith, J.; Holden, P.A.; LaMontagne, M.G.; Le, J.; Olson, B.; Simonich, M.T. A comparative study of culture-independent, library-independent genotypic methods of fecal source tracking. J. Water Health 2003, 1, 181–194. [Google Scholar] [CrossRef] [PubMed] [Green Version]
- Bernhard, A.E.; Field, K.G. A PCR assay to discriminate human and ruminant feces on the basis of host differences in Bacteroides-Prevotella genes encoding 16S rRNA. Appl. Environ. Microbiol. 2000, 66, 4571–4574. [Google Scholar] [CrossRef] [Green Version]
- Dick, L.K.; Bernhard, A.E.; Brodeur, T.J.; Santo Domingo, J.W.; Simpson, J.M.; Walters, S.P.; Field, K.G. Host distributions of uncultivated fecal Bacteroidales bacteria reveal genetic markers for fecal source identification. Appl. Environ. Microbiol. 2005, 71, 3184–3191. [Google Scholar] [CrossRef] [Green Version]
- Gentry, R.W.; Layton, A.C.; McKay, L.D.; McCarthy, J.F.; Williams, D.E.; Koirala, S.R.; Sayler, G.S. Efficacy of Bacteroides measurements for reducing the statistical uncertainty associated with hydrologic flow and fecal loads in a mixed use watershed. J. Environ. Qual. 2007, 36, 1324–1330. [Google Scholar] [CrossRef] [PubMed]
- Omernik, J.M. Ecoregions of the Conterminous United States. Ann. Assoc. Am. Geogr. 1987, 77, 118–125. [Google Scholar] [CrossRef]
- Harmel, D.R.; Bonta, V.J.; Richardson, W.C. The Original USDA-ARS Experimental Watersheds in Texas and Ohio: Contributions from the Past and Visions for the Future. Trans. ASABE 2007, 50, 1669–1675. [Google Scholar] [CrossRef]
- Harmel, R.D.; Richardson, C.W.; King, K.W.; Allen, P.M. Runoff and soil loss relationships for the Texas Blackland Prairies ecoregion. J. Hydrol. 2006, 331, 471–483. [Google Scholar] [CrossRef]
- Harmel, D.R.; King, W.K.; Haggard, E.B.; Wren, G.D.; Sheridan, M.J. Practical Guidance for Discharge and Water Quality Data Collection On Small Watersheds. Trans. ASABE 2006, 49, 937–948. [Google Scholar] [CrossRef]
- Harmel, D.; Wagner, K.; Martin, E.; Smith, D.; Wanjugi, P.; Gentry, T.; Gregory, L.; Hendon, T. Effects of field storage method on E. coli concentrations measured in storm water runoff. Environ. Monit. Assess. 2016, 188, 170. [Google Scholar] [CrossRef]
- United States Environmental Protection Agency. Method 1603: Escherichia coli (E. coli) in Water by Membrane Filtration Using Modified Membrane-Thermotolerant Escherichia coli Agar (Modified mTEC); Office of Water, United States Environmental Protection Agency: Washington, DC, USA, 2006.
- Walters, S.P.; Field, K.G. Survival and persistence of human and ruminant-specific faecal Bacteroidales in freshwater microcosms. Environ. Microbiol. 2009, 11, 1410–1421. [Google Scholar] [CrossRef]
- Oldham, A.L.; Duncan, K.E. Similar gene estimates from circular and linear standards in quantitative PCR analyses using the prokaryotic 16S rRNA gene as a model. PLoS ONE 2012, 7, e051931. [Google Scholar] [CrossRef]
- Ragsdale, R.M. Bacterial Source Tracking in an Eastern Tennessee Stream using Bacteroides Host Associated Real-Time Polymerase Chain Reaction Assays; University of Tennessee: Knoxville, TN, USA, 2007. [Google Scholar]
- Bell, A.; Layton, A.C.; McKay, L.; Williams, D.; Gentry, R.; Sayler, G.S. Factors influencing the persistence of fecal Bacteroides in stream water. J. Environ. Qual. 2009, 38, 1224–1232. [Google Scholar] [CrossRef] [Green Version]
- Lamendella, R.; Santo Domingo, J.W.; Yannarell, A.C.; Ghosh, S.; Di Giovanni, G.; Mackie, R.I.; Oerther, D.B. Evaluation of Swine-Specific PCR Assays Used for Fecal Source Tracking and Analysis of Molecular Diversity of Swine-Specific “Bacteroidales” Populations. Appl. Environ. Microbiol. 2009, 75, 5787–5796. [Google Scholar] [CrossRef] [Green Version]
- Gregory, L.; Gentry, T.J.M.; Mukherjee, R.; Rodriguez, E.A.; Casarez, J.A. Truesdale Texas Bacterial Source Tracking Program Application, Expansion and Marker Evaluation (FY16–FY17); Texas Water Resources Institute: College Station, TX, USA, 2018. [Google Scholar]
- Korajkic, A.; McMinn, B.R.; Ashbolt, N.J.; Sivaganesan, M.; Harwood, V.J.; Shanks, O.C. Extended persistence of general and cattle-associated fecal indicators in marine and freshwater environment. Sci. Total Environ. 2019, 650, 1292–1302. [Google Scholar] [CrossRef] [PubMed]
- Van der Wielen, P.W.; Medema, G. Unsuitability of quantitative Bacteroidales 16S rRNA gene assays for discerning fecal contamination of drinking water. Appl. Environ. Microbiol. 2010, 76, 4876–4881. [Google Scholar] [CrossRef] [PubMed] [Green Version]
Figure 1.
Box plot depicting AllBac concentrations (copies/L) at each site. The boundary of the box closest to zero indicates the 25th percentile, the solid line within the box represents the median, the dashed line represents the mean, the boundary of the box farthest from zero indicates the 75th percentile, the whiskers above and below the box indicate the 10th and 90th percentiles, and the circles indicate outliers (note that y-axis has been truncated to allow clearer observation of differences among sites resulting in outlier at BB3 (3.5 × 10⁹ gene copies/L) not being shown).

Figure 2.
BoBac concentrations (copies/L) in runoff from grazing lands at each site when stocked and destocked.
Figure 2.
BoBac concentrations (copies/L) in runoff from grazing lands at each site when stocked and destocked.

Figure 3.
Linear regression analysis showing correlation of AllBac (A–C) and BoBac (D–F) levels to E. coli levels in runoff from grazing lands.
Figure 3.
Linear regression analysis showing correlation of AllBac (A–C) and BoBac (D–F) levels to E. coli levels in runoff from grazing lands.


Figure 4.
Linear regression analysis showing correlation of AllBac and BoBac concentrations to E. coli concentrations in runoff from BCSC sites when stocked.
Figure 4.
Linear regression analysis showing correlation of AllBac and BoBac concentrations to E. coli concentrations in runoff from BCSC sites when stocked.

Figure 5.
Comparison of BoBac/AllBac ratio when sites were stocked and destocked. The error bars on each bar indicate one standard deviation.
Figure 5.
Comparison of BoBac/AllBac ratio when sites were stocked and destocked. The error bars on each bar indicate one standard deviation.


Table 1.
Comparison of annual AllBac concentrations (copies/L) with grazing management, stocking rate (AUD/hectare), and cattle presence during runoff events.
Table 1.
Comparison of annual AllBac concentrations (copies/L) with grazing management, stocking rate (AUD/hectare), and cattle presence during runoff events.
| Site-Yr § | Mean | sd | Median | Max. | Grazing Management | Annual AUD/ Hectare | Cattle on Site during Runoff-% * |
|---|---|---|---|---|---|---|---|
| BB1-1 | 1.52 × 10⁷ | 2.22 × 10⁷ | 9.49 × 10⁶ | 6.84 × 10⁷ | Ungrazed | 0 | No-0% |
| BB2-1 | 4.13 × 10⁶ | 3.25 × 10⁶ | 4.30 × 10⁶ | 1.07 × 10⁷ | Proper stocking | 147 | No-0% |
| BB3-1 | 3.58 × 10⁶ | 3.04 × 10⁶ | 3.30 × 10⁶ | 1.17 × 10⁷ | Overstocked | 312 | No-0% |
| BB1-2 | 5.88 × 10⁶ | 4.80 × 10⁶ | 3.58 × 10⁶ | 1.41 × 10⁷ | Ungrazed | 17 | Yes †-20% |
| BB2-2 | 8.72 × 10⁶ | 9.83 × 10⁶ | 4.74 × 10⁶ | 2.82 × 10⁷ | Proper stocking | 301 | Yes-67% |
| BB3-2 | 4.64 × 10⁸ | 1.23 × 10⁹ | 1.45 × 10⁷ | 3.52 × 10⁹ | Overstocked | 543 | Yes-75% |
| SW12-1 | 8.13 × 10⁶ | 4.87 × 10⁶ | 7.61 × 10⁶ | 1.62 × 10⁷ | Ungrazed | 0 | No-0% |
| SW17-1 | 6.48 × 10⁷ | 5.38 × 10⁷ | 5.22 × 10⁷ | 1.58 × 10⁸ | Proper stocking | 124 | Yes-100% |
| SW12-2 | 5.95 × 10⁶ | 7.16 × 10⁶ | 4.18 × 10⁶ | 2.39 × 10⁷ | Ungrazed | 0 | No-0% |
| SW17-2 | 6.21 × 10⁷ | 7.49 × 10⁷ | 1.58 × 10⁷ | 2.06 × 10⁸ | Proper stocking | 341 | Yes-100% |
| WWR1-1 | 4.34 × 10⁶ | 4.66 × 10⁶ | 2.74 × 10⁶ | 1.32 × 10⁷ | Ungrazed | 0 | No-0% |
| WWR3-1 | 1.01 × 10⁶ | 8.73 × 10⁵ | 6.99 × 10⁵ | 2.72 × 10⁶ | Proper stocking ‡ | 0 | No-0% |
* Percent of samples collected while site actively or recently stocked (<2 weeks). † Electric fences failed allowing cattle access to site for 7 days. ‡ Although managed at a proper stocking level, a severe drought prevented grazing the year immediately preceding all runoff events; therefore, data from these events are more representative of an ungrazed site. § Year of study at site. Note that only one year of data available at WWR1 and WWR3 due to extended drought during study.
Table 2.
Comparison of annual BoBac concentrations (copies/L) with grazing management, stocking rate (AUD/hectare), and cattle presence during runoff events.
Table 2.
Comparison of annual BoBac concentrations (copies/L) with grazing management, stocking rate (AUD/hectare), and cattle presence during runoff events.
| Site-Yr § | Mean | sd | Median | Max. | Grazing Management | Annual AUD/ Hectare | Cattle on Site during Runoff-% * |
|---|---|---|---|---|---|---|---|
| BB1-1 | 9.10 × 10³ | 7.45 × 10³ | 6.18 × 10³ | 2.31 × 10⁴ | Ungrazed | 0 | No-0% |
| BB2-1 | 6.56 × 10³ | 5.56 × 10³ | 4.59 × 10³ | 1.66 × 10⁴ | Proper stocking | 147 | No-0% |
| BB3-1 | 6.61 × 10³ | 3.75 × 10³ | 6.13 × 10³ | 1.32 × 10⁴ | Overstocked | 312 | No-0% |
| BB1-2 | 2.28 × 10⁵ | 2.84 × 10⁵ | 1.12 × 10⁵ | 7.32 × 10⁵ | Ungrazed | 17 | Yes †-20% |
| BB2-2 | 1.67 × 10⁶ | 2.48 × 10⁶ | 8.87 × 10⁵ | 6.60 × 10⁶ | Proper stocking | 301 | Yes-67% |
| BB3-2 | 7.69 × 10⁷ | 2.05 × 10⁸ | 2.90 × 10⁶ | 5.85 × 10⁸ | Overstocked | 543 | Yes-75% |
| SW12-1 | 1.26 × 10⁴ | 2.77 × 10⁴ | 1.51 × 10³ | 6.90 × 10⁴ | Ungrazed | 0 | No-0% |
| SW17-1 | 1.09 × 10⁷ | 1.23 × 10⁷ | 5.45 × 10⁶ | 3.30 × 10⁷ | Proper stocking | 124 | Yes-100% |
| SW12-2 | 1.40 × 10⁴ | 3.08 × 10⁴ | 2.17 × 10³ | 9.57 × 10⁴ | Ungrazed | 0 | No-0% |
| SW17-2 | 2.60 × 10⁷ | 3.75 × 10⁷ | 6.95 × 10⁶ | 1.03 × 10⁸ | Proper stocking | 341 | Yes-100% |
| WWR1-1 | 1.02 × 10⁵ | 1.12 × 10⁵ | 7.93 × 10⁴ | 2.92 × 10⁵ | Ungrazed | 0 | No-0% |
| WWR3-1 | 2.05 × 10⁴ | 1.88 × 10⁴ | 1.73 × 10⁴ | 4.46 × 10⁴ | Proper stocking ‡ | 0 | No-0% |
* Percent of samples collected while site actively or recently stocked (<2 weeks). † Electric fences failed allowing cattle access to site for 7 days. ‡ Although managed at a proper stocking level, a severe drought prevented grazing the year immediately preceding all runoff events; therefore, data from these events are more representative of an ungrazed site. § Year of study at site. Note that only one year of data available at WWR1 and WWR3 due to extended drought during study.
Publisher’s Note: MDPI stays neutral with regard to jurisdictional claims in published maps and institutional affiliations. |
© 2021 by the authors. Licensee MDPI, Basel, Switzerland. This article is an open access article distributed under the terms and conditions of the Creative Commons Attribution (CC BY) license (http://creativecommons.org/licenses/by/4.0/).
Share and Cite
MDPI and ACS Style
Wagner, K.L.; Gentry, T.J.; Harmel, R.D.; Pope, E.C.; Redmon, L.A. Grazing Effects on Bovine-Associated and Background Fecal Indicator Bacteria Levels in Edge-of-Field Runoff. Water 2021, 13, 928. https://doi.org/10.3390/w13070928
AMA Style
Wagner KL, Gentry TJ, Harmel RD, Pope EC, Redmon LA. Grazing Effects on Bovine-Associated and Background Fecal Indicator Bacteria Levels in Edge-of-Field Runoff. Water. 2021; 13(7):928. https://doi.org/10.3390/w13070928
Chicago/Turabian StyleWagner, Kevin L., Terry J. Gentry, R. Daren Harmel, Emily C. Pope, and Larry A. Redmon. 2021. "Grazing Effects on Bovine-Associated and Background Fecal Indicator Bacteria Levels in Edge-of-Field Runoff" Water 13, no. 7: 928. https://doi.org/10.3390/w13070928
Note that from the first issue of 2016, this journal uses article numbers instead of page numbers. See further details here.