
Thickening and Storage of Sewage Sludge Contribute to the Degradation of LAS and EOX and the Humification of Organic Matter


1
Department Polytechnic of Engineering and Architecture, University of Udine, Via del Cotonificio 108, 33100 Udine, Italy
2
Department of Agricultural, Food, Environmental and Animal Sciences (DI4A), University of Udine, Via delle Scienze 206, 33100 Udine, Italy
*
Author to whom correspondence should be addressed.
Water 2021, 13(7), 933; https://doi.org/10.3390/w13070933
Submission received: 1 March 2021
/
Revised: 23 March 2021
/
Accepted: 25 March 2021
/
Published: 29 March 2021
(This article belongs to the Special Issue Treatment and Reuse of Sewage Sludge)
Abstract
:Land application of sewage sludge on agricultural soils can be sustainable only if pollutant contents and organic matter quality meet the requirements imposed by minimization of environmental risks. This study investigated the degradation of linear alkylbenzene sulfonates (LAS) and extractable organic halogens (EOX) and the formation of humic substances (HS) during the thickening and storage phases of sewage sludge treatment. Changes in spectroscopic properties (UV-Vis, FT-IR, and excitation-emission matrix (EEM) fluorescence) of HS were also evaluated to assess the occurrence of biological activities during these curing phases of sewage sludge (SS). Humic acids (HA), fulvic acids (FA), EOX, and LAS were extracted from sewage sludge sampled from four municipal wastewater treatment plants of different size and treatment sequence, before and after 90 days of aerobic or anaerobic storage. During storage, the loss of organic C in the SS ranged from almost null to 31%. No significant changes of FA were registered, whereas HA increased in almost all samples, up to 30%. The amount of humic substances synthesized during storage correlated with the percentage of C lost. Spectroscopic changes of FA and HA showed an increase in their aromaticity, with a corresponding decrease in the aliphatic contribution. These changes show the improved agronomical quality of SS. LAS decreased during storage up to 30%, surprisingly more under anaerobic than aerobic conditions, whereas EOX decreased significantly in all samples, even up to 81%. In conclusion, although storage may be normally considered not influencing the quality of SS, their organic matter quality improved and contamination decreased during 90 days of storage, whatever the conditions of oxygen availability applied.
1. Introduction
Since the implementation of the European Council Urban Wastewater Treatment Directive 91/271/EEC [1], the annual production of sewage sludge (SS) from wastewater treatment plants (WWTPs) has been rapidly increasing [2,3,4]. The high costs of landfilling and incineration, together with principles of the circular economy, have led to the current pressing need for a cost-effective and sustainable alternative disposal method of SS [5]. The use of SS as fertilizer is a suitable recycling strategy, which increases the sustainability of agricultural production by reducing the need for synthetic inorganic fertilizers [6,7]. However, this practice may lead to soil contamination and health problems [8,9] due to the accumulation in soils of persistent organic contaminants (POPs) [10], toxic metals (e.g., Cd and Hg [11]), and the presence of pathogenic microorganisms [12]. Therefore, the sustainable use of sludge derived from WWTPs as a fertilizer in agriculture requires the adoption of efficient treatment strategies and precise specification of their properties and quality [13].
Suitable treatments and regulation of municipal and industrial waste disposal have greatly reduced risks from toxic metals and pathogens, but other types of contaminants are now becoming increasingly diffuse in SS. These emerging contaminants, among which plasticizers [14], pharmaceuticals [15], chlorinated compounds, and linear alkylbenzene sulfonates (LAS) [16,17], are not always satisfactorily eliminated during SS treatments. Nowadays, they represent the major reason of concern for the application of SS to agricultural soils [18].
LAS, introduced in 1964 as the readily biodegradable replacement for branched alkylbenzene sulfonates (BAS), are the most used anionic surfactants. They are a mixture of homologs and isomers characterized by a hydrophilic negatively charged sulfonate head-group attached to a benzene ring and a long hydrophobic alkyl tail of 10–13 carbon units [19]. LAS are widely used in cleaners and household detergents, given their low cost, excellent detergent properties, and general good biodegradability under aerobic conditions [20].
Recently, particular attention has also been given to the presence of organic halogenated compounds in municipal wastewaters. Extractable organic halogens (EOX) represent the sum of organic chlorine (Cl), iodine (I), and bromine (Br), which can be extracted by organic solvents from biosolids. These compounds include not only synthetic polychlorinated biphenyls, organochlorine pesticides, polychlorinated dibenzo-p-dioxins, or polychlorinated dibenzofurans but also those naturally produced by microorganisms, flora, and fauna [21]. During municipal wastewater treatments, organic halogens are adsorbed and concentrated on microbial biomass [22,23]. Due to the toxicity and persistence of these compounds, monitoring and control of SS are essential before their application to agricultural soils. The importance and usefulness of the EOX parameter in the evaluation of the environmental quality of SS have been demonstrated by several investigations [23,24,25]. However, the degradation of EOX during thickening and storage of SS has so far never been investigated.
Humic substances (HS), namely humic (HA) and fulvic acids (FA), are major organic constituents of sludge [26,27]. HS are considered important indicators of the biological maturity and chemical stability of sludge [28]. During sludge stabilization, labile organic matter is biologically converted into more stable HS through the humification process [29]. Their quantification has been largely used in the evaluation of the SS quality for agricultural use [30,31].
In intensively cropped and organic matter depleted soils, the SS distribution is an important strategy for its recycling [32]. In particular, the addition of HS has positive effects on the soil structure by enhancing cationic exchange capacity [33], particle aggregation [34], and the assimilation of nutrients by plants and microorganisms [35]. Moreover, HS are involved in heavy metals and xenobiotic organic molecules retention in soils [36]. Consequently, the transformation of HS during the stabilization phases of sludge is of great significance-relevance.
This study aims to investigate the degradation of LAS and EOX and the synthesis of humic substances (FA and HA) during the thickening and storage phase of SS treatment. We considered a stage that is generally neglected in the evaluation of the performance of sewage treatment plants: namely the period spent by treated sludge in thickening beds and storage facilities. To this purpose, we evaluated: (i) the effect of sludge storage on the degradation of EOX and LAS; and (ii) the changes of HS quantity and quality as an indicator of organic matter stabilization and fertilizing properties of SS.
2. Materials and Methods
2.1. Sewage Sludge
Sewage sludge samples were collected, fresh and after 90 days of storage, from four different WWTPs located in the Friuli Venezia Giulia region in the northeast of Italy. Their main characteristics are given in Table 1. Sewage sludge from plant 1 (P1), which represents a medium-size plant treating largely municipal wastewaters, was obtained after anaerobic treatment. It was then dewatered by a belt press and stored aerobically in a heap under a shelter. The sludges from plants 2 (P2), 3 (P3), and 4 (P4) were produced by small size plants treating exclusively urban sewage. Sludge P2 underwent only thickening and drying in open-air drying beds. After undergoing aerobic treatment, the sludge was stored aerobically in a heap in the open-air ground. Sludges P3 and P4 underwent aerobic digestion and were both stored (in the dark at 25 °C) in a plastic container under anaerobic conditions by substituting air with N2.
Fresh and stored SS samples (about 5 kg) were collected in polyethylene bags at the end of the sludge treatment processes (fresh) and from heaps or anaerobic containers after 90 days (stored). The bags were transported to the laboratory and immediately stored at +4 °C. For the subsequent analysis, the samples were freeze-dried with a Coolsafe 55-4 Touch lyophilizer (Labogene) and then 1-mm sieved.
2.2. Organic C and Total N Analyses
Organic carbon (Corg) and total nitrogen (Ntot) of the SS samples (fresh and stored) and extracted HS were determined with a CHN elemental analyzer (Vario Microcube, Elementar). Caffeine IAEA was used as reference material.
2.3. Extraction of Humic Substances
The isolation of HS from SS samples was performed according to the procedure recommended by the International Humic Substances Society (IHSS). Briefly, 40 g of dried sample was extracted by adding 400 mL of fully deaerated 0.1 M NaOH and shaking for 4 h under N2. The alkaline suspension was left to settle overnight. After centrifugation (20 min at 14,000 rpm), the extract was filtered (0.2 µm cellulose filters), acidified with 6 M HCl to about pH 1, and then allowed to stand for 16 h. Then, centrifugation for 20 min at 5000 rpm allowed the separation of humic acids (HA) in the precipitate and of the fulvic acid (FA) fraction (supernatant).
To purify HA, the precipitate was re-dissolved by adding a minimum volume of 0.1 M KOH under a nitrogen atmosphere with constant stirring. Solid KCl was then added to attain a concentration of 0.3 M K+, and the suspension was centrifuged to remove the suspended solids. HA were re-precipitated by adding 6 M HCl with constant stirring to pH 1.0, and the suspension was allowed to stand for 16 h. The separation was carried out by centrifugation, and the supernatant was discarded. To further reduce the ash content, HA were suspended in a 0.1 M HCl/0.3 M HF solution in a plastic container and shaken overnight at room temperature. After centrifugation, the precipitate was suspended in Milli-Q water and transferred to a Visking dialysis tube and dialyzed against distilled water until a negative Cl− test with silver nitrate (AgNO3). Purified HA were freeze-dried and then weighed.
To isolate FA, the FA fraction extract was loaded on a XAD-8 resin column. The effluent was discarded, and the XAD-8 column, containing the retained FA, was rinsed with 0.65 column volumes of distilled H2O. The adsorbed FA were desorbed from the resin with one column volume of 0.1 M NaOH, followed by two column volumes of Milli-Q water. The solution was immediately acidified with 6 M HCl to pH equal to 1, and concentrated HF was added to a final concentration of 0.3 M HF. The acidified solution was passed again through XAD-8 resin and the FA recovered by the same process described above. The eluate was passed through H+-saturated cation-exchange resin and finally freeze-dried.
2.4. Humic Substances Characterization
UV-vis spectra of HA and FA were recorded at pH 7.0 (0.1 M phosphate buffer) on a Varian Cary 1E spectrophotometer in 1 cm quartz cuvettes and scanned from 210 to 700 nm (scan rate of 60 nm min−1). The specific absorbance at 254 nm (SUVA254, L cm−1 mg−1) was calculated, normalizing the absorbance value at 254 nm by the optical path length (1 cm) and the Corg concentration in the cuvette (mg L−1). Calculation of aromaticity from SUVA254 data was performed according to ref. [37]. Determination of the E4/E6 ratios (i.e., the ratio of the absorbance measured at 445 and 665 nm) was conducted according to ref. [38].
Attenuated reflectance Fourier-transform infrared (ATR-FTIR) spectra of HA and FA were recorded with an FT-IR spectrum (100 PerkinElmer Spectrometer) equipped with an ATR device, over an interval from 4000 to 500 cm−1, with a 4 cm−1 resolution. A linear baseline correction was applied to compare spectra. Attribution of the main absorption bands was performed according to [39,40].
The excitation-emission matrix (EEM) fluorescence spectra of HA and FA were recorded in 0.1 M phosphate buffer solution at pH 7.0 (50 mg L−1 of HS) with a Cary Eclipse Fluorescence Spectrophotometer (Agilent Technologies). Solutions were irradiated in 1 cm quartz cells, thermostated at 20 °C. Scanning and recording of emission spectra (300–600 nm) were carried out at sequential 5 nm increments of excitation wavelength (λex) between 220 and 550 nm. Bandwidths for both excitation and emission were 4 nm, with emission wavelength (λem) increments of 1 nm and integration time of 0.1 s. The scans were used to generate three-dimensional contour plots of fluorescence intensity as a function of excitation and emission wavelengths. All fluorescence intensities were normalized by the Corg concentration in the cuvette. Blank spectra, recorded under the same conditions, were subtracted before normalization.
The fluorescence humification index (HIX) was calculated by dividing the area of the emission at 435–480 nm by that at 300–345 nm at λex of 254 nm [41].
2.5. EOX Analysis
Freeze-dried SS samples (1 g) were extracted with 5 mL of ethyl acetate by shaking the suspension for 24 h. Most of the solvent was then stripped from the extracts under nitrogen flow until the volume was reduced to 1 mL and stored refrigerated until analysis. The EOX content of the extracts was determined with a Trace Elemental Instrument (Euroglas ECS 1000) upgraded with digital coulometer and control software (TEIS). Instrumental parameters were: injection rate of 20 µL min−1, combustion chamber temperature of 950 °C (oxygen atmosphere), and titration cell filled with 70% acetic acid solution with silver ion concentration kept constant to 10−7 M.
2.6. LAS Analysis
HPLC-grade acetonitrile and methanol were purchased from Merck (Darmstadt, Germany). Sodium dodecyl-benzenesulfonate was used as standard (Sigma-Aldrich, St. louis, MO, USA). Standard solutions of LAS were prepared in ultrapure water, obtained from a Milli-Q water purification system (Millipore, Bedford, MA, USA).
Microwave-assisted extraction (MAE) was performed on 0.5 g of dried SS samples by adding 5 mL of methanol [42]. Then the extraction vessels were closed and introduced into the microwave extraction system (Microwave Mars 5 Digestion Oven apparatus, CEM, North Carolina, USA) with an oven power of 340 W and irradiation time of 10 min. After extraction, the vessels were cooled at room temperature. The extracts were filtered through glass wool before analysis.
Measurements were taken with a Shimadzu HPLC (LC-20AT Shimadzu Corporation Kyoto, Japan), coupled with a SIL-20AHT autosampler with a loop of 20 µL, equipped with a diode array detector (set at λex = 225 nm), a quaternary pump, a vacuum degasser, and a thermostated column compartment. The analytical cartridge column was a SUPELCOSIL LC-8 (SUPELCO, Bellefonte, PA, USA), 25.0 cm × 4.6 mm ID, 5 µm particle size. A commercial mixture of LAS with C10 to C13 chain lengths was used to prepare standard solutions at different concentrations in methanol. LAS were separated using acetonitrile-water containing 0.1 M NaClO4 (55:45) as a mobile phase. The column was thermostated at 35 °C, and injected samples (20 µL) were eluted isocratically over a 6 min run time at a flow rate of 0.8 mL min−1. Since polar interferences are eluted between 0 and 2 min, they do not interfere in the analysis.
3. Results
3.1. Chemical Characterization of SS
Chemical characteristics of sludge samples, including Corg, total N (Ntot), and content of organic C in HA (HA-C) and FA (FA-C) before and after sludge thickening and storage are reported in Table 2. Biological activity is accompanied by the production of carbon dioxide and, therefore, by the loss of organic C. The four SS displayed different degrees of loss of Corg (∆Corg, Table 2) at the end of storage. The P1 sludge did not appear to have undergone an extended biological transformation after three months, as testified by the small loss of Corg (−6%). On the contrary, sludge from plant 4 lost about 30% of its original Corg content and must have therefore undergone strong biological mineralization. Samples from plants 2 and 3 represented intermediate situations, so these SS provide a well-sorted representation of storage situations which, for different reasons, may have different impacts on post-treatment modifications of SS quality.
Very slight variations in Ntot contents were found in sludges P1, P2, and P3 after storage. This indicates that little ammonia volatilization or nitrate leaching occurred during this period in the examined samples. On the contrary, sludge P4 lost about 12% of Ntot.
The changes in C/N ratios mainly reflect C losses through mineralization (evolution of carbon dioxide). This loss was very small for the aerobically treated dewatered sewage sludge from plant 1 after 90 days of storage. However, changes in C/N ratios appear to be relatively small, even in samples P2 and P3. The higher and significant decrement (from 8.9 to 7) regarded SS from plant 4. The C/N parameter, which decreases during decomposition as a result of C loss as CO2 and which is often used to characterize the degree of stabilization of sludges and composts, is not sufficient for monitoring changes that may occur during storage of treated sewage sludge.
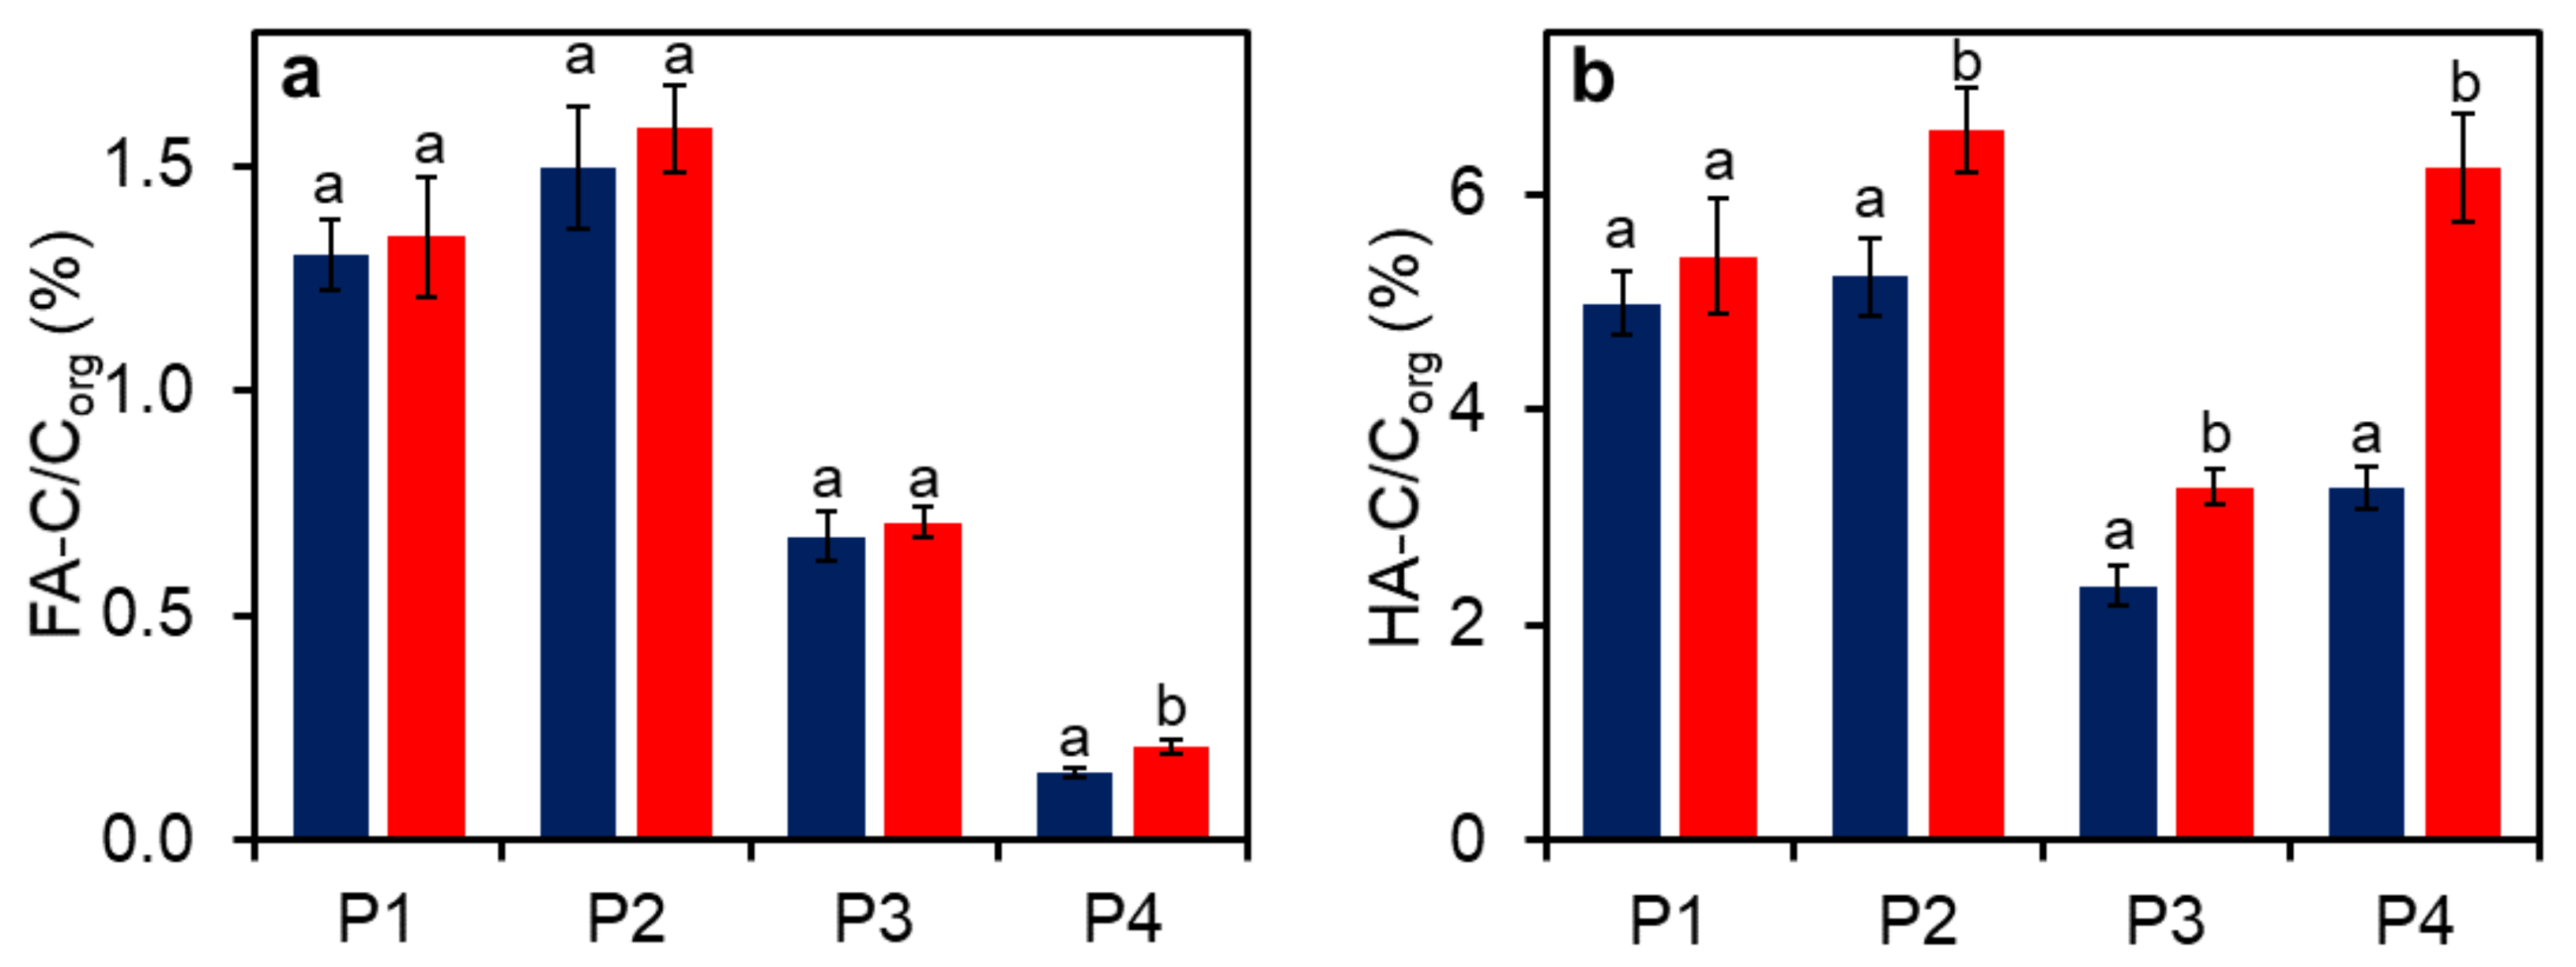
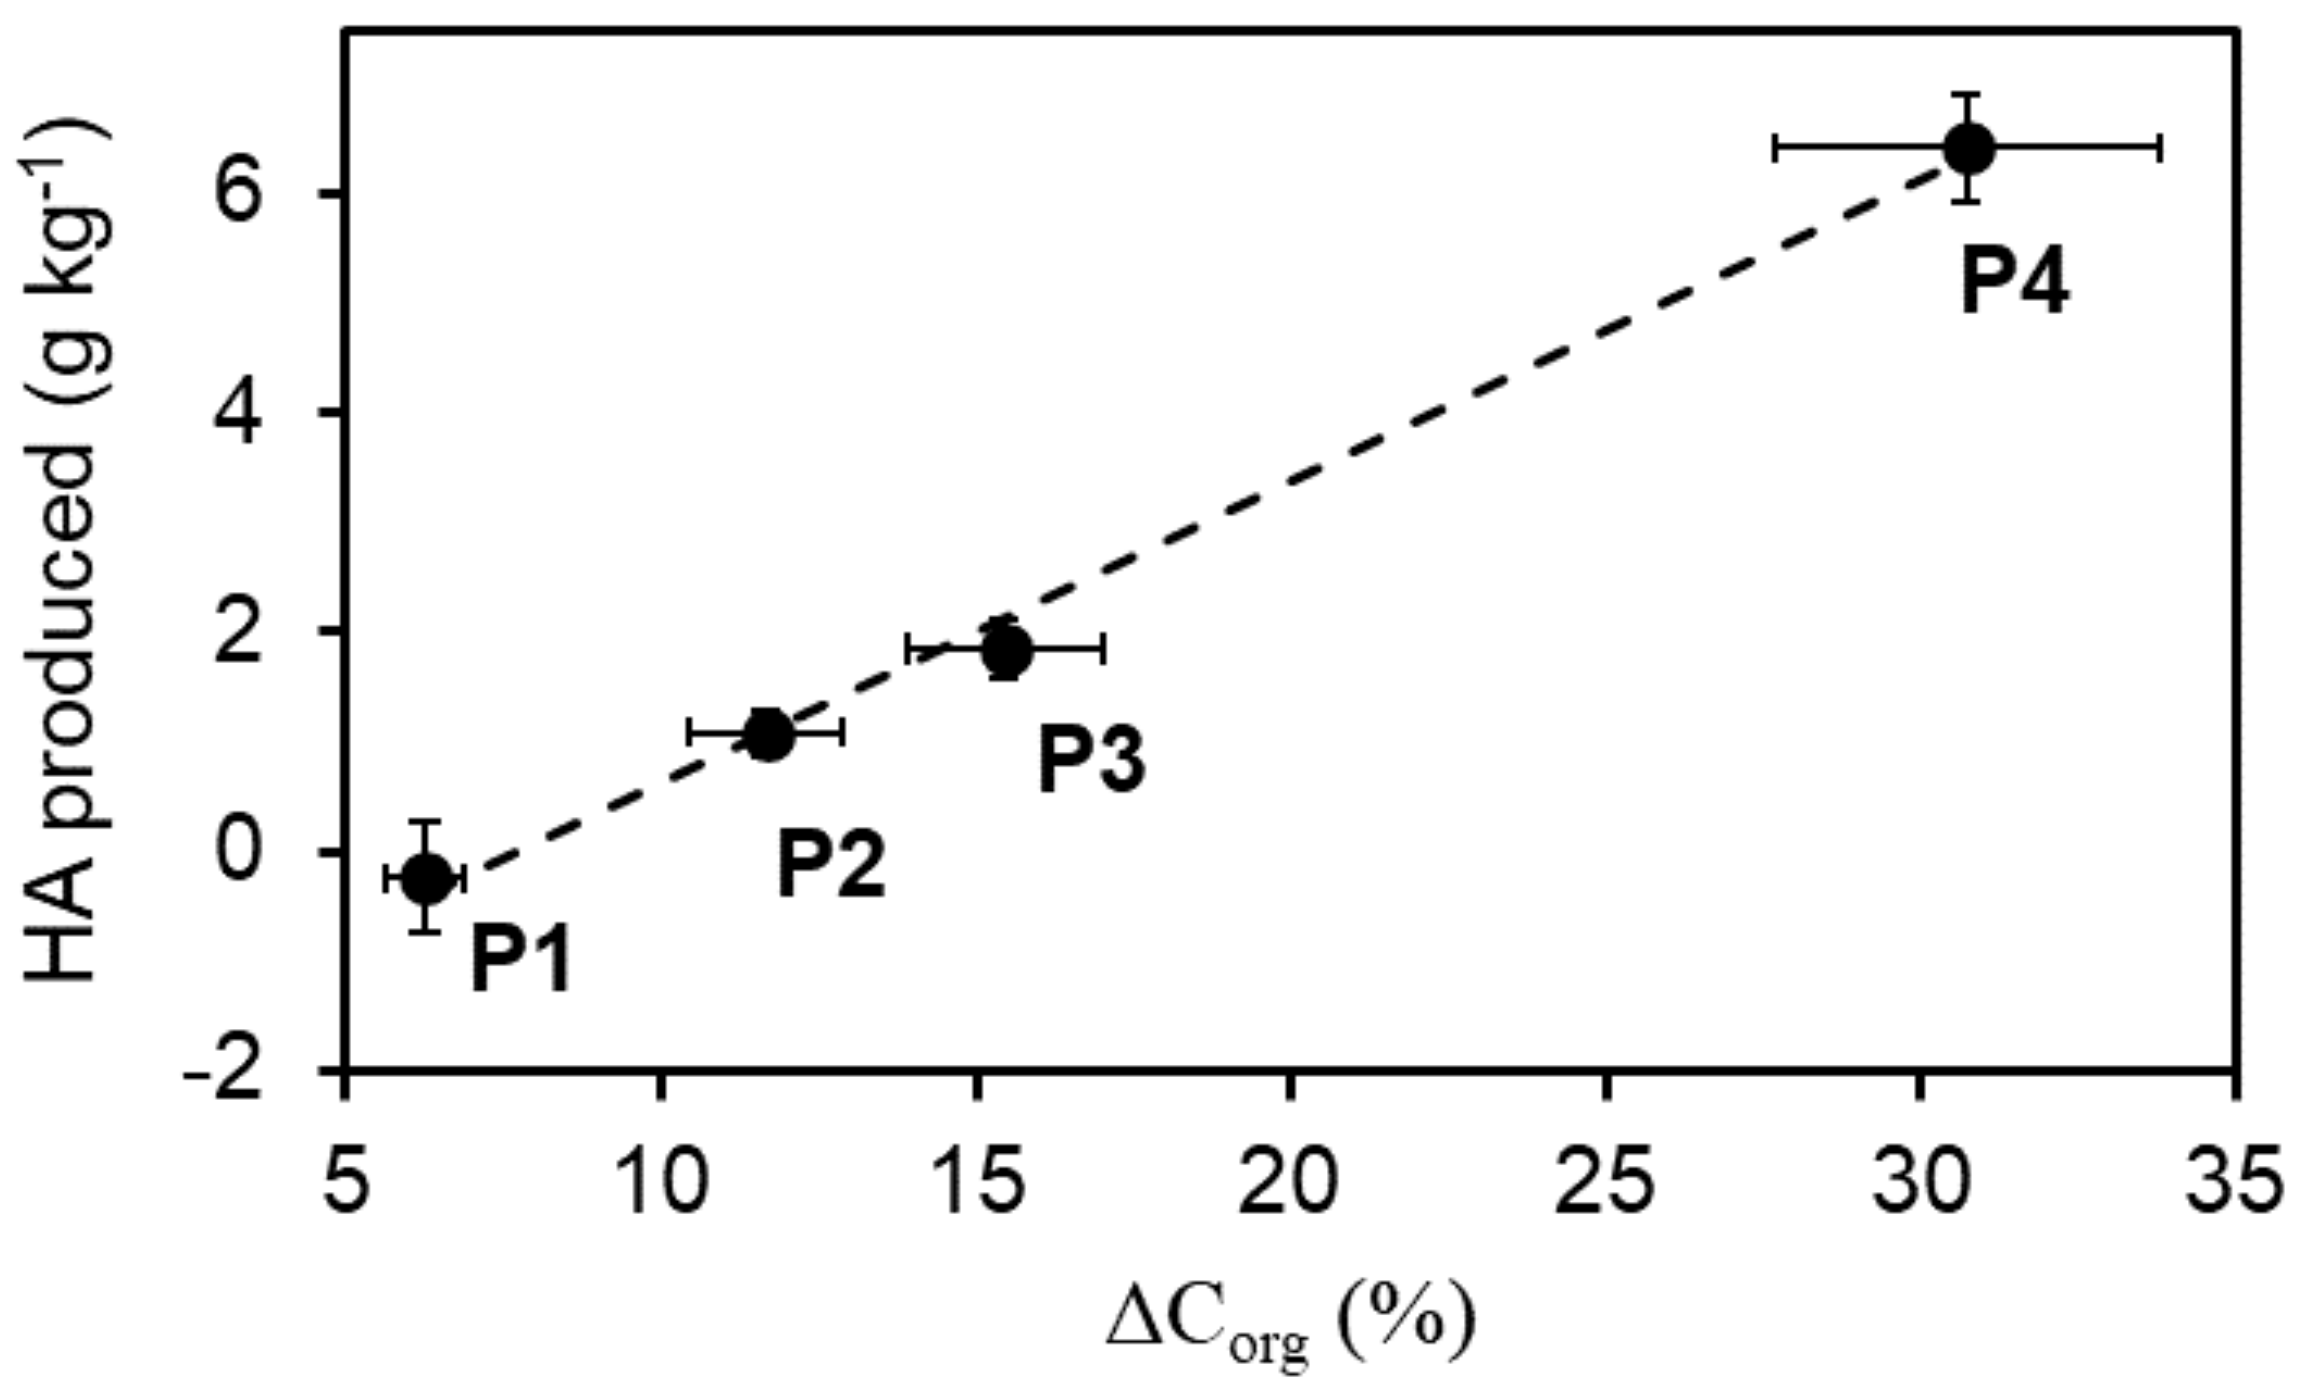
The HA and FA content in the sludge samples was expressed considering their carbon concentration (HA-C and FA-C). No significant changes in FA-C were registered in all stored samples (Table 2). This stability, however, was only apparent as an increase of the percentage of FA-C to the total Corg content of the sludge was observed, after storage, in all samples unless it was statistically significant only in P4 (Figure 1a). At the same time, the percent content of HA-C to Corg increased significantly in all stored sludges during the three months that followed the end of the SS treatment, except in P1 (Figure 1b). The amount of HA produced during storage was strongly related to the loss of Corg that occurred during this period and is therefore evidently related to the intensity of biological transformations that have occurred and that are confirmed by the Corg loss (Figure 2). The total amount of humified C, (FA+HA)-C, increased in the three months of the storage period in all sludge samples except that from plant 1, where sewage and SS underwent the most intensive treatment.
3.2. UV-Vis Characteristics of HA and FA
UV-vis spectra of HA and FA extracted from the sludge samples before and after storage are shown in Figure S1 (Supplementary Materials). In all spectra, absorbance decreased monotonically with increasing wavelength. The presence of a shoulder between 240 and 290 nm is related to absorbance by aromatic groups or unsaturated compounds (tryptophan, conjugation of quinone, and ketones) [43]. Compared to fresh samples, the higher absorption in this region reported by HA and FA from stored samples indicates increased aromaticity after storage. In fact, except for HS from sample P1, the SUVA254 values (and consequently the % of aromaticity) significantly increased in both HA and FA after storage (Table 3). The E4/E6 ratio has a negative correlation with the humification degree, molecular size, and condensation. The E4/E6 ratios of HA and FA varied after storage in all samples except for HA of plant 1. Oxic conditions during the storage (plants 1 and 2) favored the breakdown of large humic molecules, reflected by the increase in E4/E6 ratios. This pointed out also the enrichment of HS with oxygen functional groups [44]. Anaerobic conditions during storage (plants 3 and 4) resulted in an apparent increase in molecular sizes in both FA and HA.
3.3. FT-IR Spectra of HA and FA
All ATR-FTIR spectra of HA and FA extracted from sewage sludge before and after storage are reported in Figure S2. The obtained spectra of HA were very similar to each other, displaying the typical absorption bands of HA extracted from SS [39,40]: O–H and N–H stretching around 3400–3300 cm−1, aliphatic C–H stretching at 2930 cm−1, carboxyl and ketonic carbonyl stretching at 1710 cm−1, visible as a shoulder merged with the much more intense 1650–1620 cm−1 (conjugated carbonyl C=O and aromatic C=C) absorption band. The band at 1560–1530 cm−-1 is attributed to N–H vibrations. Absorption due to CH2 bending, O–H deformation, and C–O stretching of phenolic groups is visible in the region 1485–1400 cm−1, C–O stretching and O–H deformation of COOH groups around 1200 cm−1, and stretching of carbohydrate or alcoholic C–O at 1040 cm−1. The FA spectra appeared similar to those of HA; the only differences were the non-splitting of the band in the 2940–2860 cm−1 region and the absence of any absorption in the 1450 cm−1 region. These differences could be attributed to a lower content of aliphatic chains in FA [45].
Some shifts and intensity variations were observed after the storage period. Coherently with other techniques and parameters, small changes were observed in HA from all plants and were mostly limited to a decrease in intensity of absorbance in regions related to stretching and bending vibrations of carbohydrates and a slight relative increase of carboxyls (1720 cm−1). In fact, the 1720/1040 cm−1 intensity ratio decreased up to 24% in P4.
3.4. EEM Fluorescence Spectra of Humic Substances
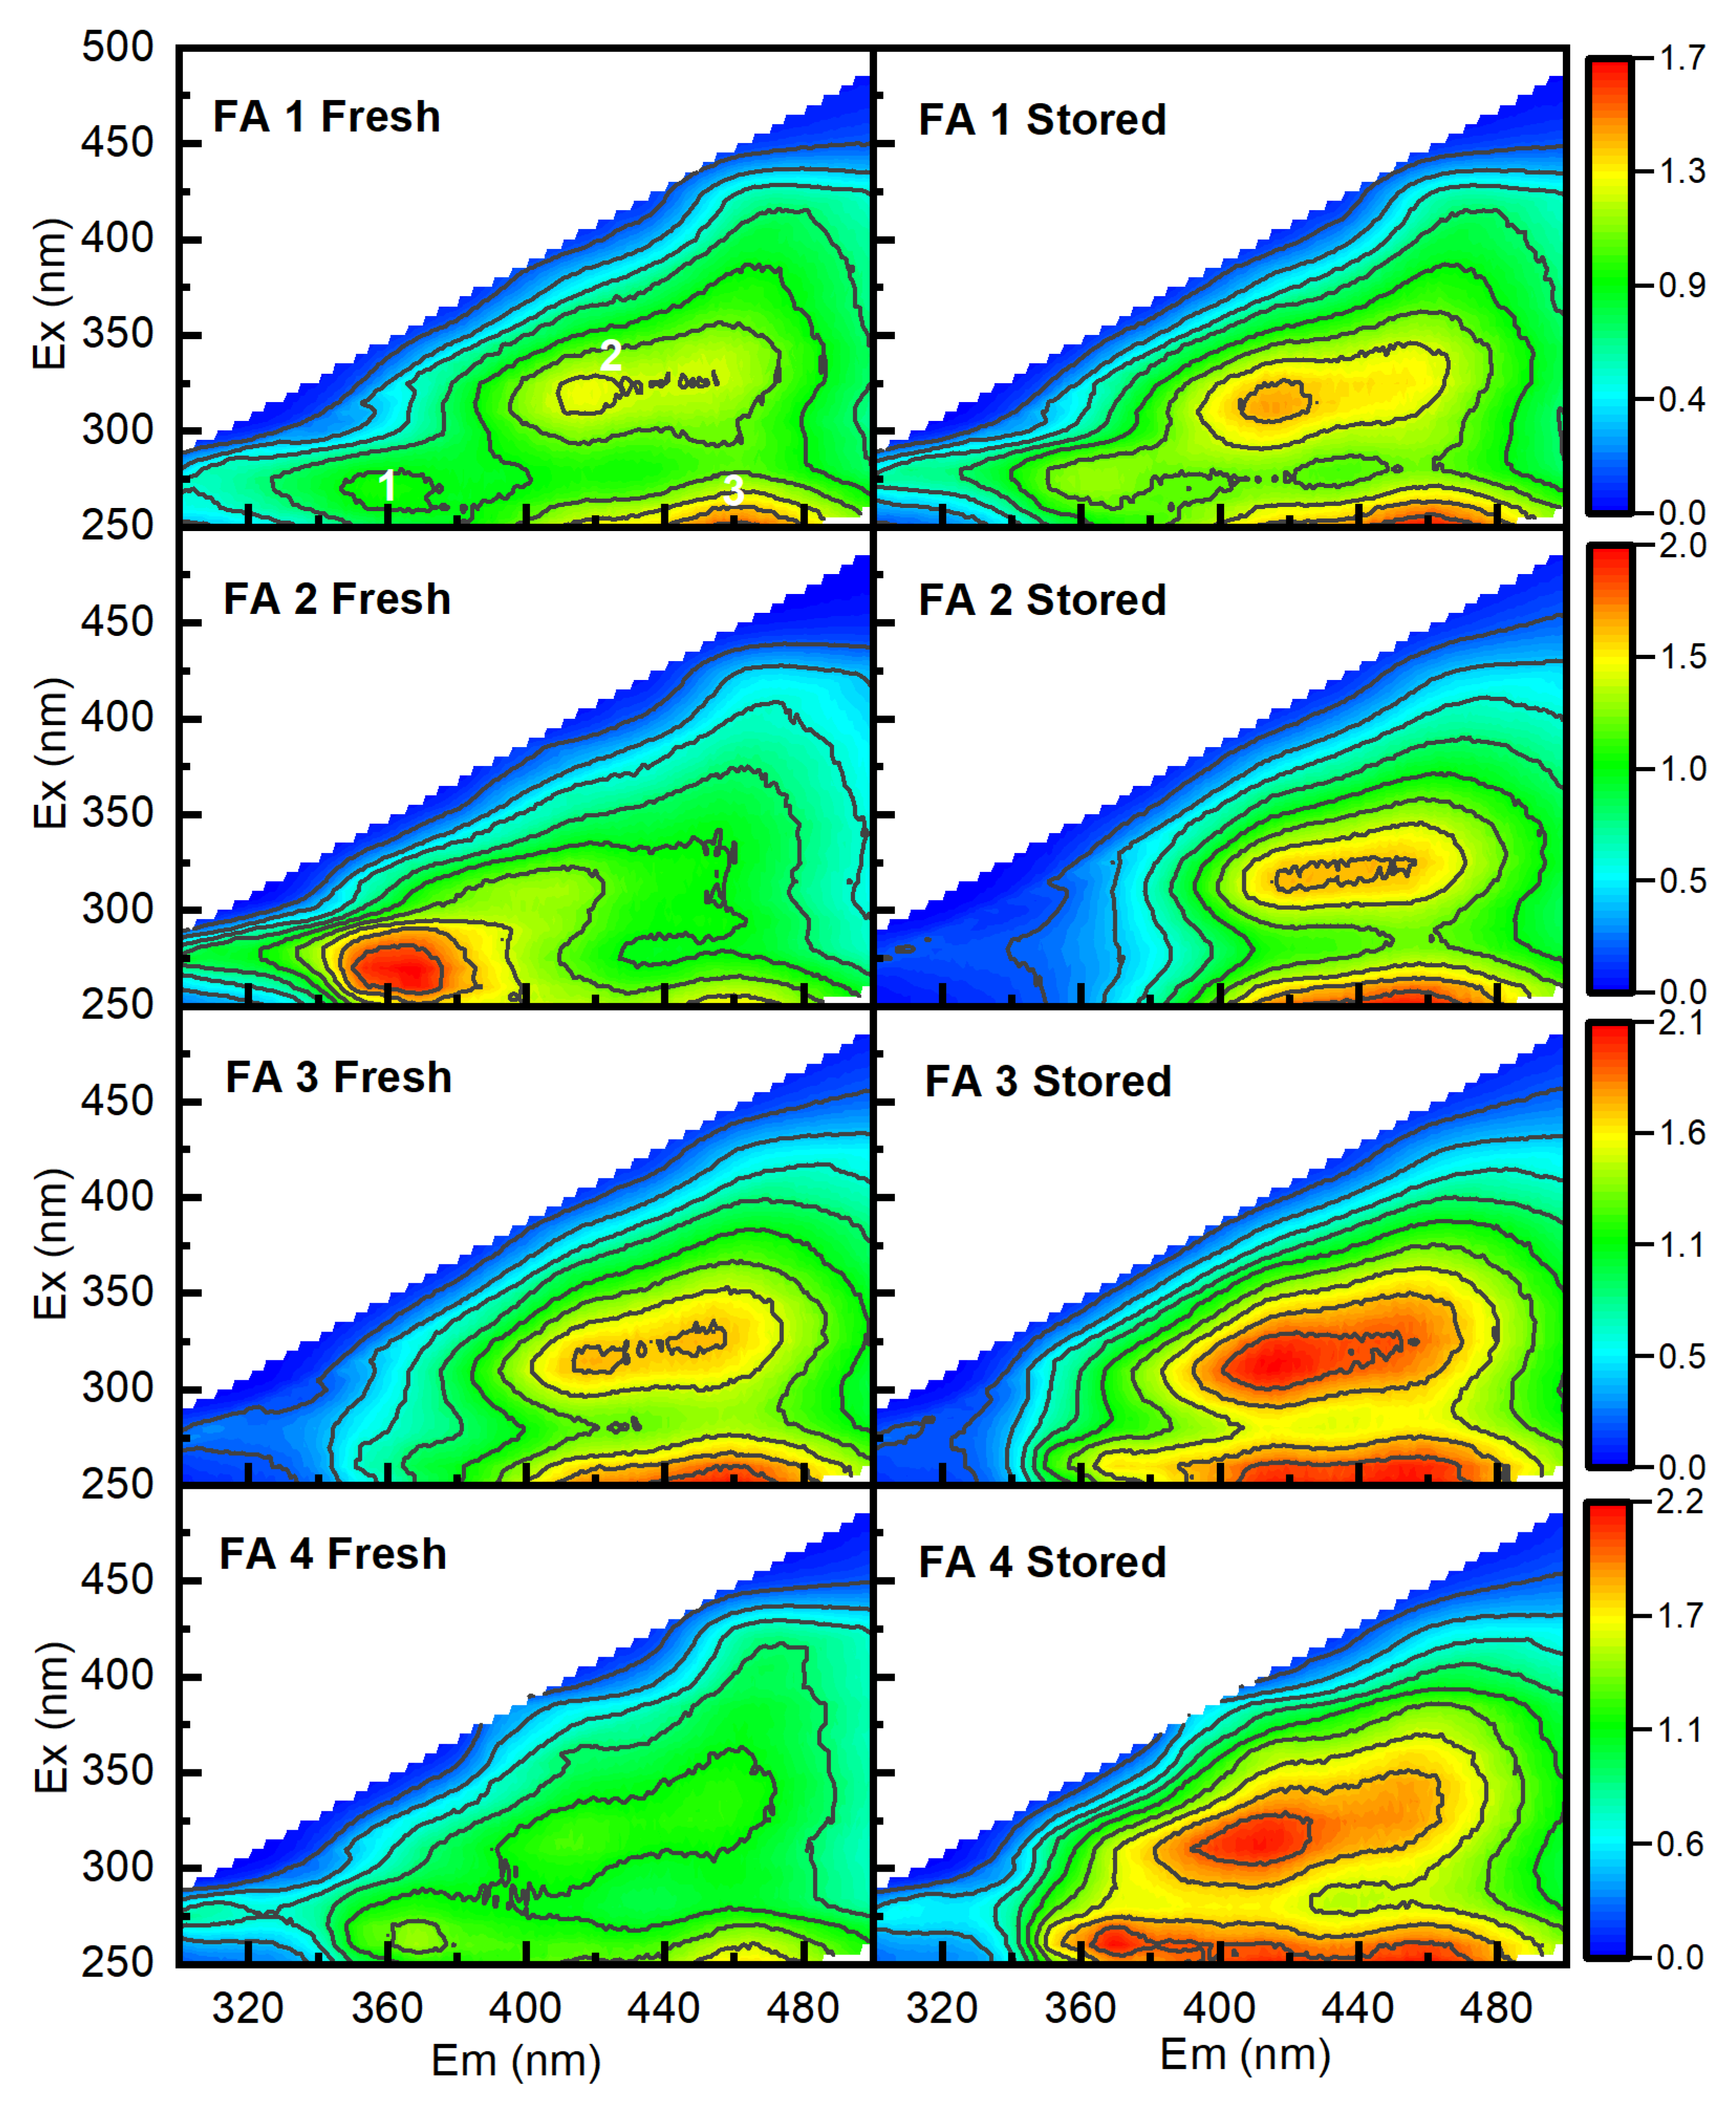
As shown in Figure 3, three main peaks were detected in the normalized EEM spectra of FA extracted from fresh sludge from plant 1. Peak 1 was characterized by an Ex/Em wavelength range of 260–280/330–350 nm, which is attributed to soluble microbial byproducts and frequently disappears with stabilization [46]. This peak was already very little expressed in this sample compared to samples P2 and P4. As reported by ref. [47], the level of non-humic substances is relatively high in SS before treatment, but fluorescence emitted by these components is expected to progressively decrease with the stabilization degree achieved by the organic materials. This indeed occurred in FA in sample P2, but it was not even detectable in sample P3, which, in the fresh sample, already displayed peaks typical of well-humified FA. These peaks (namely peaks 2 and 3) were characterized by Ex/Em wavelength ranges of 300–340/400–430 and 250–260/450–470 nm, respectively, which are related to typical FA components.
Comparing the EEM spectra of FA before and after storage in all samples, it is possible to observe that storage did cause increments in the intensity of peaks 2 and 3, with the only exception of the well-stabilized fresh sludge in P1, where no significant changes were observed.
In the EEM spectra of HA (Figure 4), peak A was characterized as peak 1 in EEM spectra of FA, by an Ex/Em wavelength range of 260–280/330 nm. Except for sample P3, the level of non-humic substances was relatively high at the beginning of the process. Peak B was centered at an Ex/Em wavelength range of 330–360/420–460 nm and could be identified as an HA component. Considering EEM spectra of HA extracted from P1 after storage, the fluorescence intensity (FI) of peaks A and B presented very slight decreasing and increasing trends, respectively.
Much stronger changes were observed in the other three samples. In sample P2, the EEM spectrum of fresh HA differentiated significantly from that of stored. In fact, the intense peak A almost disappeared after storage. Peak B, on the other hand, displayed a low intensity in HA from the fresh P2 sample, but his peak became more intense after storage. Moreover, a new fluorescence peak (peak C) with an Ex/Em wavelength range of 250–275/450–480 nm appeared in stored HA from plant 2. This peak could be referred to as humic components [46]. These changes indicated that humification occurred during storage in this sludge sample. In HA from P3, while no changes observed in peak A, the intensities of peak B and C increased almost twice, coherently with the intense biological activity testified by the >15% loss in Corg.
EEM features are often summarized and evaluated by calculating the Zsolnay humification index (HIX) [41]. HIX values are reported in Table 4 and increased after storage as a consequence of shifting of the emission spectra toward longer wavelengths (red-shifting of fluorescence emission) that occurs with humification and aromaticity degree [48,49,50].
In HA from sample P4, peak B doubled its intensity after anaerobic storage. However, the EEM fluorescence spectra of stored HA from plant 4 displayed a very strong intensity of emission for peak A, typical of poorly humified materials. Probably the increase of this peak is related to the strong biological activity that occurred in this sludge during the 3 months of anaerobic storage, which is testified by the strong decrease in Corg registered and which, under the controlled anaerobic conditions maintained during storage, may have caused a massive release of microbial byproducts.
3.5. EOX and LAS
The concentrations of EOX (mg kg−1 d.w.) in SS samples from the four different WWTPs before and after storage are shown in Table 5. Results indicated that, in general, storage caused a decrease in the EOX concentration in sludge samples from all plants. This indicated that reductive dehalogenation occurred during storage. The reduction of EOX concentration was 14, 81, 29, and 30% in samples P1, P2, P3, and P4, respectively.
Oxygen availability within the SS is limited even in aerobic storage. Some oxygen may be taken in because of the progressive emptying of pores during drying, but most of the SS heap remains anaerobic, especially when sludge is stored in the open during rainy periods, as in plant 2. These conditions favored reductive dehalogenation of EOX, which can be used as electron acceptors by anaerobic microorganisms. The anaerobically stored samples (P3 and P4) showed indeed about a 30% percent decreases in EOX.
No significant changes of LAS were observed in samples P1 and P2, while, surprisingly, LAS concentration decreased by 30 and 20% in P3 and P4, respectively (Table 5). These results are opposite to expectations since LAS are preferentially decomposed under aerobic conditions. The larger microbial activity in P3 and P4 was responsible for LAS degradation even under anaerobic conditions.
4. Discussion
The aerobic or anaerobic storage of SS for 90 days increased the amount of HA and FA with a parallel decrease in their C content (Table 2). The small changes observed in P1 were probably due to the more intense treatment of wastewater and SS before thickening and storage, rather than its aerobic storage.
During sludge storage, part of the organic matter is mineralized to carbon dioxide, ammonia, and water, whereas the other part is transformed into HS. In all samples, the content of HA was higher than FA, as reported in other studies [28,51]. FA are synthesized and transformed, probably in HA, at the same rate during storage, so their total amount did not change significantly during storage. The content of HA increased significantly but at a different rate in the three treatments. SS from P4 was the more active with an increment in HS of about 30%.
Qualitative changes of HA that occurred during SS storage could be due to the degradation of highly aliphatic structural moieties, such as fatty acids. This caused a relative increment of more stable aromatic compounds [52,53], as confirmed by the increase of aromaticity observed by UV-Vis spectrometry (Table 3). EEM fluorescence and even UV spectra appeared to be much more sensitive than FT-IR spectroscopy to detect modifications of HA and FA during thickening and storage.
Both EOX and LAS are hydrophobic contaminants: they tend to become sorbed onto hydrophobic surfaces and therefore to accumulate in SS [42,54]. However, while EOX are sparingly soluble, on the contrary, LAS are highly soluble because of the ionized hydrophilic sulfonate groups in their structure [54]. Consequently, LAS may easily adhere to hydrophobic moieties of other molecules with their hydrophobic tail and may co-precipitate with them.
Contamination of SS may be therefore driven in the case of EOX by their low solubility and tendency to partition sorption on hydrophobic moieties of the HA and FA.
On the other hand, in the case of LAS, sludge contamination may be driven not only by hydrophobic sorption but also by mechanic trapping into aggregated HS of these contaminants during flocculation.
Surprisingly, LAS degradation was more intense in SS stored anaerobically than in those stored aerobically. The reasons may be different according to the two SS: SS from P1 undergo very limited biological transformations, as testified by low C loss and absence of HS synthesis. On the other side, SS from P2 had a very low content of LAS, closer to the method detection limit, which limited the possibility to observe significant changes.
5. Conclusions
This work showed that several quantitative and qualitative changes occurred in the humic fraction of SS organic matter, during thickening and storage, under both aerobic and anaerobic conditions. These changes were particularly intense in SS originated from milder treatments of wastewater. The modifications in the molecular structure of HA were a direct consequence of SS storage practices. Storage of SS produced by WWTPs, either under aerobic or anaerobic conditions, decreased their content of LAS and EOX and increased the quantity of HS. All these changes ameliorated the agronomical properties of SS and, therefore, their beneficial effects on soil fertility.
Supplementary Materials
The following are available online at https://www.mdpi.com/article/10.3390/w13070933/s1, Figure S1: UV-Vis spectra of HA and FA, Figure S2: FT-IR spectra of HA and FA.
Author Contributions
Conceptualization, M.C. and D.G.; methodology, A.K. and C.B.; investigation, A.K. and C.B.; resources, A.K.; data curation, A.K. and M.C.; writing—original draft preparation, A.K. and C.B.; writing—review and editing, M.C.; visualization, C.B.; supervision, D.G.; funding acquisition, D.G. All authors have read and agreed to the published version of the manuscript.
Funding
This research was funded by the Province of Udine (Italy) as part of the PhD course ”Integrated water cycle sustainability: new characterization perspectives for sludge”.
Institutional Review Board Statement
Not applicable.
Informed Consent Statement
Not applicable.
Data Availability Statement
All data used during the study appear in the submitted article.
Acknowledgments
The authors thank Andrea Milocco of CAFC Spa and Paolo Dreossi of Acquedotto Poiana Spa, together with all the personnel of these water companies, for providing the samples and the help in this study.
Conflicts of Interest
The authors declare no conflict of interest.
References
- EUR-Lex Council Directive 91/271/EEC of 21 May 1991 concerning urban waste-water treatment. Off. J. Eur. Communities 1991, 135, 40–52.
- Hong, J.; Hong, J.; Otaki, M.; Jolliet, O. Environmental and economic life cycle assessment for sewage sludge treatment processes in Japan. Waste Manag. 2009, 29, 696–703. [Google Scholar] [CrossRef] [PubMed]
- Kelessidis, A.; Stasinakis, A.S. Comparative study of the methods used for treatment and final disposal of sewage sludge in European countries. Waste Manag. 2012, 32, 1186–1195. [Google Scholar] [CrossRef] [PubMed]
- Przydatek, G.; Wota, A.K. Analysis of the comprehensive management of sewage sludge in Poland. J. Mater. Cycles Waste Manag. 2020, 22, 80–88. [Google Scholar] [CrossRef] [Green Version]
- Collivagnarelli, M.C.; Abbà, A.; Frattarola, A.; Carnevale Miino, M.; Padovani, S.; Katsoyiannis, I.; Torretta, V. Legislation for the Reuse of Biosolids on Agricultural Land in Europe: Overview. Sustainability 2019, 11, 6015. [Google Scholar] [CrossRef] [Green Version]
- Urbaniak, M.; Wyrwicka, A.; Tołoczko, W.; Serwecińska, L.; Zieliński, M. The effect of sewage sludge application on soil properties and willow (Salix sp.) cultivation. Sci. Total Environ. 2017, 586, 66–75. [Google Scholar] [CrossRef]
- Seleiman, M.F.; Santanen, A.; Mäkelä, P.S. Recycling sludge on cropland as fertilizer–Advantages and risks. Resour. Conserv. Recycl. 2020, 155, 104647. [Google Scholar] [CrossRef]
- Latosińska, J.; Kowalik, R.; Gawdzik, J. Risk Assessment of Soil Contamination with Heavy Metals from Municipal Sewage Sludge. Appl. Sci. 2021, 11, 548. [Google Scholar] [CrossRef]
- Anjum, M.; Al-Makishah, N.A.; Barakat, M.A. Wastewater sludge stabilization using pre-treatment methods. Process Safe Environ. Protect. 2016, 102, 615–632. [Google Scholar] [CrossRef]
- Clarke, B.O.; Porter, N.A. Persistent organic pollutants in sewage sludge: Levels, sources, and trends. In Contaminants of Emerging Concern in the Environment: Ecological and Human Health Considerations; Halden, R.U., Ed.; American Chemical Society: Washington, DC, USA, 2010; pp. 137–171. [Google Scholar] [CrossRef]
- McBride, M.B. Toxic metals in sewage sludge-amended soils: Has promotion of beneficial use discounted the risks? Adv. Environ. Res. 2003, 8, 5–19. [Google Scholar] [CrossRef]
- Singh, R.P.; Agrawal, M. Potential benefits and risks of land application of sewage sludge. Waste Manag. 2008, 28, 347–358. [Google Scholar] [CrossRef]
- Lamastra, L.; Suciu, N.A.; Trevisan, M. Sewage sludge for sustainable agriculture: Contaminants’ contents and potential use as fertilizer. Chem. Biol. Technol. 2018, 5, 1–6. [Google Scholar] [CrossRef]
- Corradini, F.; Meza, P.; Eguiluz, R.; Casado, F.; Huerta-Lwanga, E.; Geissen, V. Evidence of microplastic accumulation in agricultural soils from sewage sludge disposal. Sci. Total Environ. 2019, 671, 411–420. [Google Scholar] [CrossRef]
- Díaz-Cruz, M.S.; García-Galán, M.J.; Guerra, P.; Jelic, A.; Postigo, C.; Eljarrat, E.; Farré, M.; López de Alda, M.J.; Petrovic, M.; Barceló, D. Analysis of selected emerging contaminants in sewage sludge. TrAC Trends Anal. Chem. 2009, 28, 1263–1275. [Google Scholar] [CrossRef]
- Ju, J.H.; Lee, I.S.; Sim, W.J.; Eun, H.; Oh, J.E. Analysis and evaluation of chlorinated persistent organic compounds and PAHs in sludge in Korea. Chemosphere 2009, 74, 441–447. [Google Scholar] [CrossRef] [PubMed]
- De Wolf, W.; Feijtel, T. Terrestrial risk assessment for linear alkyl benzene sulfonate (LAS) in sludge-amended soils. Chemosphere 1998, 36, 1319–1343. [Google Scholar] [CrossRef]
- Smith, S.R. Organic contaminants in sewage sludge (biosolids) and their significance for agricultural recycling. Philos. Trans. R. Soc. 2009, 367, 4005–4041. [Google Scholar] [CrossRef] [Green Version]
- Traverso-Soto, J.M.; González-Mazo, E.; Lara-Martín, P.A. Analysis of surfactants in environmental samples by chromatographic techniques. In Chromatography—The Most Versatile Method of Chemical Analysis; de Azevedo Calderon, L., Ed.; InTech: Vienna, Austria, 2012; pp. 187–216. [Google Scholar] [CrossRef] [Green Version]
- Zhou, Y.; Zhang, Z.; Zhang, L.; Xu, S.; Guo, B.; Liu, Y.; Xia, S. Promoting waste activated sludge reduction by linear alkylbenzene sulfonates: Surfactant dose control extracellular polymeric substances solubilization and microbial community succession. J. Hazard. Mater. 2019, 374, 74–82. [Google Scholar] [CrossRef]
- Asplund, G.; Grimvall, A. Organohalogens in Nature. Environ. Sci. Technol. 1991, 25, 1346–1350. [Google Scholar] [CrossRef]
- Bornhardt, C.; Drewes, J.E.; Jekel, M. Removal of organichalogens (AOX) from municipal wastewater by powdered activatedcarbon (PAC)/activated sludge (AS) treatment. Water Sci. Technol. 1997, 35, 147–153. [Google Scholar] [CrossRef]
- Goi, D.; Tubaro, F.; Dolcetti, G. Analysis of metals and EOX in sludge from municipal wastewater treatment plants: A case study. Waste Manag. 2006, 26, 167–175. [Google Scholar] [CrossRef]
- Rodziewicz, M.; Kaczmarczyk, A.; Niemirycz, E. Poly-chlorinated biphenyls in sediments of the Odra River and its tributaries. Pol. J. Environ. Stud. 2004, 13, 203–208. [Google Scholar]
- Contreras Lopez, M.C. Determination of potentially bioaccumulating complex mixtures of organochlorine compound in wastewater: A review. Environ. Int. 2003, 28, 751–759. [Google Scholar] [CrossRef]
- Ayuso, M.; Moreno, J.L.; Hernández, T.; García, C. Characterisation and evaluation of humic acids extracted from urban waste as liquid fertilisers. J. Sci. Food Agric. 1997, 75, 481–488. [Google Scholar] [CrossRef]
- Wilén, B.M.; Jin, B.; Lant, P. The influence of key chemical constituents in activated sludge on surface and flocculating properties. Water Res. 2003, 37, 2127–2139. [Google Scholar] [CrossRef]
- Li, H.; Li, Y.; Li, C. Characterization of humic acids and fulvic acids derived from sewage sludge. Asian J. Chem. 2013, 25, 10087–10091. [Google Scholar] [CrossRef]
- Watteau, F.; Villemin, G. Characterization of organic matter microstructure dynamics during co-composting of sewage sludge, barks and green waste. Bioresour. Technol. 2011, 102, 9313–9317. [Google Scholar] [CrossRef] [PubMed]
- Zucconi, F.; Pera, A.; Forte, M.; de Bertoldi, M. Evaluating toxicity of immature compost. Biocycle 1981, 22, 54–57. [Google Scholar]
- El Fels, L.; Mohamed, Z.; El Asli, A.; Hafidi, M. Assessment of biotransformation of organic matter during co-composting of sewage sludge-lignocelullosic waste by chemical, FTIR analyses, and phytotoxicity tests. Int. Biodeterior. Biodegrad. 2014, 87, 128–137. [Google Scholar] [CrossRef]
- Garcia, C.; Hernandez, T.; Costa, F. Characterization of humic acids from uncomposted and composted sewage sludge by degradative and non-degradative techniques. Bioresour. Technol. 1992, 41, 53–57. [Google Scholar] [CrossRef]
- Sharif, M.; Khattak, R.A.; Sarir, M.S. Effect of different levels of lignitic coal derived humic acid on growth of maize plants. Commun. Soil Sci. Plant Anal. 2002, 33, 3567–3580. [Google Scholar] [CrossRef]
- Bronick, C.J.; Lal, R. Soil structure and management: A review. Geoderma 2005, 124, 3–22. [Google Scholar] [CrossRef]
- Nardi, S.; Ertani, A.; Francioso, O. Soil–root cross-talking: The role of humic substances. J. Plant Nutr. Soil Sci. 2017, 180, 5–13. [Google Scholar] [CrossRef]
- Senesi, N.; Miano, T.M.; Brunetti, G. Humic substances in organic amendments and effects on native soil humic substances. In Humic Substances in Terrestrial Ecosystems; Piccolo, A., Ed.; Elselvier: Amsterdam, The Netherlands, 1996; pp. 531–593. [Google Scholar] [CrossRef]
- Roccaro, P.; Yan, M.; Korshin, G.V. Use of log-transformed absorbance spectra for online monitoring of the reactivity of natural organic matter. Water Res. 2015, 84, 136–143. [Google Scholar] [CrossRef] [PubMed]
- Chen, Y.; Senesi, N.; Schnitzer, M. Information provided on humic substances by E4/E6 ratios. Soil Sci. Soc. Am. J. 1977, 41, 352–358. [Google Scholar] [CrossRef]
- Inbar, Y.; Chen, Y.; Hadar, Y. Solid-state carbon-13 nuclear magnetic resonance and infrared spectroscopy of composed organic matter. Soil Sci. Soc. Am. J. 1989, 53, 1695–1701. [Google Scholar] [CrossRef]
- Polak, J.; Sułkowski, W.W.; Bartoszek, M.; Papież, W. Spectroscopic studies of the progress of humification processes in humic acid extracted from sewage sludge. J. Mol. Struct. 2005, 744, 983–989. [Google Scholar] [CrossRef]
- Zsolnay, A.; Baigar, E.; Jimenez, M.; Steinweg, B.; Saccomandi, F. Differentiating with fluorescence spectroscopy the sources of dissolved organic matter in soils subjected to drying. Chemosphere 1999, 38, 45–50. [Google Scholar] [CrossRef]
- Villar, M.; Callejon, M.; Jimenez, J.C.; Alonso, E.; Guiraum, A. Optimization and validation of a new method for analysis of linear alkylbenzene sulfonates in sewage sludge by liquid chromatography after microwave-assisted extraction. Anal. Chim. Acta 2007, 599, 92–97. [Google Scholar] [CrossRef]
- Chin, Y.P.; Aiken, G.; O’Loughlin, E. Molecular Weight, Polydispersity, and Spectroscopic Properties of Aquatic Humic Substances. Environ. Sci. Technol. 1994, 28, 1853–1858. [Google Scholar] [CrossRef]
- Pajączkowska, J.; Sułkowska, A.; Sułkowski, W.W.; Jędrzejczyk, M. Spectroscopic study of the humification process during sewage sludge treatment. J. Mol. Struct. 2003, 651, 141–149. [Google Scholar] [CrossRef]
- Riffaldi, R.; Sartori, F.; Levi-Minzi, R. Humic substances in sewage sludges. Environ. Pollut. Ser. B Chem. Phys. 1982, 3, 139–146. [Google Scholar] [CrossRef]
- Chen, W.; Westerhoff, P.; Leenheer, J.A.; Booksh, K. Fluorescence excitation–emission matrix regional integration to quantify spectra for dissolved organic matter. Environ. Sci. Technol. 2003, 37, 5701–5710. [Google Scholar] [CrossRef]
- Zbytniewski, R.; Buszewski, B. Characterization of natural organic matter (NOM) derived from sewage sludge compost. Part 1: Chemical and spectroscopic properties. Bioresour. Technol. 2005, 96, 471–478. [Google Scholar] [CrossRef]
- Cox, L.; Celis, R.; Hermosin, M.C.; Cornejo, J.; Zsolnay, A.; Zeller, K. Effect of organic amendments on herbicide sorption as related to the nature of the dissolved organic matter. Environ. Sci. Technol. 2000, 34, 4600–4605. [Google Scholar] [CrossRef] [Green Version]
- Ohno, T.; Bro, R. Dissolved organic matter characterization using multi way spectral decomposition of fluorescence landscapes. Soil Sci. Soc. Am. J. 2006, 70, 2028–2037. [Google Scholar] [CrossRef]
- Senesi, N.; Miano, T.; Provenzano, M.R.; Brunetti, G. Characterization, differentiation, and classification of humic substances by fluorescence spectroscopy. Soil Sci. 1991, 152, 259–271. [Google Scholar] [CrossRef]
- Zhang, J.; Lv, B.; Xing, M.; Yang, J. Tracking the composition and transformation of humic and fulvic acids during vermicomposting of sewage sludge by elemental analysis and fluorescence excitation–emission matrix. Waste Manag. 2015, 39, 111–118. [Google Scholar] [CrossRef]
- Li, X.W.; Xing, M.Y.; Yang, J.; Huang, Z.D. Compositional and functional features of humic acid-like fractions from vermicomposting of sewage sludge and cow dung. J. Hazard. Mater. 2011, 185, 740–748. [Google Scholar] [CrossRef]
- Awasthi, M.K.; Pandey, A.K.; Bundela, P.S.; Khan, J. Co-composting of organic fraction of municipal solid waste mixed with different bulking waste: Characterization of physicochemical parameters and microbial enzymatic dynamic. Bioresour. Technol. 2015, 182, 200–207. [Google Scholar] [CrossRef] [PubMed]
- Erhardt, W.; Pruess, A. Organic Contaminants in Sewage Sludge for Agricultural Use; European Commission/Joint Research Centre: Ispra, Italy, 2001; p. 73. [Google Scholar]
Figure 1.
Concentration of FA-C (a) and HA-C (b) as a percentage of Corg in fresh (blue) and stored (red) sewage sludge samples. Different letters (a, b) refer to significant differences (HSD test, P < 0.05).
Figure 1.
Concentration of FA-C (a) and HA-C (b) as a percentage of Corg in fresh (blue) and stored (red) sewage sludge samples. Different letters (a, b) refer to significant differences (HSD test, P < 0.05).

Figure 2.
Amount of humic acid (HA) produced during storage as a function of the loss Corg (ΔCorg).

Figure 3.
Excitation-emission matrix (EEM) fluorescence spectra of FA extracted from sewage sludge samples. Numbers indicate the considered peaks.
Figure 3.
Excitation-emission matrix (EEM) fluorescence spectra of FA extracted from sewage sludge samples. Numbers indicate the considered peaks.

Figure 4.
EEM fluorescence spectra of HA extracted from sewage sludge samples. Letters indicate the considered peaks.
Figure 4.
EEM fluorescence spectra of HA extracted from sewage sludge samples. Letters indicate the considered peaks.


Table 1.
Sewage sludge samples: WWTP, sewage sludge (SS) treatment sequence, and SS storage conditions.
Table 1.
Sewage sludge samples: WWTP, sewage sludge (SS) treatment sequence, and SS storage conditions.
| Plant | Plant Size (P.E.) | Wastewater Treatment Sequence | SS Treatment and Thickening | SS Storage (90 d) |
|---|---|---|---|---|
| P1 | >100,000 | Scr.—G.Tr.—O.Rm.—Pr.S.T.—A.S. (N-DN; SBR)—S.Cl.—Disnf. | Thk.—An.Dig.—B.Pr. | Aerobic |
| P2 | 7500 | Scr.—G.Tr.—A.S. (N-DN)—S.Cl | Thk.—D.Bd | Aerobic |
| P3 | 5000 | Scr.—G.Tr.—A.S. (N-DN)—S.Cl.—Disnf. | Thk.—Aer.Dig.—D.Bd | Anaerobic |
| P4 | 9500 | Scr.—G.Tr.—A.S. (N-DN)—S.Cl.—Disnf. | Thk.—Aer.Dig.—D.Bd | Anaerobic |
Legend: Aer.Dig. = Aerobic digestion; An.Dig. = anaerobic digestion; A.S. = activated sludge; B.Pr. = belting press; D.Bd. = drying bed; FP = filter press; G.Tr. = grit trap; N-DN = nitrification-denitrification; O.Rm. = oil removal; P.E. = population equivalent; Pr.S.T. = primary settling tank; Scr. = screening; S.Cl. = secondary clarifier; Disnf. = disinfection; Thk. = thickener.
Table 2.
Elemental composition and content of Corg, FA-C, HA-C, and (FA+HA)-C in sewage sludge samples and percentual changes in Corg, Ntot, and (FA+HA)-C following storage. Different letters (a, b) refer to significant differences (HSD test, P < 0.05). All data are expressed on a dry weight basis.
Table 2.
Elemental composition and content of Corg, FA-C, HA-C, and (FA+HA)-C in sewage sludge samples and percentual changes in Corg, Ntot, and (FA+HA)-C following storage. Different letters (a, b) refer to significant differences (HSD test, P < 0.05). All data are expressed on a dry weight basis.
| Sample | Corg g kg−1 | ∆Corg % | Ntot g kg−1 | ∆Ntot % | C/N | FA-C g kg−1 | HA-C g kg−1 | (FA+HA)-C g kg−1 | ∆ (FA+HA)-C g kg−1 | |
|---|---|---|---|---|---|---|---|---|---|---|
| P1 | Fresh | 224 ± 13 a | 32 ± 2 a | 8.2 a | 2.9 ± 0.2 a | 11.2 ± 0.7 a | 14.1 ± 0.7 a | |||
| Stored | 210 ± 21 a | −6.3 | 31 ± 3 a | −3.1 | 7.9 a | 2.8 ± 0.3 a | 11.4 ± 1.1 a | 14.2 ± 1.2 a | +0.9 | |
| P2 | Fresh | 223 ± 20 a | 35 ±3 a | 7.5 a | 3.3 ± 0.3 a | 11.7 ± 0.6 a | 15.0 ± 0.7 a | |||
| Stored | 197 ± 12 a | −12.0 | 34 ± 2 a | −2.9 | 6.8 a | 3.1 ± 0.2 a | 13.0 ± 0.5 b | 16.1 ± 0.5 b | +7.3 | |
| P3 | Fresh | 259 ± 21 a | 33 ± 3 a | 9.2 a | 1.8 ± 0.2 a | 6.1 ± 0.5 a | 7.9 ± 0.5 a | |||
| Stored | 219 ± 11 b | −15.6 | 33 ± 2 a | 0 | 7.7 a | 1.5 ± 0.3 a | 7.2 ± 0.4 b | 8.7 ± 0.4 b | +10.9 | |
| P4 | Fresh | 319 ±19 a | 42 ± 2 a | 8.9 a | 0.5 ± 0.1 a | 10.4 ± 0.6 a | 10.9 ± 0.6 a | |||
| Stored | 221 ± 18 b | −30.6 | 37 ± 2 b | −11.9 | 7.0 b | 0.5 ± 0.1 a | 13.8 ± 1.1 b | 14.3 ± 11 b | +30.7 | |
Table 3.
E4/E6 ratios, SUVA254, and % aromaticity of HA and fulvic acids (FA) extracted from fresh and stored sewage sludge samples.
Table 3.
E4/E6 ratios, SUVA254, and % aromaticity of HA and fulvic acids (FA) extracted from fresh and stored sewage sludge samples.
| Sample | E4/E6 | SUVA254 | Aromaticity (%) | ||||
|---|---|---|---|---|---|---|---|
| HA | FA | HA | FA | HA | FA | ||
| P1 | Fresh | 7.20 | 5.26 | 1.94 | 2.05 | 13.0 | 13.6 |
| Stored | 7.06 | 7.33 | 1.87 | 1.96 | 12.6 | 13.1 | |
| P2 | Fresh | 6.57 | 4.43 | 2.81 | 1.72 | 17.6 | 11.8 |
| Stored | 7.48 | 7.09 | 4.03 | 2.64 | 24.0 | 16.7 | |
| P3 | Fresh | 6.62 | 9.81 | 1.98 | 2.58 | 13.3 | 16.4 |
| Stored | 5.35 | 6.26 | 2.61 | 3.16 | 16.5 | 19.4 | |
| P4 | Fresh | 5.11 | 6.85 | 1.31 | 2.03 | 9.7 | 13.5 |
| Stored | 4.51 | 5.51 | 2.23 | 2.63 | 14.5 | 16.7 | |
Table 4.
Zsolnay humification index (HIX) of FA and HA and Peak B fluorescence intensity (FI) of HA extracted from fresh and stored sewage sludge samples.
Table 4.
Zsolnay humification index (HIX) of FA and HA and Peak B fluorescence intensity (FI) of HA extracted from fresh and stored sewage sludge samples.
| Sample | HIX | Peak B (FI) | |||
|---|---|---|---|---|---|
| FA | HA | HA | Δ (%) | ||
| P1 | Fresh | 1.77 | 2.72 | 0.61 | |
| Stored | 1.46 | 4.25 | 0.85 | +32 | |
| P2 | Fresh | 1.09 | 10.98 | 0.24 | |
| Stored | 2.46 | 15.82 | 0.35 | +46 | |
| P3 | Fresh | 3.54 | 8.04 | 0.26 | |
| Stored | 4.43 | 9.54 | 0.46 | +77 | |
| P4 | Fresh | 1.07 | 3.82 | 0.17 | |
| Stored | 1.35 | 4.74 | 0.32 | +88 | |
Table 5.
Linear alkylbenzene sulfonates (LAS) and extractable organic halogens (EOX) concentrations in fresh and stored sewage sludge samples. Different letters (a, b) refer to significant differences (HSD test, P < 0.05). All data are expressed on a dry weight basis.
Table 5.
Linear alkylbenzene sulfonates (LAS) and extractable organic halogens (EOX) concentrations in fresh and stored sewage sludge samples. Different letters (a, b) refer to significant differences (HSD test, P < 0.05). All data are expressed on a dry weight basis.
| LAS | ΔLAS | EOX | ΔEOX | ||
|---|---|---|---|---|---|
| mg kg−1 | % | mg kg−1 | % | ||
| P1 | Fresh | 574 ± 55 a | 26.9 ± 1.3 a | ||
| Stored | 566 ± 65 a | −1.4 | 23.0 ± 1.0 b | −14.3 | |
| P2 | Fresh | 51 ± 6 a | 5.0 ± 0.8 a | ||
| Stored | 53 ± 14 a | +6.3 | 0.9 ± 0.2 b | −81.5 | |
| P3 | Fresh | 316 ± 33 a | 21.3 ± 2.4 a | ||
| Stored | 220 ± 32 b | −30.3 | 15.2 ± 1.9 b | −28.7 | |
| P4 | Fresh | 178 ± 20 a | 9.7 ± 0.8 a | ||
| Stored | 142 ± 14 b | −20.3 | 6.9 ± 1.4 b | −29.6 | |
Publisher’s Note: MDPI stays neutral with regard to jurisdictional claims in published maps and institutional affiliations. |
© 2021 by the authors. Licensee MDPI, Basel, Switzerland. This article is an open access article distributed under the terms and conditions of the Creative Commons Attribution (CC BY) license (http://creativecommons.org/licenses/by/4.0/).
Share and Cite
MDPI and ACS Style
Khakbaz, A.; Goi, D.; Bravo, C.; Contin, M. Thickening and Storage of Sewage Sludge Contribute to the Degradation of LAS and EOX and the Humification of Organic Matter. Water 2021, 13, 933. https://doi.org/10.3390/w13070933
AMA Style
Khakbaz A, Goi D, Bravo C, Contin M. Thickening and Storage of Sewage Sludge Contribute to the Degradation of LAS and EOX and the Humification of Organic Matter. Water. 2021; 13(7):933. https://doi.org/10.3390/w13070933
Chicago/Turabian StyleKhakbaz, Ali, Daniele Goi, Carlo Bravo, and Marco Contin. 2021. "Thickening and Storage of Sewage Sludge Contribute to the Degradation of LAS and EOX and the Humification of Organic Matter" Water 13, no. 7: 933. https://doi.org/10.3390/w13070933
Note that from the first issue of 2016, this journal uses article numbers instead of page numbers. See further details here.