
Intra-Event Isotopic Changes in Water Vapor and Precipitation in South China

1
School of Geography and Planning, Sun Yat-sen University, Guangzhou 510275, China
2
School of Environmental Science and Engineering, Sun Yat-Sen University, Guangzhou 510275, China
3
Guangdong Provincial Key Laboratory of Environmental Pollution Control and Remediation Technology, Guangzhou 510275, China
*
Author to whom correspondence should be addressed.
Water 2021, 13(7), 940; https://doi.org/10.3390/w13070940
Submission received: 8 February 2021
/
Revised: 10 March 2021
/
Accepted: 26 March 2021
/
Published: 30 March 2021
Abstract
:Synchronous observations of the isotopic composition of water vapor and precipitation for 24 rain events were performed. Rain events driven by low-level jets exhibited similar isotopic changes in precipitation and water vapor. The vertical activity of water vapor in convection causes the isotopic variation in precipitation to be opposite to that of water vapor. Isotopic changes of precipitation in low-pressure systems were partially synchronized with that of water vapor at high but not low water vapor concentrations. Changes in microphysical meteorological properties in stratiform precipitation give rise to different patterns of isotopic changes in water. The re-evaporation of raindrops can be determined by the enrichment ratio of heavy isotopes in the water under the cloud base, which is closely related to the raindrop radius. Stratiform precipitation, with small raindrop sizes, was prone to kinetic fractionation under the cloud base. The raindrop radius of low-level jets was small, favoring exchange with surrounding air and re-evaporation. The moist air mass in convection facilitates isotopic exchange of raindrops with surrounding water vapor, leading to low enrichment ratios. The lowest enrichment ratios in low-pressure systems were due to environments characterized by large-scale water vapor convergence.
1. Introduction
The stable isotopic composition (δ18O/δ16O, δ2H/δ1H) of water has been considered in a variety of hydrological and meteorological studies, with applications including the classification of runoff [1,2], division of precipitation inputs [3,4], partition of evapotranspiration [5,6] and Global Circulation Models (GCMs) [7,8,9]. The conventional stable isotopic composition of water is divided into the composition of precipitation isotopes (δp) and water vapor (δv), where observations of δv have been greatly improved in recent years due to the development of laser spectroscopy technology. Without the need for condensing devices, in situ measurements with laser spectroscopy techniques save time, reduce costs and improve accuracy.
At the interannual scale, both δp and δv are associated with climate change, such as the El Niño–Southern Oscillation (ENSO) [10,11]. Seasonal variations in δp and δv are influenced by water vapor sources [11,12] and atmospheric circulation [13,14]. At the event scale, δp and δv are sensitive to condensation [15,16,17,18], precipitation regimes [19,20] and hydrological processes within and outside clouds [9]. Equilibrium fractionation and kinetic fractionation play a key role in changes of δp and δv [21,22,23].
Rayleigh fractionation is typically used to simulate isotopic fractionation in a closed system. Specifically, the stable isotopic composition of water will change according to Rayleigh fractionation: δ = δof(a − 1), where δo is the initial isotopic composition of water, δ is the isotopic composition of water when the ratio of remaining water is f and a is the equilibrium fractionation coefficient related to temperature [21]. The isotopic compositions of water vapor in a mixing system under conditions where the residual material remains in equilibrium after precipitation removal (called the composition of the equilibrium water vapor isotope, δe = (1 + δp) a − 1) can be calculated from the equilibrium fractionation coefficient. The Rayleigh process occurs under pseudo-adiabatic conditions because it is impossible to obtain a small amount of energy from a completely closed system [24] and Rayleigh fractionation lacks consideration of isotopic fractionation in both the vertical and meridional directions. Kinetic fractionation includes processes such as re-evaporation of raindrops under the cloud base and diffusive exchange with surrounding air, where re-evaporation is often cited as a possible reason for inconsistency between observations and Rayleigh predictions [11,25]. However, methods to quantify re-evaporation are still under development.
Many have carried out studies of isotopic changes in precipitation during single rain events. In previous studies, three variations of δp are most commonly reported: sinking shape, “V” shape and “W” shape. A sinking shape exhibits a downward curve, in which the air temperature and δp gradually decrease, reflecting the gradual adiabatic condensation process of atmospheric water vapor following a Rayleigh fractionation model [24]. The mechanistic explanation for the “V” shape is that δp is relatively depleted in isotopically lighter water, with heavier isotopes preferentially condensing out [21]. As precipitation decreases, δp tends to be enriched in the light isotopes due to exchange with surrounding air [26]. The “W” shape is considered a repetition of the “V” type process due to the passage of the front in cyclic rain events [27]. The value of δp during rain events changes little when the interface between cold and warm fronts is stable [28]. The value of δp can increase in an upslope [29], or an “L” shape [30], or even a “∧” shape for typhoons in southeastern China [31].
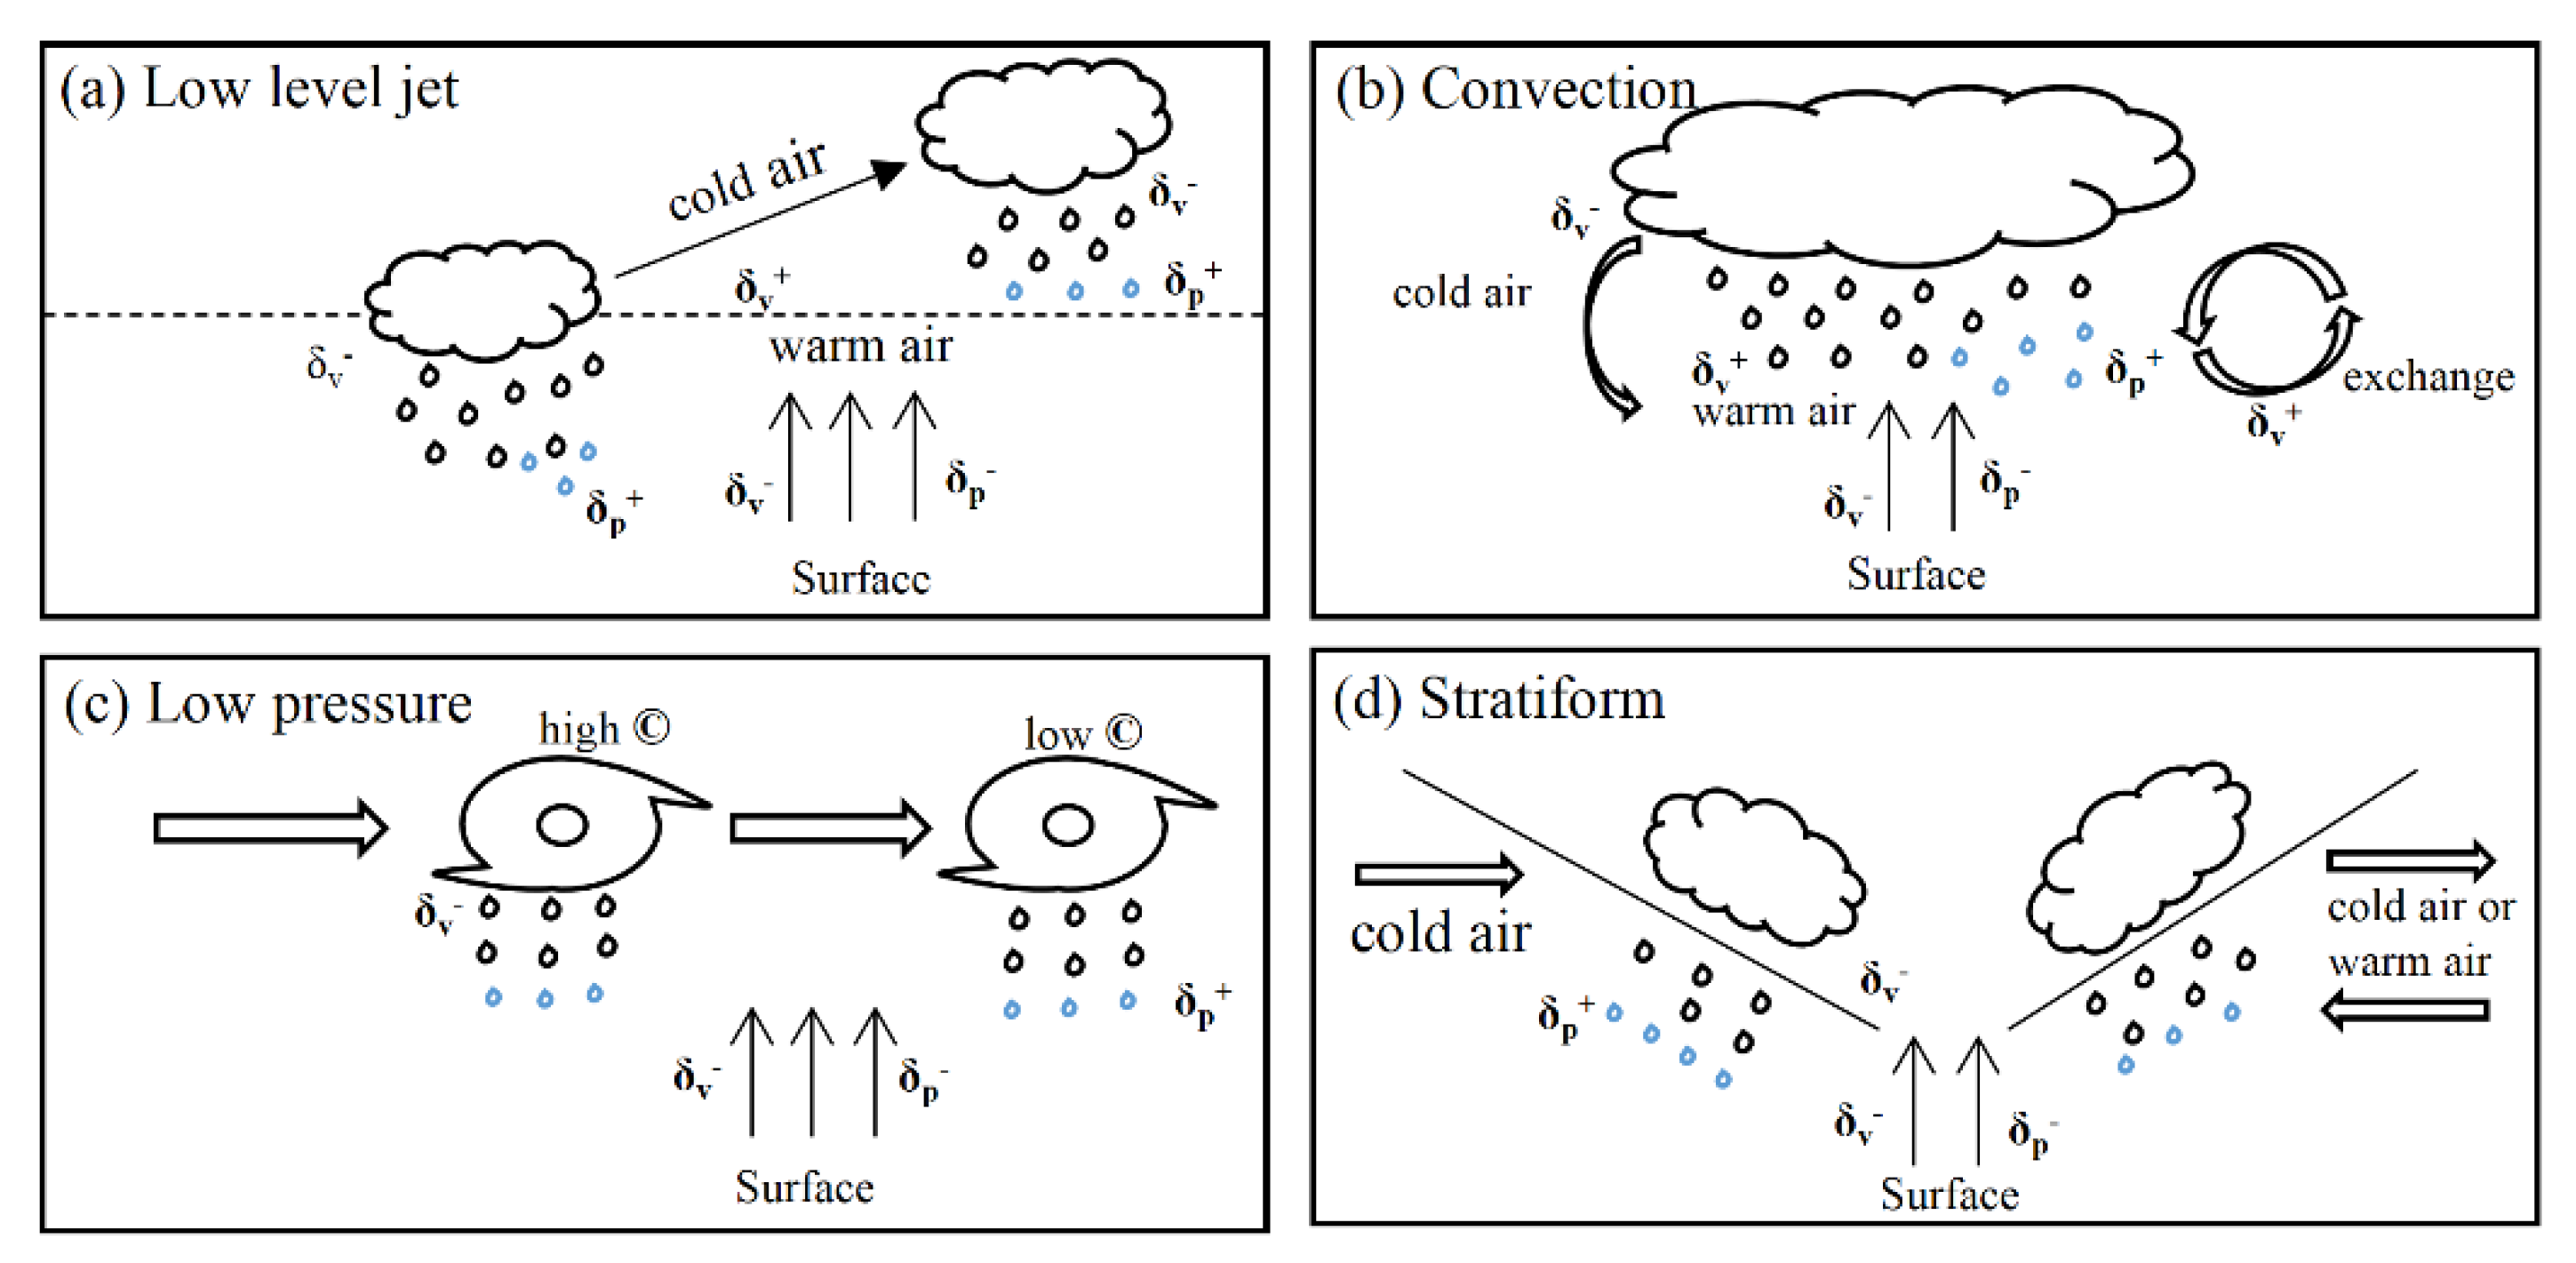
The changes of δp and δv typically observed for different rain events are summarized in Figure 1. The arrow pointing upwards from the surface refers to soil evaporation and water evaporation into the air. When evaporation occurs, the heavy isotopes in the water are retained by mass and the light isotopes are added to the water vapor and raindrops, thus contributing to the lower isotope ratios of the water vapor and raindrops. For a warm and humid low-level jet with high concentrations of rising water vapor, the heavy isotopes will be enriched in precipitation and water vapor; the opposite holds for a dry and cold low-level jet (Figure 1a) [32]. Changes in δp in convection generally follow Rayleigh fractionation, with values tending to be more negative as the rain continues. High-altitude subsidence brings water vapor with relatively negative isotopes from the upper troposphere to the surface, promoting the depletion of δv in convection [33]. If the raindrops are sufficiently large to not exchange with the surrounding air during the falling process [34], the initial δp of the rain event will initially be more negative (Figure 1b). As convection weakens, the amount of precipitation as well as the raindrop radius will decrease. Exchange with surrounding air promotes the enrichment of light isotopes while evaporation under the cloud base leads to the enrichment of heavy isotopes in precipitation. Changes in δp and δv maintain the same trends during the movement of low-pressure systems (Figure 1c) with high water vapor concentrations [35]. Steady stratiform precipitation does not cause a change in water vapor state and as such, the δp and δv in stratiform precipitation remain steady (Figure 1d); this can be attributed to the homogeneous moisture of stratiform clouds [36,37].
Researchers have conducted studies on the δp and δv in single rain events using different methods. However, there is a lack of holistic and systematic knowledge of the isotopic changes in precipitation and water vapor for different precipitation regimes, which requires multi-field rain event observations. The function of raindrop re-evaporation under the cloud base could contribute most to changes in δp and δv due to different precipitation regimes and local environmental factors during precipitation [38,39]. The calculation of heavy isotope enrichment in water under the cloud bases of different precipitation regimes enables a quantitative evaluation of the proportion of water redistribution by re-evaporation, emphasizing the importance of kinetic isotope exchange between raindrops and water vapor under clouds [40].
Simultaneous observations of δp and δv during rain events are reported less often. In this paper, we reported the variations in δp and δv in 24 rain events that occurred in Guangzhou, China, from April 2016 to January 2018, to understand the differences in isotopic variation patterns of δp and δv in different precipitation regimes. We analyzed the variation in δp and δv based on water vapor sources and Rayleigh fractionation and attempted to establish a link between patterns of variation of δp and δv and precipitation regimes. We also aimed to evaluate the degree of the effect of isotopic kinetic fractionation under different precipitation regimes by calculating the enrichment ratios of heavy isotopes in water under the cloud bases and evaluating the extent of the effect of isotope power fractionation. Further applications of isotope techniques in hydrological and meteorological observations can be accomplished if rain events can be characterized based on the isotopic behavior of precipitation and water vapor.
2. Method
2.1. Sample Collection and Measurement
Rainwater sampling was carried out using a self-made rainwater collector installed on the roof of the School of Geography and Planning, Sun Yat-sen University, China (113. 32° E, 23.13° N). The equipment was comprised of a cylinder with three main parts for collection, transfer downstream and storage, respectively (Figure S1). A layer of light pure paraffin oil floated on the water sample to prevent evaporation. Rainwater samples were collected hourly in 500 mL bottles, transferred at 8:00 am each morning and were sealed in a 4 °C refrigerator until subjected to measurements. Determination of precipitation regimes (rain density and radar data) was based on the tropical cyclone data center of the China Meteorological Administration (CMA), available online: http://tcdata.typhoon.org.cn (accessed on 21 July 2018).
A shielded air inlet was installed on the roof of the building (30 m a.g.l.) connected to an ultra-high precision isotope analyzer (Picarro L2130-i, Picarro Inc., Sunnyvale, CA, USA). The air was sampled continually (once per second) at a flow rate of 34 L/min by a vacuum pump. The hydrogen and oxygen isotopic compositions of liquid water and water vapor were expressed as the δ value relative to the reference on the Vienna Standard Mean Ocean Water scale (V-SMOW): δ [41], where R is the ratio of the abundance of the heavy to light isotope ans S denotes the sample. The analytical precision for liquid water was 0.09‰ for δ18O and 0.43‰ for δ2H and for water vapor was 0.22‰/60 s for δ18O and 2.16‰/60 s for δ2H (refer to the Supplementary File).
2.2. HYSPLIT
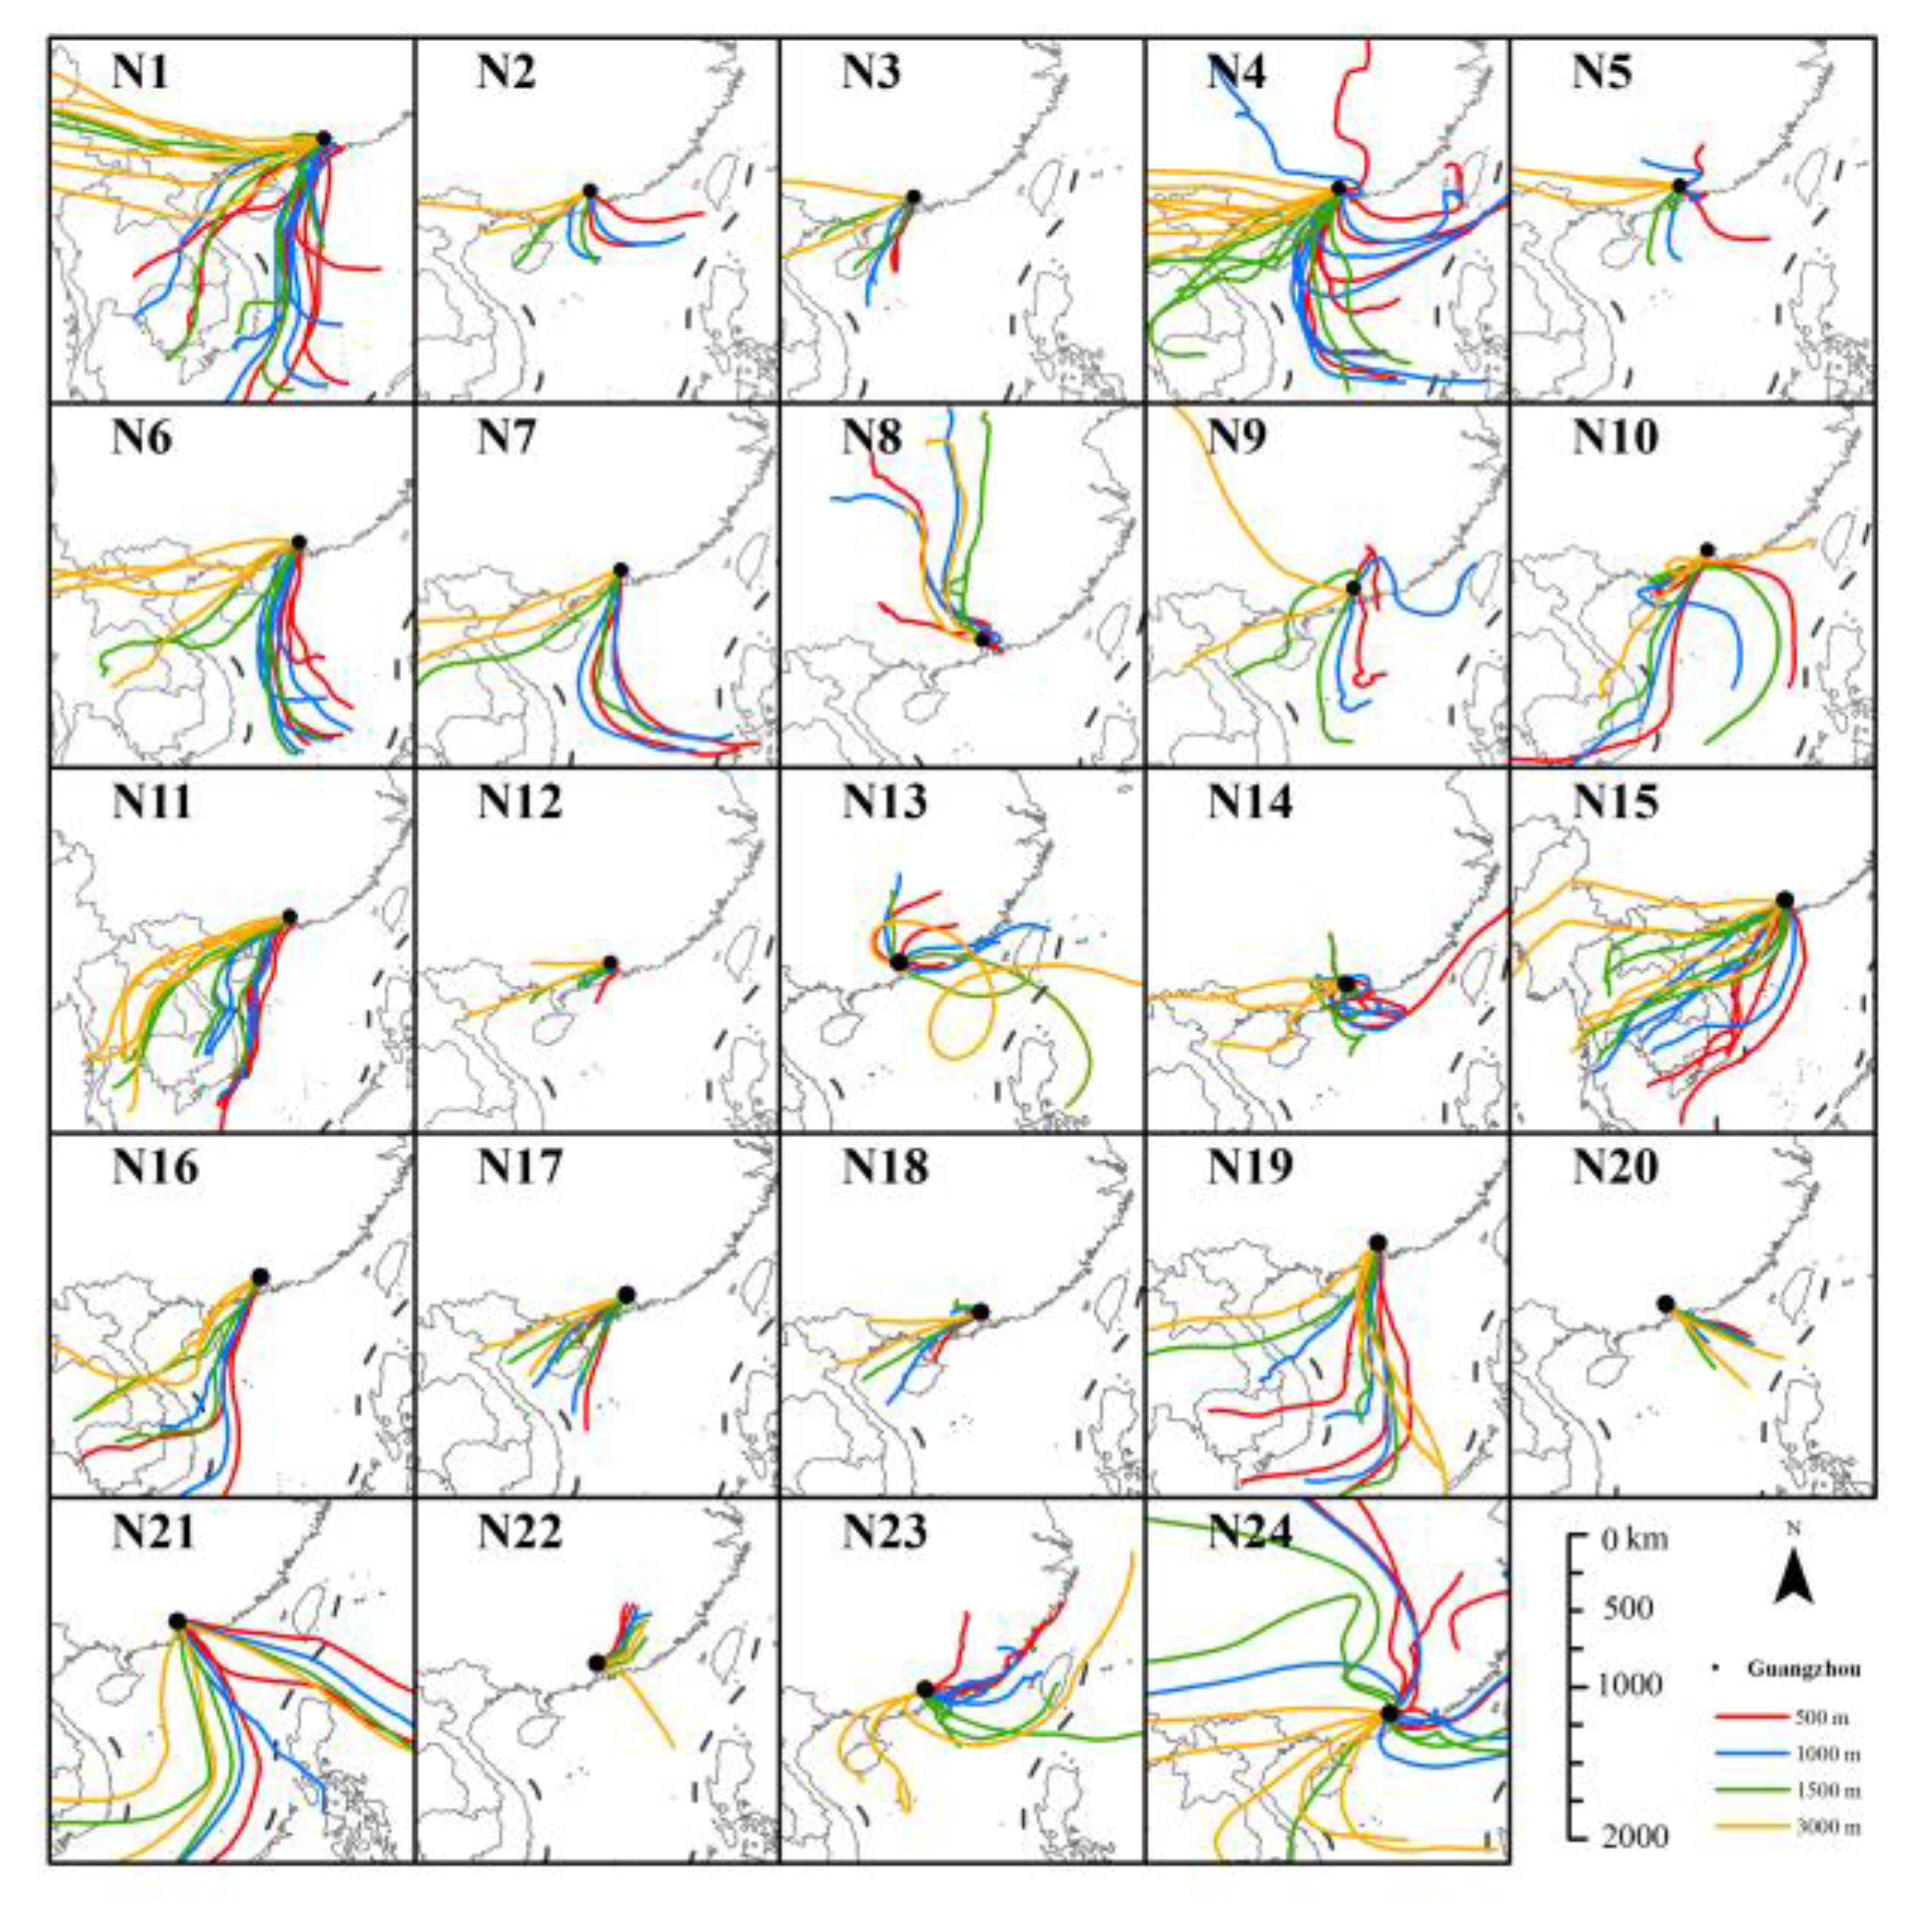
The Hybrid Single Particle Lagrangian Integrated Trajectory (HYSPLIT) model was used to characterize water vapor transport [42]. Meteorological data from the Global Data Assimilation System (GDAS) with a horizontal resolution of 1° × 1° were used as input data. HYSPLIT can output various weather fields, including hourly pressure, altitude, temperature and specific humidity along each trajectory. The back time was set to 72 h because the minimum duration of the global water vapor cycle is about 3 to 10 d [43]. The air mass trajectories arriving at the observation point at 18:00 UTC each day were calculated separately. We set four heights (500, 1000, 1500 and 3000 m) to understand differences in water vapor sources from different altitudes in rain events. In South China, the average cloud base height of convective precipitation in summer is about 400–1000 m, while the average cloud base height with predominant multilayer cloud precipitation in winter is above 1000 m [44]. The range of the lower vertical section of typhoons is typically within 3000 m. By rejecting the hourly position and humidity changes of the air parcel with humidity values <0.05 g/kg in the sinking area, the source of the water vapor transport leading to the terminal precipitation could be obtained. A cluster analysis was then carried out to represent the air mass trajectories of a single rain event.
2.3. Calculation of Re-Evaporation
Kinetic effects, such as the re-evaporation of raindrops, can partially compensates for the decrease in δ values caused by Rayleigh fractionation [45,46,47]. The relative influence of re-evaporation is defined as the enrichment ratio of heavy isotopes (E) under the cloud base, which can be estimated according to [48]:
where Ev and Ep refer to the enrichment ratio of heavy isotopes of water vapor and precipitation under the cloud base, respectively and is the isotopic change of water under the cloud base. The change of the d-excess was calculated by the measured d-excess and the d-excess under the cloud base (Dc).
The isotopic change of water under the cloud base, δc, can be determined by [49]:
where i refers to mass numbers of the heavier isotope and α is the equilibrium fractionation coefficient. fe is the remaining proportion after evaporation. β and γ can be estimated using the following equations:
where h is the relative humidity, D and D’ are the diffusion of 1H2H16O (1H1H18O) and 1H1H16O in the air, respectively, D/D’ is 1.024/1.0289 and n is 0.58 [50]. The remaining proportion after evaporation is calculated from precipitation (P) and evaporation:
where Vevp is the evaporation rate, s′ represents the effective thickness of the shell around the raindrop, Dr is the diffusion coefficient, r is the radius of the falling raindrop, and are the densities of the surface of the falling raindrop and the surrounding air, respectively and is a dimensionless value for measuring the actual heat exchange heat. Dr() can be determined form the humidity and temperature (g cm−1 s−1) and (cm) is primarily determined by the raindrop size and ambient temperature. The evaporation rate of falling raindrops can be determined by multiplying the relative humidity, temperature and raindrop size [51].
The raindrop fall time can be estimated from the fall velocity (v) and the distance between the ground and cloud base, with the fall velocity calculated according to the following relationship [52]:
Precipitation is assumed to form near average cloud base levels (1500 m) [53] and raindrops with a radius of less than 0.035 mm are considered not to evaporate or to evaporate so completely that they do not reach the ground because they fall most slowly and have the highest surface area to volume ratio.
Raindrop diameter (2r) is estimated from the Weibull distribution [54], which provides results in good agreement with measurements [55,56] compared to other distributions:
where D is the diameter of the raindrops and No, b and c are parameters with the common values of 1000 m−3, 0.26R0.44 mm and 0.95R0.14, respectively, where R is the precipitation rate (mm/h).
3. Results
3.1. Isotopic Changes in Precipitation
A total of 142 rainwater samples were collected from April 2016 to February 2018 (Table 1). The total amount of precipitation in an event ranged from 0.3 mm (N13) to 153.5 mm (N8) with a mean of 25.76 mm. The precipitation of nine rain events was greater than the mean. The weighted average of δ18Op for the 24 rain events was −3.70‰. The event with the lowest δ18Op value was N22 (a typhoon event) and the highest was N4. The δ18Op values of N4, N5 and N6 were close to those of seawater (100 km away). The variations in δ18Op are shown in Figure 2. All panels have the same y-axis range to simplify comparisons. The range of the x-axis varies due to different durations of each rain event.
Based on the change in δ18Op in 24 rain events, the δ18Op can be divided into five shapes: “—” (unchanged), “\” (sinking), “/” (rising), “V” and “∧”. The number of rain events for each δ18Op shape was 3, 7, 5, 3 and 6, respectively. N3, N9 and N20 were the unchanged shape rain events, during which δ18Op values changed very little. The standard deviation of δ18Op was 0.17‰ for N3, 0.11‰ for N9 and 0.014‰ for N20. N2, N5, N8, N12, N17, N21 and N24 were the declining shape rain events during which the δ18Op became gradually more negative. The drop of δ18Op in events N2, N12 and N21 was 2.64, 2.52 and 1.28‰, respectively. N13, N15, N16, N19 and N22 were rising shape rain events in which the value of δ18Op increased over time. The increase in δ18Op value was 2.38‰ for event N13 and 5.64‰ for event N15. The “V” and “∧” shaped rain events were characterized by long durations and featured systematic and complex isotopic changes of δ18Op, or example N10 with only 19.1mm in 16 h. The variation in δ18Op was a “W+V” shape change, which means more factors were involved that need to be considered.
3.2. Isotopic Changes in Water Vapor
The event values of δ18Ov ranged from −21.03‰ (N17) to −11.66‰ (N2) with a mean value of −14.51‰. The variations in δv sometimes differed from those for δp (Figure 2). For example, variations of δv resulted in an “L” shape in event N11. N3, N12, N20 and N23 were unchanged shape rain events during which δ18Ov changed little, e.g., 0.08‰ for event N3. Event N2, N4, N17 and N24 are declining shape rain events. The δ18Ov value of events N2, N4, N17 and N24 decreased by 0.71, 0.35, 0.20 and 0.25‰, respectively. By the end of rising shape rain events N5, N13, N16 and N21, the δ18Ov had increased by 1.03, 0.37, 0.81 and 0.85‰, respectively. Similar to the δ18Op, the value of δ18Ov could take a “V” or “∧” shape. The δ18Ov in events N1 and N22 was 0.43 and 0.25‰ higher, respectively, during an intermittent precipitation. The variations in δ18Ov for event N10 were complex, more so than a simple W-shape can describe. It is worth noting that an “L” shape was also evident in the changes of δ18Ov. The remaining events were classified as “V” shape rain events.
3.3. The Enrichment of Heavy Isotopes by Re-Evaporation
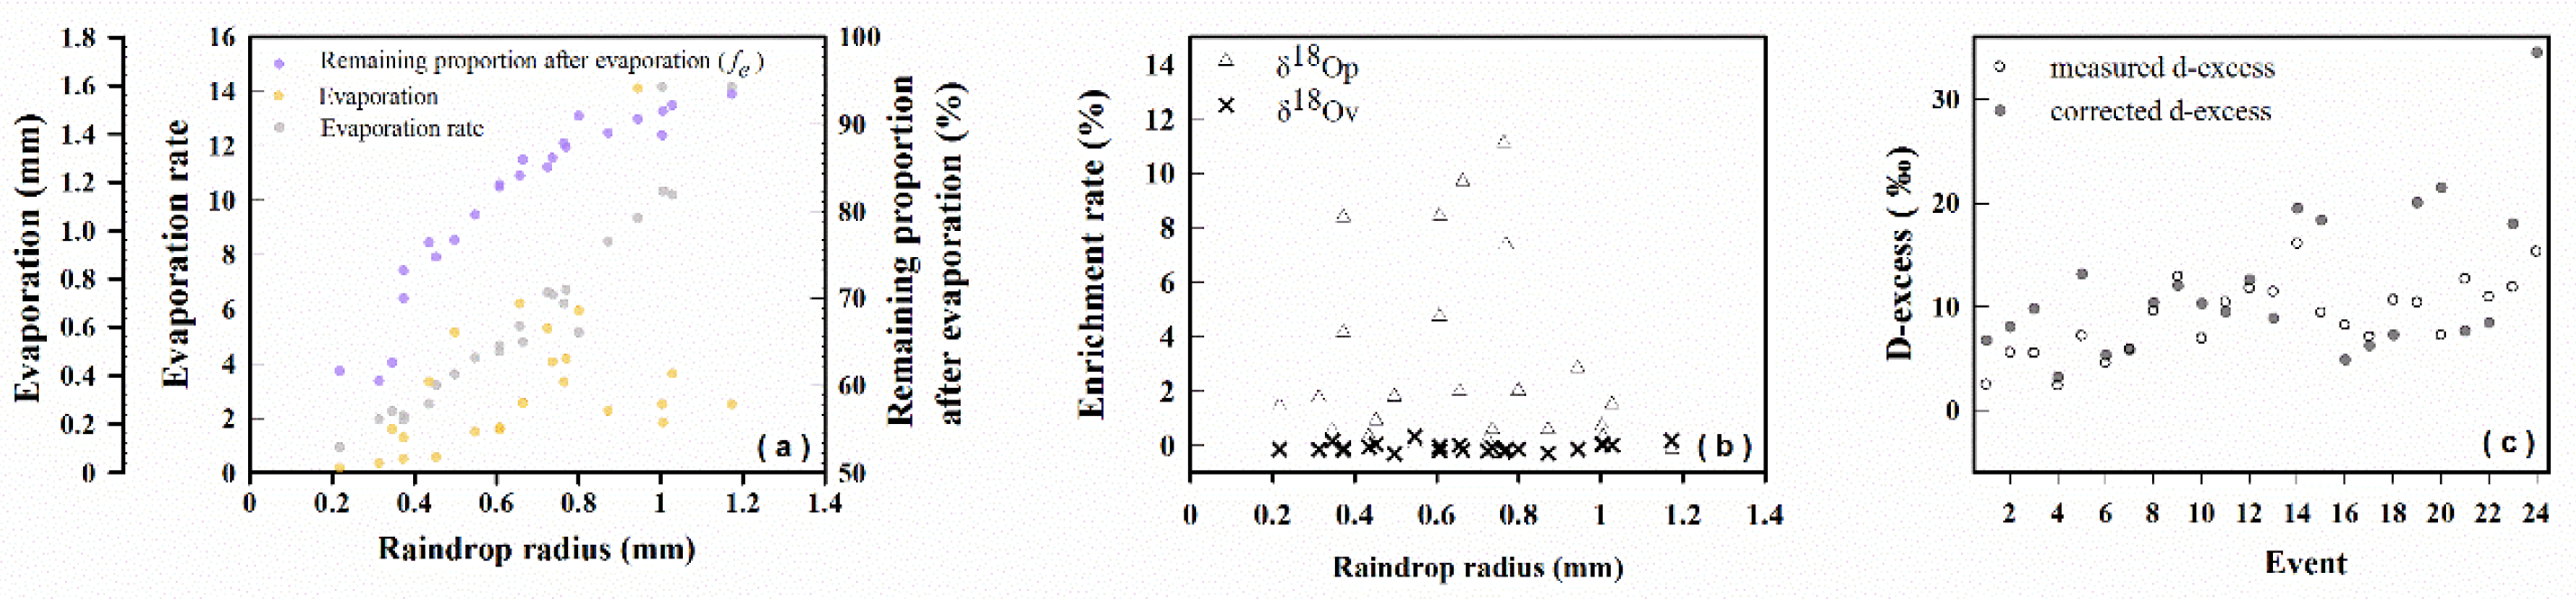
The isotopic composition of equilibrium water vapor was calculated based on the δp (Table 1), with the mean value of δ18Oe found to be 0.95‰ higher than the mean δ18Ov. The isotopic change under the cloud base was −7.79~−9.36‰ for δ18O and −60.6~−81.51‰ for δD, which were generally consistent with the model results found [57]. Ep was notably higher than Ev. The minimum, maximum and mean values of were −0.17% (N22), 15.29% (N4) and 3.40%, respectively. The value of for each rain event was so small that the difference between maximum and minimum values was only 0.63%, indicating little isotopic fractionation in the vapor profile from the cloud base to the ground surface. The estimated raindrop radius for the 24 rain events ranged from 0.22 to 1.17 mm. Figure 3a depicts how the evaporation, evaporation rate and proportion remaining after evaporation all increased with increasing raindrop radius. However, variations of Ep did not follow the raindrop size (Table 2 and Figure 3b). The range of dp (d-excess of precipitation) was 2.38~16.07‰, with a mean value of 9.02‰. The corrected d-excess rose by an average of 2.75‰ (Figure 3c). Most of dp decreased in rain events due to re-evaporation, but there were rain events such as N13 and N17 where dp raised by 2.53‰ and 0.87‰, respectively.
4. Discussion
4.1. Effects of Water Vapor Sources and Rayleigh Fractionation
The water vapor trajectories driven by water vapor sources were a critical factor controlling the characteristics of δp [58,59,60] and the measurements of δv were markedly different depending on the source of water vapor [61,62]. The vapor trajectories calculated by HYSPLIT were used to analyze the relationships between the water vapor source and changes in δ18Ov and δ18Op (Figure 4). The source of water vapor for events N2 and N5 was similar, resulting in similar changes in δ18Op and δ18Ov. Events N12 and N17 behaved consistently in terms of vapor trajectories, δ18Op and δ18Ov. In general, values of δ18Op and δ18Ov for events under similar meteorological conditions (Table 1) and with similar water vapor sources, varied comparably. A single vapor source also resulted in similar changes in δ18Op and δ18Ov; for example, the vapor trajectories of N20 mainly originated from the Pacific Ocean. However, in the case of multiple sources of water vapor, δ18Op and δ18Ov did not demonstrate the same variation even when some of water vapor sources were the same. Moreover, sources of water vapor from opposite directions, such as southeast and southwest, did not result in opposite changes in δ18Op and δ18Ov. The vapor trajectories of events N6 and N7 partially coincided and the variations of δ18Ov were the same, but the change of δ18Op in N6 was a “∧” shape and in N7 trended upward; the same held true for events N9, N10, N14 and N23. In addition, the same water vapor source could also correspond to different variations in δ18Op and δ18Ov, as noted for events N11 and N16. Different sources of water vapor were also capable of generating similar variations in δ18Op and δ18Ov. For example, the water vapor for event N7 came from the Pacific Ocean and the Indian Ocean, while the vapor trajectories of N8 originated from the northern mainland. Yet, the changes in δ18Op and δ18Ov in these two events were similar. Thus, the relationship between changes in the isotopic composition of water and the source of water vapor in rain events remains unclear. Changes of δ18Op and δ18Ov could not be rationalized in cases where the water vapor sources were partially the same or inconsistent and may be related to the mechanism of precipitation formation and micrometeorological physical processes in the rain event [11,63]. Event N7 was formed by the convergence of southeast and southwest winds during the summer monsoon transition period, while event N8 was caused by a cold front and local warm and humid airflow, resulting in opposite changes in δ18Op and δ18Ov.
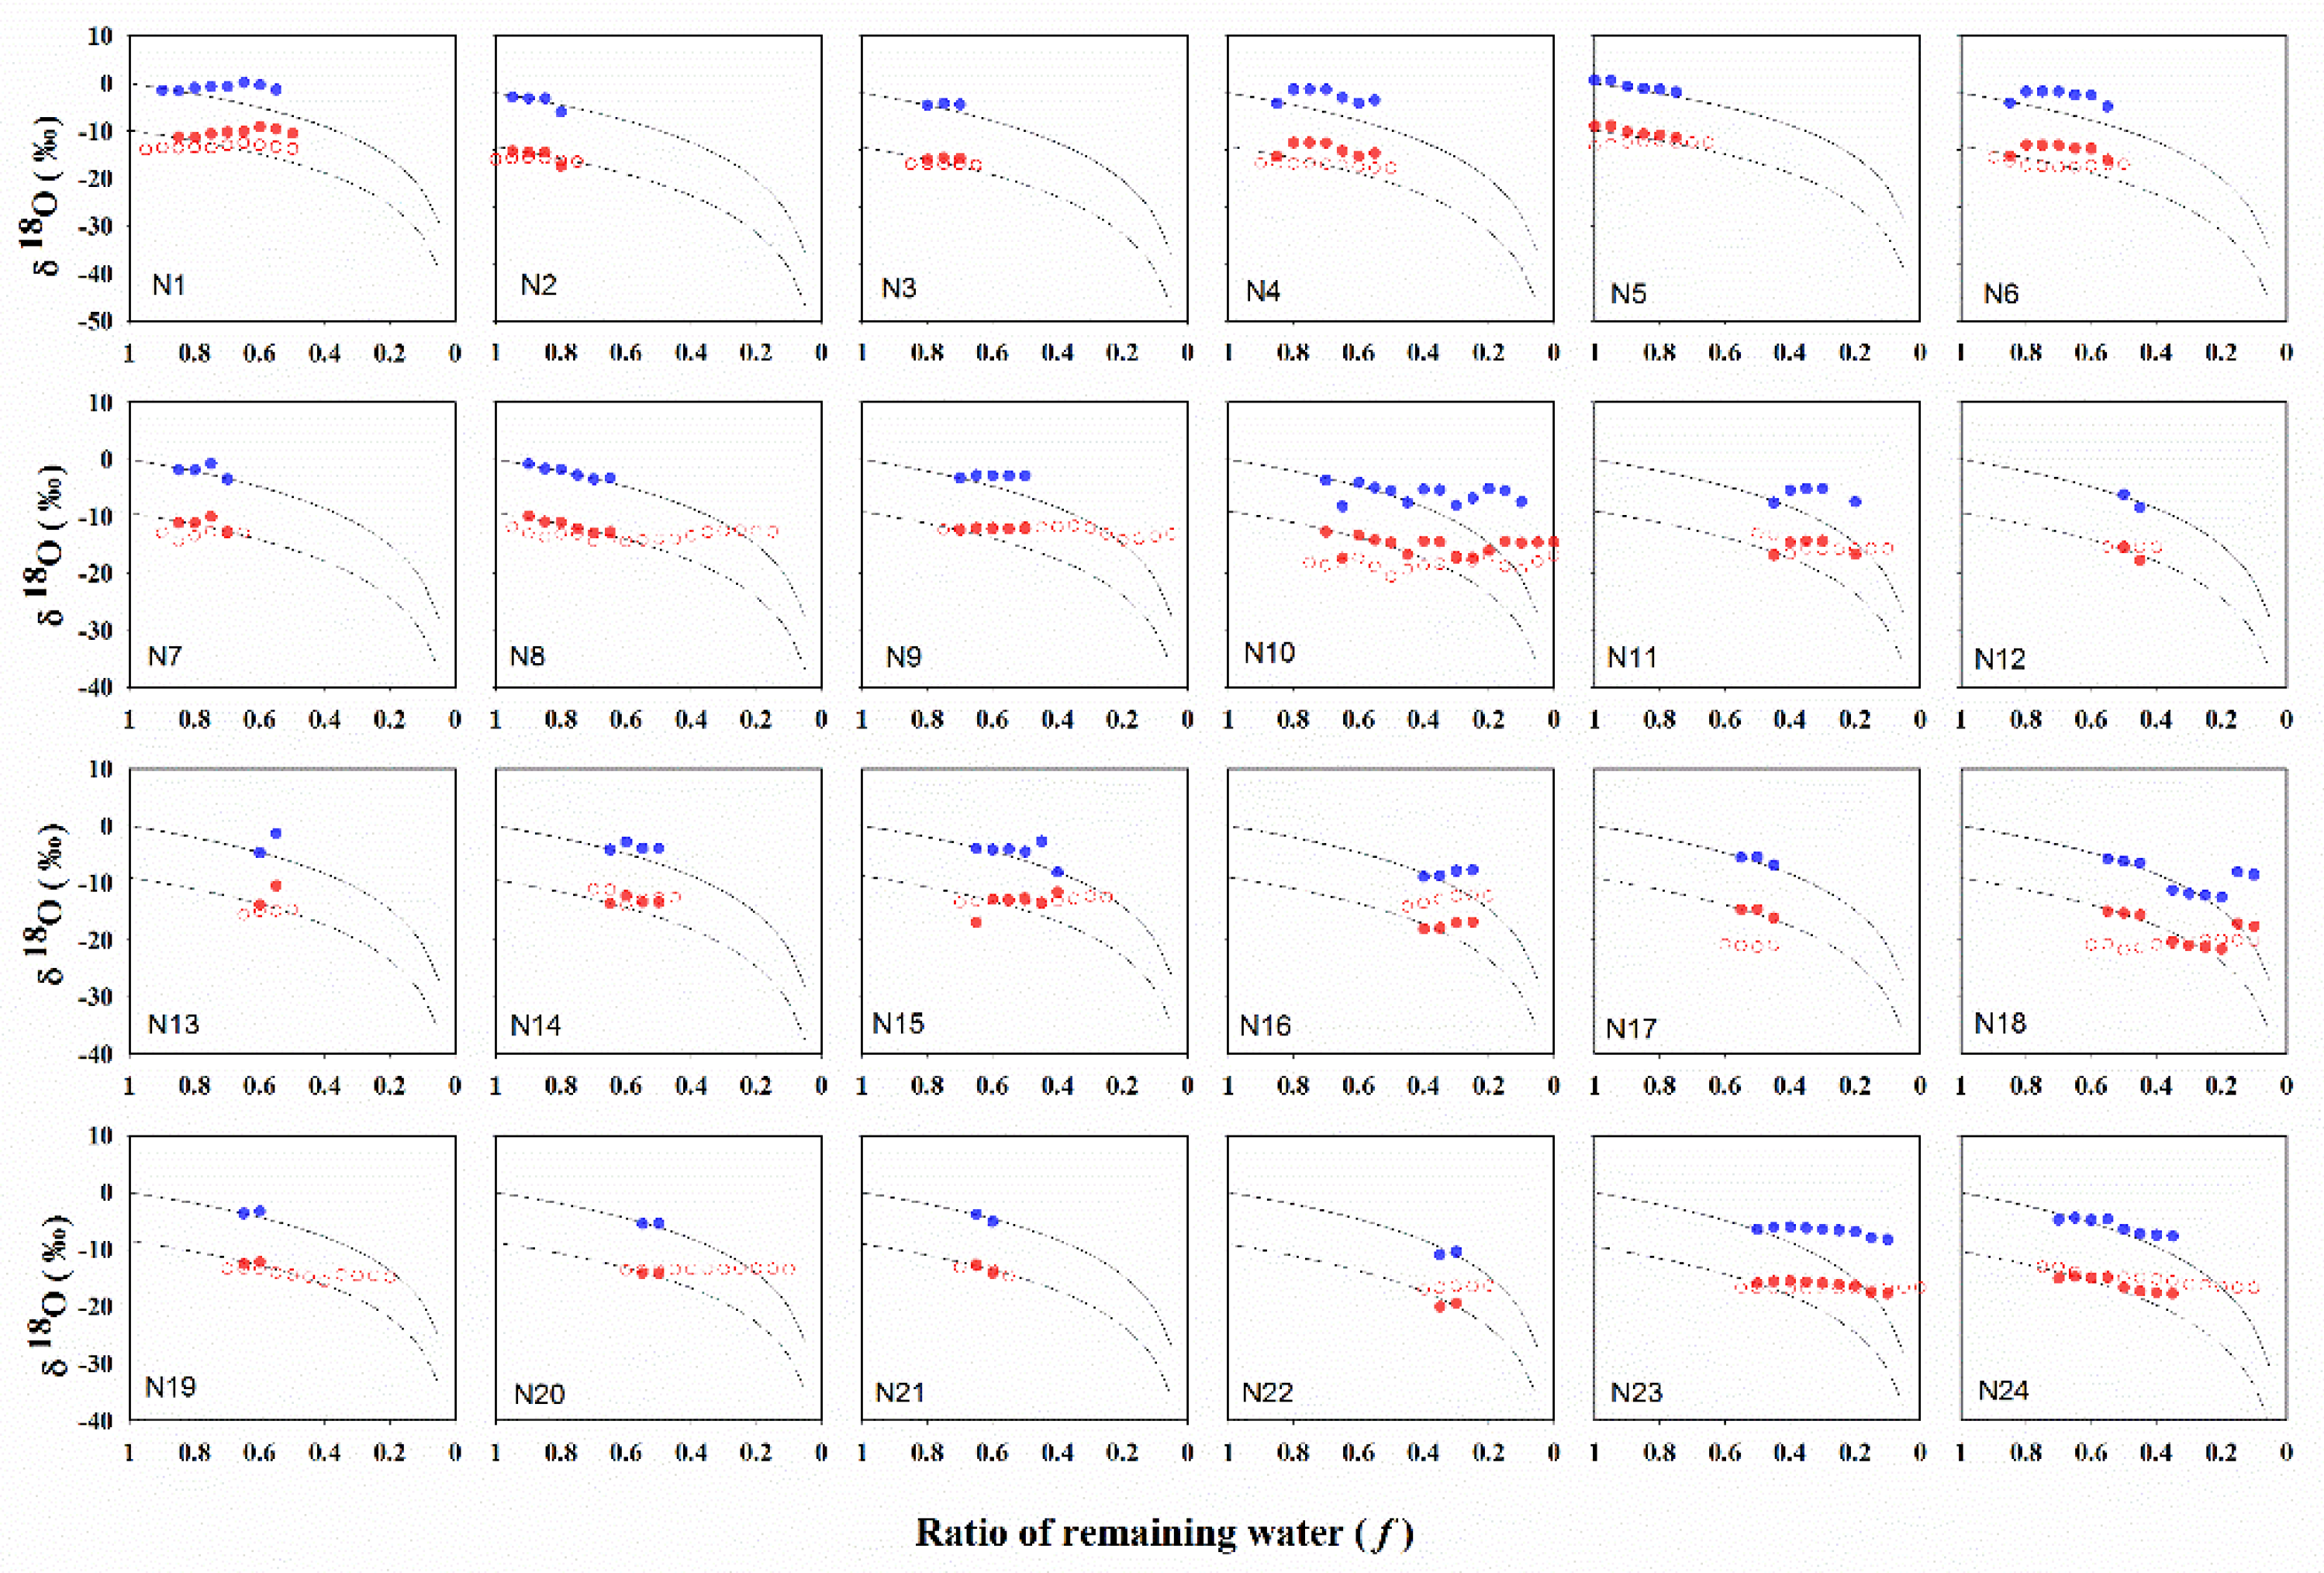
Rayleigh fractionation was used to evaluate the isotopic change of each rain event (Figure 5). Rain event temperatures were typically ~24 °C, with only event N24 occurring at a notably cooler 15 °C. We assumed that the isotope ratios of water satisfy the equilibrium fractionation during condensation (Rayleigh fractionation) before it reaches Guangzhou. Condensation temperature remained constant throughout a rain event. Although the condensation temperature varied for each rain event, the change of equilibrium fractionation coefficient from the condensation temperature was small. The starting point of δp from seawater for the 24 rain events is 0‰. As the temperature in the first hour increases, the initial value of δ18Ov becomes more positive. Precipitation coming directly from the ocean satisfied Rayleigh fractionation, with an initial ratio greater than 0.9 [64]. The initial ratios of 24 rain events were between 0.35 and 1, with a mean value of 0.68, indicating the local initial precipitation had a degree of heavy isotope separation. The events with the highest ratio, such as N2 (0.95), N5 (1) and N8 (0.9), showed little loss of heavy isotopes during the moisture transportation process from the ocean to the local area and during the precipitation formation process. Rain events whose initial ratio was less than 0.5 had more than half of the water from the ocean consumed by the rainout process. The events that fit the Rayleigh fractionation curve were N2, N5, N7, N8, N10, N12, N17, N20 and N24; however, their different initial ratios suggested variations of δp and δv are independent of the initial ratios. The initial points of events N1, N4, N5, N11, N13 and N16 satisfied the Rayleigh fractionation prediction, but the subsequent change of δ18Op did not; this demonstrates that even if the early values of δp matched Rayleigh fractionation, it may not be able to capture later changes in δp. Initial values of δ18Op and δ18Ov were determined by the source of precipitation and how much is lost to rainout during the process of water transport.
The variations in δp and δv were different from Rayleigh’s prediction due to its idealized assumptions and neglect of kinetic effects [13]. Events that satisfy the predicted isotopic variations mostly reflected pseudo-Rayleigh conditions [61]. The traditional Rayleigh fractionation framework is not sufficient to explain isotopic variation in the subtropics and tropics, where most precipitation comes from deep convection and vertical motion dominates horizontal transport [11]. Those rain events that did not align with Rayleigh’s prediction were most likely affected by extra-systemic processes such as re-evaporation [8,9,20,23], surface evapotranspiration [65,66] and exchange with surrounding air [67,68,69]. If a raindrop experiences re-evaporation, isotopically light molecules increase in the water vapor and δv will be more negative than δe, as in most of our observed cases, (except N12, N18, N22 and N24). Additionally, the data that deviate from the Rayleigh curve may reflect the advection of remaining water vapor from the precedent clouds with a relatively low isotopic composition [9]. Rayleigh fractionation as a system mechanism can generally indicate which process may affect the variations in δ18Op and δ18Ov in rain events, but it cannot help to classify rain events, as the changes of δ18Op and δ18Ov may be closely related to precipitation mechanisms.
4.2. Rain Event Styles Based on Formation Mechanism
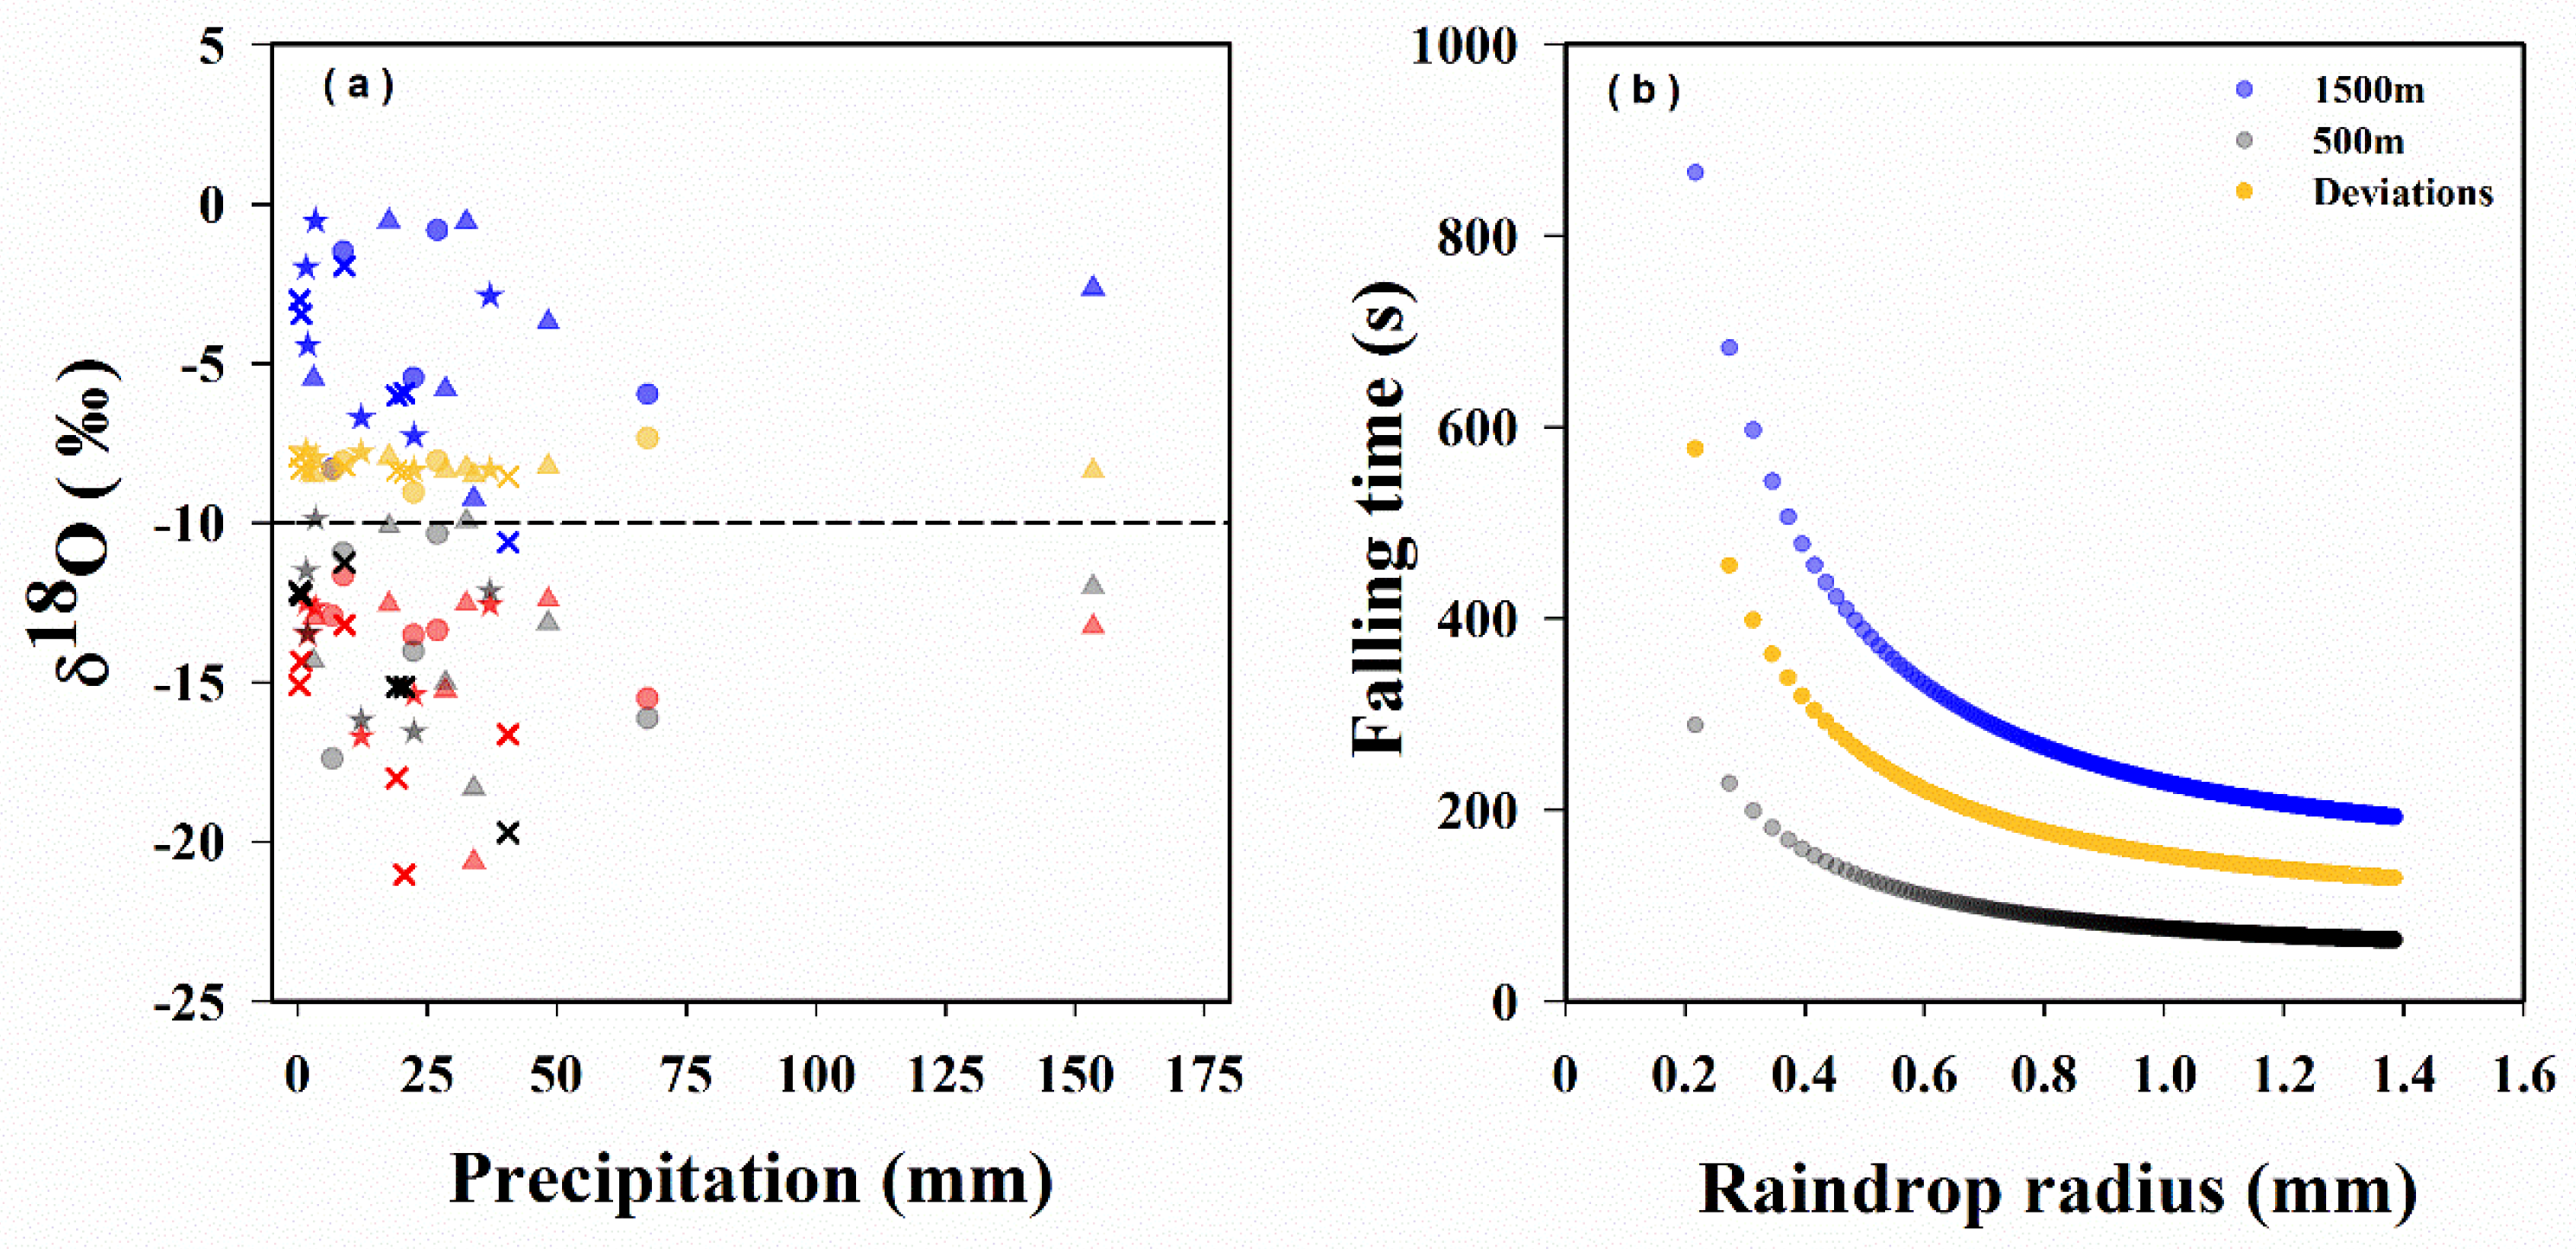
Temperature did not affect the local value of δp, but the isotopic composition of water declined with increasing precipitation (Figure 6a), implying a precipitation amount effect [69,70]. The precipitation regimes were used as an indicator to link various types of rain events. Four rain event styles were based on the variations in δp and δv. The first style (S1) featured simultaneous changes in δp and δv and the second style (S2) featured opposite changes in δp and δv. S1 included events N1, N2, N16, N20 and N24 and S2 included events N5, N6, N8, N11, N14, N15 and N18. The third style (S3) featured the partial coincidence of δp and δv and the fourth (S4) was characterized by uncorrelated changes in δp and δv. S3 included events N7, N10, N13, N17, N19 and N22 while S4 included events N3, N4, N9, N12, N21 and N23.
The precipitation in S1 was characterized by moderate rain events, except for rainstorm event N24. Most rain events of this style were caused by low-level jets [16], with similar variations in δp and δv but different shapes. Intra-cloud processes in the dynamical system (e.g., cloud thickness, cloud top height), sub-cloud processes (e.g., temperature, density of precipitation) were captured by δv and affected the δp at any time. For event N24, dry cold air from the north mainland at high altitude moved to South China and mixed with a warm wet air mass from the Pacific Ocean to develop a low-level jet. The values of δp and δv had been decreased, even in the late precipitation period, but did not match the predictions of Rayleigh fraction. A reasonable explanation is that residual precipitation forms at lower altitudes after precipitation stops, when the rainfall intensity decreases due to the dissolution of the cold front [15].
S2 was characterized by heavy rain events, formed by convection, with opposing changes in δp and δv. Strong convection can be either well-organized or unorganized. Well-organized convective results in opposing shapes of δp and δv, e.g., event N5. The δ18Op of event N5 began with a decreasing trend, at a rate of −0.41‰ per hour, while the δ18Ov increased from −13.27‰ to −12.25‰. In contrast, unorganized convection is a three-dimensional system that covers multiple precipitation processes [39] and provides conditions for changes in raindrop radius and, thus, δp and δv [65]. This was evident in the enrichment of heavy isotopes in events N6, N11 and N14. Water vapor supplementation in unorganized convection may allow for light isotopes accumulation before the precipitation stops [15], which accounts for the late changes in δp in events N15 and N18, with high water vapor concentrations of 33.33 and 34.41 mmol/mol, respectively. In unorganized convection, the values of δp and δv show complex and different variations due to sufficient time for processes such as evolution of raindrop size and water vapor replenishment to occur.
S3 mostly occurs in tropical low-pressure systems. Events N7 and N10 were caused by the tropical low depressions in the South China Sea and events N13 and N22 were formed by the super-strong Typhoons Haima and Doksuri, respectively. Variation in water vapor concentration may be responsible for controlling the variation of δp and δv in S3. The changes in δp during event N10 were synchronous with changes in δv when the water vapor concentration peaked at 33.35 mmol/mol from 14:00. However, at lower water vapor concentration levels, the variations of δp and δv began to differ. After 23:00, the water vapor concentration began to decrease to less than 30 mmol/mol, with a decrease in δp and a continued increase in δv. The same was true for the δp changes of tropical cyclone rains, as the water vapor concentration provided by the front and tail ends is related to the system structure [71], Pacific storms [16] and eight typhoons in Fuzhou from 2013 to 2017 [31]. The changes in δp and δv in low-pressure systems with high water concentration were consistent, while those with low water concentration differed.
Compared to other styles of rain events, S4 was characterized by a low number of thunderstorms and mainly consisted of stratiform precipitation. The total amount of precipitation was only 78.6 mm. With the exception of N9, a common characteristic of the other five rain events of this style was a small variation in δv. The δ18Ov ranged from 0.07 to 0.85‰, with a mean of 0.40‰. In such rain events, changes in δp are most likely related to the kinetic effects and thermal structures under the cloud base [16]. The δ18Op value of events N12 and N21 continued to decrease, similar to the ideal isotopic change pattern of raindrops. However, there is a feedback mechanism by re-evaporation that limits the ideal isotopic change pattern of raindrops [72]. The re-evaporation causes a decrease in the size of a raindrop that, in turn, reduces its rate of descent and increases the time to exchange with the surrounding air. Therefore, the δ18Op value of events N4 and N23 initially increased followed by a decrease. Event N9 was a rain event during which δ18Op did not noticeably change but δ18Ov slightly fluctuated. A small percentage of re-evaporation of raindrops can contribute to the depletion of heavy isotopes in water vapor [40,73], which provides an explanation for the steady δp and decreasing δv during event N9. Both δp and δv for S4 were affected by kinetic effects or micrometeorological physical properties, resulting in a less-enriched heavy isotope in δp than expected and a less-depleted light isotope in δv than predicted.
4.3. Re-Evaporation under the Cloud Base
Raindrops that fall into unsaturated air will partially re-evaporate and become enriched in heavy isotopes, depleting the surrounding water vapor [21,50]. Values of Ep are influenced by evaporation, which involves both the evaporation rate and falling time of raindrops. The evaporation rate and fall time are in turn determined by the standard height for precipitation clouds and the radius of the raindrops. The estimated raindrop radius was 0.74 mm (S2) > 0.73 mm (S1) > 0.61 mm (S3) > 0.55 mm (S4), similar to the global drop size distributions for different precipitation mechanisms [74]. The higher the liquid water content and the deeper the warm cloud, the stronger the convection and the larger the raindrop. The mean value of Ep in the four precipitation regimes was 6.11% (S4) > 4.44% (S1) > 2.29% (S2) > 1.59% (S3), which means greater liquid water content results in larger raindrops and a smaller enrichment ratio when precipitation is generated at the same altitude.
In low-pressure systems, with increased air mass convergence, more water vapor comes from the surrounding air column, resulting in a lower value of δ18Ov [21,67,68,73] and a smallest value of Ep. The second smallest value of Ep is for convection because the moist air mass carried by strong convection facilitates isotopic diffusion exchange between raindrops and water vapor, which in turn limits the re-evaporation of raindrops [8,9,34]. Although raindrops are enriched in heavy isotopes, the isotopic compositions of evaporated water vapor are depleted relative to the surrounding water vapor [75]. Light isotopes in subsequent precipitation from this air mass may be depleted, resulting in a lower δ18Op [7,8]. Such dynamic microphysical processes can cause the Ep for δ18O in convection to be as high as 14.48% (N5) or as low as −0.04% (N18). The slightly smaller raindrop radius of low-level jets than convection can explain the larger Ep of low-level jets. In addition, the high heavy isotope enrichment of the low-level jets may be due to the fact that raindrops with the same radius in a low-level jet would have a shorter falling time than in convection (Figure 6b). Compared to convection, with a smaller raindrop size, the raindrop feedback mechanism would be weaker [72], leading to stronger re-evaporation in the low-level jets. Stratiform precipitation had the lowest precipitation rates, the smallest raindrops radius and the greatest Ep.
Convection and stratiform are single cloud systems and multi-cloud systems (low level jet and low pressure) have a wide range of cloud heights, but the height of local precipitation cloud base where condensation occurs in multi-cloud systems is fixed within a certain range. Re-evaporation is a post-condensation process and from this perspective, estimates of Ep can be applied to multi-cloud systems. Falling time is a key element for determining the accuracy of the Ep, as the standard height for precipitation clouds was set to 1500 m, which is not reflective of reality. The difference in falling time between 1500 and 500 m for raindrops with a radius of 0.5 mm is 258 s (Figure 6b). At 25 °C and 95% relative humidity, the evaporation of a raindrop with a radius of 0.5 mm from an altitude of 1500 m is 0.13 mm and from an altitude of 500 m is 0.04 mm. An evaporation difference of 0.09 mm between the two altitudes can lead to an enrichment ratio bias of 13.32% (not shown).
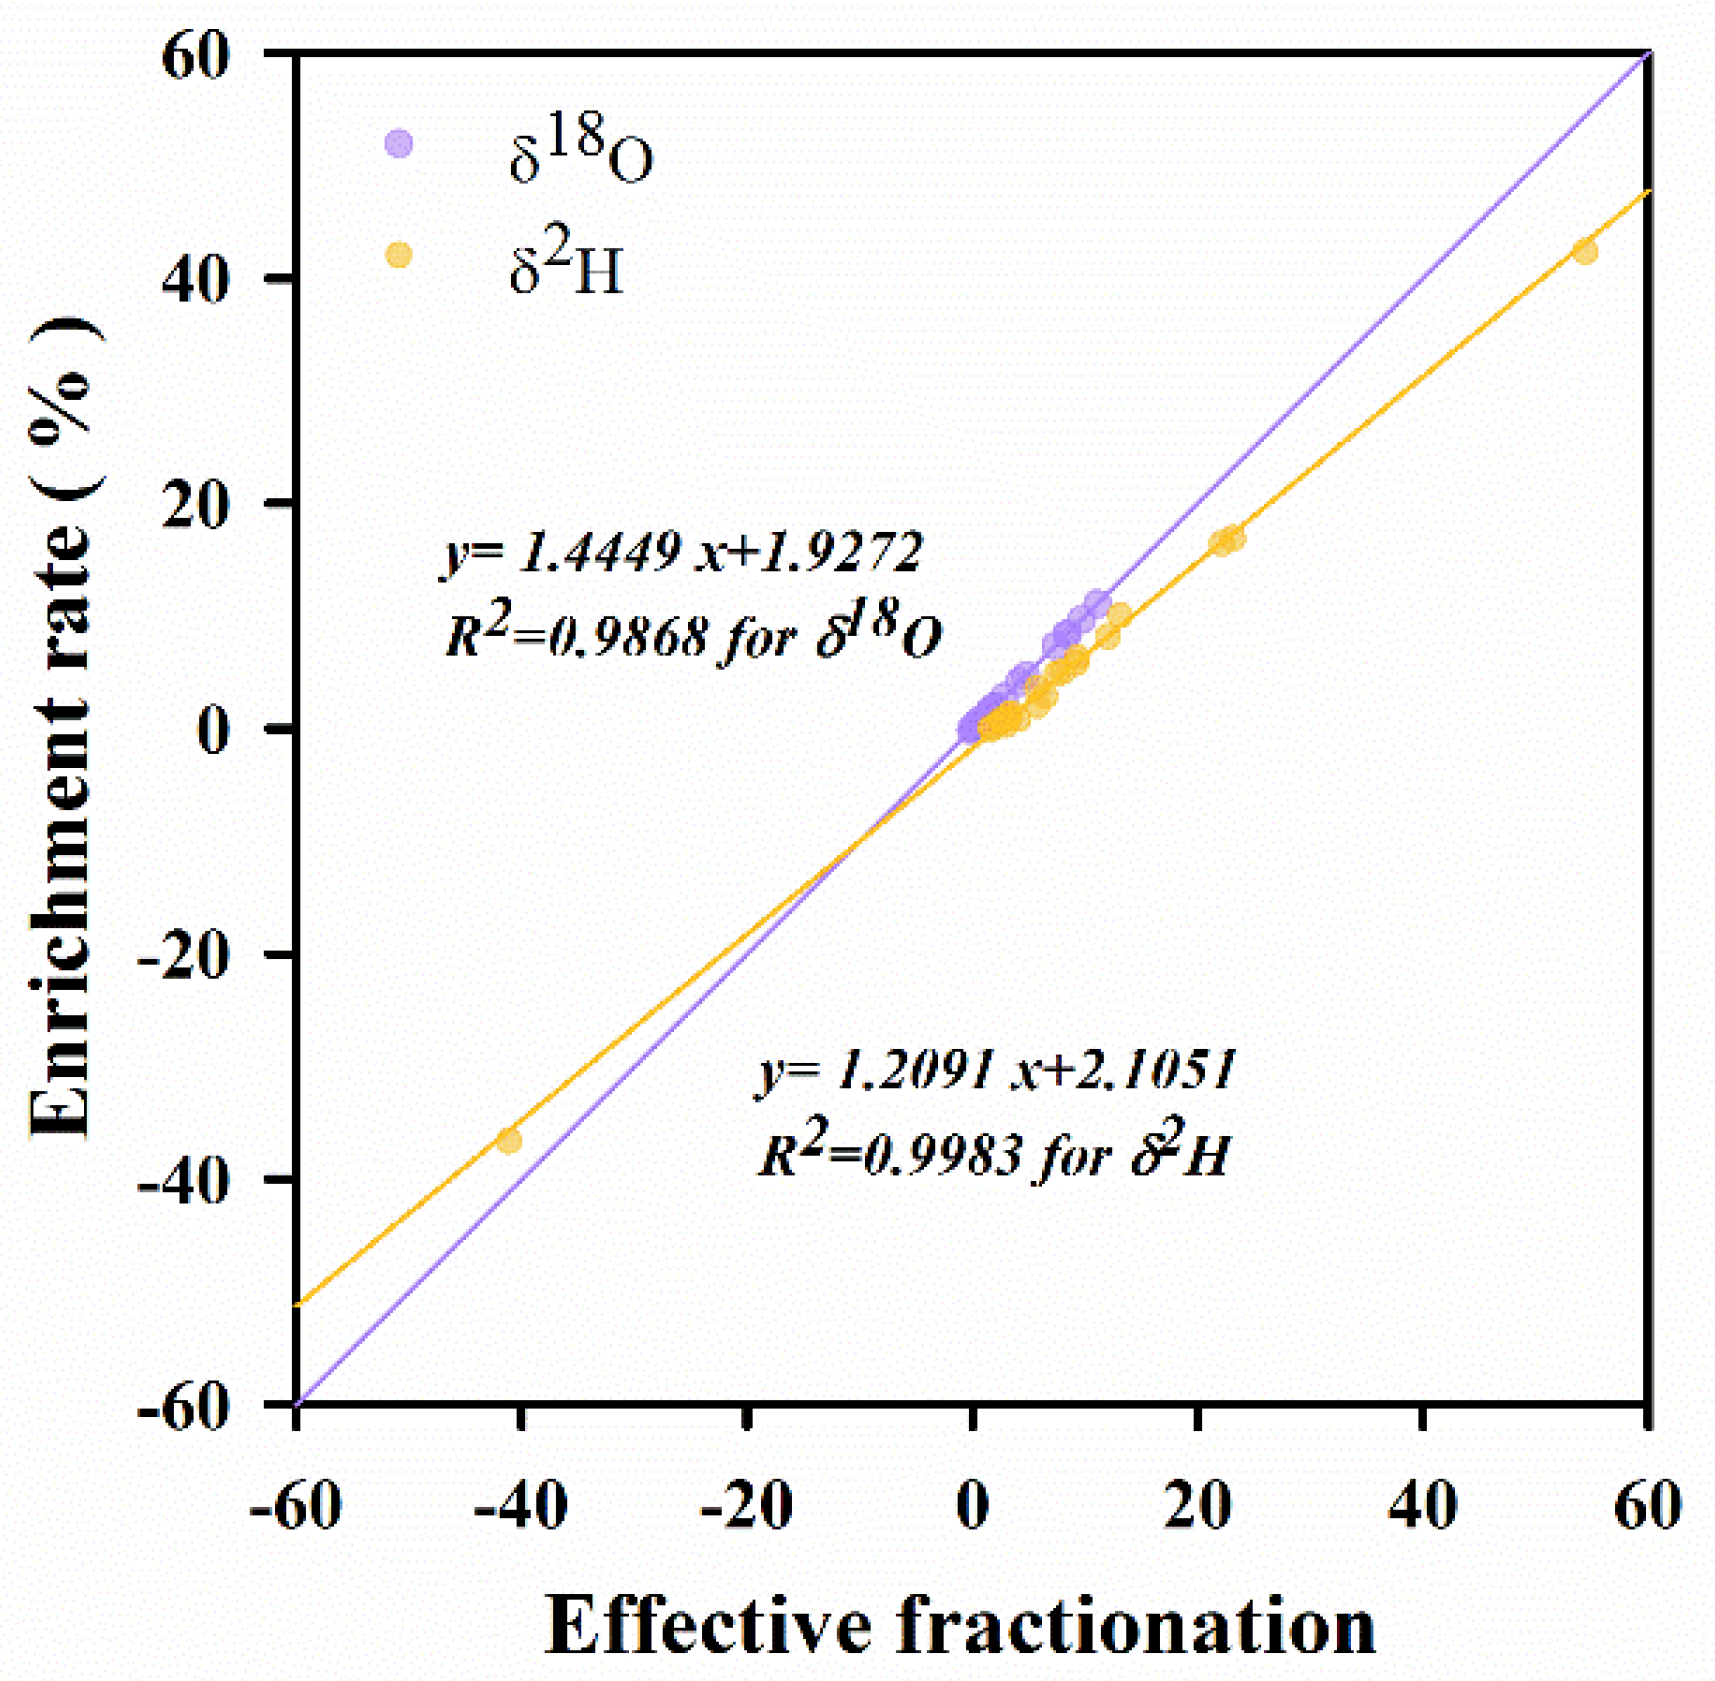
The isotopic effective fractionation factor (Ef = δv/δp) was used to determine the fractionation effect between water vapor and precipitation during a rain event. Changes in Ef are likely caused by potential precipitation and rainout processes (including equilibrium fractionation and kinetic fractionation). The greater the Ef, the greater the degree of isotope effective fractionation. The mean value of Ef for the four precipitation regimes was 9.75 (S4) > 7.49 (S1) > 5.41 (S2) > 4.29 (S3), the same as the mean value order of Ep. The mean equilibrium fractionation factors of local rain events are 1.01 for δ18O and 1.09 for δ2H. The conversion of water vapor to precipitation results in an isotopic fractionation of −1‰, showing that isotopic composition of water under the cloud base changed little and potential precipitation had a minimal effect on Ef. Kinetic isotopic fractionation accounts for most of the fractionation effect. Assuming a weaker to negligible fractionation with respect to isotope exchange, Ef can be used to evaluate the results of re-evaporation. There was a good linear fit between Ef and Ep (Figure 7), which provides a reasonable mechanical reference for Ep. Ep decreased linearly as Ef decreased, which is consistent with the general law of isotopic fractionation of water in rain events. Our future work will use satellite data (such as TRMM data, radar data) to accurately determine the cloud base height and improve the enrichment ratio calculations of heavy isotopes in water under the cloud base.
5. Conclusions
This paper summarized and classified hourly changes in δv and δp for 24 rain events in South China. Characteristics of δv and δp and precipitation regimes were analyzed. The importance of re-evaporation in the distribution of water during precipitation can be understood based on calculations of isotopic evaporation enrichment ratios under the cloud base.
The initial values of δp and δv were determined by the source of water vapor and how much rainout was lost during moisture transport. Rain events with the same water vapor sources were likely to have the same, but not absolute, changes in δp and δv. Variations in of δp and δv were related to precipitation mechanism. Changes in microphysical meteorological properties, including the size of the raindrop radius, exchange of surrounding water vapor and re-evaporation caused isotopic changes in water of different precipitation regimes to have different patterns.
Overall, the findings of this paper show the following:
- (1)
- Synchronous changes of δp and δv are found in low-level jets. Residual precipitation forms at low altitudes after the end of precipitation, resulting in opposing changes in δp and δv.
- (2)
- Large-scale convective activity, characterized by opposing changes in δp and δv, brings in water vapor depleted in heavy isotopes from the upper troposphere, while rainout causes enrichment of heavy isotopes in precipitation. A decrease in precipitation amount and raindrop size at the end of the rain event and possible re-evaporation under the cloud base, leads to the depletion of heavy isotopes in precipitation.
- (3)
- The precipitation environment of low-pressure systems creates a high water vapor concentration, replenishes water vapor and synchronizes variations in δp and δv. Once the water vapor concentration decreases, the changes in δp and δv no longer coincide.
- (4)
- For small-scale events and small precipitation amounts, precipitation may occur within stable clouds, with less variable δv.
The re-evaporation of raindrops is one of the kinetic fractionation processes that can be determined by the enrichment ratios of heavy isotopes (Ep). The value of Ep varies for different precipitation regimes, with the lowest value in low-pressure systems being determined by large-scale air mass convergence. High precipitation rates and large raindrop radii in strong convective activities creates the second largest values of Ep. The raindrop radii of low-level jets are slightly smaller than for convection, prompting the exchange of raindrops with surrounding air and re-evaporation and a value of Ep that is smaller than for convective activity. The largest values of Ep are found for stratiform precipitation and high isotope fractionation for precipitation regimes with high Ep indicates the role of re-evaporation is not negligible during precipitation processes, especially for stratiform precipitation.
Different patterns of changes in δp and δv can reflect different precipitation regimes. The drawback is that Ep can be biased by the assumption of precipitation cloud height, increasing its uncertainty. However, this paper provides new possible directions for meteorological system discrimination by observing changes in δp and δv and offers some new information for the characterization and application of δp and δv in subtropical and tropical regions.
Supplementary Materials
The following are available online at https://www.mdpi.com/article/10.3390/w13070940/s1. Figure S1: Sampling device is a close cylinder, which consists of three parts: collection, downstream and storage, Figure S2: Isotopic measurement calibration of national standard samples and working standard samples, Figure S3: The deviation between isotope value of liquid water and standards under different water vapor concentrations, Figure S4: Before and after Six-hour correction, one correction & daily correction in five days and 3 m tube correction & 30 m tube correction, Figure S5: Sampling device is a close cylinder, which consists of three parts: collection, downstream and storage, Table S1: The accuracy of isotope composition in liquid water and water vapor, Table S2: The initial point of the Rayleigh curve for the 24 rain events.
Author Contributions
Conceptualization, X.L. and C.T.; methodology, X.L.; software, X.L.; validation, X.L., C.T. and J.C.; formal analysis, X.L.; investigation, X.L. and J.C.; resources, X.L.; data curation, X.L.; writing—original draft preparation, X.L.; writing—review and editing, X.L.; visualization, X.L.; supervision, C.T.; project administration, C.T.; funding acquisition, C.T. All authors have read and agreed to the published version of the manuscript.
Funding
This work was financially supported by the General Program of the National Natural Science Foundation of China (Grant No.41877470), the Natural Science Foundation of Guangdong Province, China (Grant No.2017A030313231) and the Natural Science Foundation of Guangdong Province, China (Grant No.2017A030313229).
Institutional Review Board Statement
Not applicable.
Informed Consent Statement
Not applicable.
Data Availability Statement
The data that support the findings of this study are available from the corresponding author upon reasonable request.
Acknowledgments
We appreciate constructive comments from anonymous reviewers that helped us improve our manuscripts.
Conflicts of Interest
The authors declare no conflict of interest.
References
- McDonnell, J.J.; Bonell, M.; Stewart, M.K.; Pearce, A.J. Deuterium variations in storm rainfall: Implications for stream hydrograph separation. Water Resour. Res. 1990, 26, 455–458. [Google Scholar] [CrossRef]
- Uhlenbrook, S.; Frey, M.; Leibundgut, C.; Maloszewski, P. Hydrograph separations in a mesoscale mountainous basin at event and seasonal timescales. Water Resour. Res. 2002, 38, 31-1–31-14. [Google Scholar] [CrossRef] [Green Version]
- Krabbenhoft, D.P.; Bowser, C.J.; Anderson, M.P.; Valley, J.W. Estimating groundwater exchange with lakes: 1. The stable isotope mass balance method. Water Resour. Res. 1990, 26, 2445–2453. [Google Scholar] [CrossRef]
- Gibson, J.J.; Edwards, T.W.D.; Birks, S.J.; Amour, N.A.S.; Buhay, W.M.; McEachern, P.; Wolfe, B.B.; Peters, D.L. Progress in isotope tracer hydrology in Canada. Hydrol. Process. 2005, 19, 303–327. [Google Scholar] [CrossRef]
- Yakir, D.; Wang, X.-F. Fluxes of CO2 and water between terrestrial vegetation and the atmosphere estimated from isotope measurements. Nature 1996, 380, 515–517. [Google Scholar] [CrossRef]
- Sutanto, S.J.; Hurk, B.V.D.; Dirmeyer, P.A.; Seneviratne, S.I.; Röckmann, T.; Trenberth, K.E.; Blyth, E.M.; Wenninger, J.; Hoffmann, G. HESS Opinions “A perspective on isotope versus non-isotope approaches to determine the contribution of transpiration to total evaporation”. Hydrol. Earth Syst. Sci. 2014, 18, 2815–2827. [Google Scholar] [CrossRef] [Green Version]
- Brown, D.; Worden, J.; Noone, D. Comparison of atmospheric hydrology over convective continental regions using water vapor isotope measurements from space. J. Geophys. Res. Space Phys. 2008, 113. [Google Scholar] [CrossRef]
- Risi, C.; Bony, S.; Vimeux, F.; Descroix, L.; Ibrahim, B.; Lebreton, E.; Mamadou, I.; Sultan, B. What controls the isotopic composition of the African monsoon precipitation? Insights from event-based precipitation collected during the 2006 AMMA field campaign. Geophys. Res. Lett. 2008, 35, 851–854. [Google Scholar] [CrossRef] [Green Version]
- Yoshimura, K.; Kanamitsu, M.; Dettinger, M. Regional downscaling for stable water isotopes: A case study of an atmospheric river event. J. Geophys. Res. Space Phys. 2010, 115, 311–319. [Google Scholar] [CrossRef]
- Galewsky, J.; Sobel, A.; Held, I. Diagnosis of Subtropical Humidity Dynamics Using Tracers of Last Saturation. J. Atmos. Sci. 2005, 62, 3353–3367. [Google Scholar] [CrossRef] [Green Version]
- Galewsky, J.; Steen-Larsen, H.C.; Field, R.D.; Worden, J.; Risi, C.; Schneider, M. Stable isotopes in atmospheric water vapor and applications to the hydrologic cycle. Rev. Geophys. 2016, 54, 809–865. [Google Scholar] [CrossRef]
- Wen, X.-F.; Zhang, S.-C.; Sun, X.-M.; Yu, G.-R.; Lee, X. Water vapor and precipitation isotope ratios in Beijing, China. J. Geophys. Res. Space Phys. 2010, 115, 133–134. [Google Scholar] [CrossRef] [Green Version]
- Brown, D.; Worden, J.; Noone, D. Characteristics of tropical and subtropical atmospheric moistening derived from Lagrangian mass balance constrained by measurements of HDO and H2O. J. Geophys. Res. Atmos. 2013, 118, 54–72. [Google Scholar] [CrossRef] [Green Version]
- Farlin, J.; Lai, C.-T.; Yoshimura, K. Influence of synoptic weather events on the isotopic composition of atmospheric moisture in a coastal city of the western United States. Water Resour. Res. 2013, 49, 3685–3696. [Google Scholar] [CrossRef] [Green Version]
- Celle-Jeanton, H.; Gonfiantini, R.; Travi, Y.; Sol, B. Oxygen-18 variations of rainwater during precipitation: Application of the Rayleigh model to selected rainfalls in Southern France. J. Hydrol. 2004, 289, 165–177. [Google Scholar] [CrossRef]
- Coplen, T.B.; Neiman, P.J.; White, A.B.; Landwehr, J.M.; Ralph, F.M.; Dettinger, M.D. Extreme changes in stable hydrogen isotopes and precipitation characteristics in a landfalling Pacific storm. Geophys. Res. Lett. 2008, 35. [Google Scholar] [CrossRef] [Green Version]
- Barras, V.; Simmonds, I. Observation and modeling of stable water isotopes as diagnostics of rainfall dynamics over southeastern Australia. J. Geophys. Res. Space Phys. 2009, 114, 23. [Google Scholar] [CrossRef]
- Rangarajan, R.; Laskar, A.H.; Bhattacharya, S.K.; Shen, C.-C.; Liang, M.-C. An insight into the western Pacific wintertime moisture sources using dual water vapor isotopes. J. Hydrol. 2017, 547, 111–123. [Google Scholar] [CrossRef]
- Schmidt, G.A.; Hoffmann, G.; Shindell, D.T.; Hu, Y. Modeling atmospheric stable water isotopes and the potential for constraining cloud processes and stratosphere-troposphere water exchange. J. Geophys. Res. Space Phys. 2005, 110. [Google Scholar] [CrossRef] [Green Version]
- Lee, J.-E.; Pierrehumbert, R.; Swann, A.; Lintner, B.R. Sensitivity of stable water isotopic values to convective parameterization schemes. Geophys. Res. Lett. 2009, 36. [Google Scholar] [CrossRef] [Green Version]
- Dansgaard, W. Stable isotopes in precipitation. Tellus 1964, 16, 436–468. [Google Scholar] [CrossRef]
- Clark, I.D.; Fritz, P. Environmental Isotopes in Hydrology; Lewis Publishers: Boca Raton, FL, USA, 1998. [Google Scholar]
- Araguás-Araguás, L.; Froehlich, K.; Rozanski, K. Stable isotope composition of precipitation over southeast Asia. J. Geophys. Res. Space Phys. 1998, 103, 28721–28742. [Google Scholar] [CrossRef]
- Gonfiantini, R.; Roche, M.-A.; Olivry, J.-C.; Fontes, J.-C.; Zuppi, G.M. The altitude effect on the isotopic composition of tropical rains. Chem. Geol. 2001, 181, 147–167. [Google Scholar] [CrossRef]
- Cappa, C.D.; Hendricks, M.B.; Depaolo, D.J. Isotopic fractionation of water during evaporation. J. Geophys. Res. Atmos. 2002, 108, 4525. [Google Scholar] [CrossRef]
- Dittmann, A.; Schlosser, E.; Masson-Delmotte, V.; Powers, J.G.; Manning, K.W.; Werner, M.; Fujita, K. Precipitation regime and stable isotopes at Dome Fuji, East Antarctica. Atmos. Chem. Phys. Discuss. 2016, 16, 6883–6900. [Google Scholar] [CrossRef] [Green Version]
- Rindsberger, M.; Jaffe, S.; Rahamim, S.; Gat, J.R. Patterns of the isotopic composition of precipitation in time and space: Data from the Israeli storm water collection program. Tellus B 1990, 423, 263–271. [Google Scholar] [CrossRef]
- Miyake, Y.; Matsubaya, O.; Nishihara, C. An Isotopic Study on Meteoric Precipitation. Pap. Meteorol. Geophys. 1968, 19, 243–266. [Google Scholar] [CrossRef]
- Munksgaard, N.C.; Wurster, C.M.; Bass, A.; Bird, M.I. Extreme short-term stable isotope variability revealed by continuous rainwater analysis. Hydrol. Process. 2012, 26, 3630–3634. [Google Scholar] [CrossRef]
- Adaretal, E.M. A Mechanical Sequential Rain Sampler for Isotopic and Chemical Analyses; Contract No. 5542/RO/RB; IAEA: Vienna, Austria, 1991. [Google Scholar]
- Xu, T.; Sun, X.; Hong, H.; Wang, X.; Cui, M.; Lei, G.; Gao, L.; Liu, J.; Lone, M.A.; Jiang, X. Stable isotope ratios of typhoon rains in Fuzhou, Southeast China, during 2013–2017. J. Hydrol. 2019, 570, 445–453. [Google Scholar] [CrossRef]
- Chen, T.J.; Wang, C.C.; Lin, T.W. Characteristics of low-level jets over northern taiwan in mei-yu season and their relationship to heavy rain events. Mon. Weather Rev. 2010, 133, 20–43. [Google Scholar] [CrossRef] [Green Version]
- Lekshmy, P.R.; Midhun, M.; Ramesh, R.; Jani, R.A. 18O depletion in monsoon rain relates to large scale organized convection rather than the amount of rainfall. Sci. Rep. 2015, 4, 5661. [Google Scholar] [CrossRef] [Green Version]
- Lee, J.-E.; Fung, I. “Amount effect” of water isotopes and quantitative analysis of post-condensation processes. Hydrol. Process. 2007, 22, 1–8. [Google Scholar] [CrossRef]
- Saranya, P.; Krishan, G.; Rao, M.; Kumar, S.; Kumar, B. Controls on water vapor isotopes over Roorkee, India: Impact of convective activities and depression systems. J. Hydrol. 2018, 557, 679–687. [Google Scholar] [CrossRef]
- Houze, R.A. Stratiform Precipitation in Regions of Convection: A Meteorological Paradox? Bull. Am. Meteorol. Soc. 1997, 78, 2179–2196. [Google Scholar] [CrossRef]
- Fudeyasu, H.; Ichiyanagi, K.; Yoshimura, K.; Mori, S.; Hamada, J.-I.; Sakurai, N.; Yamanaka, M.D.; Matsumoto, J.; Syamsudin, F. Effects of Large-scale Moisture Transport and Mesoscale Processes on Precipitation Isotope Ratios Observed at Sumatera, Indonesia. J. Meteorol. Soc. Jpn. 2011, 89A, 49–59. [Google Scholar] [CrossRef] [Green Version]
- Fudeyasu, H.; Ichiyanagi, K.; Sugimoto, A.; Yoshimura, K.; Ueta, A.; Yamanaka, M.D.; Ozawa, K. Isotope ratios of precipitation and water vapor observed in Typhoon Shanshan. J. Geophys. Res. Space Phys. 2008, 113. [Google Scholar] [CrossRef]
- Laskar, A.H.; Huang, J.-C.; Hsu, S.-C.; Bhattacharya, S.K.; Wang, C.-H.; Liang, M.-C. Stable isotopic composition of near surface atmospheric water vapor and rain–vapor interaction in Taipei, Taiwan. J. Hydrol. 2014, 519, 2091–2100. [Google Scholar] [CrossRef]
- Worden, J.; The Tropospheric Emission Spectrometer Science Team and Data Contributors; Noone, D.; Bowman, K.; Beer, R.; Eldering, A.; Fisher, B.; Gunson, M.; Goldman, A.; Herman, R.; et al. Importance of rain evaporation and continental convection in the tropical water cycle. Nat. Cell Biol. 2007, 445, 528–532. [Google Scholar] [CrossRef]
- Coplen, T.B. New guidelines for reporting stable hydrogen, carbon, and oxygen isotope-ratio data. Geochim. Cosmochim. Acta 1996, 60, 3359–3360. [Google Scholar] [CrossRef]
- Sodemann, H.; Schwierz, C.; Wernli, H. Interannual variability of Greenland winter precipitation sources: Lagrangian moisture diagnostic and North Atlantic Oscillation influence. J. Geophys. Res. Space Phys. 2008, 113, 1–17. [Google Scholar] [CrossRef] [Green Version]
- He, S.; Goodkin, N.F.; Jackisch, D.; Ong, M.R.; Samanta, D. Continuous real-time analysis of the isotopic composition of precipitation during tropical rain events: Insights into tropical convection. Hydrol. Process. 2018, 32, 1531–1545. [Google Scholar] [CrossRef] [Green Version]
- Huang, R.H.; Wu, G.X.; Chen, W. Advances and Frontiers in the Study of Atmospheric Science and Global Climate Change; Science Press: Beijing, China, 2014. [Google Scholar]
- Rozanski, K. Isotopic patterns in modern global precipitation. Clim. Chang. Cont. Isot. Rec. 1993, 78, 1–36. [Google Scholar]
- Peng, T.-R.; Wang, C.-H.; Huang, C.-C.; Fei, L.-Y.; Chen, C.-T.A.; Hwong, J.-L. Stable isotopic characteristic of Taiwan’s precipitation: A case study of western Pacific monsoon region. Earth Planet. Sci. Lett. 2010, 289, 357–366. [Google Scholar] [CrossRef]
- Winnick, M.J.; Chamberlain, C.P.; Caves, J.K.; Welker, J.M. Quantifying the isotopic ‘continental effect’. Earth Planet. Sci. Lett. 2014, 406, 123–133. [Google Scholar] [CrossRef]
- Wang, S.; Zhang, M.; Che, Y.; Zhu, X.; Liu, X. Influence of Below-Cloud Evaporation on Deuterium Excess in Precipitation of Arid Central Asia and Its Meteorological Controls. J. Hydrometeorol. 2016, 17, 1973–1984. [Google Scholar] [CrossRef]
- Froehlich, K.; Kralik, M.; Papesch, W.; Rank, D.; Scheifinger, H.; Stichler, W. Deuterium excess in precipitation of Alpine regions—Moisture recycling. Isot. Environ. Heal. Stud. 2008, 44, 61–70. [Google Scholar] [CrossRef]
- Stewart, M.K. Stable isotope fractionation due to evaporation and isotopic exchange of falling waterdrops: Applications to atmospheric processes and evaporation of lakes. J. Geophys. Res. Space Phys. 1975, 80, 1133–1146. [Google Scholar] [CrossRef]
- Kinzer, G.D.; Gunn, R. The evaporation, temperature and thermal relaxation-time of freely falling waterdrops. J. Atmos. Sci. 1951, 8, 71–83. [Google Scholar] [CrossRef] [Green Version]
- Best, A.C. The size distribution of raindrops. Q. J. R. Meteorol. Soc. 1950, 76, 16–36. [Google Scholar] [CrossRef]
- Salamalikis, V.; Argiriou, A.; Dotsika, E. Isotopic modeling of the sub-cloud evaporation effect in precipitation. Sci. Total. Environ. 2016, 544, 1059–1072. [Google Scholar] [CrossRef] [PubMed]
- Sekine, M.; Lind, G. Rain Attenuation 0f Centimeter, Millimeter and Submillimeter Radio Waves. Eur. Microw. Conf. 1982, 584–589. [Google Scholar] [CrossRef]
- Qiu, S.B.; Chen, J.H. The distribution of raindrop size in Guangzhou. Chin. J. of Radio Sci. 1995, 10, 73–77. [Google Scholar]
- Sekine, M.; Ishii, S.; Hwang, S.I.; Sayama, S. Weibull Raindrop-Size Distribution and its Application to Rain Attenuation from 30 GHz to 1000 GHz. Int. J. Infrared Millim. Waves 2007, 28, 383–392. [Google Scholar] [CrossRef]
- Aemisegger, F.; Spiegel, J.K.; Pfahl, S.; Sodemann, H.; Eugster, W.; Wernli, H. Isotope meteorology of cold front passages: A case study combining observations and modeling. Geophys. Res. Lett. 2015, 42, 5652–5660. [Google Scholar] [CrossRef]
- Gat, J.; Klein, B.; Kushnir, Y.; Roether, W.; Wernli, H.; Yam, R.; Shemesh, A. Isotope composition of air moisture over the Mediterranean Sea: An index of the air-sea interaction pattern. Tellus B 2003, 55, 953–965. [Google Scholar] [CrossRef]
- Kurita, N.; Ichiyanagi, K.; Matsumoto, J.; Yamanaka, M.D.; Ohata, T. The relationship between the isotopic content of precipitation and the precipitation amount in tropical regions. J. Geochem. Explor. 2009, 102, 113–122. [Google Scholar] [CrossRef]
- Cai, Z.; Tian, L.; Bowen, G.J. Spatial-seasonal patterns reveal large-scale atmospheric controls on Asian Monsoon precipitation water isotope ratios. Earth Planet. Sci. Lett. 2018, 503, 158–169. [Google Scholar] [CrossRef]
- Noone, D.C. Pairing Measurements of the Water Vapor Isotope Ratio with Humidity to Deduce Atmospheric Moistening and Dehydration in the Tropical Midtroposphere. J. Clim. 2012, 25, 4476–4494. [Google Scholar] [CrossRef]
- Steen-Larsen, H.C.; Sveinbjörnsdottir, A.E.; Jonsson, T. Moisture sources and synoptic to seasonal variability of North Atlantic water vapor isotopic composition. J. Geophys. Res. Atmos. 2015, 120, 5757–5774. [Google Scholar] [CrossRef] [Green Version]
- Konecky, B.L.; Noone, D.C.; Cobb, K.M. The Influence of Competing Hydroclimate Processes on Stable Isotope Ratios in Tropical Rainfall. Geophys. Res. Lett. 2019, 46, 1622–1633. [Google Scholar] [CrossRef]
- Gat, J.R. Oxygen and hydrogen isotopes in the hydrologic cycle. Annu. Rev. Earth Planet. Sci. 1996, 24, 225–262. [Google Scholar] [CrossRef] [Green Version]
- Zhang, S.; Sun, X.; Wang, J.; Yu, G.; Wen, X. Short-term variations of vapor isotope ratios reveal the influence of atmospheric processes. J. Geogr. Sci. 2011, 21, 401–416. [Google Scholar] [CrossRef]
- Aemisegger, F.; Pfahl, S.; Sodemann, H.; Lehner, I.; I Seneviratne, S.; Wernli, H. Deuterium excess as a proxy for continental moisture recycling and plant transpiration. Atmos. Chem. Phys. Discuss. 2014, 14, 4029–4054. [Google Scholar] [CrossRef] [Green Version]
- Lee, J.-E.; Fung, I.; DePaolo, D.J.; Henning, C.C. Analysis of the global distribution of water isotopes using the NCAR atmospheric general circulation model. J. Geophys. Res. Space Phys. 2007, 112. [Google Scholar] [CrossRef]
- Moore, M.H.; Kuang, Z.; Blossey, P.N. A moisture budget perspective of the amount effect. Geophys. Res. Lett. 2014, 41, 1329–1335. [Google Scholar] [CrossRef] [Green Version]
- Xie, L.; Wei, G.; Deng, W.; Zhao, X. Daily δ18O and δD of precipitations from 2007 to 2009 in Guangzhou, South China: Implications for changes of moisture sources. J. Hydrol. 2011, 400, 477–489. [Google Scholar] [CrossRef]
- Ruan, J.; Zhang, H.; Cai, Z.; Yang, X.; Yin, J. Regional controls on daily to interannual variations of precipitation isotope ratios in Southeast China: Implications for paleomonsoon reconstruction. Earth Planet. Sci. Lett. 2019, 527, 115794. [Google Scholar] [CrossRef]
- Lawrence, R.J.; Gedzelman, D.S. Low stable isotope ratios of tropical cyclone rains. Geophys. Res. Lett. 1996, 23, 527–530. [Google Scholar] [CrossRef]
- Sharp, Z.D. Principles of Stable Isotope Geochemistry, 2nd ed.; Prentice Hall: Upper Saddle River, NJ, USA, 2017; Available online: https://doi.org/10.25844/h9q1-0p82 (accessed on 21 May 2018).
- Field, R.D.; Jones, D.B.A.; Brown, D.P. Effects of postcondensation exchange on the isotopic composition of water in the atmosphere. J. Geophys. Res. Space Phys. 2010, 115. [Google Scholar] [CrossRef] [Green Version]
- Dolan, B.; Fuchs, B.; Rutledge, S.A.; Barnes, E.A.; Thompson, E.J. Primary Modes of Global Drop Size Distributions. J. Atmospheric Sci. 2018, 75, 1453–1476. [Google Scholar] [CrossRef]
- Gedzelman, S.D.; Arnold, R. Modeling the isotopic composition of precipitation. J. Geophys. Res. Space Phys. 1994, 99, 10455–10471. [Google Scholar] [CrossRef]
Figure 1.
Isotopic variations of typical rain events: (a) low-level jets; (b) convection; (c) low-pressure systems, where © is water vapor concentrations; and (d) stratiform precipitation. The plus in the superscript indicates an increase in the isotope ratios of water, while the minus indicates a decrease in the isotope ratios of water. For example, the warm surface water vapor rises and mixes with water vapor at high altitude in low-level jets, the value of δv at high altitude rises briefly. Large raindrops experiencing re-evaporation under the clouds during their falling become small and the escape of light isotopes within the raindrops results in relatively high δp values within the raindrops. The isotopic composition of both precipitation and water vapor in all rain events were affected by kinetic effects (such as surface evapotranspiration, re-evaporation of raindrops and exchange with surrounding air), resulting in the heavy isotopes in precipitation not being as enriched as expected and the light isotopes of water vapor not being as depleted as predicted.

Figure 2.
Variations in the isotopic composition of precipitation (δp, solid circles) and water vapor (δv, open circles) in 24 rain events.
Figure 2.
Variations in the isotopic composition of precipitation (δp, solid circles) and water vapor (δv, open circles) in 24 rain events.

Figure 3.
(a) Evaporation rate, evaporation and remaining proportion after evaporation varying with raindrop radius. (b) Distribution of evaporation enrichment rate of heavy isotopes (Ep) and the size of raindrops. (c) The d-excess of measured and after correction in precipitation.
Figure 3.
(a) Evaporation rate, evaporation and remaining proportion after evaporation varying with raindrop radius. (b) Distribution of evaporation enrichment rate of heavy isotopes (Ep) and the size of raindrops. (c) The d-excess of measured and after correction in precipitation.

Figure 4.
Water vapor trajectories for each rain event.

Figure 5.
Changes of δ18O in precipitation and water vapor according to Rayleigh fractionation. Blue solid circles are the isotopic composition of precipitation (δp), red solid circles are the isotopic composition of equilibrium water vapor isotopes (δe) estimated by δp and red hollow circles are the isotopic composition of water vapor (δv). The initial values of hydrogen and oxygen isotopes were set to 0‰ (seawater) and the initial isotopic composition in vapor was derived from the evaporation of seawater. Solid and dashed lines represent Rayleigh simulations of the isotopic composition of precipitation and water vapor, respectively.

Figure 6.
(a) Relation between δ18O and precipitation. The isotopic composition of precipitation (δp) and water vapor (δv) are represented by blue and red, respectively. The equilibrium isotopic composition of water vapor is in gray and the isotopic change of water under the cloud base is in yellow. Circle, triangle, cross and star represent rain event styles S1, S2, S3 and S4, respectively. (b) Falling time for raindrops of different sizes from 1500 and 500 m.

Figure 7.
Relationship between the effective fractionation coefficient (Ef) and enrichment rate of heavy isotopes in precipitation under the cloud base (Ep).
Figure 7.
Relationship between the effective fractionation coefficient (Ef) and enrichment rate of heavy isotopes in precipitation under the cloud base (Ep).


Table 1.
Weighted average isotopic composition of water for each rain event.
| Event Number | Date | Duration (h) | # of Samples | Precipitation (mm) | Precipitation Isotopes (‰) | Water Vapor Isotopes (‰) | Equilibrium Vapor Isotopes (‰) | |||||||
|---|---|---|---|---|---|---|---|---|---|---|---|---|---|---|
| δ18O | std | δ2H | std | δ18O | std | δ2H | std | δ18O | δ2H | |||||
| N1 | 18 April 2016 | 6 | 8 | 26.9 | −0.82 | 0.60 | −4.09 | 3.56 | −13.37 | 0.43 | −93.92 | 2.93 | −10.21 | −79.91 |
| N2 | 20 April 2016 | 4 | 4 | 8.7 | −1.49 | 1.25 | −6.38 | 5.64 | −11.66 | 0.26 | −85.20 | 1.70 | −10.95 | −81.55 |
| N3 | 22 April 2016 | 3 | 3 | 1.6 | −1.99 | 0.17 | −10.40 | 3.79 | −12.52 | 0.08 | −91.20 | 0.53 | −11.15 | −85.31 |
| N4 | 24 April 2016 | 7 | 7 | 3.4 | −0.53 | 1.13 | −1.86 | 4.24 | −12.66 | 0.35 | −89.27 | 1.71 | −10.26 | −78.00 |
| N5 | 30 April 2016 | 6 | 6 | 17.6 | −0.54 | 1.02 | 2.83 | 3.06 | −12.56 | 0.33 | −84.38 | 2.08 | −10.36 | −75.06 |
| N6 | 3 May 2016 | 7 | 7 | 32.5 | −0.57 | 1.04 | 0.00 | 3.72 | −12.54 | 0.56 | −87.02 | 3.49 | −10.40 | −76.08 |
| N7 | 6 May 2016 | 4 | 4 | 9 | −1.94 | 1.12 | −9.62 | 2.67 | −13.20 | 0.64 | −91.98 | 2.90 | −11.25 | −82.82 |
| N8 | 10 May 2016 | 17 | 17 | 153.5 | −2.64 | 0.89 | −11.56 | 3.99 | −13.26 | 0.73 | −90.62 | 4.47 | −11.65 | −84.35 |
| N9 | 20 May 2016 | 13 | 6 | 37.1 | −2.89 | 0.11 | −10.17 | 2.46 | −12.56 | 0.80 | −88.05 | 4.86 | −12.18 | −87.28 |
| N10 | 27 May 2016 | 16 | 13 | 19.1 | −6.01 | 1.46 | −41.17 | 11.19 | −18.00 | 1.32 | −126.55 | 8.48 | −12.30 | −92.44 |
| N11 | 4 June2016 | 7 | 5 | 28.5 | −5.81 | 1.16 | −36.08 | 7.71 | −15.25 | 1.23 | −107.73 | 9.01 | −14.76 | −108.01 |
| N12 | 5 June 2016 | 2 | 2 | 22.4 | −7.27 | 1.60 | −46.39 | 12.09 | −15.39 | 0.07 | −108.19 | 0.51 | −15.85 | −112.27 |
| N13 | 21 October 2016 | 2 | 2 | 0.3 | −3.01 | 2.38 | −26.18 | 7.06 | −15.09 | 0.37 | −108.08 | 2.38 | −12.71 | −96.47 |
| N14 | 8 May 2017 | 4 | 4 | 48.3 | −3.70 | 0.63 | −13.53 | 3.39 | −12.42 | 1.08 | −89.51 | 6.09 | −12.86 | −86.95 |
| N15 | 2 June 2017 | 8 | 6 | 3.01 | −5.47 | 2.25 | −34.32 | 18.46 | −12.98 | 0.39 | −93.95 | 2.53 | −14.69 | −103.18 |
| N16 | 14 June 2017 | 4 | 4 | 6.6 | −8.30 | 0.59 | −58.20 | 4.44 | −12.92 | 0.80 | −95.27 | 6.02 | −17.48 | −126.88 |
| N17 | 16 June 2017 | 3 | 3 | 20.6 | −5.93 | 0.77 | −40.34 | 4.55 | −21.03 | 0.20 | −151.05 | 1.48 | −14.81 | −107.89 |
| N18 | 17 June 2017 | 9 | 9 | 34 | −9.23 | 2.76 | −63.21 | 20.42 | −20.62 | 0.60 | −147.50 | 4.27 | −16.45 | −117.91 |
| N19 | 22 June 2017 | 2 | 2 | 0.6 | −3.45 | 0.28 | −17.23 | 2.53 | −14.35 | 0.72 | −102.51 | 4.71 | −12.16 | −83.56 |
| N20 | 13 July 2017 | 2 | 2 | 22.3 | −5.45 | 0.01 | −36.38 | 0.91 | −13.51 | 0.09 | −95.88 | 0.80 | −14.02 | −99.60 |
| N21 | 15 July 2017 | 2 | 2 | 1.9 | −4.43 | 0.90 | −22.75 | 6.20 | −13.51 | 0.85 | −94.71 | 5.16 | −13.68 | −96.90 |
| N22 | 14 September 2017 | 2 | 2 | 40.6 | −10.61 | 0.38 | −73.90 | 1.61 | −16.63 | 0.30 | −120.47 | 2.11 | −19.42 | −139.64 |
| N23 | 13 November 2017 | 15 | 15 | 12.2 | −6.70 | 0.62 | −41.69 | 3.99 | −16.70 | 0.25 | −121.24 | 1.44 | −15.85 | −113.79 |
| N24 | 6 January 2018 | 13 | 9 | 67.5 | −5.96 | 1.25 | −32.35 | 10.73 | −15.50 | 1.13 | −111.78 | 8.44 | −12.80 | −96.77 |
Table 2.
Enrichment rate of heavy isotopes and the effective fractionation factor for different styles of rain events.
Table 2.
Enrichment rate of heavy isotopes and the effective fractionation factor for different styles of rain events.
| Style | Number | Temperature (°C) | RH (%) | Raindrop Radius (mm) | Evaporation Rate | Evaporation | Remaining Proportion after Evaporation | Isotopic Change of Water under the Cloud Base (‰) | Enrichment Rate (Precipitation) | Enrichment Rate (Vapor) | Effective Fractionation Factor | ||||
|---|---|---|---|---|---|---|---|---|---|---|---|---|---|---|---|
| δ18O | δ2H | δ18O | δ2H | δ18O | δ2H | δ18O | δ2H | ||||||||
| S1 | N1 | 22.21 | 95.10 | 0.76 | 6.22 | 0.37 | 87.81 | −8.49 | −72.20 | 9.38 | 16.66 | −0.23 | −0.15 | 16.35 | 22.97 |
| N2 | 22.80 | 94.17 | 0.61 | 4.44 | 0.18 | 83.05 | −8.57 | −71.07 | 4.77 | 10.14 | −0.06 | −0.04 | 7.85 | 13.35 | |
| N16 | 26.50 | 90.83 | 0.55 | 4.21 | 0.17 | 79.67 | −8.84 | −67.38 | 0.07 | 0.16 | 0.35 | 0.32 | 1.56 | 1.64 | |
| N20 | 33.61 | 76.64 | 1.00 | 14.17 | 0.28 | 88.72 | −9.36 | −60.60 | 0.72 | 0.67 | 0.04 | 0.04 | 2.48 | 2.64 | |
| N24 | 14.02 | 98.36 | 0.80 | 5.14 | 0.67 | 91.00 | −7.79 | −81.51 | 0.31 | 1.52 | 0.04 | 0.02 | 2.60 | 3.46 | |
| S2 | N5 | 21.43 | 91.25 | 0.66 | 4.80 | 0.29 | 85.93 | −8.40 | −73.24 | 14.48 | −26.90 | −0.19 | −0.12 | 23.13 | −29.84 |
| N6 | 23.87 | 87.78 | 0.77 | 6.72 | 0.47 | 87.35 | −8.65 | −69.98 | 14.27 | −0.21 | −0.14 | 22.14 | |||
| N8 | 23.57 | 95.60 | 0.94 | 9.35 | 1.59 | 90.62 | −8.66 | −70.10 | 2.29 | 5.06 | −0.09 | −0.06 | 5.03 | 7.84 | |
| N11 | 25.32 | 89.89 | 0.74 | 6.55 | 0.46 | 86.14 | −8.73 | −68.97 | 0.50 | 0.91 | −0.02 | −0.01 | 2.63 | 2.99 | |
| N14 | 22.68 | 90.83 | 1.03 | 10.21 | 0.41 | 92.20 | −8.53 | −71.67 | 1.30 | 4.30 | 0.06 | −0.01 | 3.35 | 6.62 | |
| N15 | 29.83 | 98.90 | 0.35 | 2.25 | 0.18 | 62.62 | −9.09 | −63.82 | 0.66 | 0.86 | 0.10 | 0.08 | 2.37 | 2.74 | |
| N18 | 26.49 | 92.18 | 0.72 | 6.62 | 0.60 | 85.09 | −8.85 | −67.44 | −0.04 | 0.07 | −0.11 | −0.11 | 2.23 | 2.33 | |
| S3 | N7 | 24.58 | 93.33 | 0.61 | 4.66 | 0.19 | 82.83 | −8.69 | −69.48 | 3.47 | 6.22 | −0.15 | −0.10 | 6.79 | 9.56 |
| N10 | 26.47 | 88.78 | 0.50 | 3.62 | 0.58 | 76.76 | −8.84 | −67.33 | 0.47 | 0.64 | −0.16 | −0.13 | 2.99 | 3.07 | |
| N13 | 26.43 | 89.50 | 0.22 | 0.93 | 0.02 | 61.68 | −8.77 | −67.63 | 1.91 | 1.17 | −0.19 | −0.06 | 5.01 | 3.47 | |
| N17 | 25.15 | 97.25 | 0.87 | 8.50 | 0.26 | 88.98 | −8.74 | −69.05 | 0.47 | 0.71 | −0.28 | −0.27 | 3.55 | 3.74 | |
| N19 | 30.48 | 90.27 | 0.31 | 1.96 | 0.04 | 60.52 | −9.11 | −63.20 | 1.64 | 2.67 | −0.14 | −0.18 | 4.16 | 5.95 | |
| N22 | 26.04 | 91.60 | 1.17 | 14.17 | 0.28 | 93.48 | −8.82 | −68.02 | −0.17 | −0.08 | 0.19 | 0.17 | 1.57 | 1.63 | |
| S4 | N3 | 22.14 | 96.60 | 0.37 | 1.95 | 0.06 | 73.25 | −8.47 | −72.06 | 3.26 | 5.93 | −0.08 | −0.06 | 6.29 | 8.77 |
| N4 | 24.17 | 83.89 | 0.37 | 2.08 | 0.15 | 69.98 | −8.61 | −69.71 | 15.29 | 36.43 | −0.22 | −0.15 | 23.95 | 47.94 | |
| N9 | 25.09 | 94.07 | 0.66 | 5.38 | 0.70 | 84.14 | −8.73 | −68.98 | 2.02 | 5.78 | −0.03 | −0.06 | 4.35 | 8.66 | |
| N12 | 24.15 | 97.75 | 1.01 | 10.35 | 0.21 | 91.54 | −8.66 | −70.12 | 0.19 | 0.51 | 0.08 | 0.08 | 2.12 | 2.33 | |
| N21 | 27.70 | 84.50 | 0.45 | 3.20 | 0.06 | 74.77 | −8.91 | −66.27 | 1.01 | 1.91 | 0.00 | −0.03 | 3.05 | 4.16 | |
| N23 | 21.71 | 95.94 | 0.43 | 2.51 | 0.38 | 76.43 | −8.39 | −73.20 | 0.25 | 0.76 | −0.03 | −0.05 | 2.49 | 2.91 | |
Publisher’s Note: MDPI stays neutral with regard to jurisdictional claims in published maps and institutional affiliations. |
© 2021 by the authors. Licensee MDPI, Basel, Switzerland. This article is an open access article distributed under the terms and conditions of the Creative Commons Attribution (CC BY) license (http://creativecommons.org/licenses/by/4.0/).
Share and Cite
MDPI and ACS Style
Li, X.; Tang, C.; Cui, J. Intra-Event Isotopic Changes in Water Vapor and Precipitation in South China. Water 2021, 13, 940. https://doi.org/10.3390/w13070940
AMA Style
Li X, Tang C, Cui J. Intra-Event Isotopic Changes in Water Vapor and Precipitation in South China. Water. 2021; 13(7):940. https://doi.org/10.3390/w13070940
Chicago/Turabian StyleLi, Xingxian, Changyuan Tang, and Jingsi Cui. 2021. "Intra-Event Isotopic Changes in Water Vapor and Precipitation in South China" Water 13, no. 7: 940. https://doi.org/10.3390/w13070940
Note that from the first issue of 2016, this journal uses article numbers instead of page numbers. See further details here.