
Assessing the Effectiveness of Nourishment in Decadal Barrier Island Morphological Resilience
by
 , , and
Davina L. Passeri
1,*, 
Matthew V. Bilskie
2,
Scott C. Hagen
3,
Rangley C. Mickey
1,
P. Soupy Dalyander
4 and
and
Victor M. Gonzalez
5 1
St. Petersburg Coastal and Marine Science Center, U.S. Geological Survey, St. Petersburg, FL 33701, USA
2
School of Environmental, Civil, Agricultural and Mechanical Engineering, University of Georgia, Athens, GA 30602, USA
3
Department of Civil and Environmental Engineering, Louisiana State University, Baton Rouge, LA 70803, USA
4
The Water Institute of the Gulf, Baton Rouge, LA 70802, USA
5
U.S. Army Engineer Research and Development Center, Vicksburg, MS 39180, USA
*
Author to whom correspondence should be addressed.
Water 2021, 13(7), 944; https://doi.org/10.3390/w13070944
Submission received: 27 January 2021
/
Revised: 24 March 2021
/
Accepted: 28 March 2021
/
Published: 30 March 2021
(This article belongs to the Special Issue Advances in the Study of Coastal Resilience, Hydrodynamic Modelling and Coastal Monitoring)
Abstract
:Nourishment has shown to be an effective method for short-term storm protection along barrier islands and sandy beaches by reducing flooding, wave attack and erosion. However, the ability of nourishment to mitigate the effects of storms and sea level rise (SLR) and improve coastal resilience over decadal time scales is not well understood. This study uses integrated models of storm-driven hydrodynamics, morphodynamics and post-storm dune recovery to assess the effectiveness of beach and dune nourishment on barrier island morphological resilience over a 30-year period, accounting for storms and a moderate amount of SLR. Results show that at the end of the 30 years, nourishment contributes to maintaining island volumes by increasing barrier height and width compared with a no-action scenario (i.e., no nourishment, only natural recovery). During storms where the collision regime was dominant, higher volumes of sand were lost from the wider beach in the nourishment scenario than in the no-action scenario. During stronger storms, nourishment reduced dune overtopping compared with the no-action scenario, allowing the island to maintain height and width. Additionally, nourishment was particularly effective in reducing breaching during back-to-back storms occurring in the same year.
1. Introduction
Coastal resiliency is defined as the capacity of coastal environments to cope with natural- and human-induced disturbances by adapting while maintaining essential function [1]. Barrier island processes, including sediment transport during periods of storms and post-storm recovery, can enhance landform resiliency to drivers such as storms and sea level rise (SLR). During storms as water levels approach and exceed dunes, sand is transported either through collision (erosion of the dune face with sand deposited offshore) or overwash (overtopping of the dune crest with sand transported landward and deposited on the backbarrier) [2]. If water levels on both sides of the island exceed the dune crest, breaching may occur [3]. Over decadal timescales, barrier islands depend on the accumulation of overwash deposition during individual storm events to migrate landward (rollover) or seaward in response to changes in sea level. Although storms may overwash and destroy dune systems, over time, dunes can maintain volume through due to natural recovery processes [4]. If a barrier island is unable to keep pace, it may drown by flattening if the island is unable to maintain the subaerial height, narrowing if the island undergoes rapid shoreline retreat [5,6,7] or deflating (a combination of narrowing and flattening) [8].
On developed barrier islands, shore protection strategies such as beach nourishment are used to reduce flooding, wave attack and erosion during storm events; however, the effects and/or benefits from beach nourishment are often considered temporary, thus requiring periodic maintenance or renourishment [9]. In the future, SLR has the potential to exacerbate beach and dune erosion, particularly along low-lying coastlines [10,11]. Previous studies have shown that beach nourishment may offset shoreline erosion under increased sea levels [12], aid in disaster prevention [13] and reduce land loss and associated costs due to SLR [14]. Houston [12] assessed the potential for beach nourishment to reduce shoreline erosion under SLR using projections of future shoreline change based on an empirical model and concluded that nourishment at historic rates can offset recessional effects for most SLR projections to the year 2100. Smallegan et al. [15] used a process-based morphodynamic model to show that beach and dune nourishment can reduce volumetric barrier island erosion during a storm event, particularly under moderate rates of SLR. While these studies provide insight into the potential for nourishment to mitigate the effects of future storms and elevated water levels due to SLR, the ability of nourishment to mitigate the long-term effects of multiple storms and rising sea levels in the context of morphological resilience remains unknown. This study aims to assess the effectiveness of beach and dune nourishment on barrier island morphological resilience over a 30-year period using high-resolution process-based modeling.
2. Materials and Methods
2.1. Study Area
Dauphin Island is a 25 km long, low-lying barrier island located offshore of the Alabama coast between the Gulf of Mexico and Mississippi Sound (Figure 1). The island has been severely impacted by extreme storm events including Hurricane Ivan (2004) which caused extensive overwash and Hurricane Katrina (2005) which breached the middle of the island. Following the Deepwater Horizon oil spill in 2010, a rubble mound structure was constructed to close the Katrina Cut. East of Katrina Cut, the island is developed with homes and infrastructure, including 2400 property owners and 1400 permanent residents [16]. This part of the island has dunes on the order of 3 m and has undergone frequent nourishment after storm events including bulldozers returning overwashed sand on the road to the beach and dune system as well as larger-scale activities such as sand placement and berm construction. West of Katrina Cut, the island is undeveloped and lower in elevation with dune heights generally less than 1.5 m; historically, nourishment activities have not occurred there. Due to its low elevation, future hazards such as SLR and storms may increase inundation, overwash and loss of land on the island [17,18,19].
2.2. Model Descriptions
An integrated modeling approach using three models was used to simulate barrier island evolution over decadal time scales accounting for storm-driven morphologic change and post-storm dune recovery. An ADCIRC+SWAN model [20,21] was used to simulate water surface elevations, depth-integrated velocities and wave radiation stresses during tropical cyclones forced with wind and pressure fields from URS/Dewberry [22]. The 5.5 million node NGOM3 ADCIRC+SWAN model mesh [23] spans the western North Atlantic tidal domain with high resolution (down to 15 m) along Mississippi, Alabama and the Florida Panhandle. The model was previously validated for multiple historic hurricanes and has been used to establish a physics-based modeling framework to simulate hurricane storm surge under future SLR scenarios [19,23,24].
Output from the ADCIRC+SWAN model simulations was used to force a two-dimensional XBeach model to simulate storm-driven morphologic change at Dauphin Island. XBeach solves the nonlinear shallow water equations and incorporates time-varying wave action balance and roller energy balance [25], as well as sediment transport using a depth-averaged advection-diffusion equation [26]. The localized XBeach grid has constant alongshore resolution of 25 m and varying cross-shore resolution down to 3 m on the subaerial island. The model was previously validated for hurricanes Ivan and Katrina [27] and has been used to assess the combined effects of storms and SLR [17]. Initial model elevations were set to represent present day (circa 2018) conditions using the most recently available lidar and bathymetry data (Figure 1). These conditions represent a recovered island unaffected by any recent storms.
To account for post-storm dune recovery on Dauphin Island, a previously developed empirical dune growth (EDGR) model was applied. EDGR uses the parameterized island Gaussian fit method to model cross-shore profiles of the island as a sum of Gaussian function curves that represent the subaerial island platform, dunes and berms [28,29]. EDGR then evolves the foredune of each profile based on empirical growth curves parameterized with information on the terminal dune height and dune location. Dune growth rates were calculated based on the Houser et al. [30] sigmoid growth curves using lidar datasets from 2004 to 2015. The model was validated through comparison of observed and modeled post-Hurricane Katrina dune growth. Further information on EDGR development and validation can be found in Dalyander et al. [29].
2.3. Future Climatology
The forcing used for this study was based on comprehensive coastal storm modeling that was completed for coastal Alabama under Federal Emergency Management Agency (FEMA) Region IV Risk Mapping, Analysis and Planning study and Digital Flood Insurance Rate Map update for the Florida Panhandle and Alabama coasts. The modeling included waves and water levels for 295 synthetic tropical storms making landfall in the region that were derived using JPM-OS [22]. Future storm occurrence was derived using a Monte Carlo storm sampling method in which the synthetic storm suite was sampled for a 30-year simulation period [31]. The occurrence of tropical cyclones within the north Atlantic basin can be described as a Poisson distribution. The Poisson distribution can be used to compute the number of times an event occurs in an interval of time based on the expected value λ of X, where X is a random variable representing the number of tropical cyclones in the time interval. The probability of observing x tropical cyclones in an interval of time is given by:
The Poisson distribution was used to determine the number of storms in a given year within the Monte Carlo sampling based on the annual storm recurrence rate at the study site as the expected value of the distribution. A 30-year sample of yearly storm occurrences was obtained that also retained the storm recurrence rate for the full simulation period. Synthetic tropical cyclones with landfall locations within 200 km of Dauphin Island were randomly sampled using their probability masses as sampling weights to assign specific storms to the sampled storm occurrences. This resulted in a single 30-year life cycle or realization that was selected to represent a plausible storm climatology for the study area (Figure 1). In addition to storms, a moderate amount of SLR for 30-years was accounted for using the Sweet et al. [32] intermediate sea level projection adjusted for 2020 as the starting year. The total amount of SLR was 0.24 m by 2050; this represents a reasonable amount of SLR over a 30-year period. Table 1 shows the year-by-year storm occurrence and increase in sea level from Year 0 to Year 30.
2.4. Model Integration and Scenarios
The ADCIRC+SWAN, XBeach and EDGR models were operated sequentially over the 30-year simulation period. In years with storms, ADCIRC+SWAN was used to simulate water levels and waves for each synthetic storm, accounting for the amount of SLR at that given year. Hourly water levels were output at the locations of the four corners of the XBeach grid and significant wave height, peak wave period and mean wave direction were output at the middle of the seaward XBeach grid boundary, following the setup of [27]. The wave data was used to generate a time-series of JONSWAP spectra that was applied uniformly along the offshore boundary of the XBeach model. XBeach then simulated storm-induced morphologic change. The post-storm elevations were passed to EDGR, which predicted dune recovery for the years without storms. At the time of the next storm, the subaerial elevations from EDGR and subaqueous elevations from XBeach were passed back to ADCIRC+SWAN to update the morphology and simulate the next storm; this accounts for the dynamic interactions between storm surge, waves and morphology. This process was continued through the 30-year simulation period.
Two scenarios were considered: (1) no-action, meaning that it was assumed no human intervention would take place and the island would recover naturally and (2) nourishment east of Katrina Cut (see nourishment area defined in Figure 1) would occur in Year 0 and at the end of each year with storms. In the no-action scenario, the dunes and beach recover naturally after storms according to the growth parameterized by the EDGR model. For the nourishment scenario, we assumed that either small-scale (e.g., bulldozers) or large-scale (e.g., onshore sand placement) beach and dune nourishment would occur to return island elevations to a recovered state (i.e., the Year 0 elevations). In this scenario at Year 0 and at the end of years with storms, model elevations from the dune crest to the shoreline (0 m contour) in the nourishment area were reset to the Year 0 elevations + 0.24 m to represent beach and dune nourishment; the additional 0.24 m elevation (equivalent to 58,332 m3 of sand over a 4 km stretch of beach) is meant to account for the 30-year (2050) projection of SLR. Outside of the nourishment area, the dunes recover naturally according to the EDGR model. The nourishment scenario meant to represent an idealized case to assess the maximum potential of nourishment to mitigate future coastal hazards; in reality, nourishment may not be feasible following every storm due to constraints such as cost. Additionally, we assume that a 30-year SLR will be accounted for in the nourishment design to help the barrier island keep pace with SLR. Model inputs and outputs in the form of bed level elevations for the nourishment and no-action scenarios can be accessed in Passeri et al. [33].
3. Results
3.1. Cumulative Effects over 30 Years
The cumulative effects of beach nourishment were assessed over the 30-year period to determine how beach nourishment can influence barrier island resiliency over long time scales. The modeled final (Year 30) bed level elevations are shown in Figure 2 and the calculated subaerial island volume (defined as the volume above the 0 m contour) at the end of each year for the entire island, as well as east and west of Katrina Cut is shown in Figure 3. At the end of the 30 years, the island breached east of Katrina Cut in both scenarios, with a wider breach in the no-action scenario. In the no-action scenario, there was more overwash deposition on the backbarrier, resulting in a further landward shoreline position (rollover) than in the nourishment scenario. In both scenarios, the overall island was unable to keep pace and lost 14% and 9% of subaerial volume in the no-action scenario and nourishment scenarios, respectively. In the nourishment area east of Katrina Cut, there was a 14% gain in subaerial island volume at the end of the 30 years in the nourishment scenario compared to a 20% loss in volume in the no-action scenario. West of Katrina Cut, the island was unable to keep pace in either scenario and lost 39% of subaerial volume in the nourishment scenario and a 40% in the no-action scenario. Further analysis is focused only on the “nourishment area” east of Katrina Cut.
To assess how nourishment can alter long-term barrier island response, the change in the island height and island width over the 30 years was calculated at cross-shore transects spaced every 25 m along the model grid in the nourishment area east of Katrina Cut (Table 2). The change in the average island width and average island height was 1% and −30% for the no-action scenario, respectively and 15% and 0% for the nourishment scenario, respectively. These results indicate that nourishment not only helped to maintain island heights, but also increased the overall island width as a result of overwash deposition on the backbarrier in conjunction with sand placed on the Gulf shoreline to maintain beach widths. This gain in width contributed more to the overall increase in subaerial volume than the change in height. In the no-action scenario, the island showed rollover or landward migration, although it was unable to maintain height. Using the change in island height and island width, each transect was classified either as aggradation (gaining height and width), narrowing (losing width but maintaining/gaining height), flattening (losing height but maintaining/gaining width), deflating (losing height and width) or keeping pace (maintaining height and width) (Table 2). The dominant responses in the no-action scenario were flattening (65% of transects) and deflating (26% of transects), which resulted from overwash and/or collision during storm events. In the nourishment scenario, the number of transects that experienced flattening and deflation was reduced to 0% and 0%, respectively as a result of higher dune heights and wider beaches reducing overtopping during storms. Additionally, the dominant behavior with nourishment was aggradation (91%) due to increased barrier island widths from a combination of overwash deposition on the backbarrier and sand placement on the beach, as well as maintained dune heights.
3.2. Effects of Individual Storms
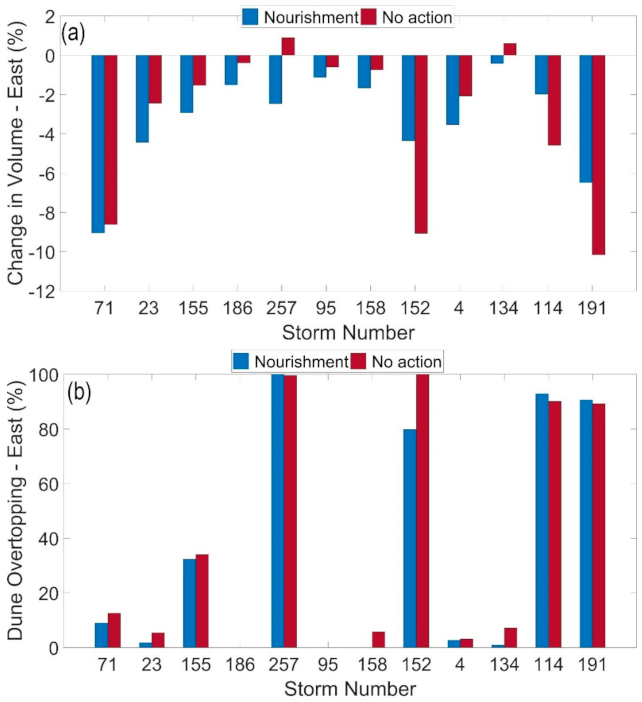
While the cumulative effects over the 30-year period illustrate how nourishment can aid in long-term barrier island resilience, the effects of nourishment on individual storms can provide additional insight into short-term storm protection. Figure 4 shows the percent change in post-storm subaerial island volume as well as the percent of dunes overtopped during each storm for the area east of Katrina Cut. For storms with limited dune overtopping (storms 71, 23, 155, 186, 95, 158, 4, 134), higher volumes of sand were eroded in the nourishment scenario than in the no-action scenario. The wider nourished beach allowed more sand to be eroded from the beach and deposited offshore during the collision regime. In storms with widespread dune overtopping (greater than 50%; storms 257, 152, 114, 191), the change in subaerial volume either increased or decreased in the nourishment scenario compared to the no-action scenario. For example, in Storm 257 there was a net loss of sand in the nourishment scenario and a net increase in sand in the no-action scenario; in storms 152, 114 and 191 there were larger volumes of sand lost in the no-action scenarios. To better understand these impacts, storms 257, 152, 114 and 191 are further assessed individually.
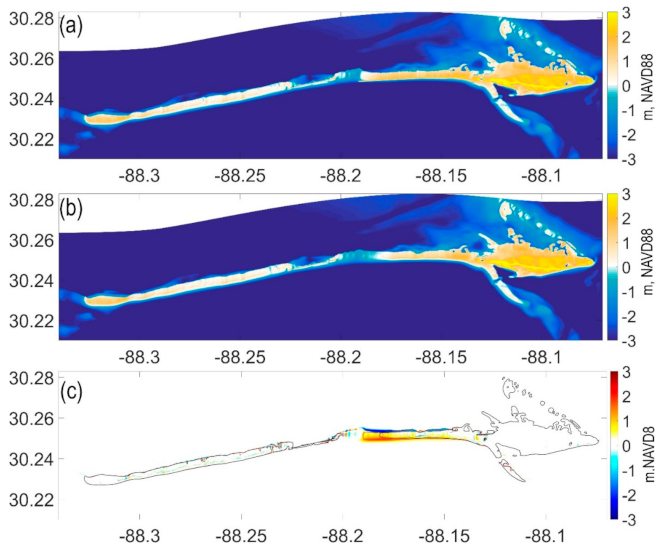
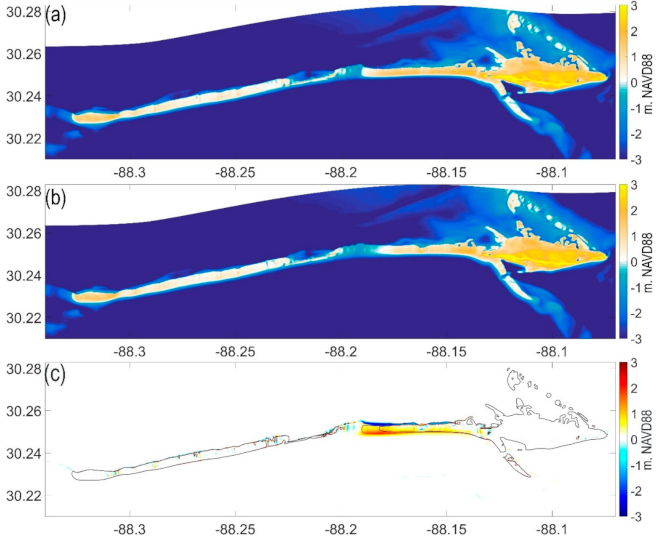
Storm 257 makes landfall directly on Dauphin Island. Comparison of post-storm model elevations (Figure 5) shows that post-storm dune heights are higher in the nourishment scenario (average of 1.88 m in the nourishment scenario versus 1.76 m in the no-action scenario). The pre- and post-storm elevations for both scenarios indicate there was overwash deposition on the backbarrier shoreline in the area between Katrina Cut and the nourishment area in both scenarios. In the no-action scenario, the overwash deposition extended further east into the nourishment area than in the nourishment scenario due to lower dunes; this “rollover” slightly increased the post-storm island volume (0.89% gain). On the other hand, in the nourishment scenario, there was a 2.4% loss in volume as a result of less overwash deposition on the backbarrier and sand being lost to subaqueous areas. This illustrates the complex and dynamic interactions between water levels and bed levels during storms.
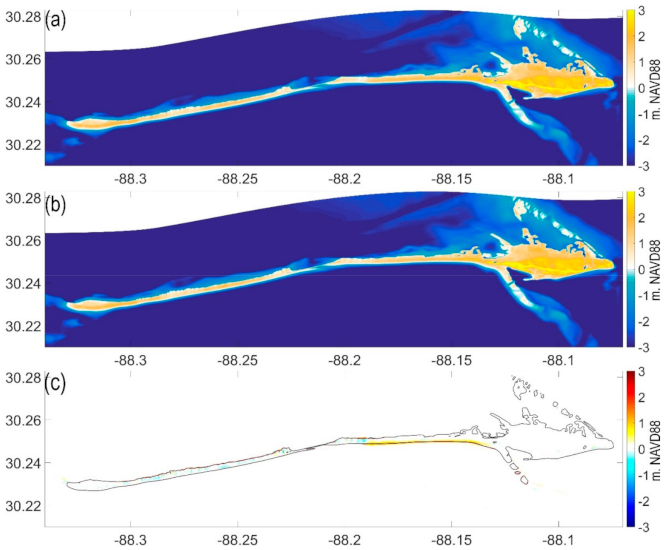
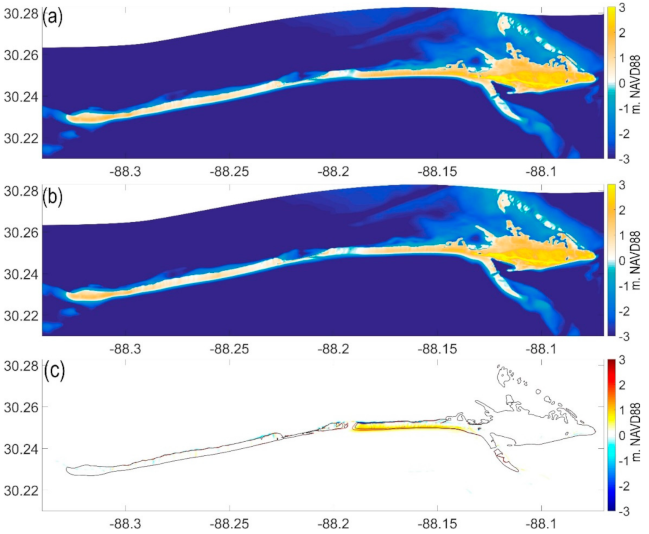
Storm 158 and Storm 152 occur back-to-back in the same year with Storm 158 making landfall 16 km east of Dauphin Island and Storm 152 making landfall 24 km west of Dauphin Island. During Storm 158, no dunes were overtopped in the nourishment scenario and 6% were overtopped in the no-action scenario. The average post-storm dune heights east of Katrina Cut were 2.05 and 2.59 m for the no-action and nourishment scenarios, respectively. During Storm 152, 100% and 80% of the dunes were overtopped in the no-action and nourishment scenarios, respectively. There were breaches east of Katrina Cut in both scenarios; however, the breach in the no-action scenario was wider by ~160 m (Figure 6), resulting in a higher volume loss than in the nourishment scenario (9% vs 4.3%). Similarly, Storm 114 and Storm 191 occur back-to-back with Storm 114 making landfall 55 km west of Dauphin Island and Storm 191 making landfall 175 km southwest of Dauphin Island. Both storms resulted in widespread overtopping east of Katrina Cut (>89% of dunes). Although the island was breached before Storm 191 in both scenarios, the breach in the no-action scenario widened during the storm, resulting in a higher volume of sand lost in the no-action scenario (10.1% vs 6.4%) and a breach ~800 m wider (Figure 7).
4. Discussion
Assessing the island response to individual storm events reveals that back-to-back storms (i.e., storms occurring in the same year) make the island more vulnerable to breaching and sand loss. Nourishment can reduce breaching, particularly during the subsequent storm due to higher pre-storm dune heights and wider beaches. Nourishment can also reduce sand volume loss for stronger storms with higher water levels that result in widespread overtopping. Weaker storms that are collision dominant cause more sand to be eroded from the beach in the nourishment scenarios as a result of a wider beach, although dunes remain intact. It is expected that similar behavior would be observed on other low-lying barrier islands.
Artificially high nourished dunes can disrupt the transport of natural overwash sediment from the front of the barrier to the back-barrier [34,35], reducing the ability of marshes to keep pace with SLR [36] and subjecting the island back-barrier platform to passive drowning and erosion [35,37]. By selecting a recovered state to represent nourishment, we assessed an appropriate dune height that was not too high to prevent overwash and resulting deposition. While the backbarrier shoreline position was located further landward in the no-action scenario as a result of increased overwash deposition, the average change in island width was greater in the nourishment scenario, illustrating that the island was still experiencing overwash deposition on the backbarrier but the Gulf shoreline position was maintained due to nourishment. The additional sand availability from nourishment did not result in increased overwash deposition as compared to the no-action scenario; this may differ if only beach nourishment was considered to widen the beach rather than a combination of beach and dune nourishment.
The dominance of deflation across transects indicates that a combination of beach and dune nourishment is necessary to maintain island heights and widths, rather than just beach nourishment or dune nourishment for this island. In terms of a long-term strategy for barrier island resilience, the island was more susceptible to flattening and deflation in the no-action scenario than in the nourishment scenario. Flattening can lead to height drowning whereas deflation can increase vulnerability to breaching during storm events [8]. The effects of deflation are apparent in storms 114 and 191, where breaching was more widespread in the no-action scenario than the nourishment scenario.
Although alongshore transport was accounted for during storm events, for simplicity, the integrated models did not simulate alongshore transport during non-storm periods, which can drive sediment transport and deposition to adjacent shorelines. Inclusion of alongshore sediment transport may have resulted in changes in sand volume lost/gained during storm events and overwash sand distribution, particularly westward of the nourished area (tide and fair-weather wind-driven currents move east to west along the Gulf shoreline of the island). While this study indicates that beach and dune nourishment can be a viable option for maintaining barrier island geometry and volume over long-time scales, we only considered resilience in the context of morphological impacts and considered ideal nourishment volumes and schedules. Due to complexities such as sediment availability from borrow areas, construction costs and environmental impacts, beach nourishment may not be a sustainable long-term strategy to protect developed coastlines at risk to the effects of climate change and may be better suited as a near-term strategy to address existing vulnerabilities [38]. For example, over the 30-year simulation period, a total of 1,231,107 m3 of sand was required to nourish the beach and dunes; this equates to a total cost of $34 million based on 2016 nourishment costs at Dauphin Island [39]. Hybrid approaches for shoreline and dune stabilization may be a reasonable alternative to traditional nourishment (e.g., Nordstrom [39], Bridges et al. [40], Smallegan et al. [15]). Our results further support beach nourishment as a strategy to mitigate storm-driven erosion, particularly during back-to-back storm events. This is especially pertinent given the 2020 Atlantic hurricane season during which five tropical cyclones (two tropical storms and three hurricanes) made landfall in Louisiana.
5. Conclusions
Integrated models of storm-driven hydrodynamics, morphodynamics and post-storm dune recovery were used to assess the effectiveness of beach and dune nourishment on long-term (decadal) barrier island morphological resilience. Results showed that over a 30-year simulation period, the idealized nourishment scenario helped to maintain island volumes by increasing barrier height and width compared with the no-action scenario. During storms when the collision regime was dominant, higher volumes of sand were lost from the wider beach in the nourishment scenario than in the no-action scenario. During stronger storms, nourishment reduced dune overtopping, allowing the island to maintain height and width, whereas the no-action scenario resulted in island rollover but decreased island height. Nourishment was particularly effective in reducing erosion and breaching during back-to-back storms occurring in the same year. Results of this study provide insight to how beach and dune nourishment can improve morphological resilience by maintaining barrier island geometry and volume over decadal timescales. Future efforts assessing the dynamic effects of SLR and the ability of nourishment to improve barrier island resiliency can benefit from these insights.
Author Contributions
Conceptualization, D.L.P., M.V.B. and S.C.H.; methodology, D.L.P., M.V.B., S.C.H.; R.C.M., P.S.D. and V.M.G.; software, D.L.P., M.V.B., R.C.M. and P.S.D.; validation, D.L.P., M.V.B.; formal analysis, D.L.P. and M.V.B.; investigation, D.L.P., M.V.B., S.C.H.; resources, D.L.P., M.V.B. and S.C.H.; data curation, D.L.P.; writing—original draft preparation, D.L.P.; writing—review and editing, M.V.B., S.C.H., R.C.M., P.S.D. and V.M.G.; visualization, D.L.P.; supervision, D.L.P.; project administration, D.L.P.; funding acquisition, D.L.P. and S.C.H. All authors have read and agreed to the published version of the manuscript.
Funding
This work was funded by project NA16NOS4780208 of the National Oceanic & Atmospheric Administration Ecological Effects of Sea Level Rise Program, the Louisiana Sea Grant Laborde Chair and the USGS Coastal and Marine Hazards and Resources Program. Any use of trade, firm, or product names is for descriptive purposes only and does not imply endorsement by the U.S. Government.
Data Availability Statement
Model inputs and outputs in the form of bed level elevations for the nourishment and no-action scenarios can be accessed in Passeri et al. [33].
Acknowledgments
The authors would like to thank Legna Torres-Garcia and the anonymous reviewers for providing input on this work.
Conflicts of Interest
The authors declare no conflict of interest.
References
- Masselink, G.; Lazarus, E.D. Defining Coastal Resilience. Water 2019, 11, 2587. [Google Scholar] [CrossRef] [Green Version]
- Sallenger, A.H.J. Storm impact scale for barrier islands. J. Coast. Res. 2000, 16, 890–895. [Google Scholar]
- Long, J.W.; de Bakker, A.T.M.; Plant, N.G. Scaling coastal dune elevation changes across storm-impact regimes. Geophys. Res. Lett. 2014, 41, 1–8. [Google Scholar] [CrossRef] [Green Version]
- Johnson, C.L.; Chen, Q.; Ozdemir, C. Lidar time-series analysis of a rapidly transgressing low-lying mainland barrier (Caminada Headlands, Louisiana, USA). Geomorphology 2020, 352. [Google Scholar] [CrossRef]
- Lorenzo-Trueba, J.; Ashton, A.D. Rollover, drowning and discontinuous retreat: Distinct modes of barrier response to sea-level rise arising from a simple morphodynamic model. J. Geophys. Res. Earth Surf. 2014, 119, 779–801. [Google Scholar] [CrossRef] [Green Version]
- Miselis, J.L.; Lorenzo-Trueba, J. Natural and Human-Induced Variability in Barrier-Island Response to Sea Level Rise. Geophys. Res. Lett. 2017, 44, 11922–11931. [Google Scholar] [CrossRef] [Green Version]
- Ciarletta, D.J.; Lorenzo-Trueba, J.; Ashton, A.D. Mechanism for reatreating barriers to autogenically form periodic deposits on continental shelves. Geology 2019, 47, 239–242. [Google Scholar] [CrossRef]
- Passeri, D.L.; Dalyander, P.S.; Long, J.W.; Mickey, R.C.; Jenkins, R.L., III; Thompson, D.M.; Plant, N.G.; Godsey, E.S.; Gonzalez, V.M. The roles of storminess and sea level rise in decadal barrier island evolution. Geophys. Res. Lett. 2020, 47. [Google Scholar] [CrossRef]
- Cunniff, S.; Schwartz, A. Performance of Natural Infrastructure and Nature-Based Measures as Coastal Risk Reduction Features; Environmental Defense Fund: New York, NY, USA, 2015. [Google Scholar]
- Gutierrez, B.T.; Plant, N.G.; Thieler, E.R. A Bayesian network to predict coastal vulnerability to sea level rise. J. Geophys. Res. 2011, 116. [Google Scholar] [CrossRef] [Green Version]
- Plant, N.G.; Thieler, E.R.; Passeri, D.L. Coupling centennial-scale shoreline change to sea-level rise and coastal morphology in the Gulf of Mexico using a Bayesian network. Earth’s Future 2016, 4, 143–158. [Google Scholar] [CrossRef] [Green Version]
- Houston, J.R. Shoreline change in response to sea-level rise on Florida’s West Coast. J. Coast. Res. 2017, 33, 1243–1260. [Google Scholar] [CrossRef] [Green Version]
- Yoshida, J.; Udo, K.; Takeda, Y.; Mano, A. Framework for proper beach nourishment as an adaptation to beach erosion due to sea level rise. J. Coast. Res. 2014, 267–472. [Google Scholar] [CrossRef]
- Hinkel, J.; Nicholls, R.J.; Tol, R.S.J.; Wang, Z.B.; Hamilton, J.M.; Boot, G.; Vafeidis, A.T.; McFadden, L.; Ganopolski, A.; Klein, R.J.T. A global analysis of erosion of sandy beaches and sea-level rise: An application of DIVA. Glob. Planet. Chang. 2013, 111, 150–158. [Google Scholar] [CrossRef]
- Smallegan, S.M.; Irish, J.L.; van Dongeren, A.R. Developed barrier island adaptation strategies to hurricane forcing under rising sea levels. Clim. Chang. 2017, 143, 173–184. [Google Scholar] [CrossRef]
- Five E’s Unlimited. Dauphin Island Strategic Plan—20 Year Vision: Final Report and Implementation Recommendations; Mississippi-Alabama Sea Grant Consortium Number: MASGP07-023. Seattle, WA, USA, 2007; p. 58. Available online: http://www.eeeee.net/dauphin_island/di_final_report10-07.pdf (accessed on 30 March 2021).
- Passeri, D.L.; Bilskie, M.V.; Plant, N.G.; Long, J.W.; Hagen, S.C. Dynamic modeling of barrier island response to hurricane storm surge under future sea level rise. Clim. Chang. 2018, 149, 413–425. [Google Scholar] [CrossRef]
- Passeri, D.L.; Hagen, S.C.; Plant, N.G.; Bilskie, M.V.; Medeiros, S.C.; Alizad, K. Tidal hydrodynamics under future sea level rise and coastal morphology in the Northern Gulf of Mexico. Earth’s Future 2016, 4, 159–176. [Google Scholar] [CrossRef] [Green Version]
- Bilskie, M.V.; Hagen, S.C.; Alizad, K.; Medeiros, S.C.; Passeri, D.L.; Needham, H.; Cox, A. Dynamic simulation and numerical analysis of hurricane storm surge under sea level rise with geomorphologic changes along the northern Gulf of Mexico. Earth’s Future 2016, 4, 177–193. [Google Scholar] [CrossRef] [Green Version]
- Dietrich, J.C.; Zijlema, M.; Westerink, J.J.; Holthuijsen, L.H.; Dawson, C.N.; Luettich, R.A.; Jensen, R.E.; Smith, J.M.; Stelling, G.S.; Stone, G.W. Modeling hurricane waves and storm surge using integrally-coupled, scalable computations. Coast. Eng. 2011, 58, 45–65. [Google Scholar] [CrossRef]
- Luettich, R.A.; Westerink, J.J.; Scheffner, N.W. ADCIRC: An. Advanced Three-Dimensional Circulation Model. For. Shelves, Coasts, and Estuaries, I: Theory and Methodology of ADCIRC-2DDI and ADCIRC-3DL; U.S. Army Corps of Engineers: Washington, DC, USA, 1992. [Google Scholar]
- URS/Dewberry. Joint Probability Analysis of Hurricane Flood Hazards for Gulf, Bay, Walton, Okaloosa, Santa Rosa, and Escambia Counties Florida, and Baldwin and Mobile Counties, Alabama; Federal Emergency Management Agency (FEMA) Map Modernization Program for the Northwest Florida Water Management District; URS/Dewberry: Boulder, CO, USA, 2012. [Google Scholar]
- Bilskie, M.V.; Hagen, S.C.; Medeiros, S.C.; Cox, A.T.; Salisbury, M.; Coggin, D. Data and numerical analysis of astronomic tides, wind-waves, and hurricane storm surge along the northern Gulf of Mexico. J. Geophys. Res. Ocean. 2016, 121, 3625–3658. [Google Scholar] [CrossRef]
- Bilskie, M.V.; Hagen, S.C.; Irish, J.L. Development of return period stillwater floodplains for the northern Gulf of Mexico under the coastal dynamics of sea level rise. J. Waterw. Port. Coast. Ocean. Eng. 2019, 145, 04019001. [Google Scholar] [CrossRef]
- Roelvink, J.A.; Reniers, A.; van Dongeren, A.; van Thiel de Vries, J.; McCall, R.; Lescinski, J. Modeling storm impacts on beaches, dunes and barrier islands. Coast. Eng. 2009, 56, 1133–1152. [Google Scholar] [CrossRef]
- Galappatti, G.; Vreugdenhil, C.B. A depth-integrated model for suspended sediment transport. J. Hydraul. Res. 1985, 23, 359–377. [Google Scholar] [CrossRef]
- Passeri, D.L.; Long, J.W.; Plant, N.G.; Bilskie, M.V.; Hagen, S.C. The influence of bed friction variability due to land cover on storm-driven barrier island morphodynamics. Coast. Eng. 2018, 132, 82–94. [Google Scholar] [CrossRef]
- Mickey, R.C.; Dalyander, P.S.; McCall, R.; Passeri, D.L. Sensitivity of storm response to antecedent topography in the XBeach model. J. Mar. Sci. Eng. 2020, 8, 829. [Google Scholar] [CrossRef]
- Dalyander, P.S.; Mickey, R.C.; Passeri, D.L.; Plant, N.G. Development of an empirical dune growth model and use in evaluating barrier island recovery from storms. J. Mar. Sci. Eng. 2020, 8, 977. [Google Scholar] [CrossRef]
- Houser, C.; Wernette, P.; Rentschlar, E.; Jones, H.; Hammond, B.; Trimble, S. Post-storm beach and dune recovery: Implications for barrier island reslience. Geomorphology 2015, 234, 54–63. [Google Scholar] [CrossRef]
- Gonzalez, V.M.; Garcia-Moreno, F.A.; Melby, J.A.; Nadal-Caraballo, N.C.; Godsey, E.S. Alabama Barrier Island Restoration Assessment Life-Cycle Structure Response Modeling; US Army Corps of Engineers Engineer Research and Development Center: Vicksburg, MS, USA, 2020; p. 79. [Google Scholar]
- Sweet, W.V.; Kopp, R.E.; Weaver, C.P.; Obeysekera, J.; Horton, R.M.; Thieler, E.R.; Zervas, C. Global and Regional Sea Level Rise Scenarios for the United States; National Oceanic and Atmospheric Administration: Silver Spring, MD, USA, 2017; p. 75. [Google Scholar]
- Passeri, D.L.; Bilskie, M.V.; Hagen, S.C.; Mickey, R.C.; Dalyander, P.S.; Gonzalez, V.M. Assessing the Effectiveness of Nourishment in Decadal Barrier Island Morphological Resilience: Model Inputs and Outputs; U.S. Geological Survey data release, 2021. [Google Scholar] [CrossRef]
- Smith, C.G.; Culver, S.J.; Riggs, S.R.; Ames, D.; Corbett, D.R.; Mallinson, D. Geospatial analysis of barrier island width of two segments of the Outer Banks, North Carolina, USA: Anthropogenic curtailment of natural self-sustaining processes. J. Coast. Res. 2008, 24, 70–83. [Google Scholar] [CrossRef]
- Magliocca, N.R.; McNamara, D.E.; Murray, A.B. Long-term, large-scale morphodynamic effects of artificial dune construction along a barrier island coastline. J. Coast. Res. 2011, 27, 918–930. [Google Scholar] [CrossRef]
- Lorenzo-Trueba, J.; Mariotti, G. Chasing boundaries and cascade effects in a coupled barrier-marsh-lagoon system. Geomorphology 2017, 290, 235–263. [Google Scholar] [CrossRef] [Green Version]
- Rogers, L.J.; Moore, L.J.; Goldstein, E.B.; Hein, C.J.; Lorenzo-Trueba, J.; Ashton, A.D. Anthropogenic controls on overwash deposition: Evidence and consequences. J. Geophys. Res. Earth Surf. 2015, 120, 2609–2624. [Google Scholar] [CrossRef] [Green Version]
- Parkinson, R.W.; Ogurcak, D.E. Beach nourishment is not a sustainable strategy to mitigate climate change. Estuar. Coast. Shelf Sci. 2018, 212, 203–209. [Google Scholar] [CrossRef] [Green Version]
- Nordstrom, K.F. Coastal dunes with resistant cores. J. Coast. Conserv. 2019, 23, 227–237. [Google Scholar] [CrossRef]
- Bridges, T.S.; Wagner, P.W.; Burks-Copes, K.A.; Bates, M.E.; Collier, Z.A.; Fischenich, C.J.; Gailani, J.Z.; Lueck, L.D.; Piercy, C.D.; Rosati, J.D.; et al. Use of Natural and Nature-Based Features (NNBF) for Coastal Resilience; U.S. Army Engineer Research and Development Center, Information Technology Laboratory: Vicksburg, MS, USA, 2015. [Google Scholar]
Figure 1.
(a) Study area with synthetic storm tracks for a 30-year realization and (b) initial (Year 0) XBeach model bed level elevations (in meters, relative to NAVD88) at Dauphin Island. Base map layer in (a) provided by ESRI.
Figure 1.
(a) Study area with synthetic storm tracks for a 30-year realization and (b) initial (Year 0) XBeach model bed level elevations (in meters, relative to NAVD88) at Dauphin Island. Base map layer in (a) provided by ESRI.

Figure 2.
Modeled bed level elevations for (a) final (Year 30) nourishment scenario, (b) final (Year 30) no-action scenario and (c) difference between final nourishment scenario and no-action. In (c), the black line is the 0 m contour for final (Year 30) no-action scenario and the red line is the 0 m contour for the final (Year 30) nourishment scenario.

Figure 3.
Subaerial island volume through the 30-year simulation across (a) the entire island and (b) east of Katrina Cut and (c) west of Katrina Cut under scenarios of nourishment and no-action.
Figure 3.
Subaerial island volume through the 30-year simulation across (a) the entire island and (b) east of Katrina Cut and (c) west of Katrina Cut under scenarios of nourishment and no-action.

Figure 4.
For each storm the (a) percent change in subaerial island volume east of Katrina Cut and (b) the percent of dunes overtopped east of Katrina Cut.
Figure 4.
For each storm the (a) percent change in subaerial island volume east of Katrina Cut and (b) the percent of dunes overtopped east of Katrina Cut.

Figure 5.
Post-storm 257 bed level elevations for the (a) nourishment scenario, (b) no-action scenario and (c) difference between nourishment and no-action scenarios. In (c), the black line is the 0 m contour for final (Year 30) no-action scenario and the red line is the 0 m contour for the final (Year 30) nourishment scenario.

Figure 6.
Post-storm 152 bed level elevations for the (a) nourishment scenario, (b) no-action scenario and (c) difference between nourishment and no-action scenarios. In (c), the black line is the 0 m contour for final (Year 30) no-action scenario and the red line is the 0 m contour for the final (Year 30) nourishment scenario.

Figure 7.
Post-storm 191 bed level elevations for the (a) nourishment scenario, (b) no action scenario and (c) difference between nourishment and no-action scenarios. In (c), the black line is the 0 m contour for final (Year 30) no-action scenario and the red line is the 0 m contour for the final (Year 30) nourishment scenario.


Table 1.
Thirty-year climatology including a moderate amount of sea level rise (SLR) and synthetic storm occurrences.
Table 1.
Thirty-year climatology including a moderate amount of sea level rise (SLR) and synthetic storm occurrences.
| Year | Sea Level Rise (m) | Storm Number |
|---|---|---|
| 0 | 0 | |
| 1 | 0.005 | 71 |
| 2 | 0.010 | 23 |
| 3 | 0.015 | |
| 4 | 0.020 | |
| 5 | 0.025 | |
| 6 | 0.030 | |
| 7 | 0.035 | |
| 8 | 0.040 | |
| 9 | 0.045 | 155 |
| 10 | 0.060 | |
| 11 | 0.069 | |
| 12 | 0.078 | |
| 13 | 0.087 | 186 |
| 14 | 0.096 | |
| 15 | 0.105 | |
| 16 | 0.114 | 257 |
| 17 | 0.123 | 95 |
| 18 | 0.132 | 158, 152 |
| 19 | 0.141 | |
| 20 | 0.150 | |
| 21 | 0.159 | |
| 22 | 0.168 | |
| 23 | 0.177 | 4 |
| 24 | 0.186 | |
| 25 | 0.195 | 134 |
| 26 | 0.204 | |
| 27 | 0.213 | 114, 191 |
| 28 | 0.222 | |
| 29 | 0.231 | |
| 30 | 0.240 |
Table 2.
Barrier island behaviors and the average change in subaerial island width and maximum island height for the nourishment and no-action scenarios east of Katrina Cut at Dauphin Island, AL.
Table 2.
Barrier island behaviors and the average change in subaerial island width and maximum island height for the nourishment and no-action scenarios east of Katrina Cut at Dauphin Island, AL.
| Scenario | Aggradation | Narrowing | Flattening | Deflating | Stable | Average Change in Width | Average Change in Height |
|---|---|---|---|---|---|---|---|
| Nourishment | 91% | 9% | 0% | 0% | 0% | 15% | 0% |
| No-action | 9% | 0% | 65% | 26% | 0% | 1% | −30% |
Publisher’s Note: MDPI stays neutral with regard to jurisdictional claims in published maps and institutional affiliations. |
© 2021 by the authors. This is an open access article, free of all copyright, and may be freely reproduced, distributed, transmitted, modified, built upon, or otherwise used by anyone for any lawful purpose. The work is made available under the Creative Commons CC0 public domain dedication.
Share and Cite
MDPI and ACS Style
Passeri, D.L.; Bilskie, M.V.; Hagen, S.C.; Mickey, R.C.; Dalyander, P.S.; Gonzalez, V.M. Assessing the Effectiveness of Nourishment in Decadal Barrier Island Morphological Resilience. Water 2021, 13, 944. https://doi.org/10.3390/w13070944
AMA Style
Passeri DL, Bilskie MV, Hagen SC, Mickey RC, Dalyander PS, Gonzalez VM. Assessing the Effectiveness of Nourishment in Decadal Barrier Island Morphological Resilience. Water. 2021; 13(7):944. https://doi.org/10.3390/w13070944
Chicago/Turabian StylePasseri, Davina L., Matthew V. Bilskie, Scott C. Hagen, Rangley C. Mickey, P. Soupy Dalyander, and Victor M. Gonzalez. 2021. "Assessing the Effectiveness of Nourishment in Decadal Barrier Island Morphological Resilience" Water 13, no. 7: 944. https://doi.org/10.3390/w13070944
Note that from the first issue of 2016, this journal uses article numbers instead of page numbers. See further details here.