
Accuracy and Reliability Analysis of Pipe Irrigation Metering Device for Sandy Water Source


1
College of Agricultural Science and Engineering, Hohai University, Nanjing 210098, China
2
State Key Laboratory of Hydrology-Water Resources and Hydraulic Engineering, Hohai University, Nanjing 210098, China
3
Collaborative Innovation Center for Water Security and Water Science, Hohai University, Nanjing 210098, China
*
Author to whom correspondence should be addressed.
Water 2021, 13(7), 947; https://doi.org/10.3390/w13070947
Submission received: 27 February 2021
/
Revised: 23 March 2021
/
Accepted: 25 March 2021
/
Published: 30 March 2021
(This article belongs to the Section Water, Agriculture and Aquaculture)
Abstract
:Sandy water sources are widely distributed and are important for agricultural development. However, no explicit result has been achieved in the research of the accuracy and reliability of pipeline metering devices as well as flow rate measurement objects (water or water–sand) of different metering devices in the process of pipelines conveying muddy water. In this study, seven kinds of sediment concentration gradients, C0–C6 (0.2–7.19%), and three different flow velocities (1.0 m/s, 1.25 m/s, 1.5 m/s) were set up, and a comparison measuring method was used to compare the flow values of three kinds of metering device (electromagnetic flowmeter, ultrasonic flowmeter and water meter) with a right triangle weir. The accuracy and reliability of the metering device were obtained by analyzing the change law of the relative error between each metering device and the right triangle weir under different flow velocities and different sediment concentrations, and the flow rate measurement objects of each metering device were finally clarified. The relative error between the electromagnetic flowmeter and right triangle weir decreased gradually with the increase in the flow velocity when the sediment concentration was constant. The maximum difference of the relative error between the electromagnetic flowmeter and the right triangle weir was 2.53% when the flow velocity was constant. Additionally, the minimum differences of the relative errors of the ultrasonic flowmeter and water meter were 2.67% and 6.90%, respectively. The measured flow law of the electromagnetic flowmeter was more in line with the measured flow law of the water–sand mixture measured by the right triangle weir. However, the relative errors of water and water–sand measured by the ultrasonic flowmeter and water meter fluctuate greatly, which does not accord with the law of muddy water measured by the right triangle weir. The results showed that the electromagnetic flowmeter has the best reliability among the three metering devices, and the accuracy can be improved by calibration before use or increasing the flow velocity of the pipe network. Under the sand grading used in this study, the electromagnetic flowmeter was recommended to measure the flow rate of pipe irrigation for sandy water sources in this paper.
1. Introduction
The Yellow River, the second longest river in China, flows through nine provinces and regions, and is the main water source for Northwest China and has an important impact on regional economic and social development [1,2]. Ningxia Province, an arid and semi-arid region located in the east of the Yellow River Basin, is the main grain-producing area in Western China with a temperate continental climate [3,4,5]. Most of the agricultural irrigation water in Ningxia is obtained from the Yellow River. However, the Yellow River is a world famous natural muddy river with the highest sand concentration among the major rivers in the world [6,7].
Irrigation with a sandy water source can significantly increase the content of soil organic matter [8,9]. Low-pressure pipelines have been widely used to transport muddy water for irrigation as a water-saving irrigation measure. However, the hydraulic performance of muddy water pipes is different from that of clean water pipes, and the entry of sediment and other solid particles into the pressure pipe has a certain influence on the flow measurement results. Irrigation with muddy water directly may produce a problem that the net amount of water used for a single irrigation may be less than what the crop actually needs. As muddy water contains sediment, if the irrigation quota is calculated according to the water without sediment, the actual net amount of irrigation water in muddy water will be less than the irrigation quota, which will lead to a lack of water and affect the growth of crops. In order to solve this problem, it is of great significance to understand the reliability, accuracy and measuring object of the pipeline metering device in the process of irrigation with sandy water sources.
Previous studies on muddy water pipeline irrigation mainly included the non-depositing critical velocity [10,11], solid–water mixture flow head losses [12] and anti-clogging technology [13]. The research on pipeline metering devices mainly includes the influence of water pressure [14], temperature [15,16], velocity distribution [16] and other factors on the metering device. Some researchers have also carried out theoretical analysis on one of the metering devices of muddy water pipelines [17,18]. However, very few studies are specifically about the comparisons of different kinds of common pipeline metering devices through experimental data.
Electromagnetic flowmeters, ultrasonic flowmeters and mechanical water meters are three commonly used pipeline metering devices. The principle of the electromagnetic flowmeter is based on Faraday’s law of electromagnetic induction [19]. The conductive liquid flows in the magnetic field and cuts the magnetic induction lines, so that the voltage signal can be sensed by electrodes located on the flow pipe walls [20] and form the output circuit of voltage and current and, finally, the speed of water can be calculated [21]. The advantages of electromagnetic flowmeters are wide measuring range, high measuring accuracy and low power consumption [22], so they are often used to measure single-phase fluid, as well as two-phase fluid gas–liquid [22,23,24], liquid–liquid [25,26], etc. There are several metering principles for ultrasonic flowmeters [27]. The transit time ultrasonic flowmeter transmits and receives ultrasonic signals from two transducers mounted on the outer wall of the pipeline, and carries out the flow velocity measurement according to the different times required for the ultrasonic wave to run the same distance in the downstream direction and the upstream direction [28,29]. An ultrasonic flowmeter has almost no requirements for the measured medium [27] and can be used for the measurement of gas [30,31,32] and liquid [33,34]. Mechanical water meters can be divided into velocity type and volume type according to the principle of measurement [15]. The essence of volumetric water meters is the volume method. There are several impellers fixed inside the water meter, and the impeller rotates when there is a constant volume of water passing through [15]. Mechanical water meters are often used in urban piped water supply systems [14].
The principles of these three metering devices (electromagnetic flowmeter, ultrasonic flowmeter and mechanical water meter) are clear. However, there are relatively few studies on the application of muddy water pipelines with sandy water sources. The effects of water–sand on the accuracy and reliability are not clear, and the definition of the flow rate measurement objects (water or water–sand) is fuzzy. Taking into account the considerations above, the relative errors of between the electromagnetic flowmeter, ultrasonic flowmeter, water meter and right triangle weir were compared by means of using a comparison measuring method, and the accuracy and reliability of different metering devices were analyzed in this paper. The objectives of this research were to find the flowmeter which is most suitable for pipeline irrigation with sandy water sources, and provide a theoretical basis for the design of an irrigation system in muddy water pipe irrigation.
The remainder of the manuscript is arranged as follows. In the next section, further details about the experimental materials and experimental methods are provided to explain the origin of the data of the relative errors between each metering device and the right triangle weir. Next, the research results are used to analyze the influence of the changes of flow velocity and sediment concentration on the accuracy and reliability of each metering device. Then, the research results of this paper are discussed in combination with previous research results. Finally, the main conclusions of the study are presented, and the shortcomings of this paper and future work are proposed.
2. Materials and Methods
2.1. Experimental Materials
The sand used in the experiment was taken from the Yellow River irrigation area of Ningxia. The dry density of the sand is 1.586 g/cm3, and the median particle size is 0.146 mm. The particle size distribution is shown in Table 1.
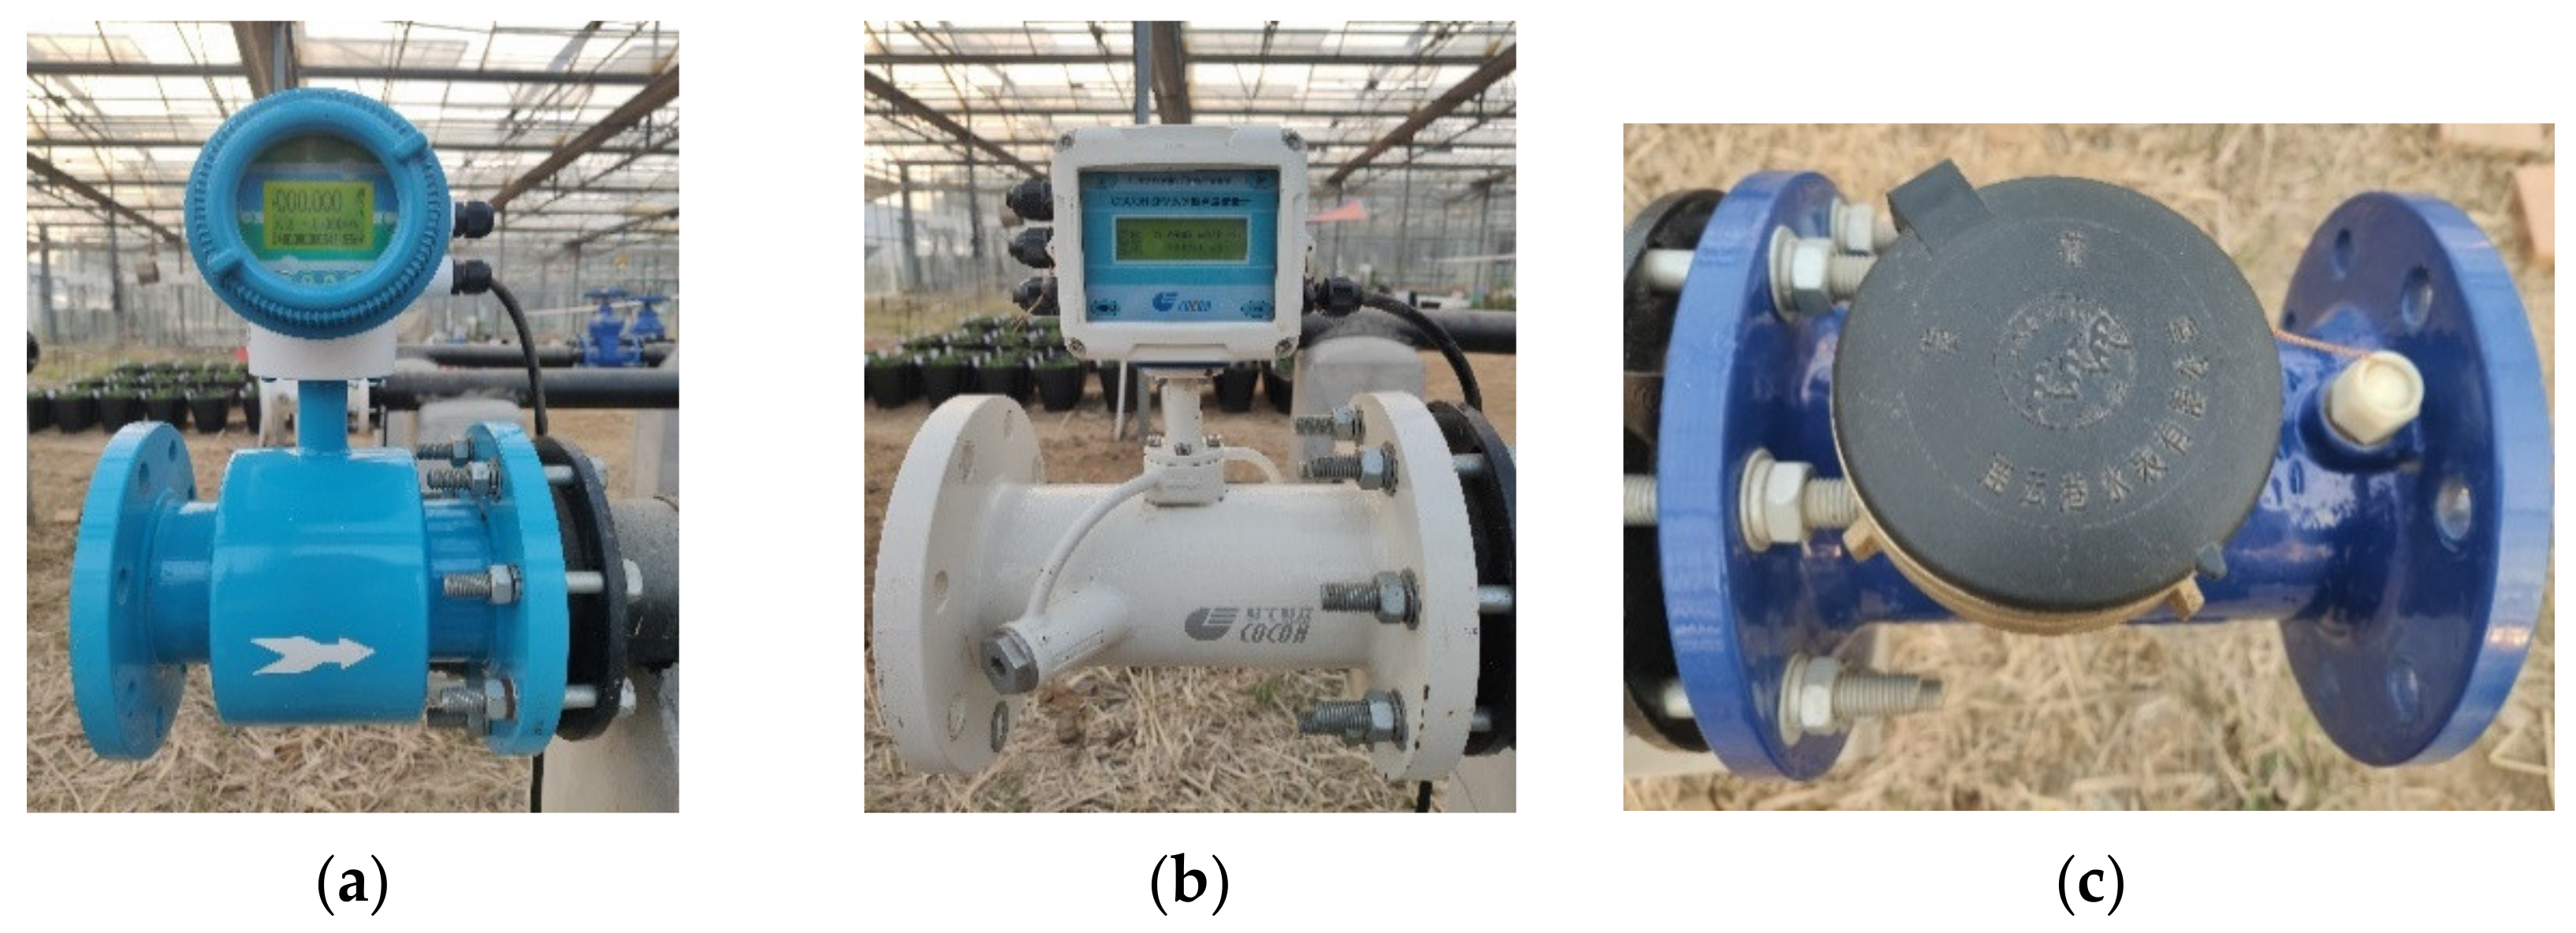
The pipe metering devices used in this study are shown in Figure 1. The model of the electromagnetic flowmeter is the Cometer-100, with a precision grade of 1.0. The ultrasonic flowmeter is a pipeline integrated flowmeter, which belongs to the COCON SFM series and has a precision grade of 1.0. The water meter used in this study is a volumetric water meter, the model is LXL-100E and the precision is ±5%. Additionally, the nominal diameters of the three metering devices are all 100 mm. Both the electromagnetic flowmeter and the ultrasonic flowmeter were manufactured by Sinoso Science and Technology Inc. in Nanjing, China. Additionally, the water meter was manufactured by Lianyungang Langhua Water Meter Factory in Lianyungang, China. All of the metering devices used in this study were provided by Sinoso Science and Technology Inc. in Nanjing, China.
2.2. Experimental Design and Measurement
2.2.1. Experimental Design
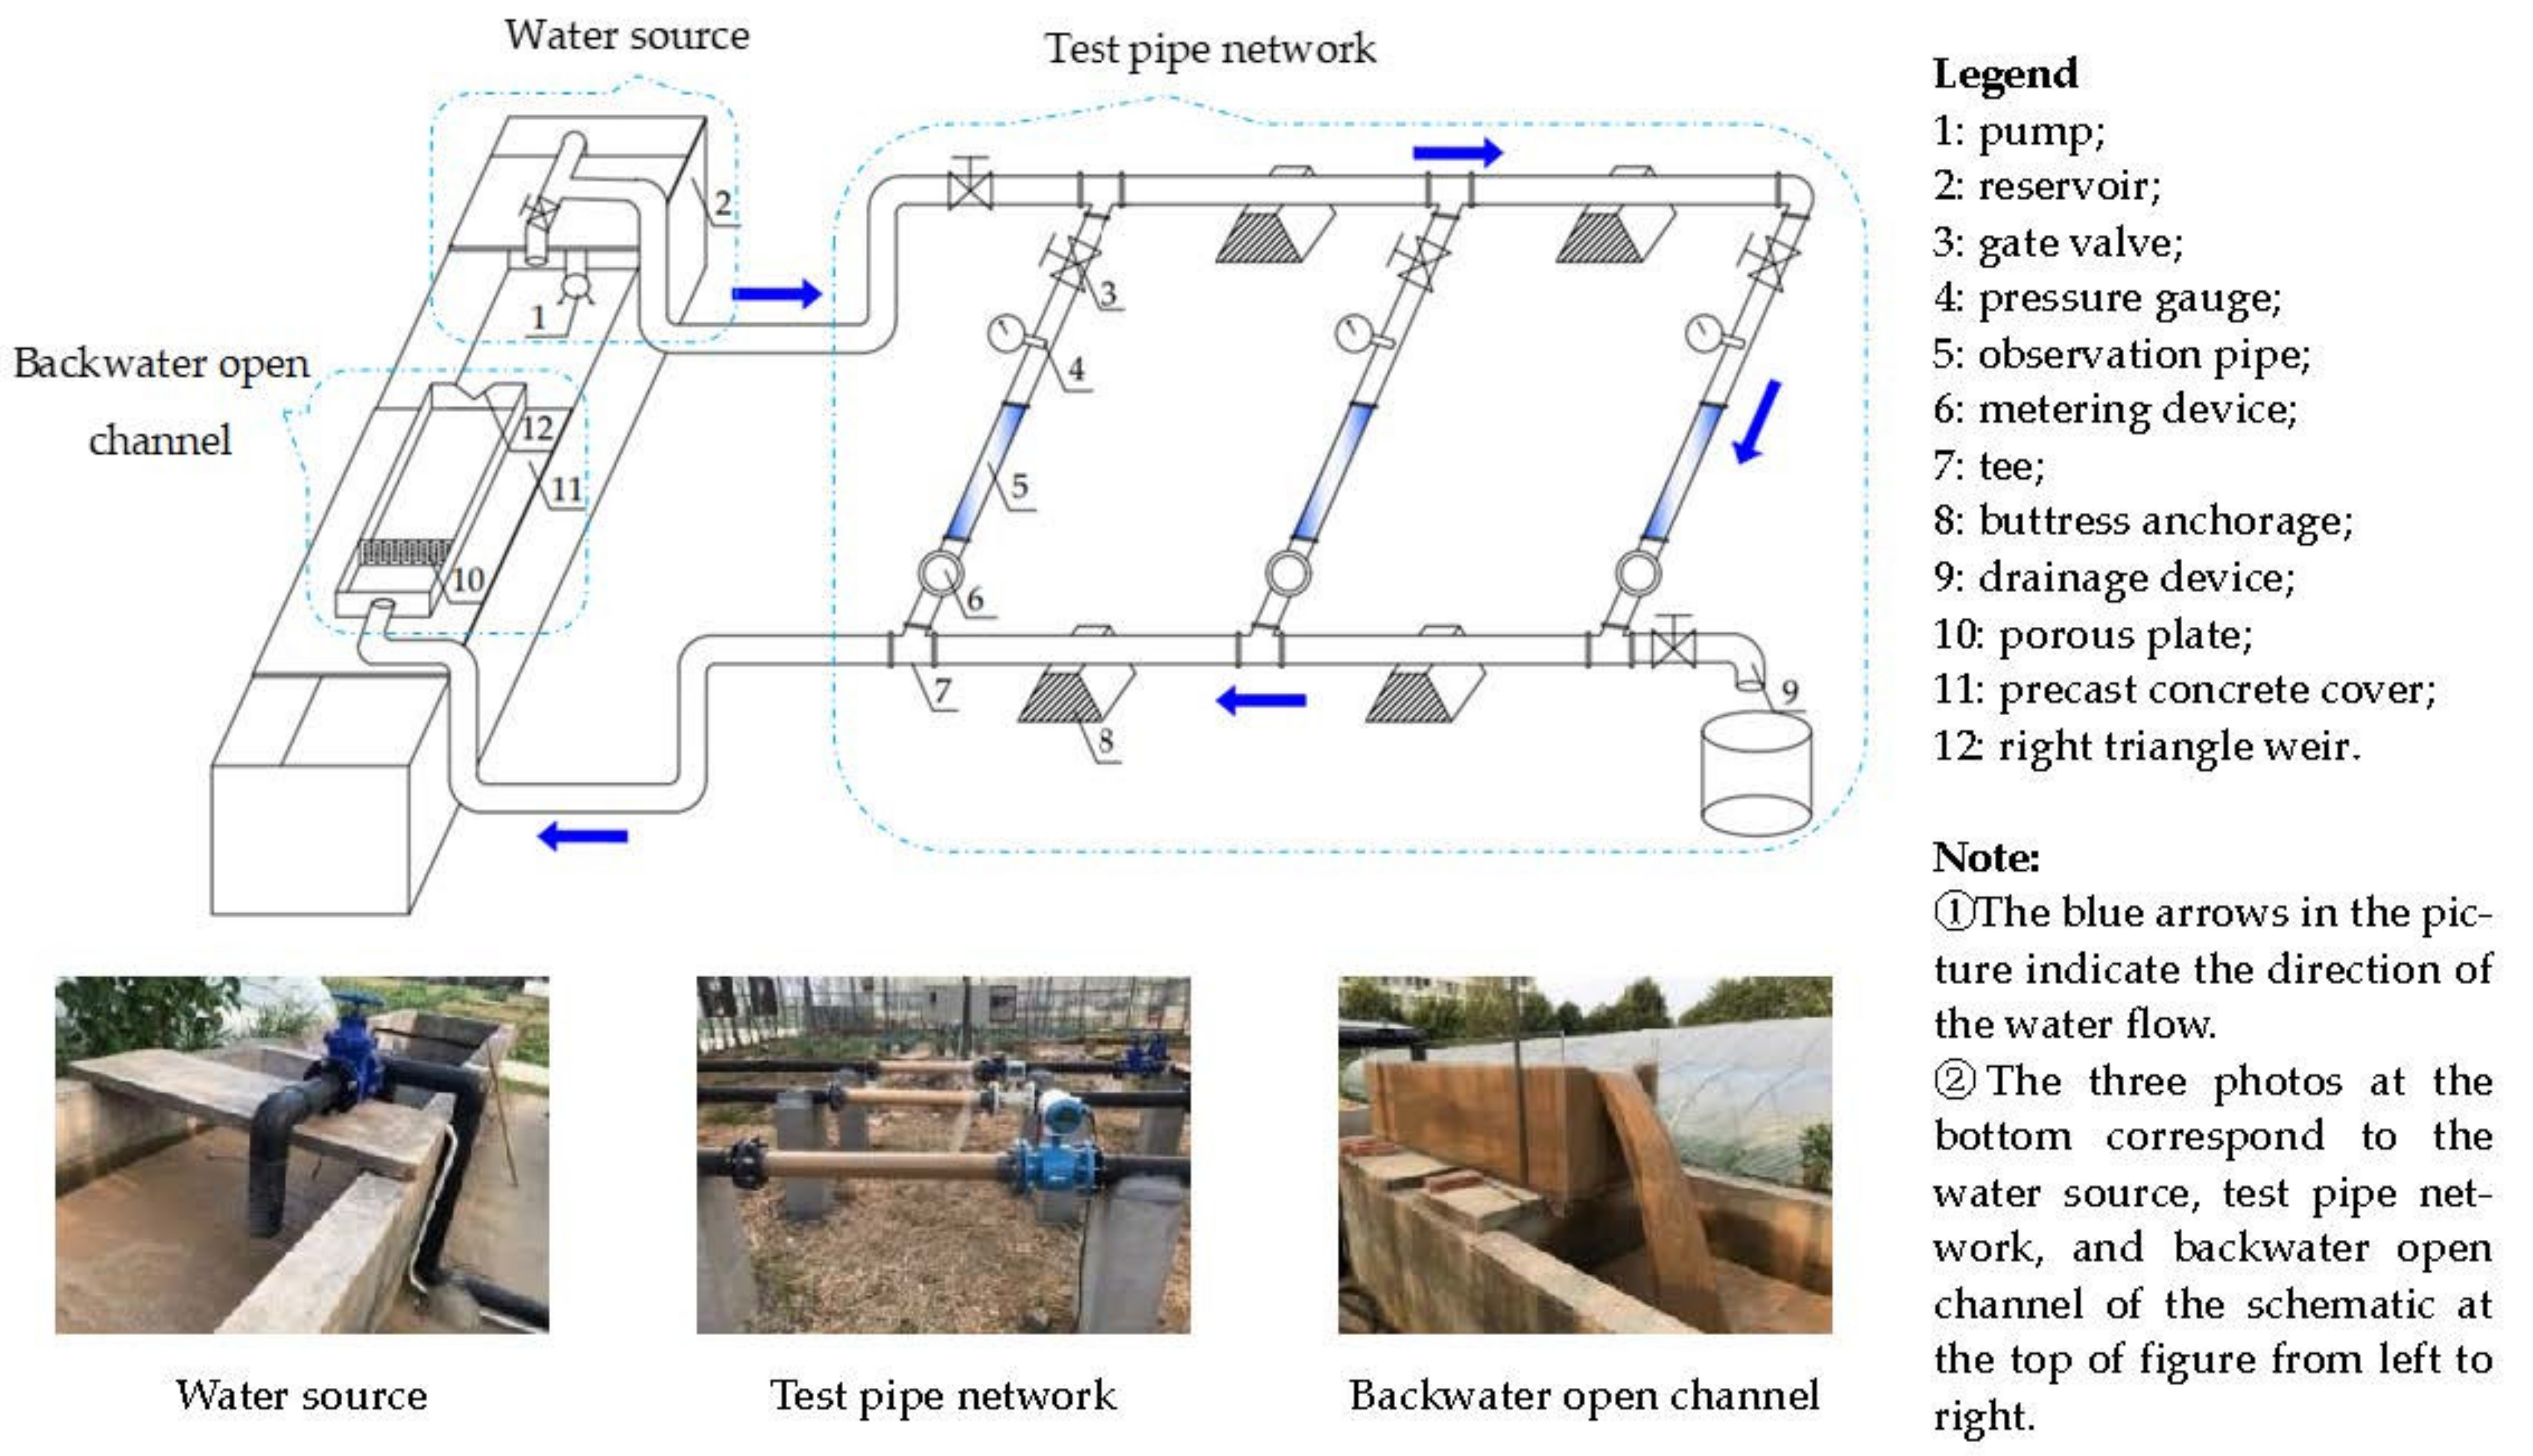
The test setup (Figure 2) is composed of three parts: water source, test pipe network and backwater open channel. In detail:
- (1).
- Water source consisted of a reservoir and a pump. The reservoir was made of concrete. A submersible pump was selected for this test. A tee was connected on the water outlet side, and the flow of the pipe network was adjusted by means of diversion.
- (2).
- Test pipe network included pressure gauges, observation pipes, metering devices, a connecting piece, etc. The observation pipes were made of transparent plexiglass material and used to observe the water flow in the pipe during the test. The length of the pipe section was 2.0 m and could be disassembled. The metering device closest to the water source was an electromagnetic flowmeter, the farthest one was a water meter and in the middle position was an ultrasonic flowmeter. A set of drainage devices was installed at the farthest end of the pipe network from the muddy pool through a tee.
- (3).
- Backwater open channel section was composed of an open channel section, a porous plate and a right triangle weir. The right triangle weir was used to measure the steady flow through the porous plate. The test device was designed as a circulating pipe network, which draws water from the submersible pump which flows through the pipe network to the backwater open channel and from the backwater open channel to the muddy pool.
Three variables, metering device type, sediment concentration and flow velocity, were selected in this experiment. The metering devices used in the test were a water meter, electromagnetic flowmeter and ultrasonic flowmeter. The sediment concentration was set at 7 levels (C0 to C6), and the specific values are shown in Table 2. The test flow velocity was set from high to low at 3 levels of 1.0 m/s, 1.25 m/s and 1.5 m/s. There were 63 treatments. The values of metering devices in the pipeline observation section and right triangle weir in the outlet section were observed.
2.2.2. Experimental Procedure
Under the condition of different sediment concentrations, the flow velocity of the pipe network was adjusted by the head-end shunt and the measured values of various metering devices were observed and recorded. The flow rate calculated by the right triangle weir was taken as the real value of the flow rate of the water–sand mixture to check the other three flow metering devices, so as to provide the basis for the evaluation of the reliability and accuracy of the pipe irrigation metering device for the sandy water source.
The experimental procedures under different sediment concentrations are listed as follows:
- (1)
- open the gate valve on the main pipe and branch pipe closest to the water source, and adjust the head of the right triangle weir to the set value according to the order of flow velocity from high to low;
- (2)
- observe the values when the metering device is stable, and close the gate valve of the branch pipe located in the metering device;
- (3)
- open the gate valve of the branch pipe located in the next metering device, and proceed in turn until the values of all three metering devices are observed;
- (4)
- adjust to different sediment concentrations in sequence and repeat the above steps.
2.2.3. Method of the Accuracy and Reliability Comparison Test Scheme of Measuring Devices
The right triangle weir free outflow method was used to measure the flow rate. First, the flow rate through the pipeline was calculated from the set flow velocity of the pipeline and the section of the pipeline. The flow rate of the pipeline was also the overflow rate of the right triangle weir. Then, according to Thompson’s empirical formula [35], the water head on the weir of the right triangle weir could be calculated.
Thompson’s empirical formula:
where H is the water head on the weir (m), Q is the flow rate through the right triangle weir (m3/s).
Q = 1.4H2.5,
The reading method of each metering device was as follows. Both the electromagnetic flowmeter and the ultrasonic flowmeter were to be read when the pipeline system ran stably. As for the water meter, the volume value of overflow was recorded every 5 min, for a total of 4 times. The measured flow value of each repeated water meter could be obtained from the ratio of the volume to the time, for a total of 3 repetitions. The final mean value was the flow rate of the water meter under a certain control head.
The measured flow value of each metering device and right triangle weir value were compared in turn, and the relative error was calculated. The calculation formulas of the relative error are shown in Equations (2) and (3). In the experiment of the influence of flow velocity on the accuracy and reliability of the metering device, the following corresponding formulas were used to calculate the relative error between each metering device and the right triangle weir. Then, the influence law of flow velocity on the accuracy of the metering device was analyzed, and the measuring object of the metering device was defined. In the experiment of the influence of sediment concentration on the accuracy and reliability of the metering device, Formula (2) was used to calculate the relative error between each metering device and the right triangle weir. As the initial sediment concentration in the experiment was not zero, to eliminate the influence of other factors other than sediment concentration on the experiment results, the relative errors of each metering device under each sediment concentration condition (C0~C6) were called F0~F6, respectively. Then, the difference between the relative error of other sediment concentrations and the relative error of the initial state of sediment concentration was calculated. The difference value of the relative error was called Δ, that is, Δ1 = F1 − F0,..., Δ6 = F6 − F0. In this case, the relative error was caused by the increase in sediment concentration in the experiment. According to the relative errors, the influence of muddy water with different sediment concentrations on the measured flow value of different metering devices was analyzed.
The relative error [36] of the flow measurement value of each metering device and right triangle weir was calculated as:
where Q1 is the flow rate measured by the corresponding metering device (m3/s), Q is the flow rate through the right triangle weir (m3/s).
The relative error [36] between the measured flow value of each metering device and the water flow rate in muddy water measured by right triangle weir was calculated as:
where Q1 is the flow rate measured by the corresponding metering device (m3/s), Q2 is the flow rate of the muddy water measured by the right triangle weir (m3/s).
3. Results
3.1. Accuracy and Reliability Analysis of Different Measuring Devices
3.1.1. Analysis of Accuracy and Reliability under Different Flow Velocities
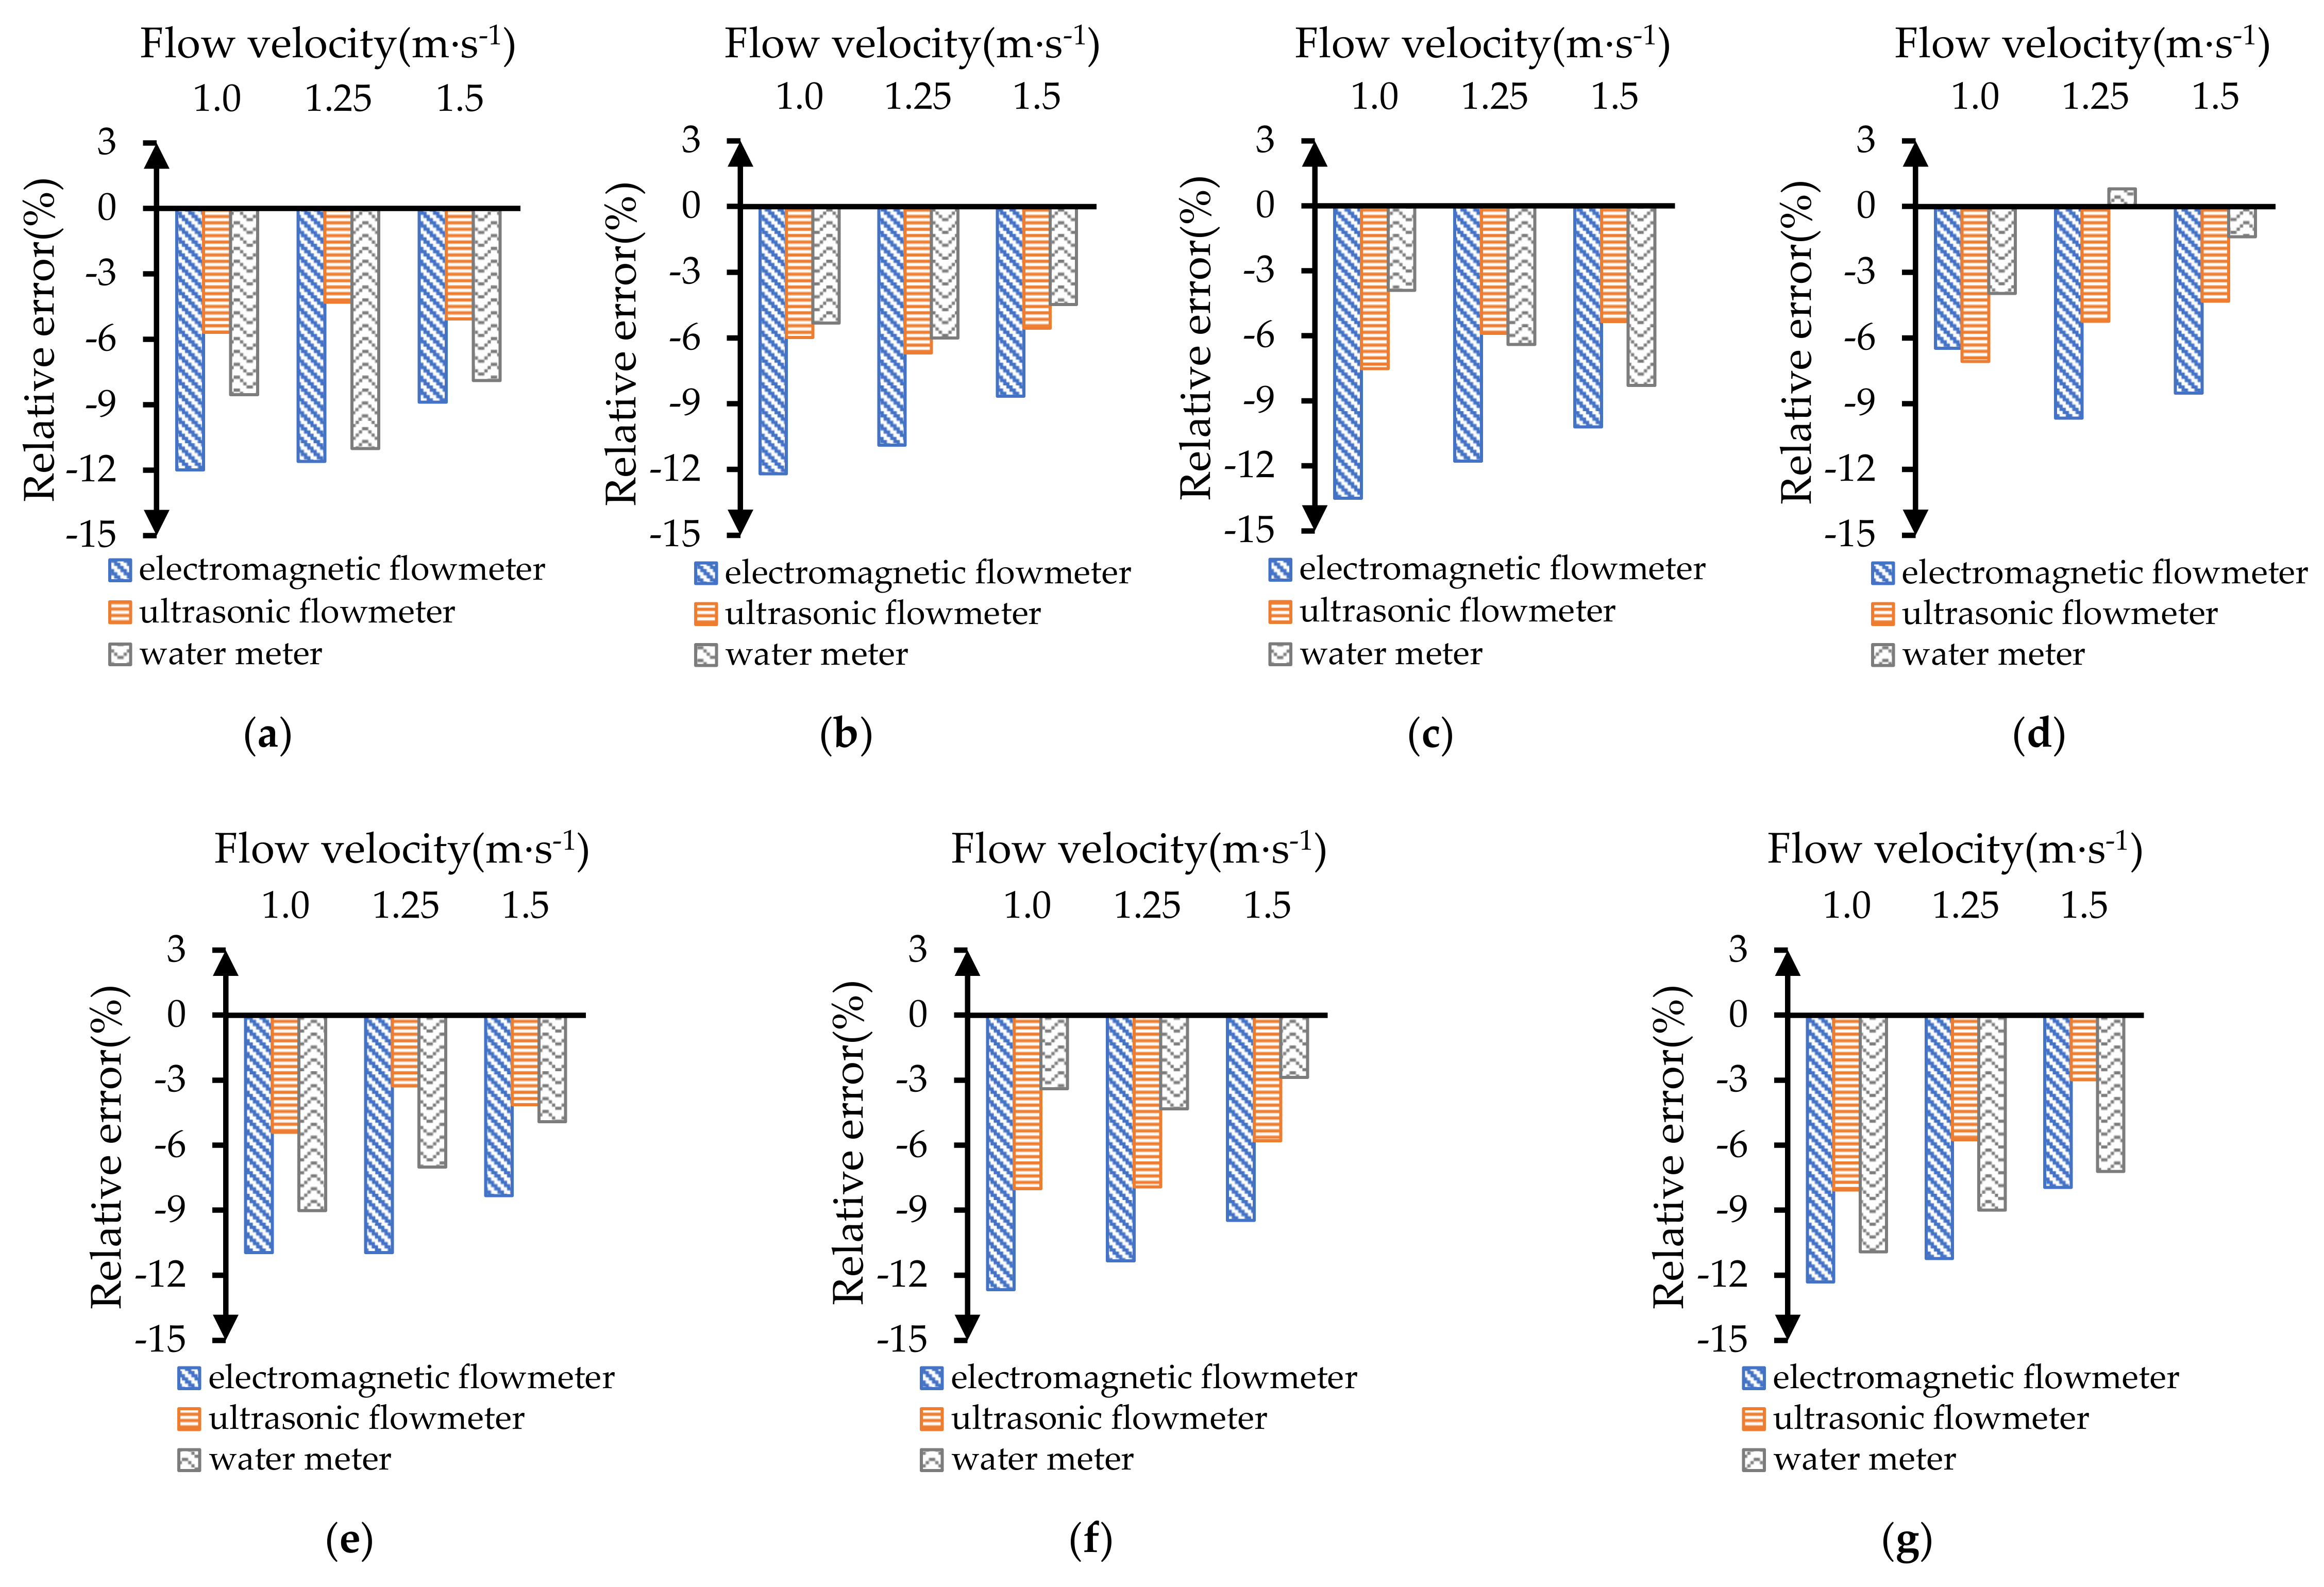
Figure 3 shows the influence of flow velocity on each metering device under different sediment concentrations. It can be seen that the relative error between the electromagnetic flowmeter and the right triangle weir changed most obviously with the increase in flow velocity under the C6 concentration. When the flow velocity was 1 m/s, the maximum relative error between the electromagnetic flowmeter and the right triangle weir was −12.32%. Under a 1.5 m/s flow velocity, the minimum relative error was −7.95%. With the increase in the flow velocity, the relative error decreased gradually, and the decrease magnitude was 35.42%. At the concentration of C4, the relative error between the electromagnetic flowmeter and the right triangle weir changed little with the increase in flow velocity, especially at the flow velocities of 1 m/s and 1.25 m/s. The relative errors at the three flow velocities were −10.96%, −10.95% and −8.33%, respectively. Under this sediment concentration, the relative error did not change significantly with the increase in flow velocity. However, there was a trend that the relative error decreased with the increase in flow velocity. In addition, the relative error between the electromagnetic flowmeter and the right triangle weir decreased with the increase in the flow velocity under other sediment concentrations. However, it was abnormal with the C3 concentration. The relative error at the flow velocity of 1 m/s was −6.48%, which was significantly smaller than the relative error at the flow velocity of 1.25 m/s, −9.65%. The reason might be that the sediment in the muddy water of the pipeline slowly sank over time after the entire pipe network system stopped running for a few hours, which resulted in sediment deposition. This reduced the cross-section of the pipeline and increased the flow velocity of the muddy water flowing through the sedimentary pipe section, resulting in a larger reading of the electromagnetic flowmeter. However, the hydraulic head of the right triangle weir was still controlled according to the hydraulic head of the weir when the pipe section was not reduced. That is to say, the flow rate measured by the electromagnetic flowmeter was larger than the flow rate before the silting of the pipe section, while the flow rate of the right triangle weir was unchanged, which led to a smaller relative error between the electromagnetic flowmeter and the right triangle weir. When the flow velocity was 1.25 m/s, the silt was washed up at the bottom of the pipeline, and the pipe section returned to normal. Therefore, when the flow velocity was running, the relative error between the electromagnetic flowmeter and the right triangle weir also returned to the original magnitude. It indicated that the change of flow velocity will affect the accuracy of the electromagnetic flowmeter. The higher the flow velocity, the smaller the relative error between the electromagnetic flowmeter and the right triangle weir.
The relative error between ultrasonic flowmeter and right triangle weir decreased with the increase in flow velocity under the sediment concentrations of C2, C3, C5 and C6. Under the C6 concentration, the maximum reduction of the relative error was 63.06%. Under the C5 concentration, the relative error reduction range was the smallest, which was 27.51%. However, under the concentration of C0, C1 and C4, the relative error between the ultrasonic flowmeter and right triangle weir did not show a tendency to decrease with the increase in flow velocity. However, the relative error of the ultrasonic flowmeter and the right triangle weir at 1 m/s was larger than that of other flow velocities at any level of sediment concentration. Therefore, when the sediment concentration was constant, the measurement accuracy of ultrasonic flowmeter had no obvious rule to follow with the increase in flow velocity.
3.1.2. Analysis of Accuracy and Reliability under Different Concentrations
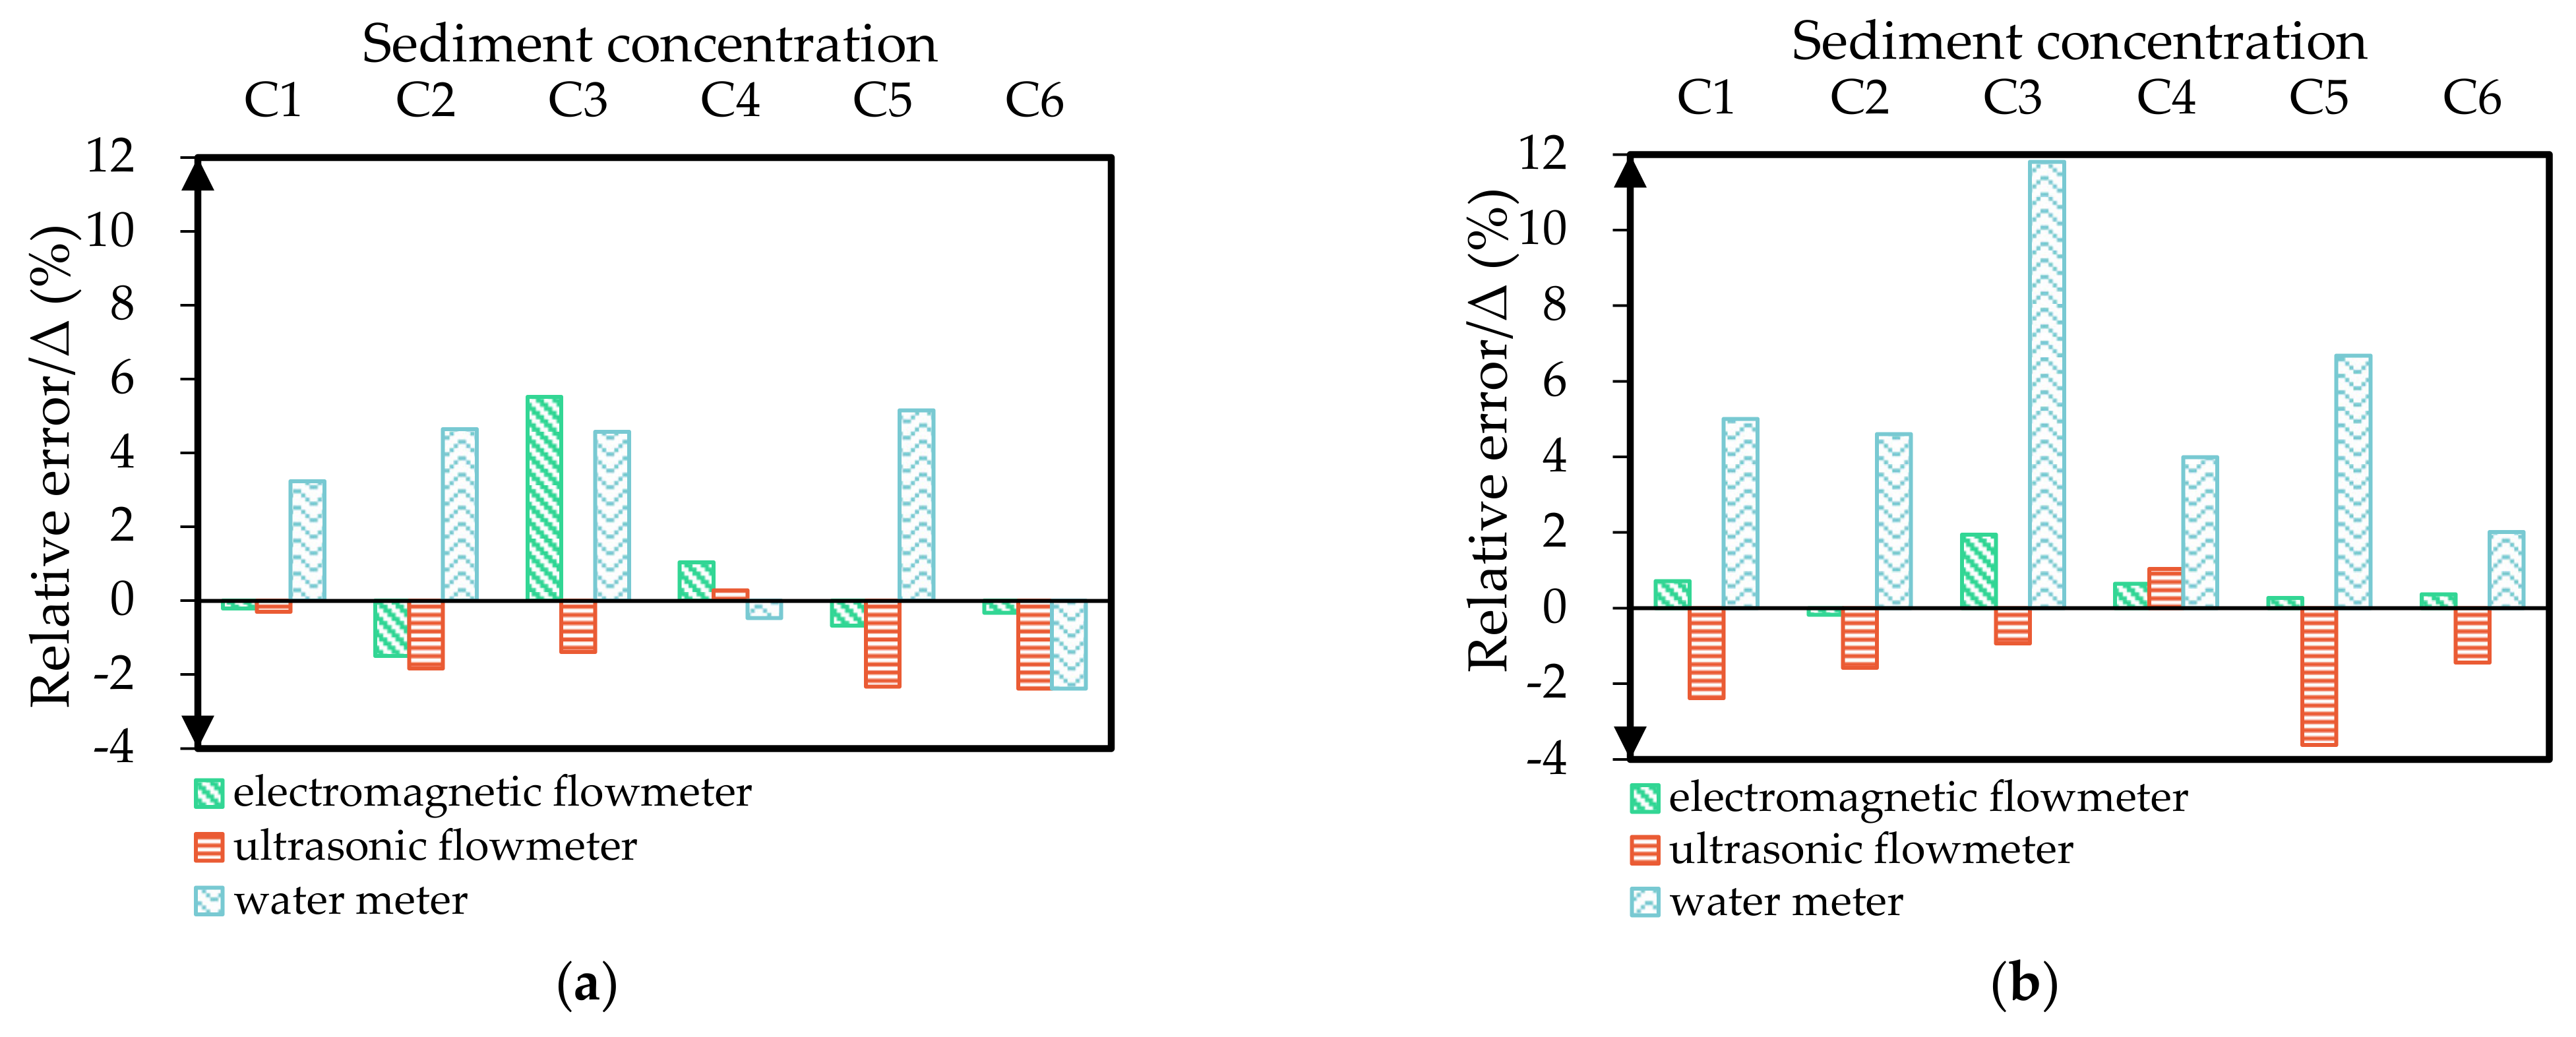
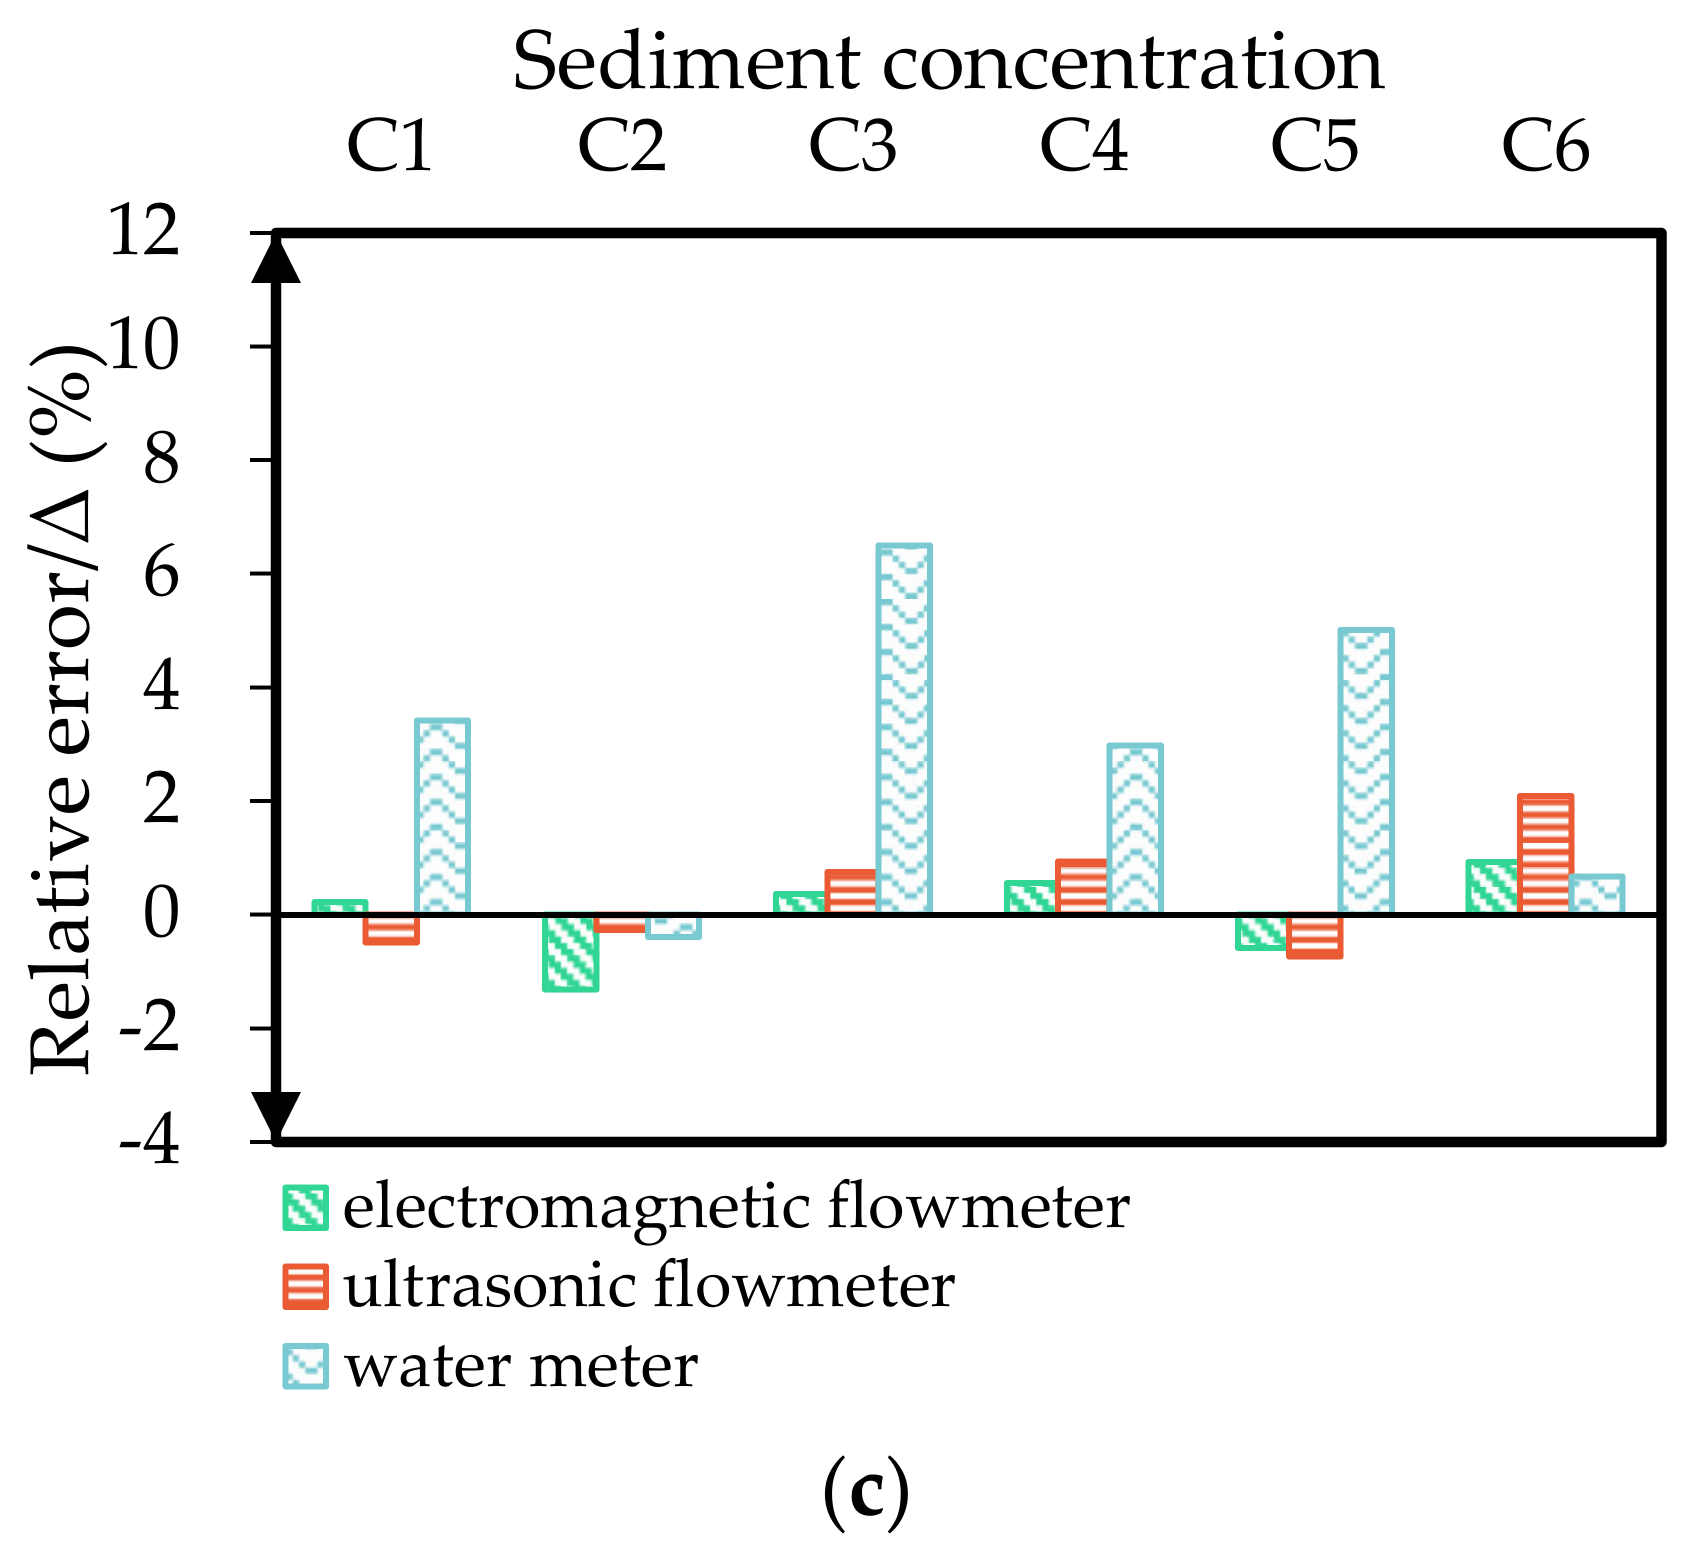
It can be seen from Figure 4 that when the flow velocity was 1 m/s, the relative errors of the negative and positive values between the electromagnetic flowmeter and the right triangle weir were the largest under the C2 concentration (−1.50%) and C4 concentration (1.04%). The difference of the relative error was only 2.53%. The relative error of negative values between the ultrasonic flowmeter and right triangle weir was the largest under the C6 concentration, which was −2.39%, and the largest relative error of positive values was under the C4 concentration (0.27%). The difference of the relative error was 2.67%. The relative error of positive values between the water meter and the right triangle weir was the largest under the C5 concentration, which was 5.15%. The largest of negative values under the C6 concentration was −2.38%. Additionally, the difference of the relative error was 7.53%. When the flow velocity was 1.25 m/s, the relative error of positive values the between the electromagnetic flowmeter and the right triangle weir was the largest at the C3 concentration and the largest relative error of negative values was under the C2 concentration. The difference of the relative error was 2.13%. The relative error of negative values for the ultrasonic flowmeter was the largest under the C5 concentration and the largest relative error of positive values was under the C4 concentration. The difference was 4.65%. The relative errors of the water meter were positive under each sediment concentration, with the largest relative error under the C3 concentration and the smallest under the C6 concentration. The difference of the relative error was 9.80%. When the flow velocity was 1.5 m/s, the differences of the relative error were 2.24%, 2.82% and 6.90% for the electromagnetic flowmeter, ultrasonic flowmeter and water meter, respectively. According to the above analysis, it can be seen that the relative error variation between the electromagnetic flowmeter and the right triangle weir was the smallest, and the water meter had the largest.
3.2. Comparative Analysis of Relative Error between Total Water and Sediment Discharge
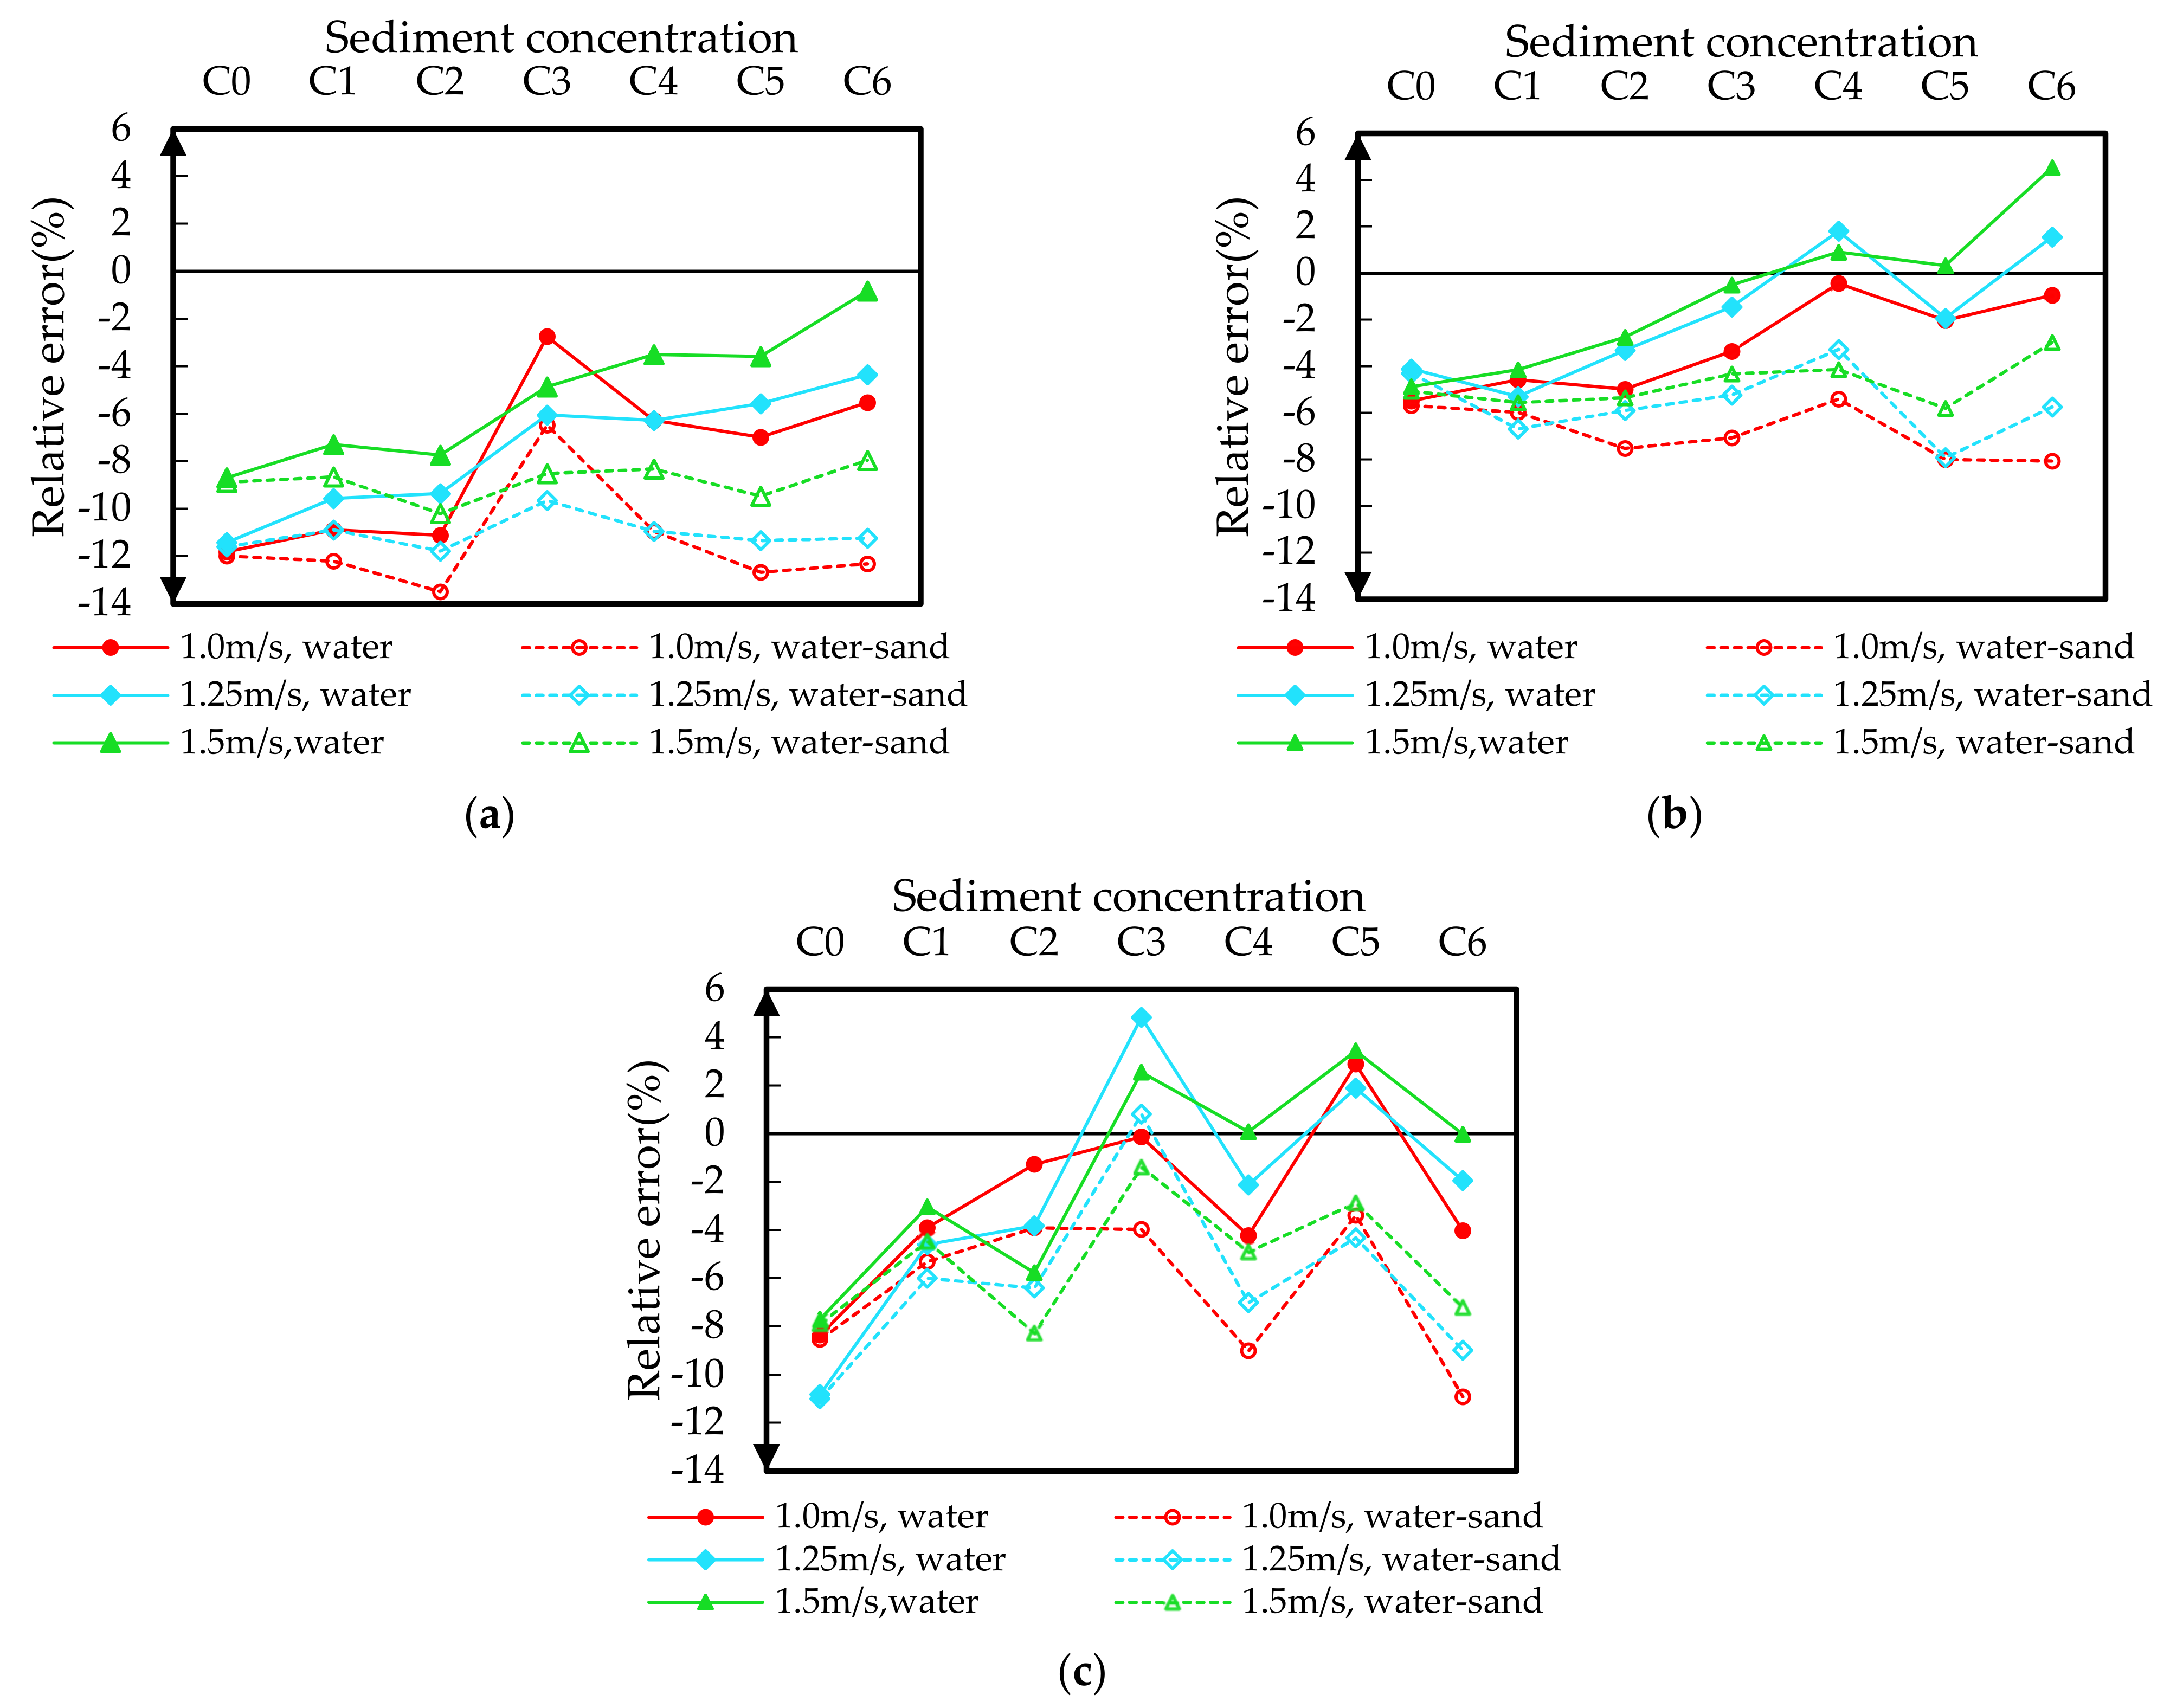
Figure 5 shows the relative errors of water and water–sand of the measured flow values between different metering devices and the right triangle weir. The relative error of water refers to the relative error between the measured flow value of each metering device and the water flow rate in muddy water measured by the right triangle weir. Additionally, the relative error of water–sand is the relative error of the flow measurement value of each metering device and the muddy water flow measured by the right triangle weir.
Figure 5a shows that the relative errors of water and water–sand between the electromagnetic flowmeter and the right triangle weir were the maximum at a flow velocity of 1 m/s, and the relative errors of water and water–sand were the smallest at a flow velocity of 1.5 m/s, when the sediment concentration was constant. The relative error of both water and water–sand showed a trend of a gradually decrease with the increase in flow velocity. When the flow velocity was constant, the relative errors of the water and water–sand measured by the electromagnetic flowmeter and the right triangle weir were relatively large under C0 sediment concentration, and the relative errors ranged from −8% to −12%. With the increase in sediment concentration, the relative error of the water between the electromagnetic flowmeter and the right triangle weir decreased gradually, while the relative error of the water–sand remained basically unchanged. The relative errors of the water and water–sand between the electromagnetic flowmeter and the right triangle weir had an obvious separation phenomenon. When the flow velocity was 1.5 m/s, the relative error of water between the electromagnetic flowmeter and the right triangle weir was smallest under the C6 concentration (−0.83%). The relative error of water–sand was largest under the C2 sediment concentration (−10.20%) and smallest under the C6 concentration (−7.95%). The relative error magnitude of the water between the electromagnetic flowmeter and the right triangle weir was about 90.50%, and the trend was sharp. However, the relative error magnitude of water–sand was 22.02%, and the trend was obviously slower. Overall, when the sand content was greater, the measured value of the electromagnetic flowmeter was closer to the sand–water value measured by the right triangle weir. However, if the sediment concentration keeps increasing, the relative error of the water between the electromagnetic flowmeter and the right triangle weir may keep decreasing, and even become a positive value. This shows that the measured flow value of the electromagnetic flowmeter did not conform to the law of that measured by the right triangle weir, and the measured flow value was also unstable. In other words, the flow rate measurement object of the electromagnetic flowmeter was not water, but more likely a mixture of water and sand.
It can be seen from Figure 5b the relative error of water and water–sand between the ultrasonic flowmeter and the right triangle weir decreased with the increase in flow velocity, but the law was different under other concentrations when the sediment concentrations were C2 and C3. This indicated that the law of relative error change with the increase in flow velocity was not clear, whether it was water or water–sand. However, the ultrasonic flowmeter had stable performance in the sediment concentration range of C2 to C3, so its use can be considered in this range. When the flow velocity was constant, the relative errors of water and water–sand between the ultrasonic flowmeter and the right triangle weir were within the range of −4–−6% under the initial sediment concentration. With the increase in sediment concentration, the relative error of water between the ultrasonic flowmeter and the right triangle weir changed from a negative value to a positive value, which showed that the trend of the flow measured by the ultrasonic flowmeter was not consistent with the trend of the water measured by the right triangle weir. This indicated that the measured flow value of the ultrasonic flowmeter could not represent the flow rate of water in a water–sand mixture well. Although the relative error of the water–sand flow rate was small, the fluctuation range was large. When the flow velocity was 1.25 m/s, the maximum value of the relative error of water–sand was −7.92% under the C5 concentration, and the minimum value was −3.27% under the C4 concentration. The variation range of the relative error was 58.71%, which was larger than the relative error of water–sand between the electromagnetic flowmeter and the right triangle weir. Therefore, the ultrasonic flowmeter could not represent the measured value of water or water–sand well. In the application of pipeline irrigation with a sandy water source, the stability and reliability are not as good as those of the electromagnetic flowmeter.
When the sediment concentration was constant, the relative errors of water and water–sand between the water meter and the right triangle weir had no obvious change rule with the increase in the flow velocity (Figure 5c). Under the C3 concentration the relative error of water at a flow velocity of 1.25 m/s obviously exceeded that at a flow velocity of 1.5 m/s. When the sediment concentration was C5, a relative error of 1.5 m/s water was larger than that of the other two flow velocities. From the above, it can be seen that in almost every sediment concentration state, the change law of relative error of water was different with the change of flow velocity. The relative errors of the water–sand between the water meter and the right triangle weir were similar to the above conditions. Moreover, the relative error of water and water–sand at low concentrations did not show obvious separation in the figure. The above analysis reflected the instability of water meters in muddy water pipeline applications. In the case of a certain flow velocity, the relative errors of water and water–sand fluctuated greatly. On the whole, the relative error of water between the water meter and the right triangle weir tended to decrease with the increase in sediment concentration, while the error of water–sand between the water meter and the right triangle weir showed an overall increasing trend under the condition of 1 m/s, and showed a decreasing trend under the condition of 1.25 m/s. Therefore, the stability and reliability of water meters are extremely poor in the application of pipeline irrigation with a sandy water source.
4. Discussion
In muddy water irrigation, clarifying the accuracy, reliability and flow rate measurement objects of the pipe metering device will help to formulate a more accurate irrigation schedule. By comparing the relative error of each metering device, the change law of the relative error between each metering device and the right triangle weir under different flow velocities and different sediment concentrations was studied, and the accuracy and reliability of each metering device were analyzed in this study.
When the sediment concentration was constant, the relative error between the electromagnetic flowmeter and the right triangle weir gradually decreased with the increase in the flow velocity. The relative error between the ultrasonic flowmeter and the right triangle weir only decreased with the increase in flow velocity under the individual sediment concentrations. The relative error between the water meter and the right triangle weir was extremely unstable and had no obvious relation to the flow velocity. Among these three measuring devices, the law of the relative error between the electromagnetic flowmeter and the right triangle weir was the most clear with the change of flow velocity. The change of flow velocity affected the measurement accuracy of the electromagnetic flowmeter. In the range of flow velocities in this study, the greater the flow velocity, the better the accuracy. This is probably because the increase in flow velocity under the sand grading made the velocity of the two-phase fluid evenly distributed and reduced the measurement error [37]. Wang [37] also proposed that the electromagnetic flowmeter can be used as the first choice for measuring the flow of a two-phase flow. When measuring a two-phase fluid with small abrasive forces, a higher flow velocity can be appropriately selected to reduce flow measurement errors. Therefore, in practical applications, if the electromagnetic flowmeter is used to measure the flow rate based on the sand sample used in this paper, a smaller diameter pipe or different diameter tubes may be used to increase the flow velocity and improve the measurement accuracy of the metering device. At the same time, the use of a small diameter pipe or electromagnetic flowmeter can also retrench expenditure.
The relative error between the electromagnetic flowmeter and the right triangle weir did not change significantly with the increase in sediment concentration under the constant flow velocity. The relative errors between the ultrasonic flowmeter, water meter and the right triangle weir fluctuate with the increase in sediment concentration. Therefore, the reliability of the electromagnetic flowmeter is the best, followed by the ultrasonic flowmeter, and the reliability of the water meter is the worst. The accuracy of the electromagnetic flowmeter is mostly unaffected by sediment concentration in muddy water irrigation. This is also related to the advantages that the electromagnetic flowmeter has, e.g., no moving parts or throttle valve parts and the fluid flow will not be blocked [19,20], which is consistent with the conclusion obtained by Lu et al. [17] based on the definition of the muddy water head and theoretical analysis. The conclusion is that the electromagnetic flowmeter is not affected by liquid pressure, temperature, viscosity, density or conductivity, so it can be used to measure the muddy water flow rate. Ultrasonic flowmeters are easily affected by the measured medium. When the measured medium passes through an ultrasonic flowmeter based on the principle of transit time, the time difference between the upstream and downstream will affect the measuring accuracy of the flowmeter [38]. There was a lot of sand in the muddy water, and the ultrasonic pulse affected the time difference when passing through the sand, which affected the measurement results. The water meter has moving parts inside it [39], so the sandy water caused unavoidable damage to the moving parts, resulting in measurement error.
As for the flow measurement object of the metering device, when the flow velocity was constant, the relative error of water–sand between the electromagnetic flowmeter and the right triangle weir was relatively stable. The relative errors of water and water–sand between the ultrasonic flowmeter and right triangle weir were relatively large. The relative errors of water and water–sand between the water meter and the right triangle weir fluctuated greatly with the change of sediment concentration. The results showed that the law of flow rate measured by the electromagnetic flowmeter was basically the same as that of the water–sand measured by the right triangle weir. Therefore, the flow rate measurement object of the electromagnetic flowmeter in muddy water was probably the water–sand mixture. This also confirmed that the electromagnetic flowmeter is not affected by the sand content. The ultrasonic flowmeter could not represent the measured flow value of water or water–sand in muddy water well. The stability and reliability of the ultrasonic flowmeter were not as good as that of the electromagnetic flowmeter in the application of muddy water low-pressure pipe irrigation. The reliability of the water meter was the worst. Therefore, the water meter was not suitable for the flow measurement of pipeline irrigation with a sandy water source. The ultrasonic flowmeter and water meter were affected by the amount of sand in the measurement of muddy water. Therefore, whether they are used to measure water or sand in muddy water, their measurement values will be affected by sand.
The results obtained in this paper only show the influence of muddy water on the accuracy and reliability of the metering device. However, other factors but will also cause errors in the metering device. Therefore, it is necessary to further study the error of the metering device for muddy water pipeline irrigation by combining these factors. It is helpful to protect and maximize the utilization of the Yellow River resource with superior hydraulic performance that can be used for agricultural irrigation [40].
5. Conclusions
Sandy water sources are widespread in China. Pipeline irrigation is a common water-saving irrigation method. Therefore, it is very important to clarify the accuracy, reliability and flow rate measurement objects of pipeline metering devices in muddy water irrigation. In this study, a comparative measurement method was used to compare the relative errors of the measured flow values of different pipeline metering devices and a right triangular weir under different sediment concentrations and different flow velocities. The influence of flow velocity and sediment concentration on the accuracy and reliability of each metering device was clarified. Suitable metering devices were recommended for pipe irrigation of sandy water sources under the sand grading used in this paper.
Conclusions are drawn as follows:
(1) The relative error of the measured flow rate between the electromagnetic flowmeter and water–sand of the right triangle weir decreased with the increase in the overall flow velocity when the sediment concentration was constant. This suggests that appropriately increasing the flow velocity can improve the accuracy of the electromagnetic flowmeter. Sediment concentration had some effects on the accuracy of the ultrasonic flowmeter and water meter, but not for the electromagnetic flowmeter. Therefore, the reliability of the electromagnetic flowmeter is the best.
(2) The measured flow rate of the electromagnetic flowmeter was closer to the water flow rate in the water–sand mixture of the right triangle weir under the condition of higher sediment concentration. However, the measured flow law of the electromagnetic flowmeter was more in line with the measured flow law of the water–sand mixture measured by the right triangle weir. The observed flow rate measurement object of the electromagnetic flowmeter was the water–sand mixture.
(3) In practical applications, the electromagnetic flowmeter should be calibrated and the system error eliminated before measuring the flow rate of pipeline irrigation with a sandy water source to improve the accuracy. Additionally, a small-diameter pipe can also be selected to measure muddy water flow rate in order to improve the measurement accuracy of electromagnetic flowmeters.
It should be noted that the above conclusions have some caveats to keep in mind when using the results. This paper focused on the accuracy and reliability of metering devices for muddy water pipeline irrigation. Additionally, we only studied the relative error comparison between three metering devices and the right triangle weir under a sand grading, and the setting of sand content and flow velocity values has certain limitations. In practical applications, the scope of application is relatively narrow. Therefore, the scope of research is expected to be expanded in the future to study the impact of sand in different gradations on the accuracy and reliability of pipeline metering devices, and to expand the range of the sand content and flow velocity.
Author Contributions
Conceptualization, X.J.; methodology, X.J. and J.L.; software, M.S.; validation, M.S. and S.W.; formal analysis, M.S. and T.W.; investigation, M.S.; resources, M.S.; data curation, M.S.; writing—original draft preparation, M.S.; writing—review and editing, M.S. and J.L.; visualization, M.S. and J.L.; supervision, X.J.; project administration, X.J.; funding acquisition, X.J. and J.L. All authors have read and agreed to the published version of the manuscript.
Funding
This research was funded by the “Major Project in Key Research and Development Program of the Ningxia Hui Autonomous Region”, grant number “2018BBF02022”; “the fundamental Research Funds for the Central Universities”, grant number “B210202120”.
Institutional Review Board Statement
Not applicable.
Informed Consent Statement
Not applicable.
Data Availability Statement
Not applicable.
Acknowledgments
The authors thank Chuanmeng Shi, Huandi Li, Ming Shang and Zhen Yao of Hohai University for their help and support during the experiment.
Conflicts of Interest
The authors declare no conflict of interest.
References
- Duan, G.; Shu, A.; Rubinato, M.; Wang, S.; Zhu, F. Collapsing Mechanisms of the Typical Cohesive Riverbank along the Ningxia–Inner Mongolia Catchment. Water 2018, 10, 1272. [Google Scholar] [CrossRef] [Green Version]
- Zhang, X.; Luo, J.; Zhao, J.; Xie, J.; Yan, L.; Yu, Z. Simulation of the Transboundary Water Quality Transfer Effect in the Mainstream of the Yellow River. Water 2018, 10, 974. [Google Scholar] [CrossRef] [Green Version]
- Du, J.; Yang, Z.; Wang, H.; Yang, G.; Li, S. Spatial–Temporal Matching Characteristics between Agricultural Water and Land Resources in Ningxia, Northwest China. Water 2019, 11, 1460. [Google Scholar] [CrossRef] [Green Version]
- Tan, C.; Yang, J.; Li, M. Temporal-Spatial Variation of Drought Indicated by SPI and SPEI in Ningxia Hui Autonomous Region, China. Atmosphere 2015, 6, 1399. [Google Scholar] [CrossRef] [Green Version]
- Li, Y.; Conway, D.; Wu, Y.; Gao, Q.; Rothausen, S.; Xiong, W.; Ju, H.; Lin, E. Rural livelihoods and climate variability in Ningxia, Northwest China. Clim. Chang. 2013, 119, 891–904. [Google Scholar] [CrossRef] [Green Version]
- Tian, F.; Ma, B.; Yuan, X.; Wang, X.; Yue, Z. Hazard Assessments of Riverbank Flooding and Backward Flows in Dike-Through Drainage Ditches during Moderate Frequent Flooding Events in the Ningxia Reach of the Upper Yellow River (NRYR). Water 2019, 11, 1477. [Google Scholar] [CrossRef] [Green Version]
- Tan, G.M.; Fang, H.W.; Dey, S.; Wu, W. Rui-Jin Zhang’s Research on Sediment Transport. J. Hydraul. Eng. 2018, 144, 02518002. [Google Scholar] [CrossRef]
- Dong, L.; Yu, D.; Zhang, H.; Zhang, M.; Jin, W.; Liu, Y.; Shi, X. Long-term effect of sediment laden Yellow River irrigation water on soil organic carbon stocks in Ningxia, China. Soil Till. Res. 2015, 145, 148–156. [Google Scholar] [CrossRef]
- Dong, L.; Zhang, H.; Wang, L.; Yu, D.; Yang, F.; Shi, X.; Saleem, H.; Akhtar, M.S. Irrigation with sediment-laden river water affects the soil texture and composition of organic matter fractions in arid and semi-arid areas of Northwest China. Geoderma 2018, 328, 10–19. [Google Scholar] [CrossRef]
- Zong, Q.L.; Zhang, X.Y.; Wang, Z.J.; Tang, H. Experimental Study on Muddy Water Delivery for Irrigation in Low-Pressure Pipeline System. Appl. Mech. Mater. 2012, 212–213, 586–589. [Google Scholar] [CrossRef]
- He, W.Q.; Cai, M.K.; Zhang, Y.P. Study on Non-Depositing Critical Velocity of Water Delivery in Pipeline System under Different Conditions of Sediment-Laden Water Source. Adv. Mater. Res. 2011, 243–249, 4660–4664. [Google Scholar] [CrossRef]
- Osra, F.A. A laboratory study of solid-water mixture flow head losses through pipelines at different slopes and solid concentrations—ScienceDirect. S. Afr. J. Chem. Eng. 2020, 33, 29–34. [Google Scholar]
- Cai, M.K.; He, W.Q. Clogging Mechanism of Muddy Water Delivery Pipe and Technology of Anti-Clogging. Adv. Mater. Res 2011, 243–249, 4665–4669. [Google Scholar] [CrossRef]
- Karadirek, I.E. An experimental analysis on accuracy of customer water meters under various flow rates and water pressures. AQUA 2019, 69, 18–27. [Google Scholar] [CrossRef]
- Koech, R.; Pezzaniti, D.; Myers, B. Effect of elevated temperature on water meter accuracy. Water J. 2015, 42, 56–60. [Google Scholar]
- Iooss, B.; Lhuillier, C.; Jeanneau, H. Numerical simulation of transit-time ultrasonic flowmeters: Uncertainties due to flow profile and fluid turbulence. Ultrasonics 2002, 40, 1009–1015. [Google Scholar] [CrossRef]
- Lu, L.; Xu, H.; Meng, X.; Zhang, H.; Zhang, J. Discussion on measuring method of head and flow under turbid water conditions. Mech. Electr. Tech. Hydropower Station 2017, 40, 1–6. (In Chinese) [Google Scholar]
- Wang, B. Comparison and Analysis of Performance of Different Flowmeters in Sewage Flow Measurement. Shanxi Hydrotech. 2019, 213, 56–58. (In Chinese) [Google Scholar]
- Yong-Yi, F.; Shih-Wei, L. Dynamic Synchronous Capture Algorithm for an Electromagnetic Flowmeter. Sensors 2017, 17, 821. [Google Scholar]
- Ge, L.; Li, H.; Wang, Q.; Wei, G.; Hu, Z.; Liao, J.; Li, J. Design and Optimization of Annular Flow Electromagnetic Measurement System for Drilling Engineering. J. Sens. 2018, 2018, 1–12. [Google Scholar] [CrossRef] [Green Version]
- Serdar, G.; Ozge, S. E.M.I. Effects of Cathodic Protection on Electromagnetic Flowmeters. Sensors 2007, 7, 75–83. [Google Scholar]
- Jiang, Y. Study on Weight Function Distribution of Hybrid Gas-Liquid Two-Phase Flow Electromagnetic Flowmeter. Sensors 2020, 20, 1431. [Google Scholar] [CrossRef] [PubMed] [Green Version]
- Shi, Y.; Wang, M.; Shen, M.; Wang, H. Optimization of an electromagnetic flowmeter for dual-parameter measurement of vertical air-water flows. J. Mech. Sci. Technol. 2015, 29, 2889–2895. [Google Scholar] [CrossRef]
- Yang, Q.Y.; Jin, N.D.; Zhai, L.S.; Ren, Y.Y.; Yu, C.; Wei, J.D. Measurement of Water Velocity in Gas–Water Two-Phase Flow with the Combination of Electromagnetic Flowmeter and Conductance Sensor. Sensors 2020, 20, 3122. [Google Scholar] [CrossRef] [PubMed]
- Faraj, Y.; Wang, M.; Jia, J.; Wang, Q.; Xie, C.G.; Oddie, G.; Primrose, K.; Qiu, C. Measurement of vertical oil-in-water two-phase flow using dual-modality ERT–EMF system. Flow Meas. Instrum. 2015, 46, 255–261. [Google Scholar] [CrossRef]
- Wang, Y.; Li, H.; Liu, X.; Zhang, Y.; Xie, R.; Huang, C.; Hu, J.; Deng, G. Novel Downhole Electromagnetic Flowmeter for Oil-Water Two-Phase Flow in High-Water-Cut Oil-Producing Wells. Sensors 2016, 16, 1703. (In Chinese) [Google Scholar] [CrossRef]
- Deng, K. Design and Research of Ultrasonic Flow Meter Based on Time Difference Method. Master’s Thesis, South China University of Technology, Guangzhou, China, 2013. [Google Scholar]
- Zhang, H.; Guo, C.; Lin, J. Effects of Velocity Profiles on Measuring Accuracy of Transit-Time Ultrasonic Flowmeter. Appl. Sci. 2019, 9, 1648. [Google Scholar] [CrossRef] [Green Version]
- Gu, X.; Cegla, F. Modeling Surface Roughness-Related Uncertainties of Leaky Lamb Wave Clamp-on Ultrasonic Flowmeters. IEEE Trans. Instrum. Meas. 2020, 69, 6843–6852. [Google Scholar] [CrossRef]
- Chen, J.; Zhang, K.; Wang, L.; Yang, M. Design of a High Precision Ultrasonic Gas Flowmeter. Sensors 2020, 20, 4804. [Google Scholar] [CrossRef]
- Raine, A.B.; Aslam, N.; Underwood, C.P.; Danaher, S. Development of an ultrasonic airflow measurement device for ducted air. Sensors 2015, 15, 705. [Google Scholar] [CrossRef]
- Liu, B.; Xu, K.J.; Mu, L.B.; Tian, L. Echo energy integral based signal processing method for ultrasonic gas flow meter. Sens. Actuators A 2018, 277, 181–189. [Google Scholar] [CrossRef]
- Szejba, D.; Bajkowski, S. Determination of Tile Drain Discharge under Variable Hydraulic Conditions. Water 2019, 11, 120. [Google Scholar] [CrossRef] [Green Version]
- Nguyen, T.H.L.; Park, S. Multi-Angle Liquid Flow Measurement Using Ultrasonic Linear Array Transducer. Sensors 2020, 20, 388. [Google Scholar] [CrossRef] [Green Version]
- Zhao, Z.; He, J. Hydraulics, 2nd ed.; Tsinghua University Press: Beijing, China, 2010; p. 251. (In Chinese) [Google Scholar]
- Nie, L.; Wang, D. Soil Analysis, 1st ed.; China Forestry Publishing House: Beijing, China, 2019; p. 13. (In Chinese) [Google Scholar]
- Wang, X. The selection of the velocity of measuring section when the electromagnetic flowmeter measures the flow rate of solid-liquid two-phase fluid. Mater. Metrol. 1997, 4, 20–22. (In Chinese) [Google Scholar]
- Rajita, G.; Mandal, N. Review on transit time ultrasonic flowmeter. In Proceedings of the 2016 2nd International Conference on Control, Instrumentation, Energy & Communication (CIEC), Kolkata, India, 28–30 January 2016. [Google Scholar]
- Arregui, F.J.; Pastor-Jabaloyes, L.; Mercedes, A.V.; Gavara, F.J. Accuracy of Solid-State Residential Water Meters under Intermittent Flow Conditions. Sensors 2020, 20, 5339. [Google Scholar] [CrossRef]
- Zhang, Y.; Guo, J.; Wang, H. The Effect of Sediment in Yellow River on Hydraulic Characteristics of Spray Sprinkler. Water 2020, 12, 1349. [Google Scholar] [CrossRef]
Figure 1.
Three pipe metering devices used in this study. (a) The electromagnetic flowmeter; (b) the ultrasonic flowmeter; (c) the water meter.
Figure 1.
Three pipe metering devices used in this study. (a) The electromagnetic flowmeter; (b) the ultrasonic flowmeter; (c) the water meter.

Figure 2.
Schematic diagram of the test device.

Figure 3.
The relative error between each measuring device and the right triangle weir. (a) C0 sediment concentration; (b) C1 sediment concentration; (c) C2 sediment concentration; (d) C3 sediment concentration; (e) C4 sediment concentration; (f) C5 sediment concentration; (g) C6 sediment concentration.

Figure 4.
The relative error between each measuring device and the right triangle weir. (a) 1.0 m/s; (b) 1.25 m/s; (c) 1.5 m/s.
Figure 4.
The relative error between each measuring device and the right triangle weir. (a) 1.0 m/s; (b) 1.25 m/s; (c) 1.5 m/s.


Figure 5.
The relative error of the measured flow values between each metering device and the right triangle weir. (a) The relative error between electromagnetic flowmeter and the right triangle weir; (b) the relative error between ultrasonic flowmeter and the right triangle weir; (c) the relative error between water meter and the right triangle weir.


Table 1.
Sediment particle gradation table.
| Particle Size (mm) | 0.5~0.25 | 0.25~0.075 | 0.075~0.005 | <0.005 |
|---|---|---|---|---|
| Weight ratio less than a certain size (%) | 29.4 | 46.4 | 21.2 | 3.0 |
Table 2.
The sand concentration in different gradients.
| Series Number | Sand Concentration (kg·m−3) | Percentage by Volume (%) |
|---|---|---|
| C0 | 3.24 | 0.2 |
| C1 | 23.24 | 1.47 |
| C2 | 42.33 | 2.67 |
| C3 | 60.86 | 3.84 |
| C4 | 79.15 | 4.99 |
| C5 | 96.78 | 6.10 |
| C6 | 114.02 | 7.19 |
Note: C0–C6 was the sand content gradient used in the experiment.
Publisher’s Note: MDPI stays neutral with regard to jurisdictional claims in published maps and institutional affiliations. |
© 2021 by the authors. Licensee MDPI, Basel, Switzerland. This article is an open access article distributed under the terms and conditions of the Creative Commons Attribution (CC BY) license (https://creativecommons.org/licenses/by/4.0/).
Share and Cite
MDPI and ACS Style
Su, M.; Jiao, X.; Li, J.; Wu, S.; Wu, T. Accuracy and Reliability Analysis of Pipe Irrigation Metering Device for Sandy Water Source. Water 2021, 13, 947. https://doi.org/10.3390/w13070947
AMA Style
Su M, Jiao X, Li J, Wu S, Wu T. Accuracy and Reliability Analysis of Pipe Irrigation Metering Device for Sandy Water Source. Water. 2021; 13(7):947. https://doi.org/10.3390/w13070947
Chicago/Turabian StyleSu, Mingxiao, Xiyun Jiao, Jiang Li, Shuyu Wu, and Tianao Wu. 2021. "Accuracy and Reliability Analysis of Pipe Irrigation Metering Device for Sandy Water Source" Water 13, no. 7: 947. https://doi.org/10.3390/w13070947
Note that from the first issue of 2016, this journal uses article numbers instead of page numbers. See further details here.