
Evaluation of Dam Water-Supply Capacity in Korea Using the Water-Shortage Index


1
School of Civil, Environmental and Architectural Engineering, College of Engineering, Korea University, Seoul 02841, Korea
2
Department of Civil and Environmental Engineering, College of Engineering, Chung-Ang University, Seoul 06974, Korea
*
Author to whom correspondence should be addressed.
Water 2021, 13(7), 956; https://doi.org/10.3390/w13070956
Submission received: 8 February 2021
/
Revised: 29 March 2021
/
Accepted: 30 March 2021
/
Published: 31 March 2021
(This article belongs to the Special Issue Water Supply Assessment Systems Developing)
Abstract
:This study evaluates the dam water-supply capacity in Korea using the water shortage index. The water-shortage index (SI) and generalized water-shortage index (GSI) used in this study are evaluated and modified slightly by considering both the damage cost due to water-supply failure and the construction cost of water-supply systems in Korea. The modified indices are then applied for performance evaluation of 16 multipurpose dams in Korea, whose results are evaluated using different units: each dam, each river basin, and all dams. In the analysis of the dam level and basin level, water-supply problems are detected in several dams and in some river basins. However, the SI and GSI estimated for all dams are found to be lower than 1. This result indicates that, even though the total amount of storage capacity is enough to satisfy the design supply, water resources are not well spatially distributed in Korea. It is also found that the modified indices are valid to describe the performance of each dam in water deficient regions during occurrence years of major droughts. In conclusion, the SI and GSI can offer alternative ways of evaluating dam water supply under different environmental conditions and potentially help determine optimal water-storage capacity of dams.
1. Introduction
About 70% of the total precipitation is concentrated in the hot summer season from June to September in Korea. As the water supply system in Korea is accustomed to this climate pattern, a slightly smaller rainfall amount during summer could create a very serious problem [1,2,3]. Dams have been built to overcome this problem, mostly since the 1970s. However, a severe water-shortage problem still occurs in Korea. As an example, the drought in 2016 hit the central part of the Korean Peninsula and caused serious water-shortage problem. It was especially serious in the Boryeong dam [4]. Whenever the water-shortage problem occurs, the need for evaluating the overall water resources in Korea arises. However, conventional evaluation methods such as the firm yield (i.e., guaranteed water) and the reliability criterion (i.e., reliability, resilience, and vulnerability) do not provide any practical answer to this question [5,6,7]. It is not easy to determine if new water resources should be developed or not.
The water-shortage problem is worldwide, and various methodologies have been developed to handle this problem. First, direct comparison of water-resource demand and supply has been done to emphasize the water-shortage problem [8,9,10]. Shiklomanov (2000) extended this comparison from the national level to the international level to show the status of water resources worldwide [11]. Various statistical methods have also been applied to evaluate water resources. For example, frequency analysis of drought indices has been done to evaluate the impact of drought on the water-supply capacity [5,12,13,14]. Models have also been developed for the purpose of water-resource evaluation. The Water Evaluation and Planning (WEAP) model is an example that has been applied to various cases worldwide [15,16,17]. In Korea, the WEAP model has also been used, and another model, the Dynamic Water Resources Assessment Tool (DWAT), is also popular [18,19,20]. Recently, more advanced theories like the Bayesian network model has been applied for water-resource or dam-risk analysis [21,22,23]. The fuzzy method, information-gap decision theory, reliability risk analysis, and system-dynamics approach are also frequently mentioned methods for better decision-making for water-resource management and water allocation [24,25,26,27,28,29].
Many indices have also been developed for the purpose of evaluating the water-supply capacity. These indices are well summarized in Pedro-Monzonis et al. [30]. For example, there are three performance indices (i.e., reliability, resiliency and vulnerability) for the dam water-supply capacity [31,32,33,34]. These three indices have been widely applied worldwide [5,6,7,35,36]. Drought and/or water scarcity indices have also been developed for the similar applications of natural water use. Examples of water scarcity/drought indices include the Palmer Drought Severity Index (PDSI), Standardized Precipitation Index (SPI), and Standardized Precipitation Evapotranspiration Index (SPEI) [37,38,39]. The Water Resource Vulnerability Index, Water Poverty Index, and Water Scarcity Index [40,41,42] are used for emphasizing the water-allocation problem.
However, most of these indices cannot consider the economic aspect of the water-shortage problem. It is simply because these indices are derived by considering only the water supply-and-demand conditions such as the design water demand, water supply, dam storage, water shortage, etc. From a practical point of view, only the comparison of the costs of water-shortage damage and developing additional water resources can determine the new dam project. For this purpose, the water shortage index (SI) and generalized water shortage index (GSI) were considered in this study [43,44]. Additionally, when considering the use of the SI and GSI, a question was raised regarding whether these indices can be applied without any modification. In fact, the parameters of the SI and GSI were determined in the US. To answer this question, the authors performed the evaluation study using the information available in Korea and found that the parameters should be modified slightly. The evaluation of the dam water-supply capacity was then done using the modified version of the SI and GSI.
The objective of this study is to evaluate the dam water-supply capacity in Korea using water-shortage indices. The water-shortage indices, the SI and GSI, are modified by considering both the damage cost due to water-supply failure and the construction cost of water-supply systems. The modified version of empirical indices is then applied to a total of 16 multipurpose dams in Korea, the results of which are then used to evaluate the current water-supply capacity of the studied dams. These are the major multipurpose dams in Korea, and are in charge of most domestic and industrial water supply. Finally, the applicability of the water-shortage indices is assessed in terms of the real drought events in Korea.
2. Models of Water Shortage Index
The deficit rate (DR) during a given period is defined as the ratio between the total amount of water shortage (total deficit; TD) and the total amount of design supply (design supply; DS). That is:
In the planning of a reservoir system, it may often be better to use the maximum deficit rate (MDR) or the average deficit rate (ADR) during the entire period than the DR itself for the purpose of water-resource development [45]. In fact, the degree of damage is not linearly proportional to the ratio of water shortage. Thus, MDR or ADR is known to be more closely related to the degree of socioeconomic damage under water-shortage conditions. The water-shortage index (SI) considers this nonlinear behavior of the degree of damage with respect to the ratio of water shortage. The SI proposed by the United States Army Corps of Engineers (USACE) is expressed as follows [43]:
where C is a proportional constant, N is the number of years, SA is the annual deficit, DA is the annual design supply, and k is a constant. This index indicates that the socioeconomic impact of water shortage is proportional to the k-th power of the water-deficit rate. The parameter k is determined by considering the relation between the socioeconomic damage cost and the water-supply cost. In the United States, k is equal to 2, which indicates that the socioeconomic damage from water-supply shortage is proportional to the square of the water-deficit rate. In addition, the proportional constant C is determined by considering the water deficit rate SA/DA. In the United States, C = 100, which indicates that SI is 1 under the water-deficit rate SA/DA at an average of 10%. That is, the deficit rate SA/DA of 10% becomes an important threshold for determining the proportional constant C of the SI. Under this threshold condition, the socioeconomic-damage cost becomes the same as the water-supply cost. For example, if the water shortage occurs every year by 10% over a period of 100 years, SI becomes 1. If the water shortage by 20% occurs for 25 years over a period of 100 years, SI also becomes 1. However, with only one year of 50% water shortage over the 100 years, SI is only 0.25. Here, an SI calculated larger than 1 indicates that there is a need to develop additional water resources in a dam basin.
The Japan Water Resources Development Public Corporation (JWRDPC) introduced the concept of the water deficit per day (DPD), which includes both the water-deficit rate and its duration [46]. This empirical water-shortage index is expressed as follows:
where DRDi is the daily deficit rate (%), Ni is the number of days of continuous deficit, and Σ represents the sum of each index value for water-shortage events during the entire data period. It is known that the emergency volume needs to be secured for satisfying the threshold DPDs when developing water resources in Japan. For the domestic water supply, the threshold DPD is 1500% per day, and for the industrial water supply, it is 2500% per day. For example, 1500% per day of DPD refers to the situation when a 30% water-deficit rate continues for 50 days or a 50% water-deficit rate continues for 30 days.
Finally, Hsu proposed the generalized water-shortage index (GSI) by combining the concepts of SI and DPD as follows [44]:
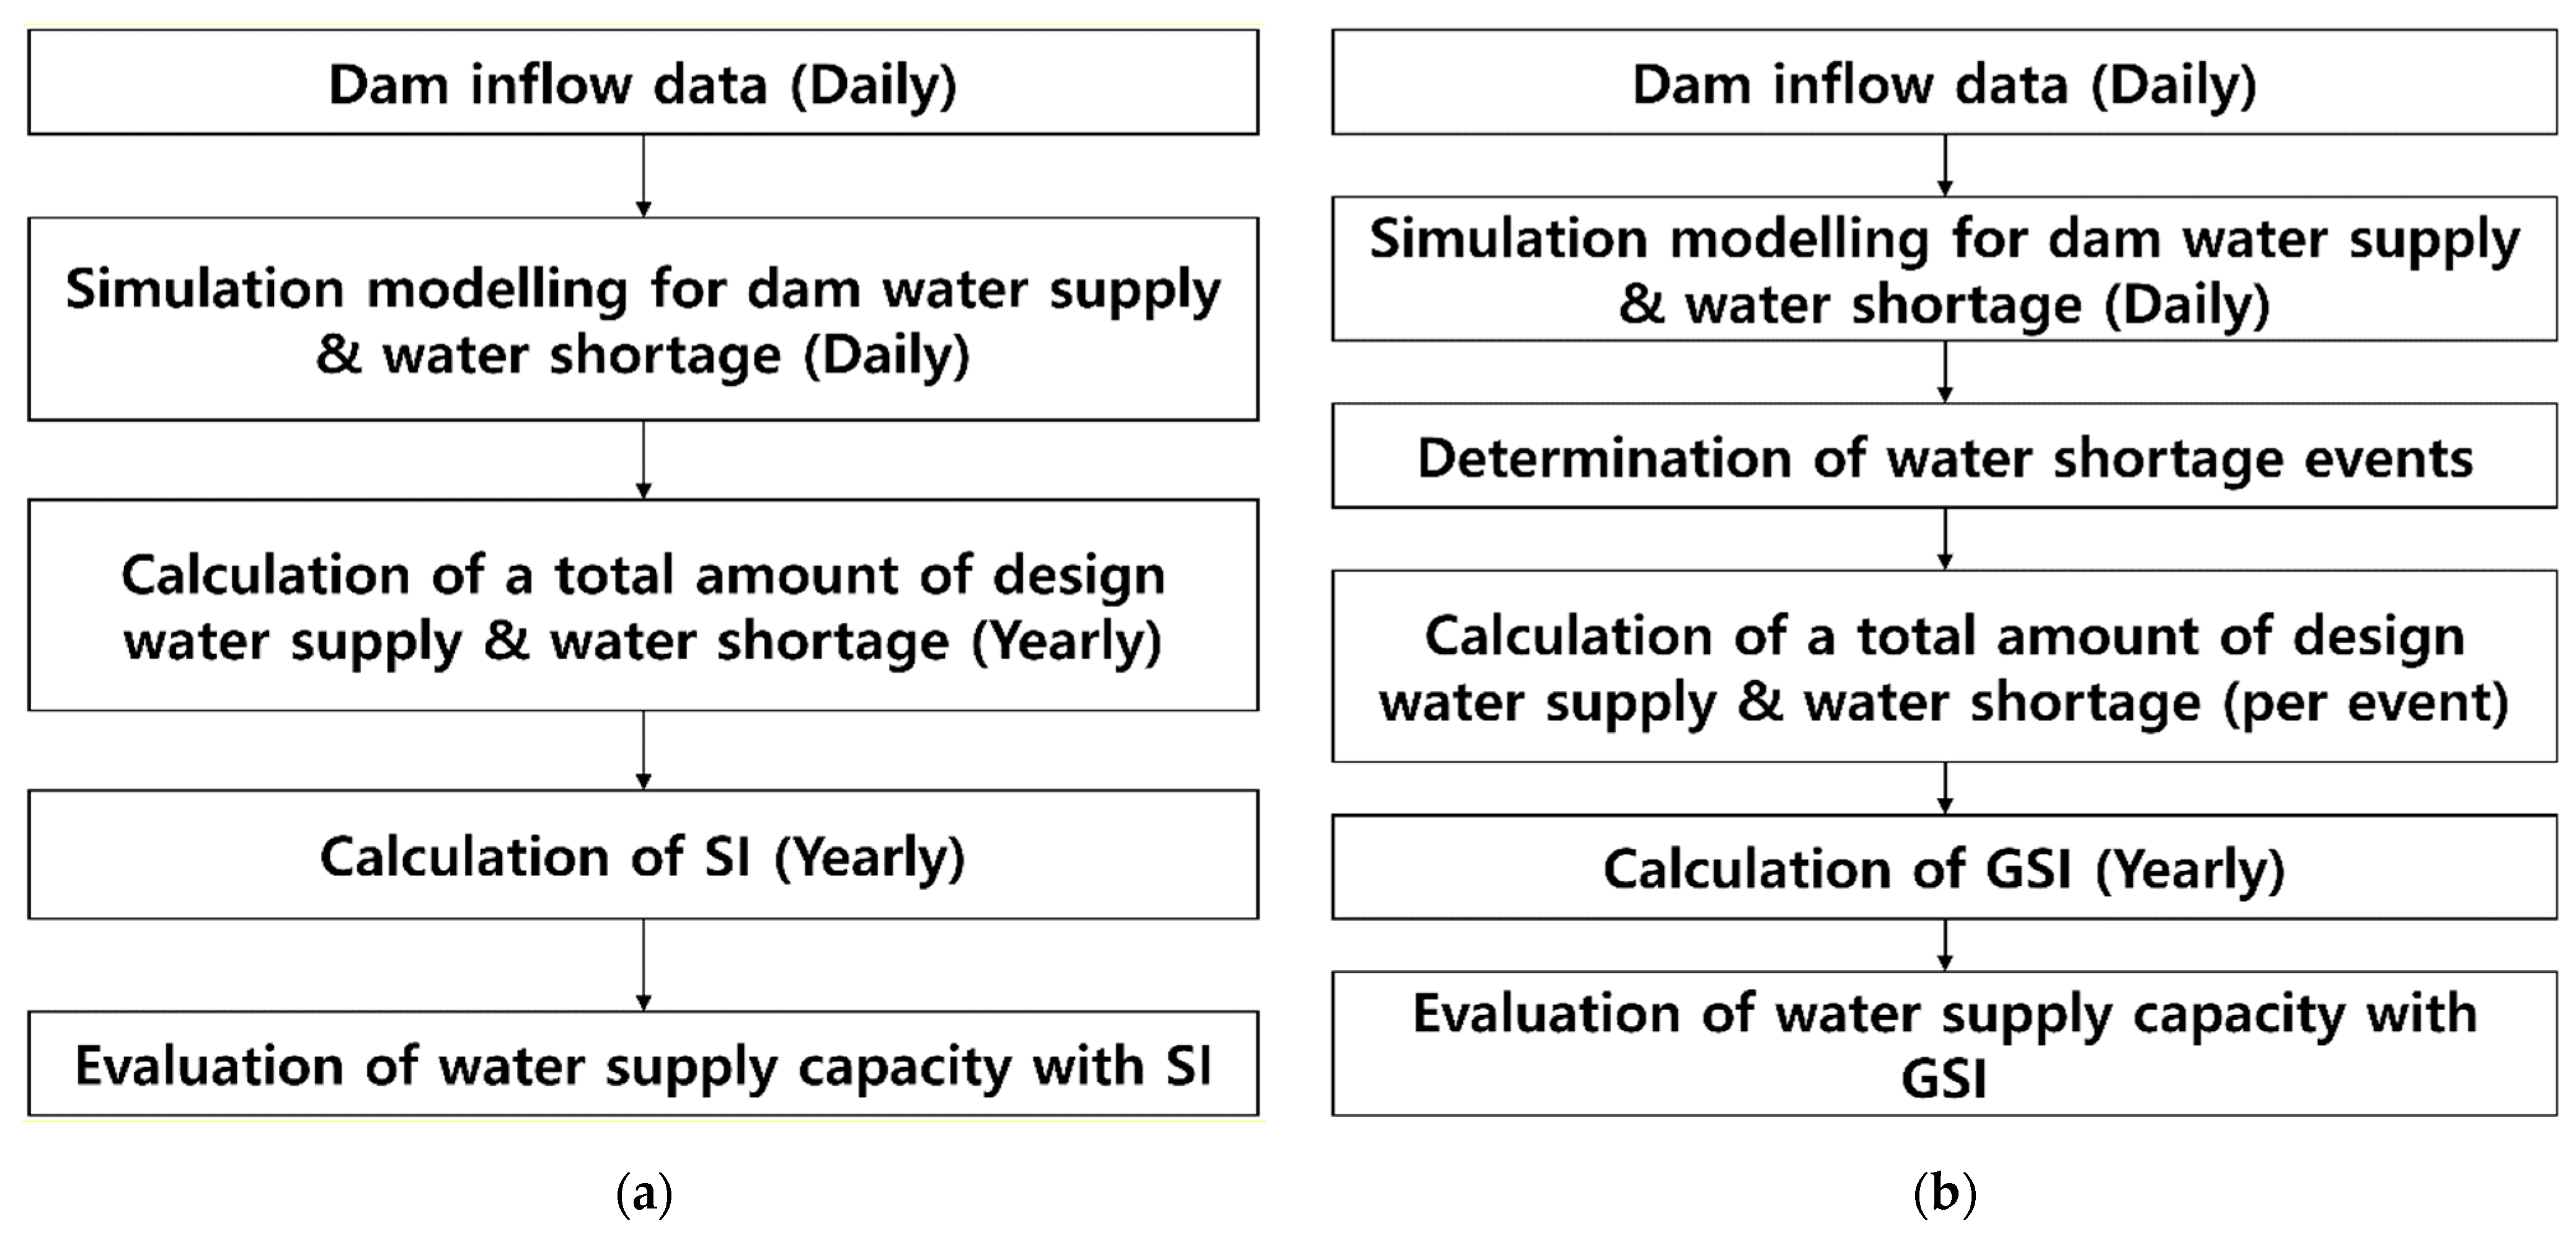
where N is the number of years, k is a constant, DYi is the number of dates in the i-th year (365 or 366), and DPDi is the sum of DPD values in the i-th year. It is noted that this index by Hsu is based on daily data, and thus reflects the duration of the water shortage [44]. The application procedure of the SI and GSI is summarized in Figure 1.
In order to apply the empirical water-shortage index for one country, it is important to check the costs of water-shortage damage and developing additional water resources. This is because the threshold value of SA/DA, which determined the proportional constant of the SI and GSI, indicates the situation that the costs of water-shortage damage and developing additional water resources are even. The cost of water-shortage damage indicates the damage cost depending on the degree of water shortage, which is generally estimated by the interindustry analysis. The cost of developing additional water resources is very dependent upon the cost itself for dam construction.
3. Evaluation of the Water-Shortage Index for Its Application to Korea
3.1. Dams and Data
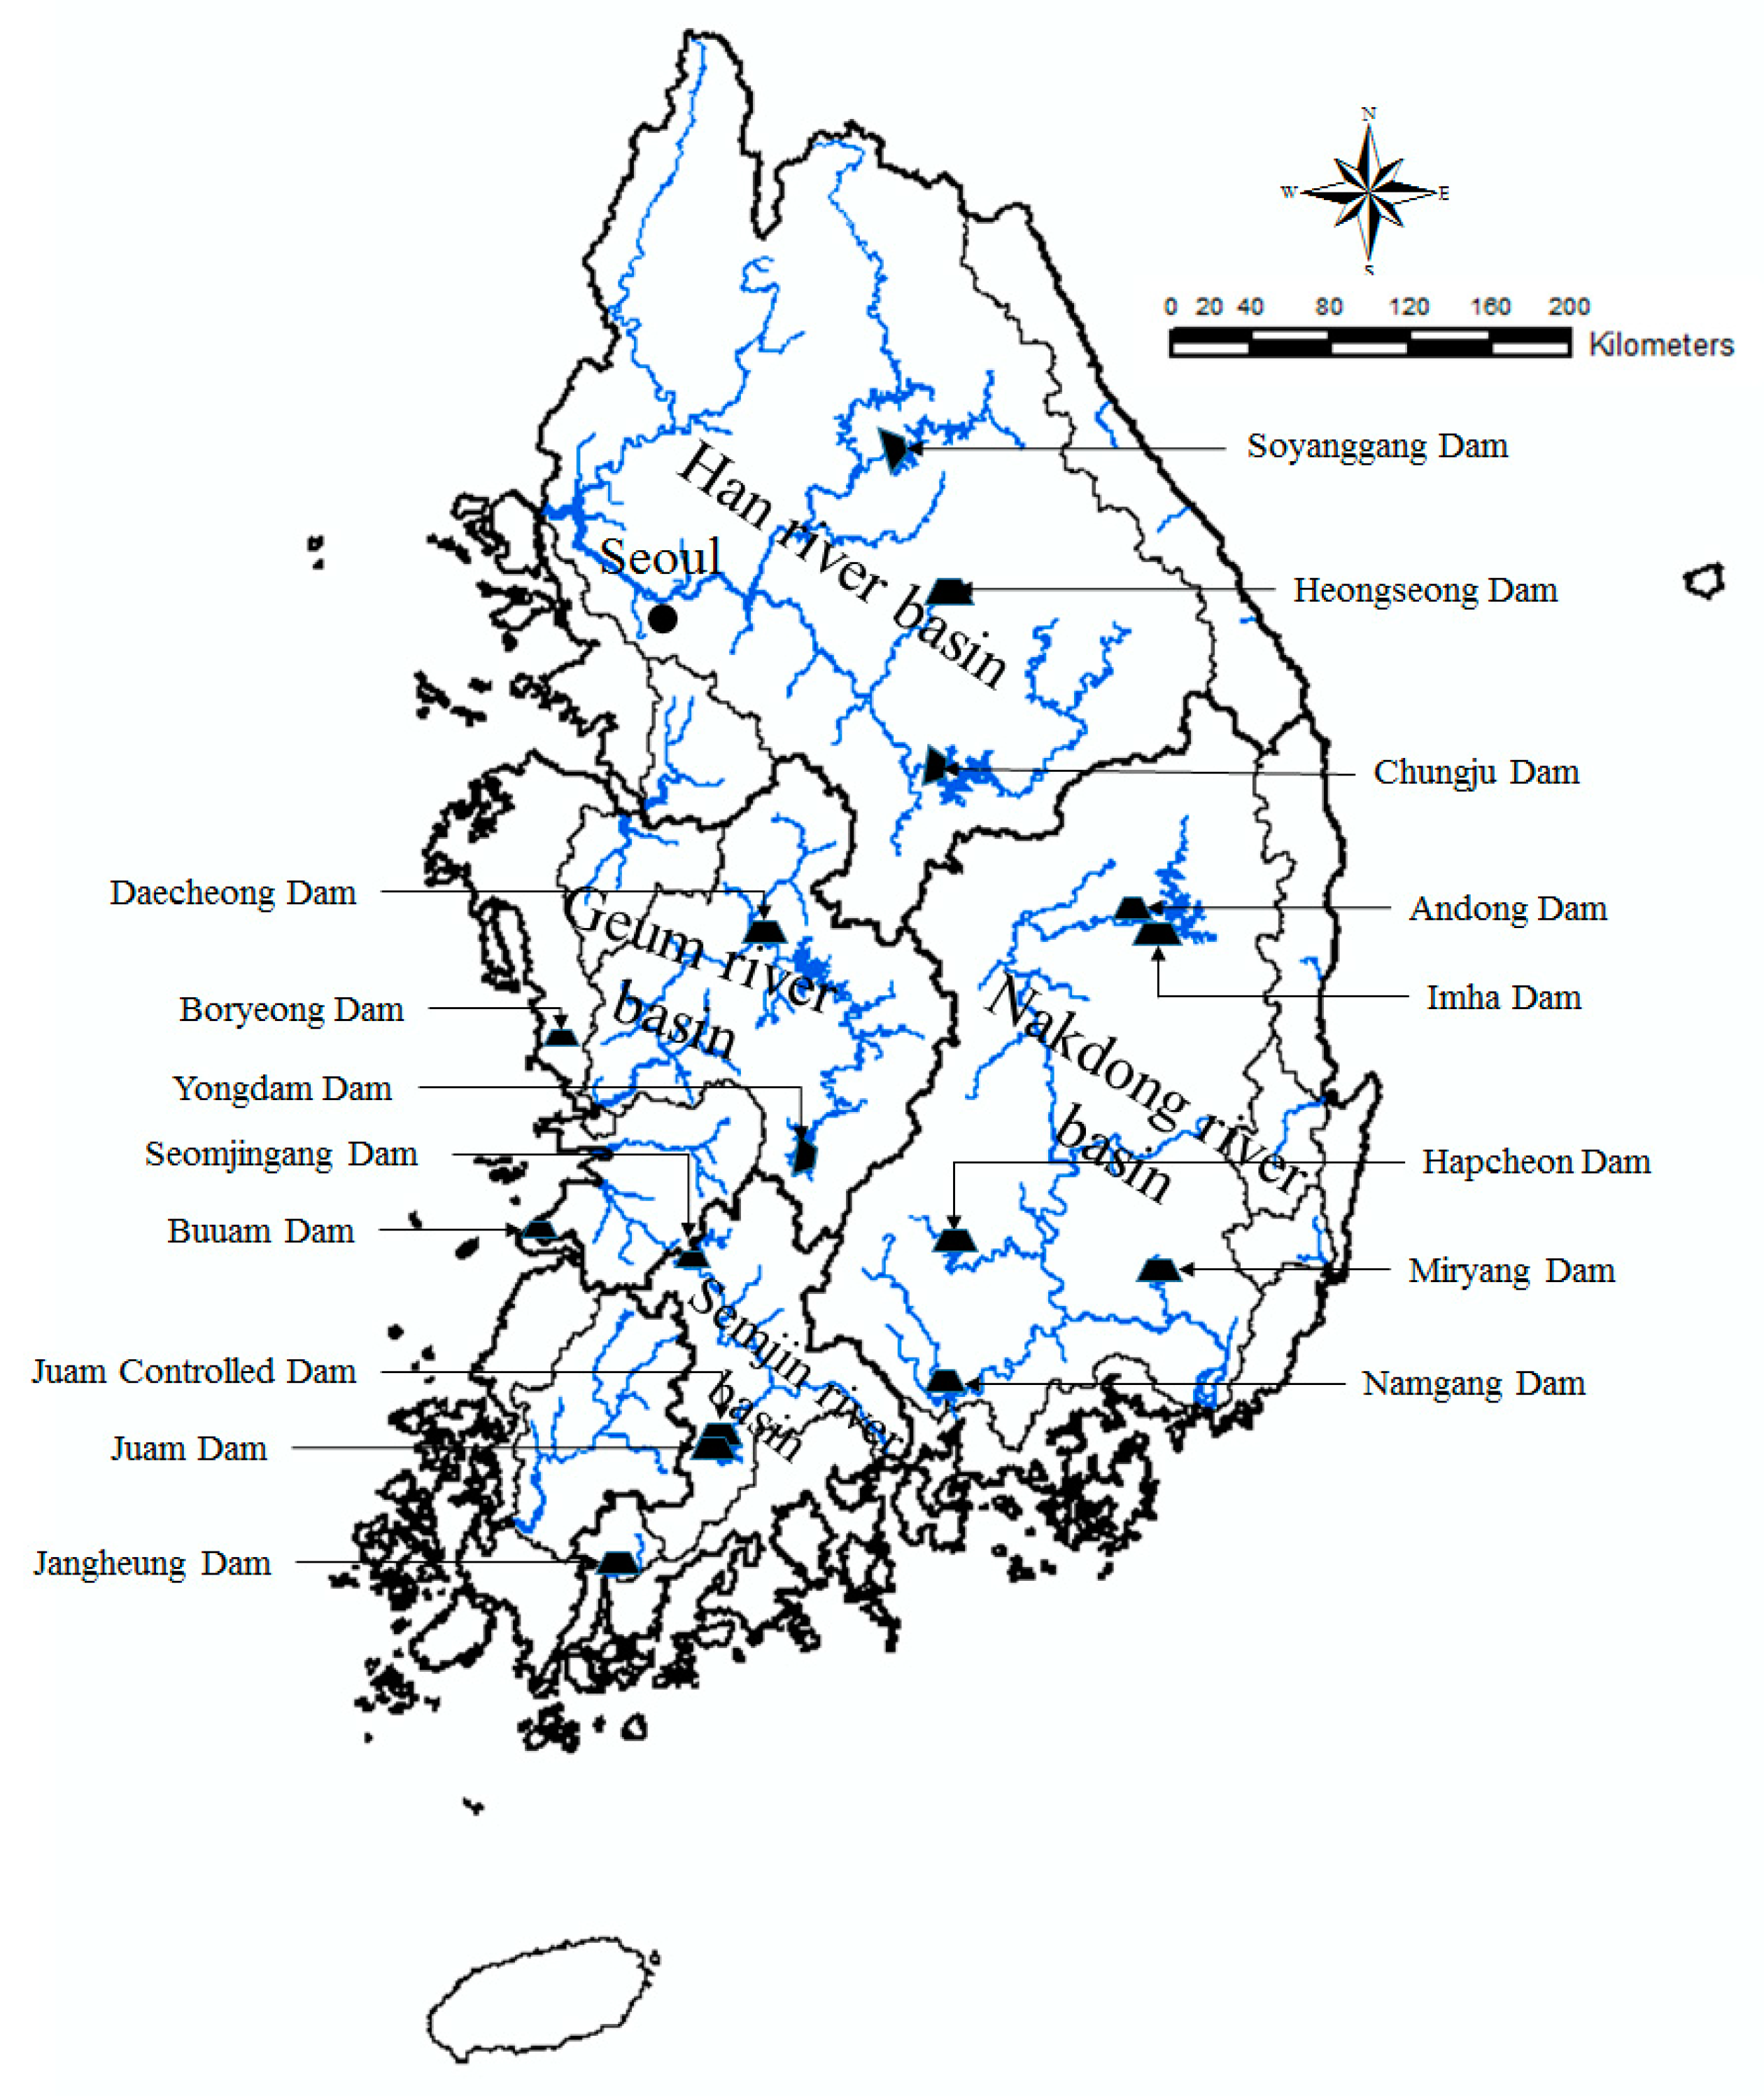
More than 18,000 dams have been constructed in Korea [47]. Most of these are small agricultural dams, with the remainder being single- and multipurpose dams. The multipurpose dams in Korea have been constructed mainly for the purpose of flood control, water supply, and hydropower generation. The total flood-control capacity and total water-supply capacity of the multipurpose dams are about 5 billion tons and 12 billion tons, respectively, which comprise more than 90% and more than 60% of the total dam capacity in Korea [48], respectively. The locations of the multipurpose dams in Korea is summarized in Figure 2.
Three multipurpose dams are in operation in the Han River Basin: Soyanggang Dam, Chungju Dam, and Hoengseong Dam. These dams mainly supply water to the northern part of Korea, including Seoul, the capital of Korea. The basin areas of these dams are 2703 km2, 6648 km2, and 209 km2, respectively [49]. The two multipurpose dams in the Geum River Basin are Daecheong Dam and Yongdam Dam. These dams are located in the middle part of Korea. Their basin areas are 3204 km2 and 930 km2, respectively [50,51].
Five multipurpose dams are in operation in the Nakdong River Basin: Andong Dam, Hapcheon Dam, Imha Dam, Namgang Dam, and Miryang Dam. The water supply from these dams is concentrated in the southeastern part of Korea. Their basin areas are 1584 km2, 925 km2, 1361 km2, 2285 km2, and 104 km2, respectively [52,53,54]. Three multipurpose dams are also in operation (Seomjingang Dam, Juam Dam, and Juam Controlled Dam) in the Seomjin River Basin, located in the southwestern part of Korea. Their basin areas are 763 km2, 1010 km2, and 135 km2, respectively [48,49,55]. In particular, the Juam Controlled Dam was constructed to satisfy the additional demand for domestic and industrial water in the Seomjin River Basin, and to solve the water-storage problems in the Juam Dam Basin. The Juam Controlled Dam is also connected to the Juam Dam through a diversion tunnel, and contributes to hydropower generation with its larger water head drop.
In the western and southwestern parts of Korea, three other multipurpose dams are in operation: Jangheung Dam, Buan Dam, and Boryeong Dam. These dams are not included in the major river basins of Korea, but provide domestic and industrial water and prevent flood damage for a wide range of cities, corresponding to areas of 193 km2, 59 km2, and 164 km2, respectively.
This study applied a reservoir simulation model, HEC-ResSim, to simulate the water-deficit amounts under the operation rule of a single reservoir. HEC-ResSim has been very popular in Korea [45,56,57,58]. This study especially relied on the study by Lee and Yi, who covered eight dams in Korea (Soyanggang, Chungju, Andong, Imha, Hapcheon, Daecheong, Sumjingang, Juam, and Namgang Dams) for their evaluation [45]. This study, however, increased the number of dams and the simulation period. The simulation results were validated by comparing the simulation results in this study with those of Lee and Yi [45].
It is noted that HEC-ResSim can consider reservoir specifications, initial values, inflow situations, and various constraints, and can estimate the potential water supply under the impact of the reservoir system [59]. The main constraints considered in this simulation were that the dam water level cannot exceed the normal high-water level, and the dam outflow stops when the water level is lower than the low-water level. During the flood season (from July to September), however, a restricted water level for the flood season was applied instead of the normal high-water level. This restricted water level was introduced to minimize the flood risk in Korea. Dam design supply was set by following the K-Water [60]. The reservoir system can be described by as a set of state variables during a dam operation period of T. The state equation is defined as follows [45]:
where Xt, It, Dt, Et, and Rt are the dam storage, inflow, intake volume from a dam, evaporation loss, and discharge at time t, respectively. In this study, the simulation was performed for each multipurpose dam in Korea without considering any multireservoir operation (Figure S1). For the evaluation of dam water capacity from a river basin, it was assumed that all the dams in a river basin were merged to be considered as one big reservoir. Detailed information can be found in Lee and Yi [45].
3.2. Damage Cost vs. Construction Cost
3.2.1. Damage Cost under Water-Supply Failure
This study estimated the total damage cost under water-supply failure from the interindustry tables provided by the Bank of Korea. Various conditions of water-supply shortage in the industrial sector were considered for the interindustry analysis because of much smaller damage costs in the agricultural sector and data quality for the failure in the sector of domestic water supply [61]. In the estimation of the total damage cost, it is necessary to consider the total linkage effect while excluding the twice-counted parts, followed by the backward and forward linkages [62]. More detailed information about the interindustry analysis and the backward and forward linkages can be found in Boudhar et al. and Miller and Blair (2009) [63,64]. The results of inter-industry analysis in the specific years of 1990, 1995, 2000, and 2005 are shown in Figure 3.
As can be seen in Figure 3, the total damage cost under water-supply failure had a linear relationship to the degree of water shortage. However, it was also found that the gradient of the slope had increased each year. For example, the total damage cost was KRW 7.69 trillion in 1995 when the water shortage rate was 5%. However, this reached KRW 18.99 trillion in 2000 and KRW 20.92 trillion in 2005 under the same condition. This result indicates that the damage cost is also proportional to the size of the industry, which has been expanded significantly in Korea over the last 20 years.
3.2.2. Construction Cost of 16 Multipurpose Dams in Korea
The total construction cost for water-supply systems at the time of construction and storage characteristics of 16 multipurpose dams in Korea is shown in Table 1. Here, the ratio of storage capacity represents the portion of each dam out of the total storage capacity of 16 multipurpose dams considered in this study. However, a limitation arises when using the total construction costs of each dam, as the ratio of compensation expense to the total construction cost varies depending on the dam site and other conditions at the time of construction. Recently, the ratio of compensation expense has become much higher than previously. The examples in Table 1 show the ratio of compensation expense was 36% for the Buan Dam completed in 1996, but 80% for the Namgang Dam completed in 2003. Therefore, it may not be appropriate to compare the total construction costs of dams by simply converting them to the values corresponding to the specific time.
3.2.3. Relation between Water-Supply Cost and Dam-Construction Cost
To consider all 16 dams to derive the relation between water-supply cost and dam-construction cost, the value conversion should be required. The cost for developing additional water resources, or the construction cost of a dam, may be re-evaluated by considering the inflation rate. However, the cost of water-shortage damage is estimated by interindustry analysis. That is, the cost of water-shortage damage considers the situation of the industry at the time of dam construction, and it can be totally different if the major industry has been changed. As a result, the relation between the cost of water-shortage damage and the cost for developing additional water resources can be different year by year. Instead, this study focused on 1995, when six dams (i.e., Buan, Hoengseong, Boryeong, Miryang, Namgang, and Yongdam Dams) were under construction. Therefore, the total construction cost of each dam was considered without any value conversion.
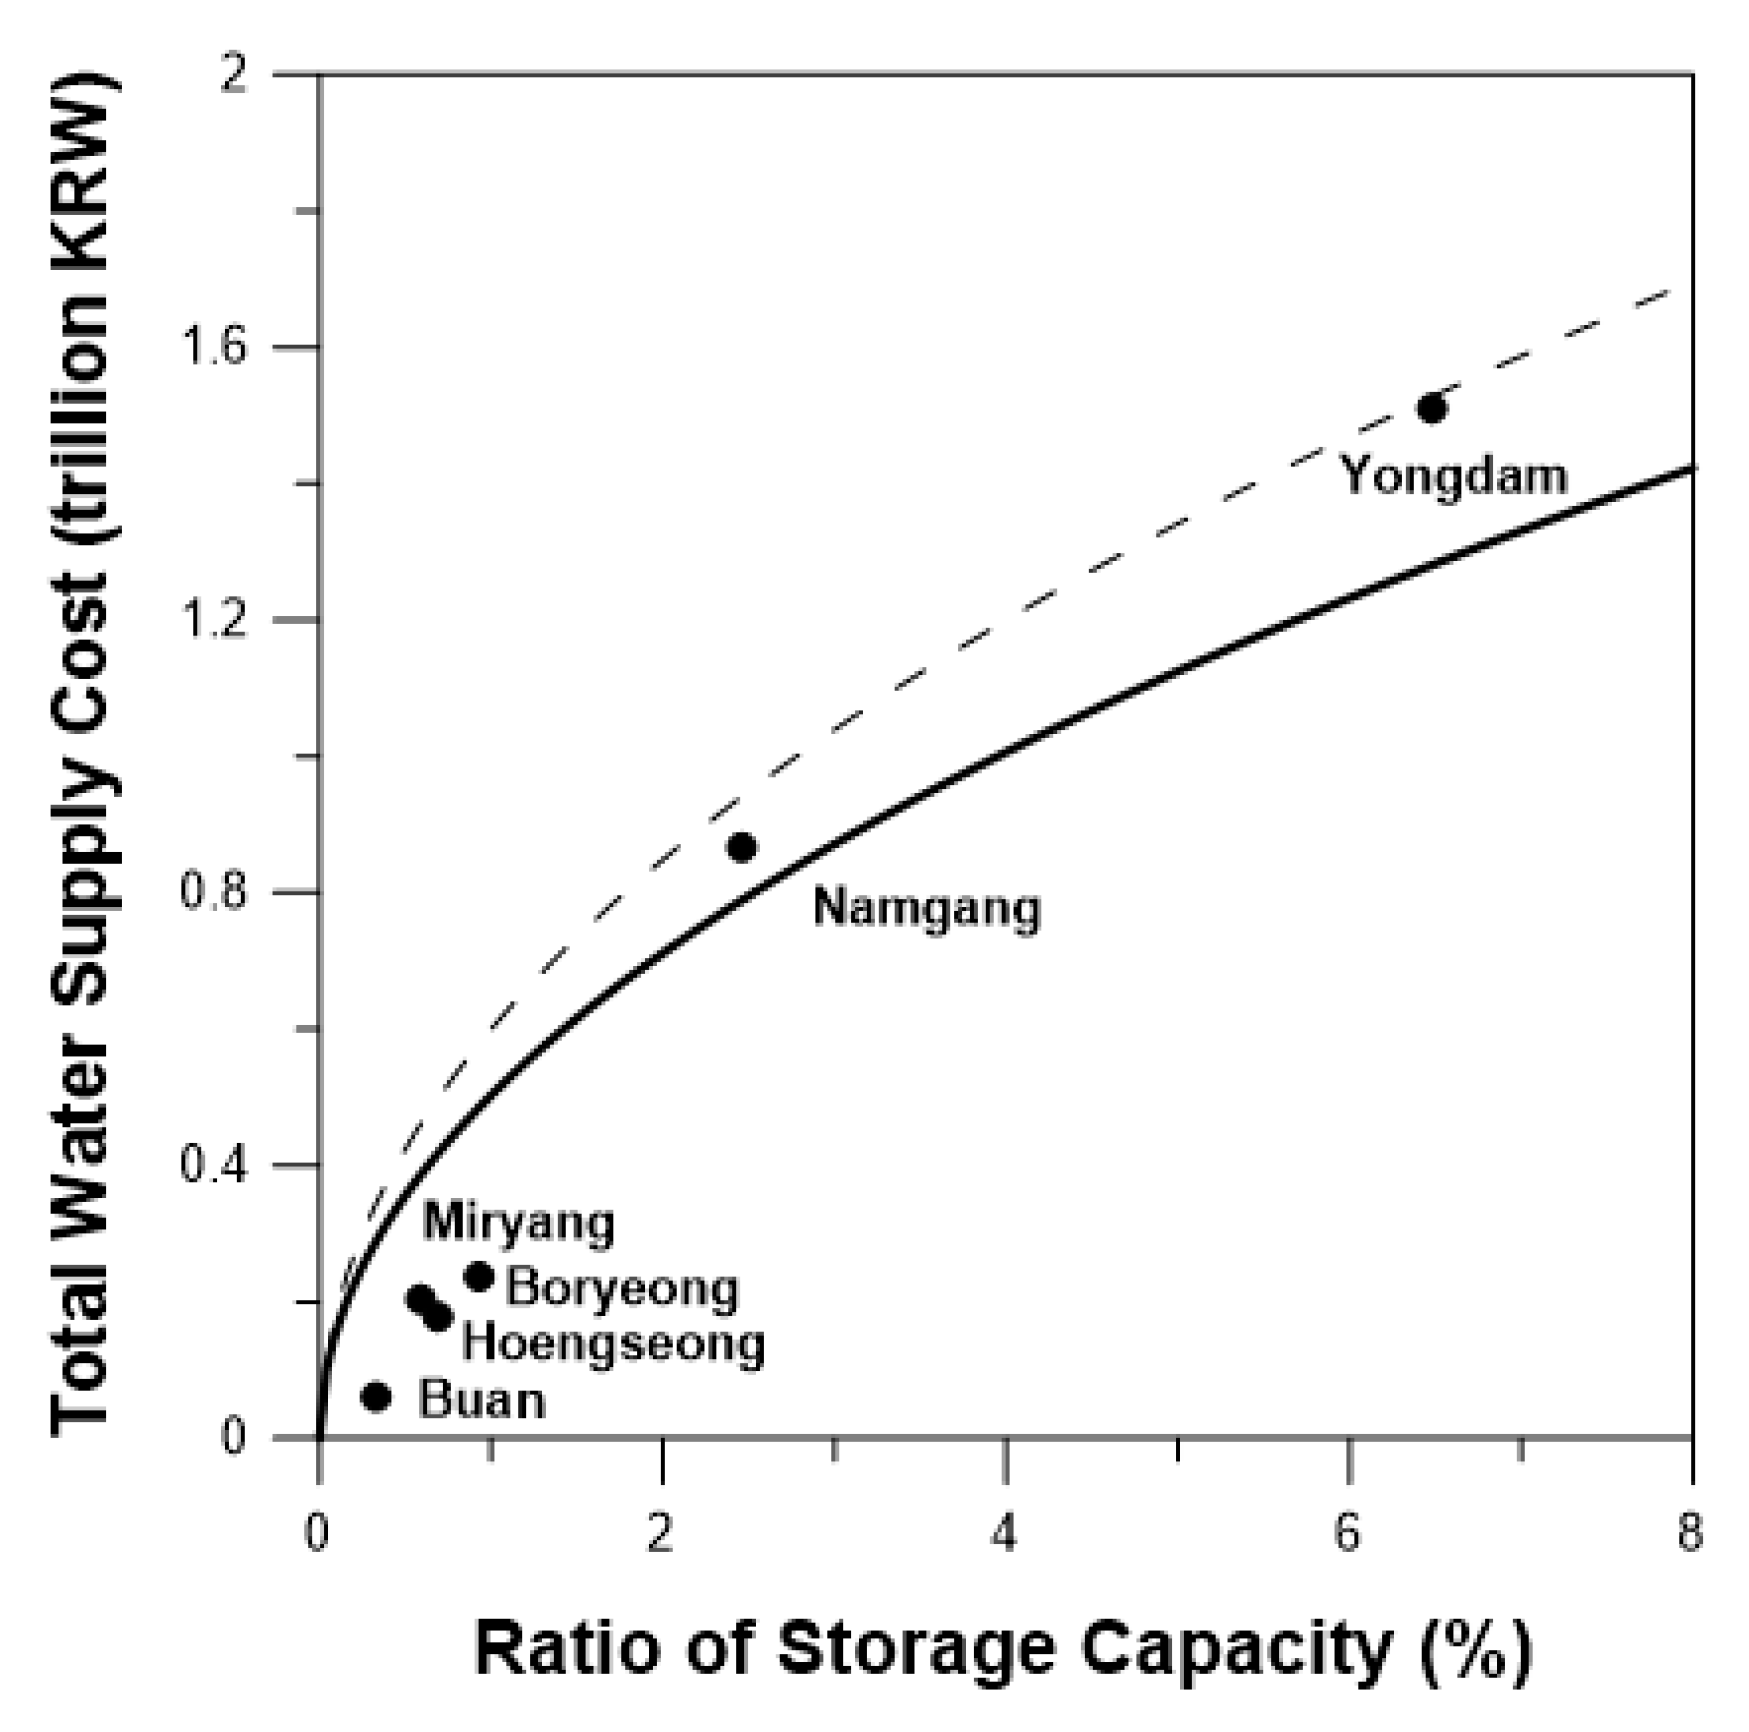
The relation between the ratio of storage capacity of the six dams and the total construction cost of each dam is summarized in Figure 4. As shown in Figure 4, the total cost appears to be proportional to the square root of the ratio of storage capacity. The regression line is shown by the solid line and fits the equation: Y = 5031.25X0.5 (R2 = 0.84). The dotted line represents the envelope line covering the total water-supply cost for all dams considered in this study: Y = 6000X0.5.
Additionally, the authors found one exceptional case of dam construction: the Pyeonglim Dam completed in 2007, with a total storage capacity of 8.47 × 10⁶ m3. This dam is exceptional, since both the dam construction and the waterwork system project were developed and completed at the same time. This project shows that the cost of the waterwork system, including the water-treatment facility, was KRW 80.7 billion, which was similar to the dam construction cost of KRW 108.0 billion [65]. The authors therefore considered the total cost as approximately two times that of the dam construction cost.
3.3. Determination of Threshold SA/DA and Parameter k
3.3.1. Determination of Threshold SA/DA
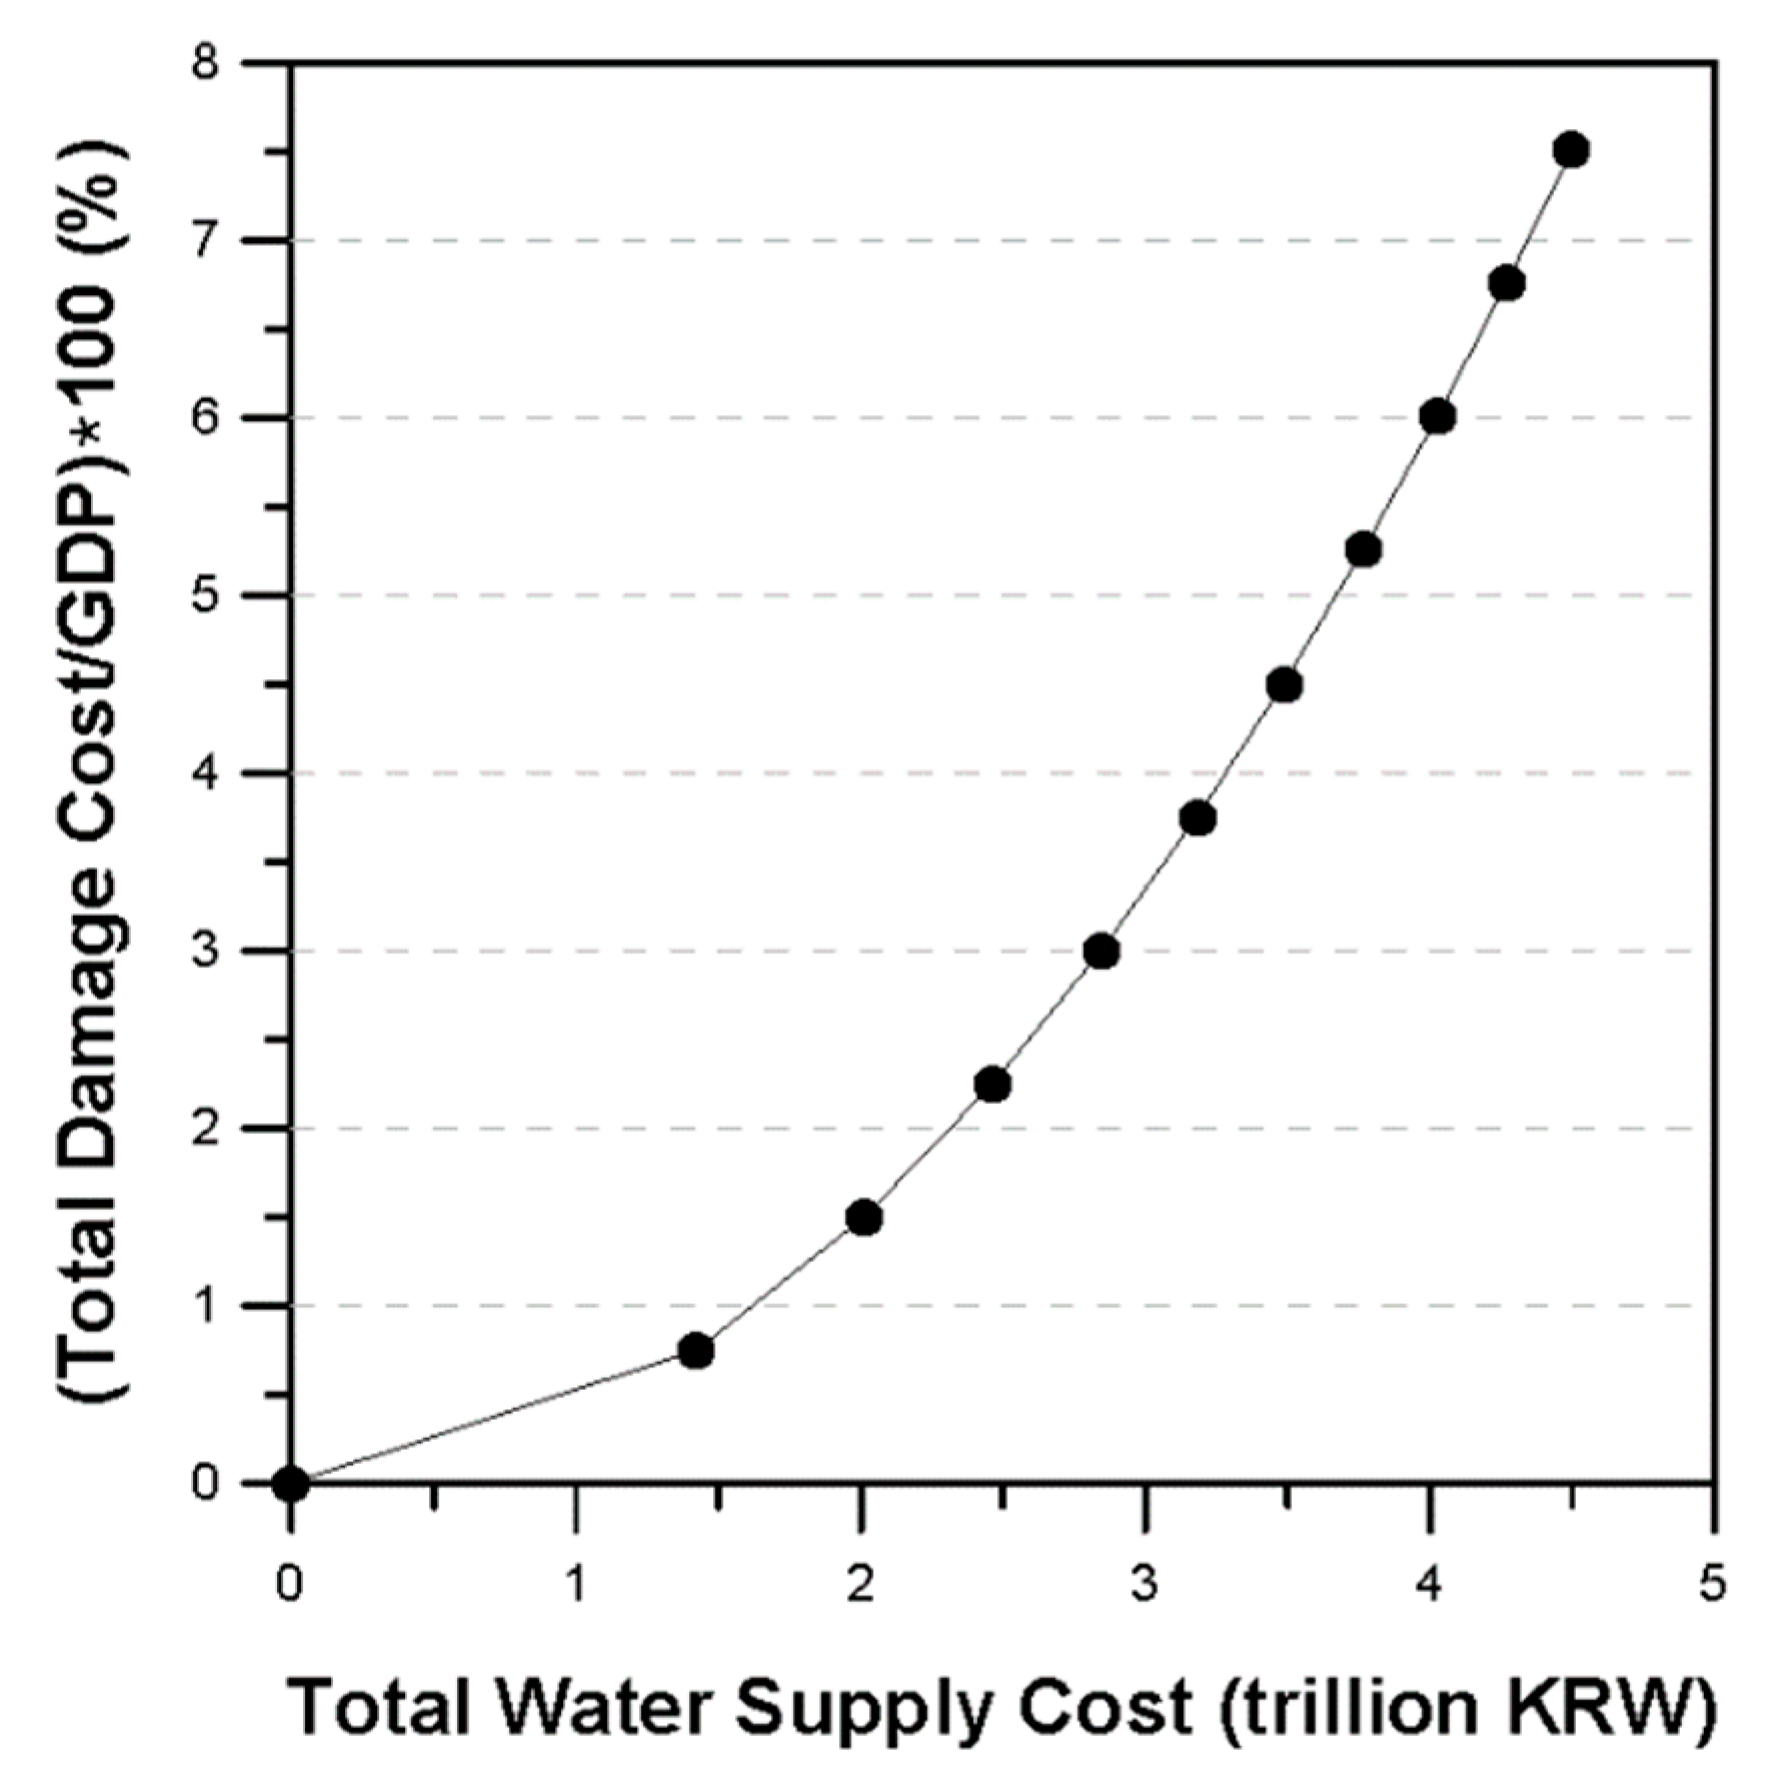
This section explains the procedure for determining the threshold SA/DA and the parameter k, which make the water-shortage index (SI) equal to 1. The relation between the total damage cost and the cost for securing the additional water resources can be obtained from the results of an interindustry analysis and the dam-construction cost in Korea. The result for 1995 is summarized in Figure 5.
First, the interindustry tables were analyzed to determine the characteristics of the threshold SA/DA. In Figure 3, it was confirmed that the total damage cost linearly increases with the degree of water shortage in the water-supply industry. In 1995, the damage cost was approximately KRW 4.2 trillion when the amount of water supply decreased by 5% [66]. That is, the damage cost is represented to be KRW 8.4 trillion under the condition that the amount of water supply decreased by 10%. This can be explained by considering the water-supply facilities, of which their storage capacity can be secured, corresponding to the decreased amount of water supply. For the six dams (Heongseong, Namgang, Miryang, Yongdam, Buan and Boryeong Dams) considered in this study, the total construction cost was about KRW 3.0 trillion, and the total water-supply cost can then be estimated as KRW 6.0 trillion. As the threshold SA/DA is determined when the total damage cost from water shortage is the same as the total water-supply cost, about 7~8% is appropriate as the threshold for the water-shortage index in Korea.
3.3.2. Determination of Parameter k
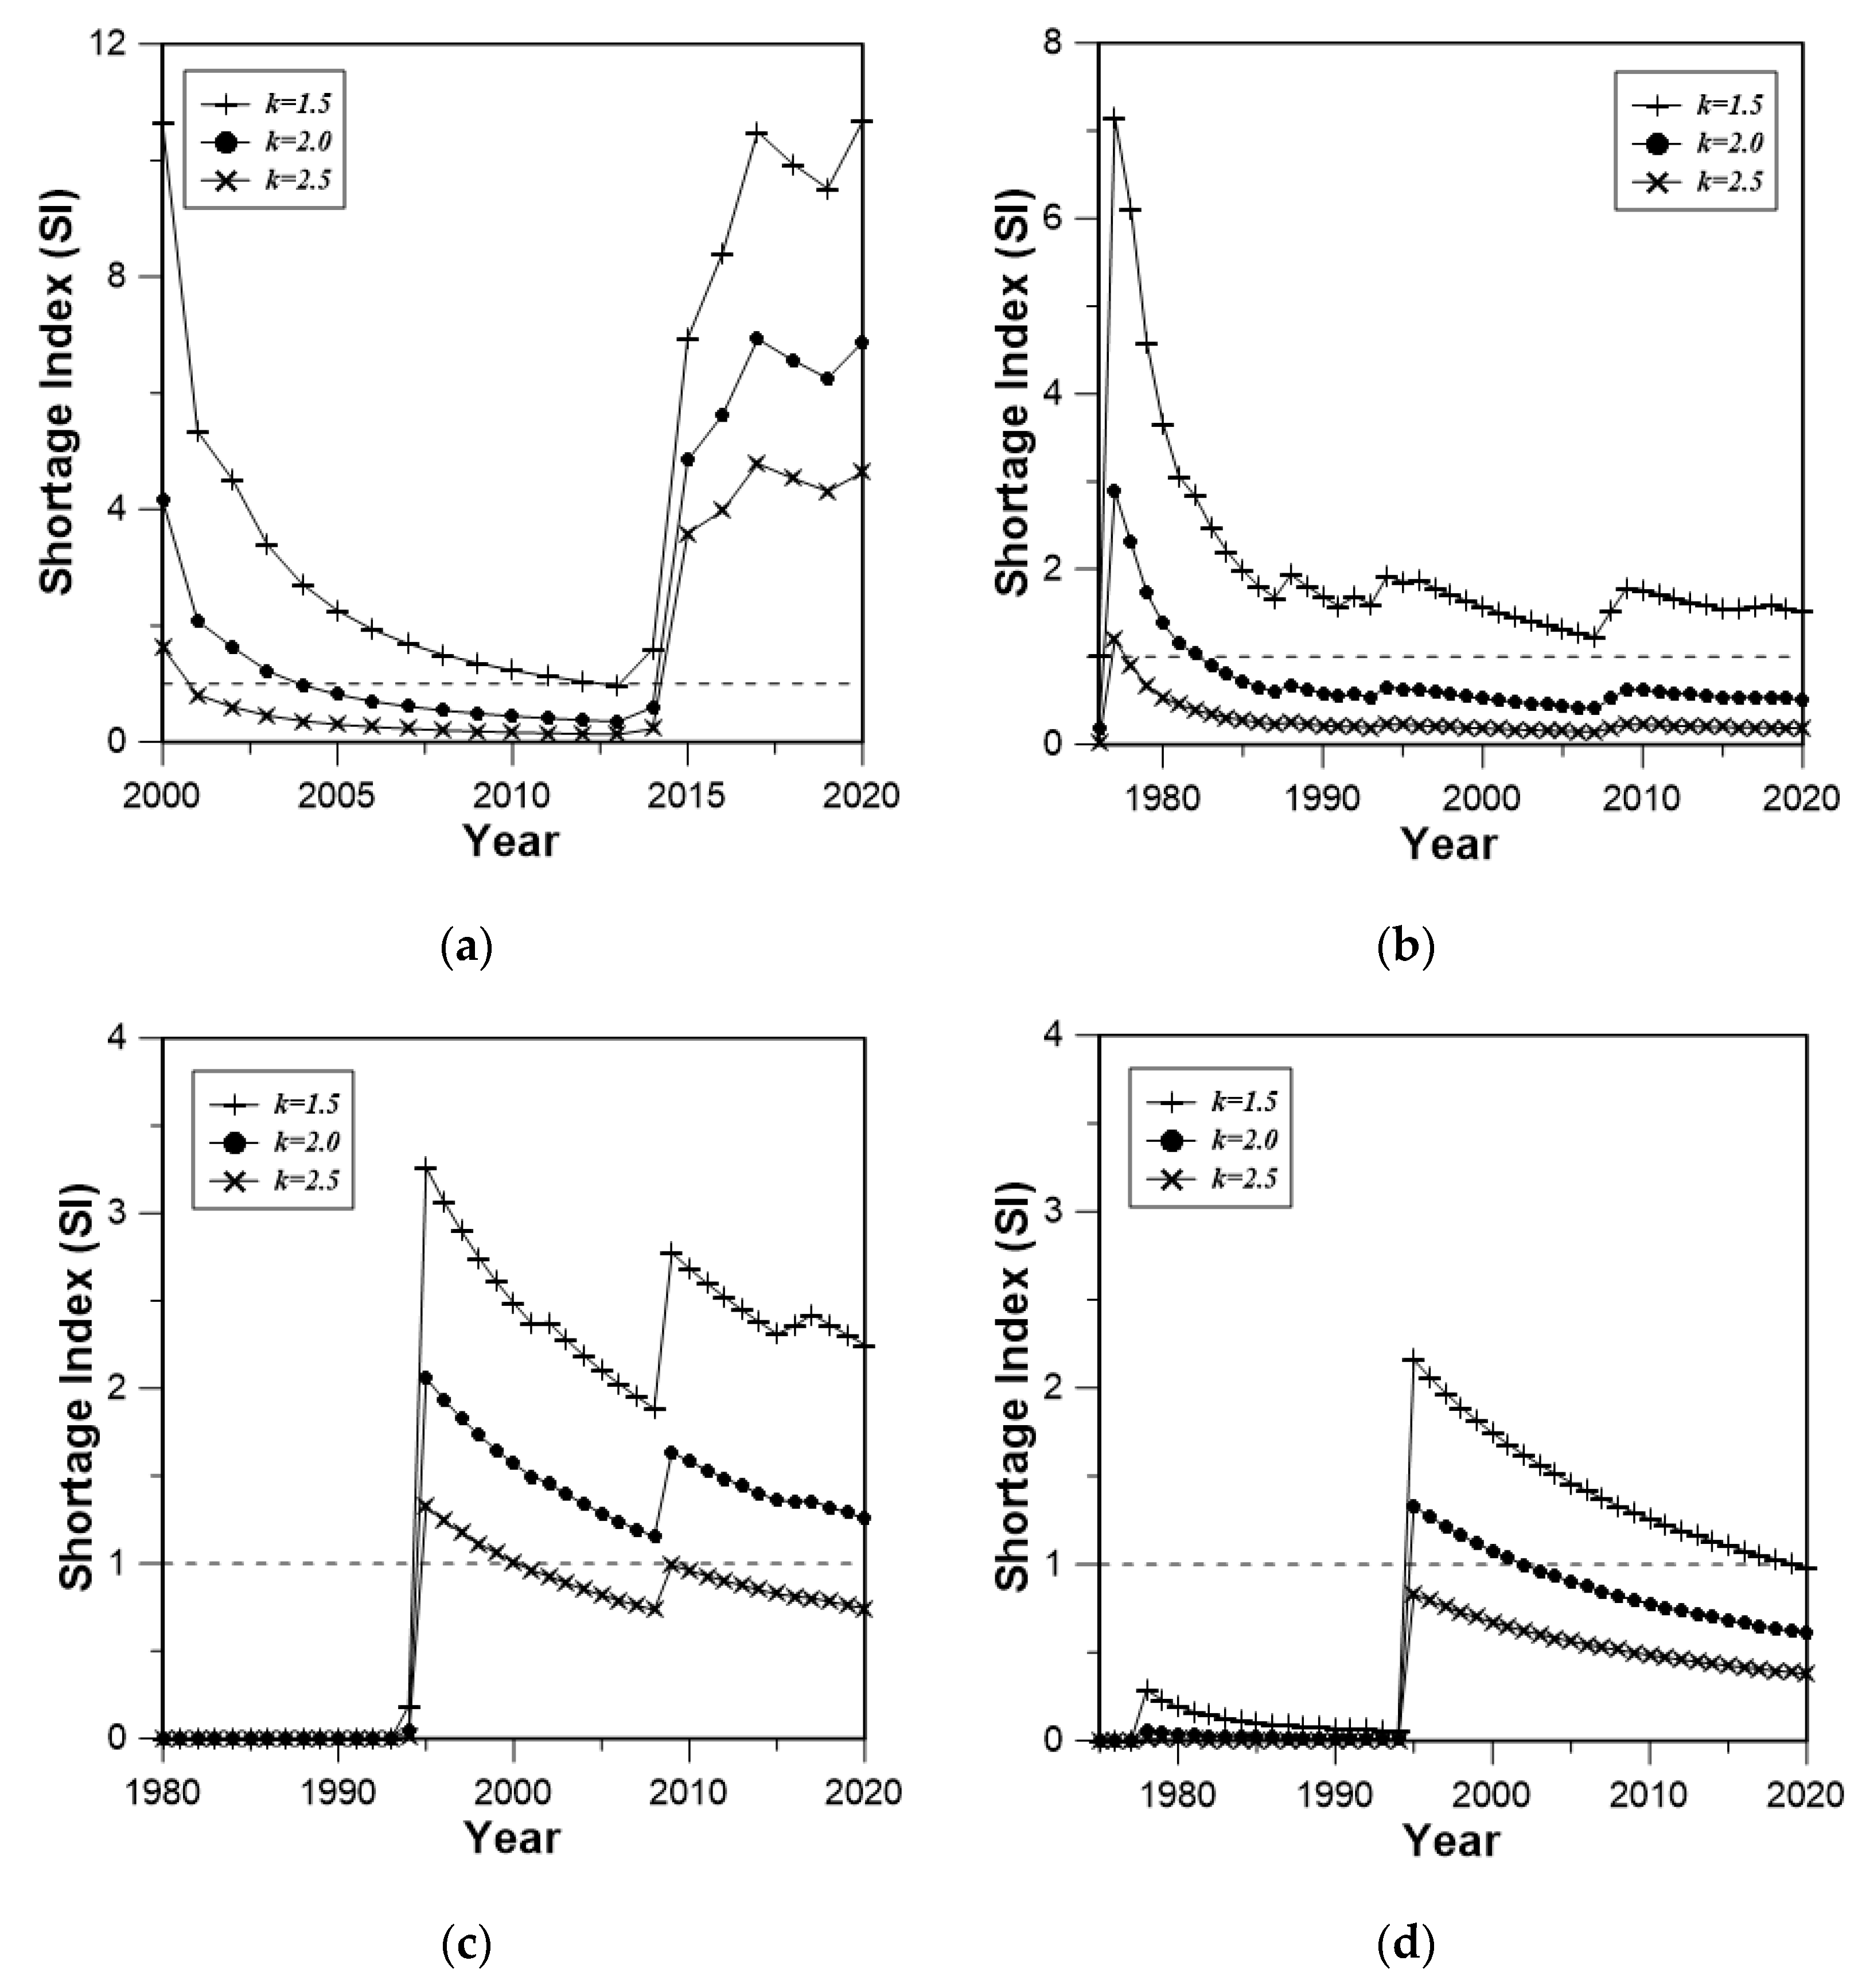
The analysis also needs to determine a parameter k, which reflects the degree of socioeconomic damage in the field of the entire water-supply industry. In this study, the value of k for the water-shortage index in Korea was determined based on the evaluation of how the derived SI explained the actual reality. As the results of SI are differently estimated according to the variation of k, it is possible to select the most probable value by comparing the derived SI and actual reality. In this study, three different values of k; i.e., 1.5, 2.0, and 2.5, were considered. A part of the analysis results is summarized in Figure 6, which shows what value should be used for k. In the case of Namgang Dam, there were no problems related to water supply under the actual drought situations in 1995. However, the value of SI was estimated to be larger than 1 for the case of k = 1.5, which means the additional water resources should be secured. In contrast, the value of SI was estimated to be smaller than 1 for Seomjingang Dam when applying k = 2.5 in 1995, which indicates that additional water resources were not necessary, even though there was a water-supply problem during the drought period in 1995. That is, the water-supply capacity of each dam can be overestimated or underestimated with the cases of k = 1.5 and k = 2.5 with respect to the water-supply problems of each dam during the actual drought period. Therefore, it seems reasonable to assume that k is equal to 2 with regard to the real water-supply capacity of each dam in Korea.
Finally, the threshold SA/DA and the parameter k for the water-shortage index in Korea were determined to be 7.5% and 2, respectively. The proportional constant C was determined to be 178 by considering the new threshold deficit rate SA/DA. The modified versions of the SI and GSI were then applied for the evaluation of the dam water-supply capacity in Korea.
4. Application Results and Discussions
4.1. Results
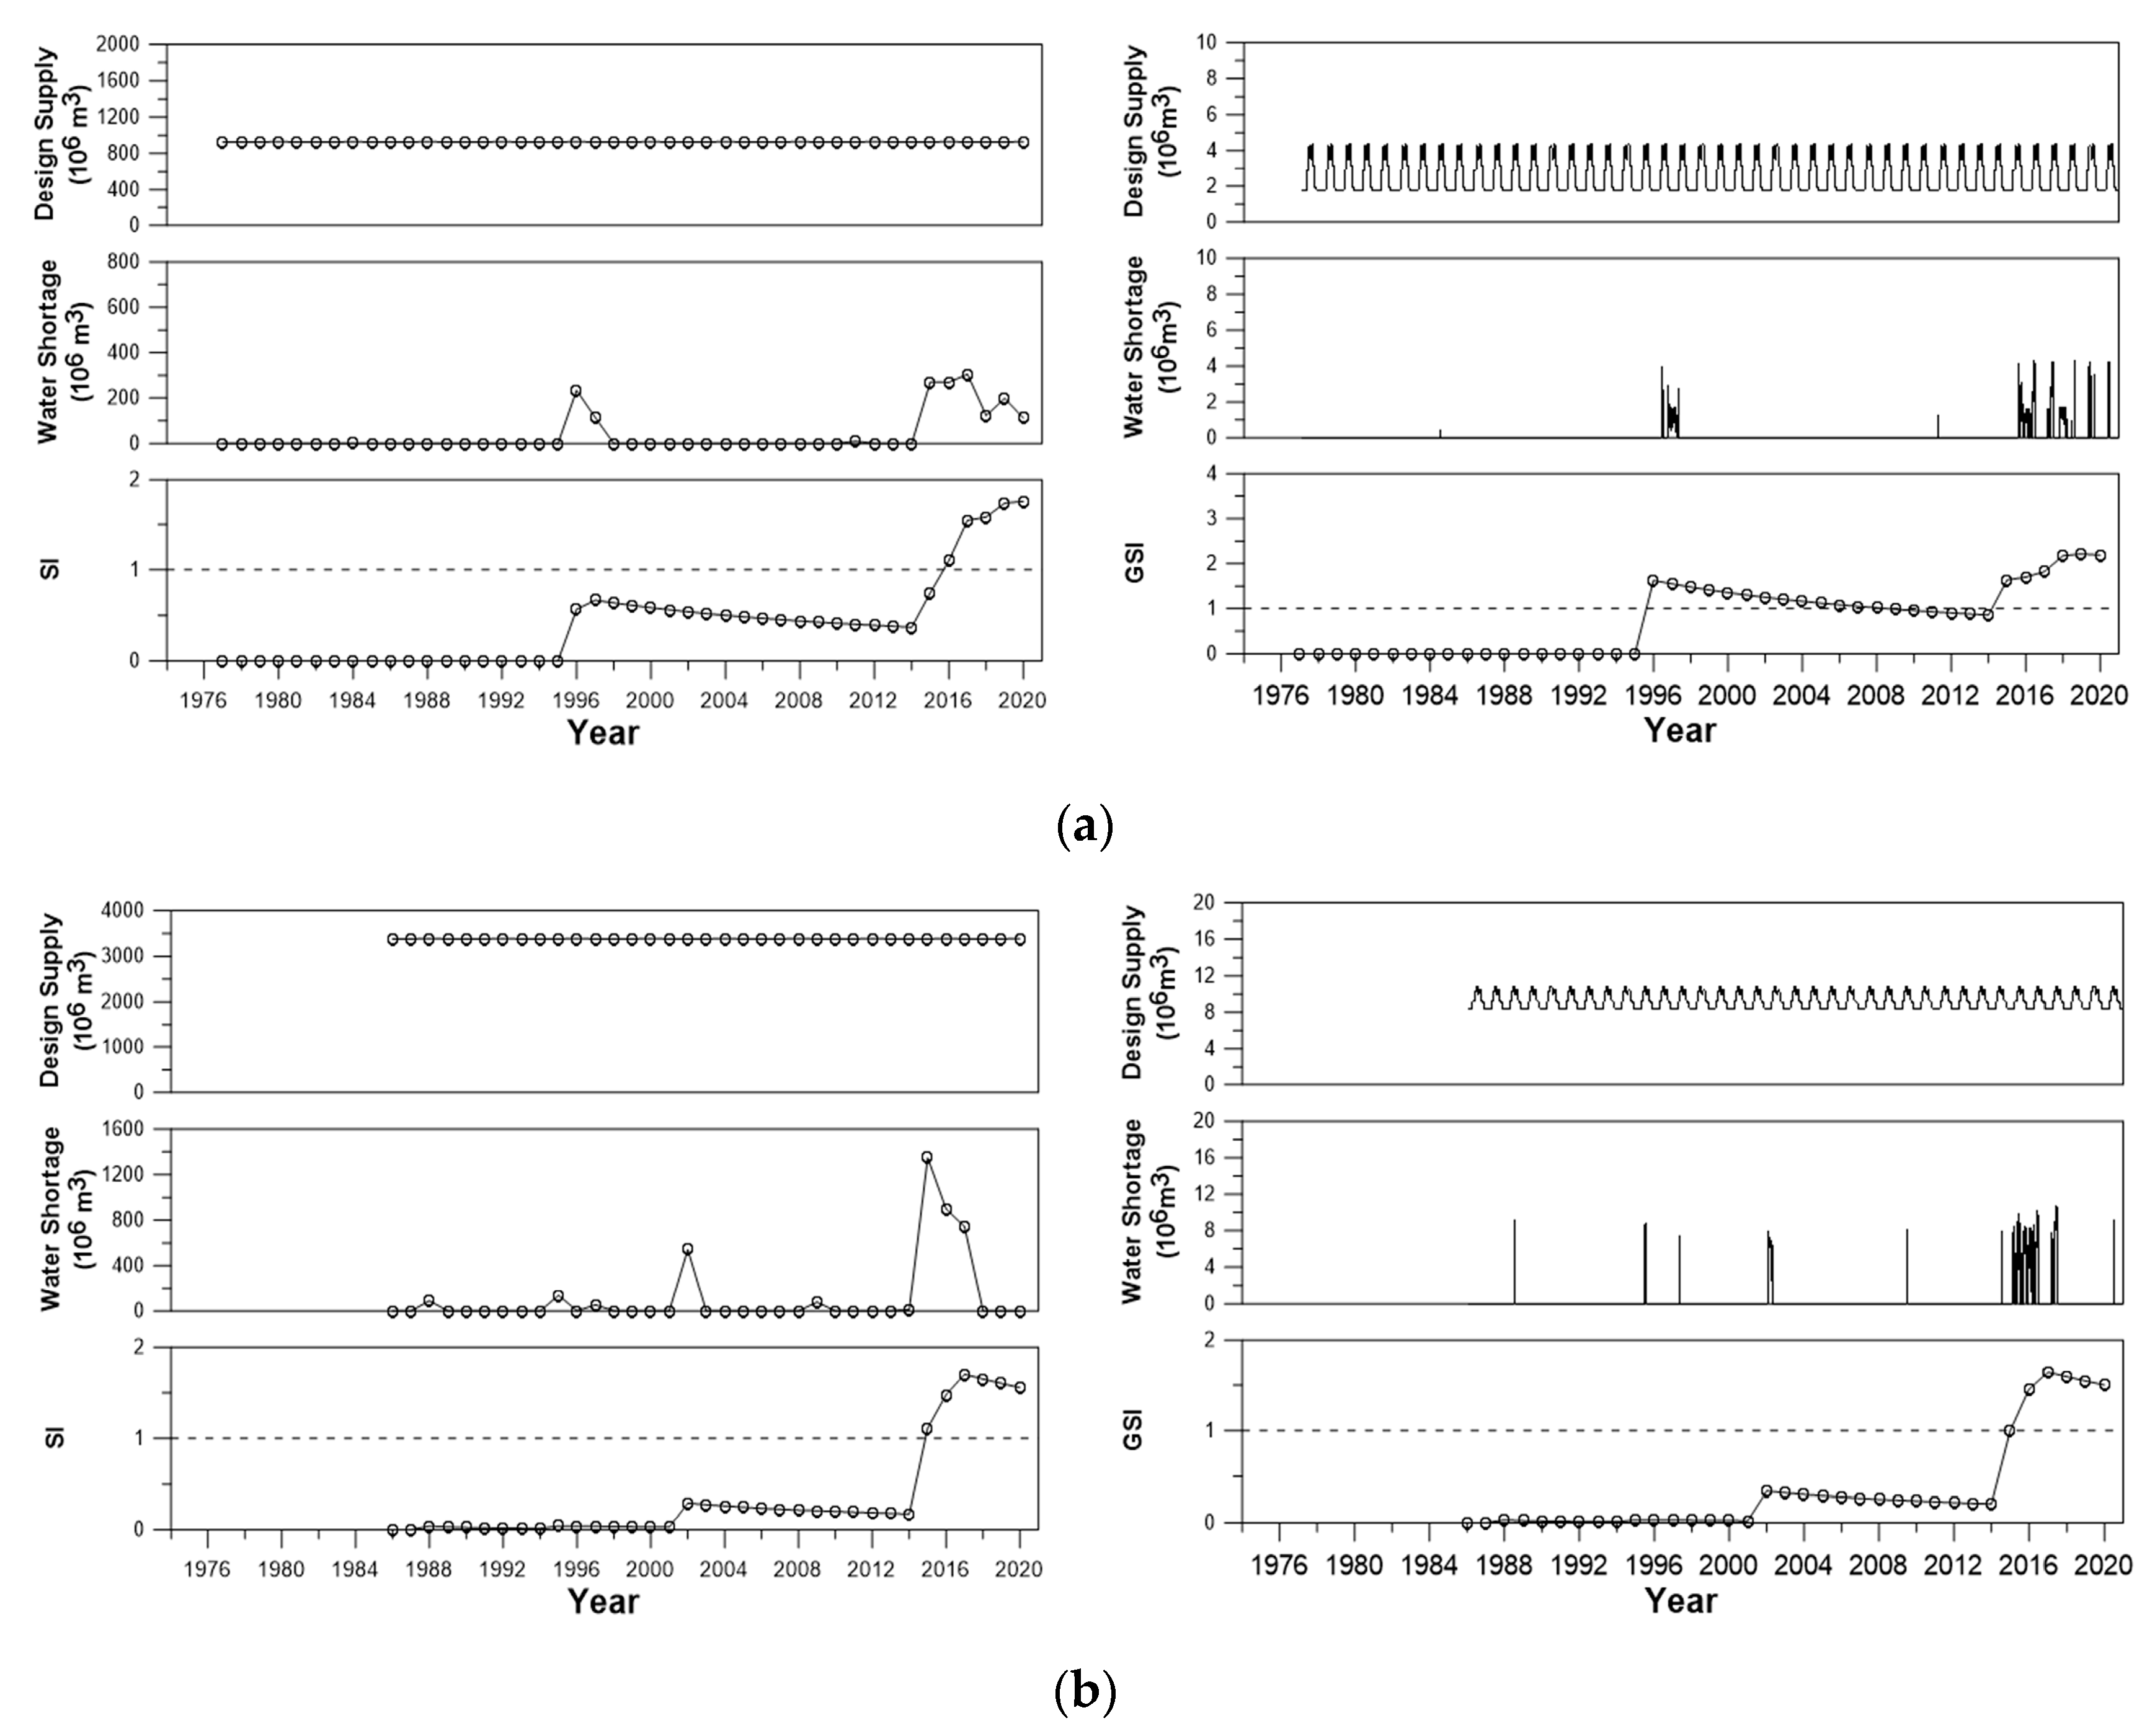
First, the SI and GSI were estimated using the water shortage and design supply data from 16 multipurpose dams to evaluate the water supply capacity of each dam (see Figures S2 and S3 for details). In most dams, SI and GSI were estimated very similarly. Just a few exceptions were found, such as in Andong, Seomjingang, and Daecheong Dams, where the difference was mainly due to the large variation of the daily data. Figure 7 shows the results from two dams as examples, among which one dam showed a rather clear difference between SI and GSI, while the remaining one did not. In fact, the dams with a rather clear difference between SI and GSI were mostly those with high seasonal variation of design water supply. For example, the Andong Dam (Figure 7a) showed a rather large difference between SI and GSI in 1996, when the agricultural drought was known to be very severe in the spring season. Under the condition that the design water supply in spring was small, a rather large deficit rate (even though the deficit amount was not so large) had become amplified in the estimation of GSI. The Chungju Dam (Figure 7b) showed very similar values of SI and GSI over the entire period of analysis, which was mainly because the design water supply remained steady all through the year.
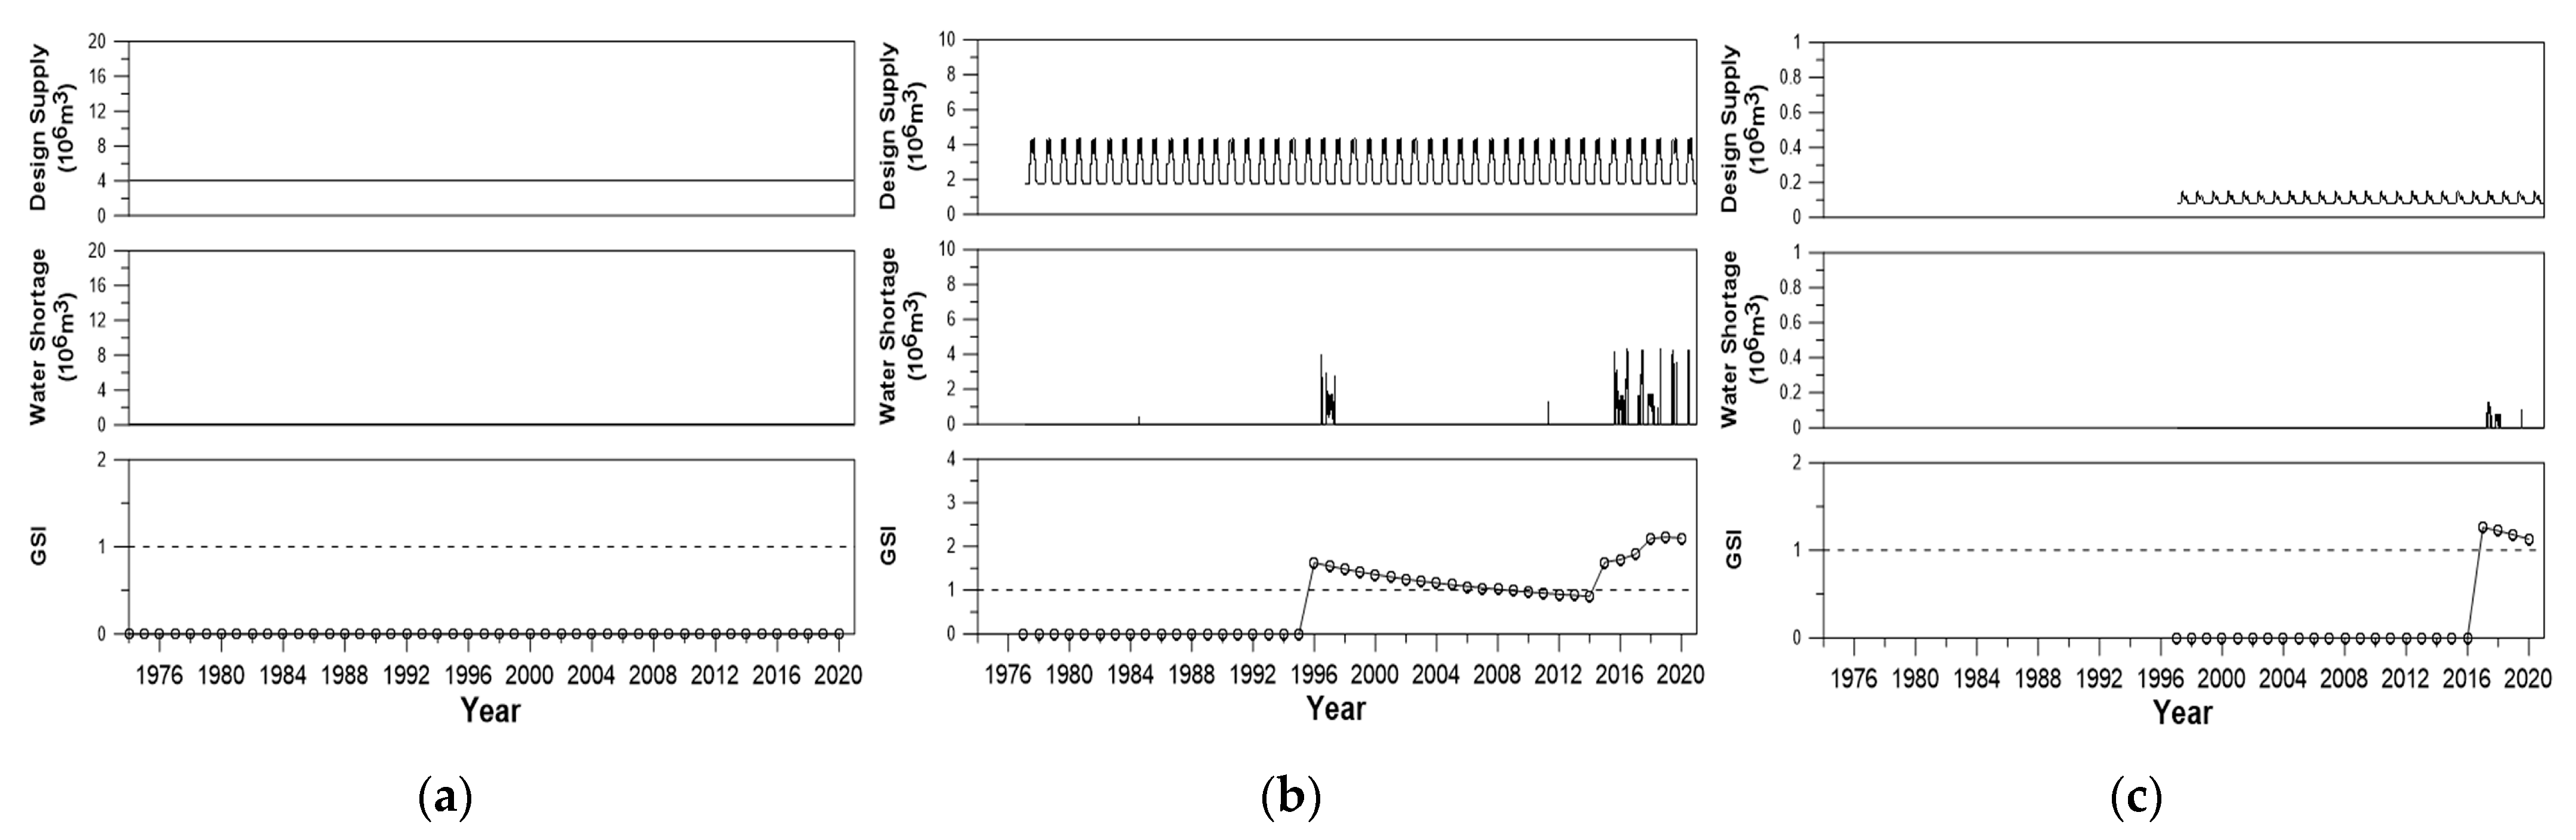
In this study, GSI was used to analyze the dam water-supply capacity. This was simply based on the fact that GSI is more sensitive to the actual temporal variation of drought. It was also considered that the evaluation of the dam water-supply capacity could be more strict [44]. Figure 8 shows derived GSI for several selected dams (Figure S3 provides the results for the remaining dams). The derived GSI showed that the 16 dams could be classified into three types: GSI always less than 1 (Type 1), GSI higher than 1 just once (Type 2), and GSI higher than 1 more than once (Type 3). As can be found in these figures, there were no water-shortage problems in the Soyanggang Dam during the period from 1974 to 2020, even in 2002 and 2015, when the drought was extremely severe in the Han River Basin. For those dams like Seomjingang, Juam, Juam Controlled, and Jangheung Dams, the GSI was estimated to be smaller than 1 during the entire period of analysis. This indicates that these dams secured sufficient storage capacity for the design supply. However, for the dams corresponding to Type 2, such as the Chungju, Heongseong, Namgang, Yongdam, Buan and Boryeong Dams, the GSI was estimated to be higher than 1 just once, indicating that the design supply could not be satisfied intermittently. Type 3 dams like the Andong, Hapcheon, Imha, Miryang and Daecheong Dams, whose GSI was higher than 1 more than once, consistently experienced water-shortage problems during the entire period of data analysis. In particular, the GSI values were estimated to be over 10 in the Hapcheon and Imha Dams, indicating that the water-shortage problem was quite serious.
Among the 16 multipurpose dams in Korea, 14 are located within four river basins, i.e., the Han, Nakdong, Geum and Seomjin River Basins. The SI and GSI were estimated at the basin level. Estimation results of GSI for major river basins in Korea are summarized in Figure 9 (Figure S4 also shows the same, but with the results of SI). Here, the results are based on the sum of water shortage and the sum of design supply corresponding to each river basin; however, the effects of multi-reservoir operation were not considered in the calculation. These figures show that no water-supply problems were recorded in the Han and Seomjin River Basin during each data period. However, the values of GSI for the Nakdong and Geum River Basins were estimated to be higher than 1, indicating the occurrence of water-supply problems.
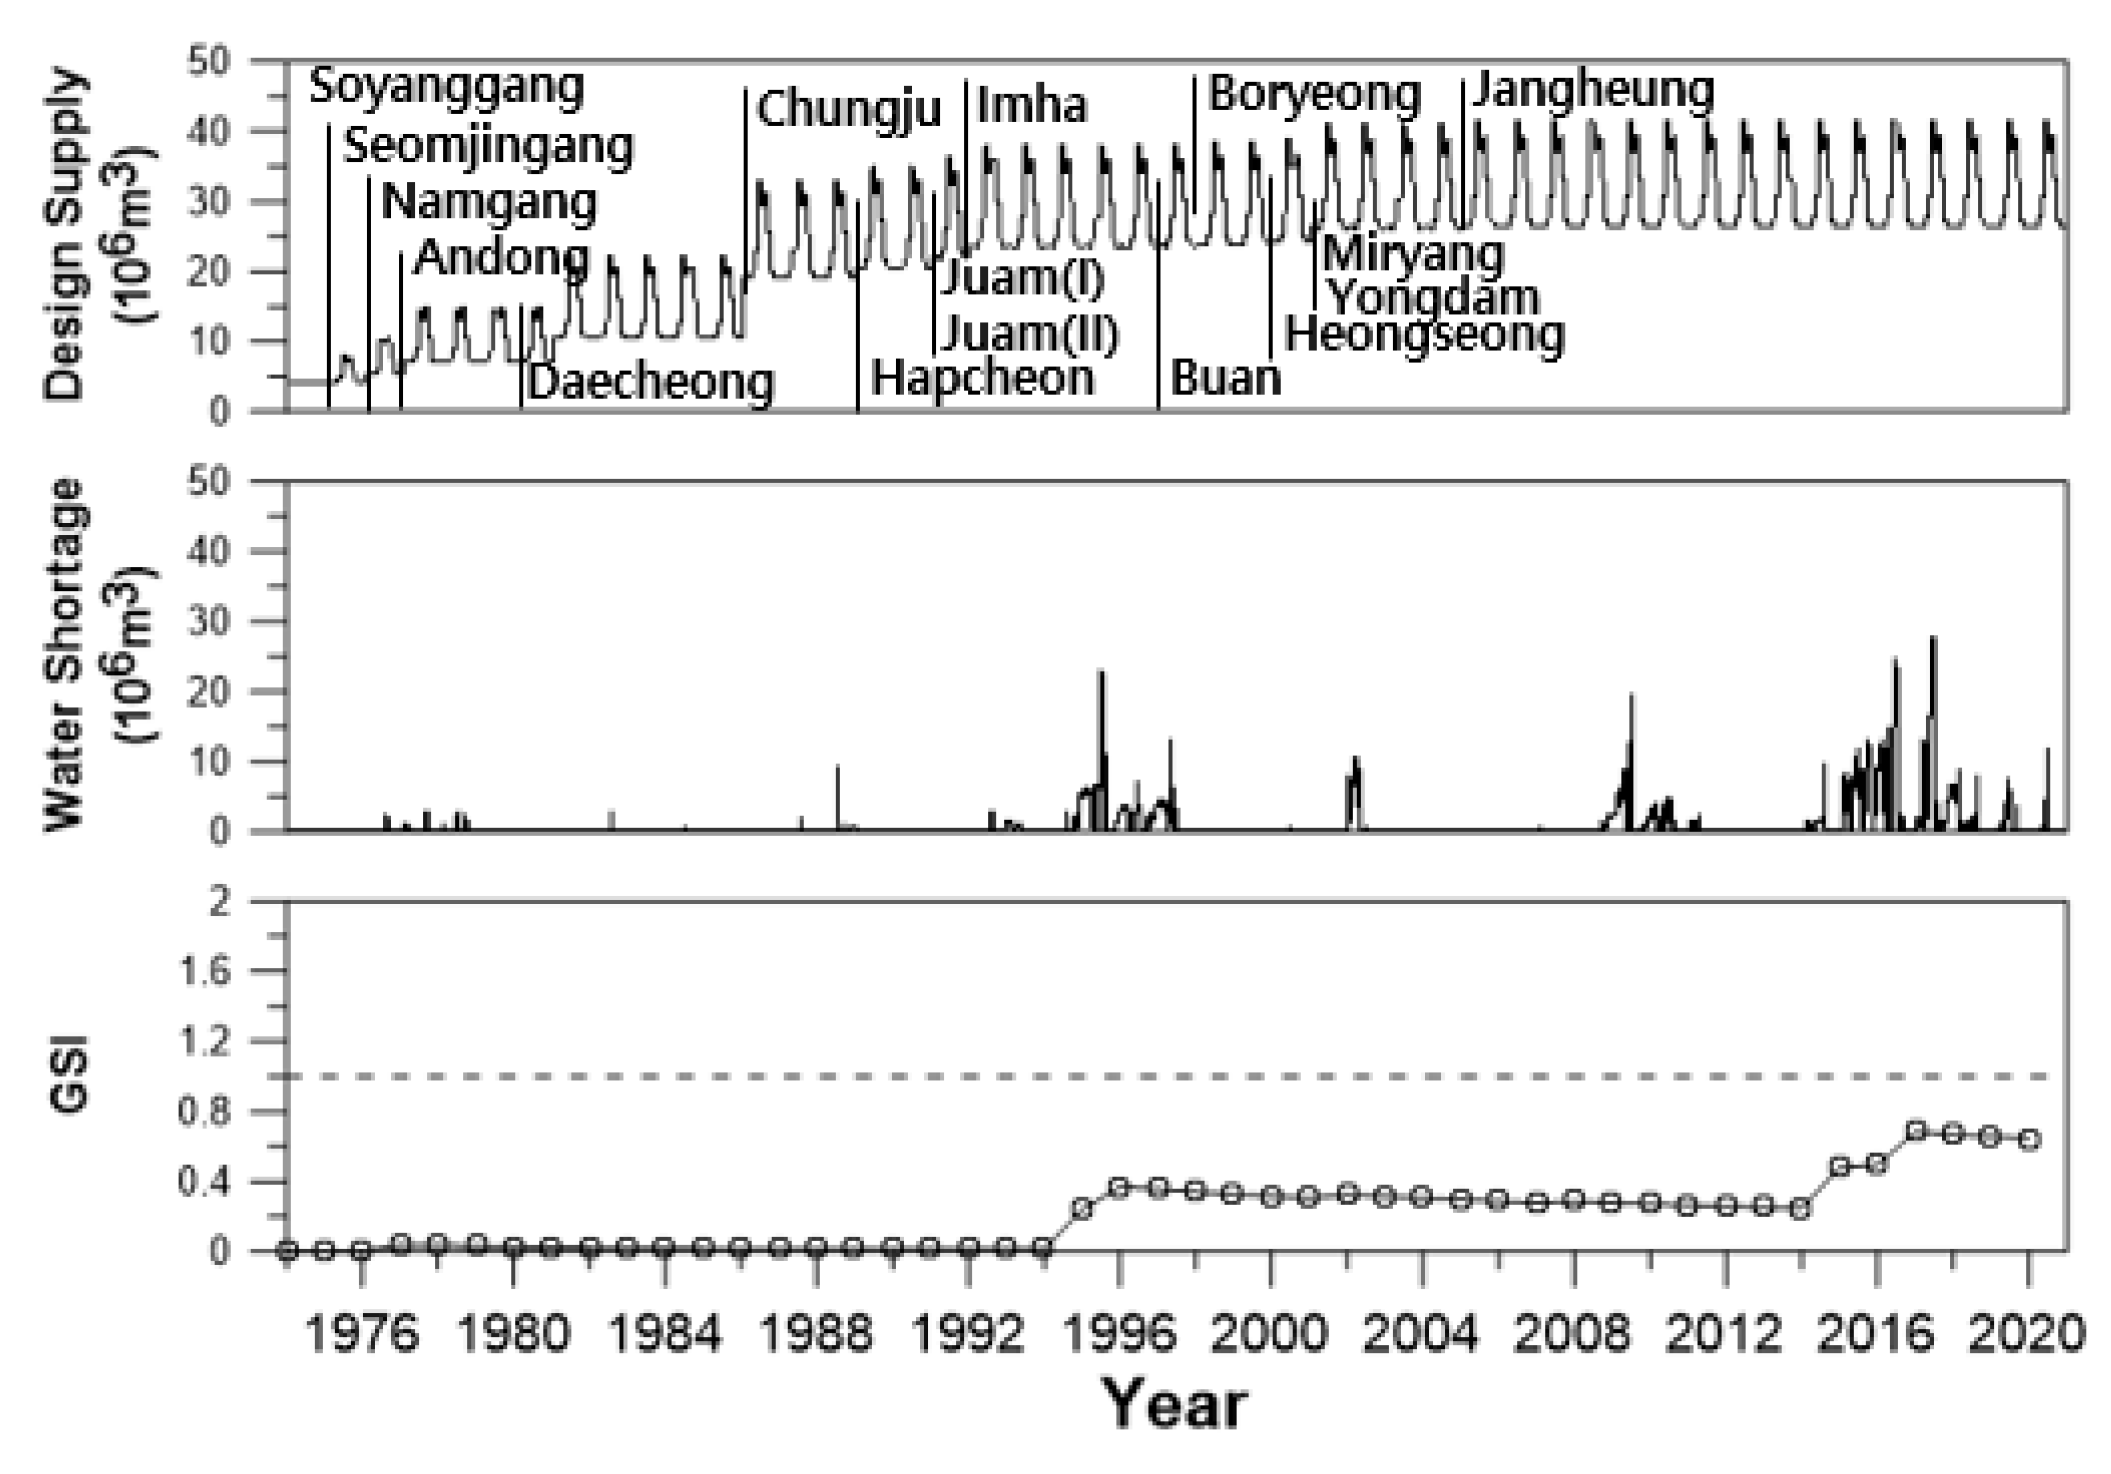
Finally, the GSIs for all 16 multipurpose dams were calculated from the total water shortage and design supply of the study dams. It is noted that the water transfer from basin to basin was not considered in the process of calculating water shortage indices. The results are shown in Figure 10 (Figure S5 shows the same, but with the results of SI). In all periods of analysis, GSI was estimated to be lower than 1 indicating that there was no problem of water supply. That is, the dam water capacity in Korea was at a sufficient level, but had some problem locally. This result indicates that the water-distribution system over the entire Korea should be supplemented, or new water resources should be secured locally. Additionally, it should also be noticed that GSI shows an increasing trend recently. This is mainly due to recent severe droughts in Korea that occurred in the period from 2014 to 2017. If this kind of long drought occurs again in the near future, GSI may become higher than 1.0.
In the analysis of the dam level and basin level, water-supply problems were detected in several dams and some river basins. However, the SI and GSI estimated by considering all dams were lower than 1. This result indicates that either the total amount of storage capacity was enough to satisfy the design supply, or water resources are not well spatially distributed in Korea. A proper system is not available for water transfer from one dam to another, or from one basin to another. In recent years, the SI and GSI were shown to be increasing, indicating the necessity of additional water resources. Under the circumstance in which no proper water-transfer system from basin to basin is available, this sign of high SI and GSI may indicate the need for immediate action for the future.
4.2. Sensitivity of SI and GSI to Major Droughts
In this section, the applicability of SI and GSI was tested in terms of their performance under actual drought situations in the past. Mild droughts occur in Korea every 5 to 10 years, and serious droughts occur every 10 to 20 years [67]. Table 2 summarizes the occurrence years of major droughts in the Korean Peninsula and multipurpose dams with larger values of SI or GSI than 1 for the corresponding years. Additionally, the results are evaluated by the detection ratio of drought events, which represents the ratio between the total number of dams and that of dams for which the SI and GSI were over 1. As can be seen in this table, the minimum detection ratio was 0.5, and that during the droughts in 1994–1995 and 2016–2017 was very high, at 0.75 and 0.82, respectively. The overall results support that the water-shortage indices modified in this study successfully describe the actual drought situation, and can be used as an alternative indicator of the water-supply condition.
For example, droughts in 1978–1979 and 1980–1981 occurred mainly in the middle and southern parts of the Korean Peninsula. At that time, the storage capacity in May of 1978 was about 64% of that of a normal year, and the total rainfall amount in 1980 was 100 to 140 mm less than the average annual rainfall [68]. The droughts were especially severe in the Nakdong River Basin. Most dams in the Nakdong River Basin recorded the minimum water-storage level, and thus the government restricted the water supply to deal with the drought. During these drought periods, the SI and GSI values of the Namgang Dam were higher than 1.
The most severe drought in Korea occurred in 1994–1995. It had a considerable influence on the water supply in the Nakdong, Geum, and Seomjin River Basins. The Andong, Hapcheon, and Imha Dams in the Nakdong River Basin; the Daecheong Dam in the Geum River Basin; and the Seomjingang Dam in the Seomjin River Basin were known to be seriously affected by the drought [69]. The impact of the drought could be found in the SI and GSI derived for these dams. The SI and GSI significantly increased during this period. The drought that occurred in 1994–1995 has also been analyzed by many researchers using the drought indices [70,71,72]. Different from previous studies, however, it was found that the impact of the drought lasted long after the drought ended.
The drought in 2001–2002 hit the northern parts of the Korean Peninsula during the late spring season. In particular, water-shortage problems were serious in the agricultural areas of Gyeonggi-do Province in the Han River Basin. The SI and GSI derived in the Heongseong Dam were found to be greater than 1. The drought in 2008–2009 was especially serious in the southern part of the Korean Peninsula, including the Nakdong River Basin [73]. The SI and GSI values for the Hapcheon, Imha, Namgang, Miryang, Daecheong and Yongdam Dams have been significantly increased to reflect the serious situation in this period.
Severe droughts were also repeated in the 2010s. The drought in 2014–2015 was centered in the middle of the Korean Peninsula. The return period of the drought in the Han River Basin and in the Geum River Basin was estimated to be 50 to 100 years [74]. The drought in 2016–2017 began in the early spring, when the precipitation amount was less than 50% of a normal year. The drought was especially serious in the middle and southern parts of the Korean Peninsula. In particular, the Boryeong Dam marked a record-low 8% of the water-reserve rate [75]. The effect of these droughts can also be found in the SI and GSI of the dams like Chungju, Heongseong, Andong, Yongdam, Buan, and Boryeong. Table 2 also confirms this serious situation in the 2010s—the number of dams with an SI and GSI higher than 1 was the highest in 2016–2017. This was obviously due to the consecutive drought in 2016–2017, just after the drought in 2014–2015.
5. Summary and Conclusions
In this study, the dam water supply capacity in Korea was evaluated using the water-shortage index (SI) and generalized water-shortage index (GSI) based on actual water-shortage data. The proposed method was applied to examine multipurpose dams in Korea. First, the damage cost under water-supply failure and cost of water-supply systems were estimated to determine the parameters of the water-shortage indices. Water-supply capacity of the studied dams was evaluated with respect to each dam, each river basin, and all dams in Korea. Finally, the application results of the modified water-shortage indices applicable to Korea were reviewed in terms of the real drought events in Korea. The findings from this study can be summarized as follows:
First, the parameters of the SI and GSI (i.e., the threshold SA/DA and k) were evaluated and modified to be applicable to Korea. The threshold SA/DA was determined to be 7.5% by comparing the cost estimation of damage caused by water-supply failure and cost estimation of water-supply systems. In addition, the exponent k was determined to be 2, based on the evaluation of how the derived SI explained the actual reality.
Second, both the SI and GSI were applied to multipurpose dams in Korea using different units: each dam, each river basin, and all dams. In the analysis of the dam level and basin level, water-supply problems were detected in several dams and in some river basins. However, the SI estimated for all dams was lower than 1. This result indicates that either the total amount of storage capacity was enough to satisfy the design supply, or water resources are not well spatially distributed in Korea. It was also found that the SI and GSI estimated for all dams has increased significantly in recent years.
Finally, the SI and GSI values for all multipurpose dams were reviewed, corresponding to the water-deficient regions for the occurrence years of major droughts. The estimation results of SI and GSI clearly described the performance of each dam under actual drought situations in the Korean Peninsula.
From the results of this study, it was found that the parameters of the SI and GSI should be modified to consider the locality of the region of interest, especially since the effect of the cost of water-shortage damage can be very different country by country, resulting in different parameters. A slight modification of the parameters was also found to be required to apply the SI and GSI to the dams in Korea. This might be the same for other countries. With well-modified indices, a new dam construction or a new water-allocation strategy could be planned more effectively. Finally, it should be mentioned that climate change is an important issue for future study. Climate change and its impact on water resources must be a new challenging area for the application of the SI and GSI.
Furthermore, the applicability of the SI and GSI is very wide. First, these indices can be used effectively in the design stage of a dam. The new SI and/or GSI can be derived by considering the simulation data of the new dam, including inflow, outflow, storage, etc., to check if the new dam can decrease the SI and/or GSI effectively. When planning a new water-allocation strategy, the SI and/or GSI can also be used for the same purpose. More effective and economical use of dam water can be tested by evaluating the SI and/or GSI.
For future study, the climate-change issue can be considered to evaluate future water resources. Climate change is a new and challenging area for the application of the SI and GSI. It requires several other small issues. One is the generation of future temperature and precipitation data, while the other is the inflow data generation using a rainfall-runoff model. Then, the reservoir operation should be done, and the SI and GSI can be used to check the dam water-supply capacity. Even though the analysis may be scenario-based, the amount of uncertainty to be derived can be used effectively to prepare for the future.
Supplementary Materials
The following are available online at https://www.mdpi.com/article/10.3390/w13070956/s1, Figure S1: Simulation results for multipurpose dams in Korea: (a) Soyanggang Dam; (b) Chungju Dam; (c) Heongseong Dam; (d) Andong Dam; (e) Hapcheon Dam; (f) Imha Dam; (g) Namgang Dam; (h) Miryang Dam; (i) Daecheong Dam; (j) Yongdam Dam; (k) Seomjingang Dam; (l) Juam Dam; (m) Juam Controlled Dam; (n) Jangheung Dam; (o) Buan Dam; (p) Boryeong Dam, Figure S2: Estimation results of SI for multipurpose dams in Korea: (a) Soyanggang Dam; (b) Chungju Dam; (c) Heongseong Dam; (d) Andong Dam; (e) Hapcheon Dam; (f) Imha Dam; (g) Namgang Dam; (h) Miryang Dam; (i) Daecheong Dam; (j) Yongdam Dam; (k) Seomjingang Dam; (l) Juam Dam; (m) Juam Controlled Dam; (n) Jangheung Dam; (o) Buan Dam; (p) Boryeong Dam, Figure S3: Estimation results of GSI for multipurpose dams in Korea: (a) Soyanggang Dam; (b) Chungju Dam; (c) Heongseong Dam; (d) Andong Dam; (e) Hapcheon Dam; (f) Imha Dam; (g) Namgang Dam; (h) Miryang Dam; (i) Daecheong Dam; (j) Yongdam Dam; (k) Seomjingang Dam; (l) Juam Dam; (m) Juam Controlled Dam; (n) Jangheung Dam; (o) Buan Dam; (p) Boryeong Dam, Figure S4: Estimation results of SI for major river basins in Korea: (a) Han River Basin; (b) Nakdong River Basin; (c) Geum River Basin; (d) Seomjin River Basin, Figure S5: Estimation results of SI for the total river basin in Korea.
Author Contributions
Conceptualization, C.Y.; data curation, C.J. and J.Z.; formal analysis, J.Z. and W.N.; methodology, C.Y.; supervision, C.Y.; visualization, W.N.; writing—original draft, C.Y.; writing—review and editing, C.J. All authors have read and agreed to the published version of the manuscript.
Funding
This work was supported by the National Research Foundation of Korea (NRF) grant funded by the Korean government (MSIT) (No. 2020R1A2C200871411).
Institutional Review Board Statement
Not applicable.
Informed Consent Statement
Not applicable.
Data Availability Statement
Not applicable.
Conflicts of Interest
The authors declare no conflict of interest.
References
- Kim, Y.; Park, H.; Jun, S. Study on Response to Water Supply Damage for Management of Drought Disaster; Korea Environment Institute: Seoul, Korea, 2014. [Google Scholar]
- Lee, E. Analysis of the recent agricultural drought events. Mag. Korean Soc. Agric. Eng. Rural Resour. 2015, 57, 2–12. [Google Scholar]
- Jung, W.; Noh, S.; Kim, Y. Evaluation of Boryeong Dam Water Supply Capacity and Drought Response Plan; ChungNam Institute: Daejeon, Korea, 2016. [Google Scholar]
- Jung, W.; Kim, Y. Evaluation of Boryeong Dam Water Supply Capacity and Proposal of a drought policy. ChungNam Rep. 2017, 278, 1–16. [Google Scholar]
- Jun, C.; Yoo, C.; Zhu, J.H.; Lee, G. Bivariate frequency analysis of dam Storage capacity before and after the rainy season and evaluation on water supply capacity. J. Korea Water Resour. Assoc. 2014, 47, 1199–1212. [Google Scholar] [CrossRef] [Green Version]
- Lee, G. Water supply performance assessment of multipurpose dams using sustainability index. J. Korea Water Resour. Assoc. 2014, 47, 411–420. [Google Scholar] [CrossRef]
- Yu, J.S.; Choi, S.J.; Kwon, H.H.; Kim, T.W. Future water supply risk analysis using a joint drought management index in Nakdong river basin. J. Korea Water Resour. Assoc. 2018, 51, 1117–1126. [Google Scholar]
- Di, C.; Yang, X.; Huang, D. A new water resources supply-demand system and its hyperchaos control. Procedia Eng. 2011, 15, 734–738. [Google Scholar] [CrossRef] [Green Version]
- Liu, K.K.; Li, C.H.; Yang, X.L.; Hu, J.; Xia, X.H. Water resources supply-consumption (demand) balance analyses in the Yellow River Basin in 2009. Procedia Environ. Sci. 2012, 13, 1956–1965. [Google Scholar] [CrossRef] [Green Version]
- Ji, X.B.; Kang, E.S.; Chen, R.S.; Zhao, W.Z.; Xiao, S.C.; Jin, B.W. Analysis of water resources supply and demand and security of water resources development in irrigation regions of the middle reaches of the Heihe River Basin, Northwest China. Agric. Sci. China 2006, 5, 130–140. [Google Scholar] [CrossRef]
- Shiklomanov, I.A. Appraisal and assessment of world water resources. Water Int. 2000, 25, 11–32. [Google Scholar] [CrossRef]
- Shih, J.S.; ReVelle, C. Water supply operations during drought: A discrete hedging rule. Eur. J. Oper. Res. 1995, 82, 163–175. [Google Scholar] [CrossRef]
- Rossi, G.; Cancelliere, A. Managing drought risk in water supply systems in Europe: A review. Int. J. Water Resour. Dev. 2013, 29, 272–289. [Google Scholar] [CrossRef]
- Yu, J.S.; Shin, J.Y.; Kwon, M.; Kim, T.W. Bivariate drought frequency analysis to evaluate water supply capacity of multi-purpose dams. J. Korean Soc. Civ. Eng. 2017, 37, 231–238. [Google Scholar] [CrossRef] [Green Version]
- Lévite, H.; Sally, H.; Cour, J. Testing water demand management scenarios in a water-stressed basin in South Africa: Application of the WEAP model. Phys. Chem. Earth Parts A/B/C 2003, 28, 779–786. [Google Scholar] [CrossRef]
- Mounir, Z.M.; Ma, C.M.; Amadou, I. Application of water evaluation and planning (WEAP): A model to assess future water demands in the Niger River (in Niger Republic). Mod. Appl. Sci. 2011, 5, 38–49. [Google Scholar] [CrossRef] [Green Version]
- Li, X.; Zhao, Y.; Shi, C.; Sha, J.; Wang, Z.L.; Wang, Y. Application of Water Evaluation and Planning (WEAP) model for water resources management strategy estimation in coastal Binhai New Area, China. Ocean Coast. Manag. 2015, 106, 97–109. [Google Scholar] [CrossRef]
- Choi, S.J.; Lee, D.R.; Moon, J.W.; Kang, S.K. Application of K-WEAP (Korea-Integrated Water Resources Evaluation and Planning Model). J. Korea Water Resour. Assoc. 2010, 43, 625–633. [Google Scholar] [CrossRef] [Green Version]
- Jang, C.H.; Kim, H.R.; Jo, H.S. Introduction of Dynamic Water resources Assessment Tool (DWAT). Mag. Korea Water Resour. Assoc. Water Future 2019, 52, 93–100. [Google Scholar]
- Oh, J.H.; Kim, Y.S.; Ryu, K.S.; Cho, Y.S. Comparison and discussion of MODSIM and K-WEAP model considering water supply priority. J. Korea Water Resour. Assoc. 2019, 52, 463–473. [Google Scholar]
- Chan, T.; Ross, H.; Hoverman, S.; Powell, B. Participatory development of a Bayesian network model for catchment-based water resource management. Water Resour. Res. 2010, 46, W07544. [Google Scholar] [CrossRef] [Green Version]
- Cronk, R.; Bartram, J. Factors influencing water system functionality in Nigeria and Tanzania: A regression and Bayesian network analysis. Environ. Sci. Technol. 2017, 51, 11336–11345. [Google Scholar] [CrossRef]
- Shi, H.; Luo, G.; Zheng, H.; Chen, C.; Bai, J.; Liu, T.; Ochege, F.U.; De Maeyer, P. Coupling the water-energy-food-ecology nexus into a Bayesian network for water resources analysis and management in the Syr Darya River basin. J. Hydrol. 2020, 581, 124387. [Google Scholar] [CrossRef]
- Hyde, K.M.; Maier, H.R.; Colby, C.B. Reliability-based approach to multicriteria decision analysis for water resources. J. Water Resour. Plan. Manag. 2004, 130, 429–438. [Google Scholar] [CrossRef]
- Gong, L.; Jin, C. Fuzzy comprehensive evaluation for carrying capacity of regional water resources. Water Resour. Manag. 2009, 23, 2505–2513. [Google Scholar] [CrossRef]
- Chen, C.; Huang, G.H.; Li, Y.P.; Zhou, Y. A robust risk analysis method for water resources allocation under uncertainty. Stoch. Environ. Res. Risk Assess. 2013, 27, 713–723. [Google Scholar] [CrossRef]
- Korteling, B.; Dessai, S.; Kapelan, Z. Using information-gap decision theory for water resources planning under severe uncertainty. Water Res. Manag. 2013, 27, 1149–1172. [Google Scholar] [CrossRef] [Green Version]
- Li, T.; Yang, S.; Tan, M. Simulation and optimization of water supply and demand balance in Shenzhen: A system dynamics approach. J. Clean. Prod. 2019, 207, 882–893. [Google Scholar] [CrossRef]
- Yang, Z.; Song, J.; Cheng, D.; Xia, J.; Li, Q.; Ahamad, M.I. Comprehensive evaluation and scenario simulation for the water resources carrying capacity in Xi’an city, China. J. Environ. Manag. 2019, 230, 221–233. [Google Scholar] [CrossRef]
- Pedro-Monzonís, M.; Solera, A.; Ferrer, J.; Estrela, T.; Paredes-Arquiola, J. A review of water scarcity and drought indexes in water resources planning and management. J. Hydrol. 2015, 527, 482–493. [Google Scholar] [CrossRef] [Green Version]
- Hashimoto, T.; Stedinger, J.R.; Loucks, D.P. Reliability, resiliency, and vulnerability criteria for water resource system performance evaluation. Water Resour. Res. 1982, 18, 14–20. [Google Scholar] [CrossRef] [Green Version]
- Loucks, D.P. Quantifying trends in system sustainability. Hydrol. Sci. J. 1997, 42, 513–530. [Google Scholar] [CrossRef]
- Sandoval-Solis, S.; McKinney, D.; Loucks, D. Sustainability index for water resources planning and management. J. Water Resour. Plan. Manag. 2011, 137, 381–390. [Google Scholar] [CrossRef] [Green Version]
- Martin-Carrasco, F.; Garrote, L.; Iglesias, A.; Mediero, L. Diagnosing causes of water scarcity in complex water resources systems and identifying risk management actions. Water Resour. Manag. 2013, 27, 1693–1705. [Google Scholar] [CrossRef] [Green Version]
- Cha, S.; Park, K. A study on estimate of evaluation indices of water supply capacity for multipurpose dam. J. Environ. Sci. Int. 2004, 13, 197–204. [Google Scholar]
- Choi, S.J.; Kang, S.K.; Lee, D.; Kang, S. Evaluation on the water supply stability of Nakdong river basin based on future scenarios. J. Korea Water Resour. Assoc. 2018, 51, 1105–1115. [Google Scholar]
- Palmer, W.C. Meteorologic Drought; US Department of Commerce, Weather Bureau: Washington, DC, USA, 1965.
- McKee, T.B.; Doesken, N.J.; Kleist, J. The relationship of drought frequency and duration to time scales. In Proceedings of the 8th Conference on Applied Climatology American Meteorological Society, Anaheim, CA, USA, 17–22 January 1993. [Google Scholar]
- Vicente-Serrano, S.M.; Begueria, S.; Lopez-Moreno, J.I. A multi-scalar drought index sensitive to global warming: The standardized precipitation evapotranspiration index—SPEI. J. Clim. 2010, 23, 1696–1718. [Google Scholar] [CrossRef] [Green Version]
- Raskin, P.; Gleick, P.; Kirshen, P.; Pontius, G.; Strzepek, K. Water Futures: Assessment of Long-Range Patterns and Prospects; Stockholm Environment Institute: Stockholm, Sweden, 1997. [Google Scholar]
- Sullivan, C.A. Calculating a water poverty index. World Dev. 2002, 30, 1195–1210. [Google Scholar] [CrossRef]
- Zeng, Z.; Liu, J.; Savenije, H. A simple approach to assess water scarcity integrating water quantity and quality. Ecol. Indic. 2013, 34, 441–449. [Google Scholar] [CrossRef]
- United States Army Corps of Engineers (USACE). Hydrologic Engineering Methods for Water Resources Development. (Vol. 8 Reservoir Yield); US Army Corps of Engineers: Davis, CA, USA, 1975. [Google Scholar]
- Hsu, S.K. Shortage indices for water-resources planning in Taiwan. J. Water Resour. Plan. Manag. 1995, 121, 119–131. [Google Scholar] [CrossRef]
- Lee, G.; Yi, J. Analysis of emergency water supply effects of multipurpose dams using water shortage index. J. Korea Water Resour. Assoc. 2012, 45, 1143–1156. [Google Scholar] [CrossRef] [Green Version]
- Japan Water Resources Development Public Corporation (JWRDPC). Drought Assessment; Mizu To Tomoni: Tokyo, Japan, 1977. [Google Scholar]
- Korea National Committee on Large Dams (KNCOLD). The 40th Anniversary of KNCOLD; Korea National Committee on Large Dams: Daejeon, Korea, 2012. [Google Scholar]
- K-Water. Water Resources Operations Center (WROC) Annual Report; K-Water: Daejeon, Korea, 2003. [Google Scholar]
- Lee, S. Variability of Inflow and Outflow Regime Using Indicators of Hydrologic Alterations (IHA) in Multi-Purpose Dams in Korea. Master’s Thesis, University of Seoul, Seoul, Korea, 2014. [Google Scholar]
- K-Water. Annual Management Report for the Daecheong Multi-Purpose Dam; K-Water: Daejeon, Korea, 2001. [Google Scholar]
- Jung, C.M.; Shin, M.J.; Kim, Y.O. A comparison study of runoff projections for Yongdam dam watershed using SWAT. J. Korea Water Resour. Assoc. 2015, 48, 439–449. [Google Scholar] [CrossRef] [Green Version]
- K-Water. Annual Management Report for the Hapcheon Multi-Purpose Dam; K-Water: Daejeon, Korea, 2001. [Google Scholar]
- K-Water. Annual Management Report for the Imha Multi-Purpose Dam; K-Water: Daejeon, Korea, 2002. [Google Scholar]
- K-Water. Annual Management Report for the Andong Multi-Purpose Dam; K-Water: Daejeon, Korea, 2003. [Google Scholar]
- K-Water. A Study on the Aqua-Environment Monitoring and Influence Analysis for Juam Controlled Dam Downstream; K-Water: Daejeon, Korea, 2013. [Google Scholar]
- Ahn, J.M.; Lyu, S.; Kim, J.C. Study of operation rules for flood control to Seomjin River Dam using HEC-ResSim. J. Korean Soc. Civ. Eng. 2012, 32, 93–101. [Google Scholar]
- Lee, D.H.; Choi, C.W.; Yu, M.S.; Yi, J. Reevaluation of multi-purpose reservoir yield. J. Korea Water Resour. Assoc. 2012, 45, 361–371. [Google Scholar] [CrossRef] [Green Version]
- Yang, W.; Ahn, J.; Yi, J. A study on the measures to use Gunnam flood control reservoir through a reservoir simulation model. J. Korea Water Resour. Assoc. 2017, 50, 407–418. [Google Scholar]
- Klipsch, J.D.; Hurst, M.B. HEC-ResSim Reservoir System Simulation User’s Manual; US Army Corps of Engineers, Institute of Water Resources, Hydrologic Engineering Center: Davis, CA, USA, 2007. [Google Scholar]
- K-Water. Dam Operation Manual; K-Water: Daejeon, Korea, 2009. [Google Scholar]
- Seo, S.S.; Kim, D.G.; Lee, K.H.; Kim, H.S.; Kim, T.W. Estimation of drought damage based on agricultural and domestic water use. J. Wet. Res. 2009, 11, 77–87. [Google Scholar]
- Han, M.; Dunford, M.; Chen, G.; Liu, W.; Li, Y.; Liu, S. Global water transfers embodied in Mainland China’s foreign trade: Production-and consumption-based perspectives. J. Clean. Prod. 2017, 161, 188–199. [Google Scholar] [CrossRef]
- Boudhar, A.; Boudhar, S.; Ibourk, A. An input–output framework for analysing relationships between economic sectors and water use and intersectoral water relationships in Morocco. J. Econ. Struct. 2017, 6, 1–25. [Google Scholar] [CrossRef] [Green Version]
- Miller, R.E.; Blair, P.D. Input-Output Analysis: Foundations and Extensions; Cambridge University Press: Cambridge, UK, 2009. [Google Scholar]
- Korea Water Resources Association (KWRA). Improvement of Water Supply Evaluation Method from Standardization of Drought Frequency and Development of Water Shortage Index; KWRA: Seoul, Korea, 2013. [Google Scholar]
- Choi, J.W.; Heo, E.Y.; Shim, M.P. The economic impacts of water supply constraints during a drought using input-output analysis. J. Korea Water Resour. Assoc. 2000, 33, 647–658. [Google Scholar]
- Yoo, C.; Kim, D.H. Evaluation of drought events using the rectangular pulses Poisson process model. J. Korea Water Resour. Assoc. 2006, 39, 373–382. [Google Scholar]
- Bae, D. Development of Drought Outlook Response Techniques on Korea and East Asia; Sejong University Press: Seoul, Korea, 2015. [Google Scholar]
- Kim, Y. Study on Response to Water Supply Damage for Management of Drought Disaster; Korea Environment Institute: Sejong, Korea, 2015. [Google Scholar]
- Lee, J.H.; Jeong, S.M.; Kim, S.J.; Lee, M.H. Development of drought monitoring system: I. Applicability of drought indices for quantitative drought monitoring. J. Korea Water Resour. Assoc. 2006, 39, 787–800. [Google Scholar]
- Lee, J.H.; Jang, H.W.; Kim, J.S.; Kim, T.W. Quantitative characterization of historical drought events in Korea—Focusing on drought frequency analysis in the five major basins. J. Korea Water Resour. Assoc. 2015, 48, 1011–1021. [Google Scholar] [CrossRef] [Green Version]
- Yu, M.; Cho, Y.; Kim, T.W.; Chae, H.S. Analysis of drought propagation using hydrometeorological data: From meteorological drought to agricultural drought. J. Korea Water Resour. Assoc. 2018, 51, 195–205. [Google Scholar]
- Oh, G.; Yoo, I. Damage status and countermeasures of drought in spring in Korea. J. Korean Soc. Hazard Mitig. 2014, 14, 4–9. [Google Scholar]
- Ministry of Land, Infrastructure and Transport (MOLIT). Drought Information Analysis Annual Report; MOLIT: Seoul, Korea, 2016.
- Kim, M.; Kang, H.; Oh, T.; Park, J. Information of ’17 drought and the future of drought in Korea. Mag. Korea Water Resour. Assoc. Water Future 2017, 50, 56–61. [Google Scholar]
Figure 1.
Application procedure of water-shortage index used in this study: (a) SI; (b) GSI.

Figure 2.
Locations of multipurpose dams in Korea.

Figure 3.
Relation between the total damage cost and the degree of water shortage in the water-supply industry (in 1990, 1995, 2000, and 2005).
Figure 3.
Relation between the total damage cost and the degree of water shortage in the water-supply industry (in 1990, 1995, 2000, and 2005).

Figure 4.
Total water-supply cost followed by the ratio of storage capacity of dams considered in this study.
Figure 4.
Total water-supply cost followed by the ratio of storage capacity of dams considered in this study.

Figure 5.
Relation between the total damage cost in the water-supply industry and the total water-supply cost for in 1995.
Figure 5.
Relation between the total damage cost in the water-supply industry and the total water-supply cost for in 1995.

Figure 6.
Estimation results of SI derived with three different values of k (1.5, 2.0, and 2.5): (a) Heongseong Dam (located in the Han River Basin), (b) Namgang Dam (located in the Nakdong River Basin), (c) Daecheong Dam (located in the Geum River Basin), and (d) Seomjingang Dam (located in the Seomjin River Basin).

Figure 7.
Comparison of estimated SI (left panel) and GSI (right panel) for (a) Andong Dam, and (b) Chungju Dam.
Figure 7.
Comparison of estimated SI (left panel) and GSI (right panel) for (a) Andong Dam, and (b) Chungju Dam.

Figure 8.
Estimation result of GSI for multipurpose dams selected for each type: (a) Soyanggang Dam (Type 1), (b) Imha Dam (Type 2), and (c) Daecheong Dam (Type 3).
Figure 8.
Estimation result of GSI for multipurpose dams selected for each type: (a) Soyanggang Dam (Type 1), (b) Imha Dam (Type 2), and (c) Daecheong Dam (Type 3).

Figure 9.
Estimation results of GSI for major river basins in Korea: (a) Han River Basin, (b) Nakdong River Basin, (c) Geum River Basin, and (d) Seomjin River Basin. Juam (I) and Juam (II) correspond to the Juam Dam and the Juam Controlled Dam, respectively.
Figure 9.
Estimation results of GSI for major river basins in Korea: (a) Han River Basin, (b) Nakdong River Basin, (c) Geum River Basin, and (d) Seomjin River Basin. Juam (I) and Juam (II) correspond to the Juam Dam and the Juam Controlled Dam, respectively.

Figure 10.
Estimation result of GSI for all the river basins in Korea. Juam (I) and Juam (II) correspond to the Juam Dam and the Juam Controlled Dam, respectively.
Figure 10.
Estimation result of GSI for all the river basins in Korea. Juam (I) and Juam (II) correspond to the Juam Dam and the Juam Controlled Dam, respectively.


Table 1.
Total construction cost and storage characteristics of multipurpose dams in Korea.
| River Basin | Dam | Construction Period (Year, Month) | Total Construction Cost (billion KRW) | Compensation Expense (billion KRW) | Total Storage Capacity (106 m3) | Ratio of Storage Capacity (%) |
|---|---|---|---|---|---|---|
| Han | Soyanggang | 67.04–73.12 | 32.1 | - | 2900.0 | 23.05 |
| Chungju | 78.06–85.10 | 555.1 | - | 2750.0 | 21.86 | |
| Heongseong | 90.01–02.11 | 178.7 | 119.8 | 86.9 | 0.69 | |
| Nakdong | Andong | 71.04–77.05 | 40.3 | - | 1248.0 | 9.92 |
| Hapcheon | 82.04–89.12 | 262.4 | - | 790.0 | 6.28 | |
| Imha | 84.12–93.12 | 333.1 | - | 595.0 | 4.73 | |
| Namgang | 87.11–03.11 | 867.2 | 697.9 | 309.2 | 2.46 | |
| Miryang | 90.04–02.12 | 204.4 | 80.5 | 73.6 | 0.59 | |
| Geum | Daecheong | 75.03–81.06 | 155.7 | - | 1490.0 | 11.84 |
| Yongdam | 90.10–06.12 | 1510.8 | 996.6 | 815.0 | 6.48 | |
| Seomjin | Seomjingang | 61.08–65.12 | 8.0 | - | 466.0 | 3.70 |
| Juam | 84.09–92.12 | 362.8 | - | 457.0 | 3.63 | |
| Juam Controlled | 84.09–96.12 | - | - | 250.0 | 1.99 | |
| Others | Jangheung | 96.02–07.12 | 646.9 | - | 191.0 | 1.52 |
| Buan | 90.02–96.12 | 61.3 | 22.3 | 41.5 | 0.33 | |
| Boryeong | 90.11–00.06 | 237.6 | 108.5 | 116.9 | 0.93 | |
| Total | 12,580.1 | 100.00 | ||||
Table 2.
The representative drought events and application results of SI and GSI for multipurpose dams in Korea.
Table 2.
The representative drought events and application results of SI and GSI for multipurpose dams in Korea.
| Drought Years | River Basin | Dam | SI | GSI | Detection Ratio |
|---|---|---|---|---|---|
| 1978–1979 | Nakdong | Namgang | 1.72–2.30 | 1.39–1.85 | 0.50 |
| 1980–1981 | Nakdong | Namgang | 1.15–1.38 | 1.11–1.39 | 0.50 |
| 1994–1995 | Nakdong | Hapcheon | 7.23–10.54 | 8.36–10.83 | 0.75 |
| Imha | 15.90–17.80 | 13.42–18.65 | |||
| Geum | Daecheong | 1.94–2.05 | 3.27–3.47 | ||
| 2001–2002 | Han | Heongseong | 1.62–2.08 | 0.91–1.16 | 0.50 |
| Nakdong | Hapcheon | 8.02–8.69 | 8.98–9.67 | ||
| Imha | 9.64–10.52 | 9.82–10.71 | |||
| Geum | Daecheong | 1.39–1.45 | 2.35–2.45 | ||
| 2008–2009 | Nakdong | Hapcheon | 6.02–6.46 | 6.64–7.50 | 0.60 |
| Imha | 7.90–7.93 | 9.62–9.75 | |||
| Geum | Daecheong | 1.58–1.63 | 2.28–2.35 | ||
| 2014–2015 | Han | Chungju | 1.11–1.48 | 1.00–1.45 | 0.50 |
| Heongseong | 4.84–5.62 | 7.46–7.60 | |||
| Nakdong | Hapcheon | 5.26–5.46 | 6.10–6.34 | ||
| Imha | 7.40–8.19 | 8.82–9.12 | |||
| Geum | Daecheong | 1.36–1.40 | 1.96–2.02 | ||
| 2016–2017 | Han | Chungju | 1.65–1.70 | 1.59–1.64 | 0.82 |
| Heongseong | 6.56–6.93 | 7.85–8.29 | |||
| Nakdong | Andong | 1.10–1.54 | 1.70–1.82 | ||
| Hapcheon | 6.97–7.09 | 8.65–8.89 | |||
| Imha | 9.18–9.37 | 9.94–10.25 | |||
| Geum | Daecheong | 1.32–1.35 | 1.88–1.92 | ||
| Yongdam | 1.58–1.69 | 2.57–2.72 | |||
| Others | Buan | 1.25–1.27 | 1.22–1.26 | ||
| Boryeong | 0.98–1.03 | 1.02–1.08 |
Publisher’s Note: MDPI stays neutral with regard to jurisdictional claims in published maps and institutional affiliations. |
© 2021 by the authors. Licensee MDPI, Basel, Switzerland. This article is an open access article distributed under the terms and conditions of the Creative Commons Attribution (CC BY) license (https://creativecommons.org/licenses/by/4.0/).
Share and Cite
MDPI and ACS Style
Yoo, C.; Jun, C.; Zhu, J.; Na, W. Evaluation of Dam Water-Supply Capacity in Korea Using the Water-Shortage Index. Water 2021, 13, 956. https://doi.org/10.3390/w13070956
AMA Style
Yoo C, Jun C, Zhu J, Na W. Evaluation of Dam Water-Supply Capacity in Korea Using the Water-Shortage Index. Water. 2021; 13(7):956. https://doi.org/10.3390/w13070956
Chicago/Turabian StyleYoo, Chulsang, Changhyun Jun, Juhua Zhu, and Wooyoung Na. 2021. "Evaluation of Dam Water-Supply Capacity in Korea Using the Water-Shortage Index" Water 13, no. 7: 956. https://doi.org/10.3390/w13070956
Note that from the first issue of 2016, this journal uses article numbers instead of page numbers. See further details here.