Experimental and Numerical Study of the Effects of Geometric Appendance Elements on Energy Dissipation over Stepped Spillway


Department of Civil Engineering, Faculty of Engineering, University of Zanjan, Zanjan 537138791, Iran
*
Author to whom correspondence should be addressed.
Water 2021, 13(7), 957; https://doi.org/10.3390/w13070957
Submission received: 2 March 2021
/
Revised: 26 March 2021
/
Accepted: 29 March 2021
/
Published: 31 March 2021
(This article belongs to the Special Issue Physical Modelling in Hydraulics Engineering)
Abstract
:In the stepped spillway, the steps, by providing an artificial roughening bed, dissipate the flow of energy more than other types of spillways, so the construction costs for stilling basin are reduced. However, what is important in this type of spillway is increasing the effectiveness of steps in the rate of energy dissipation. The present study deals with experimental and numerical simulations regarding the influence of geometric appendance elements on the steps and its impact on the energy dissipation performances, flow patterns properties, turbulent kinetic energy, flow resistance and the Darcy roughness. The localization of inception point of air entrainment is also assessed. To this aim, different configurations are taken into account. The computational procedure is validated with experimental results and then used to test the hydraulic behavior of different geometric configurations. The results showed that the appendance elements on the steps increased the turbulent kinetic energy (TKE) values and Darcy–Weisbach friction and the energy dissipation increased significantly. By reducing the height of the elements, energy dissipation and the TKE value increase more significantly. With the appendance elements on step, the air entrainment inception locations a positioning further upstream than the flat step stepped spillway.
1. Introduction
Spillways are one of the best solutions as floodwater release facilities in reservoir dams to transfer high-energy water and dissipate water flow energy as well as to rehabilitate embankment dams [1,2]. Steps on a stepped spillway play an important role in improving energy dissipation due to the artificial roughness of the steps.
So far, different investigations have been carried out to determine the hydraulic parameters of stepped spillways by Rajaratnam [3], Peyaras et al. [4], and Chanson [5] to form definitions of the flow regimes and energy loss. Based on the mentioned studies and depending on flow conditions, the flow over a stepped spillway is usually categorized into three regimes: nappe, transition, and skimming. The stepped spillway is often designed for skimming flows. Skimming flow occurs in high discharge. Skimming flow is dominant because most prototypes of stepped spillways operate in large discharges and the aeration and energy dissipation performances are well documented for flat uniform stepped spillways with embankment dam slopes (i.e., chute angles from the horizontal between 22° and 30°) and based on studies by Chanson and Toombes [6], Ohtsu et al. [7], Gonzalez and Chanson [8], Felder and Chanson [9], Bung [10] and Hunt et al. [11].
In the following decades and to date, numerous studies have been carried out on the pooled stepped spillway, which is equipped with pool weirs at the step edges and also designed as prototype stepped chutes (e.g., Sorpe dam in Germany and Le Pont dam in France). Some studies and experiments were made on pooled stepped spillways, a new type of step structures thought to improve the energy dissipation, in order to provide information about the flow patterns and the dissipation performance by Felder et al. [12], Felder and Chanson [13], Felder and Chanson [14] and Sholichin et al. [15]. Also, experimental studies have been conducted to date on the flat uniform and non-uniform steps stepped spillways by Meireles and Matos [16], Felder [17], and Wüthrich and Chanson [18] to determine flow characteristics, inception point, and the rate of energy dissipation on these spillways.
Various types of numerical simulation study have been successfully used to study the detailed flow properties in hydraulic structures, especially stepped spillways, such as those by Valero and Bung [19], Lopes et al. [20], Biscarini et al. [21], Daneshfaraz et al. [22], and Ghaderi et al. [23].
Peng et al. [24] investigated the effects of varying horizontal face angles on turbulence kinetic energy and energy dissipation rates. They found that the energy dissipation rate decreases with an increase for the enlargement of the horizontal face angles. Guenther et al. [25] studied the characteristics of flow (i.e., aeration concentration and vortex characteristics) and rate of energy dissipation with different types of stepped spillways. Other researchers such as Ghaderi et al. [26], Hekmatzadeh et al. [27], Bayon et al. [28], and Thappeta et al. [29] performed numerical solutions to modeling flows over spillways.
The literature survey by the authors showed that there were different studies investigating various aspects of stepped spillway, but what is important in this type of spillway is increasing the effectiveness of steps in the rate of energy dissipation. This can be done by a new type of step structure (i.e., inclination angles on step or using a sill on the edge of step and cases like that) or geometric alteration and change of steps called labyrinth stepped spillways proposed by Ghaderi et al. [2]. Therefore, it is scientifically beneficial to modify the shape of the step of the stepped spillway to increase its collision and roll to achieve energy dissipation. This study aims to consider the elements appendance on the steps and its impact on characteristics of flow water over the stepped spillway such as flow pattern, energy dissipation and residual head, flow resistance and inception points on the flat and the elements appendance on the steps of the stepped spillway.
The paper is organized as follows: In Section 1, an overview of the work and research already done and available are dissected; Section 2, briefly presenting the governing equations of free surface flow and the main parameters affecting the energy dissipation, presents a brief description of the experimental set-up, discusses the numerical model employed and validation of the simulations is explained. Afterwards, Section 3 presents an analysis of the hydraulic properties of flow over different configurations of step in stepped spillway. The article ends with a conclusion and a discussion on the experimental and numerical results obtained in Section 4.
The results of this research provide answers regarding very important and open discussions on how to improve the hydraulic behaviors of a stepped spillway. A particular focus is made on the energy dissipation and the risk of cavitation phenomenon associated with the elements appendance on the steps, representing the major issue of concern.
2. Materials and Methods
2.1. Flow Regimes on Stepped Spillway
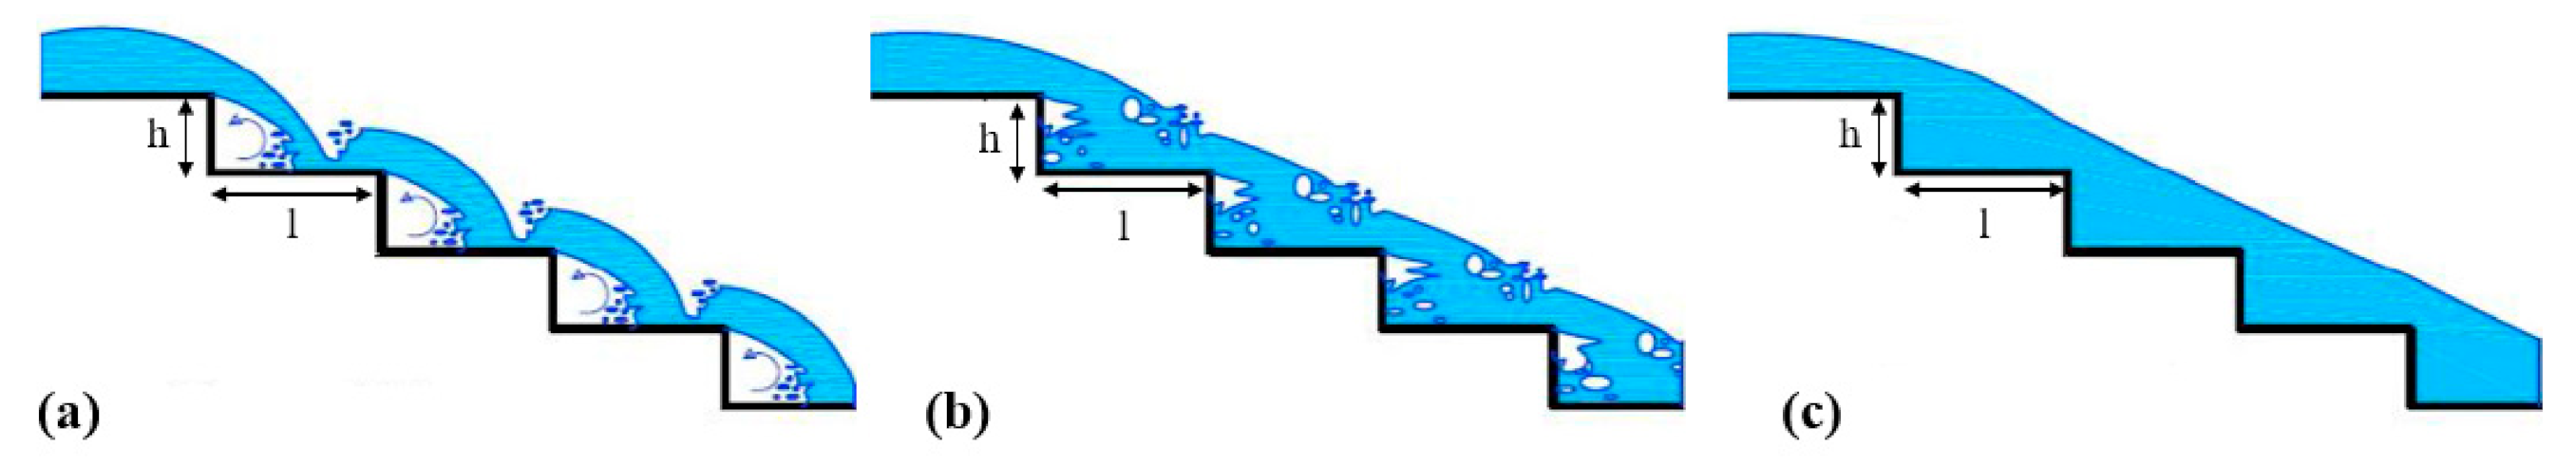
Flow regimes over the spillways are divided into three types, nappe, transition, and skimming flow [5], as indicated in Figure 1.
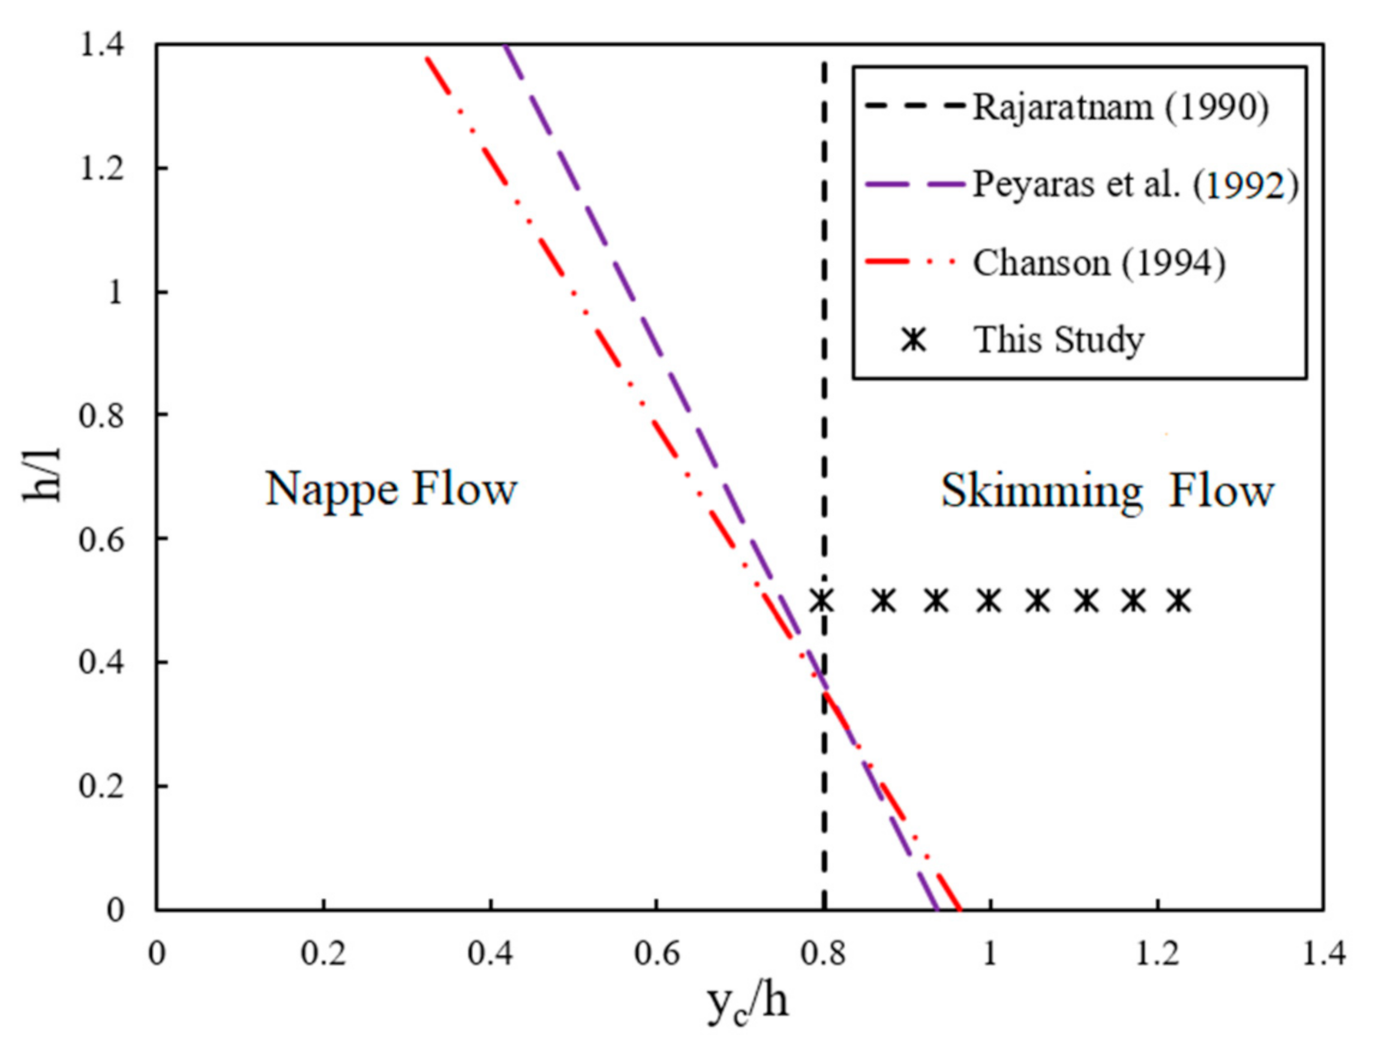
In the nappe flow pattern, the water passes from one step to the other, developing a small hydraulic jump on every step. This jump can be observed for a small ratio of (yc/h) (yc is the critical flow depth and h is the step height), the skimming flow regime is observed for the higher discharges according to Chinnarasri and Wongwises [30], and with a large value of (yc/h). The factors that affect the generation of various types of flow on stepped spillways include the geometry of the steps (length and height of the steps, l and h) and the flow rate Q [1,2]. However, some researchers have proposed other criteria. The studies of many researchers such as Rajaratnam [3], Peyaras et al. [4], and Chanson [5] have shown that the type of flow regime depends on the normalized critical depth, yc/h, and a dimensionless variable of steps, h/l. According to Equations (1)–(3), criteria are presented for which a skimming flow regime occurs:
2.2. Energy Dissipation Relations
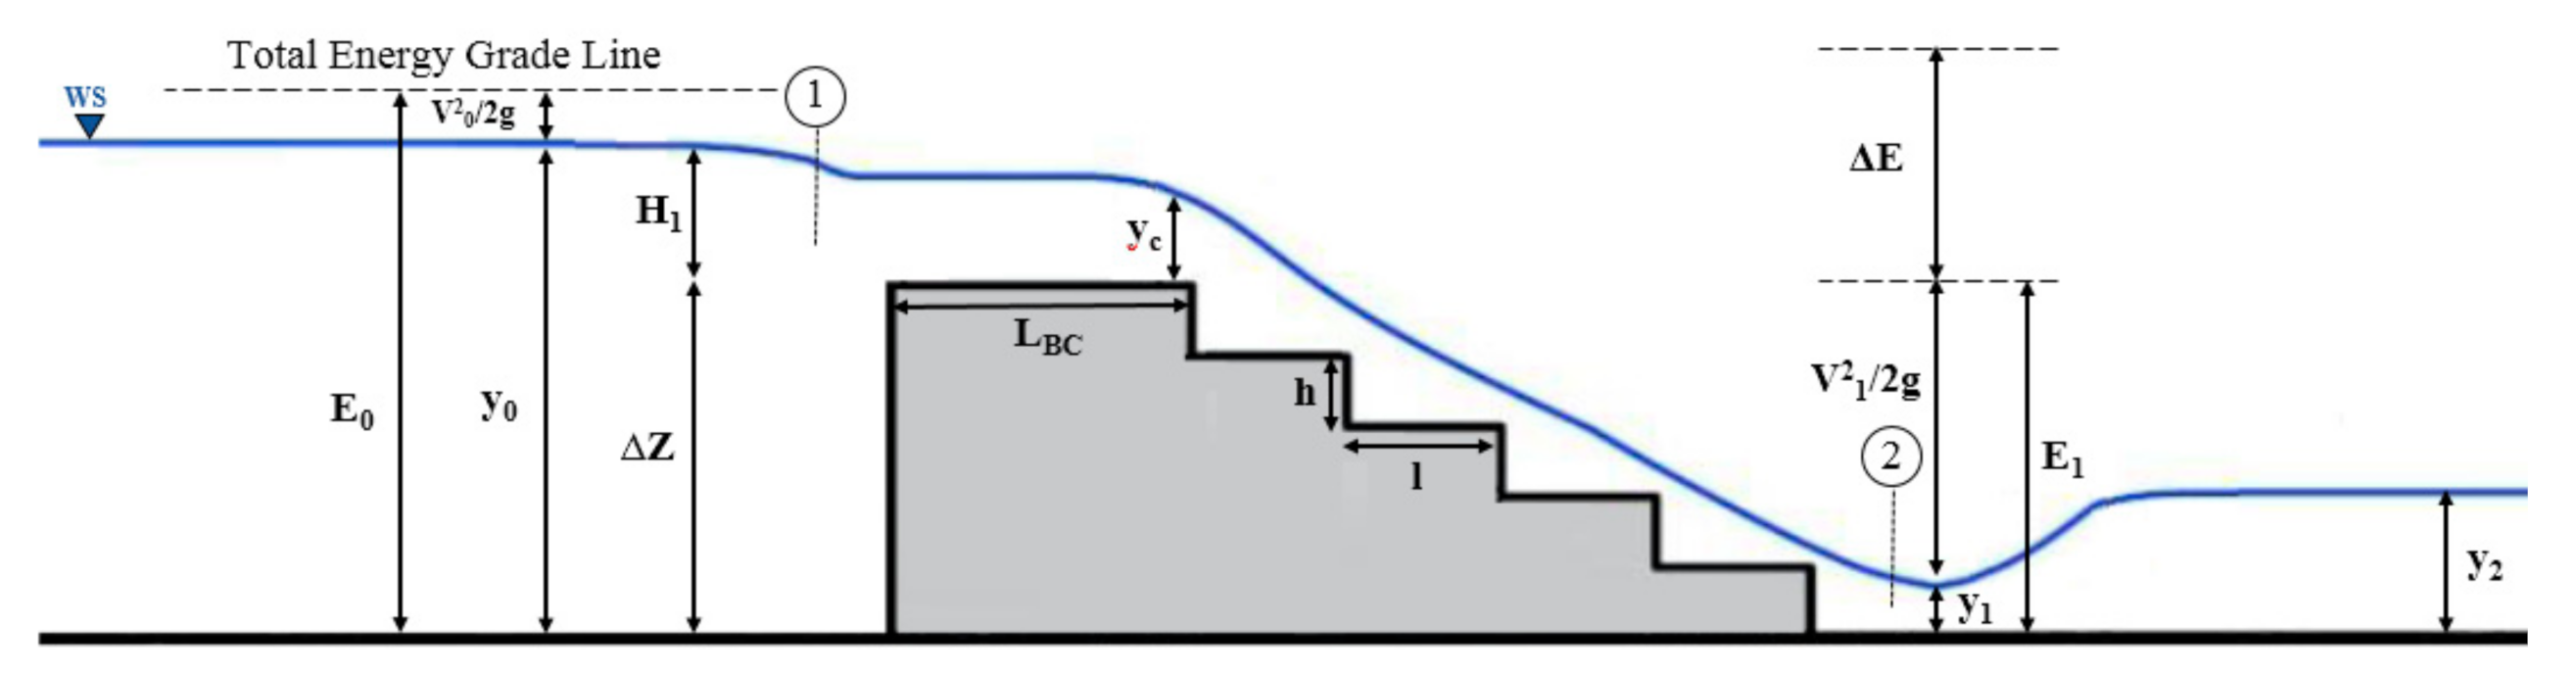
According to the notations in Figure 3, the critical depth (yc) lies at the beginning and on the first step (yc = (Q/W)2/g1/3). In this case, Q (m3/s) is the discharge, W (m) the channel width, and g (m/s2) is the acceleration of gravity. On the other hand, the following equations can be used to obtain the total water energy upstream, downstream and energy dissipation of the spillway:
Here, E0 (m) is the total water energy upstream of the spillway; E1 (m) is the total water energy downstream of the spillway; ΔE (m) is total energy dissipation; ∆Z (m) is spillway height; yc (m) is critical depth and g (m/s2) is the acceleration of gravity.
2.3. Dimensional Analysis
The most important flow variables on the energy dissipation of hydraulic jump downstream stepped spillways are:
- (i)
- Fluid properties: Water density (ρ); Dynamic viscosity (μ).
- (ii)
- Flow characteristics: Upstream water depth (y0); Water depth from upstream and downstream of hydraulic jump (y1, y2); the critical depth (yc); Water velocity just downstream the spillway (V1); Water velocity downstream the hydraulic jump (V2); length of hydraulic jump (L), and the acceleration of gravity (g).
- (iii)
- Geometric properties: Spillway height (∆Z); Step length (l); Step height (h); slope of the chute (θ), The height of the elements (a) and Number of steps (N).
Thus, energy dissipation of flow is a function of these variables as follows:
Using Buckingham’s π theory, the most effective parameters on energy dissipation are derived as:
Fr1 and Fr2 are Froude number upstream and downstream of the hydraulic jump and Re represents the Reynolds number upstream of the hydraulic jump, i.e., Re = (ρ × V1 × y1)/μ [31].
2.4. Experimental Work
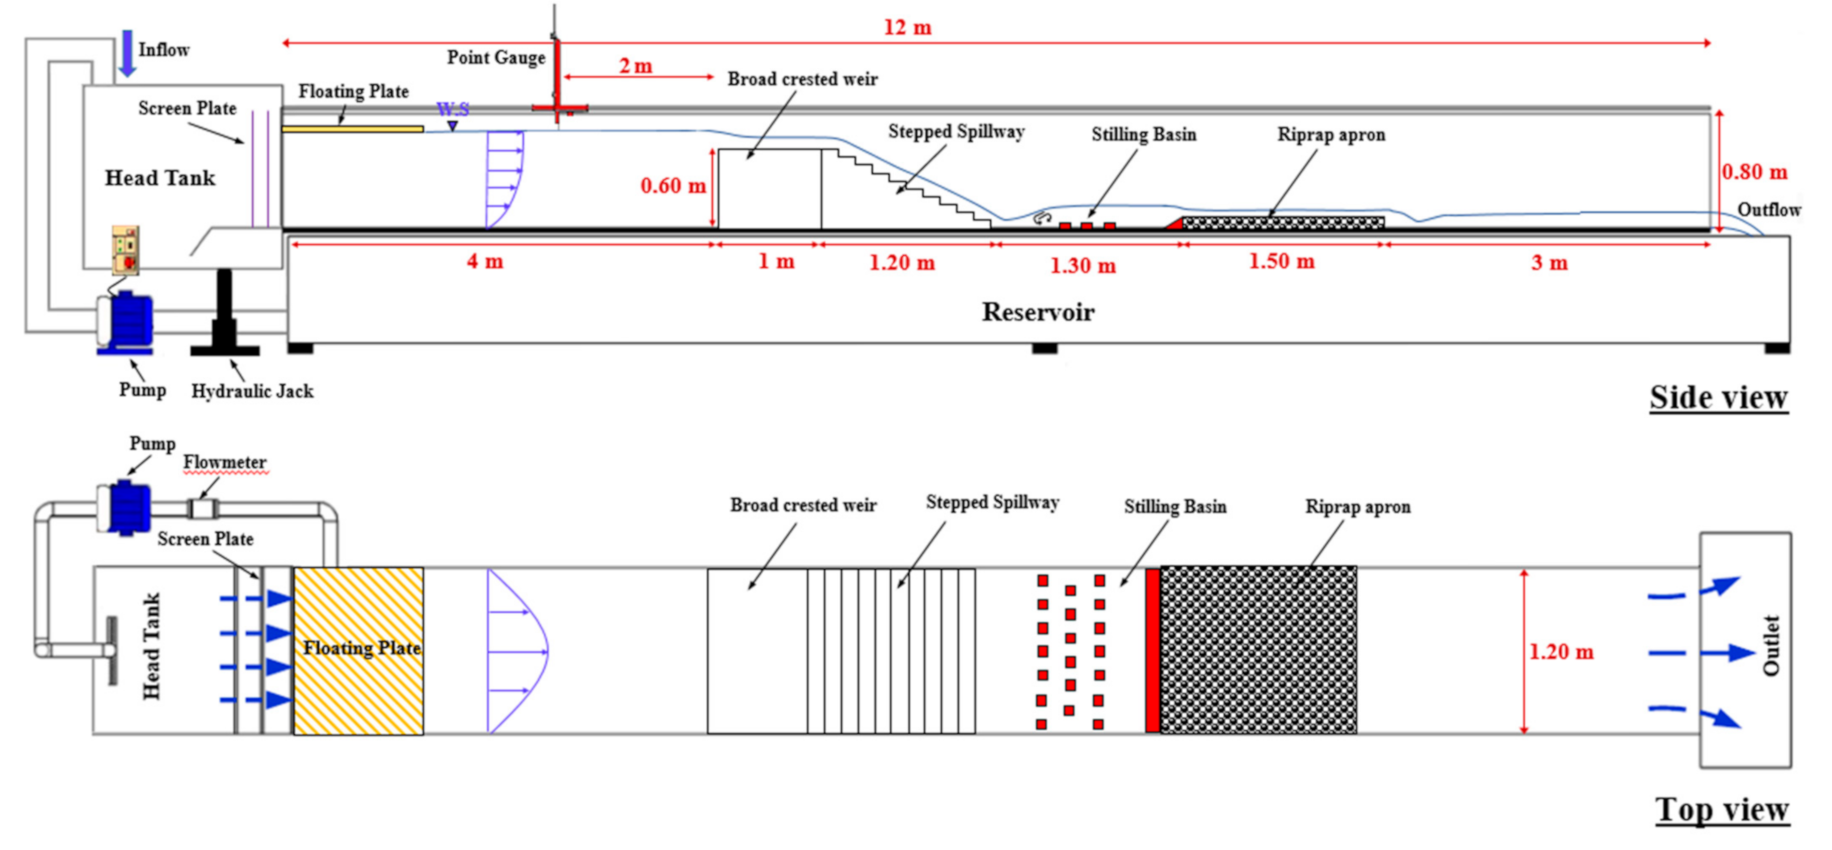
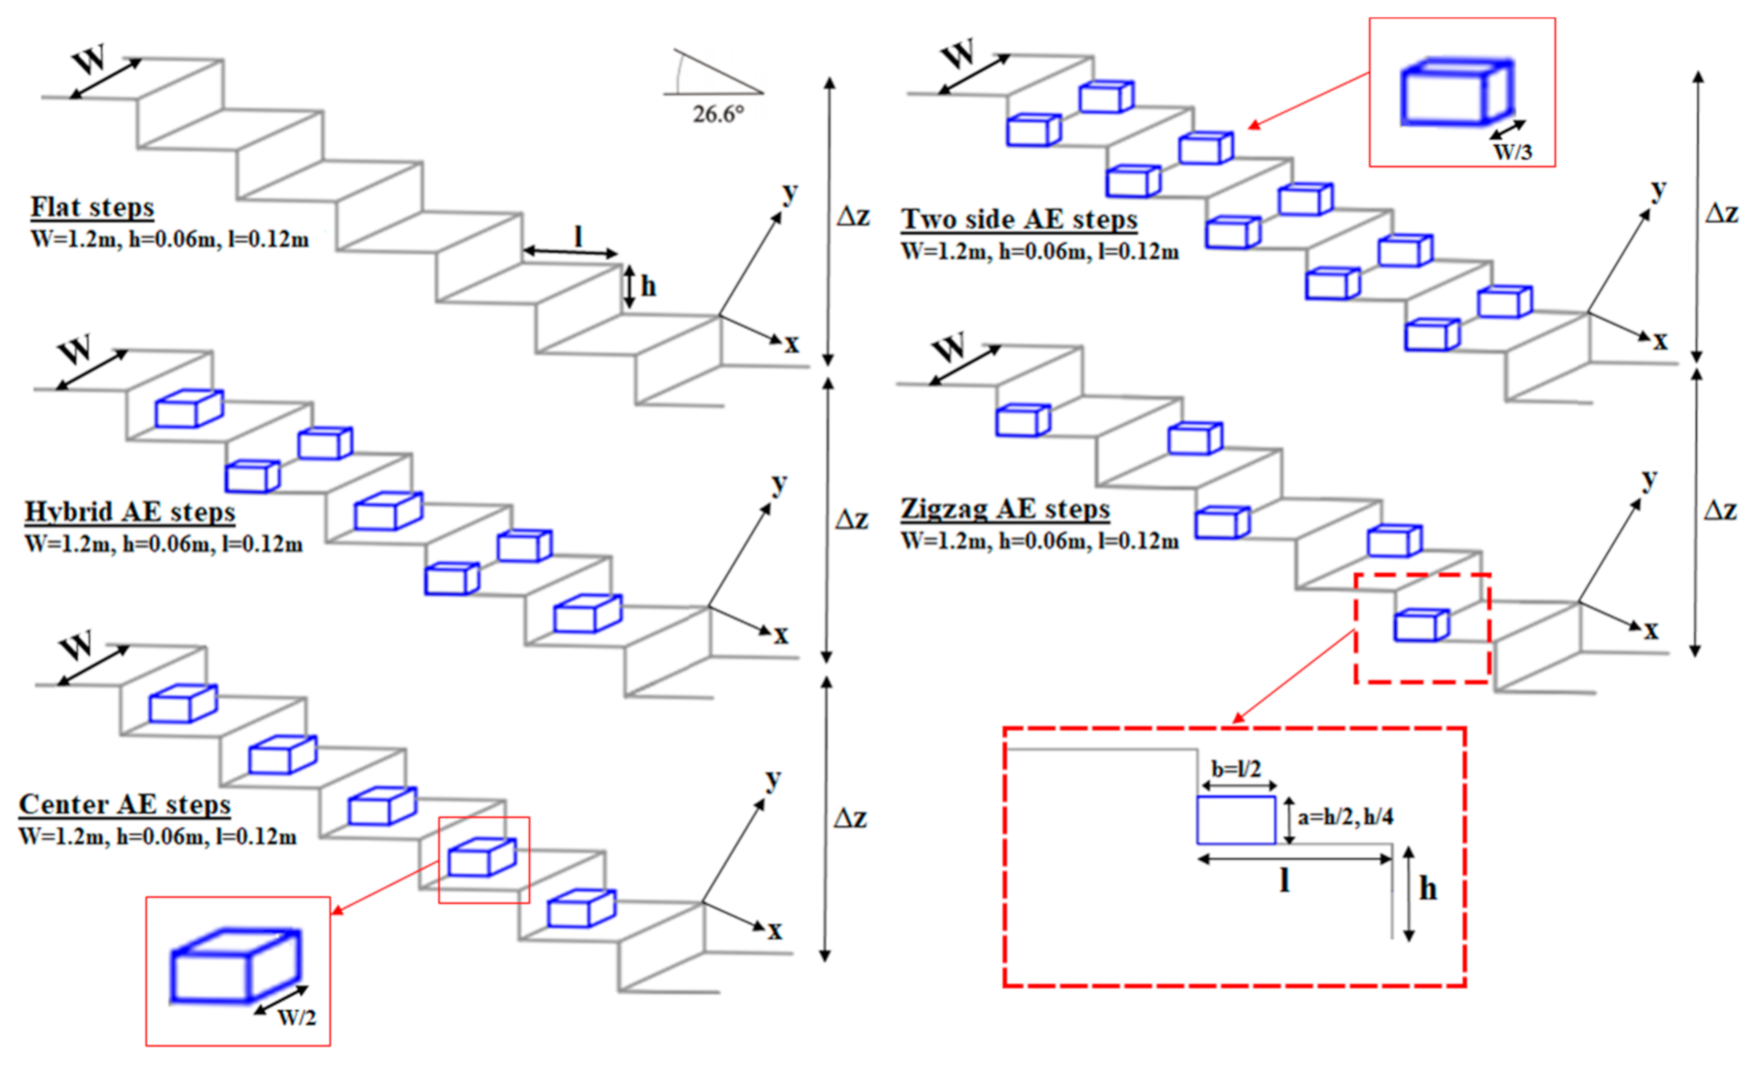
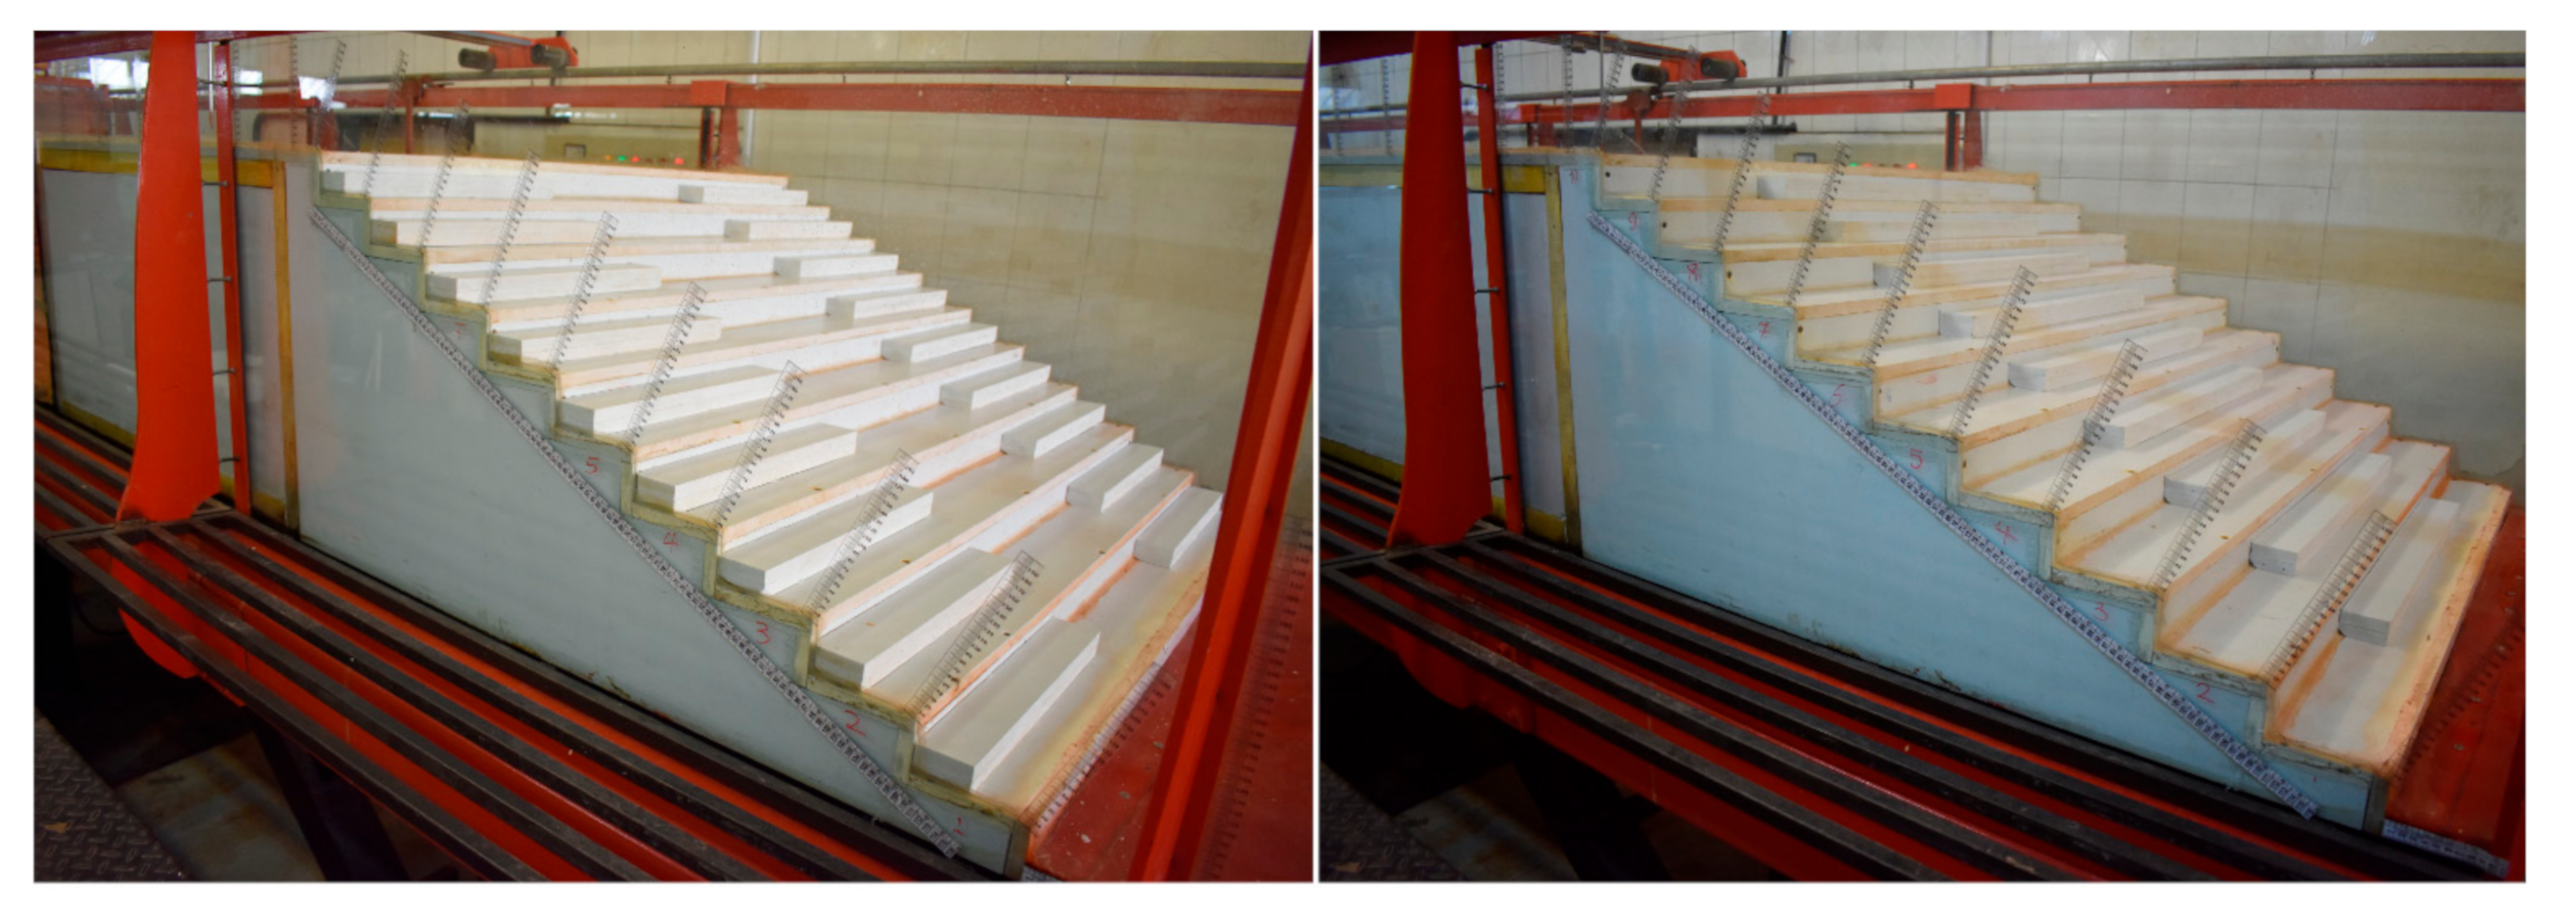
According to Figure 4, the tests were carried out in a rectangular flume with a length of 12 m, a width of 1.2 m, and a height of 0.8 m. The flume had glass walls (to improve flow visibility and reduce friction) and a steel floor. With plexiglass, the influence of sidewall effects is considered to be negligible (see Johnson [32] and Ghaderi et al. [33]). The slope of the flume is adjustable by a hydraulic jack; however, for this study, the slope was set to zero for all experiments. Flow in the flume was supplied by a pump with a maximum capacity of 55 l/s and was pumped into the flume’s head tank through a polyethylene pipe with a diameter of 0.2 m. The flow discharge entering the pump could be adjustable by a butterfly valve from the main tank. An ultrasonic flow meter with the precision of ±1 l⁄s was used on the transmission pipe to measure the discharge. Next to the head tank, two screen plates were used for flow relaxation, and also one floating Styrofoam plate fixed along with the flow was used to reduce water level fluctuations. The experiments were conducted on a stepped spillway with a slope of 26.60° and consisted of 10 steps with step length (l) and height (h) 0.06 and 0.12 m, respectively. The tests encompassed two stepped spillway configurations, flat steps, appendance elements (AE) on steps with four cases in various arrangements (Figure 5). The center appendance elements and two side appendance elements lengths were W/2 = 0.6 m and W/3 = 0.4 m, respectively. The water flow depths upstream the broad-crested models and downstream the hydraulic jumps were measured using pointer gauges with 1 mm accuracy. The first, upstream, point gauge was located at 3∆Z to 4∆Z upstream of the models [34,35,36,37]. The second point gauge, located downstream of the hydraulic jumps, was used to measure the sequent depths of the hydraulic jumps. The flow was controlled by a broad-crested weir with height P = 0.6 m, width W = 1.2 m, and length of LBC = 1 m, with the following equation by Felder and Chanson [12]:
Here, q is the water discharge per unit width, H1 the upstream total head and g the gravity acceleration constant.
2.5. Numerical Modelling Analysis
The commercially available CFD program FLOW-3D® [38] was used for the numerical simulations. Due to the limited supply of flow by pumps in experimental work, discharge from 60 to 75 l/s was generalized by FLOW3D®. The FLOW-3D uses the finite volume method in a Cartesian, staggered grid to solve the RANS equations (Reynolds Average Navier-Stokes) that describe continuity and momentum and are expressed as:
where Ui and ui are average and fluctuating velocities in the xi direction, respectively. The instantaneous velocity is defined as ut = Ut + u ’t for the three perpendicular directions (I = 1, 2, 3) in which Xi = (x, y, z), Ut = (U, V, W), ut = (u ’, v ’, w ’) and ρ, µ, P, gi are density, dynamic viscosity, kinematic pressure, and gravitational acceleration, respectively. FLOW-3D® uses an advanced algorithm for tracking free-surface flows, called Volume of Fluid (VOF), developed by Hirt and Nichols [39]. The VOF transport equation is expressed by the following Equation (12):
Here, F denotes the fraction function. In particular, if a cell is empty F = 0, and if a cell is full F = 1 [38,40]. The free surface is determined at a position related to intermediate amounts of F (usually F = 0.5, but another intermediate amount may be determined by the user). In this study, the RNG k-ε turbulence model was employed for the turbulence calculations. The RNG k-ε was proposed by Yakhot and Orszag [41] and represents a modified version of the k-ε standard model. In particular, the RNG k-ε turbulence model has an additional term in its ε equation (see successive Equation (14)) that improves the accuracy for quickly strained and swirling flows and also has good accuracy based on the results of numerical investigations by Bayon et al. [28], Daneshfaraz et al. [35], Ghaderi et al. [42], Lauria et al. [43], Ghaderi et al. [44] and Pourshahbaz et al. [45]. The adopted turbulence scheme is a two-equation model that is expressed as:
Here, k is the turbulent kinetic energy, ε is the turbulence dissipation rate, Gk refers to the generation of turbulent kinetic energy caused by the average velocity gradient, Gb denotes the generation of turbulent kinetic energy caused by buoyancy, while Sk and Sε are source terms. αk and αε are inverse effective Prandtl numbers for k and ε, respectively. μeff is the effective viscosity μeff = μ+μt, being that μt is the eddy viscosity. The following equations provide detail on how the effective viscosity is determined.
The constant values for this model are [38]:
Cµ = 0.0845, C1ε = 1.42, C2ε = 1.68, C3ε =1.0, σk = 0.7194, σε = 0.7194, η0 = 4.38, and β = 0.012.
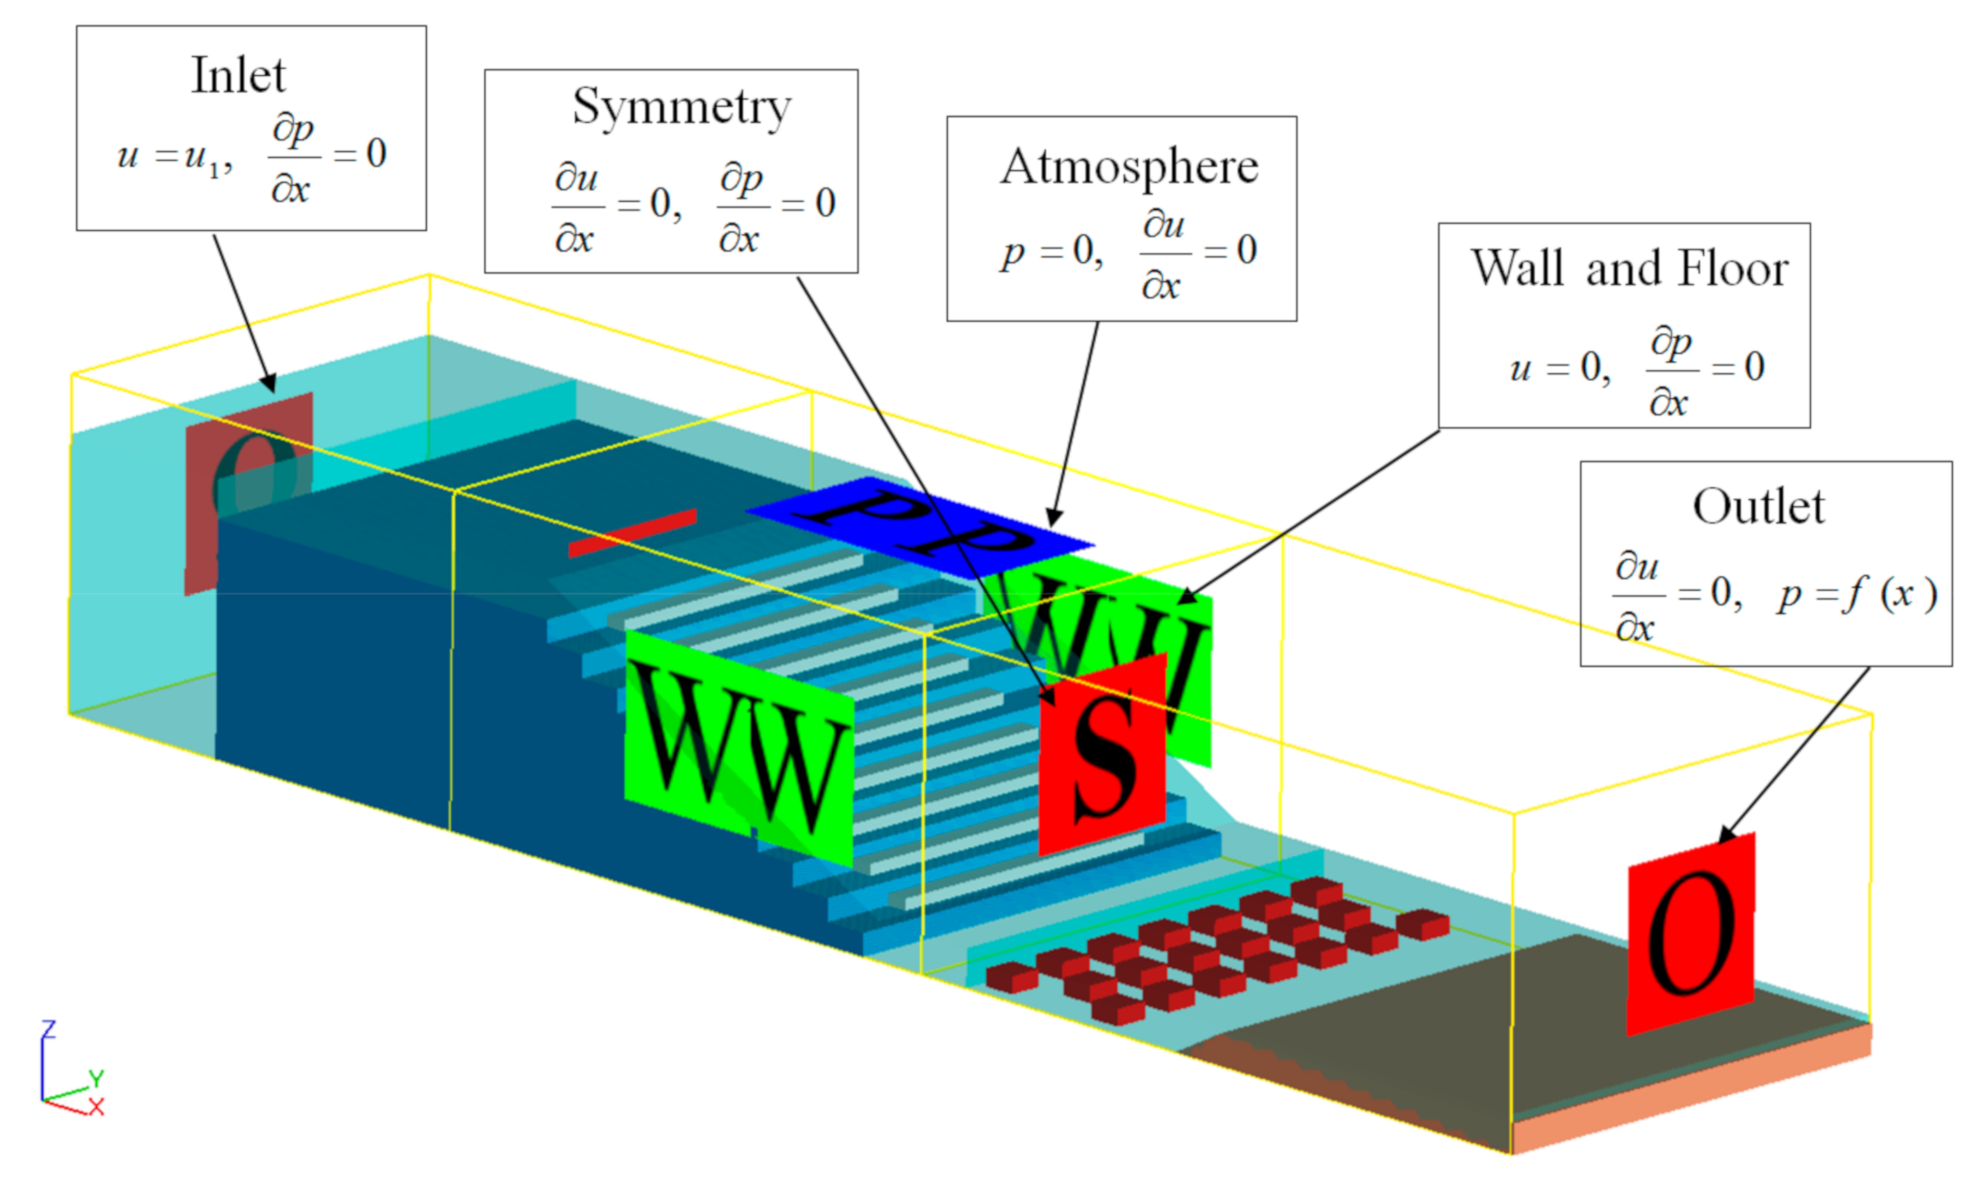
In the fluid domain, the boundary conditions were set according to the experimental condition. In the upstream of the domain, a discharge flow rate (Q) definition was set. The downstream section (outlet) of the domain was treated as an outflow (O) boundary condition. The bottom and the sides behave as rigid walls (W). No-slip conditions are expressed as zero tangential and normal velocities (u = v = w = 0, where u, v, and w are the velocities in the directions x, y, and z, respectively) that were used at the wall boundaries. For the upper boundary, the atmospheric pressure boundary condition due to the flow to enter and leave the domain as null von Neumann conditions was imposed on all variables except for pressure, which is set to zero. Symmetry (S) was used at the inner boundary conditions as well. A simple scheme of the computational domain and associated boundary conditions can be observed in Figure 7.
To obtain mesh-independent results, three different mesh sizes were used and the grid convergence index (GCI) methodology was employed to select the appropriate mesh, which is a recommended method for evaluating the discretization error; three various computational meshes were applied to choose the appropriate one, e.g., Bayon et al. [28], Ghaderi et al. [23], and Abbasi et al. [46]. This methodology was proposed by Roache [47] and was developed following the Richardson extrapolation method [45]. Cell size was considered the minimum refinement ratio (r = Gcoarse/Gfine), which was a value of 1.3, as recommended by Celik et al. [48]. To this purpose, a refinement ratio of 1.37 was considered for reducing the grid sizes. Table 2 shows some characteristics of the computational grids.
Two parameters of discharge flow rate and water depths upstream of stepped spillway at six different locations for CFD simulations were used to evaluate the accuracy of the grid. The apparent order of convergence p can be calculated as follows:
where f1, f2, f3 are the parameters obtained from CFD simulations (f1 corresponds to the fine mesh) and r is the refinement rate. The fine-grid convergence index is defined as [46]:
Here, ε = (f2-f1)/f1 is relative error, f2 and f3 are medium- and fine-grid solutions, respectively. Dimensionless indices GCI12 and GCI23 can be calculated:
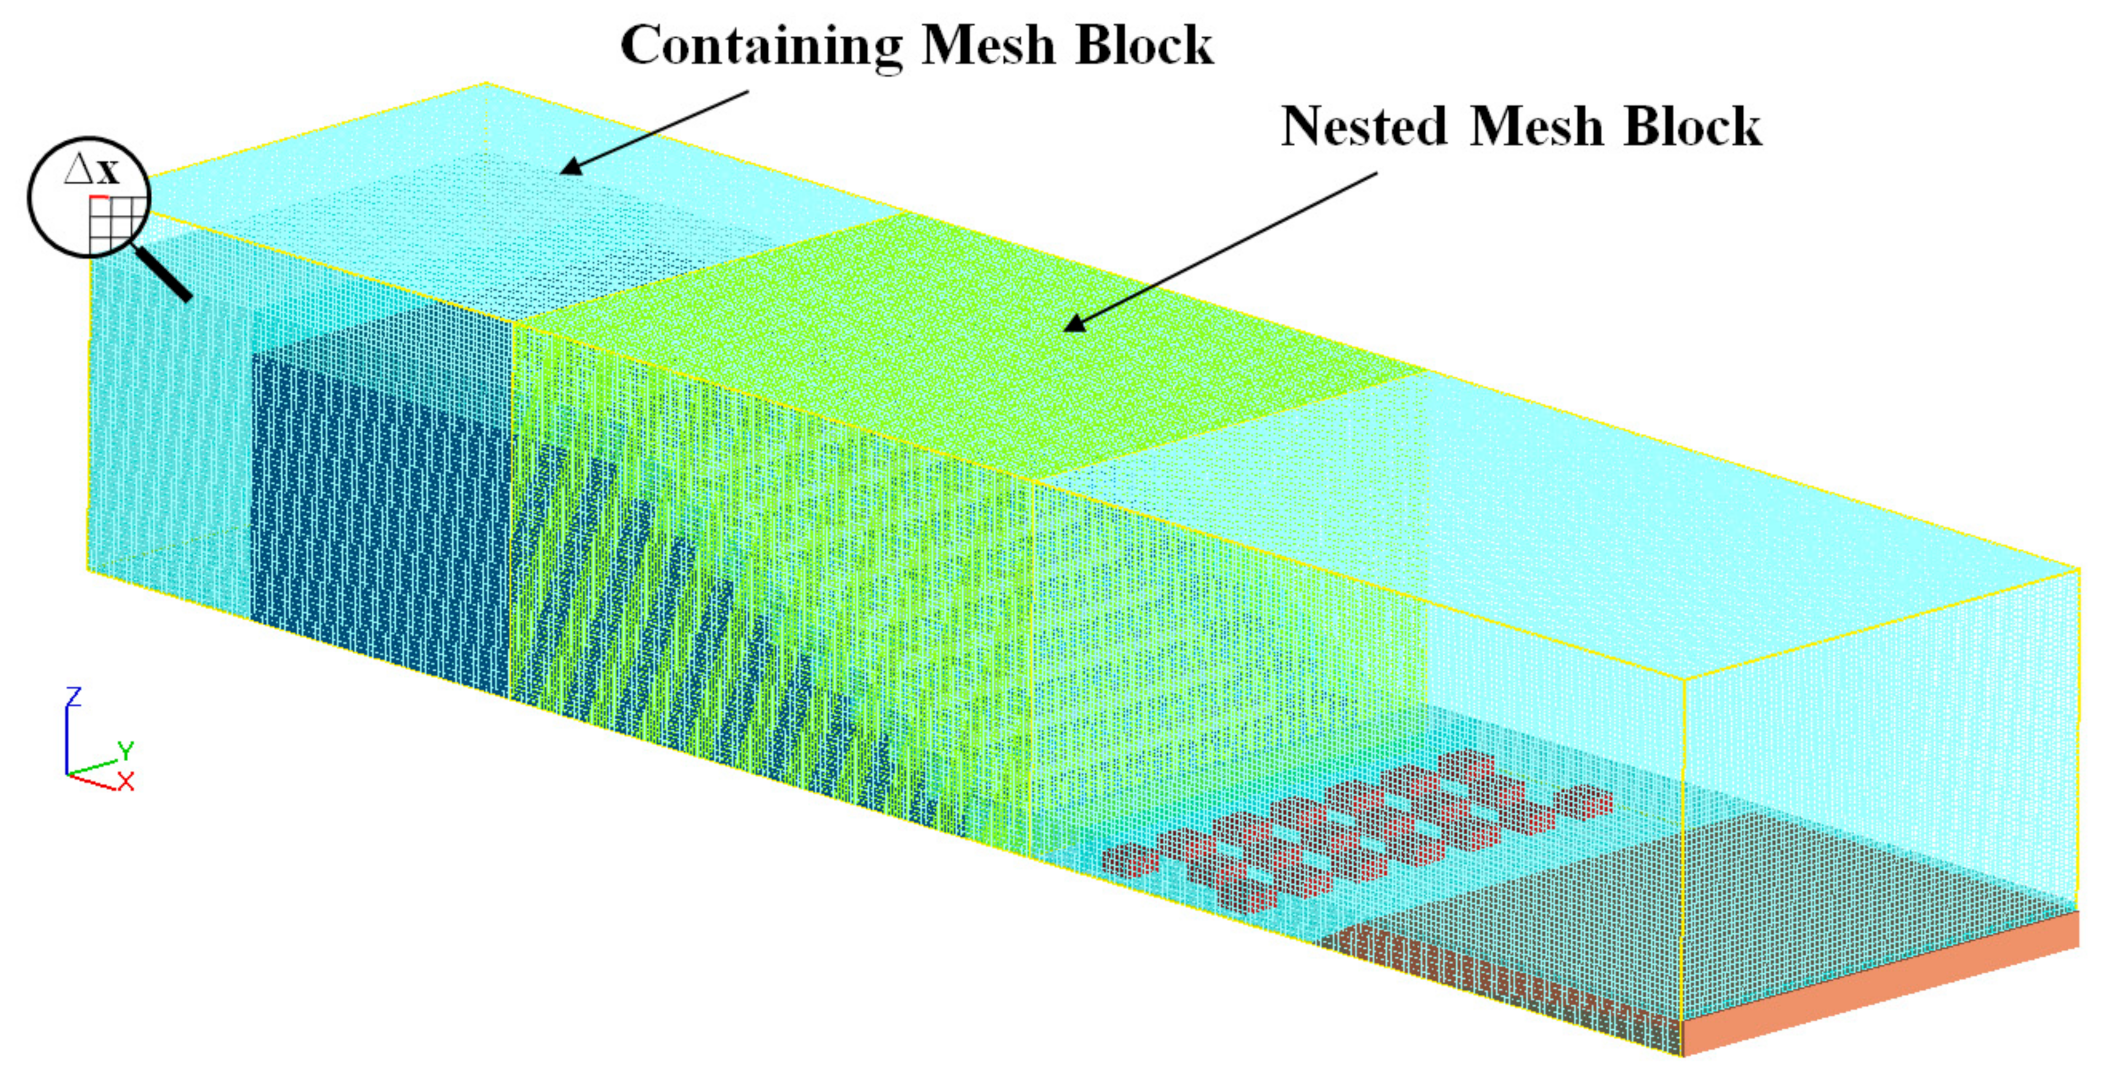
Then the grid independence is achieved. The parameters of the Grid Convergence Index (GCI) were calculated from Equation (17) through Equation (19) and are shown in Table 3. Since the GCI values for the finer grid (GCI12) are small as compared to the coarser grid (GCI23), it can be inferred that the grid-independent solution is almost obtained and no further mesh modification is required. Computed values of GCI23/rpGCI12 close to 1 indicate that the numerical solutions are within the asymptotic range of convergence. As a result, the mesh consisting of a containing block with a cell size of 1.3 cm and a nested block of 0.95 cm was selected (see Figure 8).
3. Results and Discussions
3.1. Validity of the FLOW-3D® Model Results
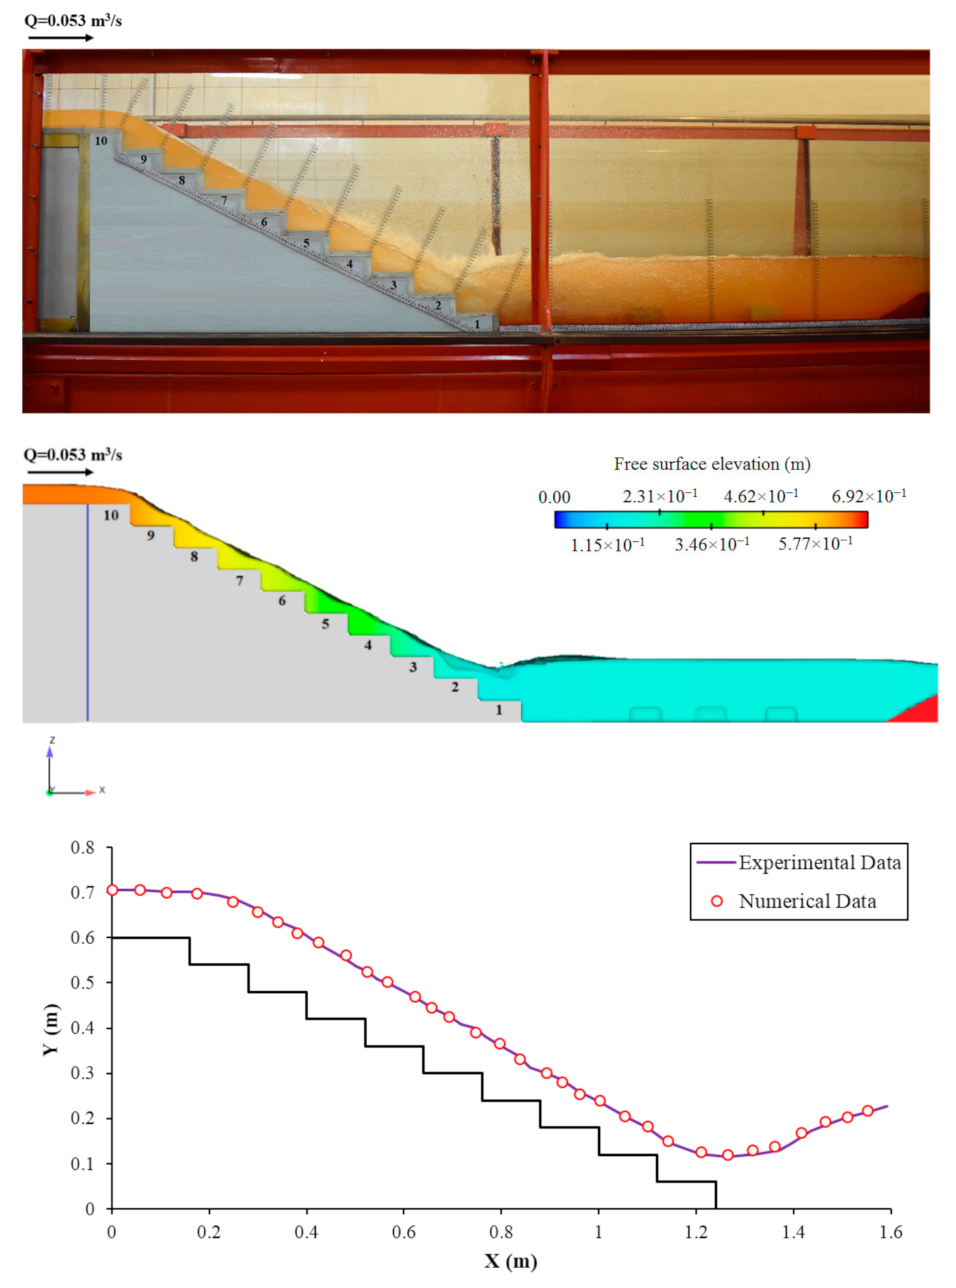
For verifying the obtained results from the numerical modeling, the water-free surface obtained from the numerical simulations is compared with the experimental data. According to Figure 9, the results show that the trend and value obtained from numerical modeling well agree with the experimental data. The average error of numerical modeling is 1.4%, which confirms the ability of the numerical model to predict the main specifications of a flow over a stepped spillway.
3.2. Flow Pattern
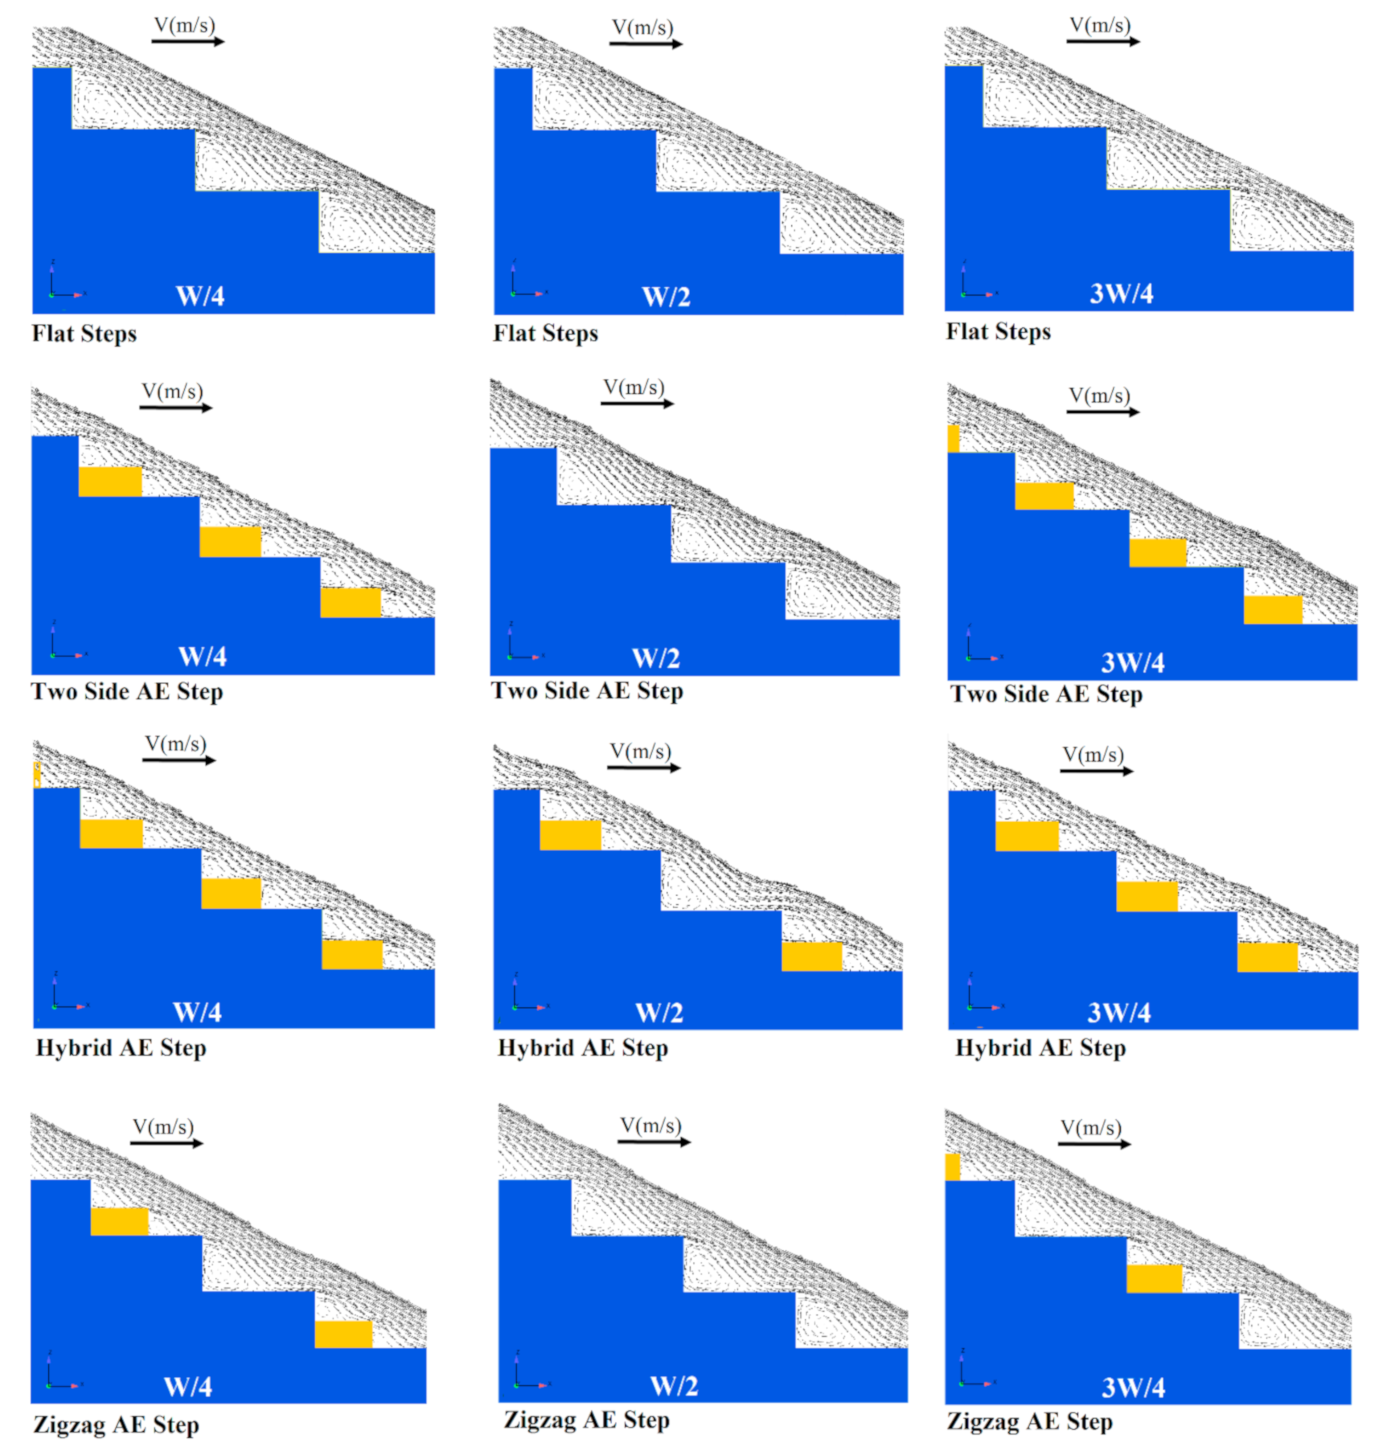
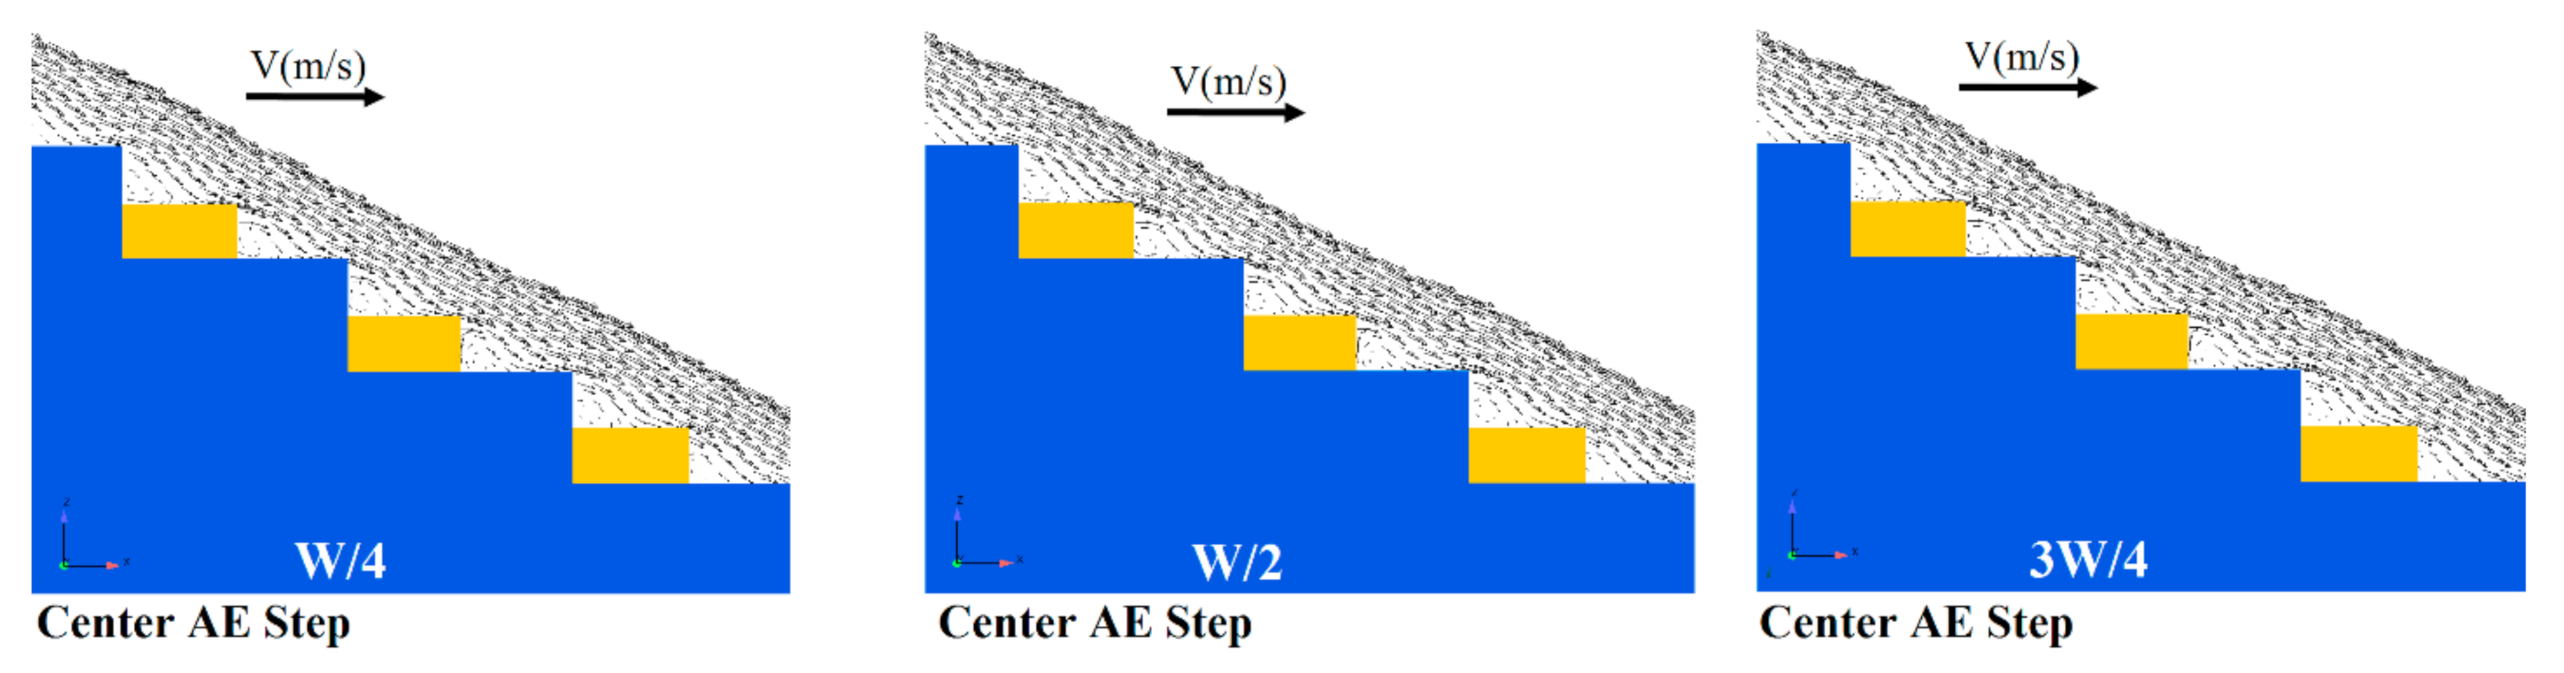
Figure 10 shows the representative streamlines on steps in each configuration. Three transverse locations were taken for all configurations: W/4, W/2(centerline), and 3W/4. As shown in Figure 10, the flow surface over steps of the flat stepped spillway was approximately parallel to the pseudo-bottom [26,49], although appendance elements on the step presented some instabilities caused by the staggered configurations. It is evident that, for appendance elements on the step, the vortex was divided into two areas in the recirculating zones on the step and appendance elements. Also, the simulations indicate that numerical models can predict recirculation zones [26,50,51,52,53].
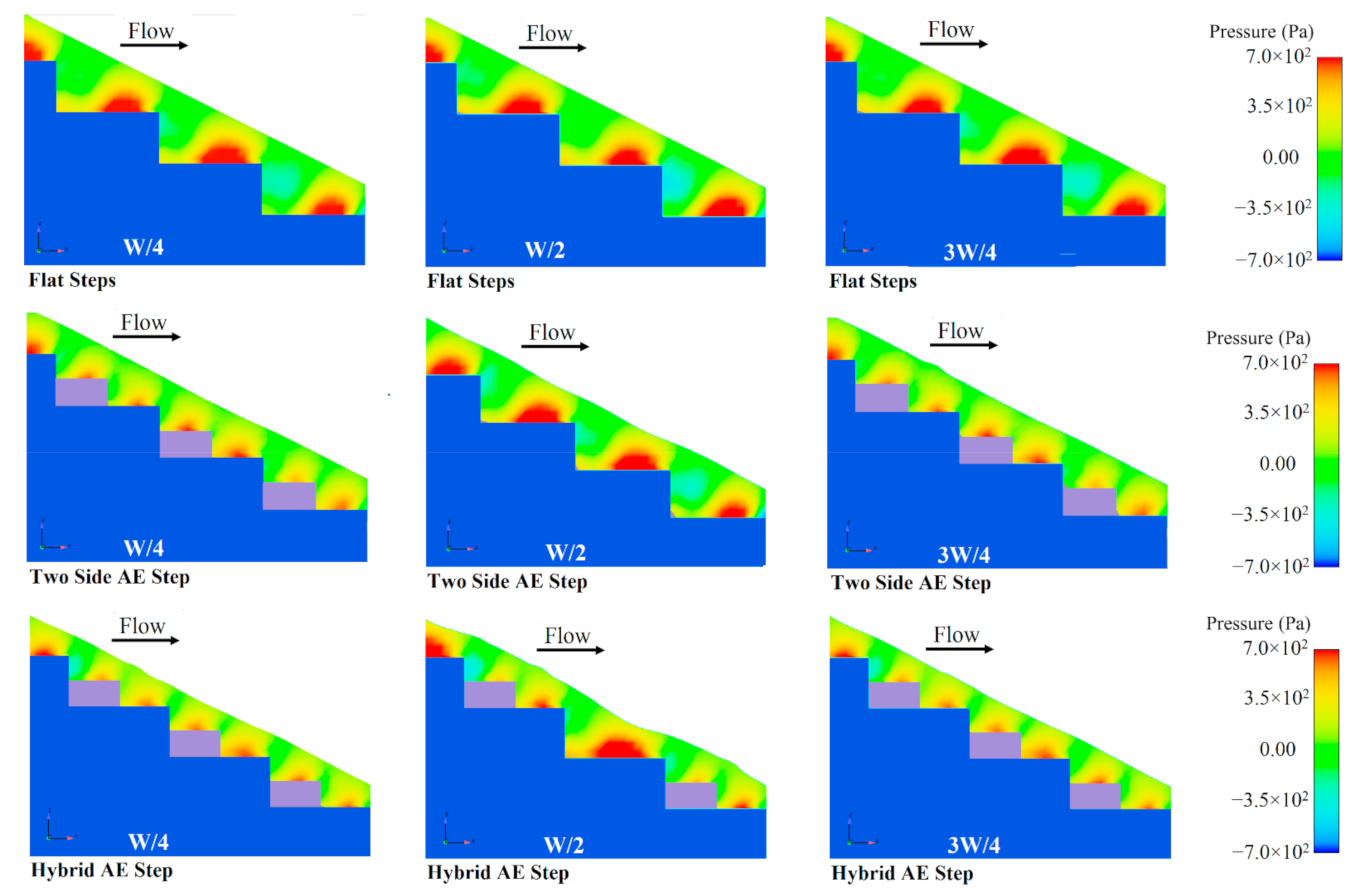
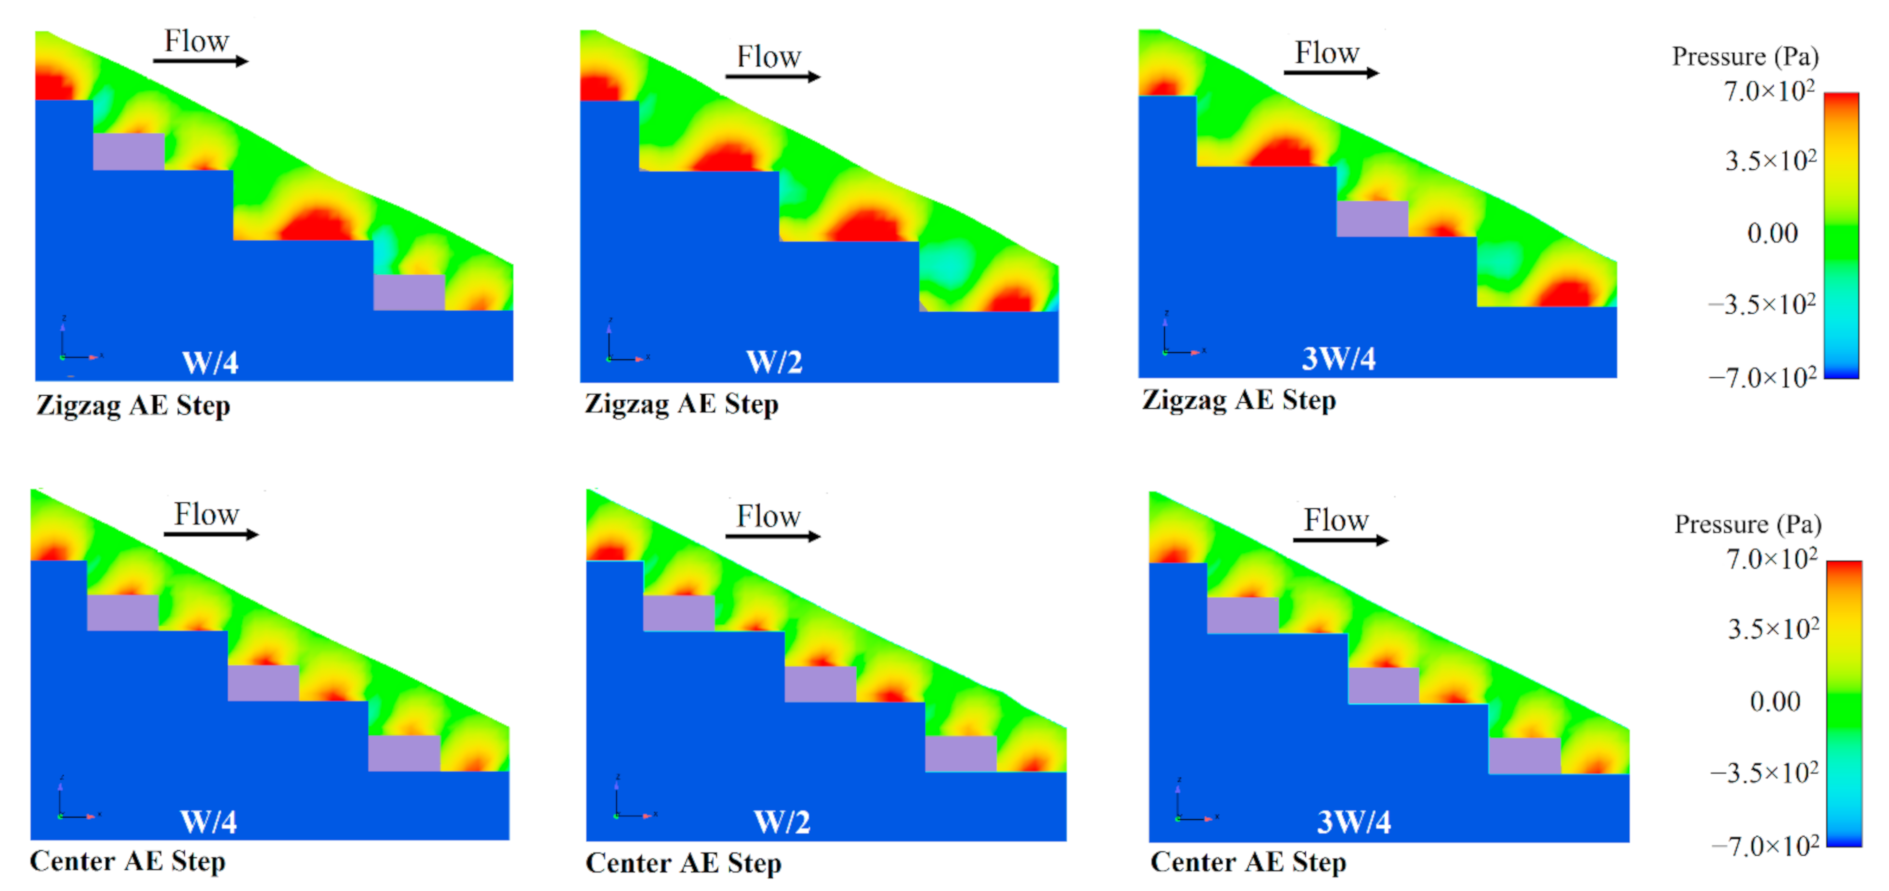
Figure 11 displays pressure contour for different configuration steps with the same slope and discharge. The pressure value on the step in flat steps is larger compared to other configurations with appendance elements, and the location of maximum pressure moves from a point in the step center towards the end of the step. Negative pressures can be observed in the flat stepped spillway: The maximum value occurred at the upper part of the step wall on the vertical face of the step. For all the proposed configurations (flat and appendance elements on step), pressure values near the step are never negative: since cavitation occurs in regions of low pressures, it is most likely to occur along the vertical step surface; with appendance elements on the step, negative pressures are divided into smaller, i.e., therefore, less subject to cavitation.
3.3. Energy Dissipation and Residual Head
3.3.1. Flat Step Configuration
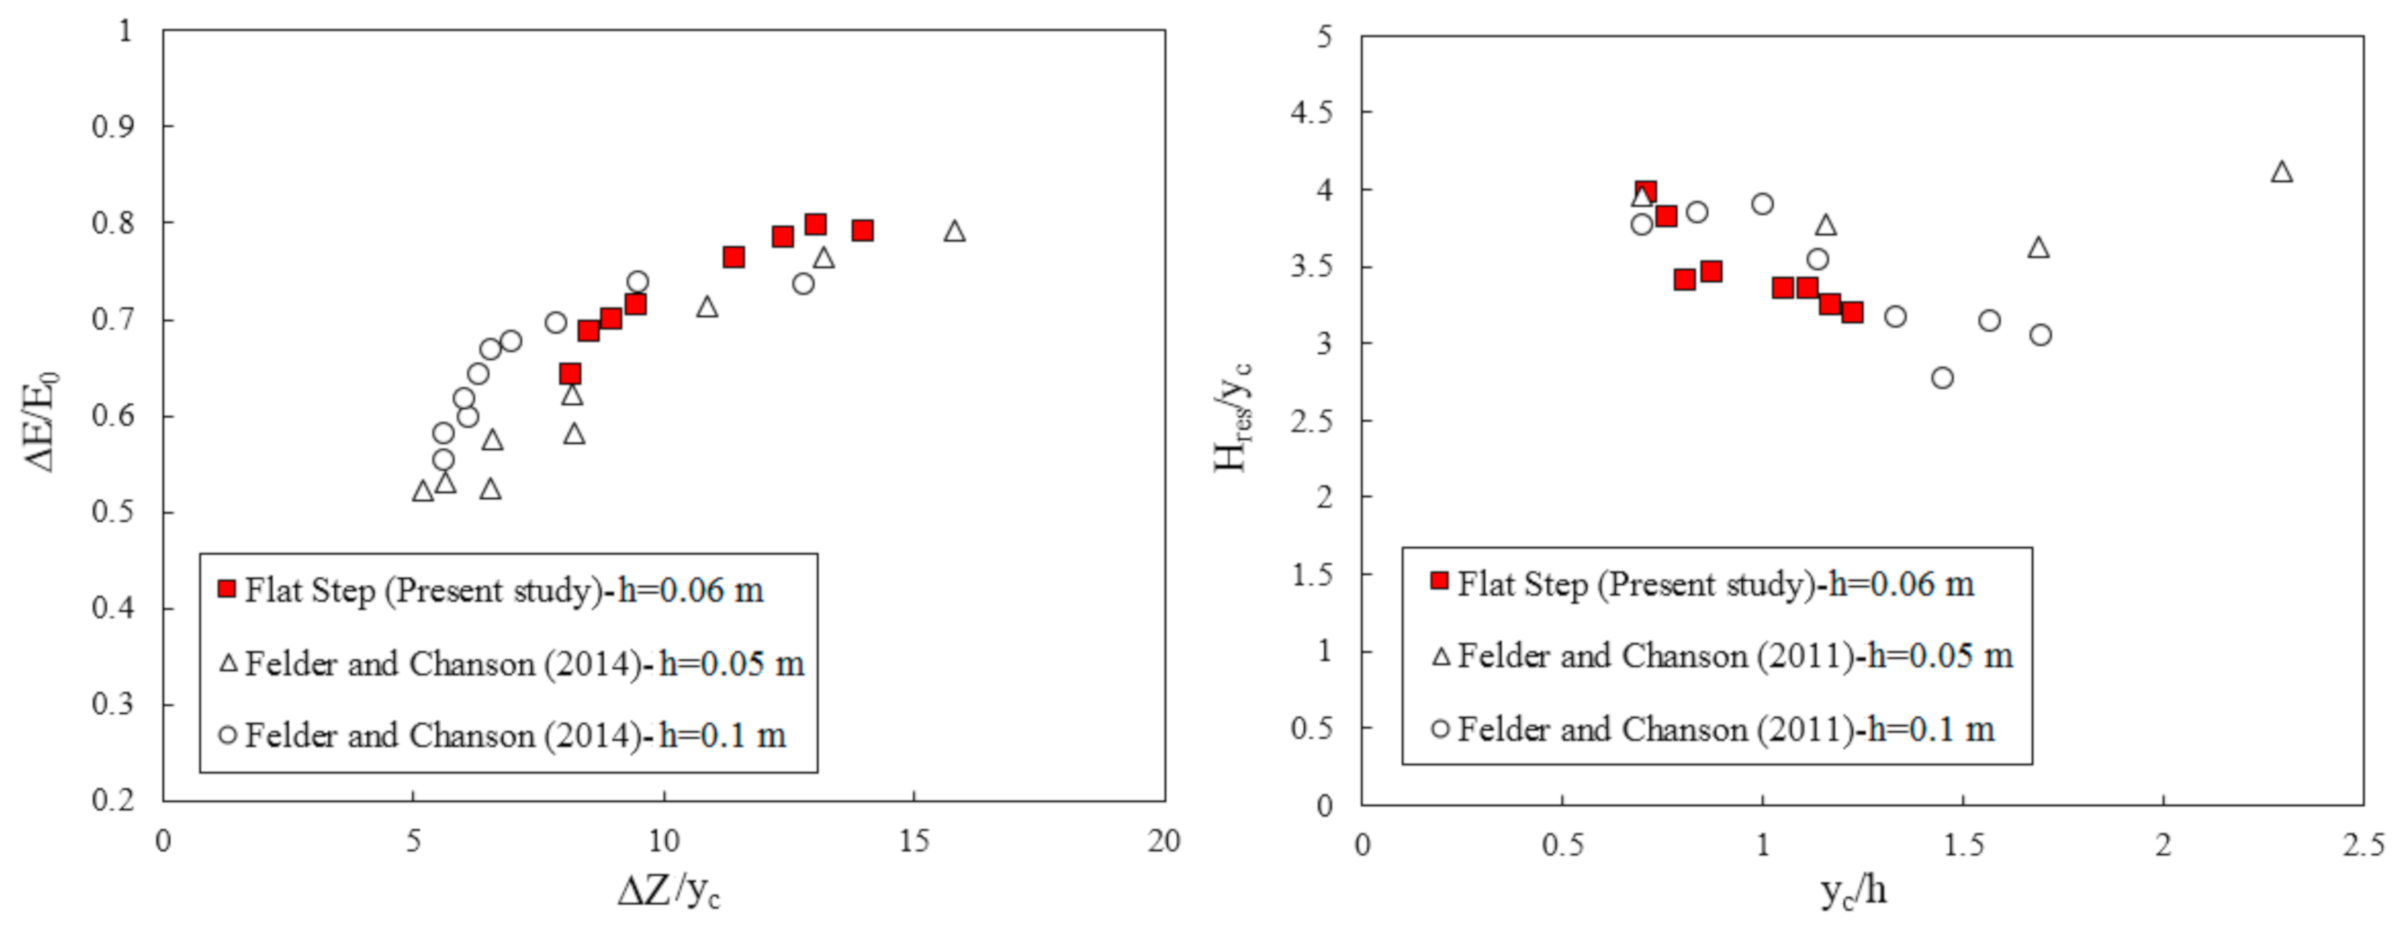
The residual energy at the chute’s downstream end is an important design parameter for the downstream energy dissipator, typically a stilling basin. The size of this stilling basin must be designed to allow the dissipation of the remaining energy to avoid damage and erosion of the river further downstream [54]. The rate of energy dissipation and residual head on the flat step is illustrated in Figure 12 as a function of the dimensionless variable of yc/h and ∆Z/yc, respectively. The present data for the flat steps are compared to a previous study with the same chute slope (θ = 26.60°), but where the step dimensions are not generally the same conducted by Felder and Chanson [14], in which ∆Z is the height of the dam, yc is the critical flow depth, and h is step height. The residual head, Hres, is:
The term V = q/y1 represents the mean flow velocity at the downstream end of the spillway. Also, θ, y, and g are the slope of the chute, the water flow depth, and the gravitational acceleration, respectively. From the results in Figure 11, the energy dissipation rate increases with increasing ∆Z/yc, which means that the energy dissipation rate decreases with increasing discharge, which is consistent with results from earlier studies of stepped spillways [14]. In addition, from the comparison of the results, as expected, a higher rate of energy dissipation was observed for the flat stepped spillway at low flow rates. According to Bung [10], energy dissipation is not related to step height. At low flow rates, the residual head is decreased due to the increasing discharge for all cases and it remained almost constant for the largest flow rates. However, for the largest flow rates, the discharge was not fully developed at the downstream end of the spillway and the residual energy might be overestimated [16,55]. The present findings are in good agreement with previous studies on stepped spillways with slopes of θ = 26.60°.
3.3.2. Appendance Elements on Steps
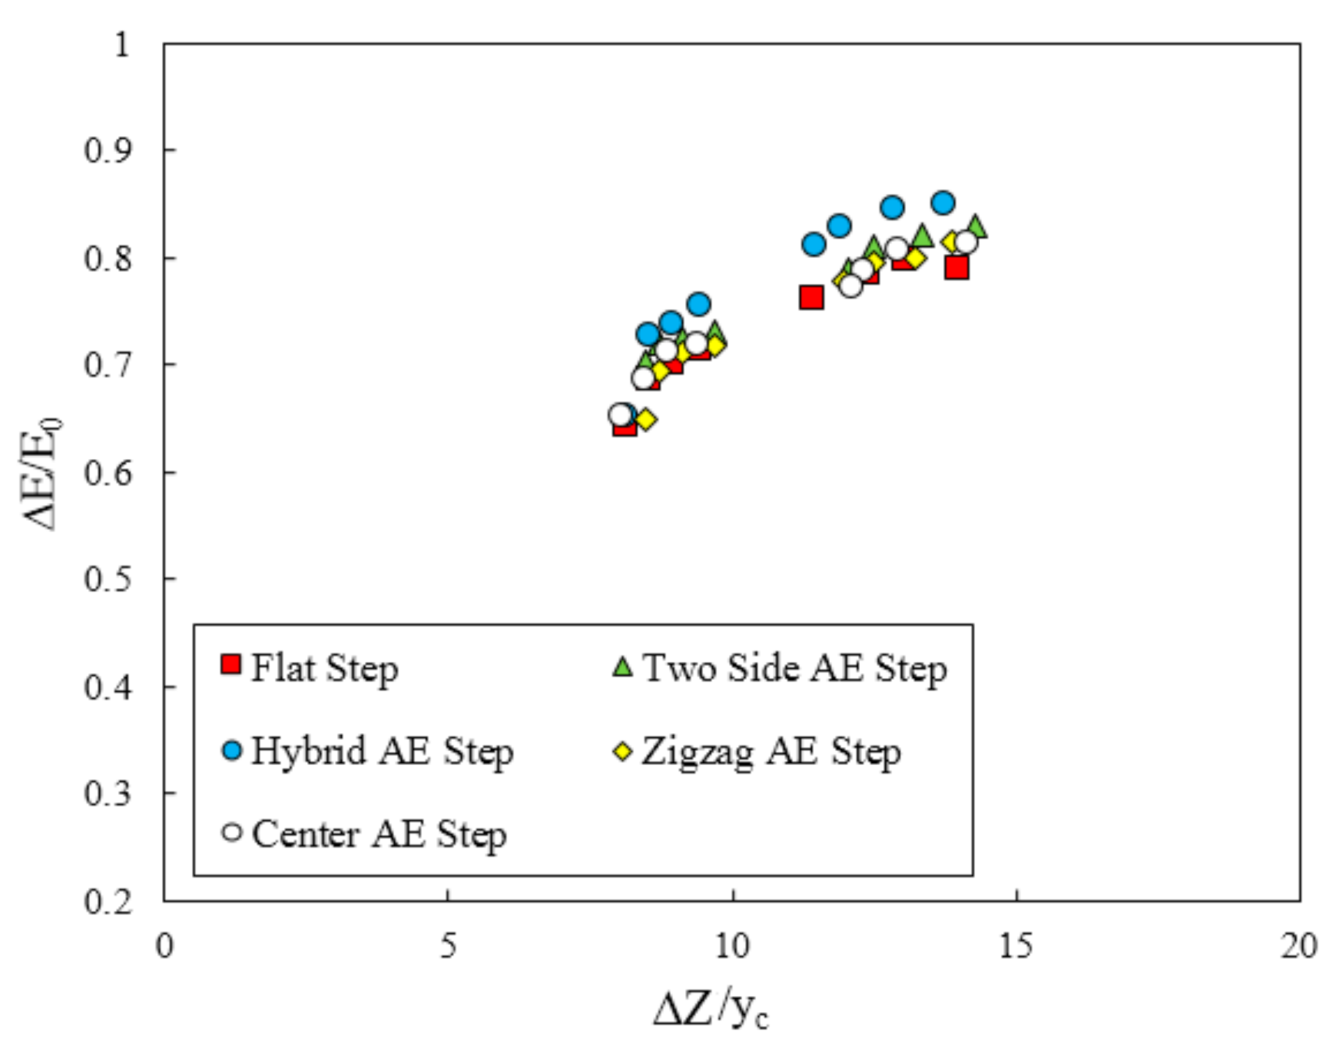
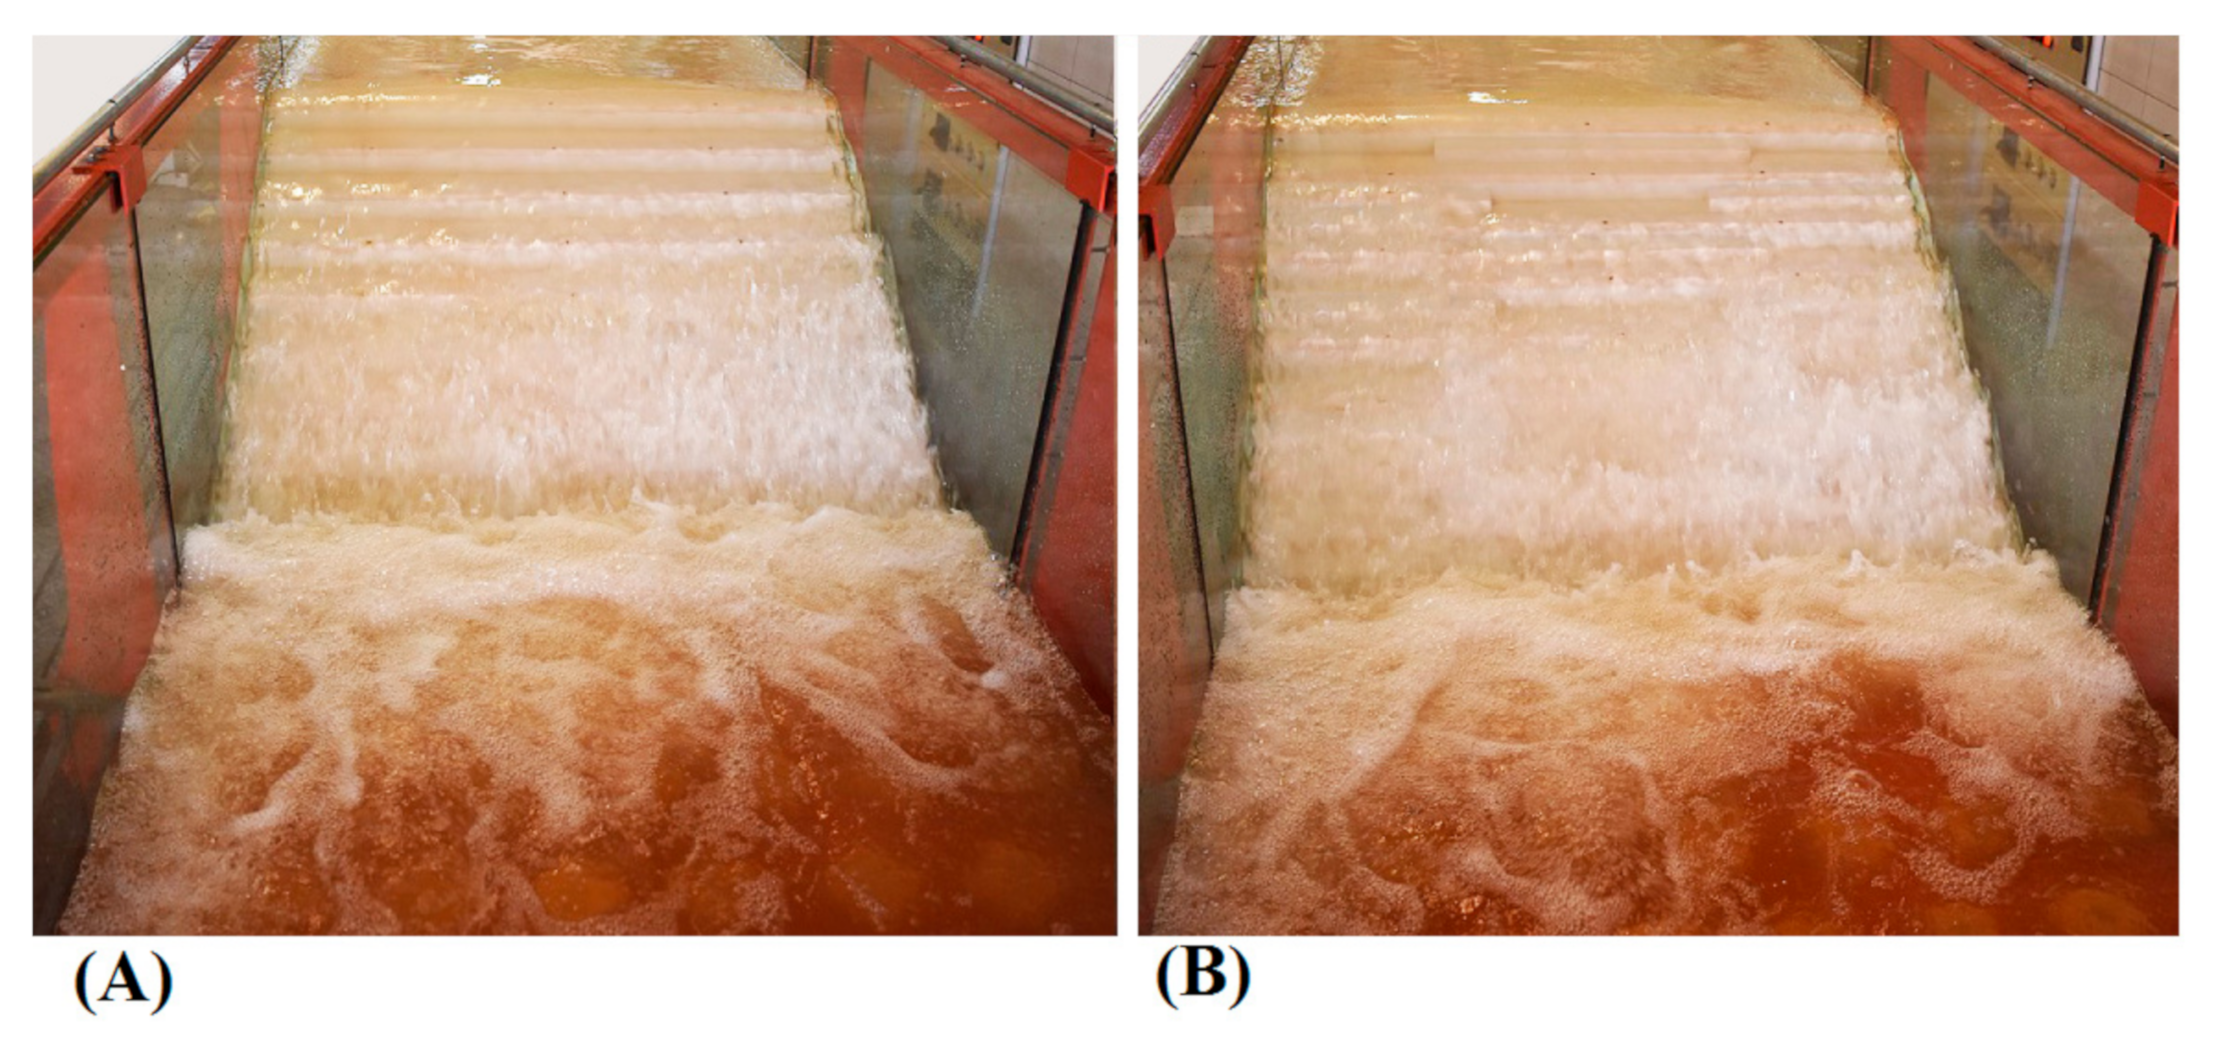
The amount of energy dissipation and residual head on the flat step with appendance elements (AE) on steps are shown in Figure 13. For all step configurations, the amount of energy-dissipated decrease with the increasing discharge was observed, which is consistent with earlier studies on stepped spillways [1]. Comparing the performance of the flat stepped spillway with appendance elements (AE) on steps shows that the rate of energy dissipation with appendance elements on step is greater. Adding appendance elements increases the streamlines interference and deflected jets on the steps (see Figure 14). The hybrid appendance elements step showed the best performance and the percentages of efficiency improvements are 7.20%, as mean.
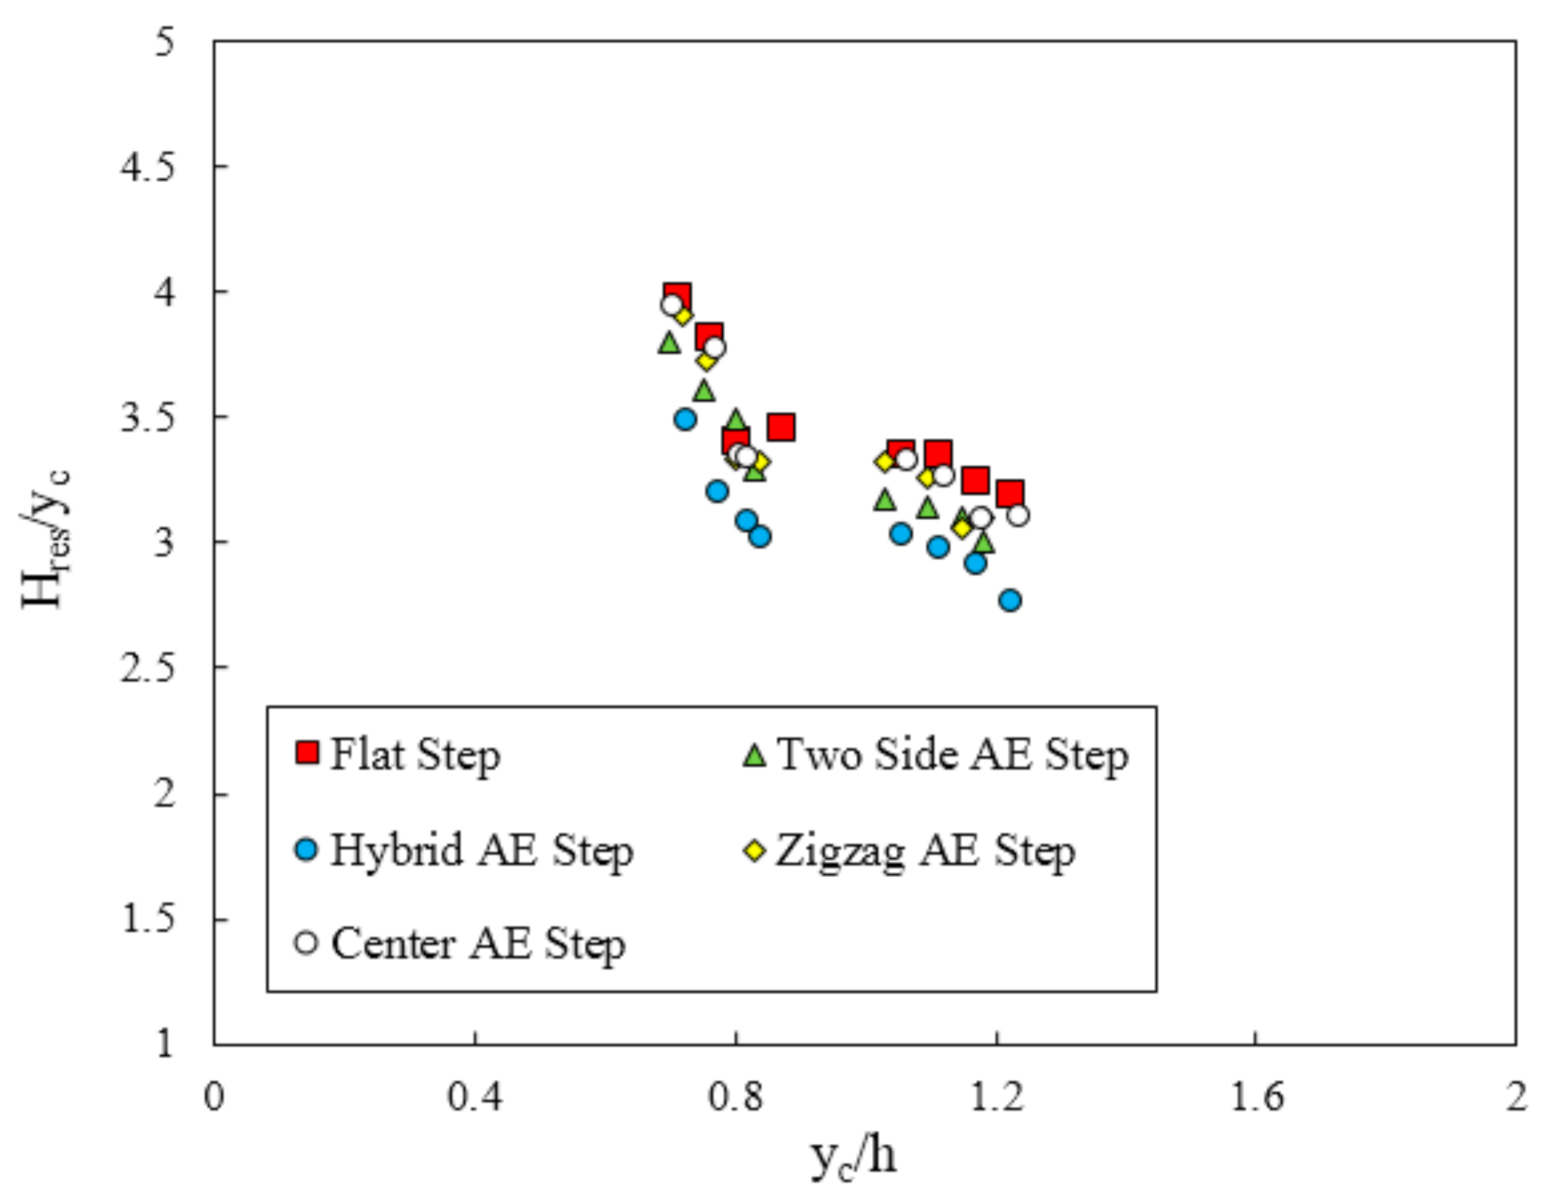
Figure 15 illustrates some differences in the residual head for the different step configurations: the residual head reduced more in the stepped spillway with the hybrid appendance elements step in comparison with the other step configurations and the flat stepped spillway under all discharges. For the smaller flow rates, the residual head decreased with increasing discharge for all models, while it was about constant for the largest flow rates. Under the same flow conditions, the dimensionless residual head on the flat stepped spillway is the largest (~3.47), while the average dimensionless residual head on the hybrid appendance elements step is ~3.02.
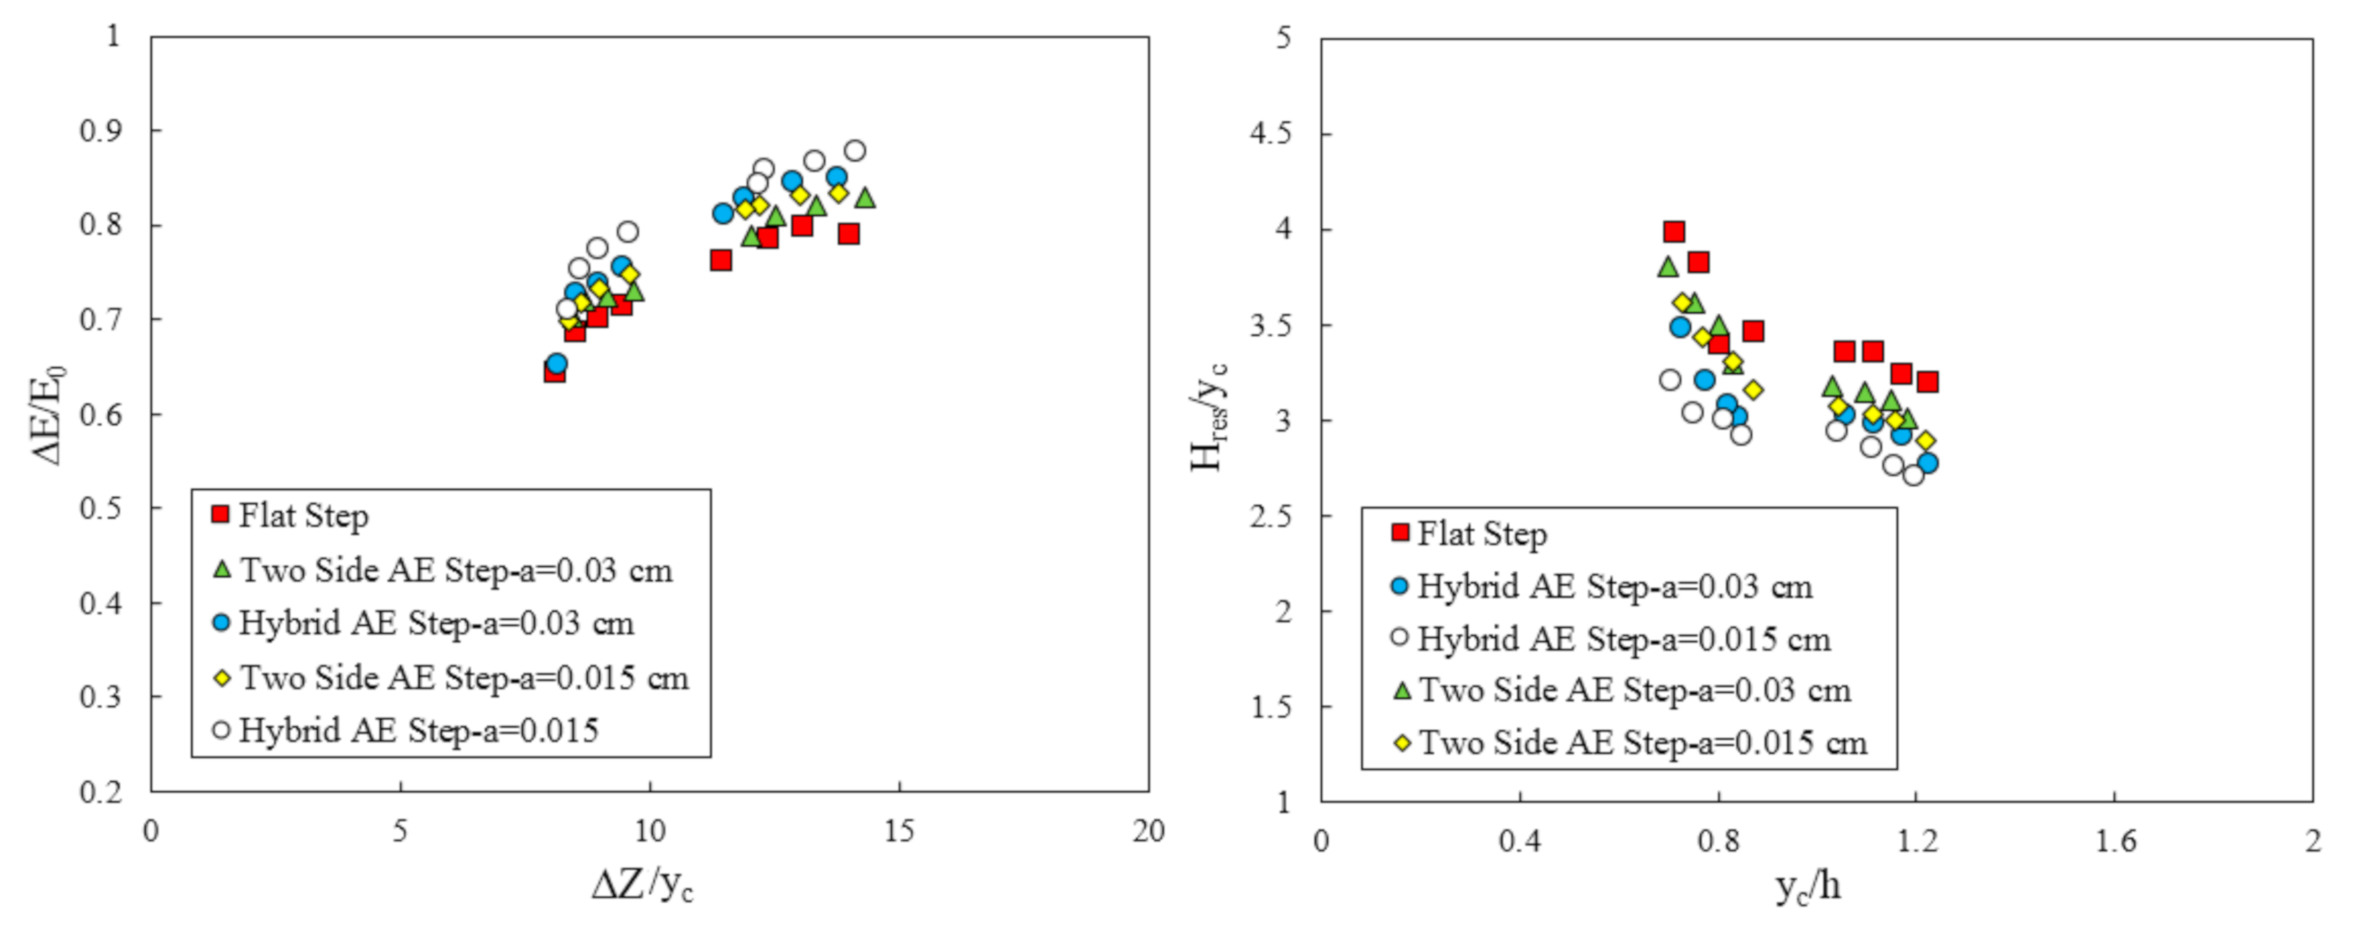
According to the results in this study, the hybrid and two side appendance elements step increases the rate of energy dissipation more than other types of arrangement of appendance elements step. Figure 16 shows a comparison of the rate of energy dissipation and the residual head of hybrid and two side appendance elements on the step with two different heights. Decreasing the height of the appendance elements increases the rate of energy dissipation and decreases the residual head to 3.20% and 7.40%, respectively. The effect of the height of the appendance elements on the rate of energy dissipation and the residual head can be explained by the deflected jets and cavity recirculation on the step of the stepped spillway. This cavity recirculation region has a strong secondary motion, and the intensity of this secondary motion increases as the appendance element’s height decreases.
3.4. Turbulent Kinetic Energy (TKE)
Turbulent kinetic energy (TKE) is resulting in the spillways due to mean velocity gradients [51] and is an important index to reflect the energy loss between two sections of the flow. TKE is characterized by measuring the root-mean-square of velocity fluctuations [56]. Considering the continuous values of velocities in the flow direction (u1, u2, u3, ..., un), the value of the root-mean-square velocity, urms, is obtained as:
Then, TKE is calculated as:
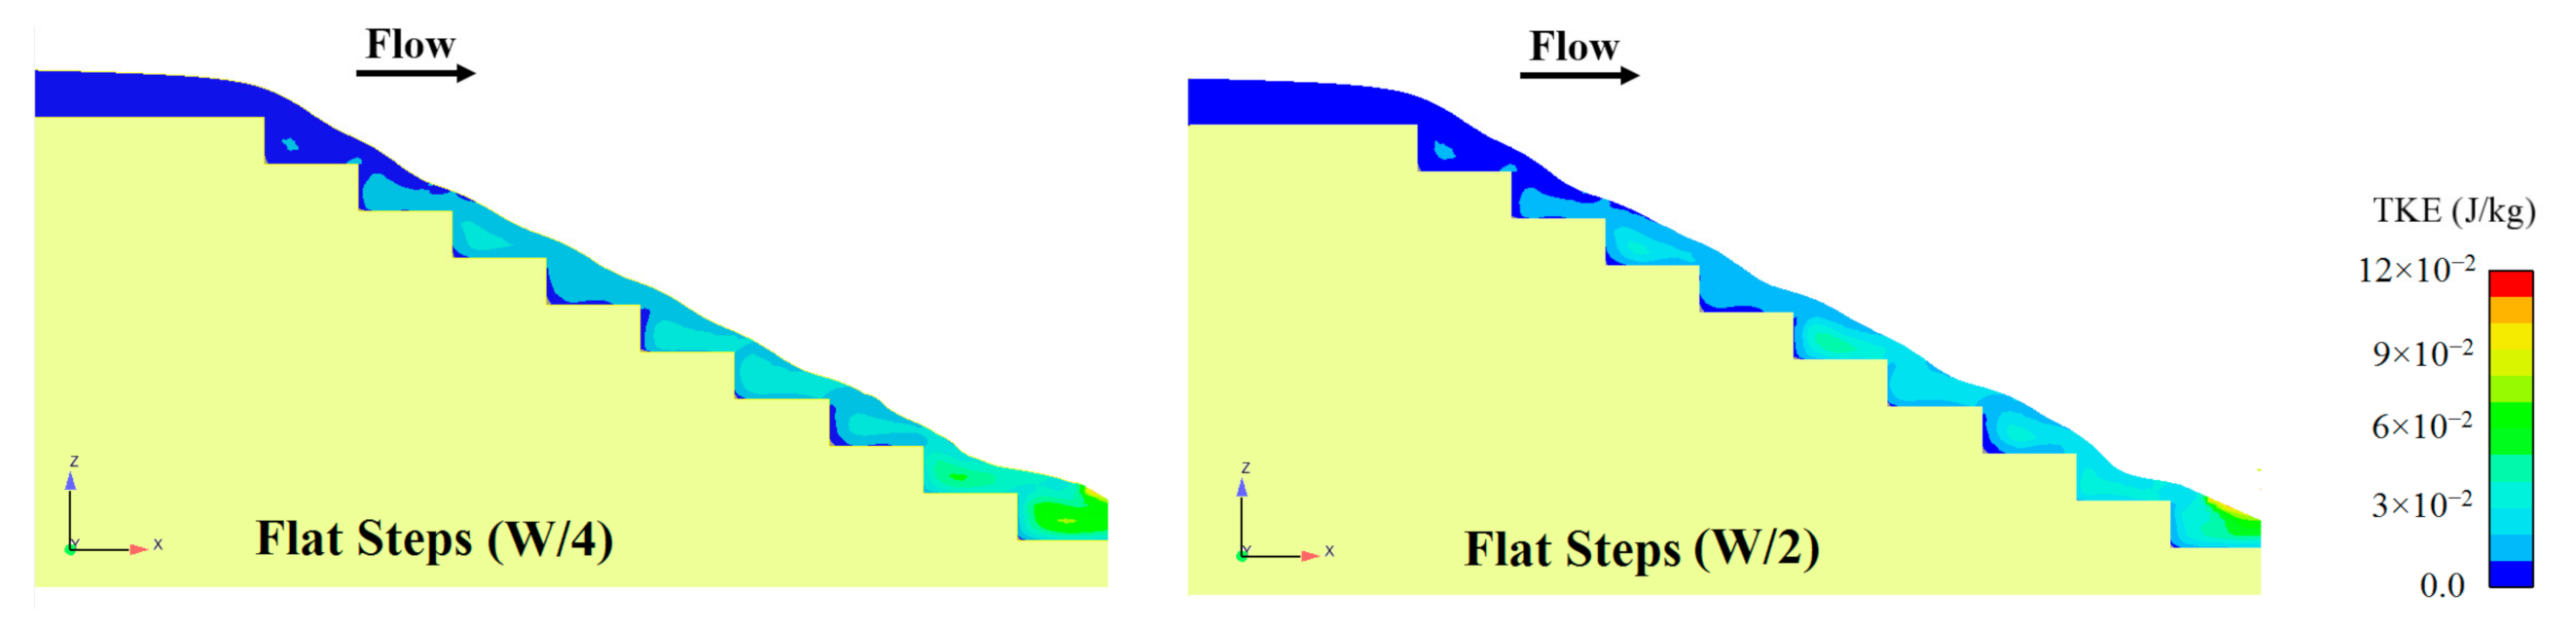
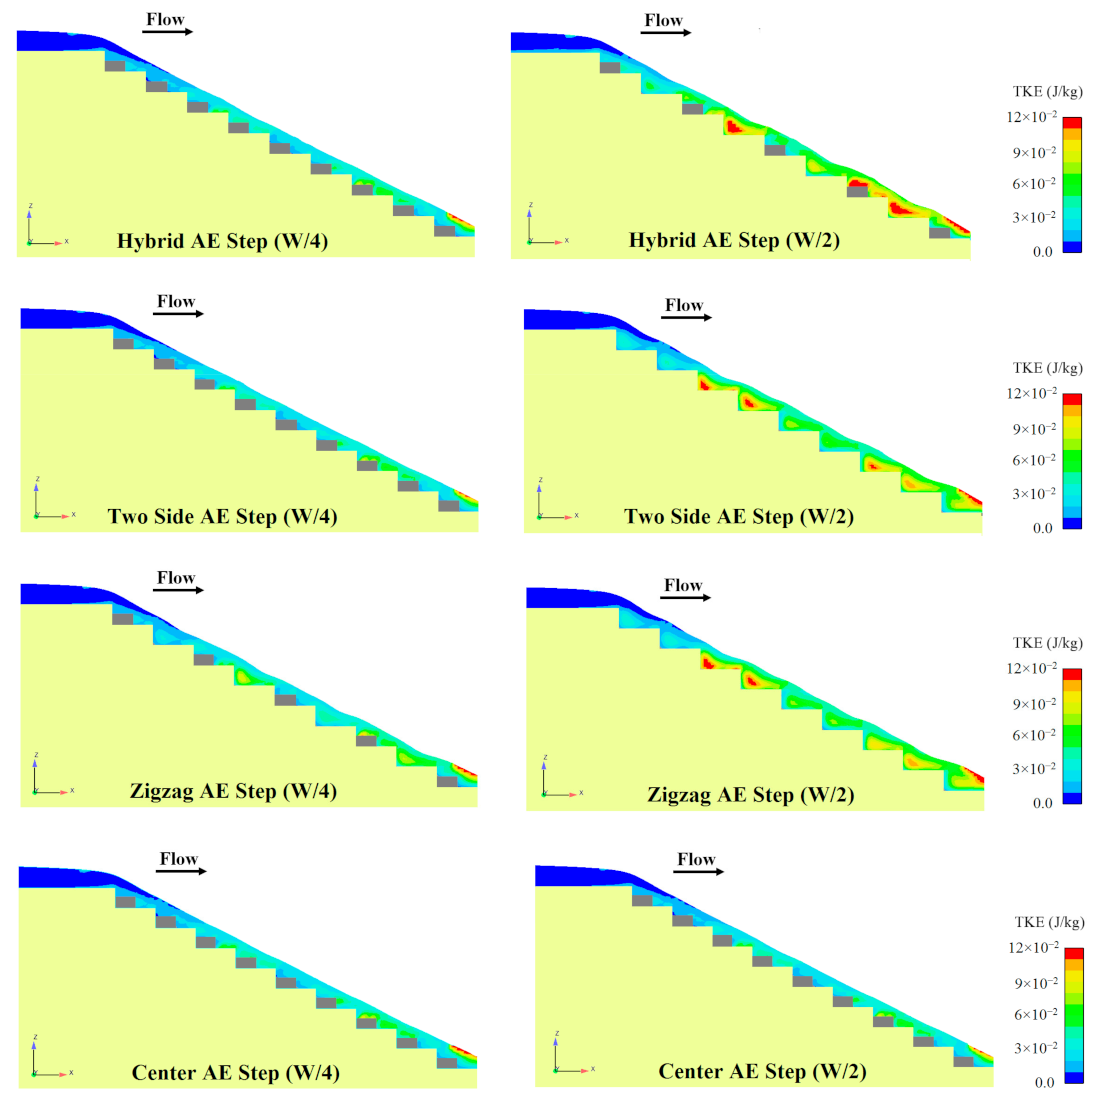
Considering that the change process of the TKE was the same for all discharges, an example outcome of this process related to discharge 0.045 m3/s is provided in Figure 17. This figure highlights that adding the appendance elements increases the deflected jets on the steps and maximum TKE is created on the appendance elements step compared to the flat step. Along the spillway, the value of the TKE also increases, which was in agreement with previous research by Bombardelli et al., [57]. The region of turbulence on hybrid appendance elements was a greater intensity than other types of arrangement of appendance elements step.
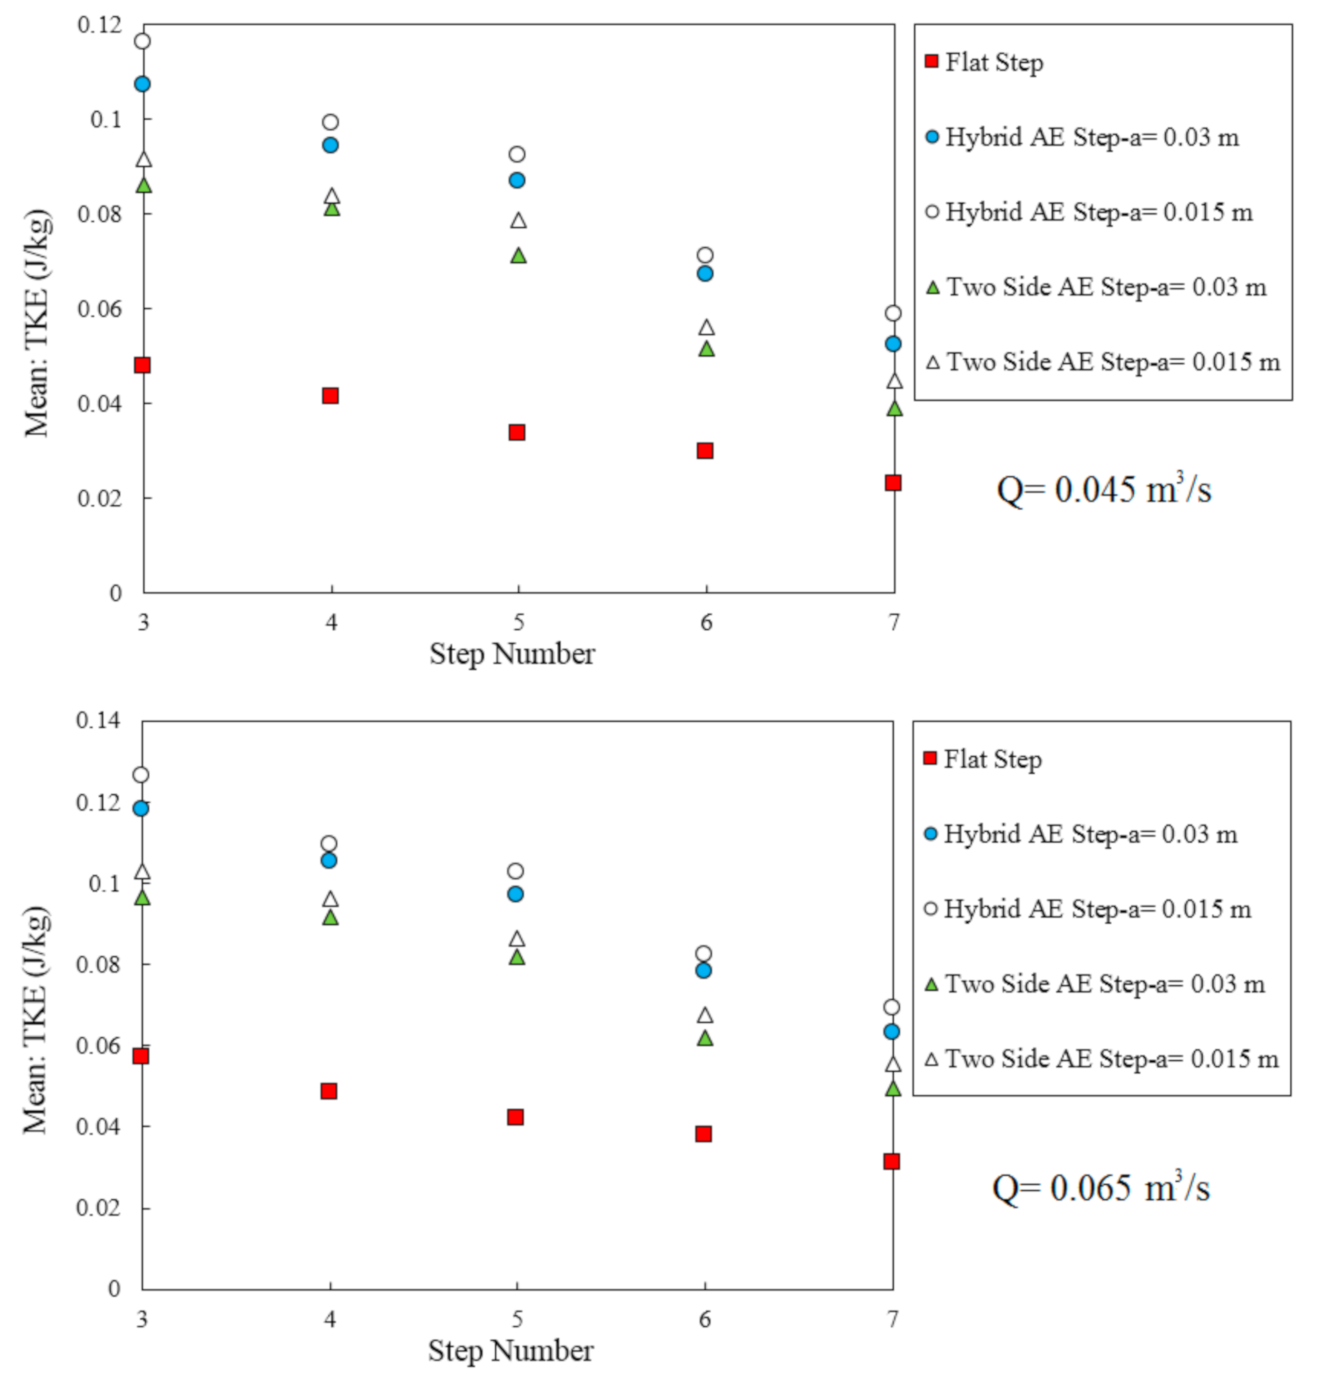
Figure 18 illustrates the mean TKE values for hybrid and two side appendance elements on the step with two different heights and discharges. The results stated that the maximum TKE values are created for the stepped spillway with hybrid appendance elements steps and half height of element for two selected discharges. Moreover, as the height of the appendance elements decreases, the value of TKE increases. It could also be seen that, as the discharge increases, the value of TKE increases for all models.
3.5. Flow Resistance
The flow resistance is commonly expressed in the form of the Darcy–Weisbach friction factor (fe). The Darcy–Weisbach friction factor is determined by measuring the air–water flow properties and is calculated from Equation (23):
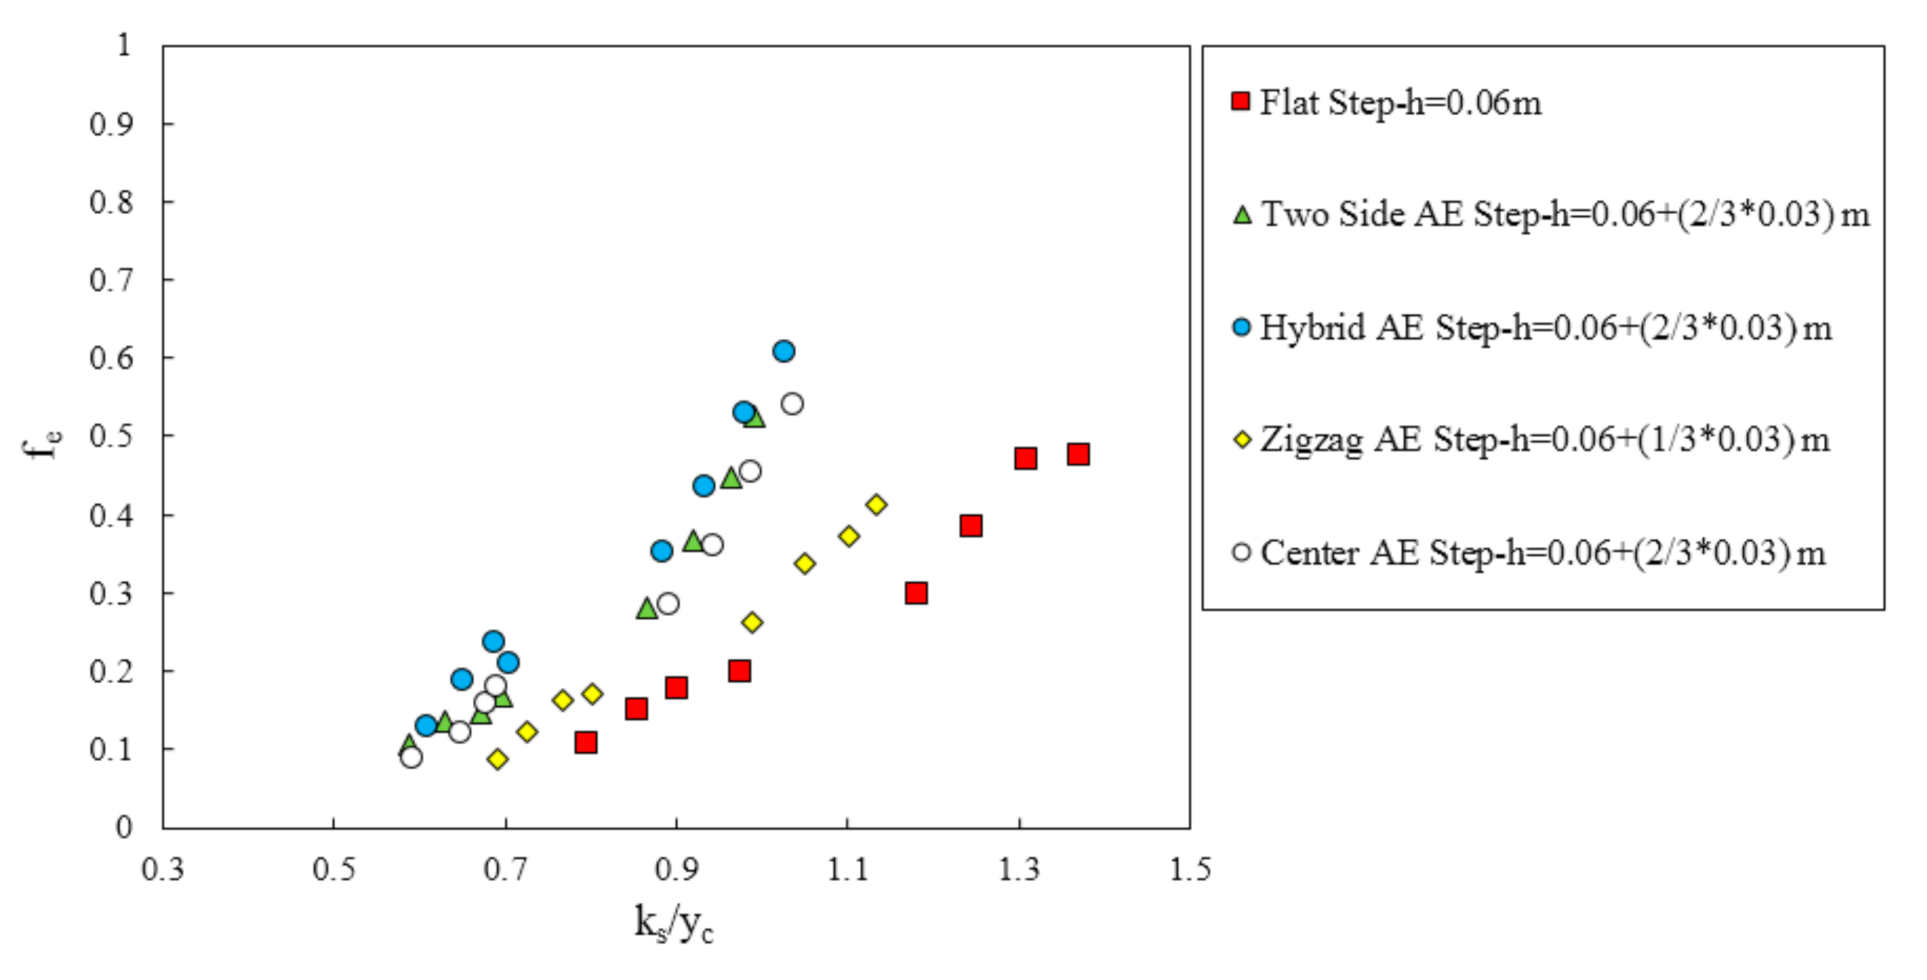
Here, q is the discharge per unit width, θ is the slope of the chute, V = q/y1 is the velocity at the downstream end of the spillway and g is the gravitational acceleration. Figure 19 shows the friction factor results of all models as a function of the dimensionless (ks/yc). ks is step roughness height and it is defined by ks = hcos(θ). It could be seen that the minimum friction factor (fe) was obtained for the flat stepped spillway compared to when appendance elements were used on a step of the stepped spillway. It could also be seen that as given Reynolds numbers increase the ks/yc, the value of friction factor increases for all models. The hybrid appendance elements step is a greater friction factor than other types of arrangement of appendance elements step.
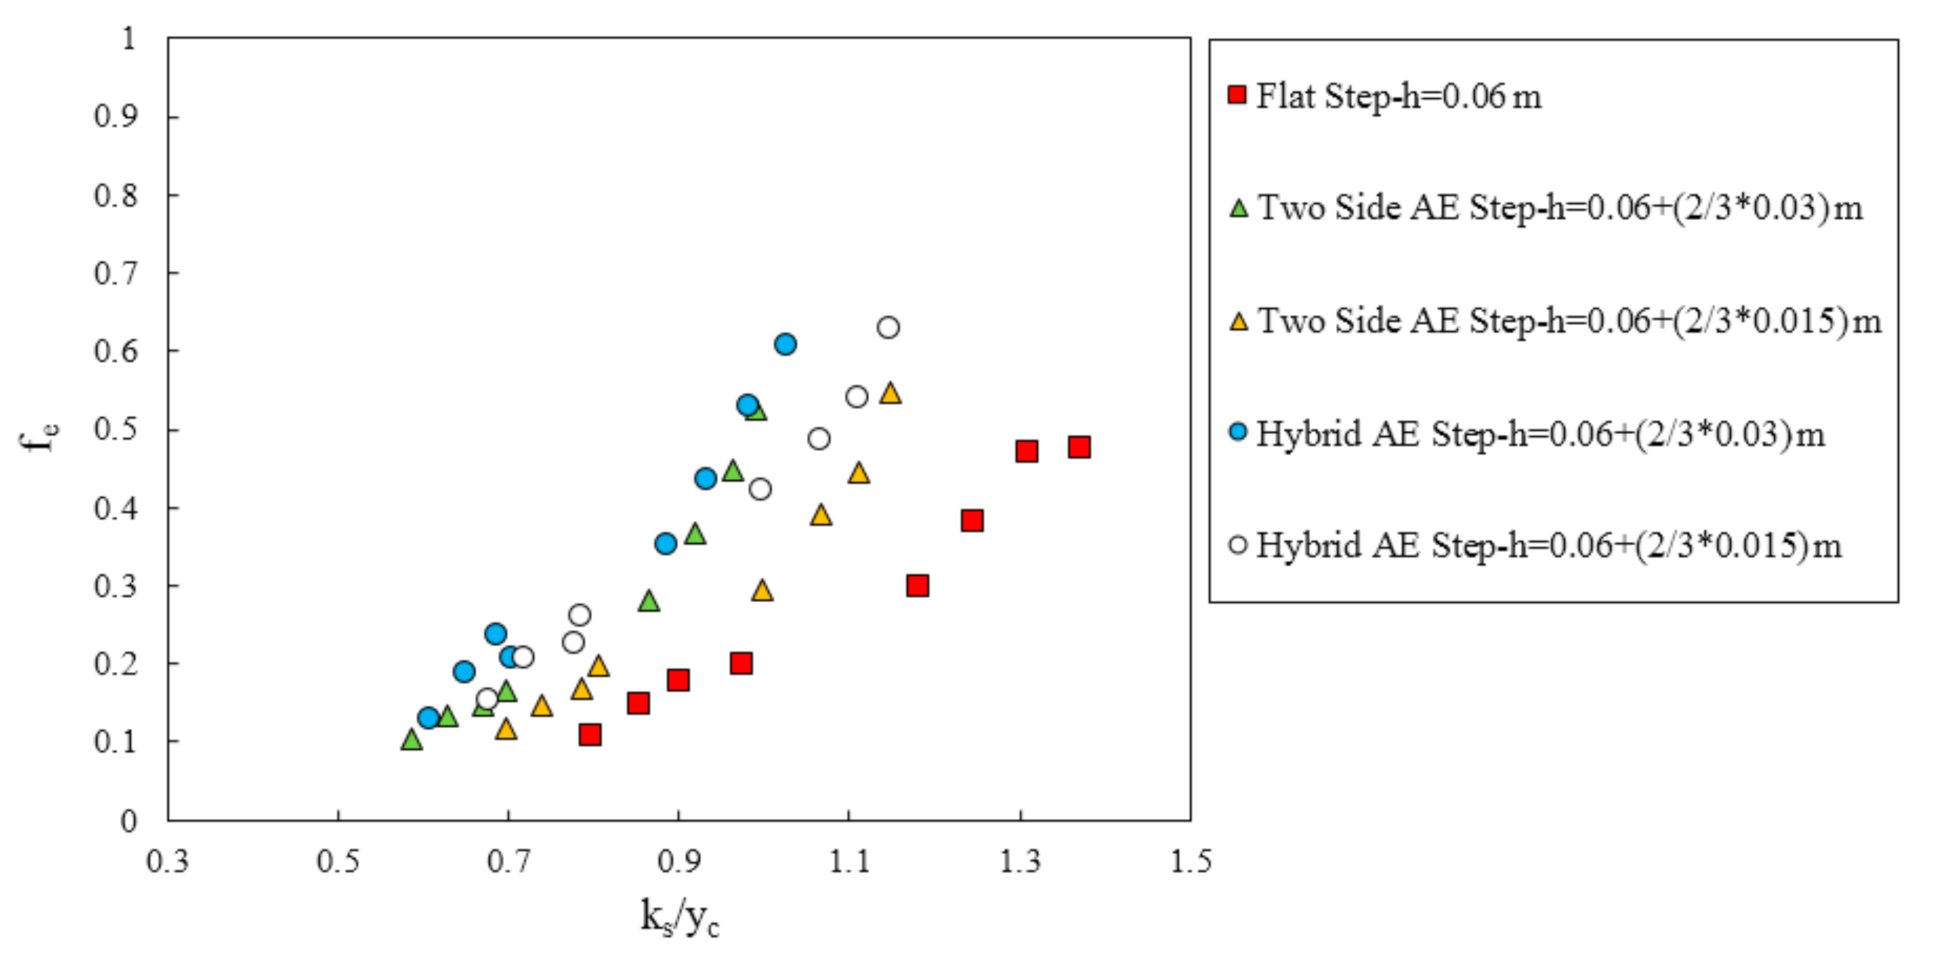
A comparison between two different heights of appendance elements steps on the friction factor is shown in Figure 20. By decreasing the heights of appendance elements, the friction factor increase and the performance of the appendance elements improves. The reason can be explained by the fact that the recirculation region expands due to the flow interference through the edges of the appendance elements part of the steps. Regarding the previous studies by Chanson and Toombes [6], flow resistance is caused by recirculating rotating vortices, and the energy dissipation changes by the motion exchange between the cavity flow and the main flow. With the appendance elements on a step of the stepped spillway, the rate of energy dissipation increases due to increases in the resistance against the flow with the interference of streamlines. Based on each step acting as a macro roughness, more steps can cause more flow resistance and also significantly causes more energy dissipation.
3.6. Inception Points with the Appendance Elements on Step
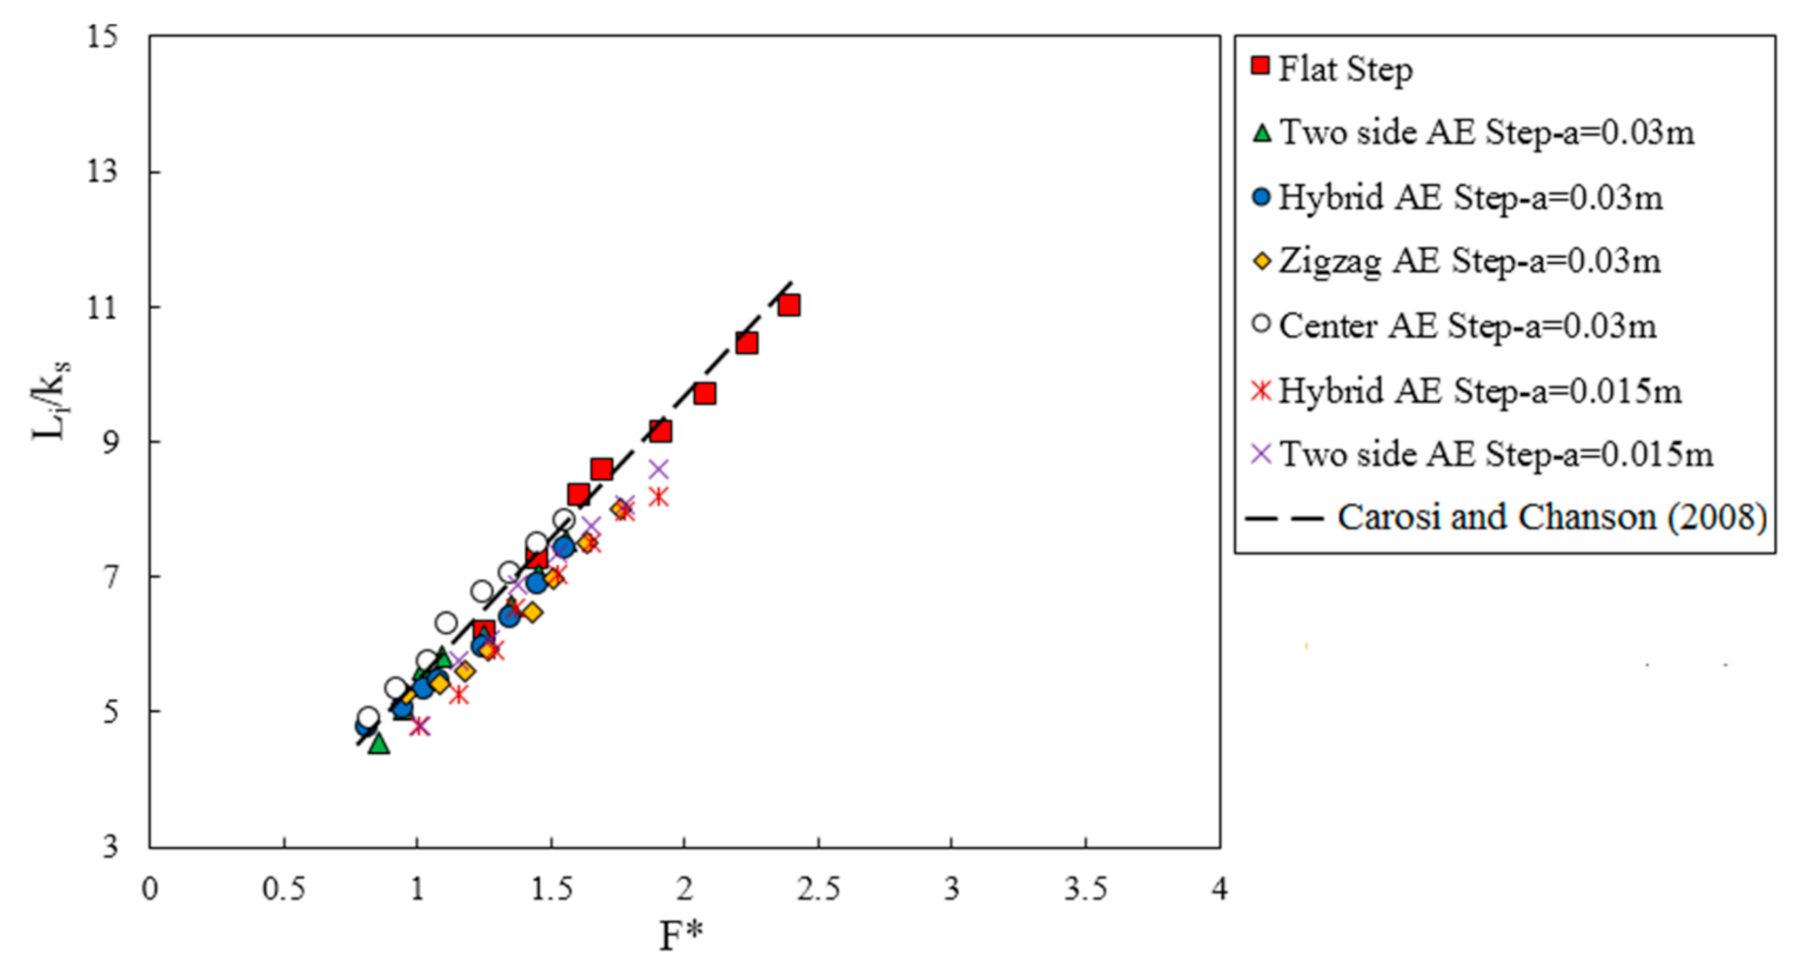
The locations of the inception point are presented in dimensionless terms as Li/ks as a function of a Froude number F* in Figure 21. Herein, Li is the longitudinal distance from the first step brink to the beginning of the inception point location and ks is the roughness height. The Froude number F* is defined:
It is evident that all data sets were in good agreement and indicated that with the appendance elements on step the air entrainment inception locations a positioning further upstream than flat step stepped spillway. However, the heights of appendance elements did not have an impact on the location of the inception point of air entrainment.
3.7. Scale Effects
The Froude similitude in an open-channel, clear-water flow is considered sufficient for a similarity between the model and the prototype. In a highly turbulent air–water flow, the roles of viscosity and surface tension should be included for similar aeration processes between the model and the prototype. Consequently, the scale ratio λ, the Froude number Fr = q/(gy3)0.5, the Weber number We = ū/(σ/(ρLS))0.5, and the Reynolds number Re = q/υ are relevant. Here, y is the water depth, ū = q/yi the average velocity with yi as the mixture flow depth, σ the surface tension between air and water, ρ the water density, Ls = (h/cosθ) the distance between two step edges, and υ the kinematic water viscosity. Boes and Hager [59] investigated scale effects. For a standard prototype step height of 0.60 m, minimum Reynolds and Weber numbers and a maximum scaling factor to minimize scale effects were suggested. For a standard step height of 0.60 m, 1 m downstream of the spillway crest, the ranges of Fr, We, Re, and yc/h for the herein-studied physical models using λ = 10 are 2.70–5.81, 48–93, 1.80–3.50 × 10⁵, and 0.79–1.23, respectively, thus partially satisfying the above conditions.
4. Conclusions
Step configurations become an important parameter for an optimized design adapted to varying flow conditions. This study aimed to present and discuss insight into the hydraulic features of a stepped spillway with the elements appendance on the steps. These important parameters were experimentally and numerically investigated using the FLOW-3D® model. To simulate the free surface, the Volume of Fluid (VOF) method was adopted and the turbulence RNG k-ε model was used. To validate the present model, comparisons between numerical and experimental results were performed for the flat stepped spillway. The following conclusions are summarized from the present study:
- With appendance elements on a step, the vortex was divided into two areas in the recirculating zones on the step and appendance elements and presented some instabilities caused by the staggered configurations. However, the flow surface over the flat step was approximately parallel to the pseudo-bottom.
- Along the horizontal step surface, the pressure value on the step in flat steps is larger compared to other configurations with appendance elements. The maximum pressure moves from a point in the step center towards the end of the step.
- Along the vertical step surface, negative pressures can be observed in the flat stepped spillway. With appendance elements on the step, negative pressures are divided into smaller, and are, therefore, less subject to cavitation.
- The rate of energy dissipation with appendance elements on step is greater. Adding appendance elements increases the streamlines interference and deflected jets on the steps. With an increase in flow discharge at all step configurations, the energy dissipation becomes less effective (lower energy loss).
- On the flat stepped spillway, the dimensionless residual head is the largest (~3.47) at a given flow condition; however, the average dimensionless residual head on the hybrid appendance elements step is ~3.02.
- A decrease in the height of the appendance elements leads to increase in the rate of energy dissipation and decreases the residual head to 3.20% and 7.40%, respectively.
- Adding appendance elements increases the deflected jets on the steps and maximum TKE is created on the appendance elements step compared to the flat step. The area of turbulence on hybrid appendance elements was of greater intensity than other types of arrangement of appendance elements step.
- As the height of the appendance elements decreases, the value of TKE increases. With an increase in flow discharge, the value of TKE increases for all models.
- It is observed that the friction factor (fe) in the flat stepped spillway is lower compared to when appendance elements are used on a step of the stepped spillway. The maximum friction factor demonstrates an increasing trend with an increase in the ks/yc values.
- By decreasing the heights of appendance elements, the friction factor increases, and the performance of the appendance elements improves.
- The air entrainment inception location can be changed through the appendance of elements on the step, leading to a positioning further upstream with respect to a flat step stepped spillway. However, the heights of appendance elements did not have an impact on the location of the inception point of air entrainment.
- To exclude scale effects on stepped spillway models, the ranges of hydraulic parameters (Froude, Weber, and Reynolds numbers) were established on the basis of literature review, considering a scale ratio less than 1:15.
This study shows that it is feasible to improve the hydraulic behaviors of a stepped spillway if the appendance elements are added. The hybrid appendance elements step are recommended if energy dissipation is a major issue of concern. For example, the hybrid appendance elements step compared with the flat steps enhances on average the energy dissipation by 7.20%. Meanwhile, the risk of cavitation phenomenon is mitigated: the lowest pressures on step surfaces, both horizontal and vertical, are improved compared with flat step. With appendance elements on a step, negative pressures are divided into smaller areas and they greatly reduce the risk of cavitation, so this step modified is advisable to use.
Author Contributions
Conceptualization, A.G. and S.A.; methodology, A.G. and S.A.; software, A.G.; validation, A.G. and S.A.; formal analysis, A.G.; investigation, A.G.; writing—original draft preparation, A.G. and S.A.; writing—review and editing, A.G. and S.A.; supervision, S.A.; project administration, A.G. All authors have read and agreed to the published version of the manuscript.
Funding
This research received no external funding.
Institutional Review Board Statement
Not applicable.
Informed Consent Statement
Not applicable.
Data Availability Statement
Data are contained within the article.
Conflicts of Interest
The authors declare no conflict of interest.
References
- Chanson, H. Hydraulic Design of Stepped Cascades, Channels, Weirs and Spillways; Pergamon: Oxford, UK, 1995. [Google Scholar]
- Ghaderi, A.; Abbasi, S.; Abraham, J.; Azamathulla, H.M. Efficiency of Trapezoidal Labyrinth Shaped stepped spillways. Flow Meas. Instrum. 2020, 72, 101711. [Google Scholar] [CrossRef]
- Rajaratnam, N. Skimming Flow in Stepped Spillways. J. Hydraul. Eng. 1990, 116, 587–591. [Google Scholar] [CrossRef]
- Peyras, L.; Royet, P.; Degoutte, G. Flow and Energy Dissipation over Stepped Gabion Weirs. J. Hydraul. Eng. 1992, 118, 707–717. [Google Scholar] [CrossRef]
- Chanson, H. Hydraulics of skimming flows over stepped channels and spillways. J. Hydraul. Res. 1994, 32, 445–460. [Google Scholar] [CrossRef] [Green Version]
- Chanson, H.; Toombes, L. Air–water flows down stepped chutes: Turbulence and flow structure observations. Int. J. Multiph. Flow 2002, 28, 1737–1761. [Google Scholar] [CrossRef] [Green Version]
- Ohtsu, I.; Yasuda, Y.; Takahashi, M. Flow Characteristics of Skimming Flows in Stepped Channels. J. Hydraul. Eng. 2004, 130, 860–869. [Google Scholar] [CrossRef] [Green Version]
- Gonzalez, C.; Chanson, H. Hydraulic design of stepped spillways and downstream energy dissipators for embankment dams. Dam Eng. 2007, 17, 223–244. [Google Scholar]
- Felder, S.; Chanson, H. Energy dissipation, flow resistance and gas-liquid interfacial area in skimming flows on moderate-slope stepped spillways. Environ. Fluid Mech. 2009, 9, 427–441. [Google Scholar] [CrossRef]
- Bung, D.B. Developing flow in skimming flow regime on embankment stepped spillways. J. Hydraul. Res. 2011, 49, 639–648. [Google Scholar] [CrossRef]
- Hunt, S.L.; Kadavy, K.C.; Hanson, G.J. Simplistic Design Methods for Moderate-Sloped Stepped Chutes. J. Hydraul. Eng. 2014, 140, 04014062. [Google Scholar] [CrossRef]
- Felder, S.; Guenther, P.; Chanson, H. Air-Water Flow Properties and Energy Dissipation on Stepped Spillways: A Physical Study of Several Pooled Stepped Configurations; Hydraulic Model Report No. CH87/12; School of Civil Engineering, The University of Queensland: Brisbane, Australia, 2012. [Google Scholar]
- Felder, S.; Chanson, H. Air–water flow measurements in a flat slope pooled stepped waterway. Can. J. Civ. Eng. 2013, 40, 361–372. [Google Scholar] [CrossRef] [Green Version]
- Felder, S.; Chanson, H. Effects of Step Pool Porosity upon Flow Aeration and Energy Dissipation on Pooled Stepped Spillways. J. Hydraul. Eng. 2014, 140, 04014002. [Google Scholar] [CrossRef] [Green Version]
- Sholichin, M.; Dermawan, V.; Krisnayanti, D. Energy dissipation of skimming flow on flat and pooled stepped spill-ways. Aust. J. Basic Appl. Sci. 2016, 10, 62–68. [Google Scholar]
- Meireles, I.; Matos, J. Skimming Flow in the Nonaerated Region of Stepped Spillways over Embankment Dams. J. Hydraul. Eng. 2009, 135, 685–689. [Google Scholar] [CrossRef]
- Felder, S. Air-Water Flow Properties on Stepped Spillways for Embankment Dams: Aeration, Energy Dissipation and Turbulence on Uniform, Non-Uniform and Pooled Stepped Chutes. Ph.D. Thesis, School of Civil Engineering, University of Queensland, Brisbane, Australia, 2013. [Google Scholar]
- Wüthrich, D.; Chanson, H. Hydraulics, air entrainment, and energy dissipation on a Gabion stepped weir. J. Hydraul. Eng. 2014, 140, 04014046. [Google Scholar] [CrossRef]
- Valero, D.; Bung, D.B. Hybrid investigations of air transport processes in moderately sloped stepped spillway flows. In Proceedings of the 36th IAHR Congress, Hague, The Netherlands, 28 June–3 July 2015. [Google Scholar]
- Lopes, P.; Leandro, J.; Carvalho, R.F. Bung. D.B. Alternating skimming flow over a stepped spillway. Environ. Fluid Mech. 2017, 17, 303–322. [Google Scholar] [CrossRef]
- Biscarini, C.; Di Francesco, S.; Manciola, P. CFD modelling approach for dam break flow studies. Hydrol. Earth Syst. Sci. 2010, 14, 705–718. [Google Scholar] [CrossRef] [Green Version]
- Daneshfaraz, R.; Minaei, O.; Abraham, J.; Dadashi, S.; Ghaderi, A. 3-D Numerical simulation of water flow over a broad-crested weir with openings. ISH J. Hydraul. Eng. 2019, 1–9. [Google Scholar] [CrossRef]
- Ghaderi, A.; Dasineh, M.; Aristodemo, F.; Ghahramanzadeh, A. Characteristics of free and submerged hydraulic jumps over different macroroughnesses. J. Hydroinform. 2020, 22, 1554–1572. [Google Scholar] [CrossRef]
- Peng, Y.; Zhang, X.; Yuan, H.; Li, X.; Xie, C.; Yang, S.; & Bai, Z. Energy Dissipation in Stepped Spillways with Different Horizontal Face Angles. Energies 2019, 12, 4469. [Google Scholar] [CrossRef] [Green Version]
- Guenther, P.; Felder, S.; Chanson, H. Flow aeration, cavity processes and energy dissipation on flat and pooled stepped spillways for embankments. Environ. Fluid Mech. 2013, 13, 503–525. [Google Scholar] [CrossRef] [Green Version]
- Ghaderi, A.; Abbasi, S.; Di Francesco, S. Numerical Study on the Hydraulic Properties of Flow over Different Pooled Stepped Spillways. Water 2021, 13, 710. [Google Scholar] [CrossRef]
- Hekmatzadeh, A.A.; Papari, S.; Amiri, S.M. Investigation of Energy Dissipation on Various Configurations of Stepped Spillways Considering Several RANS Turbulence Models. Iran. J. Sci. Technol. Trans. Civ. Eng. 2017, 42, 97–109. [Google Scholar] [CrossRef]
- Bayon, A.; Toro, J.P.; Bombardelli, F.A.; Matos, J.; López-Jiménez, P.A. Influence of VOF technique, turbulence model and discretization scheme on the numerical simulation of the non-aerated, skimming flow in stepped spillways. HydroResearch 2018, 19, 137–149. [Google Scholar] [CrossRef] [Green Version]
- Thappeta, S.K.; Bhallamudi, S.M.; Chandra, V.; Fiener, P.; Baki, A.B.M. Energy loss in steep open channels with step-pools. Water 2021, 13, 72. [Google Scholar] [CrossRef]
- Chinnarasri, C.; Wongwises, S. Flow Patterns and Energy Dissipation over Various Stepped Chutes. J. Irrig. Drain. Eng. 2006, 132, 70–76. [Google Scholar] [CrossRef]
- Christodoulou, G.C. Energy Dissipation on Stepped Spillways. J. Hydraul. Eng. 1993, 119, 644–650. [Google Scholar] [CrossRef]
- Johnson, M. Discharge Coefficient Scale Effects Analysis for Weirs. Ph.D. Dissertation, Utah State University, Logan, UT, USA, 1996. [Google Scholar]
- Ghaderi, A.; Daneshfaraz, R.; Dasineh, M.; Di Francesco, S. Energy Dissipation and Hydraulics of Flow over Trapezoidal–Triangular Labyrinth Weirs. Water 2020, 12, 1992. [Google Scholar] [CrossRef]
- Ackers, P.; White, W.R.; Perkins, J.A.; Harrison, A.J. Weirs and Flumes for Flow Measurements; Wiley: Chichester, UK, 1978. [Google Scholar]
- Daneshfaraz, R.; Ghaderi, A.; Akhtari, A.; Di Francesco, S. On the Effect of Block Roughness in Ogee Spillways with Flip Buckets. Fluids 2020, 5, 182. [Google Scholar] [CrossRef]
- Ghaderi, A.; Daneshfaraz, R.; Torabi, M.; Abraham, J.; Azamathulla, H.M. Experimental investigation on effective scouring parameters downstream from stepped spillways. Water Supply 2020, 20, 1988–1998. [Google Scholar] [CrossRef]
- Daneshfaraz, R.; Ghaderi, A.; Di Francesco, S.; Khajei, N. Experimental study of the effect of horizontal screen diameter on hydraulic parameters of vertical drop. Water Supply 2021. [Google Scholar] [CrossRef]
- Flow Science Inc. FLOW-3D V 11.2 User’s Manual; Flow Science: Santa Fe, NM, USA, 2016. [Google Scholar]
- Hirt, C.; Nichols, B. Volume of fluid (VOF) method for the dynamics of free boundaries. J. Comput. Phys. 1981, 39, 201–225. [Google Scholar] [CrossRef]
- Venturi, S.; Di Francesco, S.; Geier, M.; Manciola, P. A new collision operator for lattice Boltzmann shallow water model: A convergence and stability study. Adv. Water Resour. 2020, 135, 103474. [Google Scholar] [CrossRef]
- Yakhot, V.; Orszag, S.A.; Thangam, S.; Gatski, T.B.; Speziale, C.G. Development of turbulence models for shear flows by a double expansion technique. Phys. Fluids A: Fluid Dyn. 1992, 4, 1510–1520. [Google Scholar] [CrossRef] [Green Version]
- Ghaderi, A.; Abbasi, S. CFD simulation of local scouring around airfoil-shaped bridge piers with and without collar. Sādhanā 2019, 44, 216. [Google Scholar] [CrossRef] [Green Version]
- Lauria, A.; Calomino, F.; Alfonsi, G.; D’Ippolito, A. Discharge Coefficients for Sluice Gates Set in Weirs at Different Upstream Wall Inclinations. Water 2020, 12, 245. [Google Scholar] [CrossRef] [Green Version]
- Ghaderi, A.; Daneshfaraz, R.; Abbasi, S.; Abraham, J. Numerical analysis of the hydraulic characteristics of modified labyrinth weirs. Int. J. Energy Water Resour. 2020, 4, 425–436. [Google Scholar] [CrossRef]
- Pourshahbaz, H.; Abbasi, S.; Pandey, M.; Pu, J.H.; Taghvaei, P.; Tofangdar, N. Morphology and hydrodynamics numerical simulation around groynes. ISH 2020, 1–9. [Google Scholar] [CrossRef]
- Abbasi, S.; Fatemi, S.; Ghaderi, A.; Di Francesco, S. The Effect of Geometric Parameters of the Antivortex on a Triangular Labyrinth Side Wei. Water 2020, 13, 14. [Google Scholar] [CrossRef]
- Roache, P.J. Perspective: A Method for Uniform Reporting of Grid Refinement Studies. J. Fluids Eng. 1994, 116, 405–413. [Google Scholar] [CrossRef]
- Celik, I.B.; Ghia, U.; Roache, P.J.; Freitas, C.J. Procedure for estimation and reporting of uncertainty due to discretization in CFD applications. J. Fluids Eng. Trans. ASME 2008. [Google Scholar] [CrossRef] [Green Version]
- Li, S.; Zhang, J. Numerical Investigation on the Hydraulic Properties of the Skimming Flow over Pooled Stepped Spillway. Water 2018, 10, 1478. [Google Scholar] [CrossRef] [Green Version]
- Calomino, F.; Alfonsi, G.; Gaudio, R.; D’Ippolito, A.; Lauria, A.; Tafarojnoruz, A.; Artese, S. Experimental and Numerical Study of Free-Surface Flows in a Corrugated Pipe. Water 2018, 10, 638. [Google Scholar] [CrossRef] [Green Version]
- Ghaderi, A.; Dasineh, M.; Aristodemo, F.; Aricò, C. Numerical Simulations of the Flow Field of a Submerged Hydraulic Jump over Triangular Macroroughnesses. Water 2021, 13, 674. [Google Scholar] [CrossRef]
- Tafarojnoruz, A.; Lauria, A. Large eddy simulation of the turbulent flow field around a submerged pile within a scour hole under current condition. Coast. Eng. J. 2020, 62, 489–503. [Google Scholar] [CrossRef]
- Lauria, A.; Alfonsi, G.; Tafarojnoruz, A. Flow Pressure Behavior Downstream of Ski Jumps. Fluids 2020, 5, 168. [Google Scholar] [CrossRef]
- Felder, S.; Chanson, H. Simple Design Criterion for Residual Energy on Embankment Dam Stepped Spillways. J. Hydraul. Eng. 2016, 142, 04015062. [Google Scholar] [CrossRef] [Green Version]
- Chanson, H.; Paintal, A. Hydraulics of Stepped Chutes and Spillways. Appl. Mech. Rev. 2003, 56, B10–B11. [Google Scholar] [CrossRef]
- White, F.M. Viscous Fluid Flow, 2nd ed; McGraw-Hill University of Rhode Island: Rhode Island, NE, USA, 1991. [Google Scholar]
- Bombardelli, F.A.; Meireles, I.; Matos, J. Laboratory measurements and multi-block numerical simulations of the mean flow and turbulence in the non-aerated skimming flow region of steep stepped spillways. Environ. Fluid Mech. 2010, 11, 263–288. [Google Scholar] [CrossRef] [Green Version]
- Carosi, G.; Chanson, H. Turbulence characteristics in skimming flows on stepped spillways. Can. J. Civ. Eng. 2008, 35, 865–880. [Google Scholar] [CrossRef]
- Boes, R.M.; Hager, W.H. Two-Phase Flow Characteristics of Stepped Spillways. J. Hydraul. Eng. 2003, 129, 661–670. [Google Scholar] [CrossRef]
Figure 1.
Flow regimes on stepped spillways: (a) Nappe flow, (b) Transition flow, (c) Skimming flow.
Figure 1.
Flow regimes on stepped spillways: (a) Nappe flow, (b) Transition flow, (c) Skimming flow.

Figure 2.
Flow regime boundaries for stepped spillways in the current study.

Figure 3.
Main involved parameters on energy dissipation flow over stepped spillway.

Figure 4.
Schematic view of the experimental set-up.

Figure 5.
Stepped spillway configurations with flat and appendance elements (AE) on steps (θ = 26.60°).
Figure 5.
Stepped spillway configurations with flat and appendance elements (AE) on steps (θ = 26.60°).

Figure 6.
Schematic model of two side (AE) in left and center (AE) on steps in right.

Figure 7.
Applied boundary conditions in the fluid domain.

Figure 8.
Meshing for FLOW-3D simulations.

Figure 9.
Comparison between the experimental and numerical results of the free surface (Q = 0.052 m3/s).
Figure 9.
Comparison between the experimental and numerical results of the free surface (Q = 0.052 m3/s).

Figure 10.
Instantaneous streamlines in the transverse direction.


Figure 11.
Pressure contour for different pool configurations steps.


Figure 12.
The rate of energy dissipation and residual head for flat steps.

Figure 13.
The rate of energy dissipation on flat with appendance elements (AE) on steps versus (∆Z/yc).
Figure 13.
The rate of energy dissipation on flat with appendance elements (AE) on steps versus (∆Z/yc).

Figure 14.
Flow over the stepped spillway and its interference on transverse sides of the appendance elements on step (A): Flat step (B): Hybrid appendance elements step.
Figure 14.
Flow over the stepped spillway and its interference on transverse sides of the appendance elements on step (A): Flat step (B): Hybrid appendance elements step.

Figure 15.
Residual head for different step configurations versus (yc/h).

Figure 16.
The effect of the appendance elements height on the rate of energy dissipation and the residual head.
Figure 16.
The effect of the appendance elements height on the rate of energy dissipation and the residual head.

Figure 17.
TKE values for different arrangement steps for discharge Q = 0.045 m3/s.


Figure 18.
The mean TKE (J/kg) value on appendance elements step with different heights and discharge.
Figure 18.
The mean TKE (J/kg) value on appendance elements step with different heights and discharge.

Figure 19.
Darcy friction factors of stepped spillways with appendance elements on step versus (ks/yc).
Figure 19.
Darcy friction factors of stepped spillways with appendance elements on step versus (ks/yc).

Figure 20.
The effect of the appendance elements height on the friction factor.

Figure 21.
Inception points of free-surface aeration for flat step and appendance elements on step of stepped spillway.
Figure 21.
Inception points of free-surface aeration for flat step and appendance elements on step of stepped spillway.


Table 1.
Dimensional and hydraulic experimental and numerical parameters in the present study.
| Flow Regime | yc/h | h/l | l (m) | h (m) | yc=(q2/g)1/3 (m) | Q(m3/s) |
|---|---|---|---|---|---|---|
| ✓Skimming flow | 0.79 | 0.5 | 0.12 | 0.06 | 0.048 | 0.040 |
| ✓Skimming flow | 0.87 | 0.5 | 0.12 | 0.06 | 0.052 | 0.045 |
| ✓Skimming flow | 0.93 | 0.5 | 0.12 | 0.06 | 0.056 | 0.050 |
| ✓Skimming flow | 1 | 0.5 | 0.12 | 0.06 | 0.06 | 0.055 |
| ✓Skimming flow | 1.05 | 0.5 | 0.12 | 0.06 | 0.063 | 0.06 |
| ✓Skimming flow | 1.11 | 0.5 | 0.12 | 0.06 | 0.067 | 0.065 |
| ✓Skimming flow | 1.17 | 0.5 | 0.12 | 0.06 | 0.07 | 0.07 |
| ✓Skimming flow | 1.23 | 0.5 | 0.12 | 0.06 | 0.074 | 0.075 |
Table 2.
Characteristics of the meshes tested in the convergence analysis.
| Type | Nested Block Cell Size | Containing Block Cell Size | Number of Cells | Mesh |
|---|---|---|---|---|
| 1 | 1.65cm | 2.2cm | 1,425,876 | Coarse |
| 2 | 1.25cm | 1.65cm | 2,518,228 | Medium |
| 3 | 0.95cm | 1.30cm | 3,972,156 | Fine |
Table 3.
Grid convergence index (GCI) calculation.
| Quantity | f3 | f2 | f1 | p | GCI12 | GCI23 | Asymptotic Range |
|---|---|---|---|---|---|---|---|
| Discharge flow rate (m3/s) | 0.0505 | 0.0514 | 0.0518 | 2.64 | 0.007 | 0.017 | 1.007 |
| Water depth (m) | 0.68 | 0.698 | 0.705 | 3.08 | 0.008 | 0.02 | 1.01 |
Publisher’s Note: MDPI stays neutral with regard to jurisdictional claims in published maps and institutional affiliations. |
© 2021 by the authors. Licensee MDPI, Basel, Switzerland. This article is an open access article distributed under the terms and conditions of the Creative Commons Attribution (CC BY) license (https://creativecommons.org/licenses/by/4.0/).
Share and Cite
MDPI and ACS Style
Ghaderi, A.; Abbasi, S. Experimental and Numerical Study of the Effects of Geometric Appendance Elements on Energy Dissipation over Stepped Spillway. Water 2021, 13, 957. https://doi.org/10.3390/w13070957
AMA Style
Ghaderi A, Abbasi S. Experimental and Numerical Study of the Effects of Geometric Appendance Elements on Energy Dissipation over Stepped Spillway. Water. 2021; 13(7):957. https://doi.org/10.3390/w13070957
Chicago/Turabian StyleGhaderi, Amir, and Saeed Abbasi. 2021. "Experimental and Numerical Study of the Effects of Geometric Appendance Elements on Energy Dissipation over Stepped Spillway" Water 13, no. 7: 957. https://doi.org/10.3390/w13070957
Note that from the first issue of 2016, this journal uses article numbers instead of page numbers. See further details here.