Article

Assessing Natural Background Levels in the Groundwater Bodies of the Apulia Region (Southern Italy)

1
Water Research Institute, National Research Council (IRSA-CNR), 70132 Bari, Italy
2
Water Research Institute, National Research Council (IRSA-CNR), Monterotondo, 00015 Rome, Italy
*
Author to whom correspondence should be addressed.
Water 2021, 13(7), 958; https://doi.org/10.3390/w13070958
Submission received: 5 March 2021 / Revised: 26 March 2021 / Accepted: 29 March 2021 / Published: 31 March 2021
(This article belongs to the Special Issue Natural Background Levels in Groundwater)

Abstract

:
Defining natural background levels (NBL) of geochemical parameters in groundwater is a key element for establishing threshold values and assessing the environmental state of groundwater bodies (GWBs). In the Apulia region (Italy), carbonate sequences and clastic sediments host the 29 regional GWBs. In this study, we applied the Italian guidelines for the assessment of the NBLs, implementing the EU Water Framework Directive, in a south-European region characterized by the typical Mediterranean climatic and hydrologic features. Inorganic compounds were analyzed at GWB scale using groundwater quality data measured half-yearly from 1995 to 2018 in the regional groundwater monitoring network (341 wells and 20 springs). Nitrates, chloride, sulfate, boron, iron, manganese and sporadically fluorides, boron, selenium, arsenic, exceed the national standards, likely due to salt contamination along the coast, agricultural practices or natural reasons. Monitoring sites impacted by evident anthropic activities were excluded from the dataset prior to NBL calculation using a web-based software tool implemented to automate the procedure. The NBLs resulted larger than the law limits for iron, manganese, chlorides, and sulfates. This methodology is suitable to be applied in Mediterranean coastal areas with high anthropic impact and overexploitation of groundwater for agricultural needs. The NBL definition can be considered one of the pillars for sustainable and long-term groundwater management by tracing a clear boundary between natural and anthropic impacts.

1. Introduction

The EU Water Directives [1,2,3], implemented in Italy by Acts [4,5,6], require Member States that good status of groundwater bodies (GWBs) is achieved or maintained to protect all dependent ecosystems. Chemical status is determined based on quality standards set in Europe for nitrates and pesticides, and threshold values (TVs) that have to be set by Member States for all contaminants or groups of contaminants characterizing the GWBs as being at risk of failing the environmental objectives. The NBL can be defined as the concentration of a substance, or the value of an indicator, in a given GWB or group of GWBs, with no or extremely limited anthropogenic modifications. In this perspective, the TV of a considered natural substance may be redefined by the local authorities based on the NBL. The EU Directives do not provide any methodology for the TVs and NBLs establishment in the groundwater and the Member States are left free to apply their own approach considering the conceptual models of the groundwater bodies.
Chemical composition of groundwater depends on a wide range of natural factors such as water-rock interaction, residence time, rainfall input, chemical and biological processes that occur in the unsaturated and saturated zone, interactions with other water bodies [7]. Distinguishing between natural and anthropogenic sources is not a simple task since it requires high-level knowledge of all processes involved and the availability of a proper amount of monitoring data. The simplest methodologies for the NBL estimation within a GWB are based on the temporal and spatial approaches or on a combination of them [8,9]. The temporal approach uses historical groundwater quality data, which are assumed to be representative of the existing conditions before supposed human impacts. However, historical chemical data are usually scarce and have been determined using different methods and protocols compared to the modern sampling and analytical standards. The spatial approach uses monitoring data collected from areas in which the anthropogenic activity is assumed low and with no impact on the water quality. In this case, some care should be paid, when extending the NBLs values calculated at unspoiled areas to those impacted since they could have different physical, chemical, and biological characteristics. The difficulty of finding historical datasets and identifying pristine portions of the GWBs in populated areas has often led to developing other approaches.
The guidance issued within the EU 6th FP BRIDGE project [10,11] suggests methods based on either a statistical or a pre-selection approach. The partition of populations method [12,13,14,15,16] is a statistical approach based upon the idea that the concentration distribution of a chemical species in a groundwater system can be considered as the combination of two or more components of natural and anthropogenic origin.
On the other hand, a pre-selection based approach eliminates samples clearly affected by human activities on the base of specific markers such as nitrate, ammonium, chloride, synthetic organic compounds, etc. The samples exceeding a fixed value of the chosen markers are eliminated and the NBL is chosen as the 90th, 95th, or 97.7th percentile of the remaining water samples dataset. The main disadvantage of this approach is that the samples are eliminated according to qualitative criteria [17], e. g. the amount of available data and the shape of the related statistical distribution, and that the removal of samples might result in a too scarce data set.
Urresti-Estala et al. [18] assessed the NBLs using the objective criteria of two statistical techniques: the iterative 2σ technique, and the distribution function. Differently from the commonly employed statistical techniques, these Authors proposed two different approaches that do not require the elimination of samples, nor specific prior distributions, or the presence of large data sets. Both techniques are capable to discriminate between high values due to natural background populations from those induced by human influence.
Different attempts to apply a multi-method approach for the NBLs assessment have been made generally combining the pre-selection method and statistical techniques [19,20,21,22,23]. These studies pointed out that their integration reinforces the validity of the assessment, particularly when the hydrogeological setup and geochemical characteristic of groundwater are properly considered, confirming the greater importance of the conceptual model of the system than the choice of a statistical method. Molinari et al. [24] proposed other methodologies integrating partition population and numerical modeling of flow and transport processes to estimate NBLs of manganese and sulfate in potentially contaminated coastal aquifers. This study highlighted the need to validate the NBLs assessment procedures with accurate hydro-geochemical modeling results to identify external forcing components influencing the NBLs, such as the effects of tides and seawater intrusion, and avoid the possibility of interpreting naturally induced concentrations as anthropogenic effects.
Recently, IRSA-CNR collaborated with the Italian Institute for Environmental Protection and Research (ISPRA) in defining scientifically based guidelines for the NBLs assessment and clarifying some methodological aspects [25]. These guidelines rely on the pre-selection method but leave to the local water managers the task of identifying the specific pressure indicators while the only mentioned parameters are nitrate (for oxidizing conditions) and ammonium (for the reducing environments). Further, the guidelines do not mention how to deal with saline groundwater; hence, a procedure for the definition of a boundary between contaminated and uncontaminated groundwater in coastal aquifers has still to be defined. Assessing the origin of groundwater salinization in coastal aquifers is an issue mainly because it can depend on many concurrent natural or anthropic causes. Besides the possible contribution of seawater intrusion driven by overexploitation and sea-level rise, the scientific literature reports a detailed list of potential sources [26,27].
This work proposes a tentative application of the national guidelines for the assessment of the NBL values of some inorganic compounds in the GWBs of the Apulia region (southeast of Italy). In the case study, nitrate and ammonium concentrations have been considered as marker of anthropic contamination of the water samples. This work has been carried out within the framework of the research project on the assessment of background levels in the groundwater bodies of the Apulia region (VIOLA) jointly developed with the Department of Water Resources Management of the Apulia Region.

2. Materials and Methods

The Italian guidelines for the NBLs assessment describe an integrated approach based on the pre-selection and statistical methods [25]. The procedure consists of ten steps, some of which (steps 1–4) apply on the monitoring sites (MSs) and others (steps 5–10) on the single parameters:
  • Conceptual model definition.
  • Data exploration (validation of analytical data and handling of non-detect data).
  • Hydrochemical facies identification, based e.g., on dissolved oxygen concentration and/or redox potential. The facies analysis, when performed, leads to the separation of the dataset into separate subsets (e.g., reducing/oxidizing datasets) with different geochemical characteristics to be processed separately.
  • Pre-selection of data using the chosen anthropic markers (e.g., NO 3 concentrations in oxidizing facies and NH 4 + concentrations in reducing facies); the resulting data are compiled in the so-called “pre-selected dataset”.
  • Analysis of the time series per monitoring site (MS): identification and handling of the outliers by graphical (box and whisker plot) and statistical method (Huber’s test), trend analysis, selection of the median (or single value when only one measure is available) to be used as “representative value” in the following step.
  • Analysis of the data at the GWB scale (one data per monitoring station): identification and handling of the outliers of the preselected datasets, assessment of the existence of multiple populations and consequent identification of sub-sets.
  • Analysis of the statistical distribution (using the Shapiro-Wilk test) of the target parameter(s).
  • Assessment of pre-selected dataset size (significant spatial size: monitoring stations ≥ 15, significant temporal size: at least 8 half yearly observations);
  • Identification of specific path types based on pre-selected dataset size;
  • Assessment of the NBLs by statistical methods according to the specific path.
The pre-selected dataset size is a key element because it determines the procedure for NBL assessment and the robustness of the results. The guidelines identify four possible scenarios of dataset size (see point 9 of the previous list) considering both spatial and temporal dimension (Table 1).
The obtained NBLs are characterized by different confidence level (high, medium, low, very low) with regard to: the number of total observations or the number of total monitoring sites, the extension of GWB, and the aquifer type (confined or unconfined) (Table 2). When the confidence level is low or very low, the NBL is considered provisional. The confidence level is used to select a NBL at GWB scale from those calculated for different facies.
The logical phases and the requirements of the guidelines have been implemented at the IRSA-CNR into an automated tool capable of standardizing NBLs assessment operations. This tool, eNaBLe [28], thanks to its modularity, has been successfully integrated into the VIOLA project web site (http://www.irsa.cnr.it/Viola/, accessed on 30 March 2021) which hosts different statistical, graphical elaboration, and visualization procedures. eNaBLe and the other VIOLA web site procedure are written in PHP [29] and use MySQL [30] as relational databases manager.
The database is structured in 5 main tables (Monitoring Points, Wells, Springs, Samples, Chemical Analyses), 2 ancillary tables (GWBs, Parameters) and one table for user authentication and privileges. The user interface of the eNaBLe tool is organized in three logical phases corresponding to three different associated web pages: (i) Selection of the GWB data to be processed, analytical parameters to take into account and selection of the calculation options to be used; (ii) NBLs assessment and relative confidence levels; (iii) output of results in graphical, tabular and report form.
By performing a query on the selected dataset, eNaBLe produces a preliminary table in which all the analytical parameters and their basic statistical description are listed, proposing for the NBLs evaluation those analytical parameters in which at least one exceedance of the relative TV has been found. Next, it is possible to select the options for the NBL assessment, such as the appropriate time interval for the data to be processed, the parameters to be used for the redox facies separation and the limits to apply for the preselection process to nitrates or ammonium in relation to the oxidizing or reducing facies, among others.
A screenshot of the GWB selection and parameters configuration page is shown in Figure 1.
The results of the calculation as well as the settings used are listed in the second page of the procedure (Figure 2). In addition, the result page provides the links to the intermediate products of the calculation such as the validated dataset (built after time filtering, non-detected values handling and electrical balance verification), pre-selected and facies separated datasets, final datasets used for the calculation and the path type choice. The calculated NBLs are reported by redox facies, if this option has been chosen, and at GWB scale. The calculation path type used (A, B, C, D, Table 1) and the confidence level of the resulting NBL (Table 2) are also specified.

3. Study Area

Apulia is a southeastern region of Italy (Figure 3) that covers an area of about 19.500 km2 hosting more than four millions inhabitants [31]. This region faces the Adriatic and Ionian seas with a coastline extension of about 900 km.
Apulia region is characterized by dry sub-humid (Mediterranean) climate with hot and dry summers and mild, wet winters [32]. Precipitation are on annual average around 600 mm, and mainly concentrated between November and February.
The region economy is mainly driven by the agricultural sector followed by service and industry. Agricultural areas cover more than 70% of the region and the main crops are wheat, olive, grapes, citrus, and vegetables.
Apulia region mostly corresponds to the exposed area of the Apulian carbonate platform (Apulia foreland), separated from the Southern Apennines by the Bradanic Through (foredeep). The main geological complexes are the Mesozoic carbonate platform and the Paleocene to Pleistocene sedimentary covers [33] (Figure 4).
The carbonate platform consists of a several thousand-meter-thick succession of limestone, dolomite and limestone dolomite (Middle Jurassic–Cretaceous) diffusely outcropping in the Gargano area in the North, in the Murgia in the center, and in the Salento in the South of the region.
The sedimentary covers consist of heterogeneous marine and alluvial deposits of different ages [34].
All the calcareous and calcareous-dolomite rocks forming the Mesozoic succession are influenced by karst phenomena of different evolution degree. This causes an almost total absence of surface water and a widespread karst landscape. Karstic processes combined to the presence of fractures affecting the Mesozoic succession, give rise to a secondary permeability, which is always markedly discontinuous in space and may vary from very low to high [35,36].
For all of the above, the groundwater resources hosted in the three Mesozoic hydrogeological structures of Gargano, Murgia and Salento, representing the largest coastal karst Italian aquifers, are the main regional water supply of Apulia [37]. They are exposed to contact with the sea and the groundwater systems are largely governed by the freshwater-saltwater equilibria.
The hydrogeological structure of the Gargano is generally characterized by confined groundwater flow, except along a narrow coastal belt. Along the south-western boundary, groundwater interacts with warm waters rising from the deepest part of the carbonate platform [38]. These deep groundwater fluxes are drained by springs in the SW portion of the promontory (Manfredonia Gulf) and in the NW portion toward Lesina and Varano lakes. Particularly, in these areas they assume typical fossil water characteristics [39].
In the Murgia hydrostructure, the presence at different depths of thick dolomitic layers, practically impermeable, causes the carbonate aquifer to be under pressure and with irregular geometry. Only near the coast, and mainly in the southern part of the Murgia, the groundwater flow becomes unconfined. The watershed for groundwater flow approximately overlaps the highest topographic altitudes along the NW-SE direction and allows to identify the Bradanic and the Adriatic sectors.
The Salento is the most permeable carbonate hydrostructure of the Apulia. Groundwater flows mainly under phreatic conditions and the water table heights reach only 3–4 m above sea level. Due to the Salento geographical shape, the groundwater assumes a lenticular shape, floating on seawater. The aquifer mainly is recharged by rainfall, but in the north-west sector, it is also laterally fed by groundwater coming from the Murgia aquifer [36].
The fourth main hydrogeological structure of the Apulia Region is the Tavoliere, a shallow aquifer consisting of a complex alternation of different grain size alluvial sediments. This aquifer is unconfined in the western part of the plain, where the coarse-grained sediments prevail, and confined in the central-eastern part where fine-grained material tend to prevail in the upper part of the sequence [40].
Following the criteria established by Italian law for defining the GBWs [5], three main type of hydrogeological complexes (HCs) have been recognized in the Apulia: carbonate, detrital, and alluvial [41,42]. Moreover, on the basis of hydrogeological features of the formation hosting groundwater and its physical-chemical characteristics different GWBs were distinguished within some aquifer for a total of 29 GWBs (Figure 4).
Since the first regional groundwater monitoring network was established in 1995, different redesign have been done until 2015 to fit the WFD provisions and optimize the network configuration [43]. It follows that the surveys have been affected by some discontinuities in time. Currently, the qualitative groundwater monitoring network consists of 341 wells and 20 springs distributed almost uniformly over the regional territory (Figure 3).
The dataset used in this study consists of more than 3600 measured values of the main hydrogeochemical parameters, discontinuously measured from 1995 to 2018. In general, two sampling campaigns were carried out per year, one at the end of the recharging period and the other at the end of the dry season, for a total of 22.
Since the measurements refer to a very long time interval, the sampling and analytical methods could have likely changed over time. Inhomogeneities are therefore possible, but the NBL assessment procedures have been designed to minimize their effect on the results (use of median values, outliers removal, statistical distribution analysis). Detailed information is available only for data collected after 2000. From this date on, official monitoring protocols and field forms indicate the physical parameters (pH, Eh, EC, temperature and DO) have been measured onsite by a multiparametric probe. Water samples have been filtered through 0.45 μm pore-size filters immediately upon collection and the aliquot for cations and trace elements has been acidified with supra pure HNO3 1%. All the chemical parameters have been measured and validated at certified public and private laboratories by ion chromatography for anions and by Inductively Coupled Plasma-Mass Spectrometry for major cations and trace elements.
Severe impacts on regional GWBs are due to overexploitation and qualitative degradation [41,42]. Quantitative pressures produce impacts in terms of piezometric lowering, reduction of springs outflow and decrease of groundwater contribution to surface aquatic ecosystems. The impact from quantitative significant pressures can result in an increase of saline intrusion with a consequent reduction of freshwater availability and soil salinization in agriculture.

4. Results

4.1. GW Geochemistry and Descriptive Statistics

A summary of the qualitative status of the Apulia GWBs is provided, based on selected monitoring data.
In Table 3, the main statistics of the physical-chemical parameters relating to the Apulian monitoring network are represented. Groundwater shows a wide range of pH values, with conditions ranging from acidic to frankly alkaline, and slightly alkaline mean values. Oxidizing conditions predominate in the region, although reducing environments are also found within some GWBs, highlighted by DO deficiency and negative ORP values. The variability from 0.1 to tens mS/cm, of the electrical conductivity (EC) is typical of wide aquifers that spread from inland to the coastline.
Table 4 reports the exceedances, with respect to the values prescribed by the Italian water-related Legislative Decrees [4,5], of those parameters resulting as main indicators of significant anthropic pressures and related impacts arisen in the regional GWBs characterization [44,45]. The most evident result is the high percentage of exceedances for chloride (49.0%) and sulphates (16.8%) that can be related to saline contamination phenomena, especially in coastal areas. The percentages relating to nitrate (20.3%) and ammonium (6.4%), classical indicators of anthropogenic contamination, can be linked to the extensive agricultural land use and, partially, to livestock activities. More than a quarter of the dataset shows exceedances of the TVs for iron (32.2%) and manganese (26.2%). Both these parameters are sensitive to the redox reducing conditions of the aquifers which are quite frequent, as mentioned previously. Several values exceeding the legal limits were found for selenium (3.7%) and fluoride (3.5%), while sporadic exceedances were found for boron (0.8%) and arsenic (0.3%).
In more detail, Figure 5 shows the Piper’s classification diagram distinguished by HC. This type of representation provides information on the geochemical facies and therefore on the processes that led to the observed main chemistry. Each point represents the median value of Piper’s diagram characteristic parameters in each considered GWB, distinguished by color.
Groundwater of the Gargano and Murgia-Salento carbonate HCs (Figure 5a) shows a clear transition from frankly calcium-bicarbonate terms to chloride-alkaline terms, with increasing salinity. The points of the detrital HCs (Figure 5b) show more variable compositions, generally ranging between the chloride-alkaline and the sulphate-chloride-earth alkaline facies. Finally, groundwater from the Miocene carbonate HCs has a clear calcium-bicarbonate composition, while the alluvial HCs are characterized by mixed terms, without dominant ions (Figure 5c). The presence of clear bicarbonate-earth alkaline terms is mainly attributable to water-rock interaction processes in the carbonate aquifers, while the enrichment in chlorides, sulfates, and alkalis (sodium in particular), reflecting on a substantial increase in groundwater salinity, are found in coastal GWBs.
The NBLs at the GWB scale were assessed for all the parameters in Table 4, except for nitrogen species, which were used as anthropic indicators. To ensure a certain significance in the statistical processing, the calculation was carried out for the GWBs with at least 7 monitoring points, for a total of 15 investigated GWBs and 294 MSs.

4.2. Preliminary Analysis on the Monitoring Stations

The proposed methodology requires some preliminary processing in order to rearrange the dataset for the following steps. At first, all the analytical values below their own limit of quantification (LOQ) must be replaced with a value equal to half the limit itself. Nearly 6500 values have been replaced with regard to the 8 investigated parameters and the 15 considered GWBs.
Successively, the dataset is treated by removing the analyses whose electrical balance error (EBE) exceeds the given threshold. This validation step resulted in the removal of 55 analyses from the overall dataset, whose EBE was exceeding the threshold of 10%.
A third important data preprocessing step concerns the redox facies separation. In the case at hand, once set an ORP threshold of 50 mV (selected following a comparison with the values of Fe and Mn, tendentially showing higher concentrations below this limit), 154 MSs out of 294 were identified in the oxidizing facies and 63 MSs in the reducing one, with distribution and numerical consistency different by GWB. Finally, due to the lack of ORP and DO measurements, the redox facies assignment has not been practicable in 77 MSs. The facies separation was applied only for iron and manganese, which are particularly affected by reducing conditions that increase the solubility of their oxy-hydroxides. Therefore, only for these two metals, the NBLs were first calculated separately for the two redox facies, then a unique value (the highest of the two) was chosen from them. For all the other parameters the NBLs were calculated from the total dataset of 294 MSs.
The last step of the preliminary analysis is the pre-selection of the MSs. In this phase, some MSs and the related datasets are removed based on an anthropogenic contamination test. The test operates using two different markers of anthropogenic contamination, according to the redox conditions: a threshold of 37.5 mg/L of nitrate for the oxidizing facies and 0.375 mg/L of ammonium for the reducing one. Only those MSs in oxidizing/reducing facies, where nitrates/ammonium do not exceed the respective concentration threshold, have been retained for next processing; all the others have been considered somehow contaminated by anthropic activities and discarded. The selected concentration limits correspond to 75% of the expected quality standards/TVs. When the methodology does not involve the facies separation, both markers were used for the MSs pre-selection. On average, 66% of MSs complies with the adopted pre-selection criteria, but with very diversified distributions within the different GWBs.
In particular, the pre-selection criterion allowed retaining a number of monitoring stations (pre-selected monitoring sites = PS MSs) ranging from 40% to 90% of the initial number in 10 of the considered GWBs. The percentage of pre-selected stations falls down to values smaller than 38% in the remaining 5 GWBs. Unfortunately, these latter five GWBs, mostly belonging to the Tavoliere aquifer, were initially affected by a poor number of MSs, so the related computed NBLs are expected to be characterized by a very low confidence level. In conclusion, 194 monitoring sites were selected for the NBLs assessment in 15 GWBs of which 104 in the oxidizing and 54 in the reducing facies (Table 5).

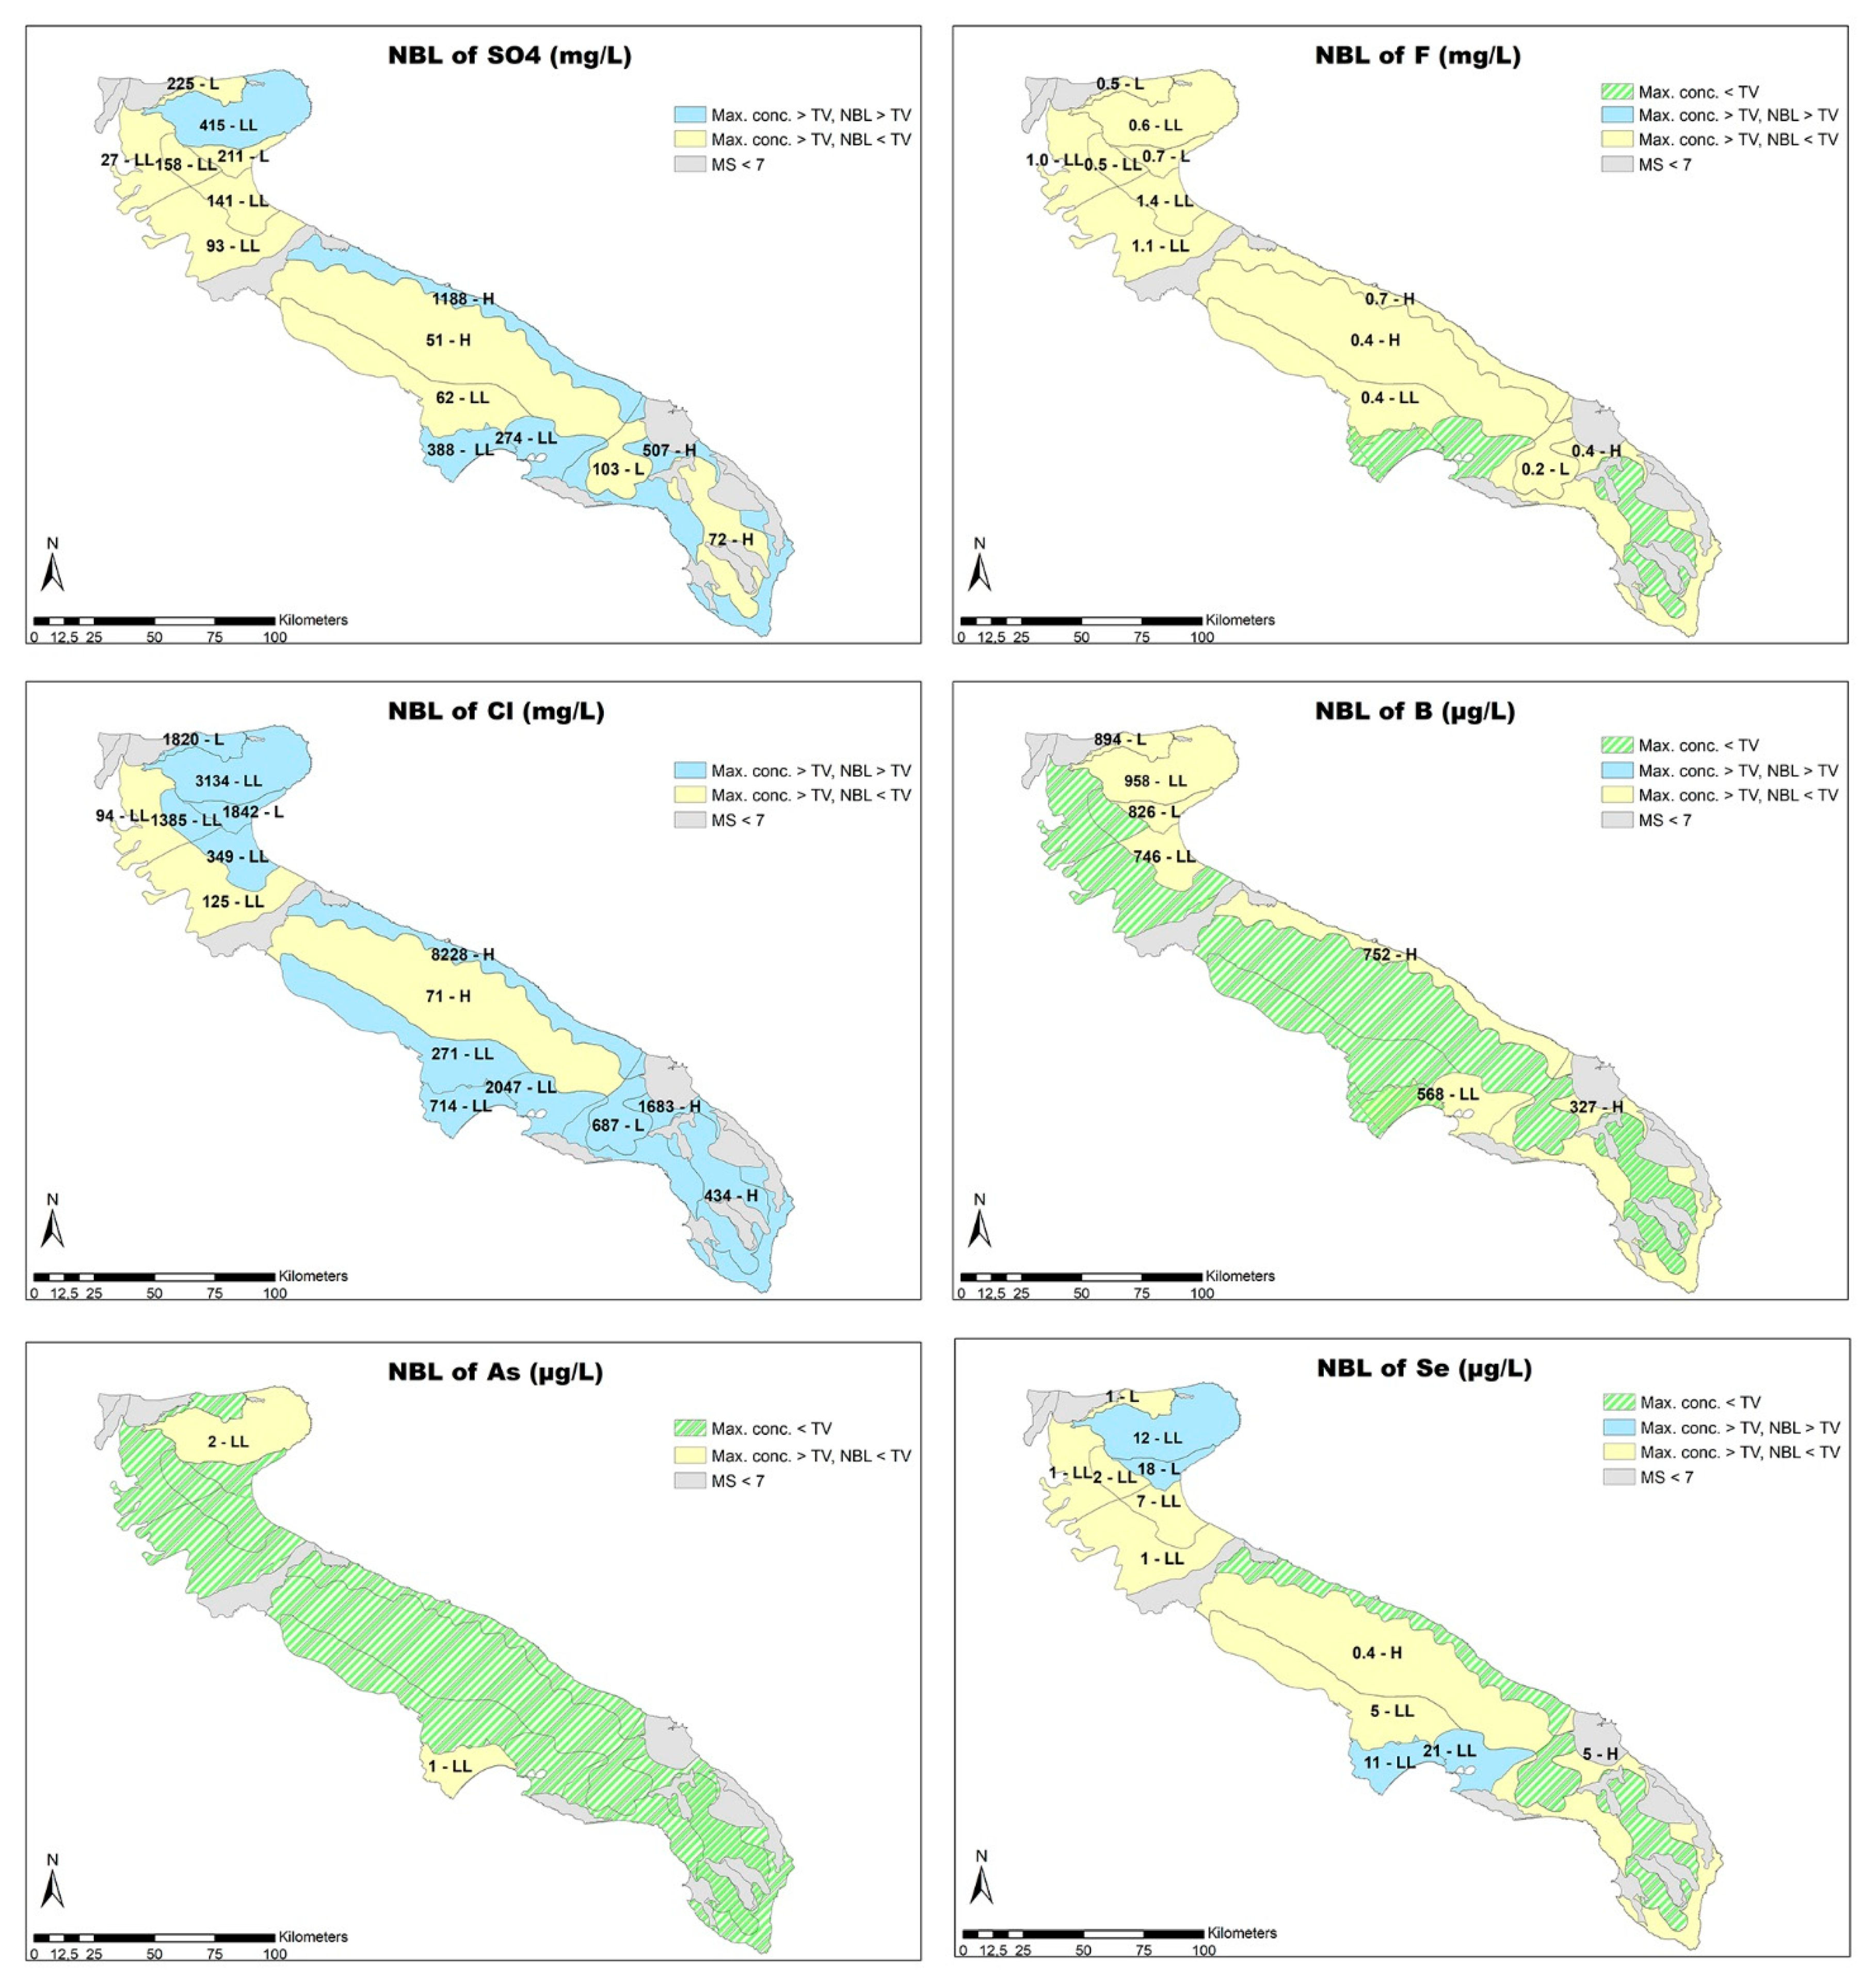
4.3. NBLs Calculation for the Non-Redox Sensitive Elements

For each PS MSs, a representative value was defined as the median of all available measurements for each investigated parameter (fluoride, chloride, sulphate, boron, arsenic, selenium). The outliers were then analyzed using the Huber’s non-parametric test and the identified anomalous data were eliminated from the dataset, before performing the calculation of the NBLs. Consequently, the number of the representative values is not equal for all parameters, resulting in part from the elimination of the outliers and in part from any missing analysis for that specific parameter.
According to the guidelines, the specific path types (A, B, C, D) were identified based on the pre-selected dataset size. For type A and B the Shapiro–Wilk test was then applied to verify the normality of the dataset. Data relating to the performed elaborations (including the specific path types and the number of representative values for each parameter) are shown in Table S1 (Supplementary Material).
The most frequent type of dataset were C and D, then A and finally B were the least represented (see Table S1 in the Supplementary Materials).
The defined NBLs for all the parameters at the GWBs scale and the associated confidence levels defined considering the aquifer type (confined or unconfined), its extension and the number of data used for the NBL assessment, are shown in Table 6 and in Figure 6. Chlorides show diffusely high background values, often above the corresponding TV (80% of the selected GWBs). Values sometimes higher than the legal limits have also been calculated for sulphate (6 GWBs) and selenium (4 GWBs), while the NBLs defined for fluoride, boron and arsenic are always lower than the respective TVs. Unfortunately, only for 4 GWBs it was possible to associate a high confidence level to the calculated NBLs, while it resulted almost always low or very low. The low/very low confidence levels are attributable to a strong reduction of MS number due to the high percentage of MS exceeding nitrate/ammonia and/or the lack of the specific analytical value.

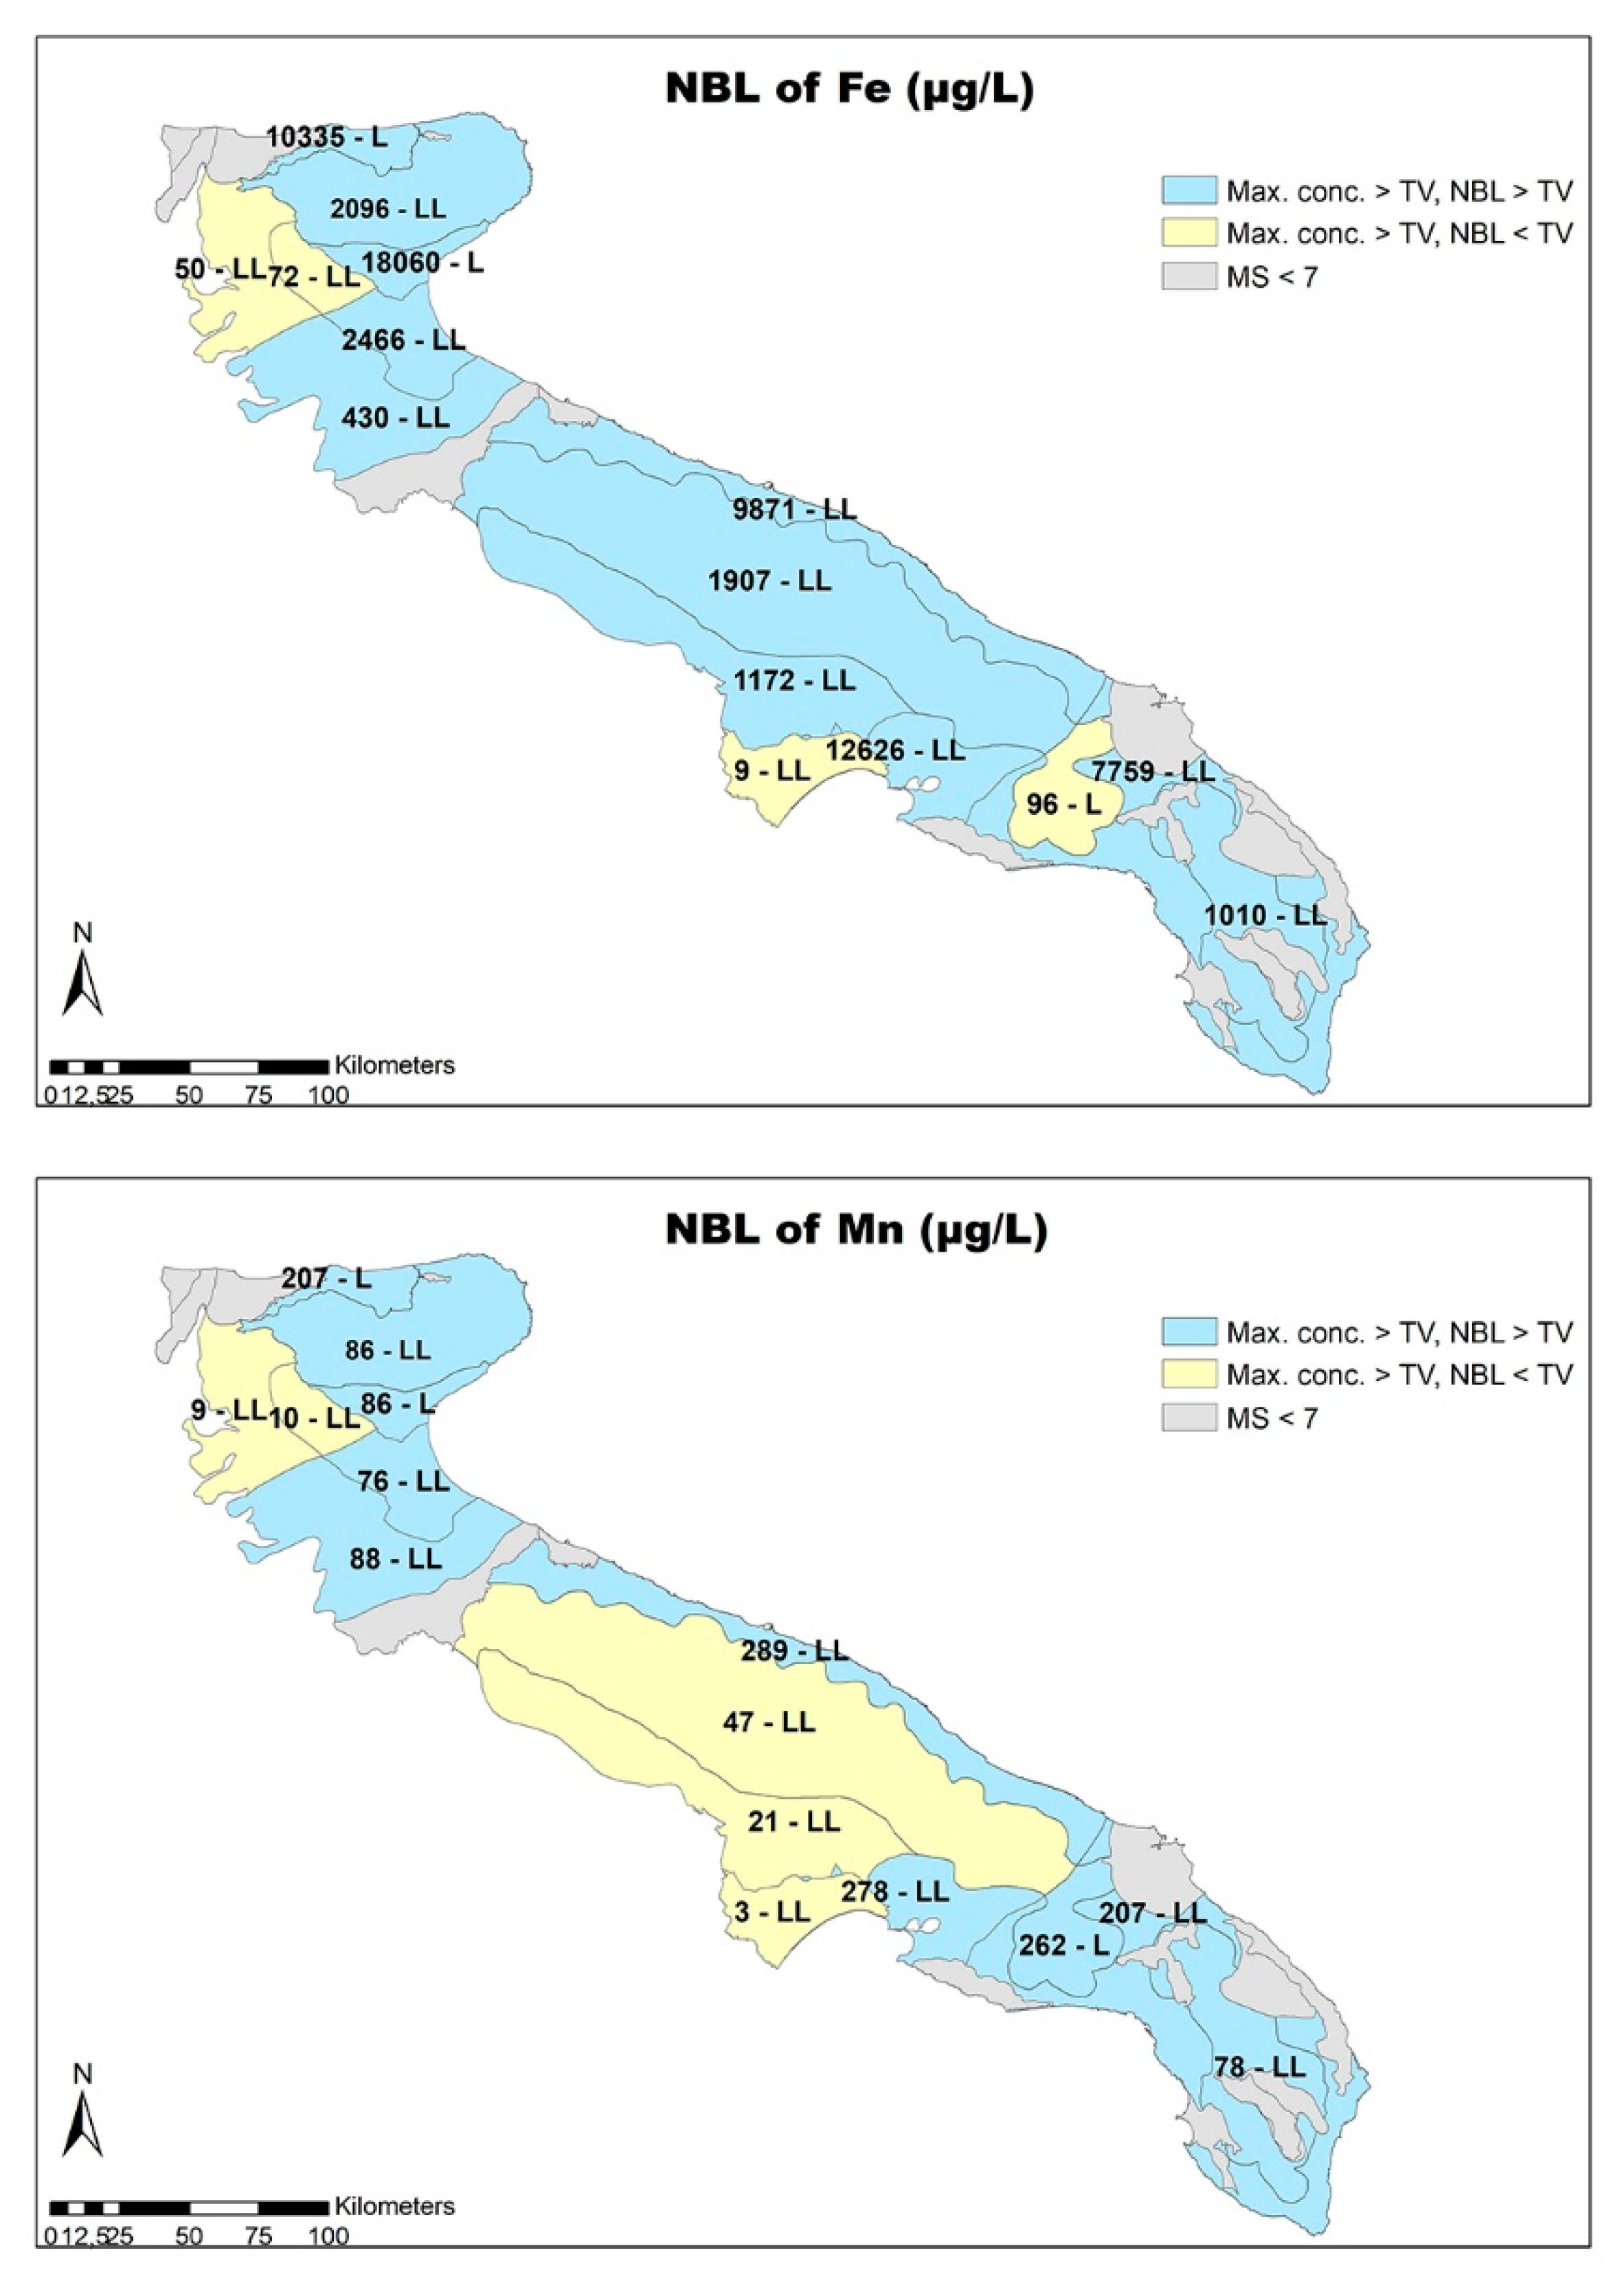
4.4. NBLs Calculation for the Redox Sensitive Elements (Iron and Manganese)

As already mentioned, for iron and manganese the NBLs were calculated separately for the oxidizing and reducing facies, and then the higher of the two values was chosen as NBL of the entire GWB. When the number of data did not allow the NBL calculation for both facies, the only available value was assigned to the GWB. The calculated NBLs and the associated confidence levels are shown in Table 7 and Figure 7, while the other data relating to the performed elaborations are shown in Table S2 (Supplementary Materials).
For both elements, the exceedances of the TVs concern almost all GWBs and are mainly due, as expected, to values defined for the reducing facies. Particularly, iron shows severe exceedances, with NBLs even two orders of magnitude higher than the corresponding TV (200 µg/L).
The confidence levels associated with the defined NBLs are always low or very low. This is due to the reduced number of initial MSs (217), as well as to the redox facies separation, which produces two different datasets with reduced numerical consistency.

5. Discussion and Conclusions

The Apulian GWBs characterization, carried out according to the rules set by the national regulation [5], pointed out the exceedance of the threshold values for some inorganic parameters, identifying a group of groundwater bodies at risk of failing to meet the Water Framework Directive environmental objectives. Consequently, the assessment of the natural background levels becomes an urgent need, in order to establish the natural or anthropogenic origin of the high values encountered for such parameters.
This work reports a tentative application of the recently published national guidelines for the NBL assessment to the inorganic compounds monitored in the GWBs of the Apulia region. The NBLs values calculated resulted often higher than the related threshold values.
Concerning the redox-sensitive elements iron and manganese, the estimated NBLs exceed, even of 11 and 10 orders of magnitude respectively, the TVs at 15 GWBs. The lack of redox-related parameter measurements (i.e., ORP and DO) forced us to eliminate many MSs from the available database, making the pre-selected dataset rather small and the estimated NBLs confidence levels low or very low. Furthermore, the resulting NBLs almost always correspond to the values estimated in the reducing facies confirming the extreme sensitivity of these two elements in a negative redox environment. This outcome is not surprising considering that Apulian GWBs, and particularly the carbonate ones, are often very deep and confined with the roof at even more than 100 m under the sea level.
The abundance of iron and manganese in the carbonate Apulian GWBs can be associated both to clay-rich lenses interbedded in the carbonate sequence and to the widespread red soils covering the limestone and filling karst cavities and fractures. Their presence is also justified in some detrital and alluvial aquifers that derive from the weathering and erosion of carbonate rocks [44,45].
The estimated NBLs of chloride and sulphate exceed the corresponding TVs in 12 and in 6 of the 15 investigated GWBs respectively, with a wide range of variability. This result was easily predictable for the coastal GWBs but unexpected in the Murgia Bradanica, being this latter very far from the coastline. As known, chloride concentration in coastal GWBs can be particularly affected by the current seawater intrusion, nevertheless different concurrent saline sources can overlap to seawater contributing to groundwater salinization independently from the GWB distance from the coastline [26,27].
In some cases, the mobilization of paleo-seawaters intruded into the aquifers during previous marine transgressions can occur. These saline waters, isolated from active flow, reside for a period long enough to allow water to assume typical connate water characteristics. This is the case of the deep groundwater flux exchanges that occur along the main tectonic elements as an effect of the Apennine convergence towards the Apulia foreland giving rise to upward flow of warm waters drained by springs [38,39]. Previous studies revealed that the chemical and isotopic features of salt groundwater, sampled in different point of the Apulian karstic aquifers or drained from coastal springs, are very different from modern seawater [46,47,48,49]. Nevertheless, currently it is not clear to what extent this phenomenon can be considered natural or forced by anthropogenic activity (e.g., excessive pumping in coastal area).
In 4 of the 15 considered GWBs, the calculated NBL for selenium exceed the threshold value set for this element. Selenium can be present in trace in the carbonate rocks and the argillaceous sediments that fill up the karst cavities [50,51]. In many cases, high values of selenium concentration have been measured in springs draining deep water whose composition results from a high degree of water-rock interaction. Nevertheless, given the evident spatial and temporal fragmentation of high selenium concentration measurements, some Authors proposed the hypothesis that it may originate from its use in agriculture as a nutrient, which, in particular environmental circumstances (e.g., soil temperature, humidity and acidity), leaches from the ground into the underlying groundwater [52].
The application of the Italian Guideline to the estimation of the NBLs of the Apulian GWBs, as proposed in this work, highlighted some problems related to the procedure itself. The Guidelines require an initial preselection of the monitoring sites and the related sets of analysis to retain for the NBLs estimation, based on several validation tests. Unfortunately, this preliminary step often reduces consistently the available information making the estimations unreliable or impossible. This is particularly true in those groundwater bodies characterized by a bounded extension and usually monitored with a few sampling sites. It is not a case that the NBLs estimation has not been possible in almost half of the regional groundwater bodies.
The data spatial consistency and the temporal continuity of monitoring are critical, but the existing groundwater monitoring networks have been designed for different purposes, such as the evaluation of the environmental state of the groundwater body or keeping under control local-specific issues.
The used dataset covers a time span of 24 years during which the monitoring has been suspended even for years and then restarted, sampling and analytical methods have changed with the scientific and technical advance. As a consequence, spatial consistency and temporal continuity of the available data can result deficient concerning some parameter or the whole groundwater body.
All the above requires a deep technical and economical evaluation of the opportunity of redesigning or modifying the existing monitoring network in order to reduce the weakness highlighted with regard to the natural background levels estimation in the regional groundwater bodies.
This topic is the subject of specific further investigations in an experimental coastal area, whose final goal is to solve the key question of source of salinization, and define specific protocols for NBLs assessment in coastal aquifers [53,54,55].
In conclusion, the aim of this work was to apply and verify the national guidelines for the assessment of the NBLs, which implement the EU Water Framework Directive, in a south-European, regional contest characterized by the typical Mediterranean climatic and hydrologic features. A frequent issue of such areas is the high anthropization of the coastal areas and the overexploitation of groundwater for agricultural needs in almost total lacking surface resources. Even though some local specific issues arose during the application of the methodology, the results are suitable to be applied for the next steps of the EU-WFD implementation. In general, the NBL definition can be considered, at any latitude, one of the pillars for sustainable and long-term groundwater management, by tracing a clear boundary between what is supposed to be natural and what is clearly anthropic.

Supplementary Materials

The following are available online at https://www.mdpi.com/article/10.3390/w13070958/s1, Table S1: Results of the procedure for the NBLs calculation at the GWB scale, applied to the non-redox sensitive elements, Table S2: Results of the procedure for the NBLs calculation at the GWB scale, applied to the redox sensitive elements (Fe and Mn).

Author Contributions

Conceptualization, R.M., S.A., E.F., S.G., M.M., D.P., E.P., M.V., A.Z. and G.P.; methodology, E.P., D.P. and S.G.; software, S.G.; formal analysis, D.P., R.M.; data curation, G.P., S.G., R.M.; writing—original draft, R.M., G.P., S.G. and D.P.; writing—review and editing, R.M., G.P., S.G., D.P., E.F., E.P., S.A., A.Z.; supervision, G.P.; project administration, G.P. and E.P.; funding acquisition, G.P. and R.M. All authors have read and agreed to the published version of the manuscript.

Funding

The VIOLA project has been funded by Apulia Region, Regional Department of Water Resources Management, within the frame of the Regional Operational Program (ROP) E.R.D.F.-E.S.F. 2014/2020.

Institutional Review Board Statement

Not applicable.

Informed Consent Statement

Not applicable.

Data Availability Statement

Paper experimental data are not currently publicly available but can be supplied on request from the corresponding author.

Conflicts of Interest

The authors declare no conflict of interest. The funders had no role in the design of the study; in the collection, analyses, or interpretation of data; in the writing of the manuscript, or in the decision to publish the results.

References

  1. Directive 2000/60/EC. Water Framework Directive (WFD). Directive of the European Parliament and of the Council of 23 October 2000 establishing a framework for Community action in the field of water policy. OJL 2000, 327, 1–73. [Google Scholar]
  2. Directive 2006/118/EC. GroundWater Daughter Directive (GWDD). Directive of the European Parliament and of the Council of 12 December 2006 on the protection of groundwater against pollution and deterioration. OJL 2006, 372, 19–31. [Google Scholar]
  3. Commission Directive 2014/80/EU of 20 June 2014 amending Annex II to Directive 2006/118/EC of the European Parliament and of the Council on the protection of groundwater against pollution and deterioration. OJL 2014, 182, 52–55.
  4. D.Lgs. 152/06—Decreto Legislativo n. 152 del 3 aprile. Norme in Materia Ambientale; Pubblicato nella Gazzetta Ufficiale n. 88 del 14 Aprile 2006. (Supplemento Ordinario n. 96); Istituto Poligrafico e Zecca dello Stato s.p.a.: Rome, Italy, 2006. [Google Scholar]
  5. D.Lgs. 30/09—Decreto Legislativo n. 30 del 16 marzo. Attuazione della Direttiva 2006/118/CE, Relativa alla Protezione delle Acque Sotterranee Dall’inquinamento e dal Deterioramento; Pubblicato nella Gazzetta Ufficiale n. 79 del 4 Aprile 2009; Istituto Poligrafico e Zecca dello Stato s.p.a.: Rome, Italy, 2009. [Google Scholar]
  6. Ministerial Decree of 6 July 2016–Recepimento della Direttiva 2014/80/UE Della Commissione del 20 Giugno 2014 che Modifica L’allegato II Della Direttiva 2006/118/CE del PARLAMENTO Europeo e del Consiglio Sulla Protezione Delle Acque Sotterranee Dall’inquinamento e dal Deterioramento; Pubblicato nella Gazzetta Ufficiale n.165 del 16 Luglio, 2016; Istituto Poligrafico e Zecca dello Stato s.p.a.: Rome, Italy, 2016.
  7. Appelo, C.A.J.; Postma, D. Geochemistry, Groundwater and Pollution, 2nd ed.; CRC Press: Boca Raton, FL, USA, 2005; p. 668. [Google Scholar]
  8. Banks, D.; Reimann, C.; Royset, O.; Skarphagen, H.; Saether, O.M. Natural concentrations of major and trace elements in some Norwegian bedrock groundwaters. Appl. Geochem. 1995, 10, 1–16. [Google Scholar] [CrossRef]
  9. Kelly, W.R.; Panno, S.V. Some considerations in applying background concentrations to ground water studies. Ground Water 2008, 46, 790–792. [Google Scholar] [CrossRef] [PubMed]
  10. Muller, D.; Blum, A.; Hart, A.; Hookey, J.; Kunkel, R.; Scheidleder, A.; Tomlin, C.; Wendland, F. Final proposal for a methodology to set up groundwater threshold values in Europe. In Report to the EU project “BRIDGE”; Deliverable D18; 2006; Available online: http://nfp-at.eionet.europa.eu/Public/irc/eionet-circle/bridge/library?l=/deliverables/bridge_groundw-205pdf/_EN_ 1.0_&a=d (accessed on 11 January 2021).
  11. European Commission. Guidance on Groundwater Status and Trend Assessment, Guidance Document no 18; Technical Report; European Communities: Luxembourg, 2009; ISBN 978-92-79-11374-1. [Google Scholar]
  12. Molinari, A.; Guadagnini, L.; Marcaccio, M.; Guadagnini, A. Natural background levels and threshold values of chemical species in three large-scale groundwater bodies in Northern Italy. Sci. Total Environ. 2012, 425, 9–19. [Google Scholar] [CrossRef]
  13. Walter, T. Determining natural background values with probability plots. In Proceedings of the EU Groundwater Policy Developments Conference UNESCO, Paris, France, 13–15 November 2008. [Google Scholar]
  14. Panno, S.V.; Kelly, W.R.; Martinsek, A.T.; Hackley, K.C. Estimating background and threshold nitrate concentrations using probability graphs. Ground Water 2006, 44, 697–709. [Google Scholar] [CrossRef] [PubMed]
  15. Wendland, F.; Hannappel, S.; Kunkel, R.; Schenk, R.; Voigt, H.J.; Wolter, R. A procedure to define natural groundwater conditions of groundwater bodies in Germany. Water Sci. Technol. 2005, 51, 249–257. [Google Scholar] [CrossRef]
  16. Edmunds, W.M.; Shand, P.; Hart, P.; Ward, R.S. The natural (baseline) quality of groundwater: A UK pilot study. Sci. Total Environ. 2003, 310, 25–35. [Google Scholar] [CrossRef] [Green Version]
  17. Nakić, Z.; Kovač, Z.; Parlov, J.; Perković, D. Ambient Background Values of Selected Chemical Substances in Four Groundwater Bodies in the Pannonian Region of Croatia. Water 2020, 12, 2671. [Google Scholar] [CrossRef]
  18. Urresti-Estala, B.; Carrasco-Cantos, F.; Vadillo-Pérez, I.; Jiménez-Gavilán, P. Determination of background levels on water quality of groundwater bodies: A methodological proposal applied to a Mediterranean River basin (Guadalhorce River, Málaga, southern Spain). J. Environ. Manag. 2013, 117, 121–130. [Google Scholar] [CrossRef] [PubMed]
  19. Parrone, D.; Ghergo, S.; Preziosi, E. A multi-method approach for the assessment of natural background levels in groundwater. Sci. Total Environ. 2019, 659, 884–894. [Google Scholar] [CrossRef] [PubMed]
  20. Biddau, R.; Cidu, R.; Lorrai, M.; Mulas, M.G. Assessing background values of chloride, sulfate and fluoride in groundwater: A geochemical-statistical approach at a regional scale. J. Geochem. Explor. 2017, 181, 243–255. [Google Scholar] [CrossRef]
  21. Dalla Libera, N.; Fabbri, P.; Mason, L.; Piccinini, L.; Pola, M. Geostatistics as a tool to improve the natural background level definition: An application in groundwater. Sci. Total Environ. 2017, 598, 330–340. [Google Scholar] [CrossRef] [PubMed] [Green Version]
  22. Ducci, D.; Condesso de Melo, M.T.; Preziosi, E.; Sellerino, M.; Parrone, D.; Ribeiro, L. Combining natural background levels (NBLs) assessment with indicator kriging analysis to improve groundwater quality data interpretation and management. Sci. Total Environ. 2016, 569–570, 569–584. [Google Scholar] [CrossRef] [PubMed]
  23. Preziosi, E.; Parrone, D.; Del Bon, A.; Ghergo, S. Natural background level assessment in groundwaters: Probability plot versus pre-selection method. J. Geochem. Explor. 2014, 143, 43–53. [Google Scholar] [CrossRef]
  24. Molinari, A.; Chidichimo, F.; Straface, S.; Guadagnini, A. Assessment of natural background levels in potentially contaminated coastal aquifers. Sci. Total Environ. 2014, 476–477, 38–48. [Google Scholar] [CrossRef]
  25. ISPRA—Istituto Superiore per la Protezione e la Ricerca Ambientale. Linee Guida Recanti la Procedura da Seguire per il Calcolo dei Valori di Fondo Naturale per i Corpi Idrici Sotterranei (DM 6 Luglio 2016); Manuali e Linee Guida 155/2017; ISPRA: Rome, Italy, 2017; ISBN 978-88-448-0830-3. Available online: https://www.isprambiente.gov.it/it/pubblicazioni/manuali-e-linee-guida/linee-guidarecanti-la-procedura-da-seguire-per-il-calcolo-dei-valori-di-fondo-per-i-corpi-idrici-sotterranei-dm-6-luglio-2016 (accessed on 11 January 2021).
  26. Mirzavand, M.; Ghasemieh, H.; Sadatinejad, S.J.; Bagheri, R. An overview on source, mechanism and investigation approaches in groundwater salinization studies. Int. J. Environ. Sci. Technol. 2020, 17, 2463–2476. [Google Scholar] [CrossRef]
  27. Emblanch, C.; Kapelj, S.; Lambrakis, N.; Morell, I.; Petalas, C. Sources of Aquifer Salinisation. Chapter 3-WG3 Environmental Tracing. Part II. Final Report of Action COST 621 “Groundwater Management of Karst Coastal Aquifers”; European Commission Publication Office: Luxemburg, 2005; ISBN 92-894-0015-1. [Google Scholar]
  28. Parrone, D.; Frollini, E.; Preziosi, E.; Ghergo, S. eNaBLe, an On-Line Tool to Evaluate Natural Background Levels in Groundwater Bodies. Water 2021, 13, 74. [Google Scholar] [CrossRef]
  29. HP: Hypertext Preprocessor. Available online: https://www.php.net (accessed on 11 January 2021).
  30. MySQL. Available online: https://www.mysql.com (accessed on 11 January 2021).
  31. ISTAT (Istituto Nazionale di Statistica). Bilancio Demografico Nazionale. 2019. Available online: http://www.istat.it/it/archivio/245466 (accessed on 11 January 2021).
  32. Passarella, G.; Bruno, D.; Lay-Ekuakille, A.; Maggi, S.; Masciale, R.; Zaccaria, D. Spatial and temporal classification of coastal regions using bioclimatic indices in a Mediterranean environment. Sci. Total Environ. 2020, 700, 134415. [Google Scholar] [CrossRef] [PubMed]
  33. Ciaranfi, N.; Pieri, P.; Ricchetti, G. Note alla carta geologica delle Murge e del Salento (Puglia centromeridionale). Mem. Soc. Geol. Ital. 1988, 41, 449–460. [Google Scholar]
  34. Ricchetti, G.; Ciaranfi, N.; Sinni, E.L.; Mongelli, F.; Pieri, P. Geodinamica ed evoluzione sedimentaria e tettonica dell’Avampaese apulo. Mem. Soc. Geol. Ital. 1988, 41, 57–82. [Google Scholar]
  35. Maggiore, M.; Pagliarulo, P. Groundwater vulnerability and pollution sources in the Apulian region (Southern Italy). In Proceedings of the 2nd Symposium Protection of Groundwater from Pollution and Seawater Intrusion, Bari, Italy, 27 September–1 October 1999; pp. 9–20. [Google Scholar]
  36. Cotecchia, V.; Grassi, D.; Polemio, M. Carbonate aquifers in Apulia and seawater intrusion. G. Geol. Appl. 2005, 1, 219–231. [Google Scholar]
  37. Maggiore, M.; Pagliarulo, P. Circolazione idrica ed equilibri idrogeologici negli acquiferi della Puglia. In Proceedings of the Conference Uso e Tutela dei Corpi Idrici Sotterranei Pugliesi, Bari, Italy, 21 June 2002. Geol. Territ. 2004, 1, 13–35. [Google Scholar]
  38. Mongelli, F.; Ricchetti, G. Heat flow along the Candelaro fault, Gargano headland (Italy). Geothermics 1970, 2, 450–458. [Google Scholar] [CrossRef]
  39. Maggiore, M.; Mongelli, F. Hydrogeothermal model of groundwater supply to San Nazario Spring (Gargano, Southern Italy). In Proceedings of the International Conference on Environmental Changes in Karst Areas, ICECKA, Bari, Italy, 15–27 September 1991; Quaderni del Dip.di Geografia—Università di Padova: Padova, Italy, 1991; Volume 13, pp. 307–324. [Google Scholar]
  40. Masciale, R.; Barca, E.; Passarella, G. A methodology for rapid assessment of the environmental status of the shallow aquifer of "Tavoliere di Puglia" (Southern Italy). Environ. Monit. Assess. 2011, 177, 245–261. [Google Scholar] [CrossRef]
  41. Passarella, G.; Vurro, M.; Barca, E.; Sollitto, D.; Pedalino, M.; Iannarelli, M.A.; Campana, C.; Casale, V. Identificazione e Caratterizzazione dei Corpi Idrici della Puglia ai Sensi del D.Lgs.30/2009; IRSA Research Report: Regione Puglia, Bari, Italy, 2013; p. 94. [Google Scholar]
  42. Passarella, G.; Vurro, M.; Barca, E.; Bruno, D.E. Attività Complementari ed Integrative della Caratterizzazione dei Corpi Idrici Sotterranei; IRSA Research Report: Regione Puglia, Bari, Italy, 2015; p. 117. [Google Scholar]
  43. Barca, E.; Passarella, G.; Vurro, M.; Morea, A. MSANOS: Data-driven, multi-approach software for optimal redesign of environmental monitoring networks. Water Res. Manag. 2015, 29, 619–644. [Google Scholar] [CrossRef]
  44. Boni, M.; Rollinson, G.; Mondillo, N.; Balassone, G.; Santoro, L. Quantitative mineralogical characterization of karst bauxite deposits in the Southern Apennines, Italy. Econ. Geol. 2013, 108, 813–833. [Google Scholar] [CrossRef] [Green Version]
  45. Moresi, M.; Mongelli, G. The relation between the terra rossa and the carbonate-free residue of the underlying limestones and dolostones in Apulia, Italy. Clay Miner. 1988, 23, 439–446. [Google Scholar] [CrossRef]
  46. Mr, B.; Mz, B.; Fidelibus, M.D.; Morotti, M.; Sappa, G.; Tulipano, L. First results of isotopic ratio 87Sr/86Sr in the characterization of seawater intrusion in the coastal karstic aqui-fer of Murgia (Southern Italy). In Proceedings of the 15th SWIM, Ghent, Belgium, 1998. Natuurwet. Tijdschr. 1999, 79, 132–139. [Google Scholar]
  47. Fidelibus, M.; Calò, G.; Tinelli, R.; Tulipano, L. Salt ground waters in the Salento karstic coastal aquifer (Apulia, Southern Italy). In Advances in the Research of Aquatic Environment; Lambrakis, N., Stournaras, G., Katsanou, K., Eds.; Springer: Berlin/Heidelberg, Germany, 2011. [Google Scholar] [CrossRef]
  48. Fidelibus, M.D.; Tulipano, L. Mixing phenomena owing to seawater intrusion for the inter- pretation of chemical and isotopic data of discharge waters in the Apulian coastal carbonate aquifer (Southern Italy). In Hydrogeology of Salt Water Intrusion; De Breuck, W., Ed.; A Selection of SWIM Papers; Heise: Hannover, Germany, 1991. [Google Scholar]
  49. Fidelibus, M.D.; Tulipano, L. Regional flow of intruding sea water in the carbonate aquifers of Apulia (Southern Italy). In Rapporter och Meddelanden-Proc. 14th SWIM, Malmo, Sweden; Geological Survey of Sweden, Gotab, Stockholm: Uppsala, Sweden, 1996; Volume 86, pp. 230–240. ISBN 91-7158-572-9. [Google Scholar]
  50. Bassil, J.; Naveau, A.; Fontaine, C.; Grasset, L.; Bodin, J.; Porel, G.; Razac, M.; Kazpard, V.; Popescu, S.M. Investigation of the nature and origin of the geological matrices rich in selenium within the Hydrogeological Experimental Site of Poitiers, France. Comptes Rendus Geosci. 2016, 348, 598–608. [Google Scholar] [CrossRef]
  51. Renarda, F.; Montes-Hernandeza, G.; Ruiz-Agudod, E.; Putnis, C.V. Selenium incorporation into calcite and its effect on crystal growth: An atomic force microscopy study. Chem. Geol. 2013, 340, 151–161. [Google Scholar] [CrossRef]
  52. Al Kuisi, M.; Abdel-Fattah, A. Groundwater vulnerability to selenium in semi-arid environments: Amman Zarqa Basin, Jordan. Environ. Geochem. Health 2010, 32, 107–128. [Google Scholar] [CrossRef] [PubMed]
  53. Masciale, R.; Amalfitano, S.; Frollini, E.; Ghergo, S.; Melita, M.; Parrone, D.; Preziosi, E.; Vurro, M.; Zoppini, A.; Passarella, G. The VIOLA Project: Natural background levels for the groundwater bodies of Apulia Region (Southern Italy). In Proceedings of the EGU General Assembly 2020, Online, 4–8 May 2020. [Google Scholar] [CrossRef]
  54. Parrone, D.; Amalfitano, S.; Frollini, E.; Ghergo, S.; Masciale, R.; Melita, M.; Passarella, G.; Vurro, M.; Zoppini, A.; Preziosi, E. The VIOLA project: Geochemical characterization and natural background levels in a coastal GWB of the Apulia Region (southern Italy). In Proceedings of the EGU General Assembly 2020, Online, 4–8 May 2020. [Google Scholar] [CrossRef]
  55. Melita, M.; Amalfitano, S.; Frollini, E.; Ghergo, S.; Masciale, R.; Daniele, P.; Passarella, G.; Preziosi, E.; Vurro, M.; Zoppini, A. The VIOLA Project: Functional responses of groundwater microbial community across the salinity gradient in a coastal karst aquifer. In Proceedings of the EGU General Assembly 2020, Online, 4–8 May 2020. [Google Scholar] [CrossRef]
Figure 1. The page of the VIOLA Project web site where the parameters for the NBLs assessment can be configured. On the right side the procedure provides general information about the GWB analytical dataset while, on the left, it allows the settings for the NBL evaluation.
Water 13 00958 g001
Figure 2. Results of the NBLs assessment. The GWD characteristics, the computational settings and the link to the intermediate and processed datasets are listed in the upper part, while the values of the NBLs for the selected parameters and the relative confidence levels appear in the lower part.
Water 13 00958 g002
Figure 3. Map of the Apulia region, showing the main geographical sub-regional areas (Gargano, Tavoliere, Murgia and Salento) and the regional groundwater monitoring network.
Water 13 00958 g003
Figure 4. Sketch map showing the geographic position of Apulia GWBs.
Water 13 00958 g004
Figure 5. Piper diagrams showing major groundwater components (a) Gargano and Murgia-Salento carbonate HCs; (b) detrital HCs; (c) Alluvial and Miocene carbonate HCs.
Water 13 00958 g005
Figure 6. NBLs defined for sulfates, fluorides, chlorides, boron, arsenic and selenium at the GWBs scale and the associated confidence levels (H = high, L = low, LL = very low). The NBLs obtained for GWBs with maximum concentration observed during monitoring below TV were not shown in the figure. In grey are shown the GWBs where the NBL assessment was not performed (MS < 7).
Water 13 00958 g006
Figure 7. NBLs defined for iron and manganese at the GWBs scale and the associated confidence levels (L = low, LL = very low). In grey are shown the GWBs where the NBL assessment was not performed (MS < 7).
Water 13 00958 g007
Table 1. Type of dataset following the size in space (number of monitoring stations) and time (number of observations in time) and relative procedure for NBL calculation (steps 8 to 10). MS = monitoring site.
TypeSpatial sizeTemporal SizeDistribution of the Parameter Dataset in SpaceNBL from the Spatial Analsyis
A≥15 MS≥8 half yearly obs. NormalMaximum value
Not normal95th percentile
B≥15 MS<8 half yearly obs. NormalMaximum value
Not normal95th percentile
C<15 MS≥8 half yearly obs. -Maximum value
D<15 MS<8 half yearly obs.Total obs. (space, time) ≥ 10(PROVISIONAL) 90th percentile
Total obs. (space, time) < 10(PROVISIONAL) Estimated by analogy with a similar GWB
Table 2. Confidence level of the obtained NBL. U. = unconfined aquifer; C. = confined aquifer; H = high; M = medium; L = low; LL very low.
Path
Type
N. Total obs.N. Total MSDimension of GWB or Portion of GWB Represented by Dataset (km2)
<1010–7070–700>700
Aquifer type
U.C.U.C.U.C.U.C.
A 15–25HHHHMHMH
>25HHHHHHHH
B 15–25MHMHLMLM
>25HHHHMHMM
C≤15 MMLMLLLLLLL
16–30MHMMLMLLL
>30HHMHMHMM
D<10 LLLLLLLLLLLLLL
≥10LLLLLLLLLLL
Table 3. Main statistical indicators of the physical-chemical parameters measured in the Apulia monitoring network.
T (°C)pHEC (µS/cm)DO (mg/L)ORP (mV)
N Observations34631936325118041802
Min7.24.711290.01−473
Max34.511.9055,76015.2504
Mean18.87.3039825.673
Median18.57.2515006.1112
Std Dev2.80.58401.95.4128.5
Table 4. Statistics and exceedances of the main inorganic parameters compared to the corresponding TVs.
NO3 (mg/L)NH4 (mg/L)NO2 (mg/L)F (mg/L)Cl (mg/L)SO4 (mg/L)B (µg/L)Mn (µg/L)Fe (µg/L)As (µg/L)Se
(µg/L)
N Obs.36093510366336633381338225392539297425392539
Max value71653.921.95.8724,1066600444612,800178,00079.0282.7
TVs500.50.51.502502501000502001010
N Exceed.73222568130165556821664957795
% Exceed.20.36.41.93.549.016.80.826.232.20.33.7
Table 5. Data validation and pre-selection of the monitoring stations. EBE = electrical balance error; MS = monitoring site; PS MSs = pre-selected monitoring sites.
GWBData ValidationTotal DatasetOxidizing FaciesReducing Facies
<LOQEBE > 10%MSsPS
MSs
%PS
MSs
MSsPS
MSs
%PS
MSs
MSsPS
MSs
%PS
MSs
East-Central Gargano 2341161487.58787.522100.0
Southern Gargano10617342.911100.03133.3
Northern Gargano20928787.544100.022100.0
Coastal Murgia11025352674.315960.01414100.0
Alta Murgia12303464189.1313096.87685.7
Murgia Bradanica 3836161168.812866.722100.0
Murgia Tarantina3559161381.333100.07571.4
Coastal Salento9009473268.1151280.0151280.0
North-Central Salento190210550.03266.733100.0
South-Central Salento8459432865.1302273.34375.0
North-Eastern Tavoliere131210220.06116.711100.0
North-Western Tavoliere 11806116.74125.011100.0
South--Central Tavoliere14316233.35240.00--
South-Eastern Tavoliere221213538.58112.522100.0
Western Arco Ionico302315426.79111.10--
All GWBs64695529419466.015410467.5635485.7
Table 6. Defined NBLs and associated confidence levels for the non-redox sensitive elements. NBLs above the threshold values are shown in bold. H = high; L = low; LL = very low. As indicated in the guidelines, the NBL for each parameter was expressed with the same measurement unit and rounded up with the same number of decimals as the relative TV set by Legislative Decree 152/2006.
GWBF (mg/L)Cl (mg/L)SO4 (mg/L)B (µg/L)As (µg/L)Se (µg/L)Confidence
Level
East-Central Gargano0.63134415958212LL
Southern Gargano0.71842211826118L
Northern Gargano0.5182022589411L
Coastal Murgia0.78228118875229H
Alta Murgia0.471518612H
Murgia Bradanica 0.42716215615LL
Murgia Tarantina0.62047274568121LL
Coastal Salento0.4168350732725H
North-Central Salento0.268710311412L
South-Central Salento0.3434729914H
North-Eastern Tavoliere1.013851589412LL
North-Western Tavoliere 0.5942715011LL
South-Central Tavoliere1.11259323611LL
South-Eastern Tavoliere1.434914174627LL
Western Arco Ionico0.3714388410111LL
TV1.525025010001010-
Table 7. Defined NBLs and associated confidence levels for iron and manganese. NBLs above the threshold values are shown in bold. L = low; LL = very low.
GWBFe (µg/L)Mn (µg/L)
OxRedGWBConf. Lev.OxRedGWBConf. Lev.
East-Central n Gargano20968342096LL864886LL
Southern Gargano-18,06018,060L-8686L
Northern Gargano310,33510,335L1207207L
Coastal Murgia19498179871LL16289289LL
Alta Murgia23419071907LL434747LL
Murgia Bradanica 117281172LL21221LL
Murgia Tarantina612,62612,626LL2278278LL
Coastal Salento13277597759LL86207207LL
North-Central Salento509696L36262262L
South-Central Salento24110101010LL247878LL
North-Eastern Tavoliere724372LL10710LL
North-Western Tavoliere 504850LL939LL
South-Central Tavoliere430-430LL88-88LL
South-Eastern Tavoliere-24662466LL-7676LL
Western Arco Ionico9-9LL3-3LL
TV200200200-505050-
Publisher’s Note: MDPI stays neutral with regard to jurisdictional claims in published maps and institutional affiliations.

