
Experimental Analysis of Scour Features at Chevrons in Straight Channel


1
Department of Energy, Systems, Territory and Construction Engineering, University of Pisa, 56122 Pisa, Italy
2
Department of Civil and Environmental Engineering, Imperial College London, South Kensington, London SW7 2AZ, UK
*
Author to whom correspondence should be addressed.
Water 2021, 13(7), 971; https://doi.org/10.3390/w13070971
Submission received: 18 February 2021
/
Revised: 15 March 2021
/
Accepted: 31 March 2021
/
Published: 1 April 2021
(This article belongs to the Special Issue Erosion Processes in Hydraulic Engineering)
Abstract
:Eco-friendly river restoration structures are used to create localized scour pools which serve as fish nurseries and promote biodiversity. In this category, chevrons are relatively new structures designed to maintain navigability in rivers. The scour hole formed in the wake region of chevrons can either act as a disposal site for dredged material or as a resting spot for different fish species. However, only few studies are present in the literature dealing with the scour mechanism due to chevrons. Therefore, this work aims to analyze the scour features at equilibrium, under different hydraulic conditions and transversal locations in a straight channel. Tests were conducted with both isolated and multiple chevrons in series arrangement. Scour morphology types were classified and their fields of existence were established as well. A detailed dimensional analysis was conducted, allowing us to identify the main parameters governing the scour phenomenon and derive a novel equivalent densimetric Froude number. Finally, empirical equations were developed to predict the maximum scour depth and length as well as the maximum dune height.
1. Introduction
Fresh water ecosystems are essential for the sustenance and preservation of human civilisation. In particular, the various river systems play an important role for all human activities. However, due to anthropogenic degradation of the environment, rivers are prone to damage in terms of water quality and sediment carrying potential. In this context, river restoration aims at enhancing river health by promoting natural flow variations and grade-control. This can be done either passively by encouraging proper land use and irrigation [1] or more directly by introducing different low-head eco-friendly structures to mimic the conditions of a reference reach [2]. In this regard, double-winged log-frames, log-frame deflectors, wood bundles, chevrons and other structures are used to stabilize the channel, control sediment carrying capacity, increase navigability and create scour pools which are regions of slow-moving deep-water suitable for fish resting and growth of other organisms. Likewise, the dune regions around the scour pools can be used as a site for fish spawning. In addition, these structures can contribute to dissipate the upstream flow energy thereby avoiding excessive degradation of the downstream branches. Nevertheless, the scour morphology due to the above structures needs to be thoroughly studied to ensure stability of the stilling basin.
Early studies on scour due to hydraulic structures was carried out by [3] who analysed the scour process downstream of spillways. Likewise, ref. [4] carried out studies on grade-control structures, providing significant contributions based on jet diffusion theory and particle stability analysis in the scour hole. A thorough literature survey was conducted by [5,6,7], who focused on the various empirical equations used to predict the maximum scour depth for grade-control structures. They concluded that empirical equations depend heavily on the experimental conditions used to calibrate/validate them. Subsequently studies dealing with other structures highlighted the important influence of hydraulic conditions and geometric configurations on the phenomenon [8,9,10,11]. More recently, advancements were made on developing theoretical models for scour prediction using Newton’s second law or the phenomenological theory of turbulence [12,13,14,15].
Studies were also conducted on the scour characteristics due to specific grade-control structures such as submerged vanes [16,17,18]. Following this, ref. [19] analyzed the effect of sills on the major scour geometry parameters and [20] studied in detail W-weirs located in meandering channels. Subsequently, refs. [21,22] analyzed the flow across vane dikes in curved channels and 3-D scour pattern due to various structures, respectively. Block ramps were analyzed in detail by [23] who highlighted the role of tailwater level and the position of the pile in influencing the scour process. Thereafter, the authors of [24] studied block ramps in the presence of downstream stilling basin protection. The scour mechanism due to block ramps located in channel curves in absence and presence of downstream sills was studied by [25,26], respectively. Finally, other studies numerically investigated the influence of different hydraulic conditions on dune dynamics, providing interesting observations on mean streamwise velocity and free water surface characteristics [27].
More recently, other eco-friendly structures like log-frames and deflectors have been used in several river restoration projects to rejuvenate the fluvial habitat. In this context, studies on log-vanes and log deflectors were carried out by [28,29]. Furthermore, [30] investigated triangular-shaped log-frame deflectors and concluded that these structures shift the location of the scour away from the bank, thereby contributing to stabilize the channel bed and banks. An experimental analysis of the scour features due to stone reinforced double-winged log-frames was proposed by [31] who also provided empirical equations to estimate the main geometric parameters of the equilibrium morphology.
The term “chevron” identifies both “large U- and V-shaped ridges found in or near shorelines worldwide” [32] and structures used for river restoration. In fluvial contexts, they represent a new and suitable solution to enhance local conditions. These structures were initially used to concentrate the flow and induce localized scour processes resulting in an improvement of the navigability of channels/rivers. However, they were also found to be effective in enhancing the habitat for fish species. Namely, deep scour zones are formed in correspondence with the structures which act as potential refuge sites for fish and aquatic habitats. Furthermore, chevrons can prevent excessive erosion if located upstream of the nose of islands. Despite their effectiveness, very few studies deal with chevrons. More specifically, ref. [33] conducted a preliminary study on blunt-nosed chevrons and provided a basic design guideline for their implementation. They also observed that chevrons usually increase the diversity of the fluvial flora and fauna. In this regard, ref. [34] conducted a study on a two-kilometre reach of St. Louis harbor, analyzing the effect of chevrons on the aquatic habitat. They concluded that the presence of the structures “increased physical-aquatic-habitat diversity within the channel by 8–35%.” The interaction of chevrons with river hydraulics was analyzed by [35]. The authors corroborated the beneficial effects of such structures, but they did not provide a detailed analysis of the equilibrium morphology. Likewise, the American Society of Civil Engineers (ASCE) Task Committee on Inland Navigation of the Waterways Committee of the Coasts, Oceans, Ports, and Rivers Institute (COPRI) further clarified the importance of this structure typology in enhancing river navigation and highlighted that they can be used to create an excellent habitat for fish species [36]. In doing so, they also pointed out that further investigations are needed to increase the understanding of the scour process occurring in correspondence with chevrons.
This study aims at filling the aforementioned gap in knowledge. Apparently, none of the previous studies provides a detailed analysis of the equilibrium morphology occurring in correspondence with chevrons under different hydraulic conditions and structure configurations. Furthermore, there are no relationships to evaluate the main geometric characteristic at equilibrium. Note that the knowledge of such characteristics is of fundamental importance for the following reasons. First, an excessive scour can cause the collapse of the structure. Then, any design optimization should be based on reliable tools allowing hydraulic engineers to predict the shape and dimensions of both scour holes and dune formations. To this end, we conducted an extensive experimental campaign, by testing several chevron configurations under clear water conditions. Several morphology types were distinguished and classified, depending on both hydraulic conditions and structure configurations. Finally, the analysis of experimental data allowed us to derive a set of empirical equations that can be useful to predict the main geometric characteristics of the scour holes and dune at equilibrium.
2. Materials and Methods
Chevrons were tested at the hydraulics laboratory of the University of Pisa under various hydraulic and geometric conditions. The straight channel used for experimentation was 11 m long, 0.5 m wide (B), 0.5 m deep and is shown in Figure 1a. Tests were conducted by placing the chevron structure at a distance of d from channel entrance (d/B = 15.8). Initially, a single, isolated chevron was tested. Thereafter, tests were undertaken with two and three chevron structures in series with a fixed inter chevron distance under otherwise identical conditions. The number of structures in a chevron structure arrangement is denoted by n. Notably, the structure position highlighted in Figure 1a is that of the first structure in the case of chevron series arrangement. Two different transversal positions of the structure were tested in the channel as shown in Figure 1c,d. They are defined as pc/B = 0.5 and 0.33 where pc denotes the distance of crown apex of the chevron structure from the channel bank.
Figure 2 shows the plan, cross-sectional and stream-wise views of the chevron series arrangement with three structures in a straight channel. The structural arrangement in case of a single, isolated structure and chevron series with two structures are the same as that reported in Figure 2, without the presence of the last two structures and the last structure, respectively. In Figure 2, zmu-1, zmu-2 and zmu-3 denote the maximum scour depths in the upstream vicinity of the first, second and third structure, respectively, in the case of multiple structures. zmd denotes the maximum scour depth formed in the downstream stilling basin after the last structure in the chevron series. z′m represents the maximum height of dune occurring in the downstream stilling basin. Accordingly, lmu denotes the maximum length of the scour hole occurring in the vicinity of the chevrons whereas lmd denotes the maximum scour length in the downstream stilling basin after the last structure in the chevron series. lmax indicates the maximum axial scour length of the entire scour region, including the scour formations in the structure vicinity and downstream stilling basin. Notably, when the downstream scour hole is absent lmax is assumed to be equal to lmu and occurs in the longitudinal section running along the edges of the chevron structure, or chevron structures in the arrangement in series. The maximum length of dune in the downstream stilling basin is denoted by l′m. Moreover, Q, htw and Δy are the flow discharge, tailwater level and difference in the level of water surface upstream and downstream of the chevron structure arrangement, respectively. hst denotes the height of the chevron structure whereas lst is the total curved length of each chevron structure.
The distance between two consecutive chevrons in a series arrangement is denoted by sc. This parameter was varied in the case of chevron series with two structures to evaluate the effect of structure longitudinal distance on the overall scour characteristics. It was observed that for sc/B = 0.2, the various chevron structures in the series interacts and causes the most significant modifications of the scour morphology and flow pattern. Therefore, all tests for chevron series arrangement with three structures were conducted for sc/B = 0.2.
The geometric characteristics of an individual chevron are shown in Figure 1b. The chevron structure has a symmetric U-shape, consisting of a central curved crown and two legs extending in the downstream direction on either side. The axial length of the structure (lcl) is equal to the structure width (wc). The entire curved length of the chevron (lst) is equal to lst = 2la + lb. For all the tests in the current study lst/B = 0.7. The relative radius of curvature of the crown of the chevron Rc/B is equal to 0.1, with Rc indicating the curvature of the crown. The chevron structure was made by layers of stones (mean diameter ranging between 2.5 and 3 cm) glued together using a silicone glue. The adopted configuration prevented sinking during experiments.
A uniform bed material was used to simulate the channel bed. The mean diameter of the bed material is d50 = 1 mm and its sediment non-uniformity parameter σ = (d84/d16)0.5 = 1.15, with dxx indicating the diameter of the bed material for which xx% is finer. The density of the bed sediment (ρs) is equal to 2467 kg/m3 and the density of water (ρ) was assumed to be equal to 1000 kg/m3. The viscous and sediment cohesive effects can be assumed to be negligible for a turbulent flow regime and d50 > 0.8 mm [37]. The summary of tests conducted in this study is shown in Table 1. In some cases, chevrons were tested under unsubmerged conditions, i.e., for hst > htw. Figure 3a,b show the development of a scour hole in the upstream vicinity of the chevron for test 6 at t = 0 s and t = 1800 s, respectively, where t is the time from the beginning of the test.
At the beginning of each test the channel bed was levelled and the desired discharge was set up. The tailwater level was controlled with the help of a tailgate located at the downstream end of the channel. The average duration of the tests was around 4 h, according to the hydraulic conditions and the channel bed material. Such duration allowed the bed to reach the equilibrium scour condition. Note that some tests were conducted with longer duration (up to 6 h) and the differences between scour features at 4 and 6 h were found to be negligible.
In order to accurately estimate the parameters Δy and htw, extensive water depth measurements were taken in longitudinal sections located at regular intervals across the entire channel width using a point gauge with precision 0.1 mm. The flow intensity (U/Uc) ranged between 0.70 and 0.96, where U and Uc are the mean flow velocity and critical flow velocity, respectively. Uc was estimated following the methodology proposed by [38,39]. Therefore, all the tests were conducted under clear water condition. It is worth remarking that the threshold peak condition occurs for U/Uc ≈ 1, for which a maximization of the scour depth takes place [40,41]. After test completion, the water was slowly drained from the channel to keep the equilibrium morphology of the bed intact. Thereafter, the mobile bed was scanned with a “Leica Geosystems” laser scanner to obtain scour maps having a precision of ±1 mm. Both geometric characteristics of the structure (among others, hst) and significant points of scour morphology (among others, maximum scour depths and dune height) were also measured using a point gauge with 0.1 mm accuracy. These points were used to validate the readings of the laser scanner and the difference was always lower than 1 mm.
3. Analysis of Equilibrium Morphology
3.1. Dimensional Analysis
A dimensional analysis was carried out to identify the non-dimensional parameters governing the scour phenomena due to chevrons. According to [4,7,12,14,31,42,43,44,45] and for uniform bed materials, the depended variable (zm + htw) can be expressed as function of the following variables:
where zm is the maximum scour depth, i.e., it is equal to the maximum of zmu-1, zmu-2, zmu-3 and zmd. However, for present tests, zm is always equal to zmu-1, regardless of the number of structures (Table 1). Note that, as suggested by several researchers [9,12,13,14,43], it is more appropriate to consider Δρ instead of ρs (where Δρ = ρs − ρ) when analysing the scour mechanism downstream of hydraulic structures. By taking Q, hst and ρ as repeating variables we obtained the following non-dimensional functional relationship:
By rearranging some of the non-dimensional groups, Equation (2) can be rewritten as:
where Fdeq is defined as the equivalent densimetric Froude number and is equal to:
Note that Fdeq incorporates the effects of structure geometry, granulometric characteristics of the bed sediment and discharge. Notably, a similar parameter was derived by [8] to analyse the scour phenomena due to different hydraulic structures. In the present study the range of variability of the different non-dimensional parameters are as follows: 2 ≤ Fdeq ≤ 5, 5.26 ≤ B/hst ≤ 8.92, lst/B = 0.7, 0.33 ≤ pc/B ≤ 0.5, 0.2 ≤ sc/B ≤ 0.6, 1 ≤ n ≤ 3, Δρ/ρ = 1.467 and d50/B = 0.002.
3.2. Scour Features
The knowledge of the various scour morphology types due to chevrons is essential for proper design of the structure and to determine sites for dredge disposal and fish refuge. For single, isolated chevrons two different types of scour morphology were identified, i.e., Types A and B. Figure 4a,b show Type A for chevron at pc/B = 0.5 and 0.33, respectively. This morphology type results in an elongated scour around the chevron which extends downstream on either side of the two structure legs. An elongated dune is formed downstream of the structure along its central axis and is partially confined by the scour on both sides. For both transversal structure positions, Type A is similar, and the scour generally reaches the channel banks. Notably, for pc/B = 0.33 the scour region near the far bank is shallower.
Figure 4c,d show Type B for pc/B = 0.5 and 0.33, respectively. A significant modification of the bed morphology is observed in this case. Two distinct scour zones are formed in Type B in the vicinity of the chevron structure and in the downstream stilling basin after the structure along its central axis. Compared to Type A, the scour hole in the structure vicinity is less elongated and confined in the downstream direction by two prominent dune formations in correspondence with the two structure legs. These dunes extend downstream and partially limit the scour in the downstream stilling basin. As before in case of morphology Type B and for pc/B = 0.33, the scour in the far bank vicinity is shallower.
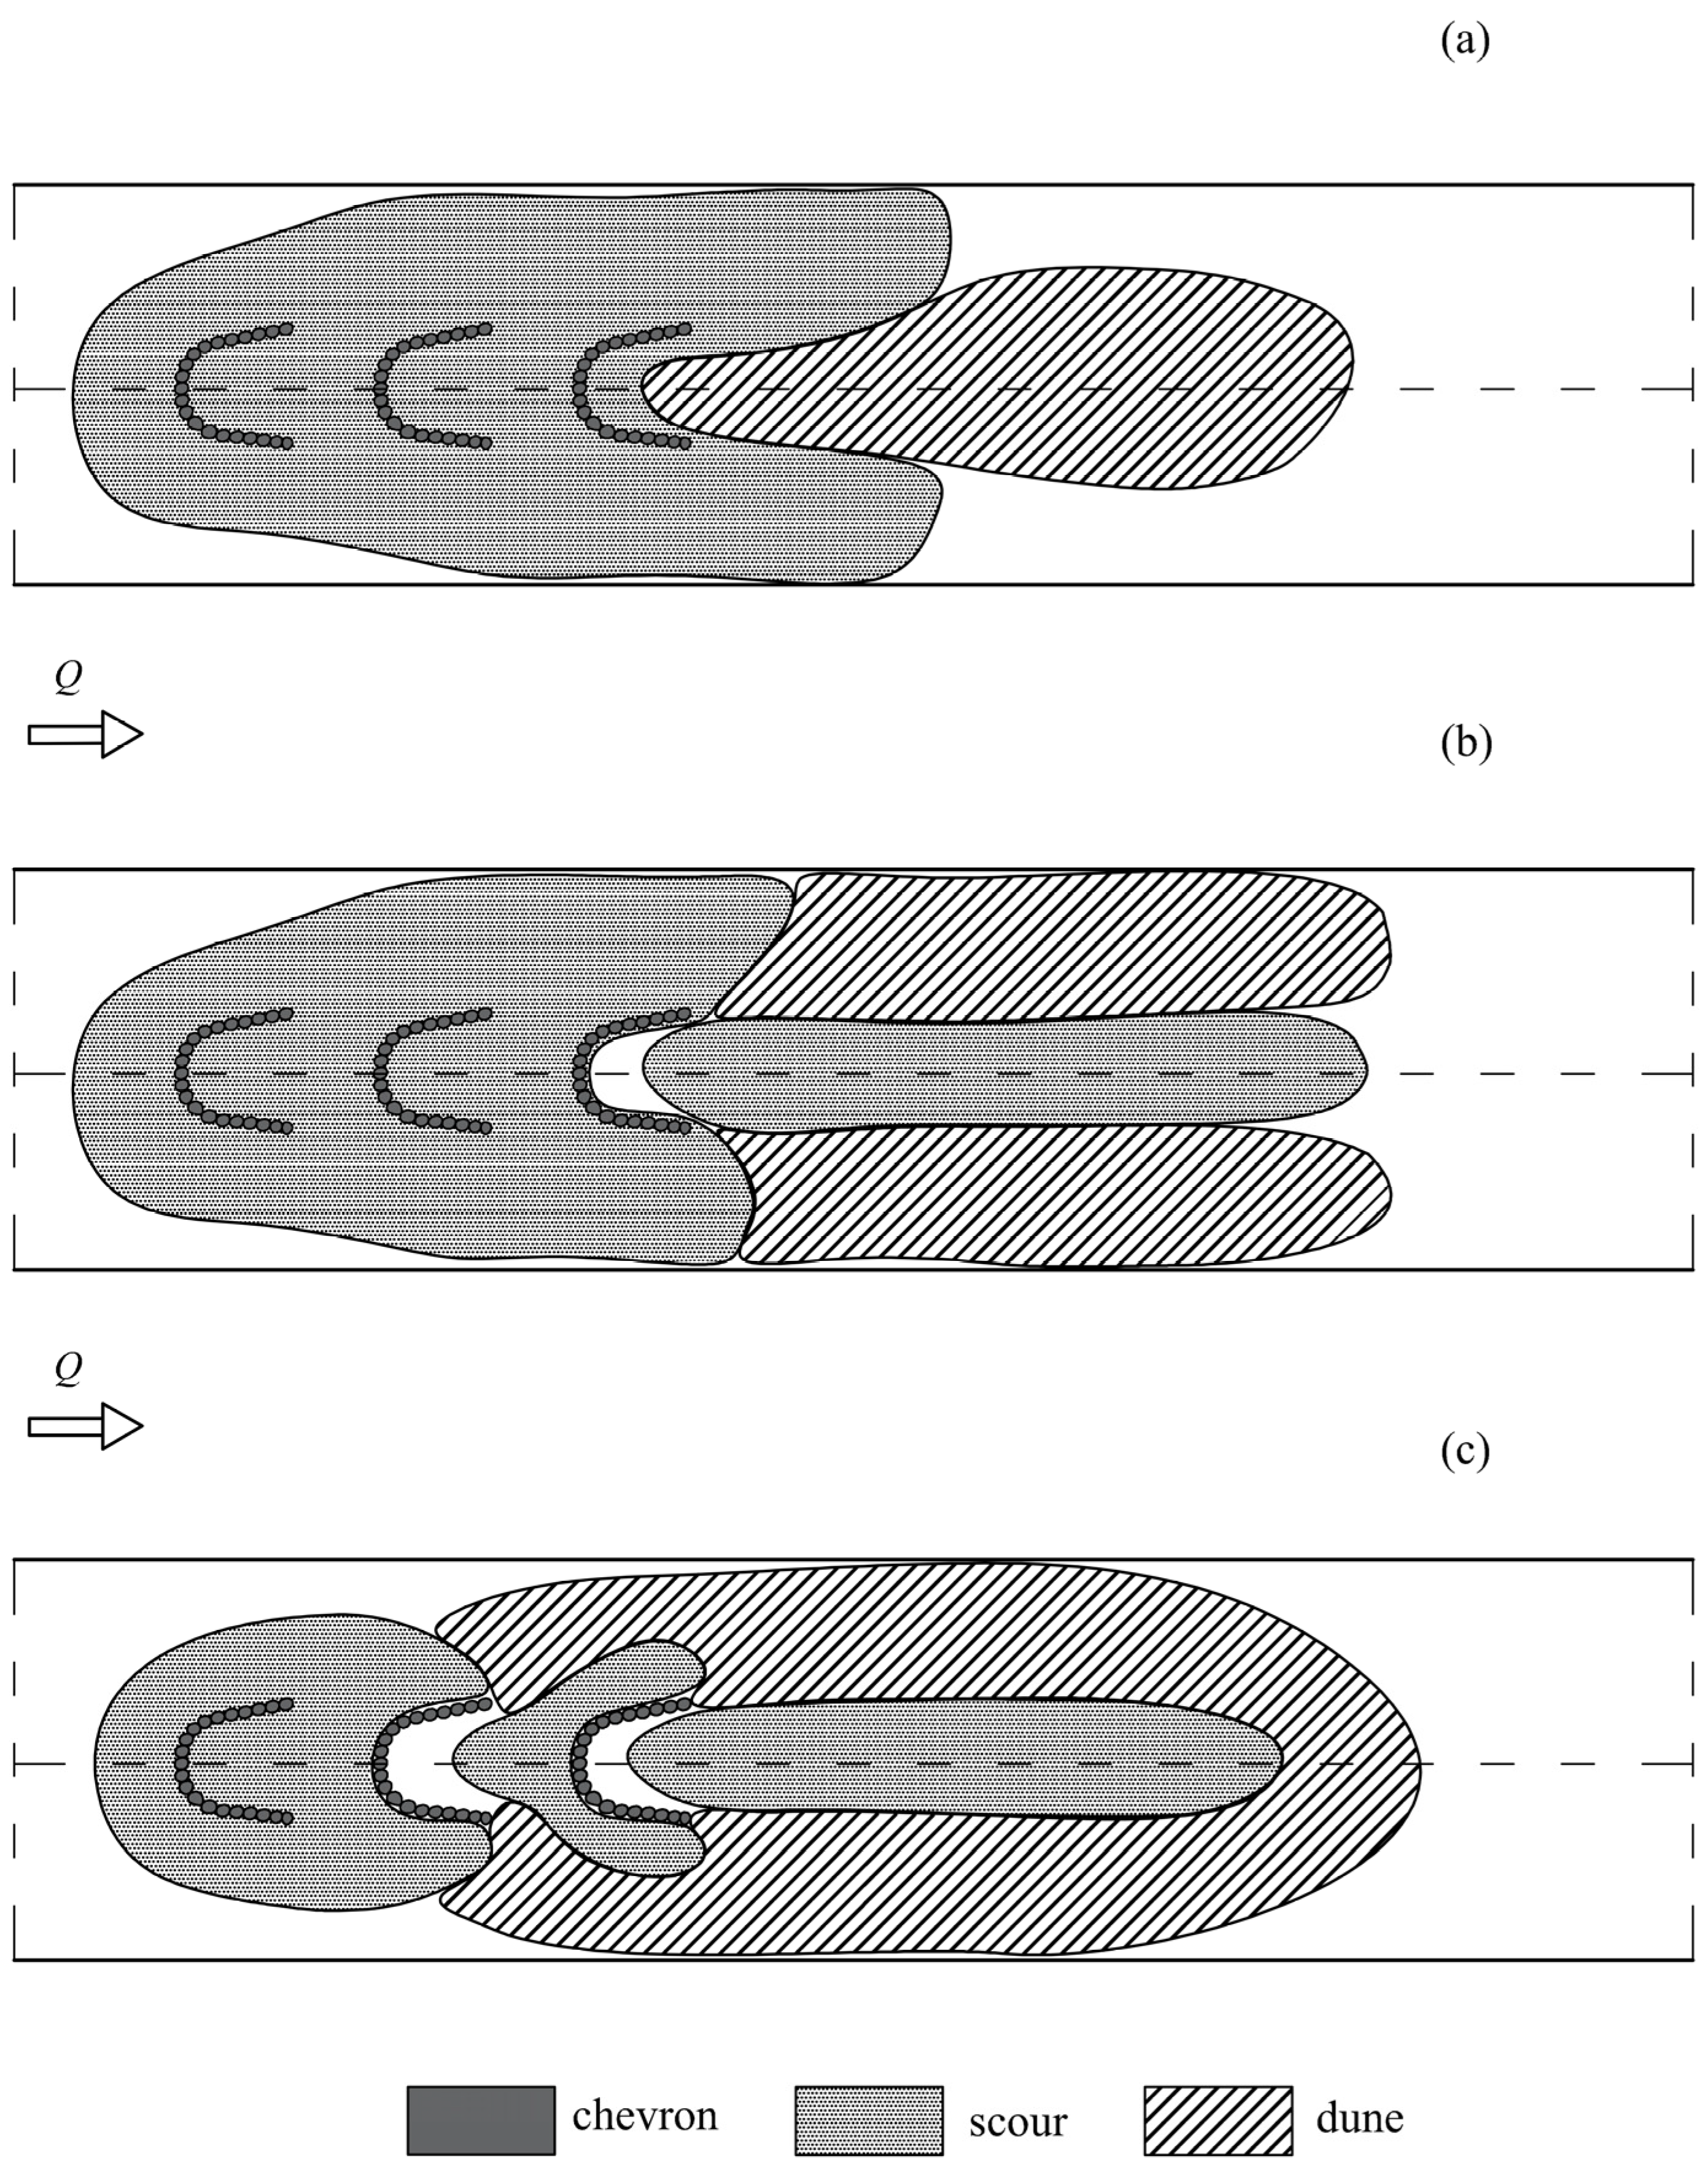
Following this, scour morphology for multiple chevron structures in series arrangement was analysed as well. Figure 5 shows the major scour morphology types for pc/B = 0.5 with three structures (n = 3). The corresponding morphology types for n = 2 are similar. Moreover, from the analysis of the single structure, it can be inferred that the transversal structure position has limited effect on the resulting morphology types which is corroborated by the findings in the case of multiple structures. Figure 5a shows Type A in the case of multiple structures defined by an elongated scour around the chevron structure arrangement which extends downstream of the last chevron in the series, similarly to the case of the single structure. A single dune is formed after the structure along its central axis, confined by scour formations on both sides. Figure 5b shows the morphology Type B in the case of multiple structures. This type is characterised by a scour in the structure vicinity and another scour formation in the downstream stilling basin, along the central axis of the structure. Like the case of the single structure, deposition regions are formed beyond the last chevron in the series in correspondence with its two legs. They usually extend downstream and partially confine the scour in the stilling basin after the structure arrangement. Notably, in the case of multiple structures, there is another type of scour morphology denoted as Type C (Figure 5c). In this morphology type, the dune regions are significantly larger in comparison to that of Type B and they completely confine the scour region in the downstream stilling basin. Moreover, they also migrate in the upstream direction, dividing the scour region in the structure vicinity into two parts.
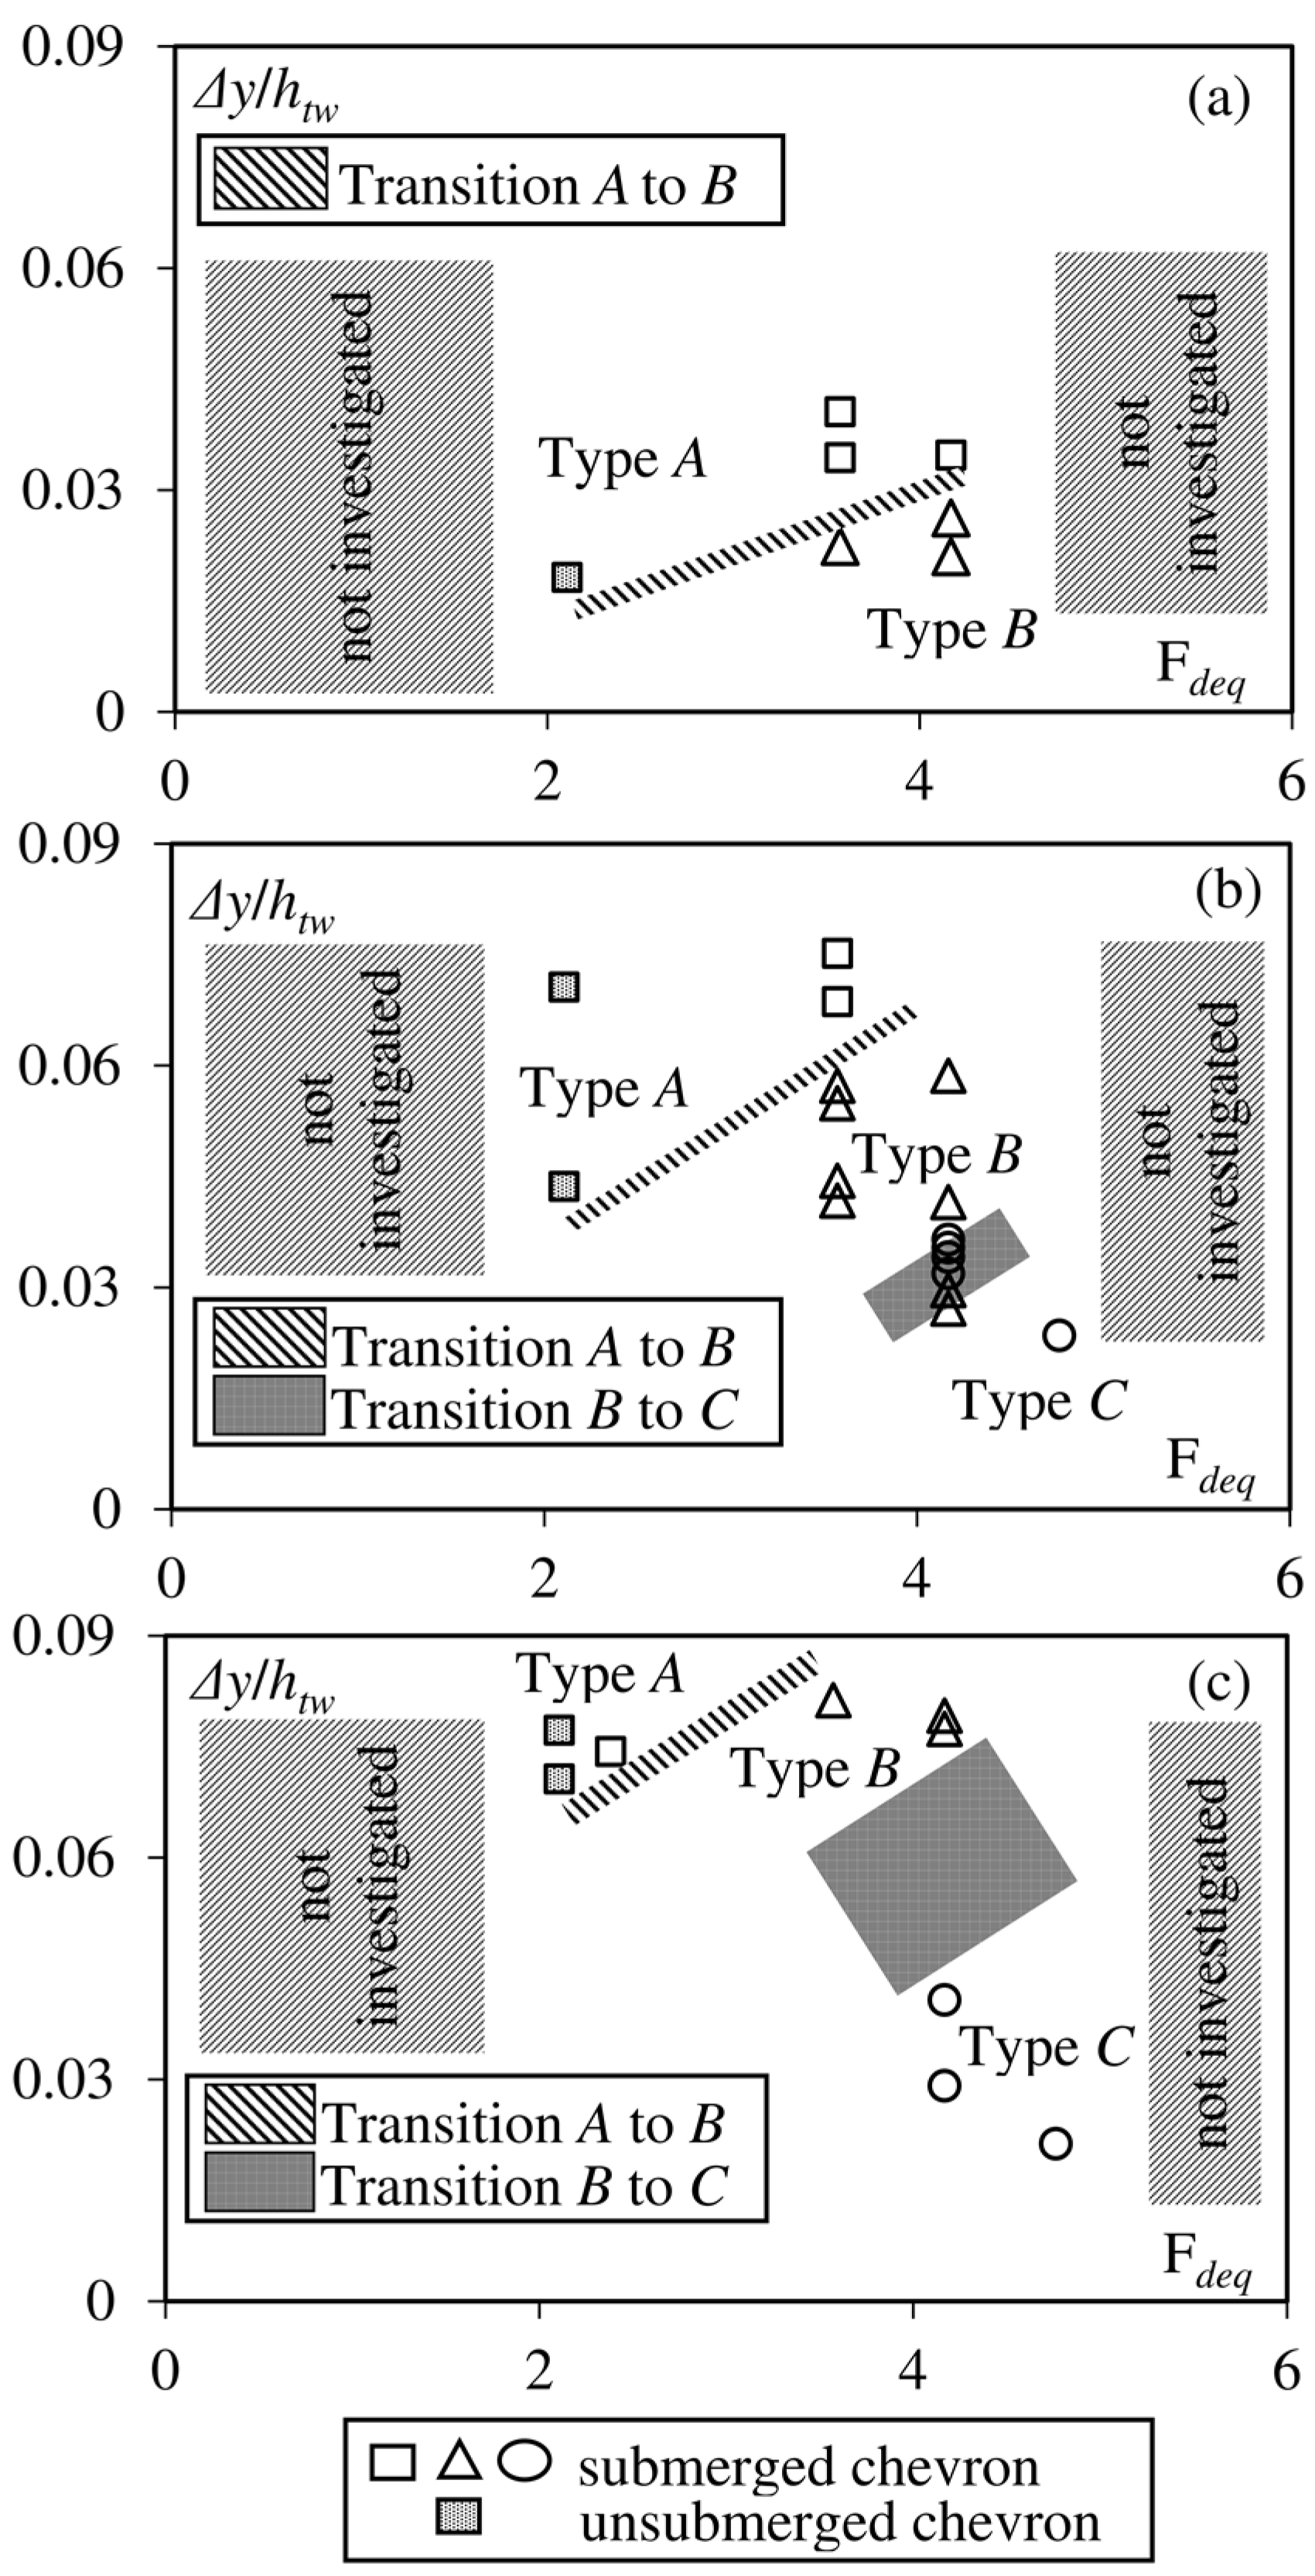
It was shown by [29,31] that Fdeq and Δy are important variables which can be used to determine the fields of existence of different morphology types in the presence of low-head structures. This finding was corroborated by the present study. Namely, we observed that Δy/htw is a crucial parameter affecting the transition between different morphology types. This parameter expresses the relative drop in the water surface level across the structure arrangement. In addition, the number of structures (n) in the chevron series arrangement has considerable influence on the scour morphology types. Therefore, different morphology types were distinguished and reported in graphs Δy/htw(Fdeq), as shown in Figure 6a–c for n = 1, 2 and 3, respectively. In Figure 6, data points for chevrons in unsubmerged condition are represented by shaded rectangles and in all those cases the resulting scour morphology was Type A. Notably, morphology Type C does not occur for a single, isolated chevron, as discussed earlier. Generally, keeping Fdeq constant, Type A occurs for higher Δy/htw values. By decreasing this ratio, a transition from Type A to B and finally to C can be obtained. This occurrence can be explained considering that high values of Δy correspond to a reduction of the diffusion length, resulting in extended scour formations on both sides of the chevron and, therefore, in scour morphology Type A. In this case the scour pushes the dune from either direction thereby eventually restricting it to the central axis of the structure arrangement in the downstream stilling basin. This phenomenon evidences that the scour magnitude decreases with htw and jet diffusion length [13,14]. For lower values of the ratio Δy/htw, the development of scour in the longitudinal direction on either side of the chevron is limited by the formation of strong dunes in correspondence with the two legs of the structure (Type B). Moreover, a shallow scour region forms after the chevron along its central axis and remains partially confined by the dunes. A further decrease of the parameter Δy/htw leads to a more pronounced dune, surrounding the scour hole in the downstream stilling basin (Type C). The dune regions also move upstream and divide the scour in the structure vicinity into two parts. In general, the transition between different types occurs at higher Δy/htw if Fdeq increases.
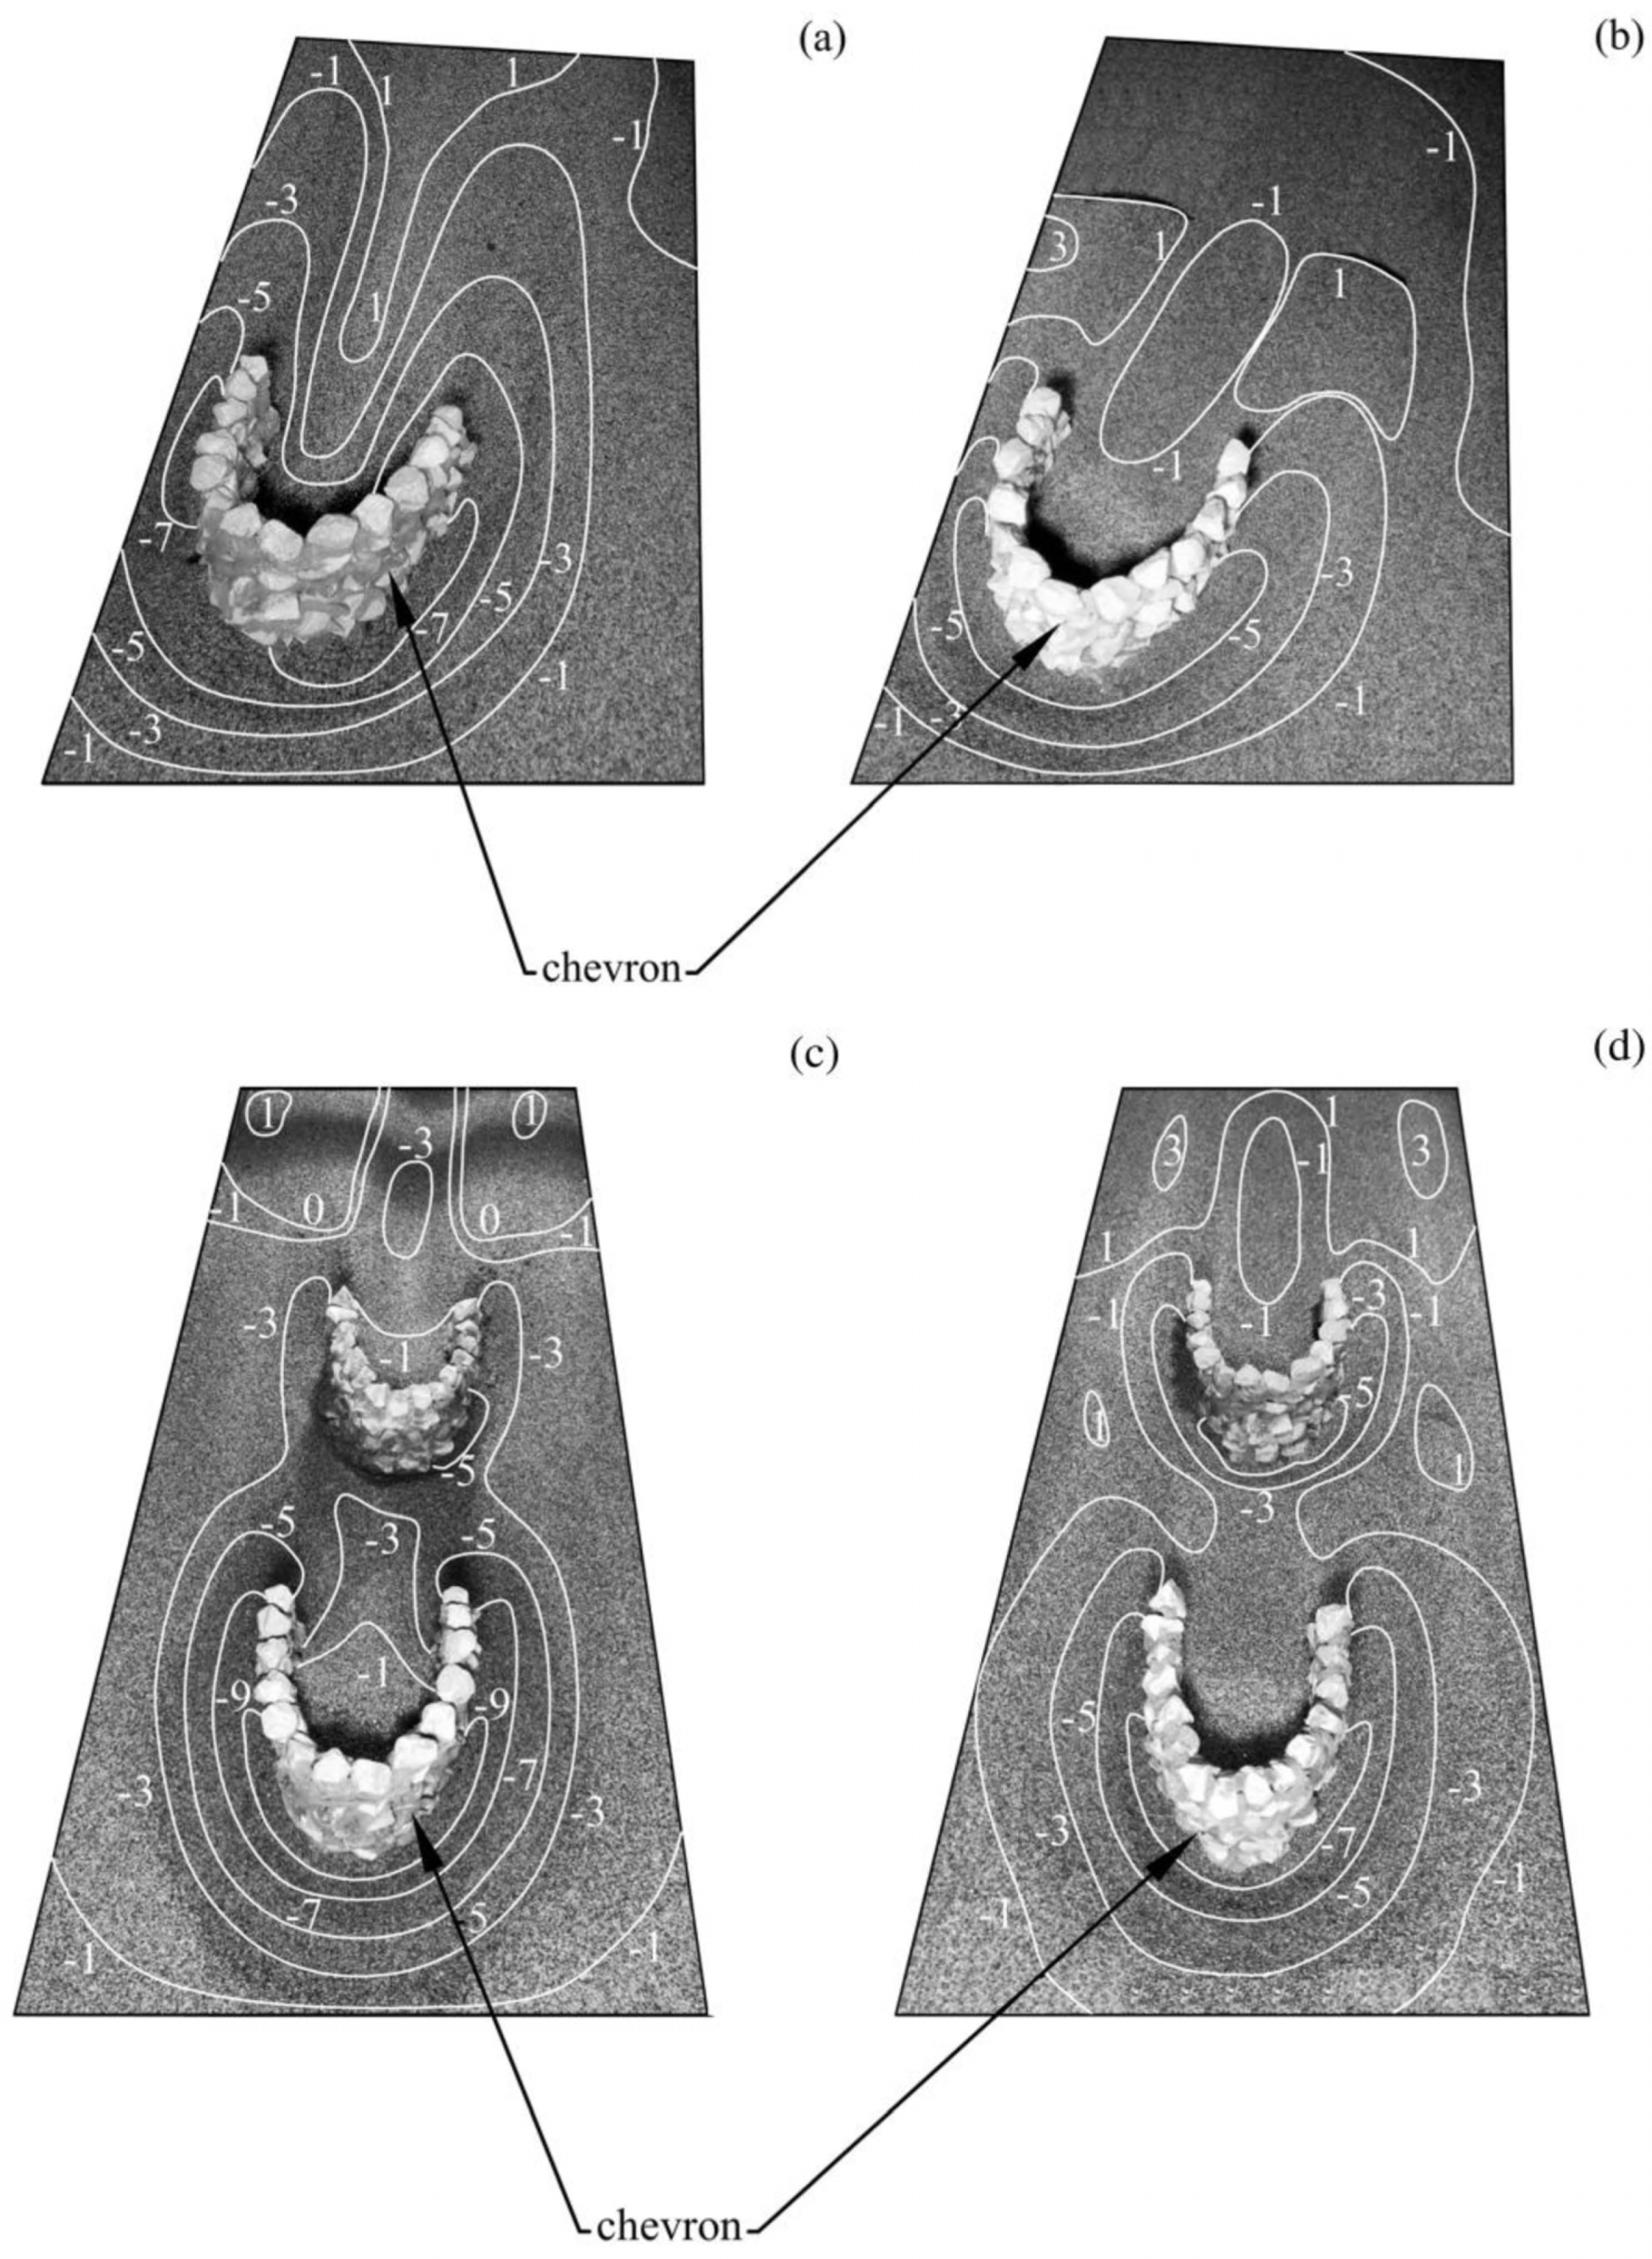
Prospective views of stilling basin scour morphologies pertaining to four tests are shown in Figure 7. Namely, Figure 7a,b present the scour maps for a single chevron (n = 1) with identical structure configuration, transversal position, Fdeq (Q = 0.014 m3/s, hst = 0.056 m, pc/B = 0.33 and Fdeq = 4.16) and Δy/htw = 0.034 (test 3) and 0.020 (test 4), respectively. In the case of the former, the ensuing scour morphology type is A, whereas in the latter case the morphology is characterised by Type B due to lower value of Δy/htw. Another set of examples is presented in Figure 7c,d showing scour maps due to identical structure arrangement, position, Fdeq (Q = 0.014 m3/s, n = 2, hst = 0.056 m, sc/B = 0.4, pc/B = 0.5 and Fdeq = 4.16) and Δy/htw = 0.058 (test 9) and 0.036 (test 10), respectively. In this case, the former map is characterised by Type B whereas the latter by Type C, thus corroborating the existence fields shown in Figure 6. To facilitate navigability in straight rivers, Type A is preferable as it creates elongated deep scour regions on both sides of the chevron which can be used as corridors for boats. Conversely, to promote biodiversity in the channel, morphology Types B and C appear to be more appropriate. In these types, slow-moving deep-water scour regions are created in the downstream stilling basin, serving as a fish nursery, whereas the dunes can be used by fishes for spawning. In other cases, the downstream scour region can be used as an in-stream dredge disposal site.
4. Results and Discussion
4.1. Maximum Scour Depth
In Section 3.1 we showed that the parameter (zm + htw)/hst can be expressed as a function of several non-dimensional groups (Equation (3)). In addition, we clarified that, in the tested ranges of parameters, the maximum scour depth zm always occurred upstream of the first chevron in the case of a multiple structure arrangement. However, Equation (3) can be further simplified as in this study Δρ/ρ = 1.467, d50/B = 0.002 and lst/B = 0.7 have been kept constant. Furthermore, preliminary analyses allowed us to state that the parameter B/hst does not affect the maximum scour depth in the range (i.e., 5.26 ≤ B/hst ≤ 8.92). Therefore, Equation (3) becomes:
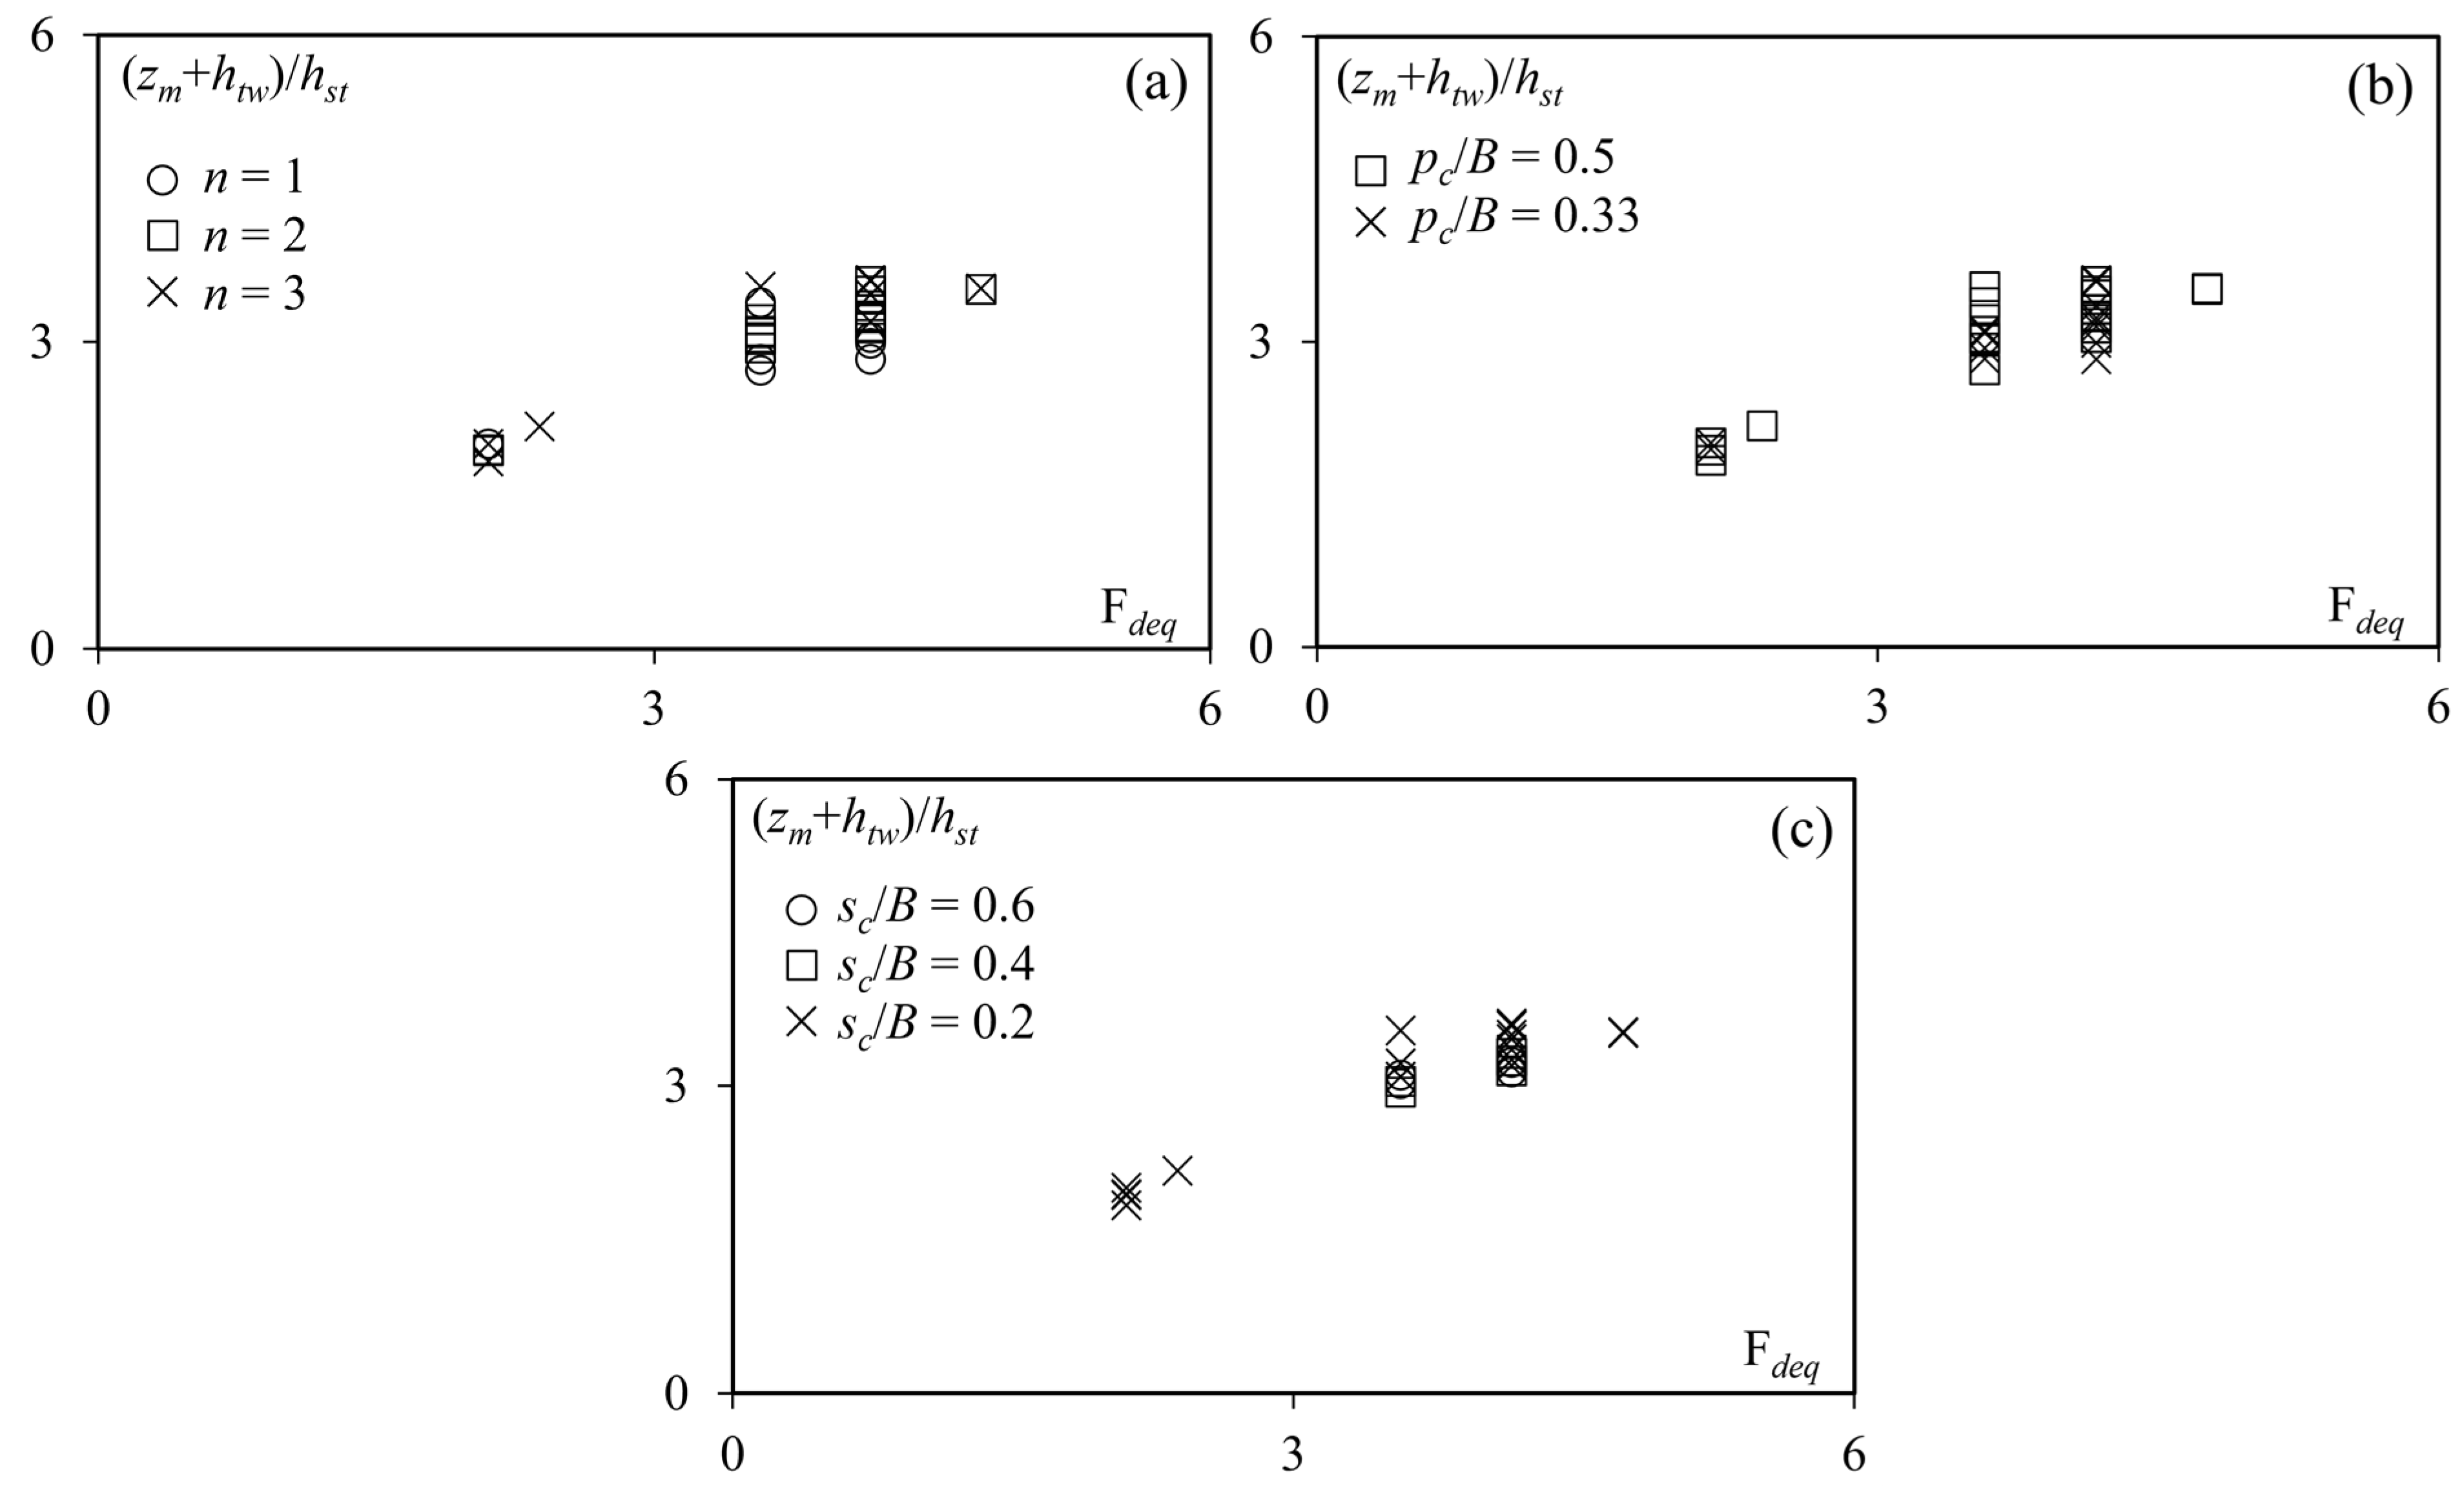
Two different transversal positions of the chevrons have been tested, i.e., pc/B = 0.5, 0.33, while three inter-chevron distances were investigated in the arrangements with multiple structures, i.e., sc/B = 0.6, 0.4, 0.2. Therefore, (zm + htw)/hst was plotted against the corresponding Fdeq values and data grouped according to the number of structures in the arrangement (n), the transversal position (pc/B) and the longitudinal distance (sc/B). Figure 8 shows that the effect of the parameters n, pc/B and sc/B on (zm + htw)/hst is very limited, allowing us to further simplify Equation (5):
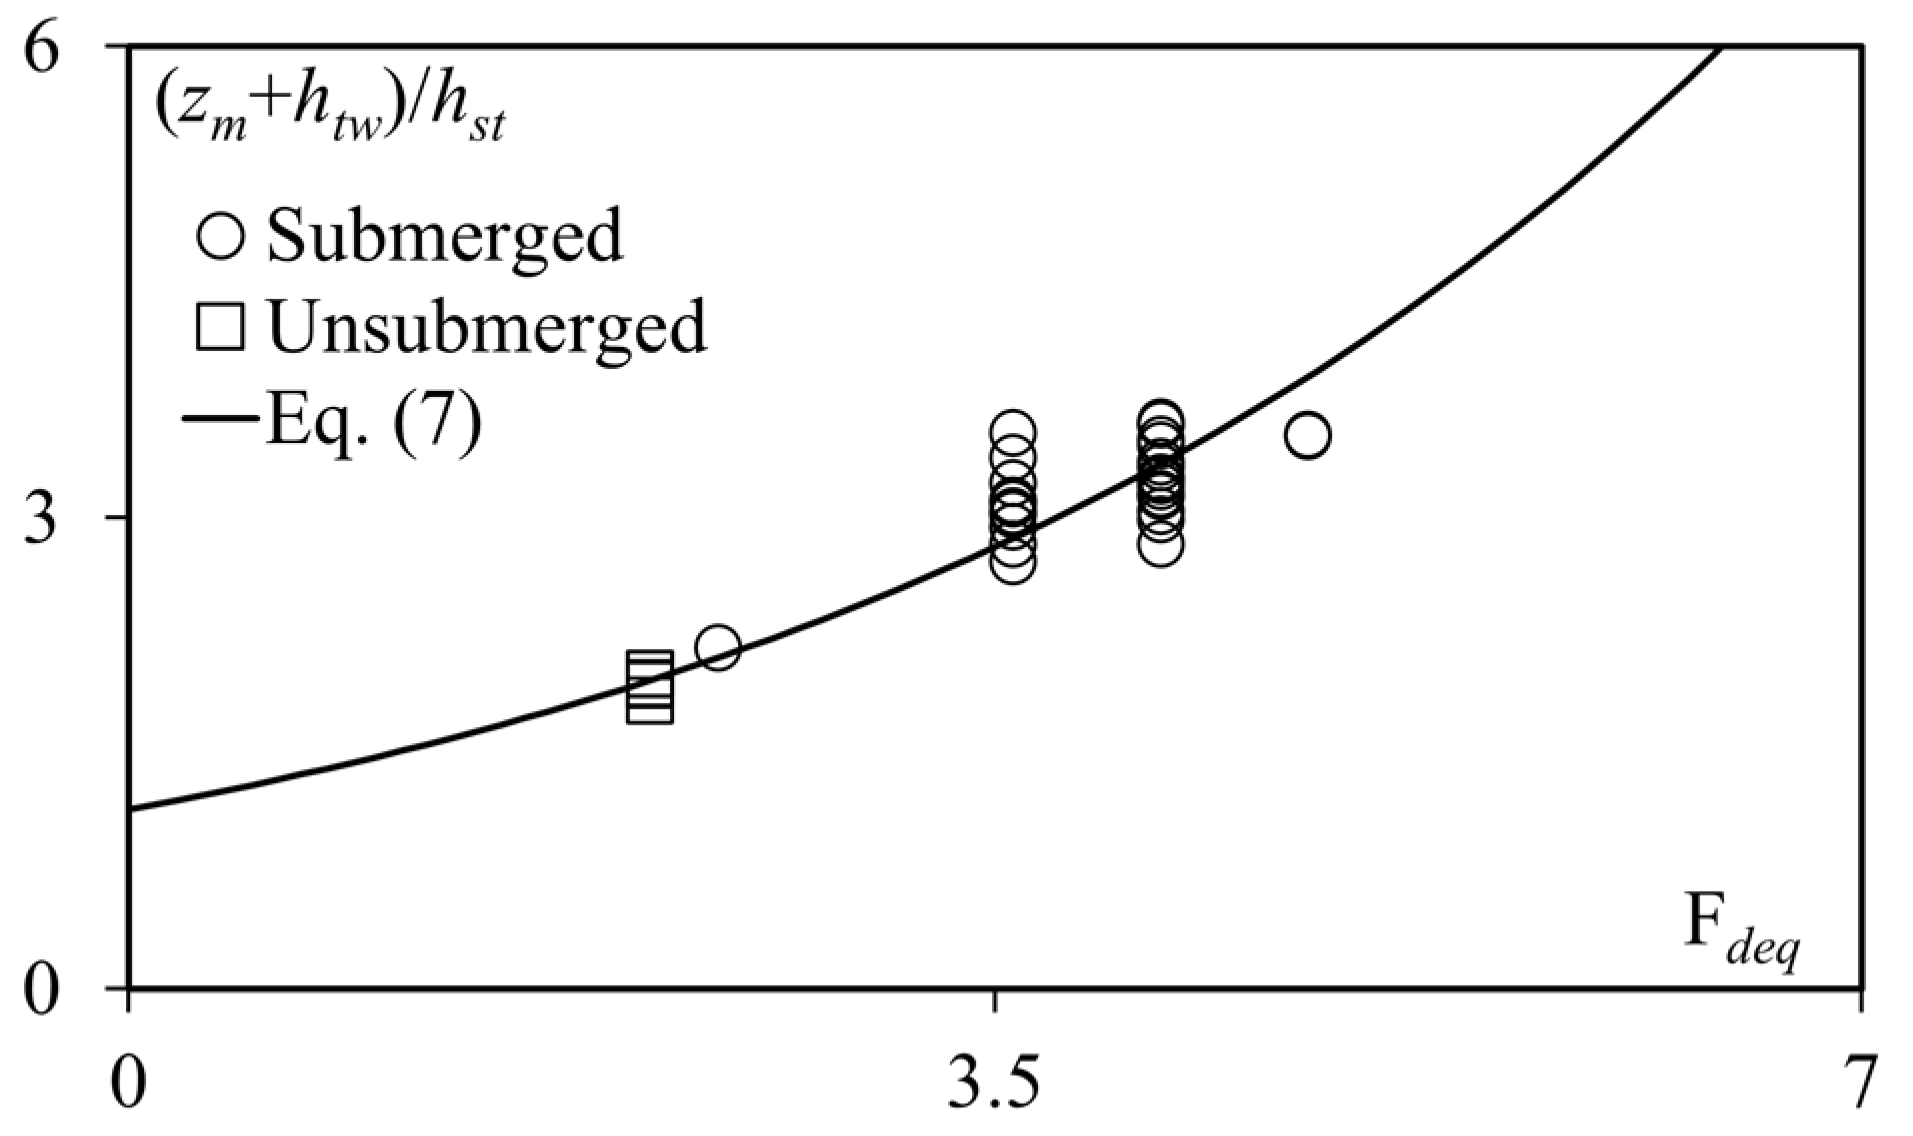
Therefore, for all the tested conditions, the experimental data can be interpolated by the following exponential function (R2 = 0.80):
which is valid in the following range of parameters: 2 ≤ Fdeq ≤ 5; 5.26 ≤ B/hst ≤ 8.92; lst/B = 0.7; 0.33 ≤ pc/B ≤ 0.5; 0.2 ≤ sc/B ≤ 0.6; 1 ≤ n ≤ 3. All data points are reported along with Equation (7) in Figure 9, showing a satisfactory agreement between predicted and measured values of the variable (zm + htw)/hst. Note that in Figure 9 data points are also distinguished according to the submergence condition of the structure. Namely, in this study we tested both submerged (hst < htw) and unsubmerged (hst > htw) chevrons. It was found that the submergence of the structure has a negligible influence on the dependent variable.
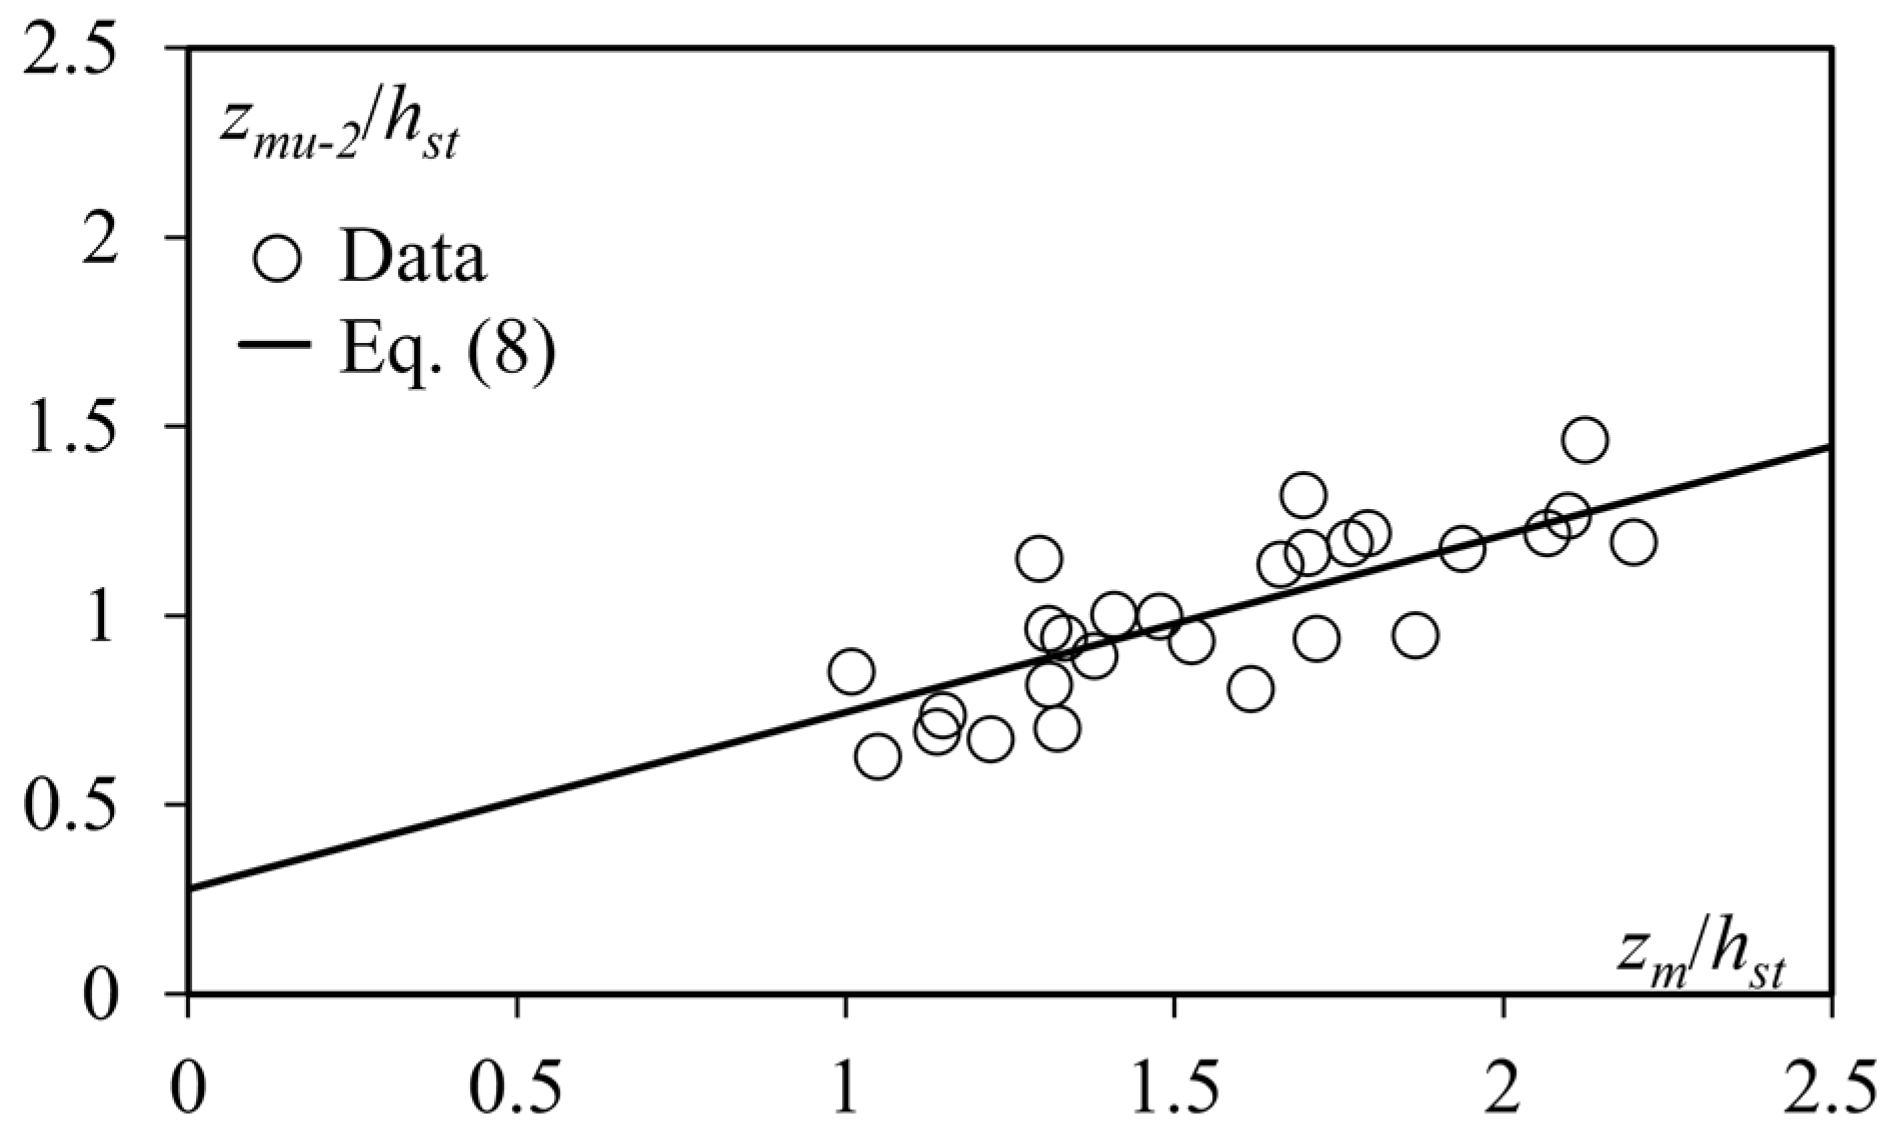
As mentioned above, Equation (7) provides an estimation of the maximum scour depth zm, that in our tests is always equal to zmu-1. However, we also analyzed the maximum scour depth occurring in the upstream vicinity of the second chevron zmu-2. To this end, we contrasted the non-dimensional scour depth zmu-2/hst against zm/hst for all the tested conditions (Figure 10). We found that the two scour depths are characterised by a significant correlation. Namely, zmu-2/hst is a monotonic increasing function of zm/hst and can be estimated using the following linear relationship (i.e., R2 = 0.65):
which is valid for the following range of parameters: 2 ≤ Fdeq ≤ 5; 5.26 ≤ B/hst ≤ 8.92; lst/B = 0.7; 0.33 ≤ pc/B ≤ 0.5; 0.2 ≤ sc/B ≤ 0.6; 1 ≤ n ≤ 3. This result is also in agreement with the findings of [7] and occurs in many other scour problems involving structures in series.
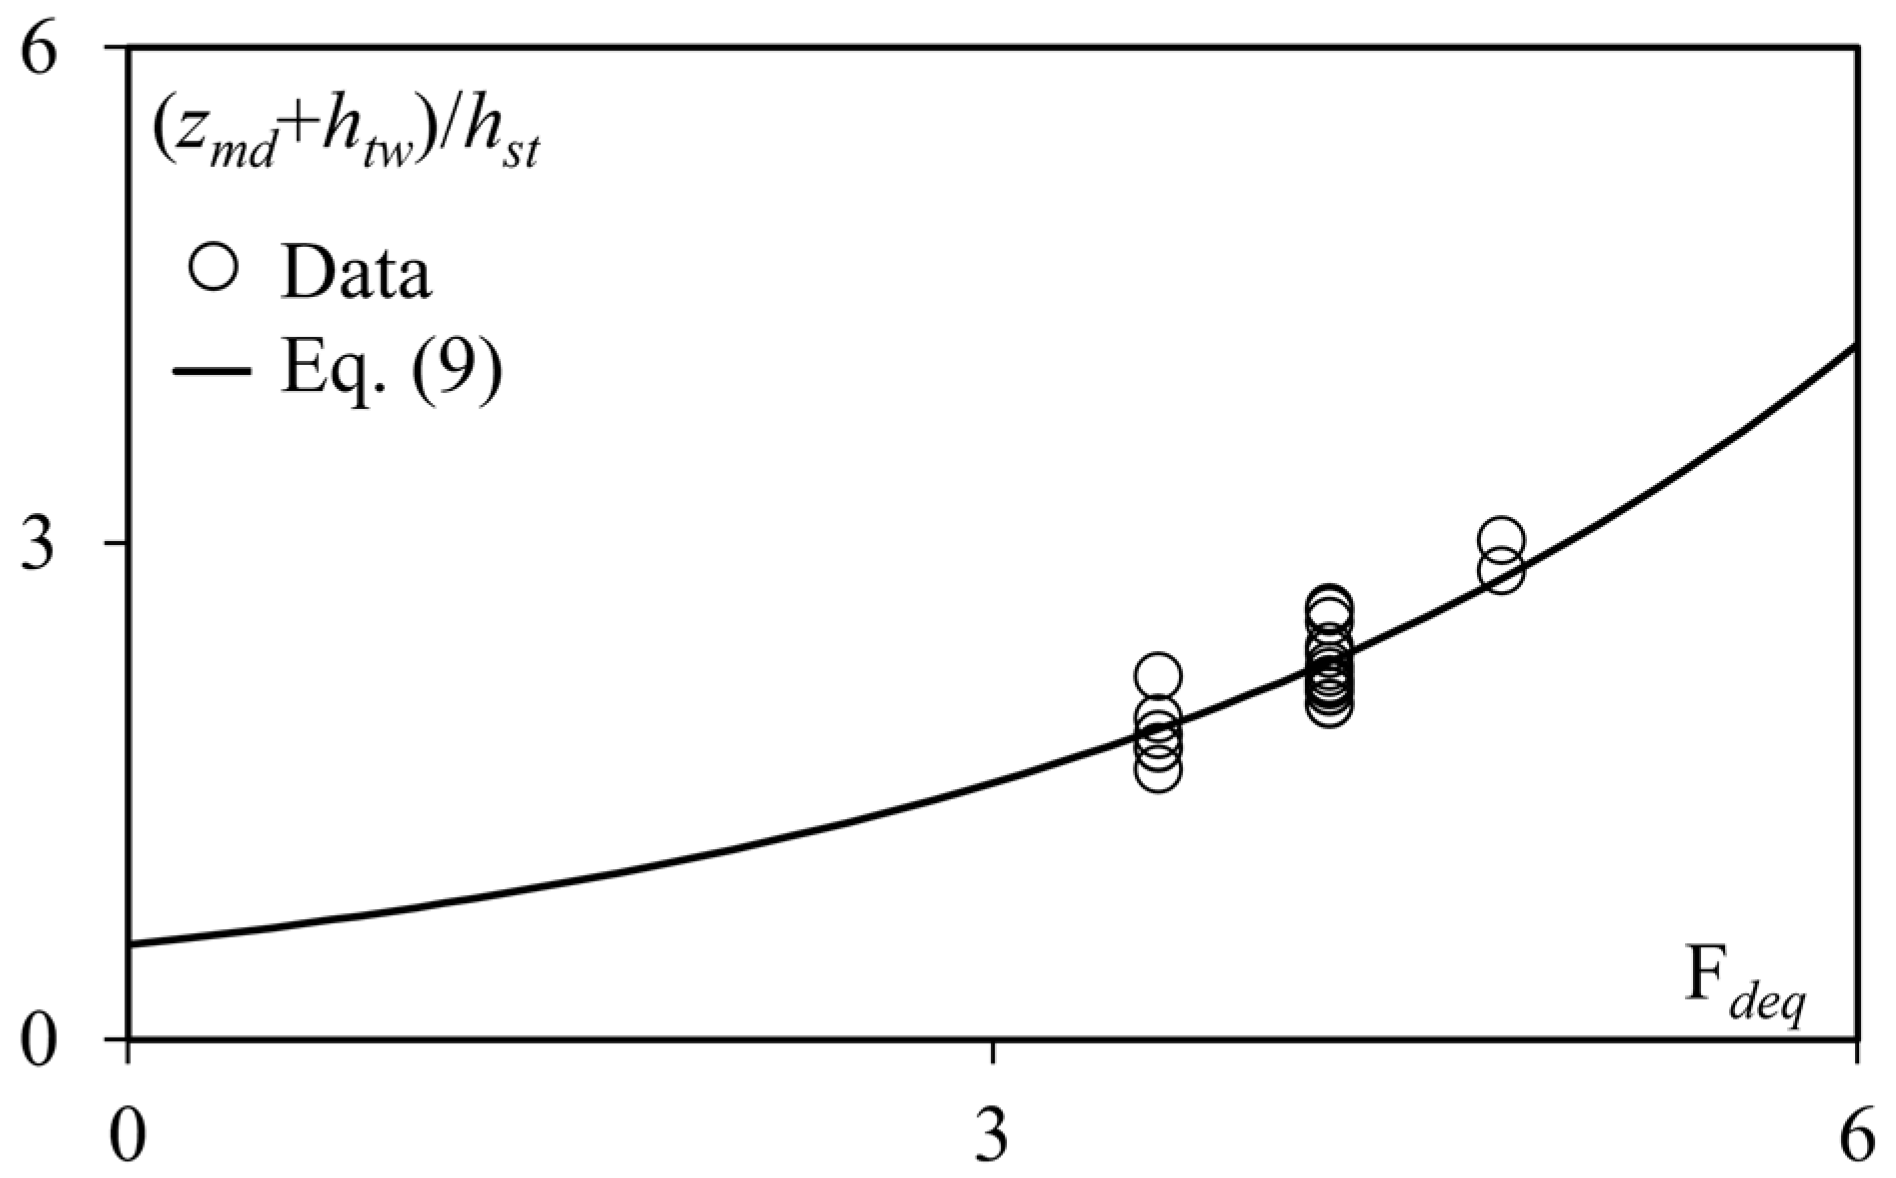
Moreover, the knowledge of the maximum scour depth occurring in the downstream stilling basin (zmd) is also of fundamental importance, as the downstream scour hole can serve as a resting pool for different kinds of fishes and aquatic species, thus enhancing river biodiversity. Therefore, experimental data of zmd were analyzed as well. Based on the dimensional analysis reported in Section 3.1 and considering that the simplifications made for the functional relationships Equations (3) and (5) also apply for (zmd + htw)/hst, the following empirical equation was obtained (R2 = 0.70):
Equation (9) is valid in the following range of parameters: 3.5 ≤ Fdeq ≤ 5; B/hst = 8.92; lst/B = 0.7; 0.33 ≤ pc/B ≤ 0.5; 0.2 ≤ sc/B ≤ 0.6; 1 ≤ n ≤ 3. Figure 11 shows that the dependent variable (zmd + htw)/hst can be satisfactorily estimated by Equation (9).
4.2. Characteristic Scour Length
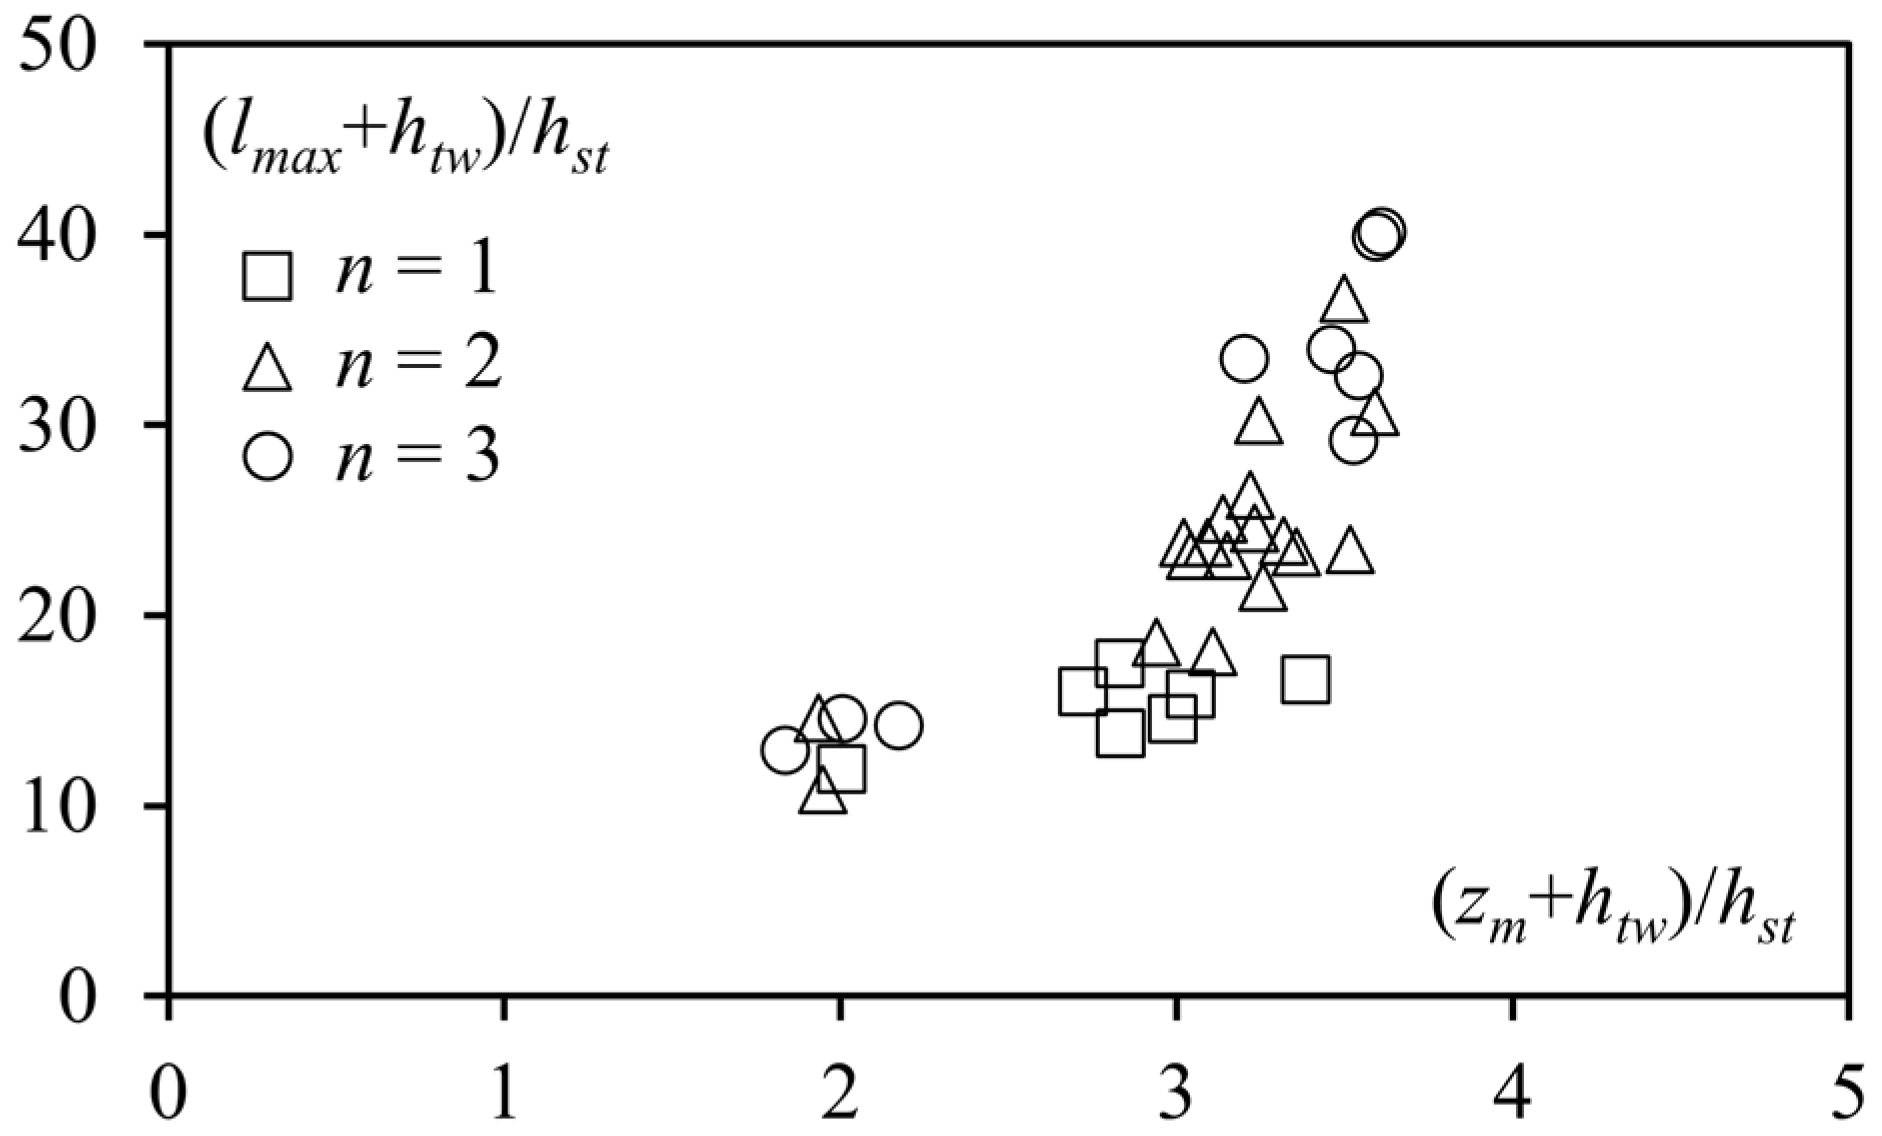
Another important scour feature is represented by the maximum axial scour length lmax. It is worth recalling that lmax refers to the entire scour region including scour formations in structure vicinity and in the downstream stilling basin (Figure 2a). In addition, if the scour hole does not occur axially in the downstream stilling basin (e.g., in morphology Type A), lmax can be assumed to be equal to lmu, which is measured in the longitudinal section running along the edges of the chevrons in series arrangement. According to [7], the maximum scour length can be expressed as a function of the maximum scour depth. Therefore, we contrasted the parameter (lmax + htw)/hst against the parameter (zm + htw)/hst. Figure 12 shows the aforementioned comparison, highlighting a slight dependence of (lmax + htw)/hst on n. Namely, it was found that (lmax + htw)/hst slightly increases with n, (zm + htw)/hst being constant.
Based on these observations, the following empirical equation has been derived (R2 = 0.80):
which is valid in the following range of parameters: 2 ≤ Fdeq ≤ 5; 5.26 ≤ B/hst ≤ 8.92; lst/B = 0.7; 0.33 ≤ pc/B ≤ 0.5; 0.2 ≤ sc/B ≤ 0.6; 1 ≤ n ≤ 3. In Figure 13a,b we show the data points pertaining to tests conducted with n = 1 and 3, along with the plot of Equation (10). Overall, we obtained a satisfactory agreement between measured and estimated values of the variable (lmax + htw)/hst.
4.3. Maximum Dune Height
Dune formations usually occur in the downstream stilling basin and they are located either centrally downstream of the structure or in correspondence with the ends of the structure legs. Dunes are also important since they act as sites of spawning for fishes. Therefore, based on the same dimensional considerations valid for the parameter (zm + htw)/hst and considering the simplifications adopted above and the findings of [6,7], we derived the following predicting equation (R2 = 0.80):
which is valid in the following ranges: 2 ≤ Fdeq ≤ 5; 5.26 ≤ B/hst ≤ 8.92; lst/B = 0.7; 0.33 ≤ pc/B ≤ 0.5; 0.2 ≤ sc/B ≤ 0.6; 1 ≤ n ≤ 3. Figure 14 shows that Equation (11) satisfactorily predicts the totality of data, regardless of the structure arrangements. Note that the deviation between measured and calculated data is consistent with most of the studies dealing with scour-related problems occurring in correspondence with other river restoration structures [6,7].
5. Conclusions
In this study, chevron structures were investigated in straight channels under several hydraulic conditions. Single, isolated chevrons as well as multiple structures located in series were tested. Experimental observations allowed us to distinguish three main types of equilibrium scour morphology, i.e., Types A, B and C. As concerns Type A, a distinct elongated scour region occurred around the chevrons resulting in the formation of deep waterways along the channel banks. Conversely, in types B and C, a secondary scour region, confined by dunes, formed in the downstream stilling basin. Based on such classification, it was found that the existence fields of different types mainly depend on the equivalent densimetric Froude number, the parameter Δy/htw and the number of structures n. Finally, useful empirical equations were derived to predict the maximum scour depth, the scour depth in the downstream stilling basin, the maximum dune height and the maximum scour length. Notably, all the tests were carried out under clear-water conditions. To the best of author’s knowledge, previous studies dealing with chevrons mainly focused on their environmental impact and highlighted the beneficial effect of these structures on aquatic habitat. However, they did not provide tools to predict scour features. Therefore, this study advances existing knowledge on the topic as, for the first time, design equations and morphological classifications are presented and validated under a large range of hydraulic conditions and for different structural configurations. These are unprecedented results that can be used to estimate the main geometric characteristics of the equilibrium morphology and allow hydraulic engineers to optimize the design of chevron structures. Further developments will include the investigation of other parameters potentially affecting the scour process, e.g., river curvature and other structure configurations.
Author Contributions
Conceptualization, M.P., D.R. and S.P.; methodology, M.P., D.R. and S.P.; validation, M.P., D.R. and S.P.; formal analysis, M.P., D.R. and S.P.; investigation, M.P., D.R. and S.P.; data curation, M.P., D.R. and S.P.; writing—original draft preparation, M.P., D.R. and S.P.; writing—review and editing, M.P., D.R. and S.P.; supervision, M.P. All authors have read and agreed to the published version of the manuscript.
Funding
This research received no external funding.
Institutional Review Board Statement
Not applicable.
Informed Consent Statement
Not applicable.
Data Availability Statement
All data used during the study appear in Table 1.
Acknowledgments
Authors would like to thank the technicians of the hydraulics laboratory of the University of Pisa, Nicola Bruni, Antonio Cecchi, Alessandro Michelotti, and Vincenzo Pennabea for their help in building the experimental apparatus.
Conflicts of Interest
The authors declare no conflict of interest.
References
- Gillilan, S.; Boyd, K.; Hoitsma, T.; Kauffman, M. Challenges in developing and implementing ecological standards for geomorphic river restoration projects: A practitioner’s response to Palmer et al. (2005). J. Appl. Ecol. 2005, 42, 223–227. [Google Scholar] [CrossRef]
- Rosgen, D.L. The cross-vane, W-weir and J-hook vane structures: Their description, design and application for stream stabilization and river restoration. In Proceedings of the Wetland Engineering and River Restoration Conference (CD-ROM), Reno, NV, USA, 27–31 August 2001; American Society of Civil Engineers: Reston, VA, USA, 2001. [Google Scholar]
- Veronese, A. Erosioni di fondo a valle di uno scarico [Scour downstream of a waterfall]. Ann. Lav. Pubbl. 1937, 75, 717–726. [Google Scholar]
- Bormann, N.E.; Julien, P.Y. Scour downstream of grade-control structures. J. Hydraul. Eng. 1991, 117, 579–594. [Google Scholar] [CrossRef] [Green Version]
- Mason, P.J.; Arumugam, K. Free jet scour below dams and flip buckets. J. Hydraul. Eng. 1985, 111, 220–235. [Google Scholar] [CrossRef]
- Breusers, H.N.C.; Raudkivi, A.J. Scouring: Hydraulic Structures Design Manual Series; Balkema: Leiden, The Netherlands, 1991. [Google Scholar]
- Hoffmans, G.J.C.M.; Verheij, H.J. Scour Manual; Balkema: Leiden, The Netherlands, 1997. [Google Scholar]
- D’Agostino, V.; Ferro, V. Scour on alluvial bed downstream of grade-control structures. J. Hydraul. Eng. 2004, 130, 1–14. [Google Scholar] [CrossRef]
- Dey, S.; Raikar, R.V. Scour in long contractions. J. Hydraul. Eng. 2005, 131, 1036–1049. [Google Scholar] [CrossRef]
- Dey, S.; Sarkar, A. Scour downstream of an apron due to submerged horizontal jets. J. Hydraul. Eng. 2006, 132, 246–257. [Google Scholar] [CrossRef]
- Dey, S.; Sarkar, A. Characteristics of submerged jets in evolving scour hole downstream of an apron. J. Eng. Mech. 2008, 134, 927–936. [Google Scholar] [CrossRef]
- Hoffmans, G.J.C.M. Jet scour in equilibrium phase. J. Hydraul. Eng. 1998, 124, 430–437. [Google Scholar] [CrossRef]
- Bombardelli, F.A.; Palermo, M.; Pagliara, S. Temporal evolution of jet induced scour depth in cohesionless granular beds and the phenomenological theory of turbulence. Phys. Fluids 2018, 30, 1–19. [Google Scholar] [CrossRef]
- Palermo, M.; Pagliara, S.; Bombardelli, F.A. Theoretical approach for shear-stress estimation at 2D equilibrium scour holes in granular material due to subvertical plunging jets. J. Hydraul. Eng. 2020, 146, 1–12. [Google Scholar] [CrossRef]
- Pagliara, S.; Palermo, M. Effect of pressure fluctuations and flow confinement on shear stress in jet-driven scour processes. Water 2020, 12, 718. [Google Scholar] [CrossRef] [Green Version]
- Odgaard, A.J.; Spoljaric, A. Sediment control by submerged vanes. J. Hydraul. Eng. 1986, 112, 1164–1181. [Google Scholar] [CrossRef]
- Odgaard, A.J.; Mosconi, C.E. Stream bank protection by submerged vanes. J. Hydraul. Eng. 1987, 113, 520–536. [Google Scholar] [CrossRef]
- Odgaard, A.J.; Wang, Y. Sediment management with submerged vanes. II: Applications. J. Hydraul. Eng. 1991, 117, 284–302. [Google Scholar] [CrossRef]
- Ben Meftah, M.; Mossa, M. Scour holes downstream of bed sills in low-gradient channels. J. Hydraul. Res. 2006, 44, 497–509. [Google Scholar] [CrossRef]
- Bhuiyan, F.; Hey, R.D.; Wormleaton, P.R. Hydraulic evaluation of W-weir for river restoration. J. Hydraul. Eng. 2007, 133, 596–609. [Google Scholar] [CrossRef]
- Scurlock, S.M.; Cox, A.L.; Thornton, C.I.; Baird, D.C. Maximum velocity effects from vane-dike installations in channel bends. In Proceedings of the World Environmental and Water Resources Congress, Albuquerque, NM, USA, 20–24 May 2012. [Google Scholar] [CrossRef]
- Scurlock, S.M.; Thornton, C.I.; Abt, S.R. Equilibrium scour downstream of three-dimensional grade-control structures. J. Hydraul. Eng. 2012, 138, 167–176. [Google Scholar] [CrossRef]
- Pagliara, S.; Palermo, M. Influence of tailwater depth and pile position on scour downstream of block ramps. J. Irrig. Drain. Eng. 2010, 136, 120–130. [Google Scholar] [CrossRef]
- Pagliara, S.; Palermo, M.; Das, R. Eco-friendly countermeasures for enlarged basins erosion. River. Res. Appl. 2016, 32, 441–451. [Google Scholar] [CrossRef]
- Pagliara, S.; Palermo, M.; Roy, D. Experimental investigation of erosion processes downstream of block ramps in mild curved channels. Environ. Fluid Mech. 2020, 20, 339–356. [Google Scholar] [CrossRef]
- Palermo, M.; Roy, D.; Pagliara, S. Morphological characteristics of eco-friendly protected basins downstream of block ramps in river bends. Geomorphology 2021, 377, 107587. [Google Scholar] [CrossRef]
- Zhao, C. Free surface flow over two-dimensional dunes under different flow regimes. In Proceedings of the 6th International Conference on Advances in Energy Resources and Environment Engineering, Chongqing, China, 20–22 November 2020. [Google Scholar] [CrossRef]
- Pagliara, S.; Hassanabadi, L.S.; Kurdistani, S.M. Log-vane scour in clear water condition. River Res. Appl. 2014, 31, 1176–1182. [Google Scholar] [CrossRef]
- Pagliara, S.; Hassanabadi, L.; Kurdistani, S.M. Clear water scour downstream of log deflectors in horizontal channels. J. Irrig. Drain. Eng. 2015, 141, 1–8. [Google Scholar] [CrossRef]
- Pagliara, S.; Kurdistani, S.M. Flume experiments on scour downstream of wood stream restoration structures. Geomorphology 2016, 279, 141–149. [Google Scholar] [CrossRef]
- Pagliara, S.; Palermo, M.; Roy, D. Scour around double-winged log frames under clear water condition. J. Irrig. Drain. Eng. 2020, 146, 1–11. [Google Scholar] [CrossRef]
- Vimpere, L.; Kindler, P.; Castelltort, S. Chevrons: Origin and relevance for the reconstruction of past wind regimes. Earth-Sci. Rev. 2019, 193, 317–332. [Google Scholar] [CrossRef]
- Davinroy, D.R.; Redington, L.S.; Stauser, N.C. Design of blunt-nosed chevrons in the Mississippi River for sediment management. In Proceedings of the 6th FISC, Las Vegas, NV, USA, 10–14 March 1996. [Google Scholar]
- Remo, J.W.F.; Khanal, A.; Pinter, N. Assessment of chevron dikes for the enhancement of physical-aquatic habitat within the Middle Mississippi River, USA. J. Hydrol. 2013, 501, 146–162. [Google Scholar] [CrossRef]
- Singh, P.; Sharma, N. Investigation of impacts of chevron as a river training measure on river hydraulics. In Proceedings of the International Conference on Agricultural, Environmental and Biological Sciences (AEBS-2014), Phuket, Thailand, 24–25 April 2014. [Google Scholar]
- ASCE. Inland Navigation: Channel Training Works; Manual of practice (MOP) 124; ASCE: Reston, VA, USA, 2011. [Google Scholar]
- Oliveto, G.; Hager, W.H. Further results to time-dependent local scour at bridge elements. J. Hydraul. Eng. 2005, 131, 97–105. [Google Scholar] [CrossRef]
- Neill, C.R. Note on initial movement of coarse uniform bed-material. J. Hydraul. Res. 1968, 6, 173–176. [Google Scholar] [CrossRef]
- Palermo, M.; Pagliara, S.; Roy, D. Effect of debris accumulation on scour evolution at bridge pier in bank proximity. J. Hydrol. Hydromech. 2021, 1, 108–118. [Google Scholar] [CrossRef]
- Oliveto, G.; Hager, W.H. Temporal evolution of clear–water pier and abutment scour. J. Hydraul. Eng. 2002, 128, 811–820. [Google Scholar] [CrossRef]
- Melville, B.W. Pier and abutment scour: Integrated approach. J. Hydraul. Eng. 1997, 123, 125–136. [Google Scholar] [CrossRef]
- Stein, O.R.; Julien, P.Y.; Alonso, C.V. Mechanics of jet scour downstream of a headcut. J. Hydraul. Res. 1993, 31, 723–738. [Google Scholar] [CrossRef]
- Hoffmans, G.J.C.M. Closure problem to jet scour. J. Hydraul. Res. 2009, 47, 100–109. [Google Scholar] [CrossRef]
- Barenblatt, G.I. Dimensional Analysis; Gordon and Breach Science: New York, NY, USA, 1987. [Google Scholar]
- Palermo, M.; Pagliara, S. Teaching Hydraulics and Hydraulic Structure Design with Leonardo da Vinci. J. Hydraul. Eng. 2020, 146, 04020035. [Google Scholar] [CrossRef]
Figure 1.
(a) Test channel showing the longitudinal chevron position (not in scale), (b) geometry of a typical chevron structure used in the study and transversal chevron position at (c) pc/B = 0.5 and (d) pc/B = 0.33.
Figure 1.
(a) Test channel showing the longitudinal chevron position (not in scale), (b) geometry of a typical chevron structure used in the study and transversal chevron position at (c) pc/B = 0.5 and (d) pc/B = 0.33.

Figure 2.
(a) Plan and (b) cross-sectional views of the chevron series arrangement along with the main parameters; (c) cross-sectional view of the bed morphology at section b-b.
Figure 2.
(a) Plan and (b) cross-sectional views of the chevron series arrangement along with the main parameters; (c) cross-sectional view of the bed morphology at section b-b.

Figure 3.
Scour evolution for test 6 at (a) t = 0 s (test beginning) and (b) t = 1800 s. Flow is from left to right.
Figure 3.
Scour evolution for test 6 at (a) t = 0 s (test beginning) and (b) t = 1800 s. Flow is from left to right.

Figure 4.
Scour morphology Type A for (a) pc/B = 0.5 and (b) pc/B = 0.33 and scour morphology Type B for (c) pc/B = 0.5 and (d) pc/B = 0.33 in case of single chevron structure (n = 1) in straight channel.
Figure 4.
Scour morphology Type A for (a) pc/B = 0.5 and (b) pc/B = 0.33 and scour morphology Type B for (c) pc/B = 0.5 and (d) pc/B = 0.33 in case of single chevron structure (n = 1) in straight channel.

Figure 5.
Scour morphology Type (a) A, (b) B and (c) C for pc/B = 0.5 in the case of chevron series arrangement with three structures (n = 3) in the straight channel.
Figure 5.
Scour morphology Type (a) A, (b) B and (c) C for pc/B = 0.5 in the case of chevron series arrangement with three structures (n = 3) in the straight channel.

Figure 6.
Existence fields of the various scour morphology types for chevron structure arrangement with (a) n = 1, (b) n = 2 and (c) n = 3.
Figure 6.
Existence fields of the various scour morphology types for chevron structure arrangement with (a) n = 1, (b) n = 2 and (c) n = 3.

Figure 7.
Scour maps pertaining to (a) test 3 resulting in Type A, (b) test 4 resulting in Type B, (c) test 9 resulting in Type B and (d) test 10 resulting in Type C. All dimensions are in centimeter and flow is from bottom to top.
Figure 7.
Scour maps pertaining to (a) test 3 resulting in Type A, (b) test 4 resulting in Type B, (c) test 9 resulting in Type B and (d) test 10 resulting in Type C. All dimensions are in centimeter and flow is from bottom to top.

Figure 8.
(zm + htw)/hst vs. Fdeq for different values of (a) n, (b) pc/B and (c) sc/B.

Figure 9.
(zm + htw)/hst vs. Fdeq for chevrons in submerged and unsubmerged conditions, along with the plot of Equation (7).
Figure 9.
(zm + htw)/hst vs. Fdeq for chevrons in submerged and unsubmerged conditions, along with the plot of Equation (7).

Figure 10.
zmu-2/hst vs. zm/hst along with the plot of Equation (8).

Figure 11.
(zmd + htw)/hst vs. Fdeq along with the plot of Equation (9).

Figure 12.
(lmax + htw)/hst vs. (zm + htw)/hst. Data point are distinguished according to the different values of n.
Figure 12.
(lmax + htw)/hst vs. (zm + htw)/hst. Data point are distinguished according to the different values of n.

Figure 13.
(lmax + htw)/hst vs. (zm + htw)/hst along with the plot of Equation (10) for (a) n = 1 and (b) n = 3.
Figure 13.
(lmax + htw)/hst vs. (zm + htw)/hst along with the plot of Equation (10) for (a) n = 1 and (b) n = 3.

Figure 14.
(z′m + htw)/hst vs. Fdeq for submerged and unsubmerged chevrons, along with the plot of Equation (11).
Figure 14.
(z′m + htw)/hst vs. Fdeq for submerged and unsubmerged chevrons, along with the plot of Equation (11).


Table 1.
Summary of experimental conditions and results.
| Test | Q | n | pc/B | hst | sc/B | htw | Δy | zmu-1 | zmu-2 | zmu-3 | zmd | z′m | lmax |
|---|---|---|---|---|---|---|---|---|---|---|---|---|---|
| (m3/s) | (-) | (-) | (m) | (-) | (m) | (m) | (m) | (m) | (m) | (m) | (m) | (m) | |
| 1 | 0.012 | 1 | 0.50 | 0.056 | - | 0.078 | 0.002 | 0.075 | - | - | 0.031 | 0.013 | 0.818 |
| 2 | 0.012 | 1 | 0.33 | 0.056 | - | 0.074 | 0.003 | 0.084 | - | - | - | 0.016 | 0.699 |
| 3 | 0.014 | 1 | 0.33 | 0.056 | - | 0.084 | 0.003 | 0.075 | - | - | - | 0.015 | 0.896 |
| 4 | 0.014 | 1 | 0.33 | 0.056 | - | 0.105 | 0.002 | 0.062 | - | - | 0.015 | 0.040 | 0.712 |
| 5 | 0.014 | 1 | 0.50 | 0.056 | - | 0.103 | 0.003 | 0.068 | - | - | 0.015 | 0.034 | 0.785 |
| 6 | 0.012 | 1 | 0.50 | 0.056 | - | 0.076 | 0.003 | 0.113 | - | - | - | 0.019 | 0.855 |
| 7 | 0.012 | 1 | 0.50 | 0.095 | - | 0.077 | 0.001 | 0.114 | - | - | - | 0.025 | 1.058 |
| 8 | 0.012 | 2 | 0.50 | 0.056 | 0.4 | 0.075 | 0.004 | 0.095 | 0.065 | - | 0.024 | 0.010 | 1.223 |
| 9 | 0.014 | 2 | 0.50 | 0.056 | 0.4 | 0.086 | 0.005 | 0.096 | 0.053 | - | 0.035 | 0.016 | 1.610 |
| 10 | 0.014 | 2 | 0.50 | 0.056 | 0.4 | 0.103 | 0.004 | 0.083 | 0.056 | - | 0.019 | 0.035 | 1.237 |
| 11 | 0.012 | 2 | 0.33 | 0.056 | 0.4 | 0.072 | 0.005 | 0.093 | 0.064 | - | - | 0.008 | 0.970 |
| 12 | 0.014 | 2 | 0.33 | 0.056 | 0.4 | 0.102 | 0.004 | 0.075 | 0.053 | - | 0.012 | 0.045 | 1.195 |
| 13 | 0.012 | 2 | 0.50 | 0.056 | 0.6 | 0.074 | 0.004 | 0.095 | 0.074 | - | 0.029 | 0.007 | 1.259 |
| 14 | 0.014 | 2 | 0.50 | 0.056 | 0.6 | 0.103 | 0.004 | 0.073 | 0.064 | - | 0.018 | 0.038 | 1.301 |
| 15 | 0.012 | 2 | 0.33 | 0.056 | 0.6 | 0.074 | 0.006 | 0.100 | 0.068 | - | - | 0.023 | 0.940 |
| 16 | 0.014 | 2 | 0.33 | 0.056 | 0.6 | 0.102 | 0.003 | 0.079 | 0.056 | - | 0.011 | 0.051 | 1.275 |
| 17 | 0.012 | 2 | 0.50 | 0.056 | 0.2 | 0.076 | 0.003 | 0.105 | 0.053 | - | 0.023 | 0.016 | 1.400 |
| 18 | 0.014 | 2 | 0.50 | 0.056 | 0.2 | 0.105 | 0.003 | 0.077 | 0.050 | - | 0.021 | 0.033 | 1.100 |
| 19 | 0.012 | 2 | 0.33 | 0.056 | 0.2 | 0.074 | 0.003 | 0.099 | 0.067 | - | 0.017 | 0.020 | 1.260 |
| 20 | 0.014 | 2 | 0.33 | 0.056 | 0.2 | 0.102 | 0.003 | 0.085 | 0.052 | - | 0.039 | 0.041 | 1.205 |
| 21 | 0.014 | 2 | 0.50 | 0.056 | 0.2 | 0.087 | 0.003 | 0.109 | 0.066 | - | 0.046 | 0.022 | 1.965 |
| 22 | 0.014 | 2 | 0.33 | 0.056 | 0.2 | 0.085 | 0.004 | 0.116 | 0.068 | - | 0.039 | 0.030 | 1.635 |
| 23 | 0.016 | 2 | 0.50 | 0.056 | 0.2 | 0.124 | 0.003 | 0.073 | 0.054 | - | 0.035 | 0.037 | 1.190 |
| 24 | 0.012 | 2 | 0.33 | 0.095 | 0.2 | 0.076 | 0.005 | 0.109 | 0.070 | - | - | 0.032 | 0.958 |
| 25 | 0.012 | 2 | 0.50 | 0.095 | 0.2 | 0.076 | 0.003 | 0.108 | 0.066 | - | - | 0.011 | 1.315 |
| 26 | 0.012 | 3 | 0.50 | 0.056 | 0.2 | 0.075 | 0.006 | 0.123 | 0.067 | 0.060 | 0.048 | 0.020 | 1.750 |
| 27 | 0.014 | 3 | 0.50 | 0.056 | 0.2 | 0.084 | 0.007 | 0.117 | 0.071 | 0.060 | 0.047 | 0.023 | 2.150 |
| 28 | 0.014 | 3 | 0.50 | 0.056 | 0.2 | 0.103 | 0.004 | 0.091 | 0.045 | 0.068 | 0.043 | 0.035 | 1.800 |
| 29 | 0.014 | 3 | 0.33 | 0.056 | 0.2 | 0.083 | 0.006 | 0.119 | 0.082 | 0.051 | 0.035 | 0.030 | 2.165 |
| 30 | 0.014 | 3 | 0.33 | 0.056 | 0.2 | 0.105 | 0.003 | 0.074 | 0.039 | 0.057 | 0.040 | 0.047 | 1.771 |
| 31 | 0.008 | 3 | 0.50 | 0.056 | 0.2 | 0.065 | 0.005 | 0.056 | 0.048 | 0.015 | - | 0.022 | 0.732 |
| 32 | 0.016 | 3 | 0.50 | 0.056 | 0.2 | 0.124 | 0.003 | 0.073 | 0.046 | 0.066 | 0.045 | 0.051 | 1.510 |
| 33 | 0.012 | 3 | 0.33 | 0.095 | 0.2 | 0.075 | 0.006 | 0.116 | 0.064 | 0.057 | - | 0.026 | 1.310 |
| 34 | 0.012 | 3 | 0.50 | 0.095 | 0.2 | 0.075 | 0.005 | 0.100 | 0.060 | 0.040 | - | 0.035 | 1.152 |
Publisher’s Note: MDPI stays neutral with regard to jurisdictional claims in published maps and institutional affiliations. |
© 2021 by the authors. Licensee MDPI, Basel, Switzerland. This article is an open access article distributed under the terms and conditions of the Creative Commons Attribution (CC BY) license (https://creativecommons.org/licenses/by/4.0/).
Share and Cite
MDPI and ACS Style
Roy, D.; Pagliara, S.; Palermo, M. Experimental Analysis of Scour Features at Chevrons in Straight Channel. Water 2021, 13, 971. https://doi.org/10.3390/w13070971
AMA Style
Roy D, Pagliara S, Palermo M. Experimental Analysis of Scour Features at Chevrons in Straight Channel. Water. 2021; 13(7):971. https://doi.org/10.3390/w13070971
Chicago/Turabian StyleRoy, Deep, Simone Pagliara, and Michele Palermo. 2021. "Experimental Analysis of Scour Features at Chevrons in Straight Channel" Water 13, no. 7: 971. https://doi.org/10.3390/w13070971
Note that from the first issue of 2016, this journal uses article numbers instead of page numbers. See further details here.