Article

Combined Effects of Summer Water Temperature and Current Velocity on the Distribution of a Cold-Water-Adapted Sculpin (Cottus nozawae)

1
Graduate School of Agriculture, Hokkaido University, N9W9 Sapporo, Hokkaido 060-8589, Japan
2
Forest Research Institute, Hokkaido Research Organization, Bibai, Hokkaido 079-0198, Japan
3
Faculty of Environmental Earth Science, Hokkaido University, N10W5 Sapporo, Hokkaido 060-0810, Japan
*
Author to whom correspondence should be addressed.
Water 2021, 13(7), 975; https://doi.org/10.3390/w13070975
Submission received: 5 March 2021 / Revised: 30 March 2021 / Accepted: 30 March 2021 / Published: 1 April 2021
(This article belongs to the Special Issue Endangered Freshwater Ecosystems: Threats and Conservation Needs)

Abstract

:
Clarifying the combined effects of water temperature and other environmental factors on the species distributions of cold-water fishes is the first step toward obtaining a better understanding of the complex impacts of climate warming on these species. In the present study, we examined the abundance and occurrence of the fluvial sculpin, Cottus nozawae, in response to water temperature along environmental gradients in northern Japan. The abundance survey was conducted in the Sorachi River catchment with two-pass electrofishing with a backpack electrofisher. For the occurrence survey, we carried out one-pass electrofishing in the Sorachi, Chitose, and Tokachi River catchments. Fish sampling was conducted once from July to August 2018 in the Sorachi River catchment, from May to June 2011 in the Chitose River catchment, and from July to September 2012 in the Tokachi River catchment. Generalized linear mixed models (GLMMs) and generalized linear models (GLMs) were used for the abundance and occurrence analyses, respectively. We found that the mean summer water temperature was the most influential factor on the distribution of C. nozawae; the abundance and occurrence were both negatively affected by increased water temperatures. In the occurrence model, occurrence probabilities of 0.9 and 0.5 for C. nozawae corresponded to mean summer temperatures of 12.0 and 16.1 °C, respectively. Furthermore, we identified a combined effect of water temperature and current velocity on the abundance of C. nozawae. The increased mean summer water temperature had a stronger negative effect on C. nozawae abundance under gentle flow conditions. While the precise mechanisms of this combined effect could not be determined in this study, stressors associated with low current velocities may increase their vulnerability to higher water temperatures. Our findings indicate that flow disturbances caused by human activities such as excessive water abstraction may exacerbate the negative impacts of climate warming on populations of C. nozawae in the future.

1. Introduction

Changes in the amount of suitable thermal habitat for cold-water fishes in river ecosystems and decreases in cold-water fish populations under global warming have been widely projected. Many previous studies have projected a shrinking of cold-water fishes’ thermal habitats [1,2,3]. Some empirical studies have verified these predictions. For example, Almodóvar et al. [4] demonstrated a population decline in brown trout, Salmo trutta, associated with global warming since the 1980s in Spain. Eby et al. [5] demonstrated that the distribution area of bull trout, Salvelinus confluentus, had declined at warmer, low-elevation sites over the last two decades in the U.S. Rocky Mountains.
However, species responses to a thermal gradient are not always straightforward. Multiple environmental factors, including the water temperature, can interactively affect the survival and distribution of stream fishes e.g., [6,7,8]. Consequently, spatially complex species responses to climate change occur in freshwaters with multiple stressors [9,10]. In the context of global warming, clarifying the effects of water temperature in combination with other environmental factors is the first step toward achieving a better understanding of the complex impacts of climate change on cold-water fishes.
The impacts of climate change on a species can be inferred from habitat modeling using abundance (i.e., number of individuals, population density) or occurrence (i.e., presence-absence) data. Abundance-based modeling provides quantitative predictions about how environmental variables will directly affect the species population size or density and can be used to estimate the minimum viable population size (MVP) [11]. Thus, abundance-based modeling contributes to the identification and prioritization of certain environmental variables to modulate in order to increase the population size of target species e.g., [12,13]. However, collecting abundance data at many sites over a large area is costly; therefore, occurrence-based modeling has also been widely used as an alternative to abundance-based modeling [14]. Compared to abundance data, presence-absence data contain much less information at the site level. However, if it is applied to vast sampling sites over a large scale, occurrence-based modeling becomes a cost-effective and highly accurate tool for understanding future shifts in species distribution ranges under various climate-change scenarios. Indeed, the occurrence of a species and its relationship to climatic variables have also been widely used to assess potential climate-induced changes in freshwater fish distribution [15]. Thus, using both types of model simultaneously is a promising approach.
Cottus nozawae is a fluvial cold-water sculpin (Cottidae) that is distributed in the Tohoku and Hokkaido regions of northern Japan [16]. The primary distributional area of this benthic fish is the Hokkaido region, and C. nozawae is often found in middle and upper reaches of rivers [17]. C. nozawae is a primary freshwater fish that prefers riffle habitats with large streambed materials and a high current velocity [18]. The main spawning season in the Hokkaido region is from April to May, and eggs are laid under large stones [18]. The body length can reach 15 cm [19]. Alterations of riverbed conditions, such as increased fine sediments and bedrock outcrops, are reported as factors associated with fluvial sculpin population declines [19,20]. The populations in the Tohoku region are listed as an endangered local population by Japan’s Ministry of the Environment. In line with the global trend, global warming is occurring on the Japanese archipelago (1.24 °C/100 yr) [21] and may have a negative impact on populations of C. nozawae. However, no study has examined the response of this species to a thermal gradient while considering confounding factors. In the present study, we collected abundance data from one river catchment and presence-absence data from three river catchments. We modeled these biotic data using multiple abiotic factors to test the combined effects of the summer water temperature and habitat quality (current velocity, streambed condition and river size) on the sculpin distribution. We expected that summer water temperature and other environmental factors interactively determined the abundance and/or occurrence of C. nozawae. In testing this hypothesis, we tried to obtain key information related to the future conservation of the target species, such as their minimum habitat requirements for survival, as well as to identify conservation measures to increase their population abundance.

2. Materials and Methods

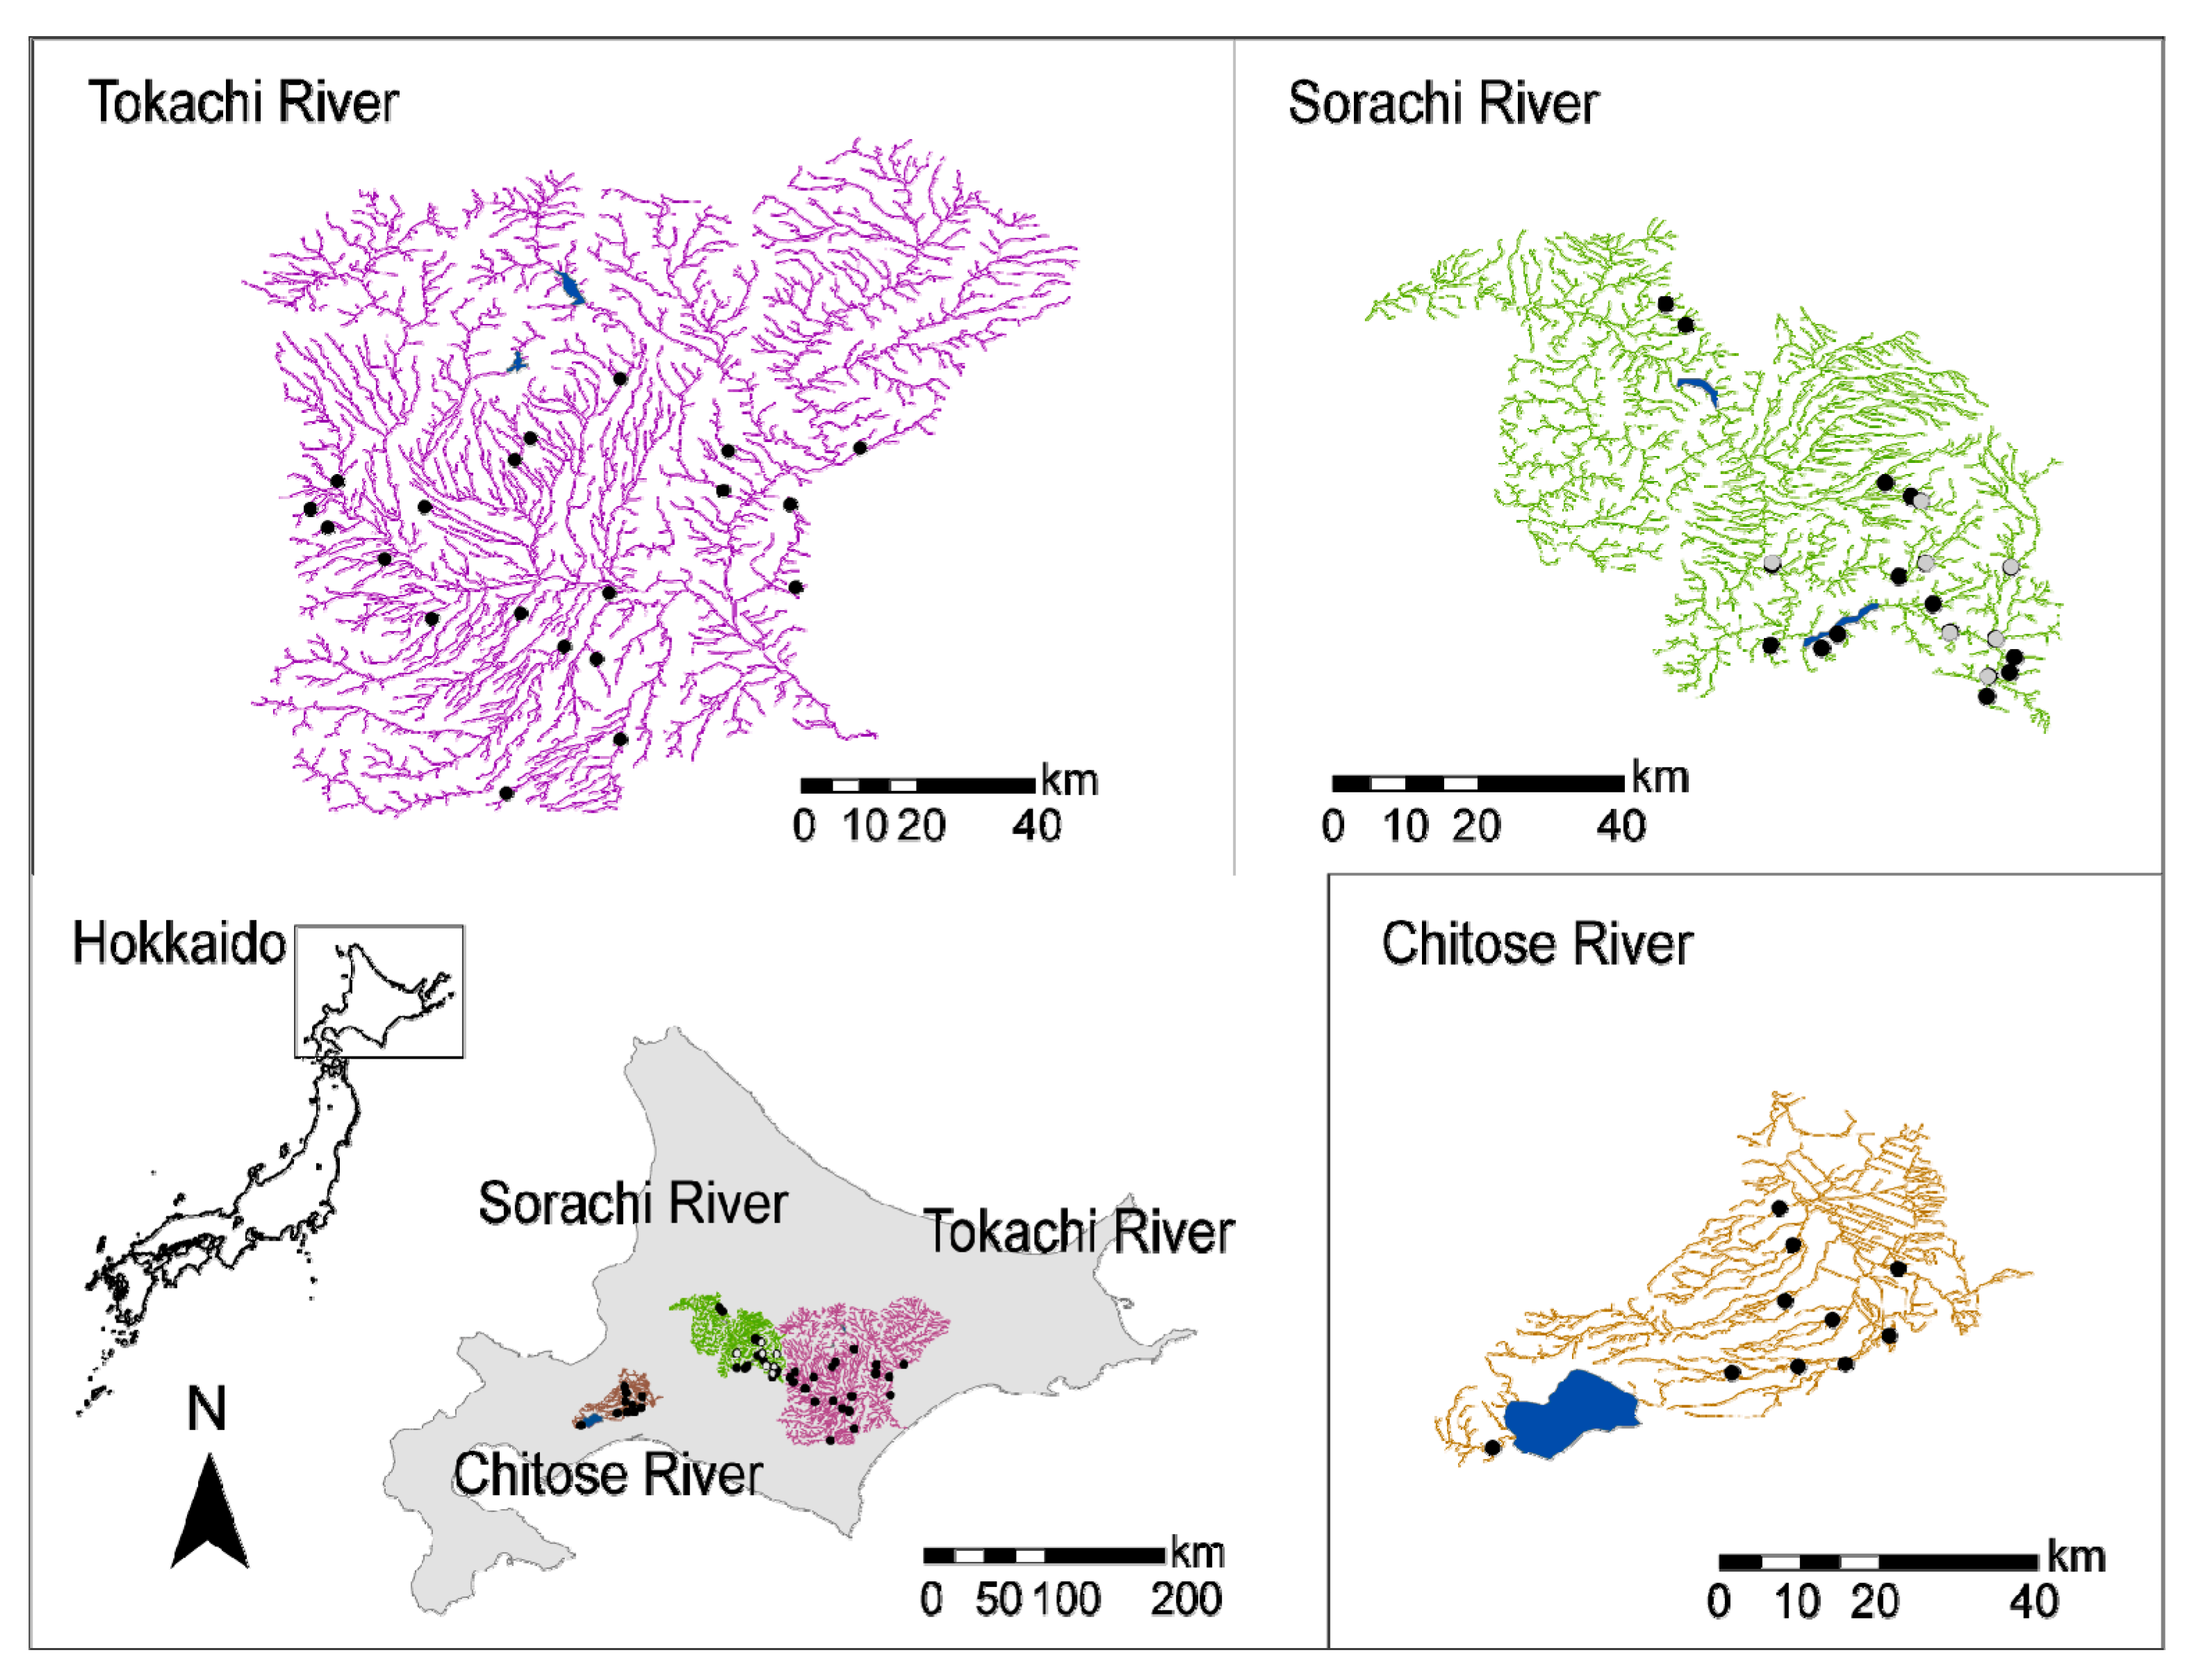
2.1. Abundance Survey

To clarify the variables affecting sculpin abundance, we conducted a field study in the Sorachi River catchment, central Hokkaido (Figure 1; 2618 km2). The total river length and proportions of farmland, urban area and forest in the catchment are 194.5 km and 12.7%, 1.2% and 77.5%, respectively. The average annual precipitation and temperature in the region (Furano city; from 2011 to 2020) were 1043.5 mm and 6.9 °C, respectively [22]. In the study region, we established 27 study sites with wetted widths of 3.4 ± 1.5 m (mean ± standard deviation (sd)) in 20 tributaries. We selected these sites because of their accessibility and a high degree of naturalness. There were 11 reservoir dams (>10 m wall height) in the catchment, but there was no dam upstream of our study sites. All study sites had no river channelization. All study sites were located on forested tributaries; the river catchment’s forest cover is 91.6% on average. We collected sculpins at each study site from July to August 2018, which corresponds to the growing season of the target species and the hottest period of the year in the Hokkaido region. We selected the study period because the target species is exposed to most severe thermal condition. At each site, we carried out two-pass electrofishing with a backpack electrofisher (Model LR-20B; Smith-Root Inc., Vancouver, WA, USA) and counted the total number of individuals obtained. Each individual site was approximately five times the length of the wetted width (19.3 ± 3.8 m: mean ± sd). We sampled only riffle habitats because they are the major spawning and growth habitat of the target species.
We measured the summer water temperature, current velocity and substrate composition at the same time as the fish sampling was performed. To measure the mean and maximum summer water temperatures, we set up a temperature logger (HOBO U20L-04, Onset, Bourne, MA, USA) in one segment of each tributary. We logged hourly water temperature data from 20 July to 31 August 2018, which corresponds to the hottest period of the year in the Hokkaido region. We established five equally spaced transects with five measurement points in each study site for the measurements of current velocity and substrate composition. At each measurement point, we measured the current velocity at 60% of the depth from the water surface with an electromagnetic flow meter (VE20, KENEK Co., Tokyo, Japan) and calculated the mean current velocity. At each measurement point, the substrates were identified by visual observation and classified as one of the following types: bedrock, sand (–2 mm), gravel (2–32 mm), pebble (32–64 mm), cobble (64–128 mm), or boulder (>128 mm). Following the study of Ishiyama et al. [19] on the relationship between substrate composition and C. nozawae density, we calculated the proportions of small substrates (2–64 mm) and large substrates (>64 mm) at each study site. The catchment size was used as an index of stream size (i.e., the flow volume) and was obtained from a 10-m digital elevation model published by the Geospatial Information Authority of Japan. Catchment delineation was performed in ArcGis Pro 2.4 (ESRI, Redlands, CA, USA).

2.2. Occurrence Survey

To clarify the variables influencing sculpin occurrence, we conducted a field study in the Sorachi, Chitose (1244 km2), and Tokachi (9010 km2) river catchments in central Hokkaido (Figure 1). The average annual precipitation and temperature at the Chitose River catchment (Eniwa city; from 2011 to 2020) were 1082.5 mm and 7.4 °C, respectively. Those at the Tokachi River catchment (Obihiro city; from 2011 to 2020) were 1007.1 mm and 7.6 °C, respectively [22]. In the Sorachi River catchment, we established 20 study sites with wetted widths of 3.8 ± 1.5 m (mean ± sd) and lengths of 19.0 ± 3.6 m (mean ± sd) in 20 tributaries. In the Chitose River catchment, we established 10 study sites with wetted widths of 6.2 ± 3.8 m (mean ± sd) and lengths of 93.3 ± 7.7 m (mean ± sd) in 10 tributaries. In the Tokachi River catchment, we established 20 study sites with wetted widths of 5.1 ± 3.7 m (mean ± sd) and lengths of 100 m in 20 tributaries. The study sites varied substantially in terms of catchment land use; the forest cover in the catchments ranged from 7.7% to 99.8%. We carried out one-pass electrofishing with a backpack electrofisher (Model LR-20B or Model 12; Smith-Root Inc., Vancouver, WA, USA) and recorded presence-absence data for the target species. Fish sampling was conducted once from July to August 2018 in the Sorachi River catchment, from May to June 2011 in the Chitose River catchment, and from July to September 2012 in the Tokachi River catchment.
We measured the summer water temperature, stream slope, catchment size and catchment land use. Water temperature was measured in the same year as the fish sampling took place. For details about the measuring method, please see “2.2 Abundance Survey: Environmental Variables”. We used the following types of loggers to take the measurements: Sorachi River, HOBO U20L-04; Chitose River, HOBO U20-001-04; and Tokachi River, HOBO UA-002-64, (Onset, Bourne, MA, USA). We used the stream slope as a surrogate for the current velocity because we did not measure the current velocity at all study sites. The stream slope and catchment size were obtained from a 10-m digital elevation model published by the Geospatial Information Authority of Japan. For the stream slope calculation, we identified river lines around study sites within a 100-m-diameter area and divided the length of the river lines by the change in altitude. Catchment land use was considered in the occurrence analyses because the degree of human land use in catchments greatly differed among the study sites. Hokkaido Island is the largest agricultural area in Japan; however, the development of agricultural land use in catchments negatively affects the diversity of stream biota by increasing sedimentation and nutrient enrichment [23,24]. Therefore, we used the proportion of farmland in the catchments as an index of human impacts on stream ecosystems. The catchment land use was calculated using high-resolution land use and land cover maps based on satellite images from 2006 to 2011 provided by Jaxa (version 16.09). We considered croplands and rice paddies as farmland and calculated the percentage of farmland in each catchment. All geospatial analyses were performed in ArcGis Pro 2.4 (ESRI, Redlands, CA, USA).

2.3. Statistical Analyses

We analyzed the sculpin abundance data using generalized linear mixed models (GLMMs) with a Poisson error and a log link function. To control for the uniqueness of each tributary, we treated the tributary as a random effects intercept. The log survey area was included as an offset term. The response variable was the number of individuals. The candidate explanatory variables were the mean summer water temperature, maximum summer water temperature, mean current velocity, proportion of small substrates, proportion of large substrates and catchment size. We found high correlations between the mean summer water temperature and the maximum summer water temperature (r = 0.89) and between the proportion of small substrates and the proportion of large substrates (r = −0.99). Therefore, we built different models using each explanatory variable and compared the Akaike’s information criterion (AIC) of each model (i.e., mean summer water temperature vs. maximum summer water temperature, proportion of small substrates vs. proportion of large substrate). Variables in the models with lower AIC values were used in the analyses. To test the combined effects of water temperature and other variables on sculpin abundance, we also used interactive terms between water temperature and the other three environmental variables. Based on the full model, we constructed models for all cases with a best-subset procedure [25], and the model performance was evaluated based on the AIC. The predictors in the best model with the lowest AIC were used to build a final model. When multiple best models (∆AIC < 2) were found, we conducted model averaging using the models. The parameters for which the 95% confidence intervals (CIs) did not include 0 were applied to the final model. Before the statistical analyses, we scaled all predictors to assess their relative importance based on standardized partial regression coefficients. We developed the GLMMs with the lme4 package [26] and performed model selection and averaging with the MuMIn package [27].
We analyzed the occurrence of C. nozawae using generalized linear models (GLMs) with a binomial error and logit link function. The response variable was the presence-absence of C. nozawae. The candidate explanatory variables were the mean summer water temperature, maximum summer water temperature, stream slope, catchment size, and proportion of farmland in the catchments. There was a strong correlation between the mean summer water temperature and the maximum summer water temperature (r = 0.70). Thus, we preliminarily performed the same procedure as used in the abundance analyses to select a more influential temperature predictor. We also incorporated the survey area of each sampling site in the models to account for variability in sampling efforts [28]. To test the combined effects of water temperature and other variables on sculpin occurrence, we used additional interactive terms between the water temperature and the other three environmental variables. Before the statistical analyses, we scaled all predictors to assess their relative importance based on standardized partial regression coefficients. The model selection procedures were the same as those described for the abundance analyses. We calculated the area under the receiver operating characteristic curve (AUC) of the final model to assess the discriminatory capacity of the species distribution model using the Epi package [29].

3. Results

3.1. Abundance Response to Thermal Gradients

Based on the results of the variable selection analysis (Table 1), the mean summer water temperature, mean current velocity, proportion of large substrates and catchment size were applied in the statistical analyses. We collected a total of 1042 individuals (Table S1). The abundance of C. nozawae per 100 m2 was 47.0 ± 42.3 (mean ± sd). The mean summer water temperature in the study catchment ranged from 7.4 to 14.0 °C (10.6 ± 1.8 °C: mean ± sd). The mean current velocity, proportion of large substrates and catchment size were 0.74 ± 0.20 m/s, 57.6 ± 18.1% and 12.3 ± 7.3 km2, respectively. The best model for predicting the abundance of C. nozawae included three variables: mean summer water temperature, mean current velocity and their interaction term (Table 2, Marginal R2: 0.42, Conditional R2: 0.98). We found that sculpin abundance was negatively affected by mean summer water temperature and was positively affected by mean current velocity. We also detected a significant interactive effect between temperature and velocity; the negative relationship of the abundance to the mean summer water temperature became more apparent at lower-velocity sites (Figure 2). The standardized partial regression coefficients of the mean summer water temperature, the mean current velocity and the interactive term were −0.47, 0.49 and 0.24, respectively.

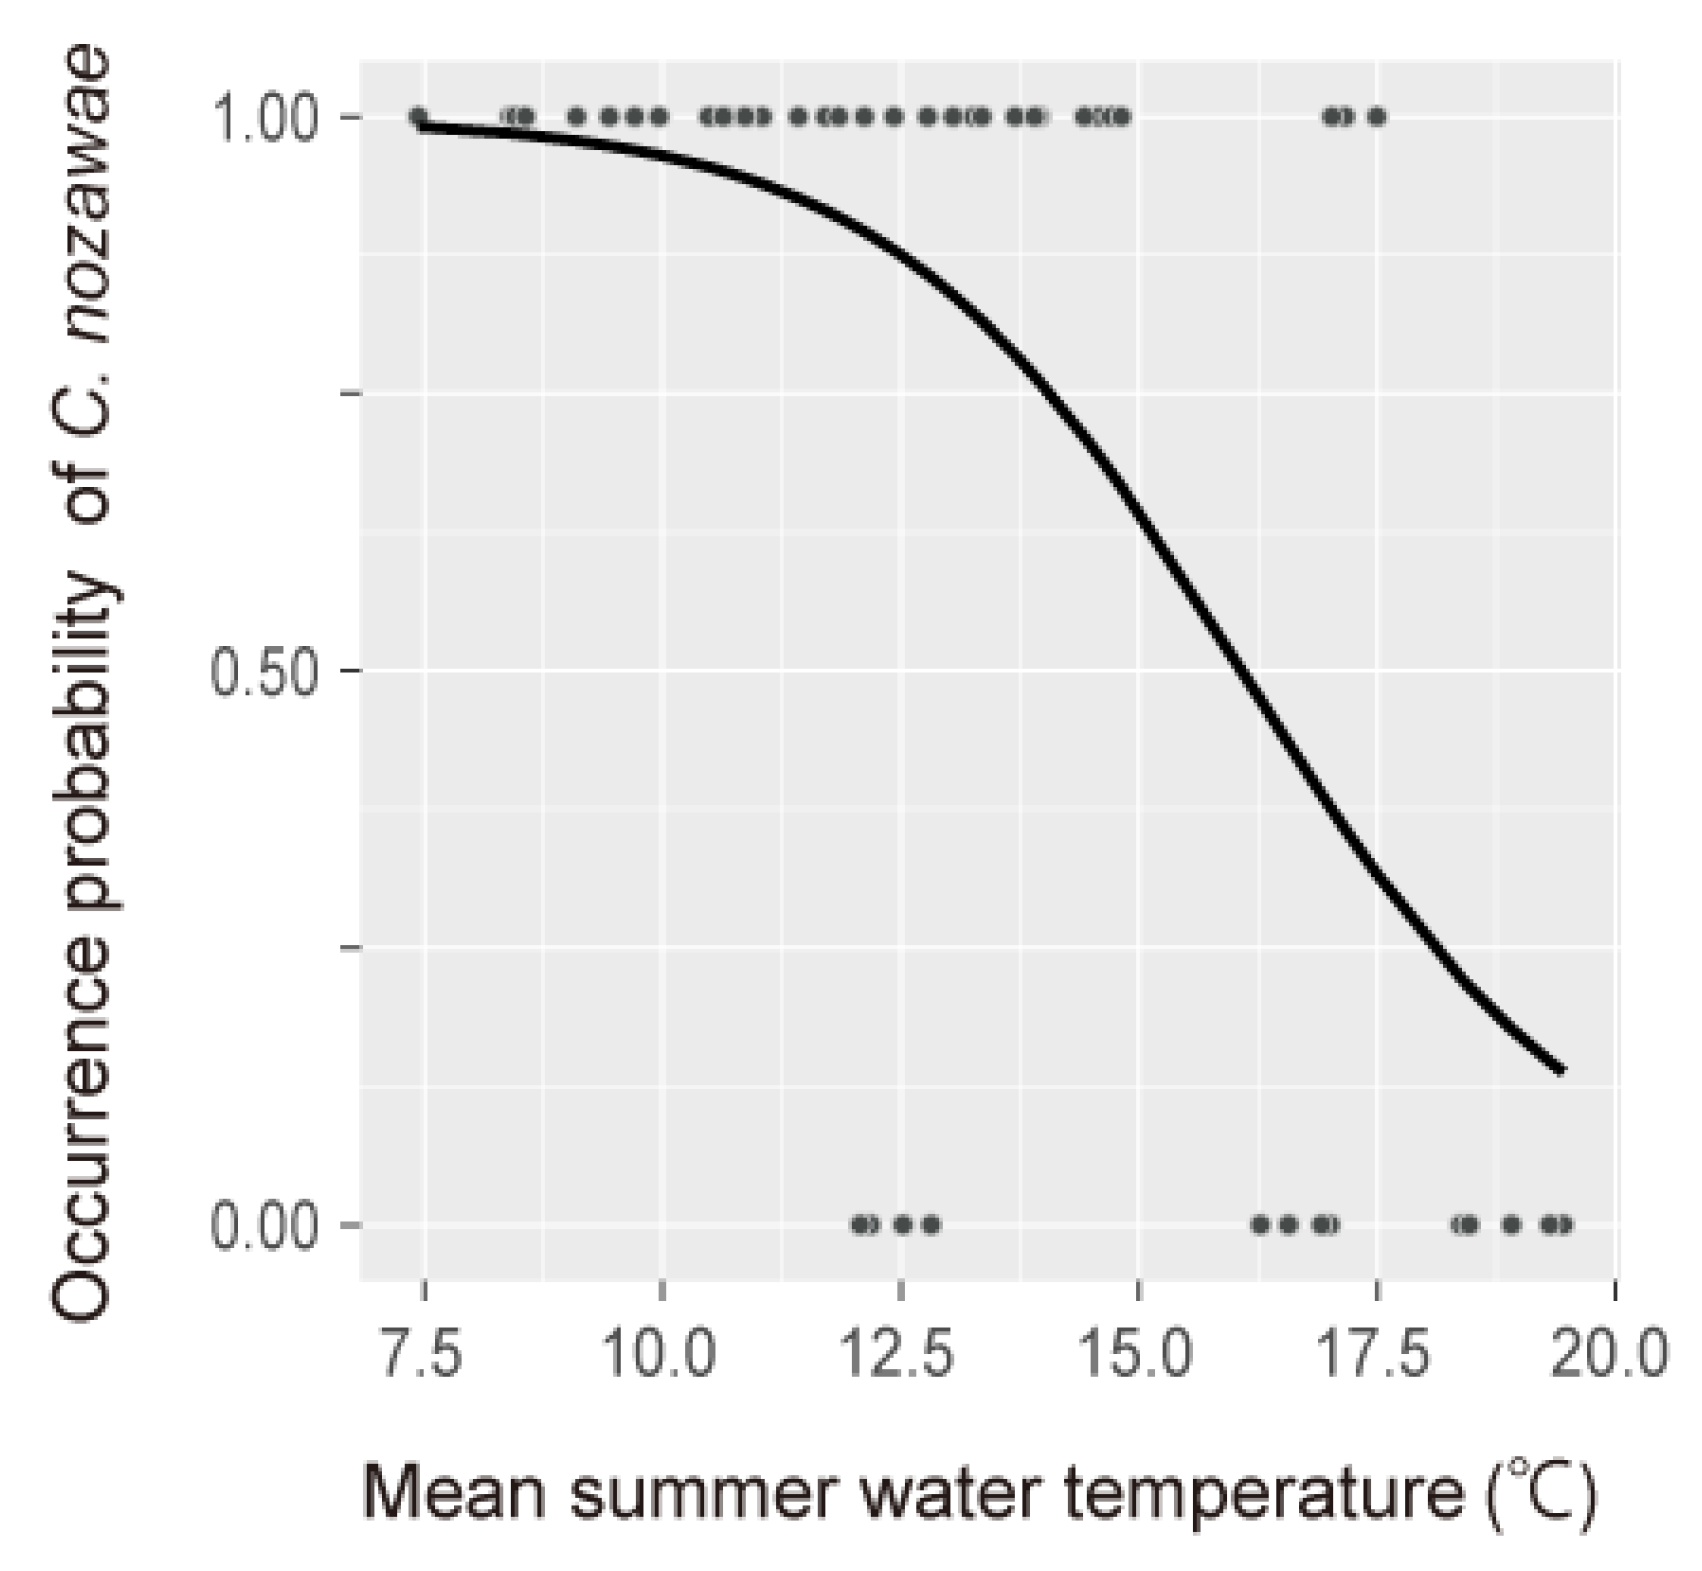
3.2. Occurrence Response to Thermal Gradients

Based on the results of the analysis for variable selection (Table 1), the mean summer water temperature, stream slope, catchment size, proportion of farmland and survey area were applied in the statistical analyses. We found the target species at 37 of the 50 study sites (Table S1). The prevalence value in the Sorachi, Chitose and Tokachi River catchments was 0.9, 0.5 and 0.7, respectively. The mean summer water temperature in the three study catchments ranged from 7.4 to 19.5 °C (13.2 ± 3.1 °C: mean ± sd). The stream slope, catchment size and proportion of farmland in the catchments were 2.2 ± 1.9%, 27.8 ± 37.8 km2 and 13.8 ± 22.7%, respectively (mean ± sd). We detected multiple best models (Table 3, ∆AIC < 2) and therefore conducted model averaging using the models. The mean summer water temperature was the sole influential factor (Table 4) and showed a negative relationship with the occurrence of C. nozawae (Figure 3). The final model yielded an R2 of 0.45 and an AUC of 0.89. In the final model, occurrence probabilities of 0.9, 0.7, and 0.5 for C. nozawae corresponded to 12.0, 14.6, and 16.1 °C, respectively.

4. Discussion

Changes in the amount of suitable thermal habitat for cold-water fishes and decreases in their population under global warming scenarios have been widely projected [1,2,3]. In line with the global trend, global warming is occurring on the Japanese archipelago [21], and information about species responses to thermal gradients is urgently needed in order to assess the potential impacts of global warming on cold-water fishes in Japan. For the fluvial cold-water sculpin C. nozawae, we examined the response of its abundance and occurrence to the mean summer water temperature along environmental gradients. Our primary finding was a combined effect of water temperature and current velocity. The abundance of C. nozawae decreased with increasing summer water temperature, and this response became more apparent at sites with lower current velocities. In river networks, future anthropogenic impacts may change flow regimes as well as thermal regimes. Our findings indicate that considering the combined effect of changes in thermal and flow regimes can improve predictions of changes in the C. nozawae’ distribution and contribute to planning conservation measures for this target species.

4.1. Effects of Summer Water Temperature

Water temperature had the most considerable effect on both the abundance and occurrence of C. nozawae among the tested variables; the mean summer water temperature negatively affected both biological indices. These patterns are supported by previous findings in fluvial sculpins in Asia, North America and Europe [30,31,32]. One of the mechanisms of this negative relationship is the physiological stress caused by the increase in temperature. For example, Dorts et al. [33], using multiple stress markers in fish liver and gill tissues, reported that elevated temperatures induced oxidative stress in the European bullhead, C. gobio. These previous studies suggest that warmer summer water temperatures would result in a higher mortality rate and therefore low abundances or the absence of the target species. Yagami and Goto [32] also reported that the abundance of C. nozawae was negatively correlated with the maximum summer water temperature, although they did not assess the mean summer temperature. We found that the mean summer water temperature had a stronger influence on C. nozawae abundance and occurrence than the maximum summer water temperature. Individuals may be continuously and negatively affected by high-temperature conditions. Therefore, a mean temperature that reflects the long-term thermal condition (i.e., the mean for the summer season) has greater explanatory power for the sculpin distribution than the temperature at a single time point (i.e., the maximum temperature for the season).

4.2. Combined Effects of Summer Water Temperature and Current Velocity

Why did a high summer water temperature have a stronger negative effect on sculpin abundance under low current velocities? One of the key reasons for this is the combined effect of multiple stressors. Many field and laboratory works have demonstrated the combined effects of anthropogenic (e.g., nutrient enrichment, increased fine sediments) and/or natural stressors (e.g., substrate coarseness) in fluvial systems e.g., [23,34,35]. C. nozawae uses the interstitial spaces in substrates as living and spawning habitats [16]. Thus, the abundance of fluvial sculpin is positively correlated with the quantity of loose stones in streambeds [20]. Unfortunately, we did not quantify the streambed mobility or interstitial spaces. Nevertheless, we guess that the amount of crucial spaces in streambeds decreases under gentle flow conditions because high flows create interstitial spaces by transporting streambed materials and removing fine sediments [36]. Low-velocity sites are also stressful for the target species in terms of food availability. Yamamoto et al. [37] reported that C. nozawae selectively feeds on drifting insects (swimming-type) and benthic insects (case-bearing-type) throughout the year. Drift fluxes of aquatic insects can increase with increasing current velocity [38,39]. Therefore, the availability of drifting food for sculpin would decrease at sites with lower current velocity, which would also result in low growth or poor body condition. Poor body conditions of the fish at low current velocities probably induced susceptibility to warm water temperatures. Unfortunately, very few studies have addressed such interactive effects of multiple stressors on the physiological stress status of stream fishes (but see [33]). A further mechanistic understanding is needed to disentangle the combined effects of water temperature and other stressors on cold-water fishes.

4.3. Management Implications

Our findings suggest that cool streams should be preserved or restored as suitable habitats for C. nozawae. What is the criterion for thermally suitable streams for the target species? Modeled occurrence probabilities are often converted into presence-absence (1 or 0) maps for conservation planning. The 0.5 point threshold (i.e., the target species is present if the predicted occurrence probability is over 0.5) is widely used to define presence-absence in ecology [40,41]. In our model for C. nozawae, an occurrence probability of 0.5 corresponds to a mean summer water temperature of 16.1 °C. This thermal threshold can be used to indicate thermally suitable habitats for the target species in northern Japan. However, it must be noted that this thermal threshold (i.e., 16.1 °C) may guarantee only a minimum habitat requirement for C. nozawae survival: the abundance model predicted that the sculpin density was very low (5.9 n/100 m2, current velocity = 0.7 m/s) at this thermal threshold, which was nearly the same value as the five lowest values among the 27 study sites. This prediction indicates that this thermal threshold is likely too high to ensure the persistence of the population. Moreover, at temperatures near the thermal threshold, active mitigation measures such as riparian forest restoration to cool the water would be required to achieve long-term population viability for C. nozawae.
The combined effects of climate change and human activities on biodiversity have recently been in the spotlight e.g., [42,43]. This study demonstrates the combined effect of increased water temperatures and decreased current velocity, which led to a dramatic reduction in C. nozawae populations. This result indicates that flow regulation caused by human activities such as water abstraction can exacerbate the negative impact of global warming on populations of C. nozawae in the future. As this study suggests, the impacts of global warming on cold-water fishes may be more complicated than we expect. Managers may overlook rapid species declines under climate change and ultimately fail to conserve target species if they consider only the independent effects of environmental stressors. Further knowledge of species responses to water temperature along other environmental gradients will improve our ability to predict climate-induced changes in cold-water fish distributions and will contribute to conservation planning.

Supplementary Materials

The following are available online at https://www.mdpi.com/article/10.3390/w13070975/s1, Table S1: Information of the abundance of C. nozawae in the three study catchments.

Author Contributions

Conceptualization, K.S., N.I., I.K. and F.N.; Methodology, K.S., N.I., I.K. and F.N.; Software, N.I.; Validation, K.S., N.I., I.K. and F.N.; Formal Analysis, N.I.; Investigation, K.S. and N.I.; Data Curation, K.S. and N.I.; Writing—Original Draft Preparation, K.S. and N.I.; Writing—Review and Editing, K.S., N.I., I.K. and F.N.; Visualization, N.I.; Supervision, N.I.; Project Administration, N.I. and F.N.; Funding Acquisition, N.I. and F.N. All authors have read and agreed to the published version of the manuscript.

Funding

This research was funded by JSPS KAKENHI Grant Number 18K18221 and the research fund for the Ishikari and Tokachi Rivers provided by the Ministry of Land, Infrastructure, Transport, and Tourism (MLIT) of Japan.

Institutional Review Board Statement

Fish sampling was undertaken with permission from the Fisheries Adjustment Rules of Hokkaido Prefecture (permit 2018-ID188, 2012-ID5).

Data Availability Statement

Fish data supporting the results are available in the Supplementary Material.

Acknowledgments

We thank the members of the Ecosystem Management Laboratory of Hokkaido University for their help in conducting the field work. We especially thank Hideyuki Kawai, Hiroki Itou and Issei Yamamoto for their dedicated supports in fish sampling.

Conflicts of Interest

The authors declare no conflict of interest.

References

  1. Buisson, L.; Thuiller, W.; Lek, S.; Lim, P.U.Y.; Grenouillet, G. Climate Change Hastens the Turnover of Stream Fish Assemblages. Glob. Chang. Biol. 2008, 14, 2232–2248. [Google Scholar] [CrossRef]
  2. Isaak, D.J.; Luce, C.H.; Horan, D.L.; Chandler, G.L.; Wollrab, S.P.; Nagel, D.E. Global Warming of Salmon and Trout Rivers in the Northwestern US: Road to Ruin or Path Through Purgatory? Trans. Am. Fish. Soc. 2018, 147, 566–587. [Google Scholar] [CrossRef]
  3. Nakano, S.; Kitano, F.; Maekawa, K. Potential Fragmentation and Loss of Thermal Habitats for Charrs in the Japanese Archipelago Due to Climatic Warming. Freshwat. Biol. 1996, 36, 711–722. [Google Scholar] [CrossRef]
  4. Almodóvar, A.; Nicola, G.G.; Ayllón, D.; Elvira, B. Global Warming Threatens the Persistence of Mediterranean Brown Trout. Glob. Chang. Biol. 2012, 18, 1549–1560. [Google Scholar] [CrossRef] [Green Version]
  5. Eby, L.A.; Helmy, O.; Holsinger, L.M.; Young, M.K. Evidence of Climate-Induced Range Contractions in Bull Trout Salvelinus Confluentus in a Rocky Mountain Watershed, USA. PLoS ONE 2014, 9, e98812. [Google Scholar] [CrossRef]
  6. Atlas, W.I.; Seitz, K.M.; Jorgenson, J.W.N.; Millard-Martin, B.; Housty, W.G.; Ramos-Espinoza, D.; Burnett, N.J.; Reid, M.; Moore, J.W. Thermal Sensitivity and Flow-Mediated Migratory Delays Drive Climate Risk for Coastal Sockeye Salmon. FACETS 2021, 6, 71–89. [Google Scholar] [CrossRef]
  7. Rahel, F.J.; Nibbelink, N.P. Spatial Patterns in Relations Among Brown Trout (Salmo trutta) Distribution, Summer Air Temperature, and Stream Size in Rocky Mountain Streams. Can. J. Fish. Aquat. Sci. 1999, 56, 43–51. [Google Scholar] [CrossRef]
  8. Terui, A.; Miyazaki, Y. Combined Effects of Immigration Potential and Habitat Quality on Diadromous Fishes. Limnology 2017, 18, 121–129. [Google Scholar] [CrossRef]
  9. Jackson, M.C.; Loewen, C.J.G.; Vinebrooke, R.D.; Chimimba, C.T. Net Effects of Multiple Stressors in Freshwater Ecosystems: A Meta-Analysis. Glob. Chang. Biol. 2016, 22, 180–189. [Google Scholar] [CrossRef]
  10. Johnson, S.L.; Penaluna, B.E. Climate Change and Interactions with Multiple Stressors in Rivers. In Multiple Stressors in River Ecosystems; Elsevier: Amsterdam, The Netherlands, 2019; pp. 23–44. [Google Scholar]
  11. Shaffer, M.L. Minimum Population Sizes for Species Conservation. Bioscience 1981, 31, 131–134. [Google Scholar] [CrossRef]
  12. Ishiyama, N.; Koizumi, I.; Yuta, T.; Nakamura, F. Differential Effects of Spatial Network Structure and Scale on Population Size and Genetic Diversity of the Ninespine stickleback in a Remnant Wetland System. Freshwat. Biol. 2015, 60, 733–744. [Google Scholar] [CrossRef] [Green Version]
  13. Ishiyama, N.; Nagayama, S.; Akasaka, T.; Nakamura, F. Habitat use by Endangered Japanese Crayfish in Low-Gradient Streams of Southern Hokkaido, Japan: Reach and Microhabitat-Scale Analysis. Hydrobiologia 2012, 686, 257–266. [Google Scholar] [CrossRef]
  14. Guisan, A.; Thuiller, W. Predicting Species Distribution: Offering More than Simple Habitat Models. Ecol. Lett. 2005, 8, 993–1009. [Google Scholar] [CrossRef]
  15. Comte, L.; Buisson, L.; Daufresne, M.; Grenouillet, G. Climate-Induced Changes in the Distribution of Freshwater fish: Observed and Predicted Trends. Freshwat. Biol. 2013, 58, 625–639. [Google Scholar] [CrossRef] [Green Version]
  16. Kawanabe, Y.; Mizuno, N. Freshwater Fishes of Japan; Yama to Keikoku-sha: Tokyo, Japan, 1998. (In Japanese) [Google Scholar]
  17. Goto, A. Geographic Distribution and Variations of Two Types of Cottus nozawae in Hokkaido, and Morphological Characteristics of C. amblystomopsis from Sakhalin. Jpn. J. Ichthyol. 1980, 27, 97–105. [Google Scholar]
  18. Goto, A. Ecological and Morphological Divergence of the Freshwater Sculpin, Cottus nozawae Synder-I. Spawning Behavior and Process of the Development in the Post-Hatching Stage. Bull. Fac. Fish. Hokkaido Univ. 1975, 26, 31–37, (In Japanese with English Abstract). [Google Scholar]
  19. Ishiyama, N.; Watanabe, K.; Nagayama, S.; Nakamura, F.; Kenmotsu, H.; Takahashi, H.; Maruoka, N.; Iwase, H. The Influence of Bedrock Outcrop on Stream Fish Habitat, and the Assessment of Restoration in a Bedrock Streamchannel. Ecol. Civil. Eng. 2009, 12, 57–66, (In Japanese with English Abstract). [Google Scholar] [CrossRef]
  20. Watanabe, K.; Nakamura, F.; Kamura, K.; Yamada, H.; Watanabe, Y.; Tsuchiya, S. Influence of Stream Alteration on the Abundance and Distribution of Benthic Fish. Ecol. Civ. Eng. 2001, 4, 133–146, (In Japanese with English Abstract). [Google Scholar] [CrossRef]
  21. JMA. Climate Change Monitoring Report. 2019. Available online: https://www.data.jma.go.jp/cpdinfo/monitor/2019/pdf/ccmr2019_all.pdf (accessed on 15 January 2021). (In Japanese).
  22. JMA. The Climate Records in Japan. Available online: https://www.data.jma.go.jp/obd/stats/etrn/index.php (accessed on 19 March 2021). (In Japanese).
  23. Ishiyama, N.; Miura, K.; Inoue, T.; Sueyoshi, M.; Nakamura, F. Geology-Dependent Impacts of Forest Conversion on Stream Fish Diversity. Conserv. Biol. 2020. [Google Scholar] [CrossRef]
  24. Sueyoshi, M.; Ishiyama, N.; Nakamura, F. β-Diversity Decline of Aquatic Insects at the Microhabitat Scale Associated with Agricultural Land Use. Landsc. Ecol. Eng. 2016, 12, 187–196. [Google Scholar] [CrossRef]
  25. Burnham, K.P.; Anderson, D.R. Model. Selection and Multimodel Inference: A Practical Information-Theoretic Approach; Springer: New York, NY, USA, 2002. [Google Scholar]
  26. Bates, D.; Maechler, M.; Bolker, B.; Walker, S.; Christensen, R.H.B.; Singmann, H. lme4: Linear mixed-effects models using Eigen and S; R Package Version 1.4; 2014; Available online: https://www.researchgate.net/publication/279236477_Package_Lme4_Linear_Mixed-Effects_Models_Using_Eigen_and_S4 (accessed on 1 April 2021).
  27. Barton, K. MuMIn: Multi-Model Inference; R Package Version 1.43.17; 2020; Available online: https://cran.r-project.org/web/packages/MuMIn/index.html (accessed on 1 April 2021).
  28. Ishiyama, N.; Ryo, M.; Kataoka, T.; Nagayama, S.; Sueyoshi, M.; Terui, A.; Mori, T.; Akasaka, T.; Nakamura, F. Predicting the Ecological Impacts of Large-dam Removals on a River Network Based on Habitat-Network Structure and Flow Regimes. Conserv. Biol. 2018, 32, 1403–1413. [Google Scholar] [CrossRef]
  29. Carstensen, B.; Plummer, M.; Laara, E.; Hills, M. Epi: A Package for Statistical Analysis in Epidemiology; R Package Version 2.44; 2021; Available online: https://cran.r-project.org/web/packages/Epi/index.html (accessed on 1 April 2021).
  30. Edwards, P.A.; Cunjak, R.A. Influence of Water Temperature and Streambed Stability on the Abundance and Distribution of Slimy Sculpin (Cottus cognatus). Environ. Biol. Fishes 2007, 80, 9–22. [Google Scholar] [CrossRef]
  31. Legalle, M.; Santoul, F.; Figuerola, J.; Mastrorillo, S.; Céréghino, R. Factors Influencing the Spatial Distribution Patterns of the Bullhead (Cottus gobio L., Teleostei cottidae): A Multi-Scale Study. Biodivers. Conserv. 2005, 14, 1319–1334. [Google Scholar] [CrossRef]
  32. Yagami, T.; Goto, A. Patchy Distribution of a Fluvial sculpin, Cottus nozawae, in the Gakko River System at the Southern Margin of its Native Range. Ichthyol. Res. 2000, 47, 27–286. [Google Scholar] [CrossRef]
  33. Dorts, J.; Bauwin, A.; Kestemont, P.; Jolly, S.; Sanchez, W.; Silvestre, F. Proteasome and Antioxidant Responses in Cottus gobio during a Combined Exposure to Heat Stress and Cadmium. Comp. Biochem. Physiol. Toxicol. Pharmacol. 2012, 155, 318–324. [Google Scholar] [CrossRef] [PubMed]
  34. Schinegger, R.; Palt, M.; Segurado, P.; Schmutz, S. Untangling the Effects of Multiple Human Stressors and Their Impacts on Fish Assemblages in European Running Waters. Sci. Total Environ. 2016, 573, 1079–1088. [Google Scholar] [CrossRef] [PubMed] [Green Version]
  35. Townsend, C.R.; Uhlmann, S.S.; Matthaei, C.D. Individual and Combined Responses of Stream Ecosystems to Multiple Stressors. J. Appl. Ecol. 2008, 45, 1810–1819. [Google Scholar] [CrossRef]
  36. Poff, N.L.; Allan, J.D.; Bain, M.B.; Karr, J.R.; Prestegaard, K.L.; Richter, B.D.; Sparks, R.E.; Stromberg, J.C. The Natural Flow Regime. Bioscience 1997, 47, 769–784. [Google Scholar] [CrossRef]
  37. Yamamoto, E.; Goto, A.; Nakaya, K.; Amaoka, K. Aquatic Insect Fauna and Feeding Habits of Two Cottus Species in the Daitobetsu River of Southern Hokkaido. Bull. Fac. Fish. Hokkaido Univ. 1988, 39, 237–256, (In Japanese with English Abstract). [Google Scholar]
  38. Brittain, J.E.; Eikeland, T.J. Invertebrate Drift—A Review. Hydrobiologia 1988, 166, 77–93. [Google Scholar] [CrossRef]
  39. Gibbins, C.N.; Vericat, D.; Batalla, R.J. Relations between Invertebrate Drift and Flow Velocity in Sand-Bed and Riffle Habitats and the Limits Imposed by Substrate Stability and Benthic Density. J. N. Am. Benthol. Soc. 2010, 29, 945–958. [Google Scholar] [CrossRef]
  40. Jiménez-Valverde, A.; Lobo, J.M. Threshold Criteria for Conversion of Probability of Species Presence to Either–or Presence–Absence. Acta Oecol. 2007, 31, 361–369. [Google Scholar] [CrossRef]
  41. Manel, S.; Williams, H.C.; Ormerod, S.J. Evaluating Presence–Absence Models in Ecology: The Need to Account for Prevalence. J. Appl. Ecol. 2001, 38, 921–931. [Google Scholar] [CrossRef]
  42. De Chazal, J.; Rounsevell, M.D.A. Land-Use and Climate Change Within Assessments of Biodiversity Change: A Review. Glob. Environ. Chang. 2009, 19, 306–315. [Google Scholar] [CrossRef]
  43. Mantyka-Pringle, C.S.; Martin, T.G.; Moffatt, D.B.; Linke, S.; Rhodes, J.R. Understanding and Predicting the Combined Effects of Climate Change and Land-use Change on Freshwater Macroinvertebrates and Fish. J. Appl. Ecol. 2014, 51, 572–581. [Google Scholar] [CrossRef]
Figure 1. The locations of the study sites in the three studied catchments. In the Tokachi and Chitose river catchments, the black circles indicate the occurrence survey sites. In the Sorachi river catchment, the gray and black circles indicate the sites for only the abundance survey and both the abundance and occurrence surveys, respectively.
Water 13 00975 g001
Figure 2. Combined effects of the mean summer water temperature and mean current velocity on the abundance of C. nozawae (n/100 m2). The black circle indicates the observed value for each study site. The blue, red and black lines indicate the predicted values at high (1.0 m/s), moderate (0.7 m/s) and low (0.5 m/s) current velocities, respectively. These velocities correspond to the 10th percentile, median and 90th percentile, respectively.
Water 13 00975 g002
Figure 3. The relationship between the mean summer water temperature and the probability of C. nozawae occurrence. The black circles and line indicate the observed data and the predicted probability, respectively. The final model yielded an R2 of 0.45 and an area under the receiver operating characteristic curve (AUC) of 0.89.
Water 13 00975 g003
Table 1. Results of analyses for variable selection. Variables used in the statistical analyses are shown in bold. AIC indicates Akaike’s information criterion.
VariableAIC
(Abundance)
-Temperature-
Mean summer water temperature241.47
Maximum summer water temperature245.34
-Substrate-
Proportion of large substrate247.97
Proportion of small substrate248.01
(Occurrence)
-Temperature-
Mean summer water temperature43.01
Maximum summer water temperature49.41
Table 2. Results of model selection for the abundance analysis. The top three models are shown. “Temp”, “Velocity”, and “Substrate” represent the mean summer water temperature, mean current velocity, and proportion of large substrates, respectively. “Temp * Velocity” indicates the interactive term between the mean summer water temperature and the mean current velocity. “df”, “∆AIC” and “Weight” indicate the degrees of freedom, delta Akaike’s information criterion, and Akaike weight, respectively. Plus and minus symbols indicate positive and negative estimated coefficients, respectively.
VariablesdfAIC∆AICWeight
−Temp + Velocity + Temp × Velocity5232.60.00.3
−Temp + Velocity4234.92.30.1
−Temp + Velocity + Temp × Velocity + Substrate6235.52.90.1
Table 3. Results of model selection for the occurrence analysis. Models with ∆AIC < 2 are shown. “Temp”, “Area”, “Slope”, “Catchment”, and “Farmland” represent the mean summer water temperature, survey area, stream slope, catchment size and proportion of farmland, respectively. “Temp * Slope”, “Temp * Catchment”, and “Temp * Farmland” indicate the interactive terms between the mean summer water temperature and other environmental factors. “df” and “Weight” indicate the degrees of freedom and Akaike weight, respectively. Plus and minus symbols indicate positive and negative estimated coefficients, respectively.
VariablesdfAIC∆AICWeight
−Temp + Area − Catchment −Temp × Catchment542.60.00.06
−Temp + Area − Catchment442.60.00.06
−Temp + Area − Slope − Catchment542.80.30.05
−Temp243.00.50.05
−Temp − Slope + Temp * Slope443.50.90.04
−Temp + Area − Slope − Catchment − Temp * Catchment643.50.90.04
−Temp −Slope343.61.10.03
−Temp + Area − Catchment + Farmland − Temp * Farmland643.81.30.03
−Temp + Area343.91.30.03
−Temp − Slope − Catchment444.01.40.03
−Temp + Area − Catchment − Farmland − Temp * Catchment644.01.50.03
−Temp + Area − Slope − Catchment + Temp*Slope644.11.50.03
−Temp + Area − Slope − Catchment + Farmland − Temp * Farmland744.21.60.03
−Temp − Catchment344.31.70.02
−Temp + Area − Slope − Catchment − Farmland644.41.80.02
−Temp + Area − Catchment − Farmland544.51.90.02
Table 4. Estimated parameters of each variable obtained by model averaging for the occurrence models. “Temp”, “Area”, “Slope”, “Catchment”, and “Farmland” represent the mean summer water temperature, survey area, stream slope, catchment size and proportion of farmland, respectively. “Temp * Slope”, “Temp * Catchment”, and “Temp * Farmland” indicate the interactive terms between the mean summer water temperature and other environmental factors. Influential variables (i.e., the variables for which the 95% confidence intervals (CIs) did not include 0) are shown in bold.
Variable95% CIs
Temp−3.7-−0.5
Area−0.6-3.4
Slope−1.7-0.5
Temp * Slope−0.6-2.1
Catchment−2.9-0.6
Temp * Catchment−5.5-1.9
Farmland−1.4-1.5
Temp * Farmland−3.6-0.9
Publisher’s Note: MDPI stays neutral with regard to jurisdictional claims in published maps and institutional affiliations.

