Article

Influent with Particulate Substrate, Clean, Innocuous and Sustainable Solution for Bulking Control and Mitigation in Activated Sludge Process

by
Pedro Cisterna-Osorio
*,
Claudia Calabran-Caceres
,
Giannina Tiznado-Bustamante
and
Nataly Bastias-Toro
Department of Civil and Environmental Engineering, University of Bío-Bío, Avenida Collao 1202, Casilla 5-C, Concepción 378000, Chile
*
Author to whom correspondence should be addressed.
Water 2021, 13(7), 984; https://doi.org/10.3390/w13070984
Submission received: 22 February 2021 / Revised: 25 March 2021 / Accepted: 27 March 2021 / Published: 2 April 2021
(This article belongs to the Special Issue Innovative Technologies for Wastewater and Water Treatment)

Abstract

:
This research studies the incidence of the type of substrate, soluble or particulate, in the emergence, development, and inhibition of bulking in activated sludge systems. It was evaluated using the sludge volume index (SVI), mixing liquor-suspended solids (MLSS), microscopic analysis of biomass, and effluent suspended solids (ESS). In the first experiment, four sequencing batch reactors (SBRs) were fed with soluble substrate at a fixed mass, while the mass of the particulate substrate varied, as those (saccharose mass/flour mass) ratios were 3:1, 3:2, 3:3 and 3:4., with a deficit ranging from 20 to 30% compared to the ratio recommended. The four SBRs have similar MLSS, IVL, and ESS. From day 30, with a deficit from 80 to 90%, the influents have ratios 1/1 and 1/2 until 48 days. The SBRs present IVL between 600 and 730 mL/g and ESS from 370 to 440 mg/L; unlike influents with ratios 1/3 and 1/4, they present IVL between 170 and 185 mL/g, and ESS from 260 to 270 mg/L. The favorable effect of particulate matter is categorical. In the second set of experiments, two SBRs were studied: SBR 1 fed with saccharose, and SBR 2 with flour; there is a lack of nutrients causing bulking in SBRs. Once the nutrient deficiency condition is changed in day 11 to excess, after 22 days, the SVI was 190 mL/g, ESS was 360 mg/L, and MLSS was 2000 mg/L for influents with saccharose; the influent with flour, with an SVI of 80 mL/g, ESS of 100 mg/L, and MLSS of 4000 mg/L, shows faster and more consistent recovery with the particulate substrate. Therefore, the proposal is to add particulate substrate-like flour to active sludge plants facing bulking. It is a clean, innocuous and sustainable alternative to processes that use chemical reagents.

1. Introduction

Activated sludge is one of the most used processes in the elimination of organic matter contaminants from urban and industrial wastewater. A frequent problem in the operation of activated sludge systems is bulking [1,2]. When this problem occurs, the biomass sediments slowly and inefficiently compact, affecting the quality of the effluent [3]. Detection methods are important tools in monitoring the process of the wastewater treatment plant to avoid bulking in activated sludge. These are applied in different investigations to estimate the sedimentation problems found in activated sludge wastewater treatment plants, with adequate results using different tools [4,5]. Additionally, this research develops a proposal that mitigates bulking in a short period, which is essential because the aim of this intervention is to solve the unusual condition of activated sludge treatment at a plant (effluent treatment plant); it is not a permanent operational condition.
The causes of bulking are usually a lack of nutrients, oxygen, and a low organic load ratio. The consequences of bulking are the contamination of water courses, which may lead to their failure to comply with current sanitation regulations [6].
Differences have been found in the floc biology of samples received from plants treating domestic wastewater and industrial wastewaters. In the first case, flocs were dominated by two filament types. The biomass of industrial wastewater showed much greater filament diversity, with eight filament types routinely observed [7].
In the above process, controlling the growth of filamentous bacteria achieves a better quality of effluent because the filamentous morphology increases the suspension particles [8,9,10]. Although various factors favoring the growth of filamentous microorganisms have been mentioned, the proliferation of filamentous bacteria can depend on factors such as the massive entry of easily assimilable substrate [11]. For example, dairy wastewater filamentous bacteria are fostered by the presence of high levels of lactose [12].
On the other hand, based on microscopic inspection, it has been demonstrated that the sludge volume index (SVI) is linked to the floc structure in active sludge systems [13] and with the content and composition of filamentous bacteria used in bulking tests [14]. There are automated methods based on the analysis of macro- and meso-scale images to characterize activated sludge in terms of size and shape [15,16,17]. The application of the image analysis of activated sludge biomass was explored for the monitoring and detection of filamentous bulking [18,19]. Image analysis was used to provide morphological data treated by partial least squares regression (PLS), which shows a close correlation between the filamentous bacteria and the SVI [20]. It has also been reported in the literature [1] that an SVI between 75 and 125 mL/g is characteristic of a sludge consisting of compact and sedimentable flocs with a balanced ratio between the number of floc formers and the filamentous microorganisms. With deficient sedimentation of the biological sludge, it is indicated that a high SVI (>150 mL/g) results in serious problems in the separation of solids of the aqueous phase [21,22]. Strategies to address the sludge sedimentation problem in activated plants are classified as curative, aimed at modifying the problem effects; and preventive, which aim directly at correcting the causes, and therefore the biomass type production [23].
Different investigations have addressed the causes of the increase in bulking in an attempt to solve the problem without chlorination. In activated sludge systems applied in the treatment of food industrial wastewaters, one procedure that has been applied to solve the bulking problem is chlorination, which is environmentally harmful. Chlorination is the most economical, non-specific method to control the excessive growth of filamentous microorganisms causing bulking [24]. A concentration of 25 mg/L in this process showed a positive effect; the total suspended solids of the return sludge showed values of 4933 mg/L and a settled volume of 947 mL/L, whereas the control was 943 mL/L. This concentration helps the sedimentation of sludge but affects the activities of other microorganisms [25]. For a safer determination of the most effective chlorine dose against bulking that is also protective of the microbial activity of the sludge, studies suggest coupling the live/dead stain with the nucleic acids (NA) test and/or the oxygen uptake rate (OUR) test [26].
Another chemical alternative is the addition of mineral talc to activated sludge for the treatment of paper mill effluents, and its effect on settlement characteristics has been investigated. One laboratory study and a full-scale investigation on a wastewater treatment plant (WWTP) with an equivalent population capacity of 500,000 have been carried out using this mineral. The sludge in the WWTP was filamentous and had sludge volume index (SVI) values in excess of 250 mL/g. The talc reduced SVI values by 38% and improved the total suspended solid concentrations by 86% [27]. When sedimentation problems occur in the activated sludge system, organic polymers and metallic salts are added to revert low sedimentability [28]; the activated sludge flakes are negatively charged; with the addition of metallic salts, cations bind to negative charges, which consolidates flaking [29], and for one of the most filamentous filaments, Microtrix parvicella, a dose of two to three grams of Al/day/kgMLSS of polychloride aluminum is recommended [30].
Another solution would be to have a pool of lytic bacteriophages, which can control the growth of all known filamentous bacteria that can cause bulking [31].
There are studies that have subjected the activated sludge system to a deficiency or limitation of nutrients (nitrogen and phosphorus) to evaluate the nutrient incidence in sedimentation of sludge [32]. Other studies point to the incidence of the type of substrate where, for example, it has been found that the total length of the extended filaments decreased and the sludge settling improved significantly after the soluble substrate was changed to particulate substrate [33].
It has also been found that the starch-enriched system has better sludge decantation than the glucose-enriched system [34]. Filamentous bulking control strategies have been critically reviewed and discussed. Additionally, future studies are proposed with the aim of developing effective and specific control strategies for filamentous sludge bulking [35].
The objective of this research is the study of activated sludge process behavior against different types of substrate, saccharose and flour, and to compare the incidence of these substrates with the development of bulking. In the first experiment, four sequencing batch reactors (SBRs) were simultaneously fed, each one with a determined mix of soluble and particulate substrate; the ratios [saccharose mass (Ms)/flour mass (Mp)] were 3:1, 3:2, 3:3 and 3:4. This first experiment was complemented with the implementation of two SBRs, where each one worked exclusively with the substrate type, soluble or particulate, under conditions of deficit or excess nutrients.
According to the results, depending on the type of substrate, a new procedure is proposed to reverse bulking in activated sludge plants. This technological response is based on feeding the activated sludge plant with particulate substrates, in this case, wheat flour, thereby enhancing the growth of floc-forming bacteria.
Strategies applied to address sedimentation problems in activated sludge plants are based mainly on physicochemical processes, where this research works and proposes a biochemical solution based on the substrate nature. According to studies, the particulate substrate, flour, generates favorable competitive conditions for the growth of floculent biomass with respect to the filamentous one. Particulate substrate feeding and the preferential growth process of floculent biomass is carried out in one of the phases of the activated sludge process, the aeration, without resorting to the external selector tank as other biochemical solutions do.

2. Materials and Methods

The aspects related to the materials and experimental methodology applied in this research are described below.

2.1. Analytical Methods and Monitoring Parameters

The following parameters were measured with their corresponding methods: total suspended solids (TSS) and sludge volume index (SVI). TSS was determined by filtering a known volume of the sample on Whatman (Whatman plc, Maidstone, UK) 4.7 cm GF/C glass fiber filters and then drying it at 103 to 105 °C. The difference in weight of the filter before and after filtration was used to estimate the Total suspended solids (TSS) with the 209C method [36]. For the sludge volume index, method 213E was used [32].

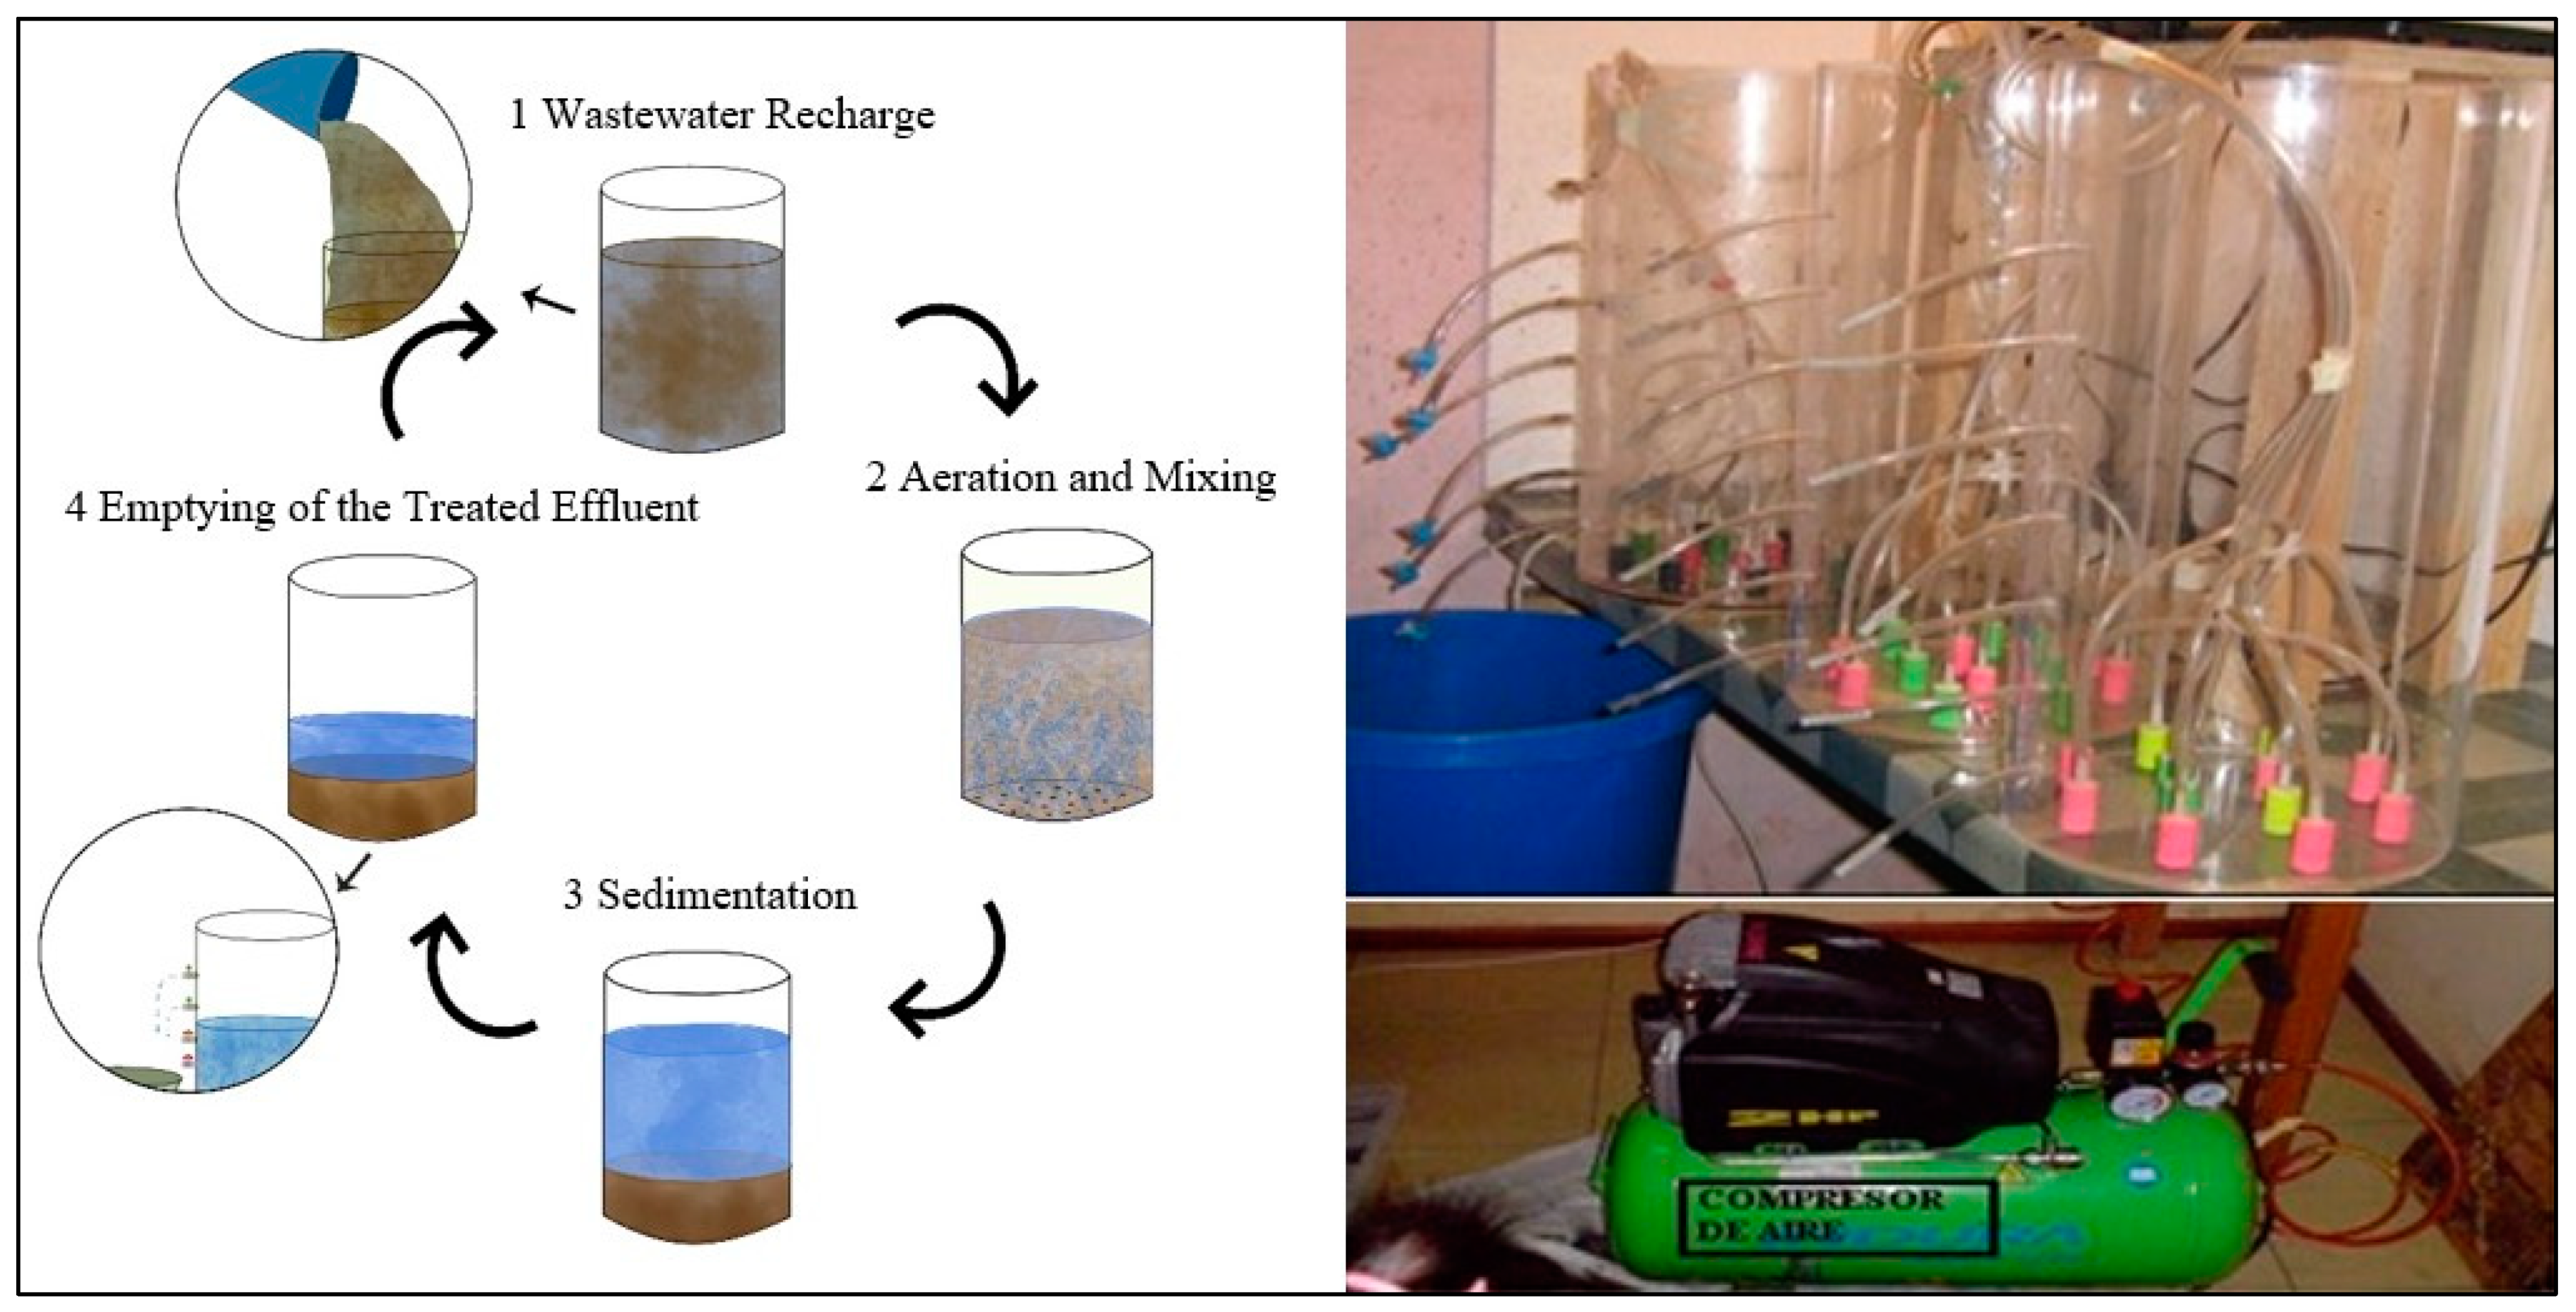
2.2. Description of Experimental Equipment: Bench-Scale Activated Sludge Reactors

The biological treatment of wastewater with saccharose and flour was carried out in bench-scale activated sludge reactors.
The laboratory-scale sequential batch reactor systems consisted of transparent acrylic tanks of 45 cm length and 20 cm internal diameter, with holes to the side that facilitated the extraction of the effluent. For the aeration system, an air compressor and fine bubble diffusers were used.
Diffusers were distributed at the bottom of each reactor so as to maintain the necessary conditions for biodegradation. The air was conducted by a system of hoses and valves. The tanks were provided with outputs at different heights, which were closed and open only when removing treated water. The outputs are related to specific volumes of water to remove; they were gradually opened starting with 8 L exit, then 6 L, and the exit with a height equivalent to 4 L was the last one to be opened. The initial volume was 10 L. The new load of synthetic wastewater was prepared in the auxiliary tank, which was manually raised, turned over, and poured in waterfall mode into the corresponding reactor. (Figure 1).

2.3. Experimental Methodology

The biomass used for the experiment was obtained from Bio-Bio’s Urban Wastewater Treatment Plant, located in Hualpen, Chile, belonging to the ESSBIO S.A. company.
The synthetic wastewater was prepared daily and deposited in a 10 L storage and homogenization tank, where a stirrer was installed to disperse the substrates. The average temperature and dissolved oxygen range were 18 °C and 2 to 3 mg/L, respectively. The presence of oxygen dissolved in the process at the stage of aeration indicates that the microorganisms are in an optimal environment for their growth and development. For the correct operation of the activated sludge system, the dissolved oxygen concentration was controlled daily using a YSI 550 oxygen meter. It was defined as an objective that the range should remain within the recommended parameters. Both variables are measured by introducing the probe-electrode of the YSI 550 equipment in the SBR tank.
The pH in a biological treatment must oscillate between 6 and 8 pH to guarantee the survival of the microorganisms. During the experiments, we worked within the recommended range, 6.5 to 7.5 pH.
The synthetic wastewater used as an affluent consisted of particulate substrate, flour, soluble substrate, saccharose, and nutrients nitrogen (N) and phosphorus (P). The amount of N and P added to SBRs to achieve the proportions of nutrients to be used was decided considering the optimal reference of ratio P/N/C = 1:5:100 for biodegradation processes [37,38]. When carrying out experimental work, the relationship of P:N:C is modified with respect to the optimum, which means, according to work scenarios, a deficiency or excess of nutrients.
The C:N:P ratio calculated was based on stoichiometric estimations knowing the components and molecular formula corresponding to flour and sucrose substrates. Nitrogen was obtained by ammonium chloride (NH4Cl) and phosphorus by sodium tripolyphosphate (Na5P3O10).
A very long sedimentation time occurred when the work condition was under nutrients deficiency; therefore, denitrification also contributes to create an environment lacking in nitrogen, which is the operational objective. Under working conditions with the availability of nutrients, the load is equivalent to 2.6 to 2.8 times the required amount. Therefore, there is an environment with a considerable excess of nitrogen supporting denitrification, while the mass load of work is lower in this experience, which mitigates the denitrification process with respect to experiments with higher mass loads. This operational condition, a long sedimentation time, was considered in the analysis of the results and eventual impact.
Work with limiting reagent as a reference in the P:N:C ratio, which in this case corresponds to phosphorus, P, since the proportions of these two elements, nitrogen and phosphorus, are different in the flour.
Work with a mass load range from 0.2 to 0.5 kg COD/d/kg MLSS for first experiment and from 0.1 to 0.2 kg COD/d/kg MLSS for the second the range.
This study did not take into account the excess sludge removal (it means SRT variable values). This will be considered in future research.

2.3.1. First Experiment: SBRs Influent with Constant Saccharose Load and Incremental Flour Load, under Nutrient Deficit

Samples were taken every two days to assess the concentrations of effluent suspended solids (ESS) and mixing liquor suspended solids (MLSS) for each of the reactors. These values determine the quality of the effluent under the different conditions of work. Furthermore, the sedimentation was assessed by sludge volume index (SVI) assays.
For the preparation of the four reactors, 4 L of mixed liquor with a concentration of 5000 mg/L of TSS (depurator biomass), obtained from the Bio-Bio’s Urban Wastewater Treatment Plant, was added, followed by the addition of 6 L of synthetic wastewater composed of flour, sugar and nutrients, reaching a constant volume of operation of 10 L. The same mass of sugar and different mass quantities of flour were added to each tank reactor in order to assess the impact of flour in the system.
The experimental cycle consisted of 18 h of aeration and 6 h of sedimentation approximately. After the treatment was performed, a volume of 6 L of treated water was withdrawn, the synthetic wastewater was introduced and the procedure was started again, loading equal volume. Six liters of clarified water was evacuated daily, and the reactors were refed with another 6 L of synthetic wastewater.
Work was conducted under two experimental conditions with regard to the contribution of nutrients. In the first stage, there was a deficit nutrient contribution that corresponded to 70% of the recommended load, based on the ratio C/N/P = 100:5:1, and in the second stage, there was no nutrient contribution. (Table 1).
In the second stage, these nutrients were completely eliminated. This stage began at day 31, and the duration of this stage was 18 days.

2.3.2. Second Experiment: SBRs Influent with Single Substrate, Sugar or Flour, under Deficit and Excess of Nutrients

In this experiment, the preparation of two reactors was carried out with a constant volume of operation of 10 L. Only one substrate type was added to each tank reactor. A concentration of sugar in reactor 1 and the same concentration of flour in reactor 2 was added in order to assess the differential impact according at the substrate. Experimental SBRs cycle is the same as the first experiment.
Work was conducted under two experimental conditions with regard to the contribution of nutrients. The nutrients, nitrogen and phosphorus, were added at 0.1% and 0.5% concentrations with respect to the carbon mass in the first stage (30 days) of experiment 2, and in the second stage, there was an excess nutrient contribution based on the ratio C/N/P = 100:5:1. (Table 2).
The experimental stage took place over a period of 34 calendar days. The system operated 24 h a day, performing cycles of filling, aeration, sedimentation, and emptying. The SBR system used two reactors, which allowed experimentation with different dosages.

3. Results and Discussion

3.1. Differential Effect of the Particulate Substrate in the Effluent in the Development of Bulking

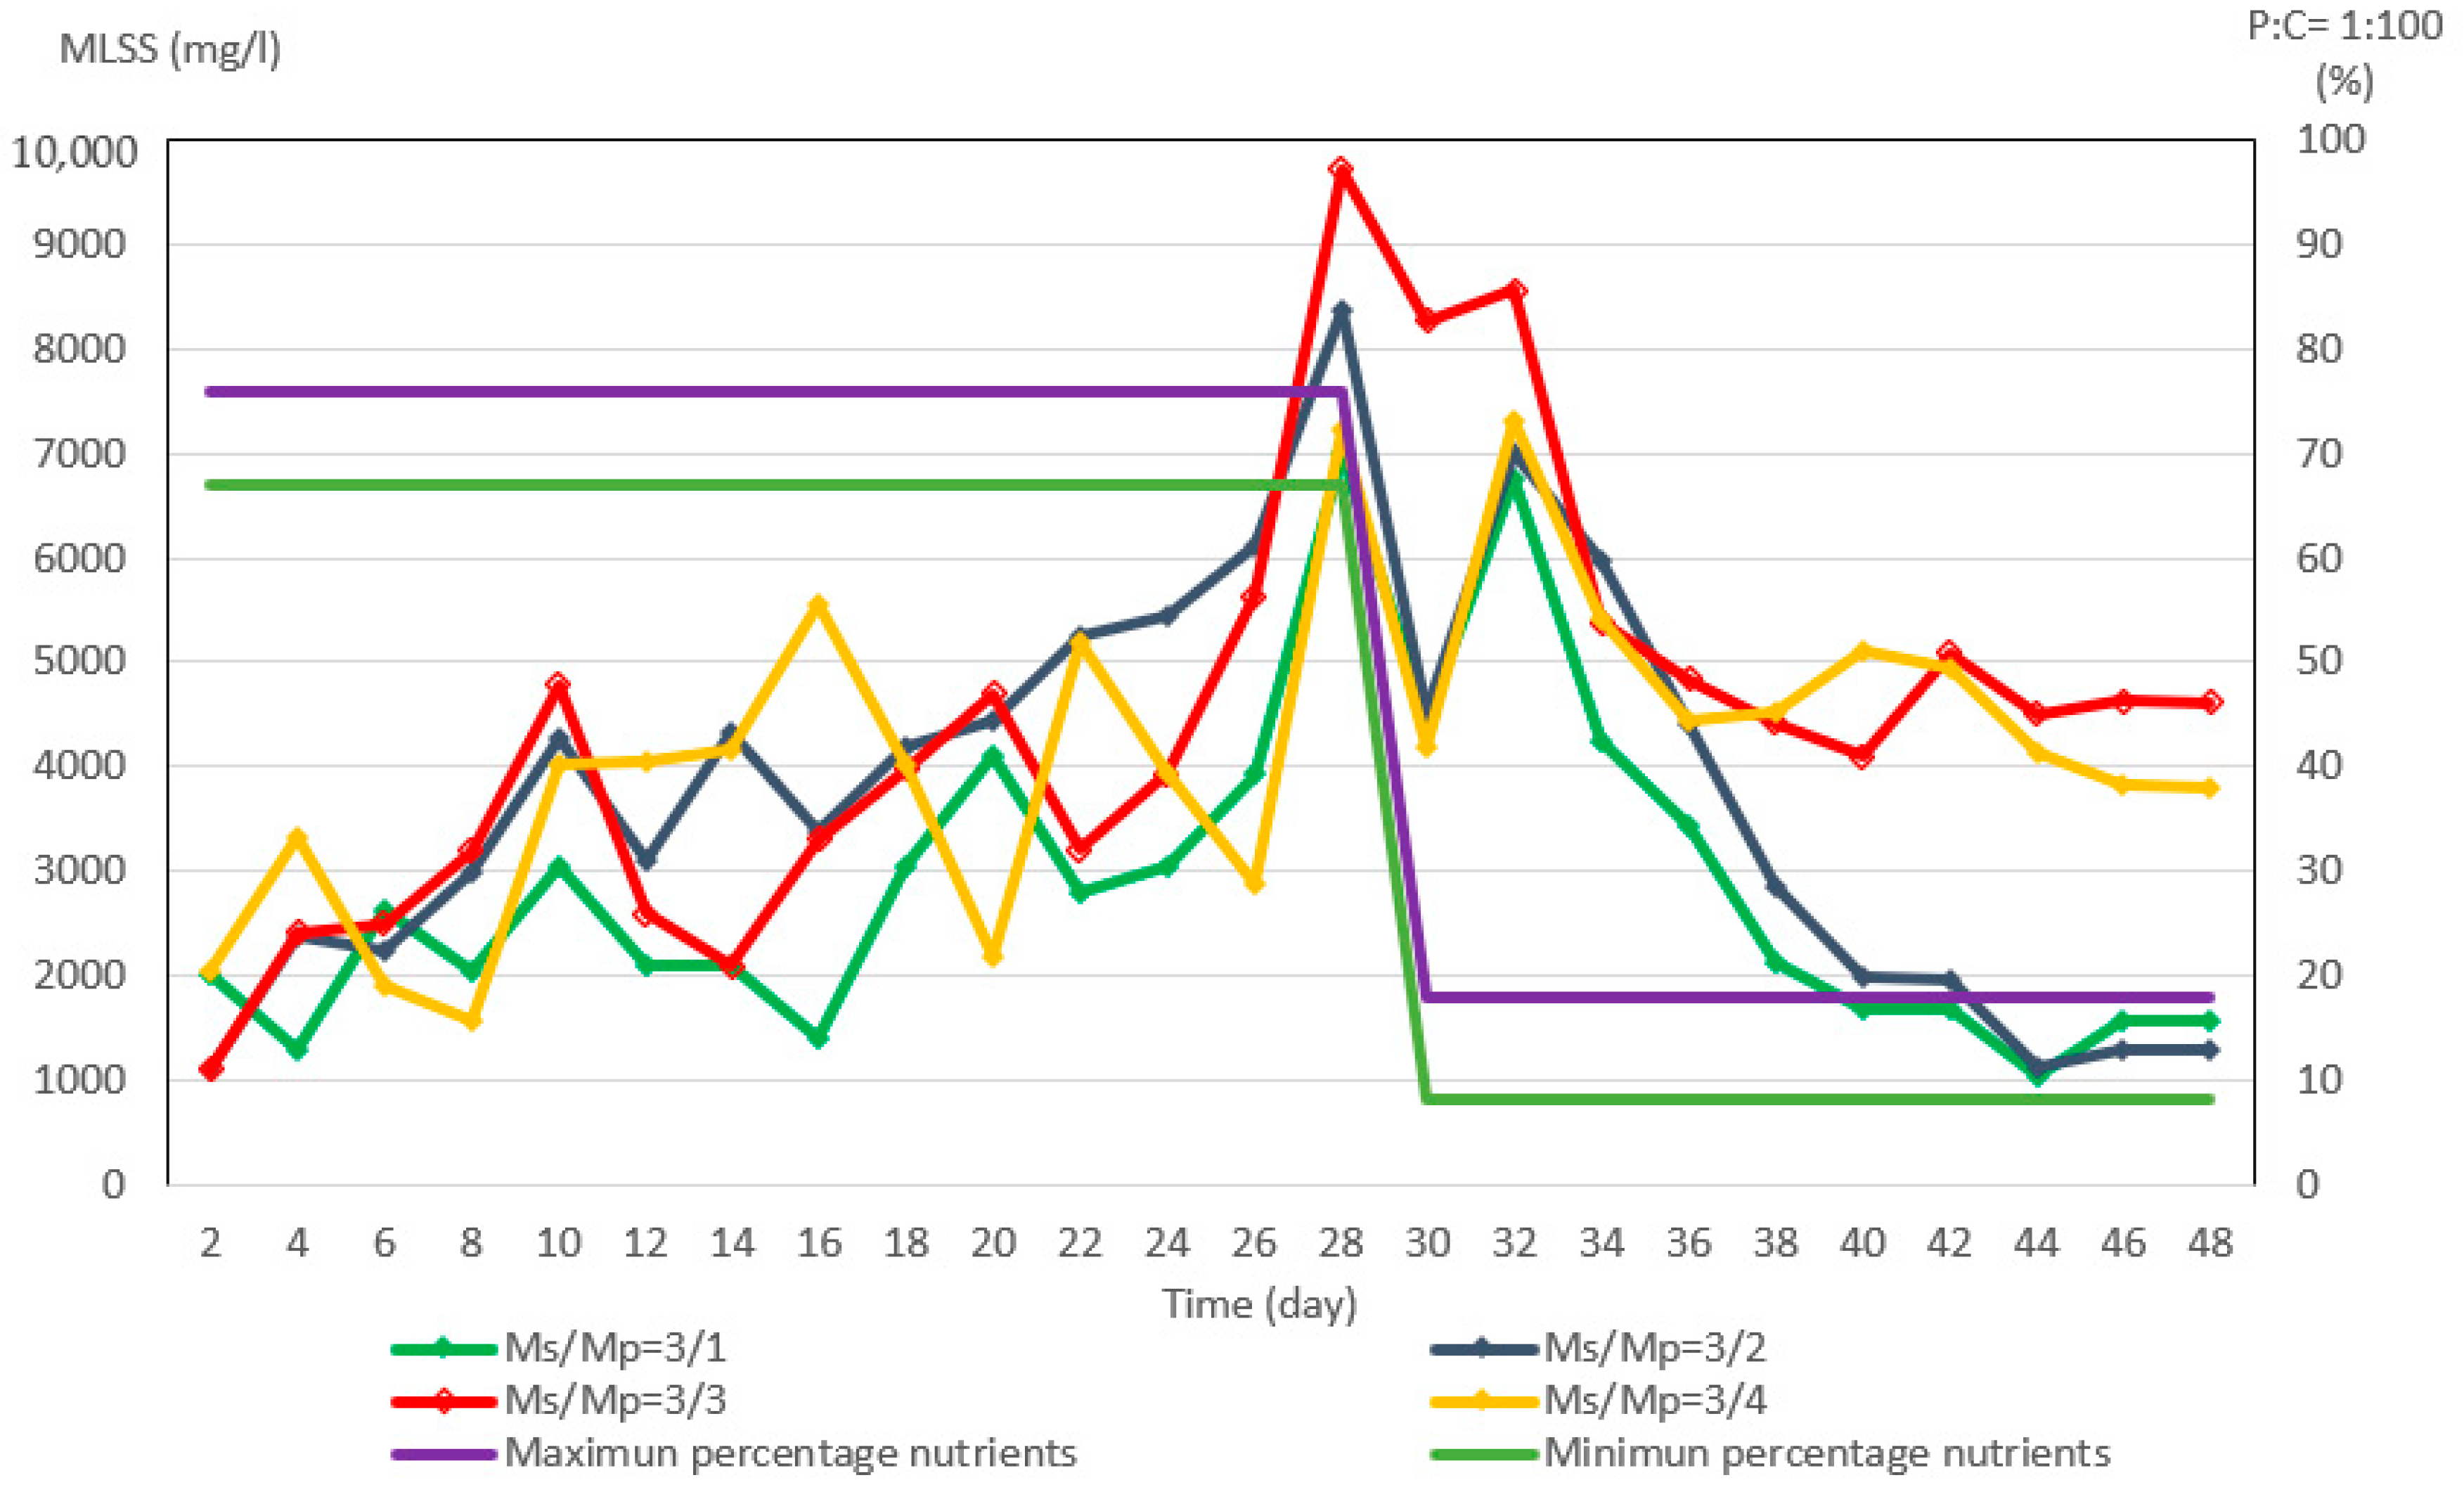
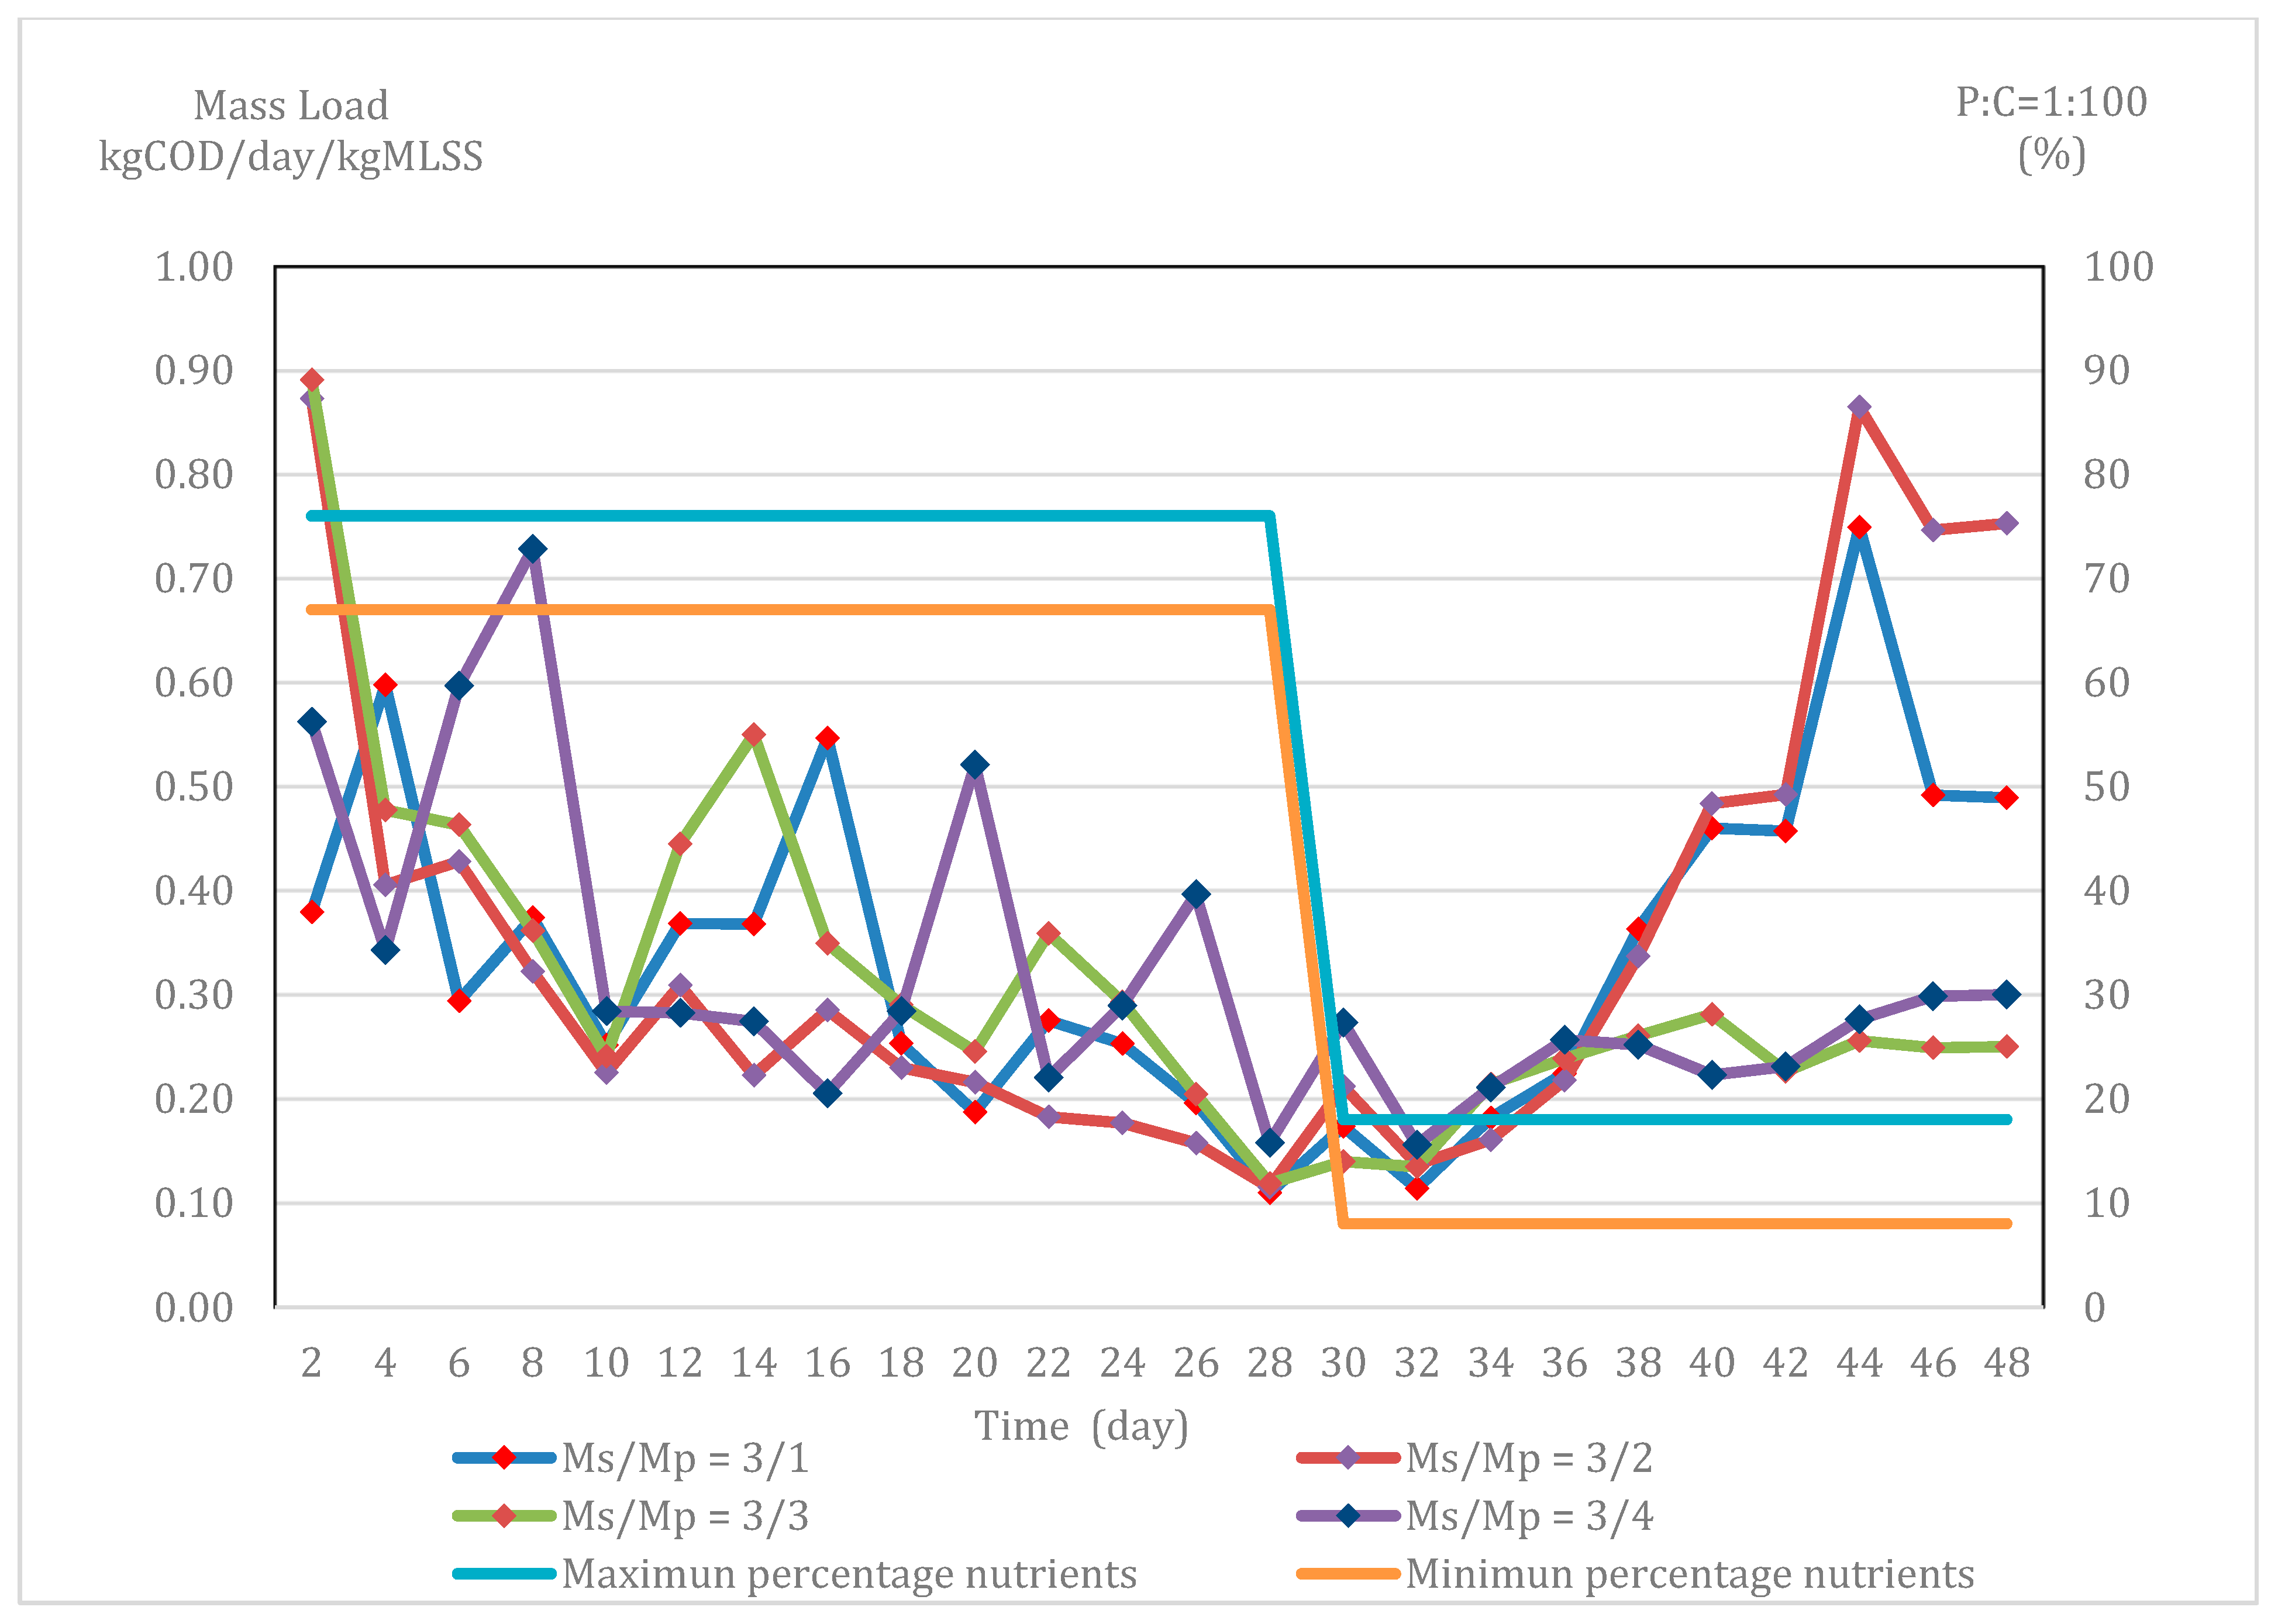
3.1.1. Biomass Quantitative Behavior

Figure 2 compares the quantitative biomass behavior (MLSS) for each of the reactors. The behavior of the four reactors was relatively similar during the first 29 days of the experiment, under conditions of 70% nutrients. The four reactors present similar MLSS curves, increasing gradually. Initially, the MLSS values were between 1000 and 2000 mg/L and reached 7000 to 9000 mg/L by day 30. On the 29th day, an operational situation of the four reactors without the contribution of nutrients began, and a consequence, MLSS values of reactors 3 and 4 decreased by a greater magnitude with respect to reactors 1 and 2. This difference is associated with the relative percentage of particulate matter in the reactors.
The greatest biomass increases in the aeration tank that treats the affluent with flour, compared to the one containing saccharose, is due to a greater percentage of biomass generated by particulate substrate remains in the aeration tank as a result of lower biomass leakage through the effluent due to better sedimentability. The flour substrate enhances the flocculent biomass growth because it sets a higher contact surface with flour particles for bioadsorption and later biodegradation, resulting in greater growth of flocculent biomass with respect to filamentous biomass. Flocculent biomass is more competitive than filamentous biomass when biodegrading flour.
In the other investigation, the effect of filamentous bulking sludge on the simulated plant-wide WWTP control strategies was studied using the IWA Benchmark Simulation. As a consequence, there was a lower TSS concentration in both return and waste flow, less biomass in the bioreactors and a reduction in the TSS removal efficiency [35]. This coincided with the use of saccharose, confirming that the soluble substrate powers the bulking.

3.1.2. Sedimentation of Biomass

In Figure 3, the SVI evolution can be observed for each of the reactors. The behavior of the four reactors was quite similar during the first 30 days of the experiment. All of them were kept under 150 mL/g, with reactors 3 and 4 having the lowest SVI values. After day 30, the SVI increased in the four reactors, and the maximum SVI reached during this period was 800 mL/g, corresponding to reactor 1 being fed with a significant percentage of saccharose. Reactors 3 and 4 have better sedimentation, and they present minor 4VI values with respect to reactors 1 and 2, equally associated with the greater relative percentage of particulate substrate. On the other hand, in the experiment with fats and oils, a higher amount of saccharose led to a synergistic effect that enhanced the growth of filamentous bacteria, reaching an SVI of 300 mL/g. When the percentage of sunflower oil increased in the influent, the SVI began to decrease until it reached a value close to 100 mL/g [36].

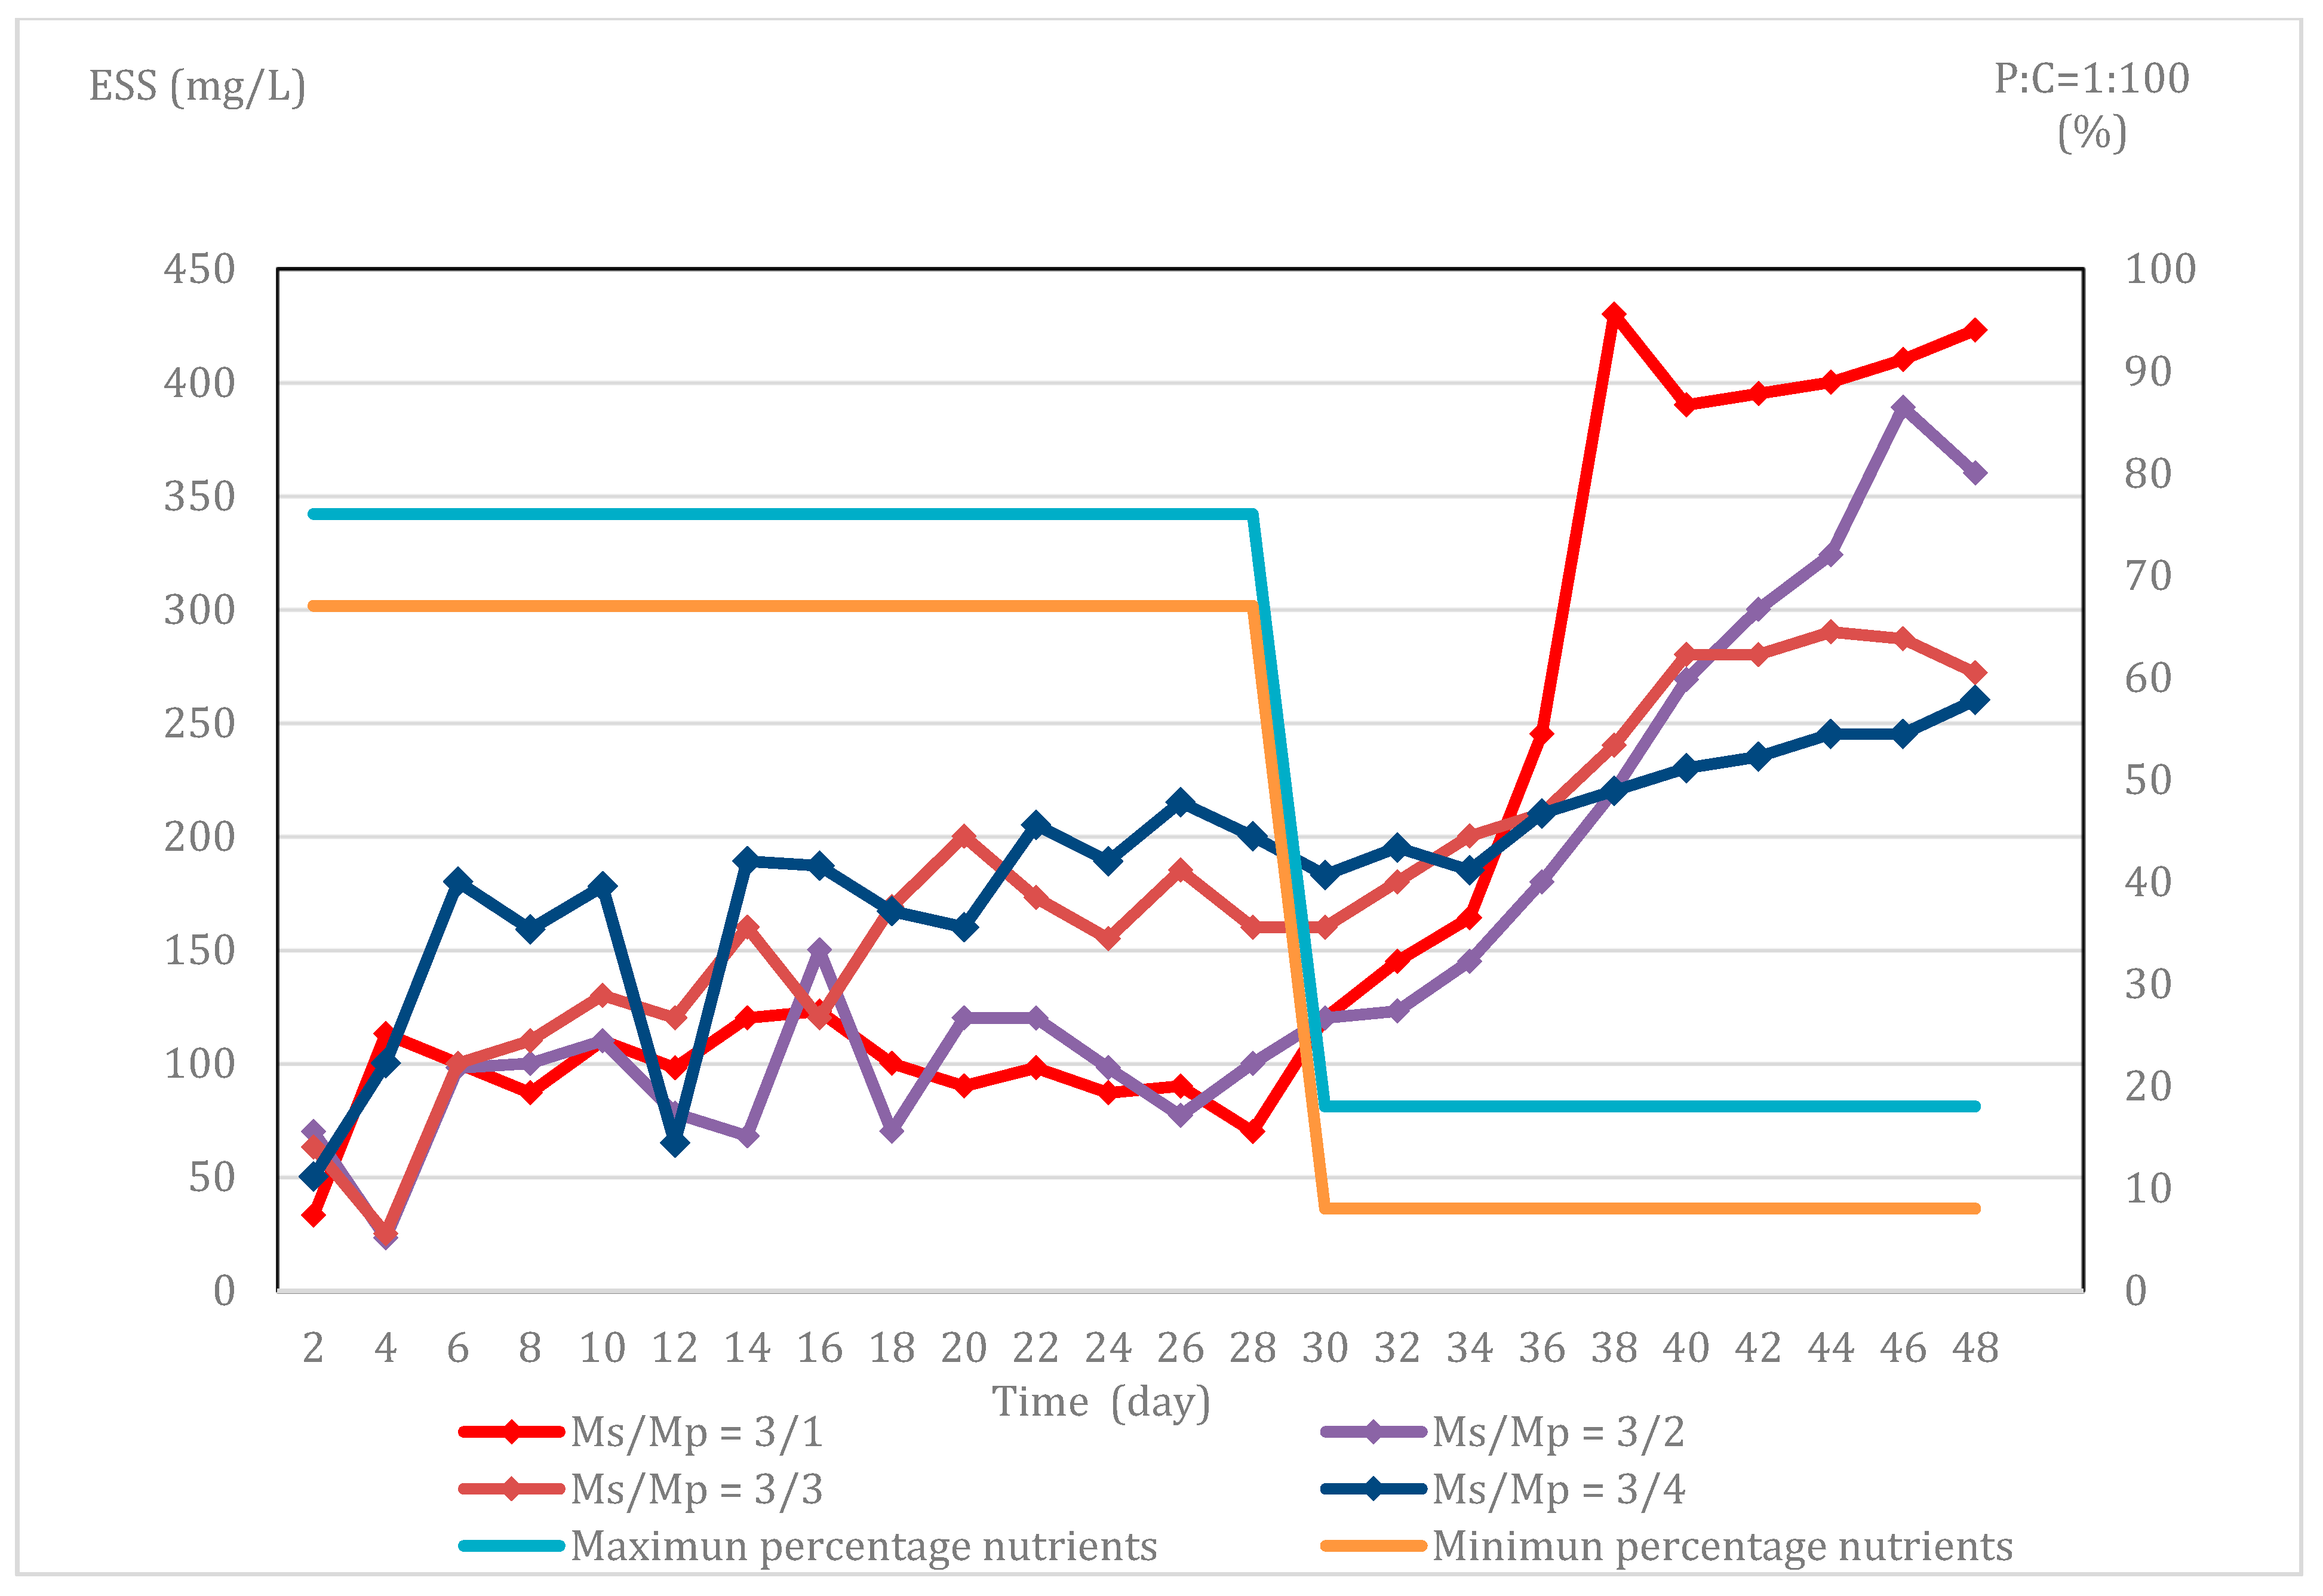
3.1.3. Effluent Quality

The quality of the effluent is closely linked to the load of pollutants; bulking causes a poor sedimentation of the biomass, which increases the solids in the effluent and also the COD and BOD, thereby increasing the environmental impact on water courses in which treated water is discharged.
Figure 4 shows the evolution of the ESS in the reactors with a lower organic input load and a higher proportion of saccharose, showing a categorically greater increase starting from day 30, which corresponds to the operating period without nutrient input. This parameter also shows the effect of the soluble substrate on the proliferation of filamentous bacteria, which are expulsed by the effluent.
Once the air intake to the system was controlled, the measurement of the parameters was continued. Until day 30 of the experiment, changes were observed in the monitored parameters in all reactors. A decrease in the MLSS and an increase in the SVI were verified, which indicated the presence of bulking.
Figure 5 shows that the mean value of mass loading (ML) is higher than 0.2 (kgCOD/d/kgMLSS) in different SBRs when the nutrient availability is about 70% of recommended value; in any case, there is a decrease in ML, reaching a mean ML value of 0.15 (kgCOD/d/kgMLSS), which indicates that the biomass leakage is controlled. When the nutrient-deficient situation begins, it is observed that all SBRs increase in ML, due to there being biomass leakage through the effluent. Therefore, the biomass decreases, being of greater magnitude for those SBRs fed with higher sugar content, opposed to those fed with higher flour content, which is more stable, indicating that the particulate substrate mitigates the impact on ML and ESS, which is due to the controlling role of the particulate substrate against bulking.

3.2. Comparative Effects of the Type of Substrate in the Control and Elimination of Bulking in Activated Sludge Systems

Using the results obtained in the first experiment, experimental work was carried out under the condition of a total lack of nutrients during the first 12 days, with the objective of generating bulking. From day 12, in the study with optimal nutrient conditions, in both situations, saccharose was used as a carbon source in reactor 1, and flour was used in reactor 2. The responses of the active sludge system of the SBR type were evaluated and compared. The parameters monitored were SVI, MLSS, and ESS.
Regarding the nutritional ratio, the system was subjected to a nutritional deficiency of 90% of nitrogen (N) and phosphorus (P), considering the optimal ratio. The ratio of C/N/P = 100:0.5:0.1 over 12 days enhanced the development of bulking. We then used N and P in excess of the optimal ratio (C/N/P = 100:12.5:2.5) [39,40]. Complementary N was obtained by ammonium chloride (NH4Cl) and P by sodium tripolyphosphate (Na5P3O10).

3.2.1. Biomass Quantitative Behavior

Figure 6 shows the quantitative biomass behavior using the parameter MLSS in the two reactors, both starting with a similar initial value of MLSS. In the initial period, with a lack of nutrients, it is pertinent to highlight that in the reactor fed with flour, the biomass increment was faster with the particulate substrate.
In the period of recovery of the system, under the nutrient load above the recommended level, the recovery of the tanks fed with flour was faster. The highest concentrations of MLSS were reached in reactor 2, fed with flour. The reduced amount of biomass lost to effluent is explained by and corroborated with the observed in S-34, Figure 7; the presence of a greater number of flocculating bacteria, compared with filamentous bacteria, is due to an adequate contribution of nutrients and particulate substrate.
The MLSS concentration of 4000 mg/L after 30 days in reactor 2, fed with flour, is clearly greater than that of reactor 1, fed with saccharose, which reached 2000 mg/L. This verifies the favorable impact of the particulate substrate in treatment wastewater in the activated sludge, since it is an occasional procedure to mitigate bulking and is expected to be treated in a short time.

3.2.2. Biomass Qualitative Behavior (Microscopy Analysis)

The monitoring of biomass by microscopic analysis is a rapid and accurate tool for controlling microbiological characteristic of biomass. Alternations of biomass characteristics can be easily observed with microscopy, helping to determine their cause and select an appropriate WWTP. Samples of the mixed liquor were taken for each of the reactors and were observed under a microscope in order to identify the morphology of the existing bacteria [41]. Bacterial colonies were photographed from the SBRs to roughly identify the types of microorganisms and flocculent bacteria and the presence of filamentous organisms.
The MLSS concentration of 4000 mg/L after 30 days in reactor 2, fed with flour, is clearly greater than that of reactor 1, fed with saccharose, which reached 2000 mg/L. This verifies the favorable impact of the particulate substrate in treatment wastewater in the activated sludge.
The samples (Figure 7) from the reactor S-21, fed with saccharose, were taken on day 21 and observed the existence of filamentous bacteria, but filamentous bacteria were not identified, corresponding to the results from the reactor fed with flour, F-21. On day 34, likewise, samples of the mixed liquor were taken for both reactors, and they were also observed under a microscope in order to identify the morphology of the existing bacteria. At day 34, the existence of filamentous bacteria persisted in reactor S-34, which was fed with saccharose. On the other hand, in reactor F-34, fed with flour, there was no presence of filamentous bacteria, and an increase in flocculating bacteria could be seen.
In Figure 8, it can be seen that the higher SVI corresponds to the systems fed with saccharose. Linking the above with Figure 7, it can be observed that there are filamentous microorganisms in the images S-21 and S34, corresponding to the reactors fed with saccharose. These results are coherent and complementary with other research; although a linear correlation was not found between SVI and the population of filamentous bacteria, it was verified that a greater population of filamentous bacteria was accompanied by higher values of SVI [42].

3.2.3. Biomass Sedimentability Behavior

Figure 8 shows the compared behavior of the SVI for reactors 1 and 2. In the first six days, reactor 2, with flour, was always above 100 mL/g, and in the remaining six days, it was above 150 mL/g. In the reactor with saccharose, until day eight, less than 100 mL/g was recorded, and from that point onwards, a sustained increase was observed that continued during the nutrient abundance stage. At day 32, after more than 20 days with an adequate nutrient load, the SVI was normalized. The maximum SVI for this reactor was 600 mg/L on day 19. In the system recovery stage, the SVI value of reactor 2, which used the flour substrate, decreased to less than 100 mL/g, which indicates that reactors fed with flour, the particulate substrate, tended to sharply increase the flocculant biomass. In a similar experiment, Micropowder (20 to 250 µm) made from ground dry sludge from a municipal sewage treatment plant was added to an SBR2. Compared with the traditional SBR1, the aerobic sludge granulation time was shortened by 15 days in the SBR2. Furthermore, filamentous bacteria in the bulking sludge were controlled to accelerate aerobic granulation and form large granules; the SVI decreased from 225 to 37 mL/g and the added micropowder acted as nuclei to induce bacterial attachment [43].
Considering a strategy validated in a WWTP, it was found that the SVI and filamentous abundance in winter were successfully controlled for two successive years at below 120 mL/g), when the sludge load was maintained at 0.14 ± 0.04 kg COD/d/kg MLSS, by adjusting sludge discharge, proving that this sludge-load-based strategy could be an efficient approach to control filamentous bulking; in our case [44], for the second experiment, the range of the mass load was from 0.1 to 0.2 kg COD/day/kg MLSS expanding the mass load range to 0.1 kg COD/d/kg MLSS due to the particulate substrate effect.

3.2.4. Effluent Quality

Figure 9 shows the compared behavior of suspended solids in the effluent (ESS) of each reactor. Both reactors showed initial values of ESS of less than 150 mg/L. In the nutrient deficiency phase, both showed a similar behavior, and the suspended solids of the effluent increased steadily until day 16. Once they began to operate with an adequate nutrient load, a marked difference was established between the reactors; the ESS of the reactor fed with saccharose reached up to 600 mg/L and maintained concentrations above 300 mg/L, which is consistent with the results of SVI and MLSS. The reactor fed with flour reached a peak value of 300 mg/L, and the concentration of ESS was maintained in the order of 150 mg/L, decreasing to values below 100 mg/L. The saccharose reactor shows the effect of bulking through the ESS concentration.
In summary, this chapter describes that SVI is much lower for flour than for saccharose, which is in accordance with scope, and explained by higher MLSS. The results of both experiences show that when working with higher soluble substrate content in the influent, the SVI is higher, which is observed in filamentous (microscopic pictures) and higher ESS (in effluent). Additionally, the microbiological factor in relation to substrate-biomass for filamentous bacteria makes it easier to biodegrade soluble material due to contact surface (bioadsorption) and, on the other hand, flocculent bacteria have an advantage over the filamentous biomass when biodegrading flour based on the same mechanism. Regarding non-biodegraded flour, it will not go out through effluent, not affecting ESS; in the worst scenario, the non-biodegraded flour is incorporated to biomass forming a whole. Therefore, in case this phenomenon of the adherence of flour and floccules occurs, the bulking control would be favored, and finally, the flour would be biodegraded as all biodegradable particulate material.
Figure 10 shows that in the lacking nutrients condition, SBR fed with flour, the ML behavior is clearly more stable than the SBR fed with saccharose, which shows a strong increase with excess nutrients; ML for SBR with flour stabilizes, showing a faster downward trend of greater magnitude than the SBR fed with sucrose; it can be observed that the relevant factor in the behavior of ML is the particulate substrate, flour, and is consistent with the results of the first experience.
Finally, the saccharose and flour mixed feeding under nutrient-deficient conditions presented a lower loss of biomass in effluent and lower ESS when the flour proportion was increased in influent. In experiment 2, two SBRs, one fed with saccharose and the other one with flour, initially working under deficit condition and later with excess nutrients, showed the SBR fed with flour reached normal operational standards with greater promptness and consistency. In both cases, a lower leakage of solids is the result of greater flocculent biomass formation, which sediments more efficiently, increasing the MLSS.

4. Conclusions

It is observed in the bench-scale activated sludge reactors with a lack of nutrients, such that the concentration of the particulate substrate increases with respect to the soluble substrate in the influent, verified a decrement in the SVI and ESS values, parameters that must be evaluated in a brief period of time. Until the 30th, with a deficit of 20 to 30% compared to recommended ratio, the four SBRs had a similar MLSS, IVL, and ESS. From day 30, with a deficit 80 to 90%, the influents had an Ms/Mp ratio of 1/1 and 1/2 after 48 days, the SBRs presented an IVL between 600 and 730 mL/g and ESS of 370 a 440 mg/L; unlike the influents with Ms/Mp, 1/3 and 1/4, they present an IVL between 170 and 185 mL/g and an ESS of 260 a 270 mg/L, where the favorable effect of the particulate matter is categoric.
When there is a lack of nutrients causing bulking in the active sludge plant and nutrients are added to correct this deficit, the influent with particulate substrate mitigates the bulking with greater speed and consistency to a normal situation, according to the SVI, ESS, and MLSS obtained. Once the condition of nutrient deficiency has been changed to excess after approximately 22 days, the SVI of 190 mL/g, ESS of 360 mg/L, and MLSS of 2000 mg/L for influents with saccharose, and SVI of 80 mL/g, ESS of 100 mg/L, and MLSS of 4000 mg/L for influents with flour shows the faster and more consistent recovery with the particulate substrate.
These values of the quantitative parameters are consistent with the microscopic images obtained in this investigation, in which, basically, a flocculent biomass was observed in the system fed with flour, which matches the dates following MLSS = 4000 mg/L, and SVI = 80 mL/g values, unlike the influents containing saccharose, where the presence of filamentous bacteria was verified, with the values of MLSS = 2000 mg/L and IVL = 190 mL/g, both the qualitative and quantitative information confirm the favorable effect of the particulate substrate, flour.
This investigation opens the window: The use of particulate substrate as a substitute for chemical reagents to control and mitigate bulking in an activated sludge system is a clean innocuous and sustainable alternative because flour or similar products are used and are disposed of as waste by the food industry preferentially.
Given the simplicity of this solution, the availability of these particulate substrates and the results obtained are detached; it is a technically feasible proposal to different scales. Therefore, this technological solution can be applied to real installations, through the direct addition of a particulate substrate to the influent, flour or something similar, which is currently carried out with chemical reagents such as chlorine to solve the bulking problem.

Author Contributions

Conceptualization, P.C.-O.; Data curation, P.C.-O., C.C.-C., G.T.-B. and N.B.-T.; Formal analysis, P.C.-O. and N.B.-T.; Investigation, P.C.-O., C.C.-C. and G.T.-B.;Methodology, P.C.-O. and N.B.-T.; Project administration, P.C.-O.; Resources, P.C.-O., C.C.-C. and G.T.-B.; Supervision, P.C.-O., C.C.-C. and G.T.-B.; Validation, P.C.-O.; Visualization, P.C.-O., C.C.-C., G.T.-B. and N.B.-T.; Writing—original draft, P.C.-O.; Writing—review and editing, P.C.-O. All authors have read and agreed to the published version of the manuscript.

Funding

This research received no external funding.

Institutional Review Board Statement

Not applicable.

Informed Consent Statement

Not applicable.

Data Availability Statement

Not applicable.

Conflicts of Interest

The authors declare no conflict of interest.

References

  1. Jenkins, D.; Richard, M.; Daigger, G. Manual on the Causes and Control of Activated Sludge Bulking, Foaming, and Other Solids Separation Problems; IWA Publishing: London, UK, 2004. [Google Scholar]
  2. Seviour, R.; Nielsen, P. Microbial Ecology of Activated Sludge; IWA Publishing: London, UK, 2010. [Google Scholar]
  3. Mielczarek, A.; Kragelund, C.; Eriksen, P.; Nielsen, P. Population dynamics of filamentous bacteria in Danish wastewater treatment plants with nutrient removal. Water Res. 2012, 46, 3781–3795. [Google Scholar] [CrossRef] [PubMed]
  4. Amanatidou, E.; Samiotis, G.; Trikoilidou, E.; Pekridis, G.; Taousanidis, N. Evaluating sedimentation problems in activated sludge treatment plants operating at complete sludge retention time. Water Res. 2015, 69, 20–29. [Google Scholar] [CrossRef]
  5. Han, H.; Qian, H.; Qiao, J. Nonlinear multiobjective model-predictive control scheme for wastewater treatment process. J. Process Control 2014, 24, 47–59. [Google Scholar] [CrossRef]
  6. Pacheco, V.; Jáuregui, B.; Pavón, T.; Mejía, G. Control del crecimiento de microorganismos filamentosos en una planta de tratamiento de aguas residuales industriales. Rev. Int. Contam. Ambient. 2003, 19, 47–53. [Google Scholar]
  7. Horan, N.; Lavender, P.; Cowley, E. Experiencie of activated-sludge bulking in the UK. Water Environ. J. 2004, 18, 177–182. [Google Scholar] [CrossRef]
  8. Wilen, B.; Balmer, P. The effect of dissolved oxygen concentration on the structure, size and size distribution of activated sludge flocs. Water Res. 1999, 33, 391–400. [Google Scholar] [CrossRef]
  9. Guo, J.; Peng, Y.; Wang, S.; Zheng, Y.; Huang, H.; Wang, Z. Long term effect of dissolved oxygen on partial nitrification performance and microbial community structure. Bioresour. Technol. 2001, 100, 2796–2802. [Google Scholar] [CrossRef]
  10. Guo, J.; Peng, Y.; Peng, C.; Wang, S.; Chen, Y.; Huang, H.; Sun, Z. Energy saving achieved by limited filamentous bulking sludge under low disolved oxygen. Bioresour. Technol. 2010, 101, 1120–1126. [Google Scholar] [CrossRef] [PubMed]
  11. Balcárcel, L.; Erazo, P.; Vides, A.; Ramírez, A. Parámetros fisicoquímicos asociados a la proliferación de bacterias filamentosas (Bulking filamentosos) en las plantas de tratamiento de aguas residuales mediante lodos activados: Revisión sistemática. Hechos Microbiol. UdeA 2012, 3, 47–58. [Google Scholar]
  12. Marazzi, F.; Bellucci, M.; Fantasia, T.; Ficara, E.; Mezzanotte, V. Interactions between Microalgae and Bacteria in the Treatment of Wastewater from Milk Whey Processing. Water 2020, 12, 297. [Google Scholar] [CrossRef] [Green Version]
  13. Dagot, C.; Pons, M.; Casellas, M.; Guibaud, G.; Dollet, P.; Baudu, M. Use of image analysis and rheological studies for the control of settleability of filamentous bacteria: Application in SBR reactor. Water Sci. Technol. 2001, 43, 27–33. [Google Scholar] [CrossRef] [Green Version]
  14. Lee, S.; Koopman, B.; Bode, H.; Jenkins, D. Evaluation of alternative sludge settleability indexes. Water Res. 1983, 17, 1421–1426. [Google Scholar] [CrossRef]
  15. Da Motta, M.; Amaral, A.; Casellas, M.; Pons, M.; Dagot, C.; Roche, N.; Ferreira, E.; Vivier, H. Characterization of Activated Sludge by Automated Image Analysis: Validation on Full-Scale Plants; IFAC Computer Applications in Biotechnology: Québec City, QC, Canada, 2001; pp. 427–431. [Google Scholar]
  16. Da Motta, M.; Pons, M.; Roche, N. Automated monitoring of activated sludge in a pilot plant using image analysis. Water Sci. Technol. 2001, 43, 91–96. [Google Scholar] [CrossRef]
  17. Mesquita, D.; Dias, O.; Dias, A.; Amaral, A.; Ferreira, E. Correlation between sludge settling ability and image analysis information using partial least squares. Anal. Chim. 2009, 642, 94–101. [Google Scholar] [CrossRef] [Green Version]
  18. Jenné, R.; Banadda, E.; Smets, I.; Deurinck, J.; van Impe, J. Detection of filamentous bulking problems: Developing an image analysis system for sludge composition monitoring. Microsc. Microanal. 2007, 13, 36–41. [Google Scholar] [CrossRef] [PubMed]
  19. Jenné, R.; Banadda, E.; Smets, I.; van Impe, J. Monitoring activated sludge settling properties using image analysis. Water Sci. Technol. 2004, 50, 281–285. [Google Scholar] [CrossRef] [PubMed]
  20. Amaral, A.; Ferreira, E. Activated sludge monitoring of a wastewater treatment plant using image analysis and partial least squares regression. Anal. Chim. 2005, 544, 246–253. [Google Scholar] [CrossRef] [Green Version]
  21. Martins, A.M.P.; Heijnen, J.; van Loosdrecht, M.C.M. Bulking sludge in biological nutrient removal systems. Biotechnol. Bioeng. 2004, 86, 125–135. [Google Scholar] [CrossRef]
  22. Wanner, J.; Kragelund, C.; Nielsen, P. Microbiology of bulking. In Microbial Ecology of Activated Sludge; IWA Pulishing: London, UK, 2010; pp. 191–214. [Google Scholar]
  23. Rodríguez, L.; Molina, F. Estrategias operacionales para el control de problemas de baja sedimentación causados por bacterias filamentosas en plantas de lodos activos. Rev. Científica Cienc. Ambient. Sostenibilidad CAS 2018, 4, 1. [Google Scholar]
  24. Caravelli, A.; Contreras, E.; Giannuzzi, L.; Zaritzky, N. Modeling of chlorine effect on floc forming and filamentous micro-organisms of activated sludges. Water Res. 2003, 37, 2097–2105. [Google Scholar] [CrossRef]
  25. Yano, A.; Gomes, L. Use of chlorine in the control of filamentous bulking in an activated sludge system from beef industry. Revista Ambiente Agua 2013, 8, 146–156. [Google Scholar]
  26. Bitton, G. Wastewater Microbiology; John Wiley & Sons: Hoboken, NJ, USA, 2005. [Google Scholar]
  27. Xie, B.; Dai, X.-C.; Xu, Y.-T. Cause and pre-alarm control of bulking and foaming by Microthrix parvicella—A case study in triple oxidation ditch at a wastewater treatment plant. J. Hazard. Mater. 2007, 143, 184–191. [Google Scholar] [CrossRef]
  28. Rossetti, S.; Tomei, M.C.; Nielsen, P.H.; Tandoi, V. “Microthrix parvicella”, a filamentous bacterium causing bulking and foaming in activated sludge systems: A review of current knowledge. FEMS Microbiol. Rev. 2005, 29, 49–64. [Google Scholar] [CrossRef] [PubMed] [Green Version]
  29. Séka, M.A.; Hammes, F.; Verstraete, W. Use of chlorine in the control of filamentous bulking in an activated sludge system from beef industry. Appl. Microbiol. Biotechnol. 2003, 61, 562. [Google Scholar] [CrossRef] [PubMed]
  30. Agridiotis, V.; Forster, C.; Balavoine, C.; Wolter, C.; Cariell-Marquet, C. An examination of the surface cha- racteristics of activated sludge in relation to bulking during the treatment of paper mill wastewater. Water Environ. J. 2006, 20, 141–149. [Google Scholar]
  31. Choi, J.; Meher, S.; Goel, R. Bacteriophagebased biocontrol of biological sludge bulking in wastewater. Bioeng. Bugs 2011, 2, 214–217. [Google Scholar] [CrossRef]
  32. Guo, J.; Peng, Y.; Wang, S.; Yang, X.; Yuan, Z. Filamentous and non-filamentous bulking of activated sludge encountered under nutrients limitation or deficiency conditions. Chem. Eng. J. 2014, 255, 453–461. [Google Scholar] [CrossRef] [Green Version]
  33. Wang, B.; Zhang, L.; Peng, D.; Yinping, H.; Liying, P.; Lifang, Y. Extended filaments of bulking sludge sink in the floc layer with particulate substrate. Chemosphere 2013, 3, 2725–2731. [Google Scholar] [CrossRef]
  34. Puigagut, J.; Salvadó, H.; Tarrats, X.; García, J. Effects of particulate and soluble substrates on microfauna populations and treatment efficiency in activated sludge systems. Water Res. 2007, 41, 3168–3176. [Google Scholar] [CrossRef] [PubMed]
  35. Fan, N.S.; Qi, R.; Huang, B.C.; Jin, R.C.; Yang, M. Factors influencing candidatus microthrix parvicella growth and specific filamentous bulking control: A review. Chemosphere 2019, 244, 125371. [Google Scholar] [CrossRef]
  36. APHA-AWWA-WPFC. Métodos Normalizados Para el Análisis de Agua Potable y Aguas Residuales; Diaz de Santos: Madrid, Spain, 1992. [Google Scholar]
  37. Metcalf, L.; Eddy, H.P.; Tchobanoglous, G. Wastewater Engineering, Treatment, Disposal, and Reuse, 3rd ed.; McGraw-Hill: New York, NY, USA, 1991. [Google Scholar]
  38. Rittmann, B.; McCarty, P. Biotecnología del Medio Ambiente; McGraw-Hill: Madrid, Spain, 2001. [Google Scholar]
  39. Flores, X.; Joaquim, C.; Rodriguez, I.; Manel, P.; Krist, G.; Ulf, J. Evaluation of plant-wide WWTP control strategies including the effects of filamentous bulking sludge. Water Sci. Technol. 2009, 60, 2093–2103. [Google Scholar] [CrossRef] [PubMed] [Green Version]
  40. Cisterna, P.; Gutierrez, A.; Sastre, H. Biodegradación de aceite girasol con presencia de sacarosa mediante lodos activos a escala de laboratorio. Interciencia 2015, 40, 684–689. [Google Scholar]
  41. Trikoilidou, E.; Samiotis, G.; Bellos, D.; Amanatidou, E. Sustainable operation of a biological wastewater treatment plant, 20th Innovative Manufacturing Engineering and Energy Conference (ImanEE 2016). Mater. Sci. Eng. 2016, 161, 012093. [Google Scholar]
  42. Bizukojc, E.; Andrzejczak, O.; Solecka, M. Study on activated sludge flocs morphology and composition in a full-scale wastewater treatment plant in Poland. Environ. Prot. Eng. 2019, 45, 69–82. [Google Scholar]
  43. Li, J.; Liu, J.; Wang, D.; Chen, T.; Ma, T.; Wang, Z.; Zhuo, W. Accelerating Aerobic Sludge Granulation by Adding Dry Sewage Sludge Micropowder in Sequencing Batch Reactors. J. Environ. Res. Public Health 2015, 12, 10056–10065. [Google Scholar] [CrossRef]
  44. Niang, S.; Wang, R.; Qi, R.; Gao, Y.; Rosseti, S.; Tandoi, V.; Yang, M. Control strategy for filamentous sludge bulking: Bench-scale test and full-scale application. Chemosphere 2018, 2, 709–716. [Google Scholar]
Figure 1. Bench Scale Activated Sludge Reactors 1. Wastewater recharge: loading raw wastewater to SBR, 3 min. 2. Aeration and mixing: compressor feeds air to SBRs, 18 h. 3. Sedimentation: separation of the aqueous and solid phases, 5 h 42 min. 4. Emptying of the treated effluent, 15 min.
Water 13 00984 g001
Figure 2. MLSS with 30% nutrient deficiency (from 1 to 30 days) and absence of nutrients (from 31 to 48 days) for each react.
Water 13 00984 g002
Figure 3. Sludge volume index (SVI) with 30% nutrient deficiency (from 1 to 30 days) and absence of nutrients (from 31 to 48 days) for each reactor.
Water 13 00984 g003
Figure 4. Effluent suspended solids (ESS) with 30% nutrient deficiency (from 1 to 30 days) and absence of nutrients (from 31 to 48 days) for each reactor.
Water 13 00984 g004
Figure 5. Mass Load (ML) with 30% nutrient deficiency (from 1 to 30 days) and absence of nutrients (from 31 to 48 days) for each reactor.
Water 13 00984 g005
Figure 6. Mixing liquor-suspended solids (MLSS) with nutrient deficiency (1 to 12 days) and optimal nutrient ratio (13 to 35 days) for each reactor.
Water 13 00984 g006
Figure 7. Microscopic view of the mixed liquor. Bacteria observed on day 21 and 34. SBRsaccharose (S-21), SBRsaccharose (S-34), SBRflour (F-21), SBRflour (F-34).
Water 13 00984 g007
Figure 8. Sludge volume index (SVI) with nutrient deficit (from 1 to 12 days) and optimal ratio of nutrients (from 13 to 34 days) for each reactor.
Water 13 00984 g008
Figure 9. Effluent-suspended solids (ESS) with nutrient deficit (1 to 12 days) and optimal nutrient ratio (13 to 35 days) for each reactor.
Water 13 00984 g009
Figure 10. Mass Load (ML) with nutrient deficit (1 to 12 days) and optimal nutrient ratio (13 to 35 days) for each reactor.
Water 13 00984 g010
Table 1. SBRs 1, 2, 3, and 4 influents characteristics. First stage and second stage.
First Stage: With Addition of Nutrients
Second stage: Without Addition of Nutrients
With Addition of NutrientsWith Addition of NutrientsWithout Addition of Nutrients
ReactorN-FlourP-FlourSugarFlourN-NH₄ClP-Na5P3O10P:N:CP:N:C
(g/L)(g/L)(g/L)(g/L)(g/L)(g/L)
10.0050.00040.9580.320.0130.0030.68:3.52:1000.08:0.91:100
20.0090.00080.9580.640.0170.00340.69:4.28:1000.13:1.50.100
30.0140.00120.9580.960.0210.0040.72:4.86:1000.17:1.97:100
40.0180.00160.9581.2830.0250.0050.78:5.14:1000.19:2.16:100
Table 2. SBRs 1 and 2 influents’ characteristics. First stage and second stage.
First Stage: Without Addition of Nutrients
Second Stage: With Addition of Nutrients
With Addition of NutrientsWithout Addition of Nutrients With Addition of Nutrients.
ReactorN-FlourP-FlourSugarFlourN-NH₄CLP-Na5P3O10P:N:CP:N:C
(g/L)(g/L)(g/L)(g/L)(g/L)(g/L)
1000.6700.0360.0072.6:13.4:1000.0:0.0:100
20.0090.000600.670.030.0062.8:16.3:1000.25:3.76:100
Publisher’s Note: MDPI stays neutral with regard to jurisdictional claims in published maps and institutional affiliations.

