Article

Quantifying the Effects of Residential Infill Redevelopment on Urban Stormwater Quality in Denver, Colorado

by
Kyle R. Gustafson
1,2,
Pablo A. Garcia-Chevesich
1,2,3,*,
Kimberly M. Slinski
1,4,5,
Jonathan O. Sharp
1,2,6 and
John E. McCray
1,2,6
1
Department of Civil and Environmental Engineering, Colorado School of Mines, Golden, CO 80401, USA
2
National Science Foundation Engineering Research Center, ReNUWIt, Golden, CO 80401, USA
3
Intergovernmental Hydrological Programme, UNESCO, 75007 Paris, France
4
Earth Systems Science Interdisciplinary Center, University of Maryland, College Park, MD 20740, USA
5
Goddard Space Flight Center, NASA, Beltsville, MD 20771, USA
6
Hydrologic Science and Engineering Program, Colorado School of Mines, Golden, CO 80401, USA
*
Author to whom correspondence should be addressed.
Water 2021, 13(7), 988; https://doi.org/10.3390/w13070988
Submission received: 12 March 2021 / Revised: 30 March 2021 / Accepted: 30 March 2021 / Published: 3 April 2021

Abstract

:
Stormwater quality in three urban watersheds in Denver that have been undergoing rapid infill redevelopment for about a decade was evaluated. Sampling was conducted over 18 months, considering 15 storms. Results: (1) The first-flush effect was observed for nutrients and total suspended solids (TSS) but not for total dissolved solids (TDS), conductivity, pH, and fecal indicator bacteria; (2) though no significant differences on event mean concentration (EMC) values were found among the three basins, local-scale EMCs were higher than traditional city-wide standards, particularly some metals and nutrients, most likely because of the significantly higher imperviousness of the studied urban basins compared to city averages; (3) peak rainfall intensity and total rainfall depth showed significant but weak correlations with some nutrients and metals, and TDS; (4) antecedent dry period were not correlated with water quality, except for phosphorus and lead; (5) contrary to what was expected, total coliforms and Escherichia coli were not correlated with TSS; and (6) no significant correlations between water quality and land-use or zoning categories were found. It was concluded that locally focused stormwater monitoring can aid data-driven decision-making by city planners where redevelopment is occurring at local “neighborhood scales”, particularly for the implementation and management related to green infrastructure and water-quality regulations.

1. Introduction

Urban stormwater pollution is considered a worldwide concern, because of its effects on the environment and human health (e.g., Reference [1]). As cities grow in size, more pollutants are mobilized during storms and discharged into urban river systems where they can cause serious environmental problems [2]. Müller et al. [3] recently developed the most up-to-date review of source pollutants in cities, concluding that atmospheric deposition, vehicular transportation-related activities, and metallic building structures are the major contaminant sources in urban stormwater. Nevertheless, cities worldwide continue growing not only in size and population, i.e., traffic and pollution from vehicles (e.g., Reference [4]); they also change their imperviousness over time, as new constructions take place, a process that directly affect urban stormwater quantity and quality [5,6].
Stormwater quality from urban areas, e.g., streets, sidewalk, commercial, and residential structures, has been the focus of countless studies on cities around the world, including Paris, France [7,8], Dunedin, New Zealand [9], Toronto, Canada [10], and Queensland, Australia [4,11], among others. Similarly, many efforts have been made in the United States to survey the chemical composition of urban stormwater (e.g., References [12,13]), an area of hydrological investigation that began decades ago in the country (e.g., Reference [14]). One of the latest and most relevant US studies on the topic is the one done by Masoner et al. [15], who evaluated existing multiagency data of pollutants in urban storm runoff from 50 storm events at 21 study sites across the country, identifying the presence of harmful contaminants such as hydrocarbons, pesticides, and pharmaceuticals, among other organic chemicals. A direct correlation was established with imperviousness, highlighting concerns for potential environmental effects in more densely developed urban areas. Similarly, several comprehensive urban runoff sampling programs have been completed, including Dallas–Fort Worth, Texas [16]; Madison, Wisconsin [17]; Phoenix, Arizona [18]; and Colorado Springs and Denver, Colorado [19,20]. The majority of federally supported sampling programs was focused on determining city-wide contributions of contaminants from stormwater systems in preparation of applying for a municipal separate storm sewer system (MS4) permit.
Conclusions from multiple urban runoff quality studies conducted outside Denver that are relevant to this research include the following: (1) Contaminant build-up and wash-off are significantly influenced by land-use patterns, impervious coverage extent, urban form, and impervious connectedness [21]; (2) fecal indicator bacteria (FIB) concentrations may be significantly higher than expected during storm events and may present a health risk associated with recreating in surface waters after storm events [22]; (3) stormwater quality is not linearly associated with rainfall intensity but more closely resembles a step-wise relationship with storm intensity and duration [21]; (4) event mean concentration (EMC) values generally increase with longer antecedent dry periods and decrease with increased total rainfall and runoff [23] (this conclusion is counter to the one in Denver discussed above); (5) streets, parking lots, and driveways are the most important sources for solids and many metals; and (6) roofs in commercial and industrial areas are sources of zinc from galvanized roofing material [17]. Even though each of these conclusions may be somewhat site specific, studies generally suggest that EMC values may be proportionally correlated to land use, impervious coverage, antecedent dry days, and storm intensity and duration. These conclusions do not generally apply to infill redevelopment in Denver, as will be subsequently discussed in this paper.
Additionally, results of these prior studies show extreme variability, concluding that one locality may not be representative of another due to variations in hydrologic conditions, urbanization and industrialization patterns, and land-use variations. Thus, city-wide sampling programs are likely not representative of local neighborhoods and, therefore, a lack of transferability exists between cities and between neighborhoods within a city. Much of the development in urban areas these days are occurring at local scales, where specific neighborhoods redevelop and adjacent neighborhoods do not. In addition, most studies across the US are at least 25 years old and, because of changes in urban development, increased vehicular traffic associated with population growth, cleaner automobile manufacturing, land-use changes, and decadal climate variations, historical stormwater-quality data may no longer be representative of urban runoff [3]. Finally, most of these older studies collected data from only a few storms from only a few sites. Thus, additional studies on urban stormwater quality are critically needed.
The city of Denver, Colorado, was selected as one of the 28 sites of the original EPA’s National Urban Runoff Program (NURP) study and one of the few large urban centers within EPA rain zone 9, making it a unique study area with a long record of urban runoff data [24]. Urban runoff monitoring in Denver began in 1968 and initially included stormwater quantity measurements to assist in flood forecasting and modeling [19]. Furthermore, the earliest stormwater-quality investigation in the Denver area occurred from 1974 to 1979, called the “Denver Urban Runoff Study”, concluding the following [19]: (1) antecedent precipitation, or dry periods, had no significant effect on rainfall-runoff quality; (2) Denver did not show a notable first-flush effect; and (3) runoff contributes significant loads of total suspended solids (TSS), total nitrogen, copper, lead, and zinc to the South Platte, the city’s main river. An additional runoff characterization report was required for Denver to apply for the National Pollutant Discharge Elimination System (NPDES) MS4 permit. This monitoring was conducted in 1992 and included eight study sites across the city, each collecting data from three storm events [24]. The Colorado Department of Transportation (CDOT) was also required to conduct stormwater sampling from highway surfaces in the Denver area, to apply for a separate MS4 permit, which occurred from 2009 to 2012. Around that time, urban runoff monitoring began to emphasize studying the effectiveness of runoff quality management techniques, namely best management practices (BMPs). Most of these studies have been conducted through municipal or academic organizations and many results have been included in the International Stormwater BMP Database or NSQD.
In a significant database effort, Denver’s Urban Drainage and Flood Control District (UDFCD) compiled a significant portion of all available urban runoff quality data applicable to Colorado. This effort compiled city-wide EMC values for various contaminants and land-use categories applicable to areas in Colorado [25]. While this publication is relatively recent, much of the data are more than 20 years old, as previously mentioned. The City and County of Denver are currently using these values in most water-quality models, BMP designs, planning models, and NPDES permitting models. As discussed above, because these EMCs are based largely on historical data, they may not be actually transferrable to current or future time-periods within a city or neighborhood. Infill development (i.e., the process of developing vacant or under-used parcels within existing urban areas that are already largely developed) is occurring in specific neighborhoods at different times, often with a significantly different urban footprint. Thus, the current EMCs may not be appropriate for any specific redeveloping neighborhood.
Infill redevelopment is happening mostly in Denver’s older, single-family residential neighborhoods where there is high demand for additional housing. This study focuses on the “Berkeley neighborhood” in the City of Denver, which is experiencing rapid infill redevelopment. This land-use change process has the tendency to increase impervious coverage due to expansion of roof space, driveways, sidewalks, and structures, as well as reduction of lawns and empty lots, increasing the quantity of water delivered to stormwater drainage systems and also causing a larger hydrologic response from smaller rainfall events [26]. Examples of this localized trend during a transition from 2014 to 2017 is shown in Figure 1. Infill redevelopment reduces infiltration areas such as lawns and sidewalk buffer zones that had previously allowed infiltration and partial stormwater treatment. Schueler [27] concluded that “the strong relationship between imperviousness and stream quality presents a serious challenge for urban watershed managers”. Similarly, many studies have focused on assessing the effects of increased impervious coverage on water quantity and quality (e.g., References [28,29]), and associated stream degradation through increased sediment and pollutant loads to urban river systems [17]. Moreover, the effects of urban stormwater quality have also been documented on aquatic populations [27,30], including nutrient loads [28] and other types of contaminants, (e.g., Reference [21]), but little is known about the effects of infill redevelopment on urban stormwater quality.
Considering the above, the purpose of this study was to conduct urban stormwater sampling and analysis in three small urban watersheds, all within the same larger watershed, but with different infill redevelopment stages, to evaluate relationships between characteristics representative of infill redevelopment and urban stormwater quality. Data collected in this study can be used by local stormwater managers to drive decision-making regarding revised stormwater control regulations for local, infill redevelopment, and also to assess differences between historical city-wide monitoring and these dynamically shifting neighborhoods.

2. Material and Methods

2.1. Study Domain

The study area is located in Denver, an area located under a semi-arid climate (Köppen climate classification BSk) with very low humidity and an average of 270 sunny or partially cloudy days per year. The climate can be moderately unpredictable. Measurable amounts of snow have fallen in Denver as late as late May and as early as first week of September, but most precipitation falls during summer storms. Mean annual precipitation is 363 mm, with around 137 cm of snow [31].
The Berkeley Neighborhood (northeast Denver, approximately 39°46′36.17″ N, 105°2′21.44″ W) was selected as the study site because of four reasons: (1) It has experienced significant growth between 2004 and 2014; its total building cover increased by 17% [32]; (2) it is one of the latest neighborhood to be redeveloped in a manner that has become common in Denver and other cities, where residential zones with a small area of shuttered stores is remade into a trendy work–live–play neighborhood with multi-family housing; (3) a statistical model developed by Cherry et al. [32], that used various public zoning and tax data to predict the amount and location of future development, calibrated with data from 2004 to 2014 (the most recent available at the time of the study) suggested that impervious area should increase by 14% between 2015 and 2024 (this forecast has not be verified but highlights significant impervious increases in the region); and (4) the area was of high interest by the City and County of Denver with regard to stormwater management for redeveloping zone.
Three sampling sites were selected based on their representative location on the stormwater network, referred to as the “West basin”, “Central basin”, and “East basin” (see Figure 2, under Results and Discussion). Each sampling site is located at a manhole that provided easy access to the stormwater system during regular business hours without interrupting the flow of traffic. The basins under investigation drain to an outlet structure on Clear Creek, which is a tributary of the South Platte River, a significant source of drinking water for the Denver metro area [33]. In addition to proximity, these three sites were selected due to the differences in the extent of infill redevelopment in each basin. The East basin has been relatively unchanged since the neighborhood was originally established. The Central basin has undergone heavy infill redevelopment in the period between 2004 and 2018, while the West basin is an intermediate case because it has significant infill redevelopment occurring close to Tennyson Street and less changes moving south and west within the drainage area [34]. GIS files of Denver’s stormwater network and a high-resolution digital elevation model (DEM) over the Berkeley neighborhood provided the information required to delineate the drainage basins for each sampling location [35]. The pipe network was “burned” into the DEM, using the start and end depths of each pipe segment, through ArcGIS and the Spatial Analyst Toolbox (ESRI 2019, ArcGIS Desktop: Release 10, Environmental Systems Research Institute, Redlands, CA, USA), allowing each sampling location’s drainage basin to be representative of the stormwater network and local topography.

2.2. Impervious Area Determination

The City of Denver provided shape files for impervious coverage for 2004, 2011, 2014, and 2018 (Reference [35] and unpublished data from the City of Denver). The 2018 dataset provided the most recent impervious coverage information. All four datasets were used to determine the location and extent of impervious coverage change from 2004 to 2018, using the Symmetry Difference function in ArcMap and the Geospatial Toolbox. Verification with historic aerial imagery from Google Earth Pro further refined this dataset and provided quality assurance.
Delineated basin extents and the impervious area dataset provided values of total impervious area (TIA) for each sampling location. TIA includes all surface cover that is not able to transmit water into the subsurface. Effective impervious area (EIA) includes all impervious areas that are connected to the stormwater network. TIA included impervious coverage that is intercepted by pervious coverage, but EIA is a measure of the land cover that directly connects with the stormwater network and eventually a surface waterway or water body. EIA was estimated by using the log-linear relationship with TIA developed by Alley and Veenhuis [36] for the Denver region. This equation (Equation (1)) was developed by using data from 14 urban basins in the Denver metro area. EIA provides a more quantitative value for impervious coverage and is typically used more frequently in urban hydrologic modeling than TIA [28].
EIA = 0.15 × TIA 1.41

2.3. Zoning Distribution

The Denver Open Data Catalog [35] provided up-to-date spatial data on the distribution of zoning classifications throughout Denver County. The percentage of zoning classifications in each basin was determined by using each delineated basin’s boundary. Relevant zoning classifications within the Berkeley neighborhood include Commercial Corridor (CC), Main Street (MS), Mixed-Use (MX and M-GMX), Multi-Unit (MU, RH, RO, and TH), Open-Space/Public Parks (OS-A), Single Unit (SU), and Two-Unit (TU). The Commercial Corridor and Main Street classifications include mostly retail businesses and restaurants. Mixed Use includes residential and commercial land use. Multi-Unit, Two-Unit, and Single Unit zones are residential land use only.

2.4. Rainfall Estimation

The RainVieux application developed by Vieux and Associates, Inc. (Norman, OK, USA), provided rainfall depths, timing, and intensity [37]. The RainVieux application supports depth–duration–frequency (DDF) analysis of individual rain events based on UDFCD sub-basins within the Denver area. DDF analysis provides the frequency interval of each storm and is based on the depth and duration of the rain event. RainVieux determines rainfall statistics by compiling local rain gauge and meteorological data into an estimate for each delineated sub-basin. Local weather radar provides a quality assurance check to account for gauge bias and measurement error.

2.5. Field Collection Procedures

Stormwater samples were collected from the three study sites during storm runoff events (from May 2018 through August 2019). Those samples were then analyzed for various constituents including nutrients, metals, FIB, TSS, and organic carbon (dissolved and total). Automated sampling was used to fractionate samples over the course of a runoff event and composite samples provided neighborhood-scale (or local-scale) EMC’s. Each sampling location was outfitted with battery powered ISCO 2160 flow level modules connected to a no-contact laser that provides the level of flow at each site within the stormwater network. The water level is then converted internally into a flow rate, using Manning’s equation for open channel flow, with user-provided pipe shape, size, slope, and roughness values. Units were calibrated according to the manufactures instructions to ensure accurate flow measurements. Measurements were set to record water level and flow rate every five-minutes, which are collected in the field, using a computer, USB connection cable, and ISCO’s FlowLink software [38].
Prior to beginning storm sampling efforts in July of 2018, the ISCO flow meters collected enough data to establish baseflow at each sampling location. Baseflow at any location in a stormwater network can be variable due to a number of different sources: groundwater infiltration, basement sump pumping (allowed by City ordinances to be discharged to the stormwater network), lawn irrigation, street-side car washing, illegal sanitary taps, or any other potential vector for water to enter the piping network. ISCO 2105 interface units, connected to the flow meter units, were programmed by using the upper bound for baseflow as a triggering threshold. Once this threshold is met or exceeded for a period of time longer than the predetermined hysteresis period (five minutes), the interface module sends a signal to the ISCO autosampler to begin sampling.
Compact automatic sampling units (ISCO 3700C) were deployed prior to each storm event. Each sampling unit contained 24 individual 500 mL polyethylene bottles that were cleaned with phosphorous-free soap and acid washed for 24 h in a 5% nitric acid solution prior to deployment. All associated tubing and suction components were sterilized by running five gallons of Contrad 70 solution through the tubing, followed by flushing with five gallons of deionized (DI) water to prevent cross-contamination between sampling events. A field blank consisting of one 500 mL bottle filled with DI water, using deployed suction line and tubing provided quality assurance at each location for each sampling event. Each auto-sampling unit was programmed to collect time-weighted samples during the length of each runoff event. The programmed sample schedule is shown in Table 1.
After each individual 150 mL sample, the ISCO unit purged the suction line with air to prevent cross contamination between samples. The extended sampling schedule during hours five–eight allowed for longer runoff events to be captured, as well as providing samples for when the flow rate declines to baseflow level.
Samples collected after each runoff event were labeled and capped, using clean, acid-washed caps, and placed in an iced cooler, for transport back to the laboratory. Samples were collected within 24 h, to minimize holding issues associated with nutrient, FIB, and E. coli analysis. Flow-level and flow-rate measurements were also collected from the flow meters at the same time samples were collected, to allow for a flow-weighted average local-scale EMC value to be determined.
The standard operating procedures for wet weather monitoring fieldwork were as follows:
  • Weather forecasts provided anticipated timing and duration of storms.
  • Prior to the runoff event, samplers were mobilized to the sampling locations and connected to flow meters.
  • Within 24 h (average 9.9 ± 4.1 h), after the end of the storm, field personnel collected the samples and data-logged flow data, and transported the samples back to the laboratory, following standard procedures to preserve samples (see Table 2).
  • Laboratory analysis were performed at Colorado School of Mines facilities.
  • Autosampler units were decontaminated and sterilized with a cleaning solution and DI water. In situations where storms occurred in succession, only sample bottoms representative of the first storm event were analyzed.

2.6. Lab Analysis Methods

Upon arrival at the lab, each sample set was either analyzed as discrete samples or combined into composite flow-weighted samples, using the collected flow data and sample schedule. Nutrients, bacteria, TSS, total dissolved solids (TDS), conductivity, and pH were analyzed immediately, while metals samples were preserved for later analysis, in accordance with standard laboratory procedures. Discrete sample analysis provided information regarding how various concentrations varied throughout the runoff event and allowed for assessment of the first-flush effect. Flow data and discrete sample concentrations were then converted into neighborhood-scale EMC’s, following the procedures by McCarthy et al. [39]. Calculated EMC’s with allowed discrete samples were compared accurately with composited flow-weighted samples. Flow-weighted samples were composited from time-weighted samples by determining the flow volume during the time interval of each sample (from the automated hydrograph data). The entire runoff volume during each storm event was then calculated as the sum of the flow rates after the flow increases above baseflow levels, divided by the duration of the runoff period. The volume of each individual sample used for the composite was then calculated as each representative sample volume, divided by the total runoff volume, times the volume of composite sample required. For the needed analysis, 600 mL of composite volume was required. Compositing samples in this manner allowed for fewer samples to be analyzed, while still providing an EMC value for each runoff event. After each sample set was composited, samples were analyzed according to each method’s standard operating procedure (SOP). Each method is summarized in Table 2.
The analytes were selected based on ease of analysis with existing infrastructure, cost, and ability to provide data that are comparable to that in the urban stormwater-quality literature and UDFCD’s established city-wide EMC values. A subset of samples was additionally analyzed for total unfiltered nutrients, to assess the relative proportion of dissolved and particulate-associated nutrients.

2.7. Colorado Department of Public Health and Environment (CDPHE) Water-Quality Standards

The stormwater piping network in the Berkeley area eventually discharges into Colorado Department of Public Health and Environment (CDPHE) Segment 15 of Clear Creek, a tributary of the South Platte River, as previously mentioned. The segment identifier for this reach of Clear Creek is COSPCL15A: Mainstem of Clear Creek from Youngfield Street in Wheat Ridge, Colorado, to the confluence with the South Platte River [40]. This reach of Clear Creek is federally listed on the EPA’s 303d Impaired Waterbody List and has been since 1998 [41]. Due to this impairment, point-sources of contaminants require total maximum daily load (TMDL) permits that limit the load of contaminants that can be discharged. Since 2016, this segment of Clear Creek has TMDLs for ammonia, E. coli, sediments, and temperature [41]. In addition to TMDL permits for point-sources, for this segment to be removed from the 303(d) impaired list, CDPHE has established in-stream water-quality standards specific to this reach of stream, including CDPHE Regulation 38 (temperature, pH, E. coli, nitrate, nitrite, total nitrogen, total phosphorus, arsenic, cadmium, copper, lead, and zinc) and CDPHE Regulation 31 (ammonia).
It is important to note that CDPHE standards are in-stream concentrations and there are not regulated limits on discharge concentration for non-point sources such as stormwater drainage. Although the study area is not considered a priority basin [42], it is beneficial to understand how water-quality parameters and EMC values compare to in-stream water-quality values. To do so, average pH, hardness, and stream temperatures from the closest USGS gaging station were used (USGS station: 06719505).

2.8. Statistical Methods

A suite of statistical methods was used to compare data collected in the Berkeley neighborhood to previously reported EMC values relevant to the entire city of Denver. The overall goal was to assess changes in water quality and local-scale EMCs due to infill redevelopment. All relevant water-quality data and storm characteristics were input into a database compatible with Matlab, for statistical analysis. Statistical methods utilized include a suite of descriptive statistics, Anderson–Darling test for normality, Pearson correlation, Box-Cox transformation where applicable, one-way Analysis of Variance (ANOVA), and Analysis of Covariance (ANCOVA), all conducted in Matlab.
The water-quality database and Matlab provided summary statistic values, including sample mean, median, maximum values, minimum values, quartile distribution, variance, and standard deviation. This analysis was conducted on the complete dataset, as well as subsets based on sampling location. Box plots provided a graphical method to display descriptive statistics.

3. Results and Discussion

3.1. GIS Analysis

Table 3 shows a breakdown of catchment area and impervious coverage, Table 4 shows impervious surface increases by basin between 2004 and 2018, and Table 5 shows zoning areas by basin and zoning category. Figure 2 illustrates the watersheds’ boundaries and where infill redevelopment has been occurring within the three basins since 2004.
Basin delineations (Figure 2) very closely matched basins delineations in Denver’s Stormwater Master Plan for basin 4309-01 [42]. The West and East basins drain comparable areas at 133 and 159 ha, but have significantly different impervious areas (56% and 46%) respectively, while the Central basin is substantially smaller (only 32 ha), with an impervious area (59%) that is more similar to the West basin than the East Basin. Impervious coverage is substantial within the entire study area. The East basin has the lowest coverage (46%), which is still high even for many urban residential areas [43] and significantly higher than the city-wide average for Denver, which is 39% [35].
There is a significant contrast wherein the redevelopment is occurring between the three basins (Figure 2). The East basin has undergone relatively little change during this period, while the Central basin has relatively uniform increases in imperviousness across the drainage area. The West basin, on the other hand, shows a significant gradient, with more infill occurring closer to Tennyson Street and less infill occurring west and south. While the increases in impervious coverage since 2004 are considerable (and visually noticeable to residents and planners), it is still a relatively low percentage of total land cover. As shown in Table 4, from 2004 to 2018, the Central basin increased imperviousness by 5%. During this same period, the East basin only increased imperviousness by only 0.8%. The main contributor to increased imperviousness is continuous building footprints (between 51 and 68% of increased imperviousness is due to larger building coverage replacing lawns and infiltrative surfaces).
Zoning classifications (Figure 2 and Table 5) provide additional information related to infill redevelopment trends. The majority of infill redevelopment and increases in imperviousness occurs in areas zoned as Two-Unit residential. Developers commonly purchase a single-family home property, successfully apply to rezone the lot as Two-Unit residential, and replace the home with a larger Two-Unit residence, resulting in increased impervious coverage. The Central basin is dominantly Two-Unit, as is the area just to the west of Tennyson Street in the East basin (Figure 2). These areas have experienced the largest impervious coverage increase. It is likely that additional infill redevelopment will occur in the remaining Single Unit zoning areas as limited housing options and real estate economics justify rezoning to Two-Unit or Multi-Unit classifications. The transition to Two-Unit, Mixed Use, and Multi-Unit zoning seems to be a significant driver for increased impervious coverage mainly due to the economic incentives to build more housing near popular commercial areas. Cherry et al. [32] found that Building-to-Land ratio was the parameter most highly correlated to whether or not a property would be infill redeveloped.

3.2. Storm Runoff Analysis

A total of 15 rain events were sampled between July 2018 and July 2019. Due to sporadic equipment malfunctions, not all storm events were captured at each sampling location. Nine sampling events were captured and analyzed at the Central basin, 13 at the West basin, and 12 at the East basin. Table 6 shows the dates and rain-event characteristics of the storms analyzed, while Table 7 presents the descriptive statistics of the water-quality analyses. Table 8 shows the average surface water loading of each contaminant during a storm event. Similarly, Appendix A Table A1 and Table A2 show results from the Pearson’s Correlation analysis, excluding and including metals, respectively, while the ANCOVA results for the analysis of the effects of peak rainfall intensity, antecedent dry days, and rainfall depth are shown in Appendix A Table A3, Table A4 and 
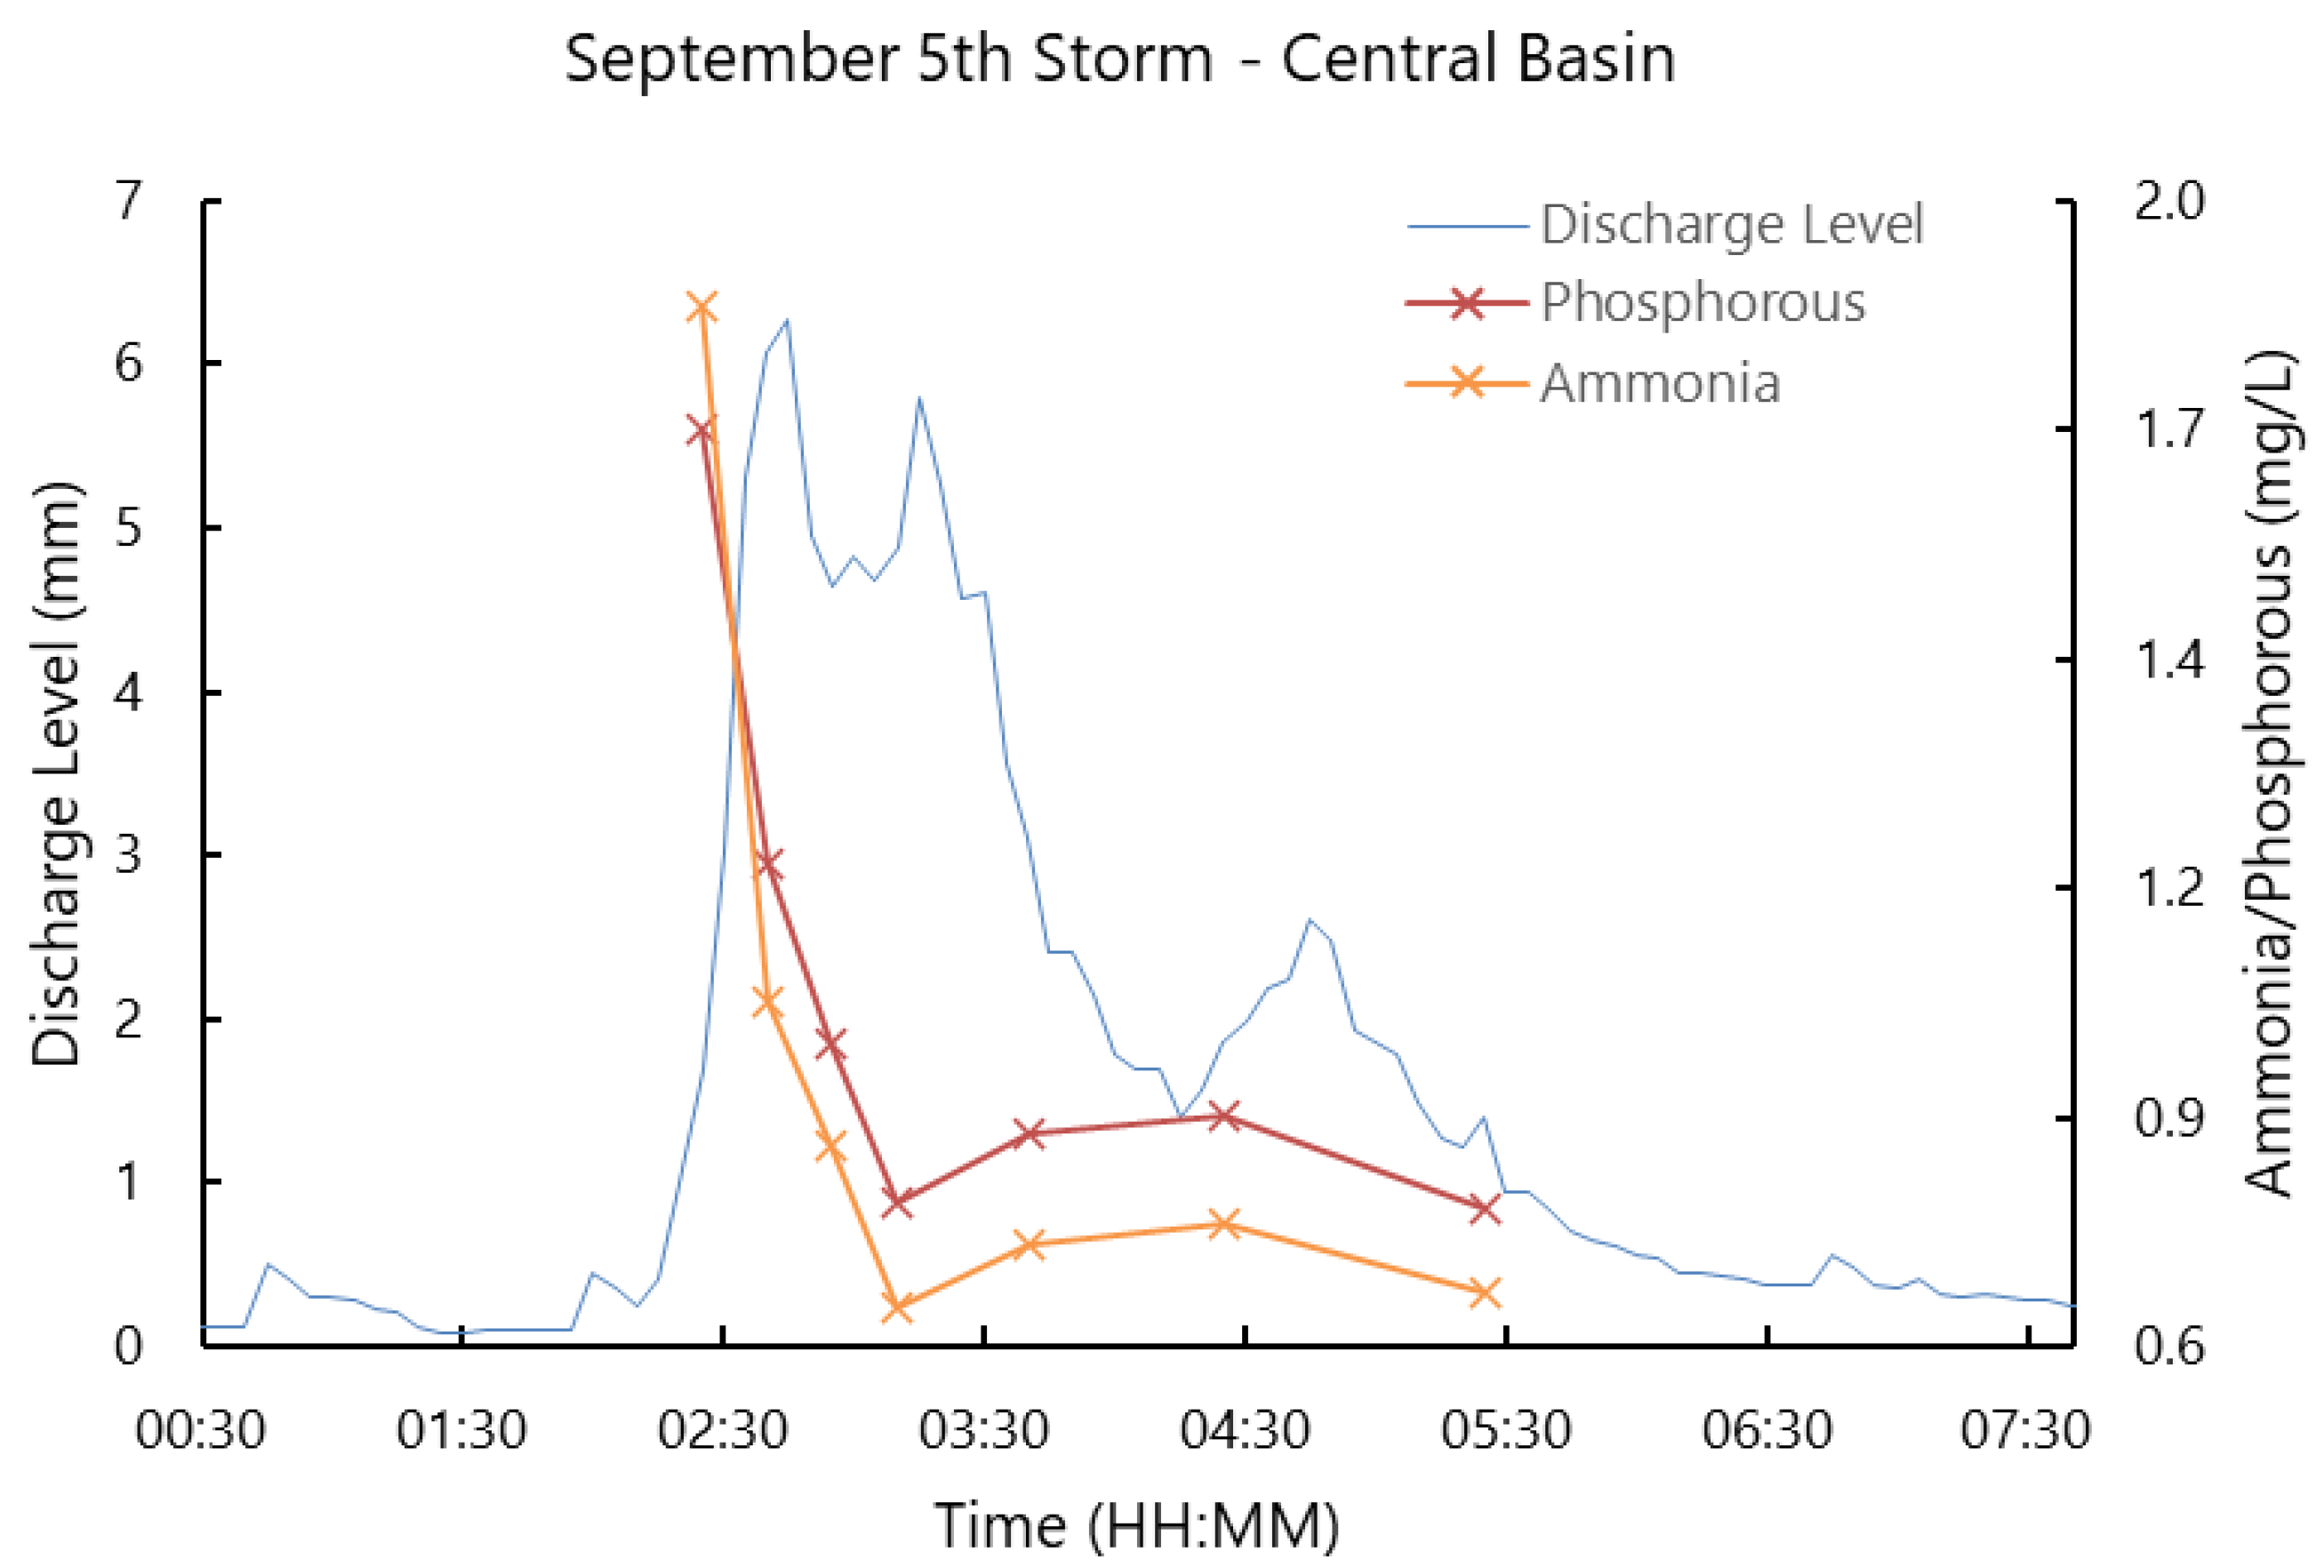
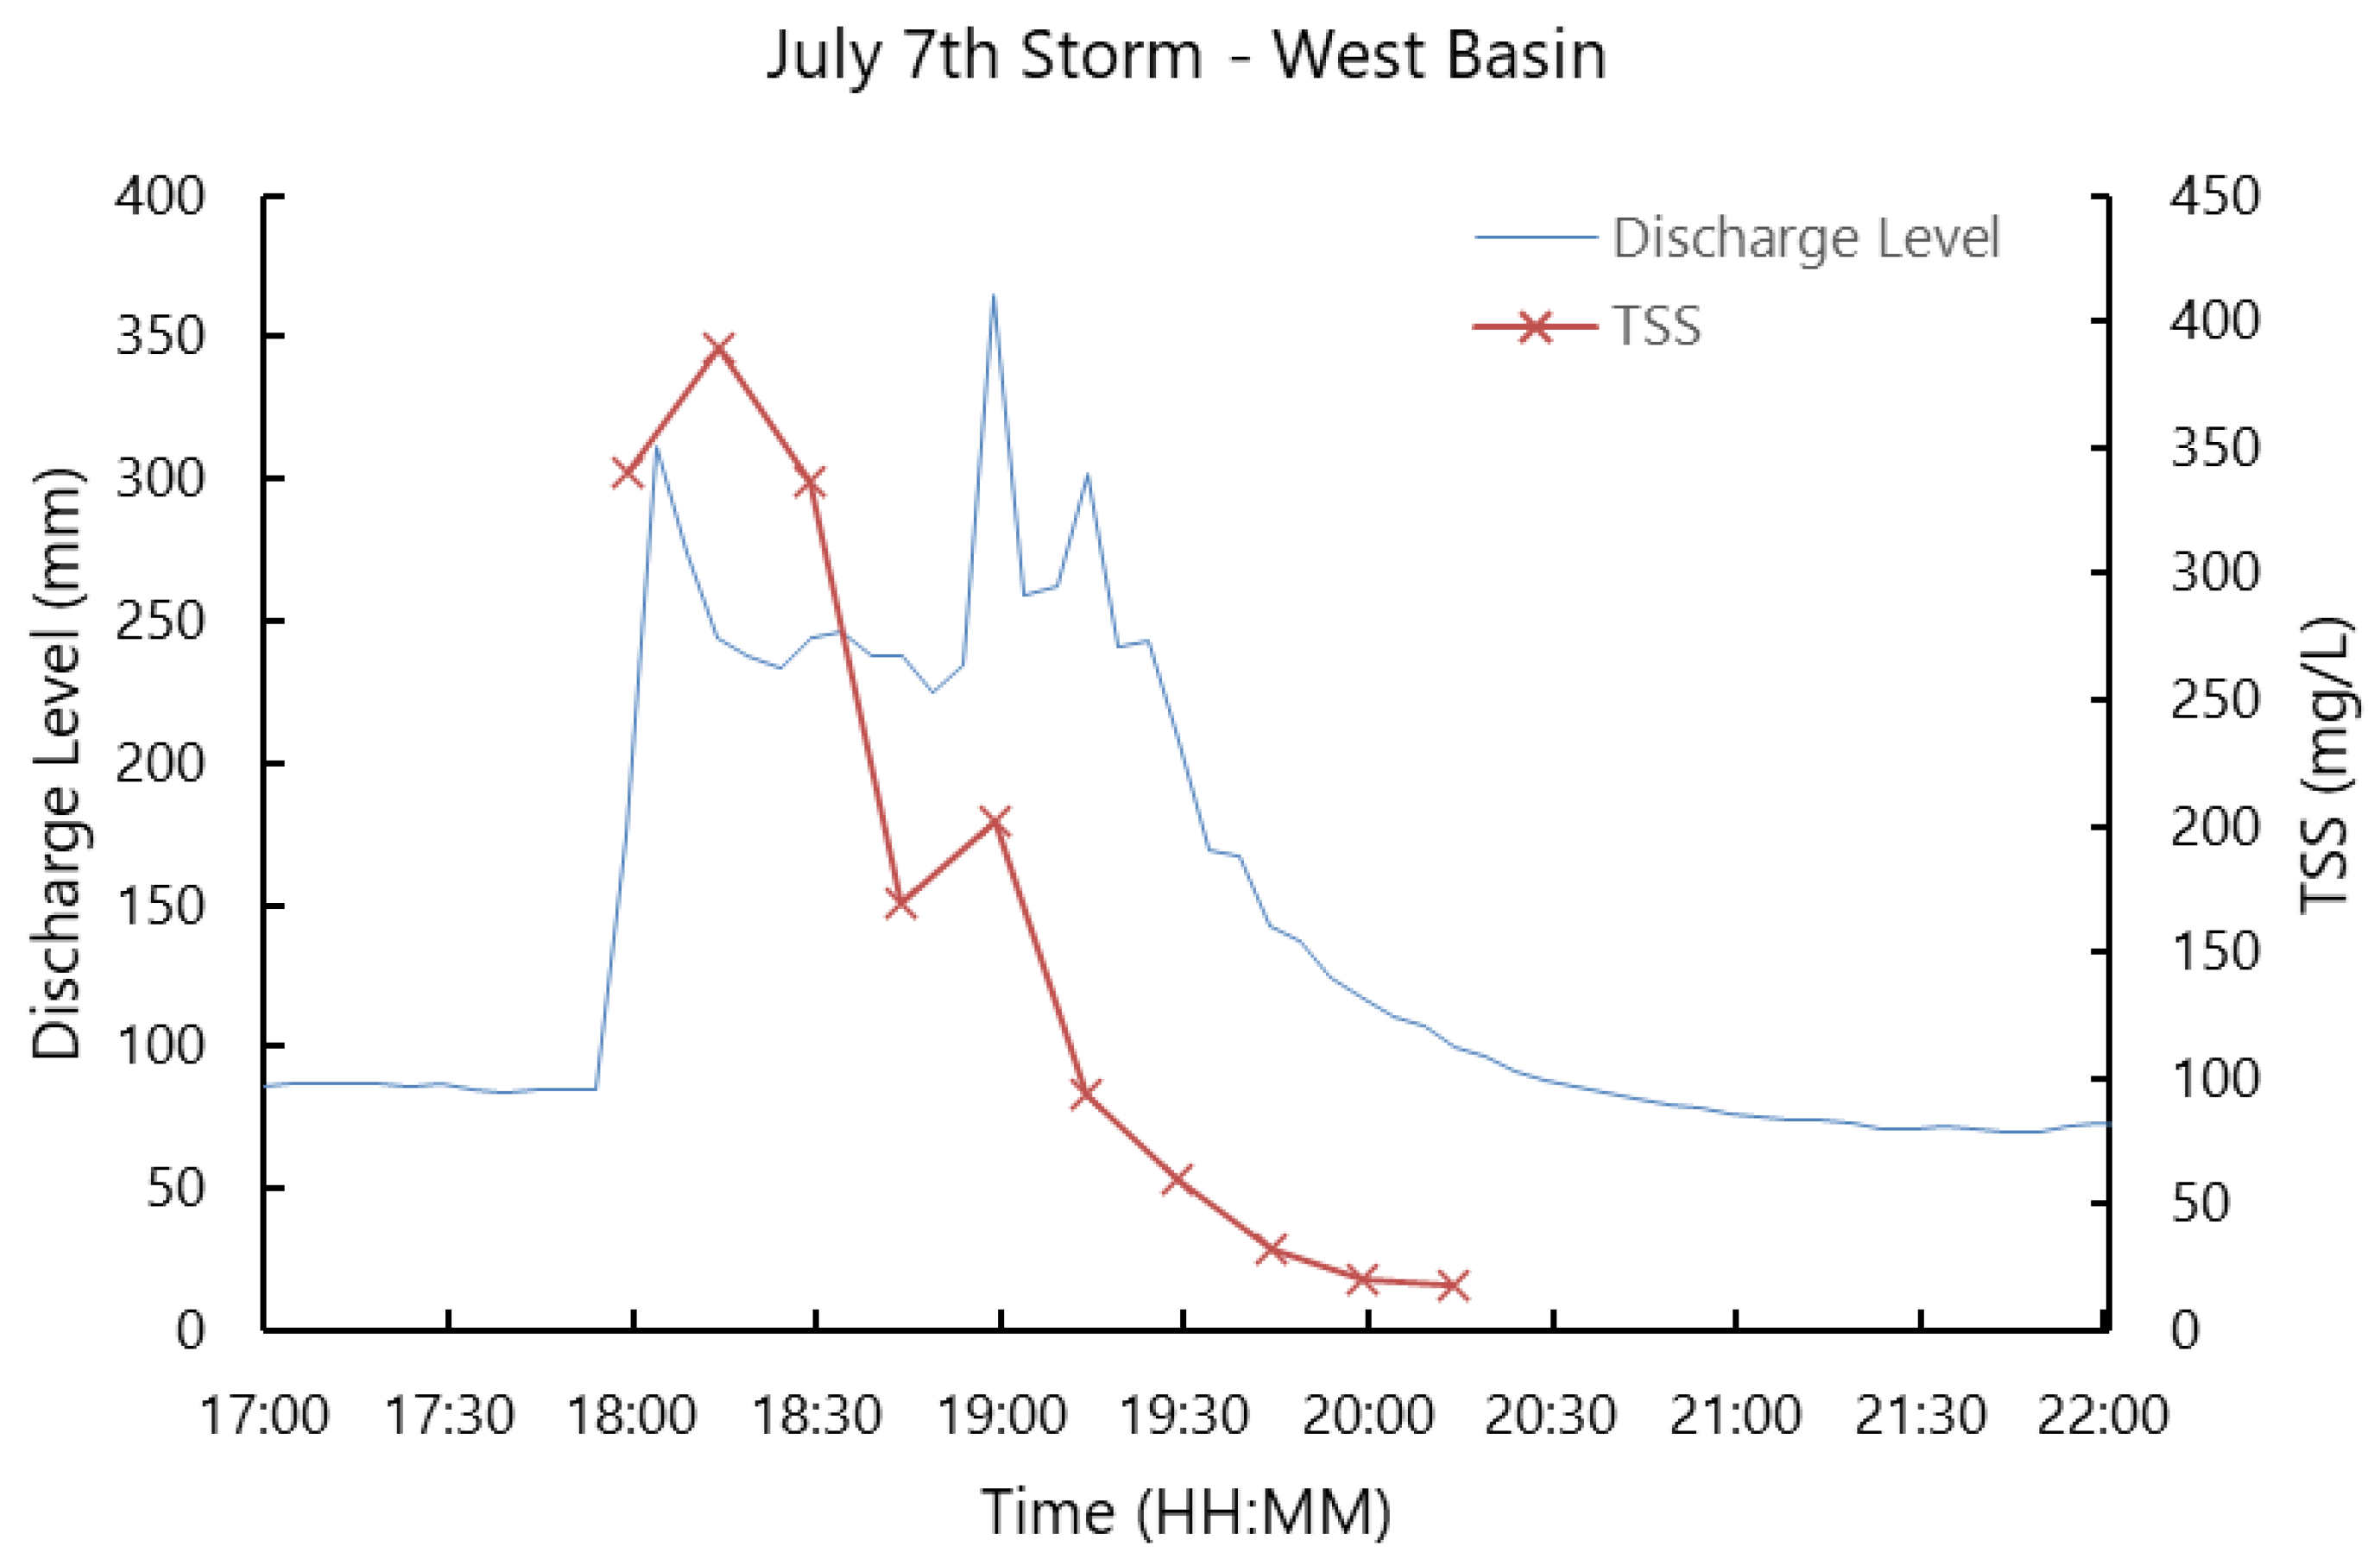
Table A5, respectively. Analytes were not strictly related to flow rates, as shown in Figure 3, Figure 4 and Figure 5, which show examples of discretely analyzed storms for phosphorus (Central basin) and ammonia (Central basin), TSS (West basin), and TDS (East basin), respectively.
Each sampled wet-weather event was less than a 2-year storm, according to Denver’s precipitation–duration–frequency diagrams, and less than 2 h in duration (Table 6). Antecedent dry days prior to rain events fell in a range between 1 and 8 days. Rainfall depths ranged from 0.5 to 10.2 mm during the captured rain events. The relative consistency of the storms allows for an efficient comparison due to limited ranges in rainfall intensity and total rainfall volume.
Seven storms were analyzed by using discrete, time weighted samples that show how contaminant concentrations change over the course of the event. Hydrographs of these discretely analyzed samples can be found in Figure 3, Figure 4 and Figure 5, as previously mentioned. This analysis provided agreeable evidence of the first-flush effect for nutrients (Figure 3) and TSS (Figure 4), which is contrary to the conclusions in the 35-year-old Denver Urban Runoff Study [19].
TDS (Figure 5), conductivity, pH, and FIB did not show a consistent first-flush effect. TDS, conductivity, and pH could be influenced by variable water-quality factors, such as temperature and dissolved oxygen, that change during the course of a rain event. There were occasions where nutrient concentrations increased after the peak of the hydrograph, which could be related to these contaminants requiring time to dissolved or mobilize into the surface runoff during a rain event.
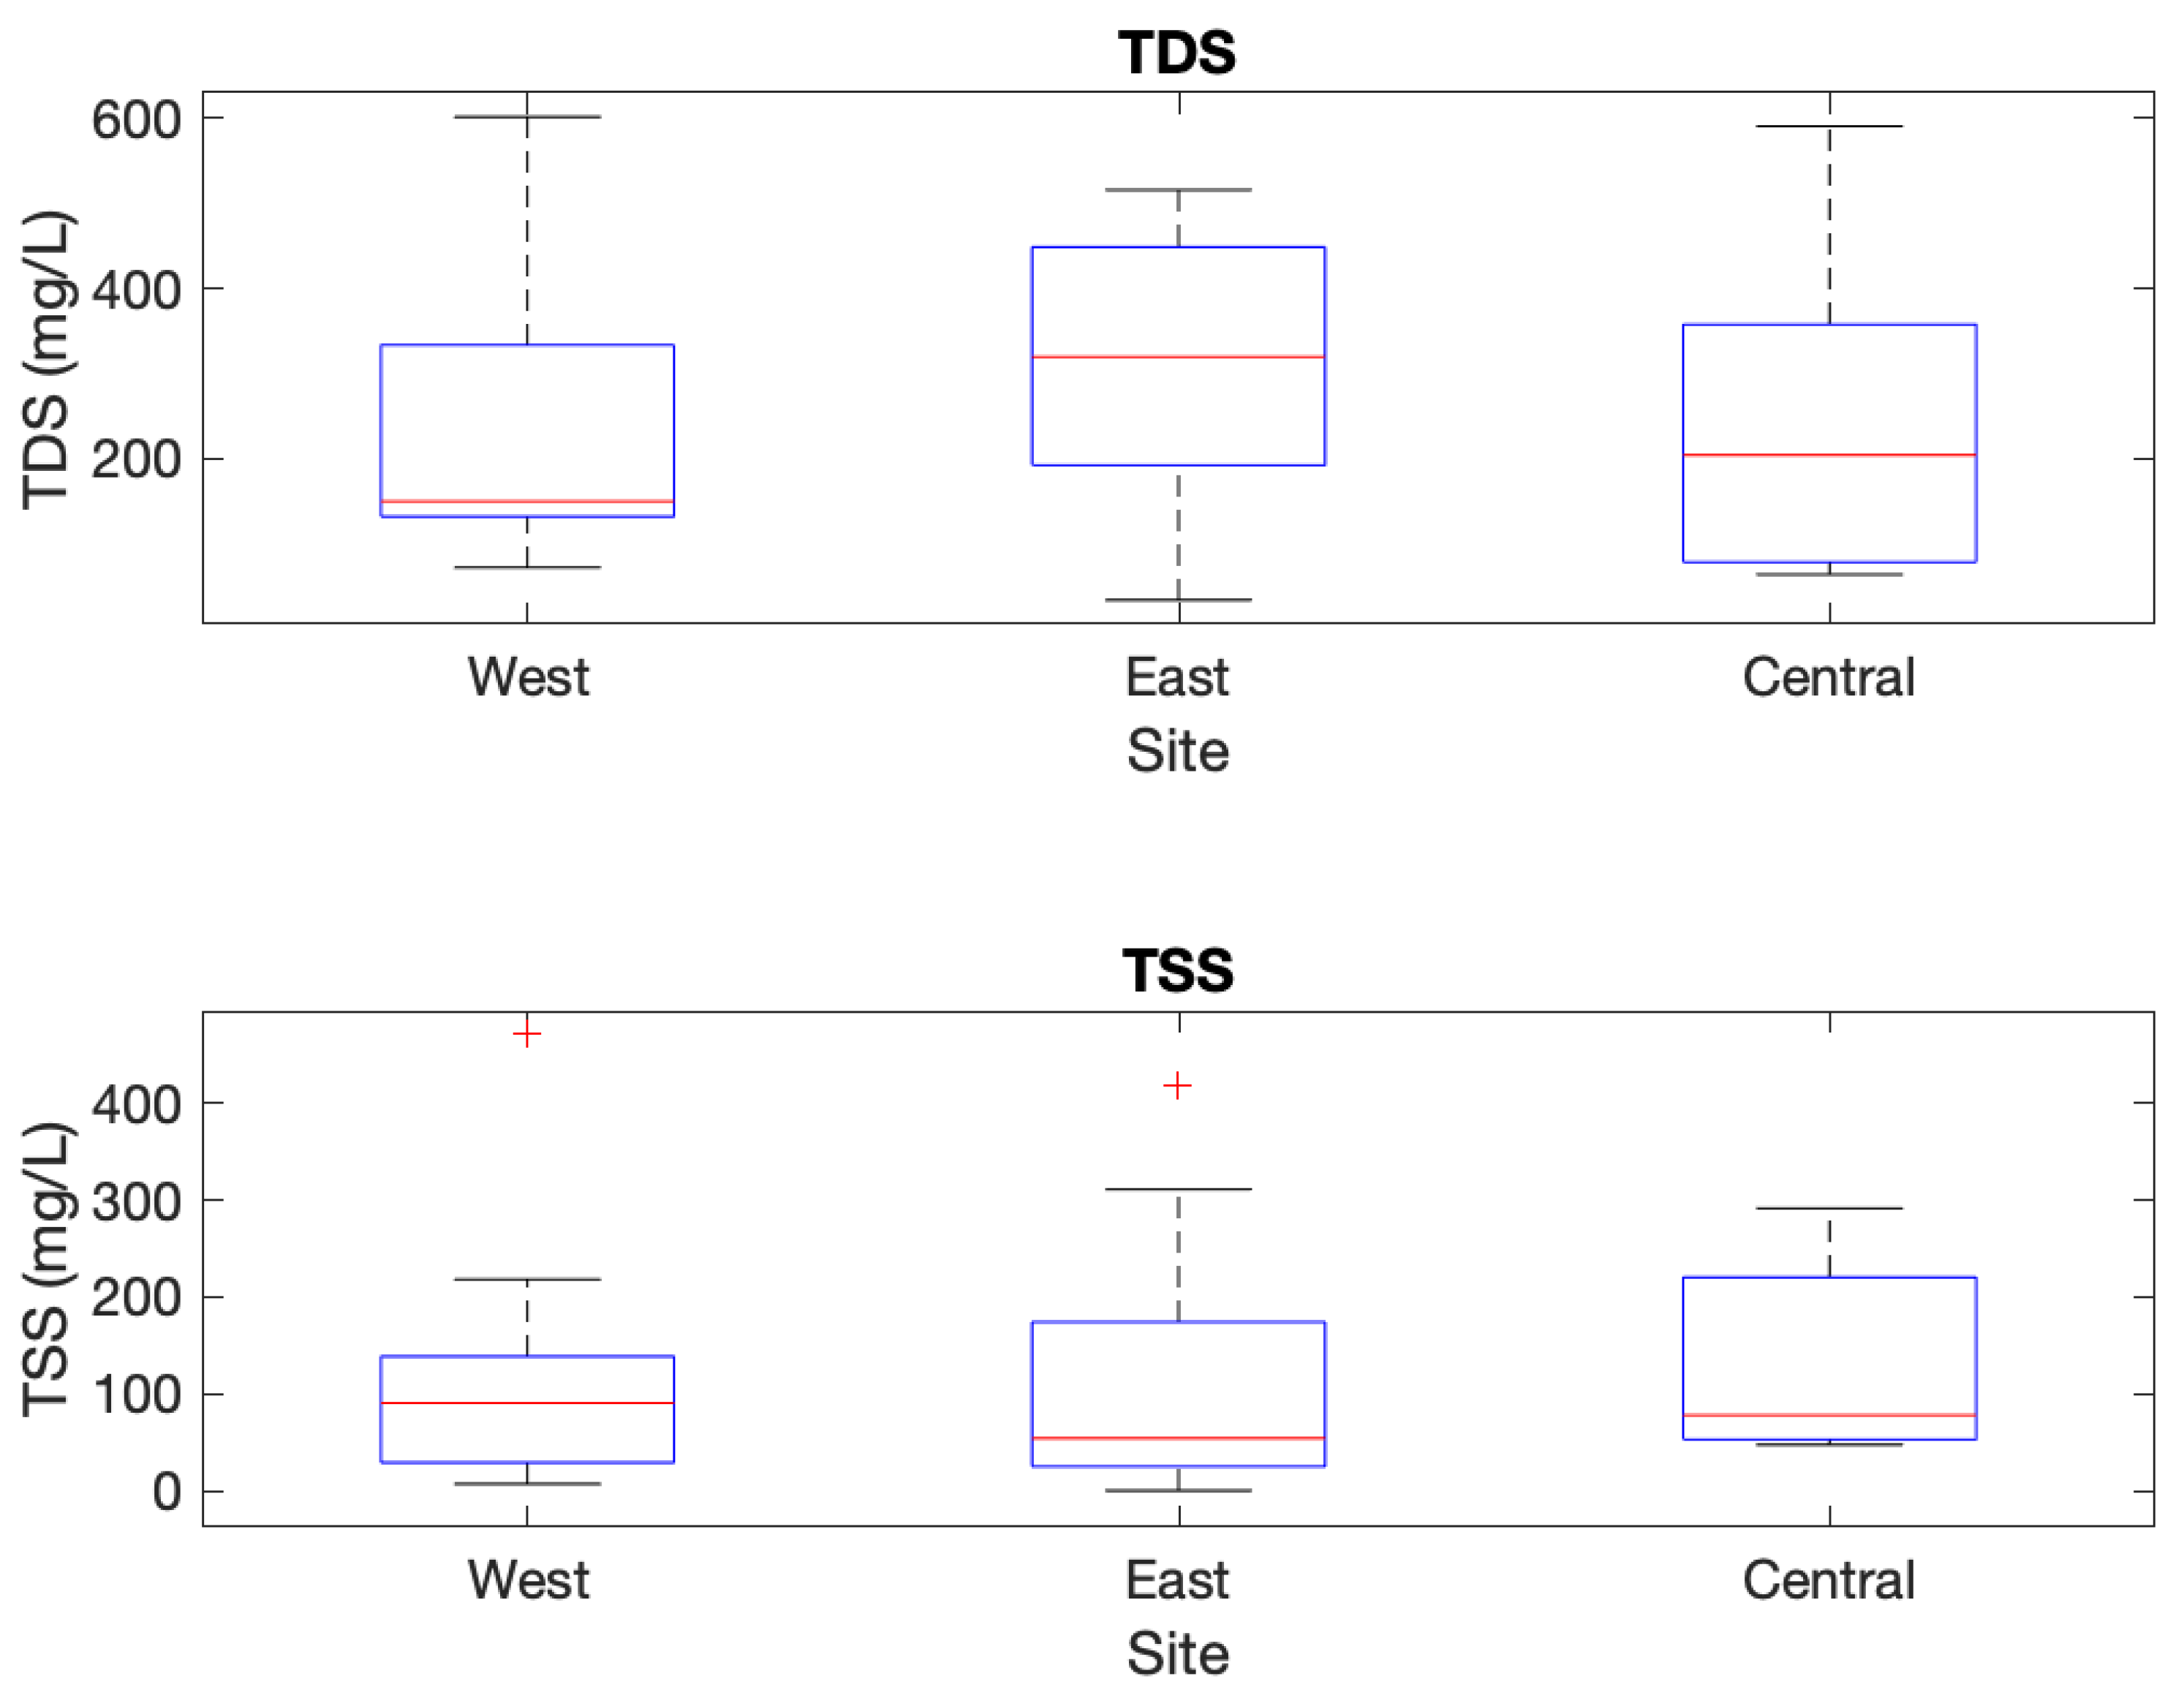
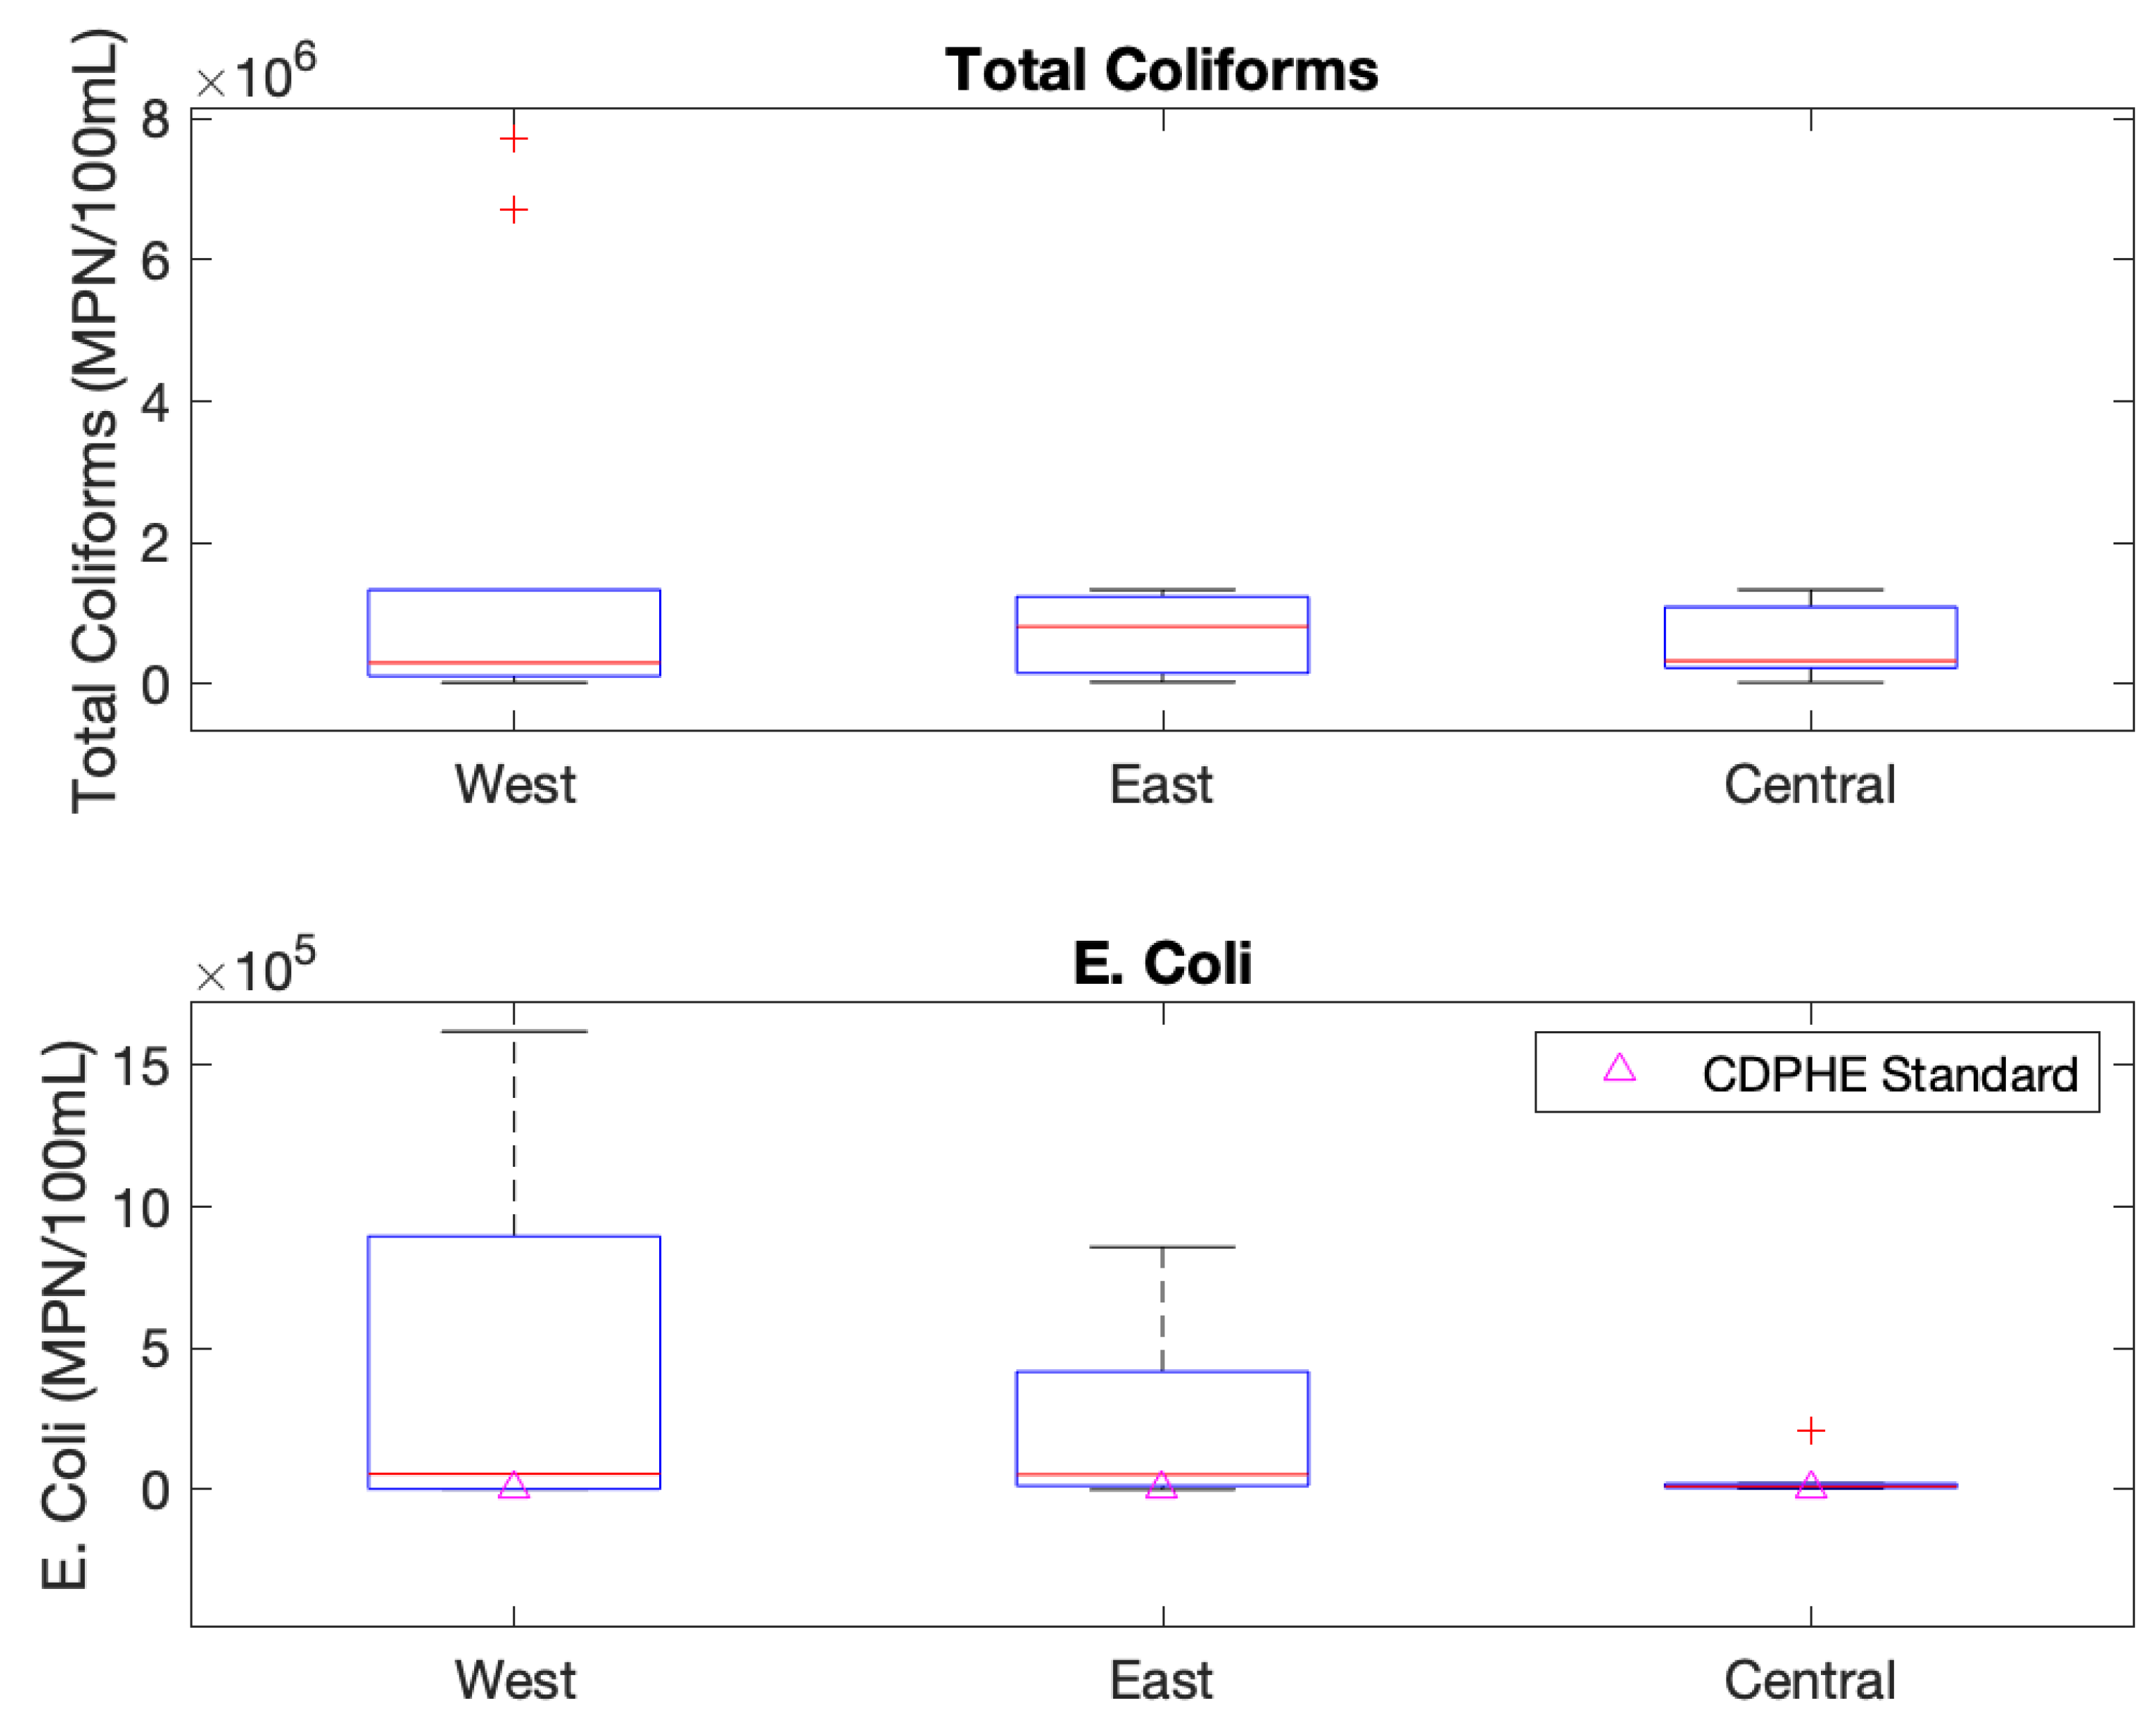
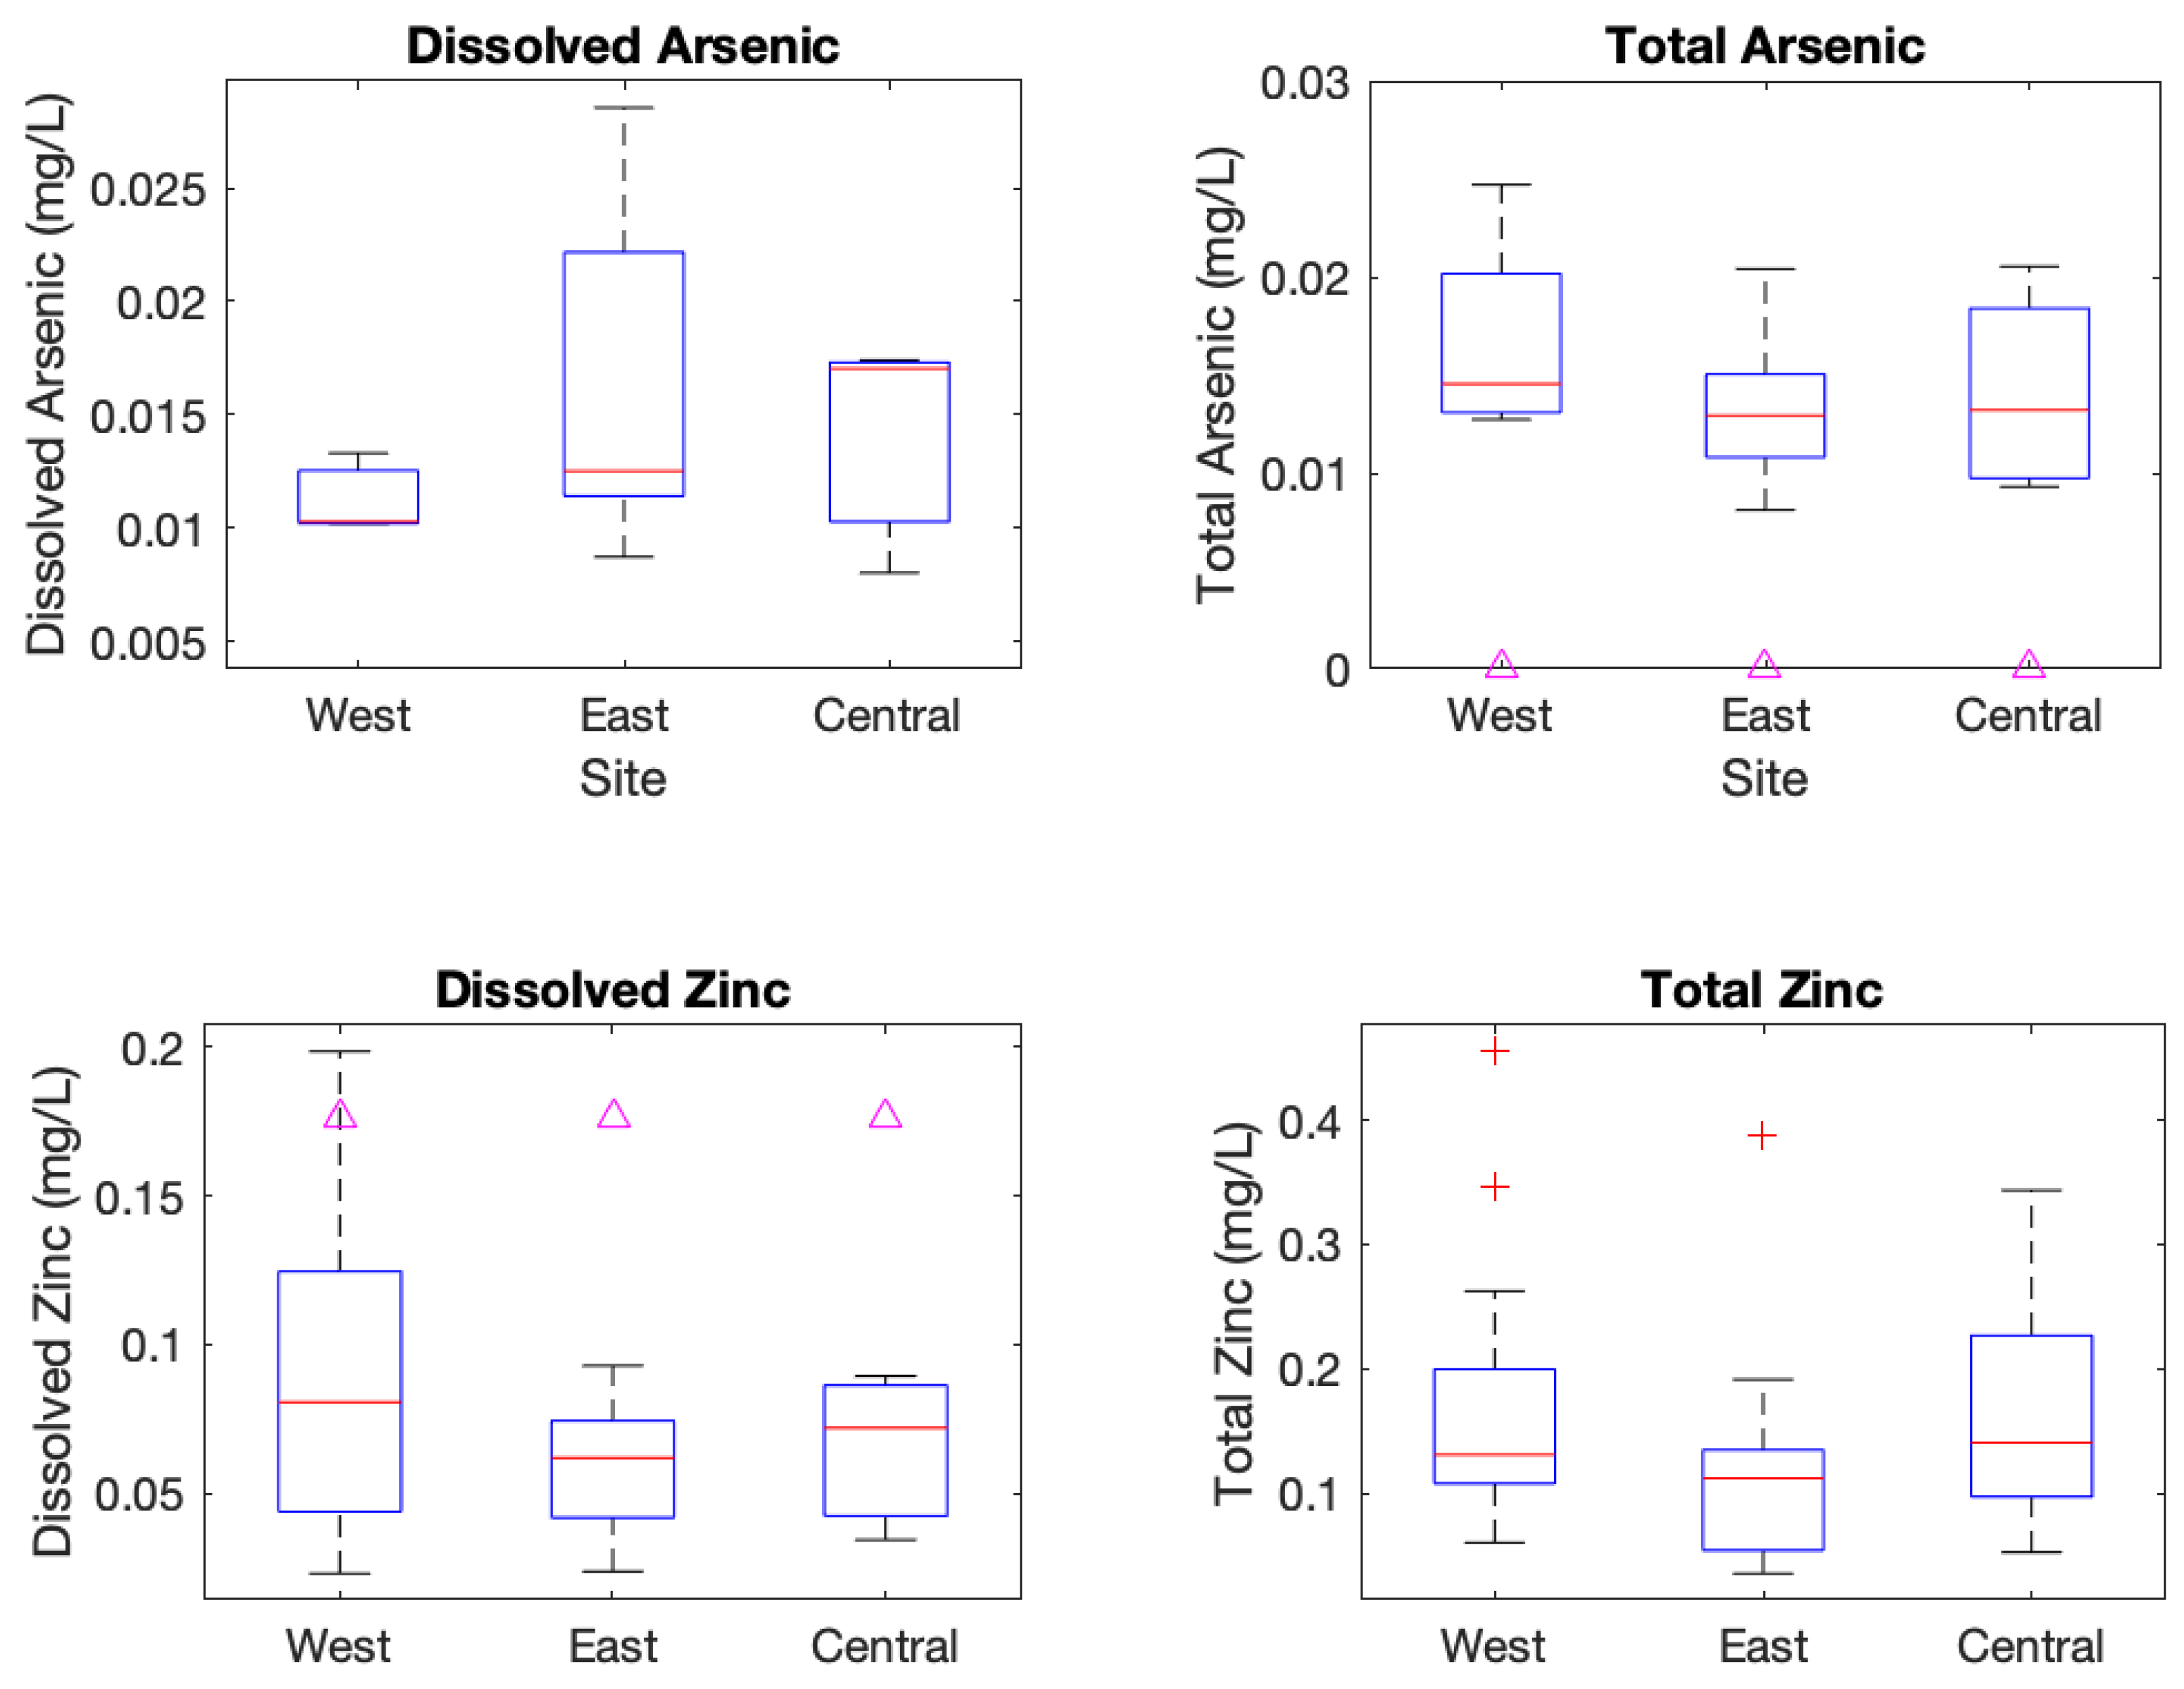
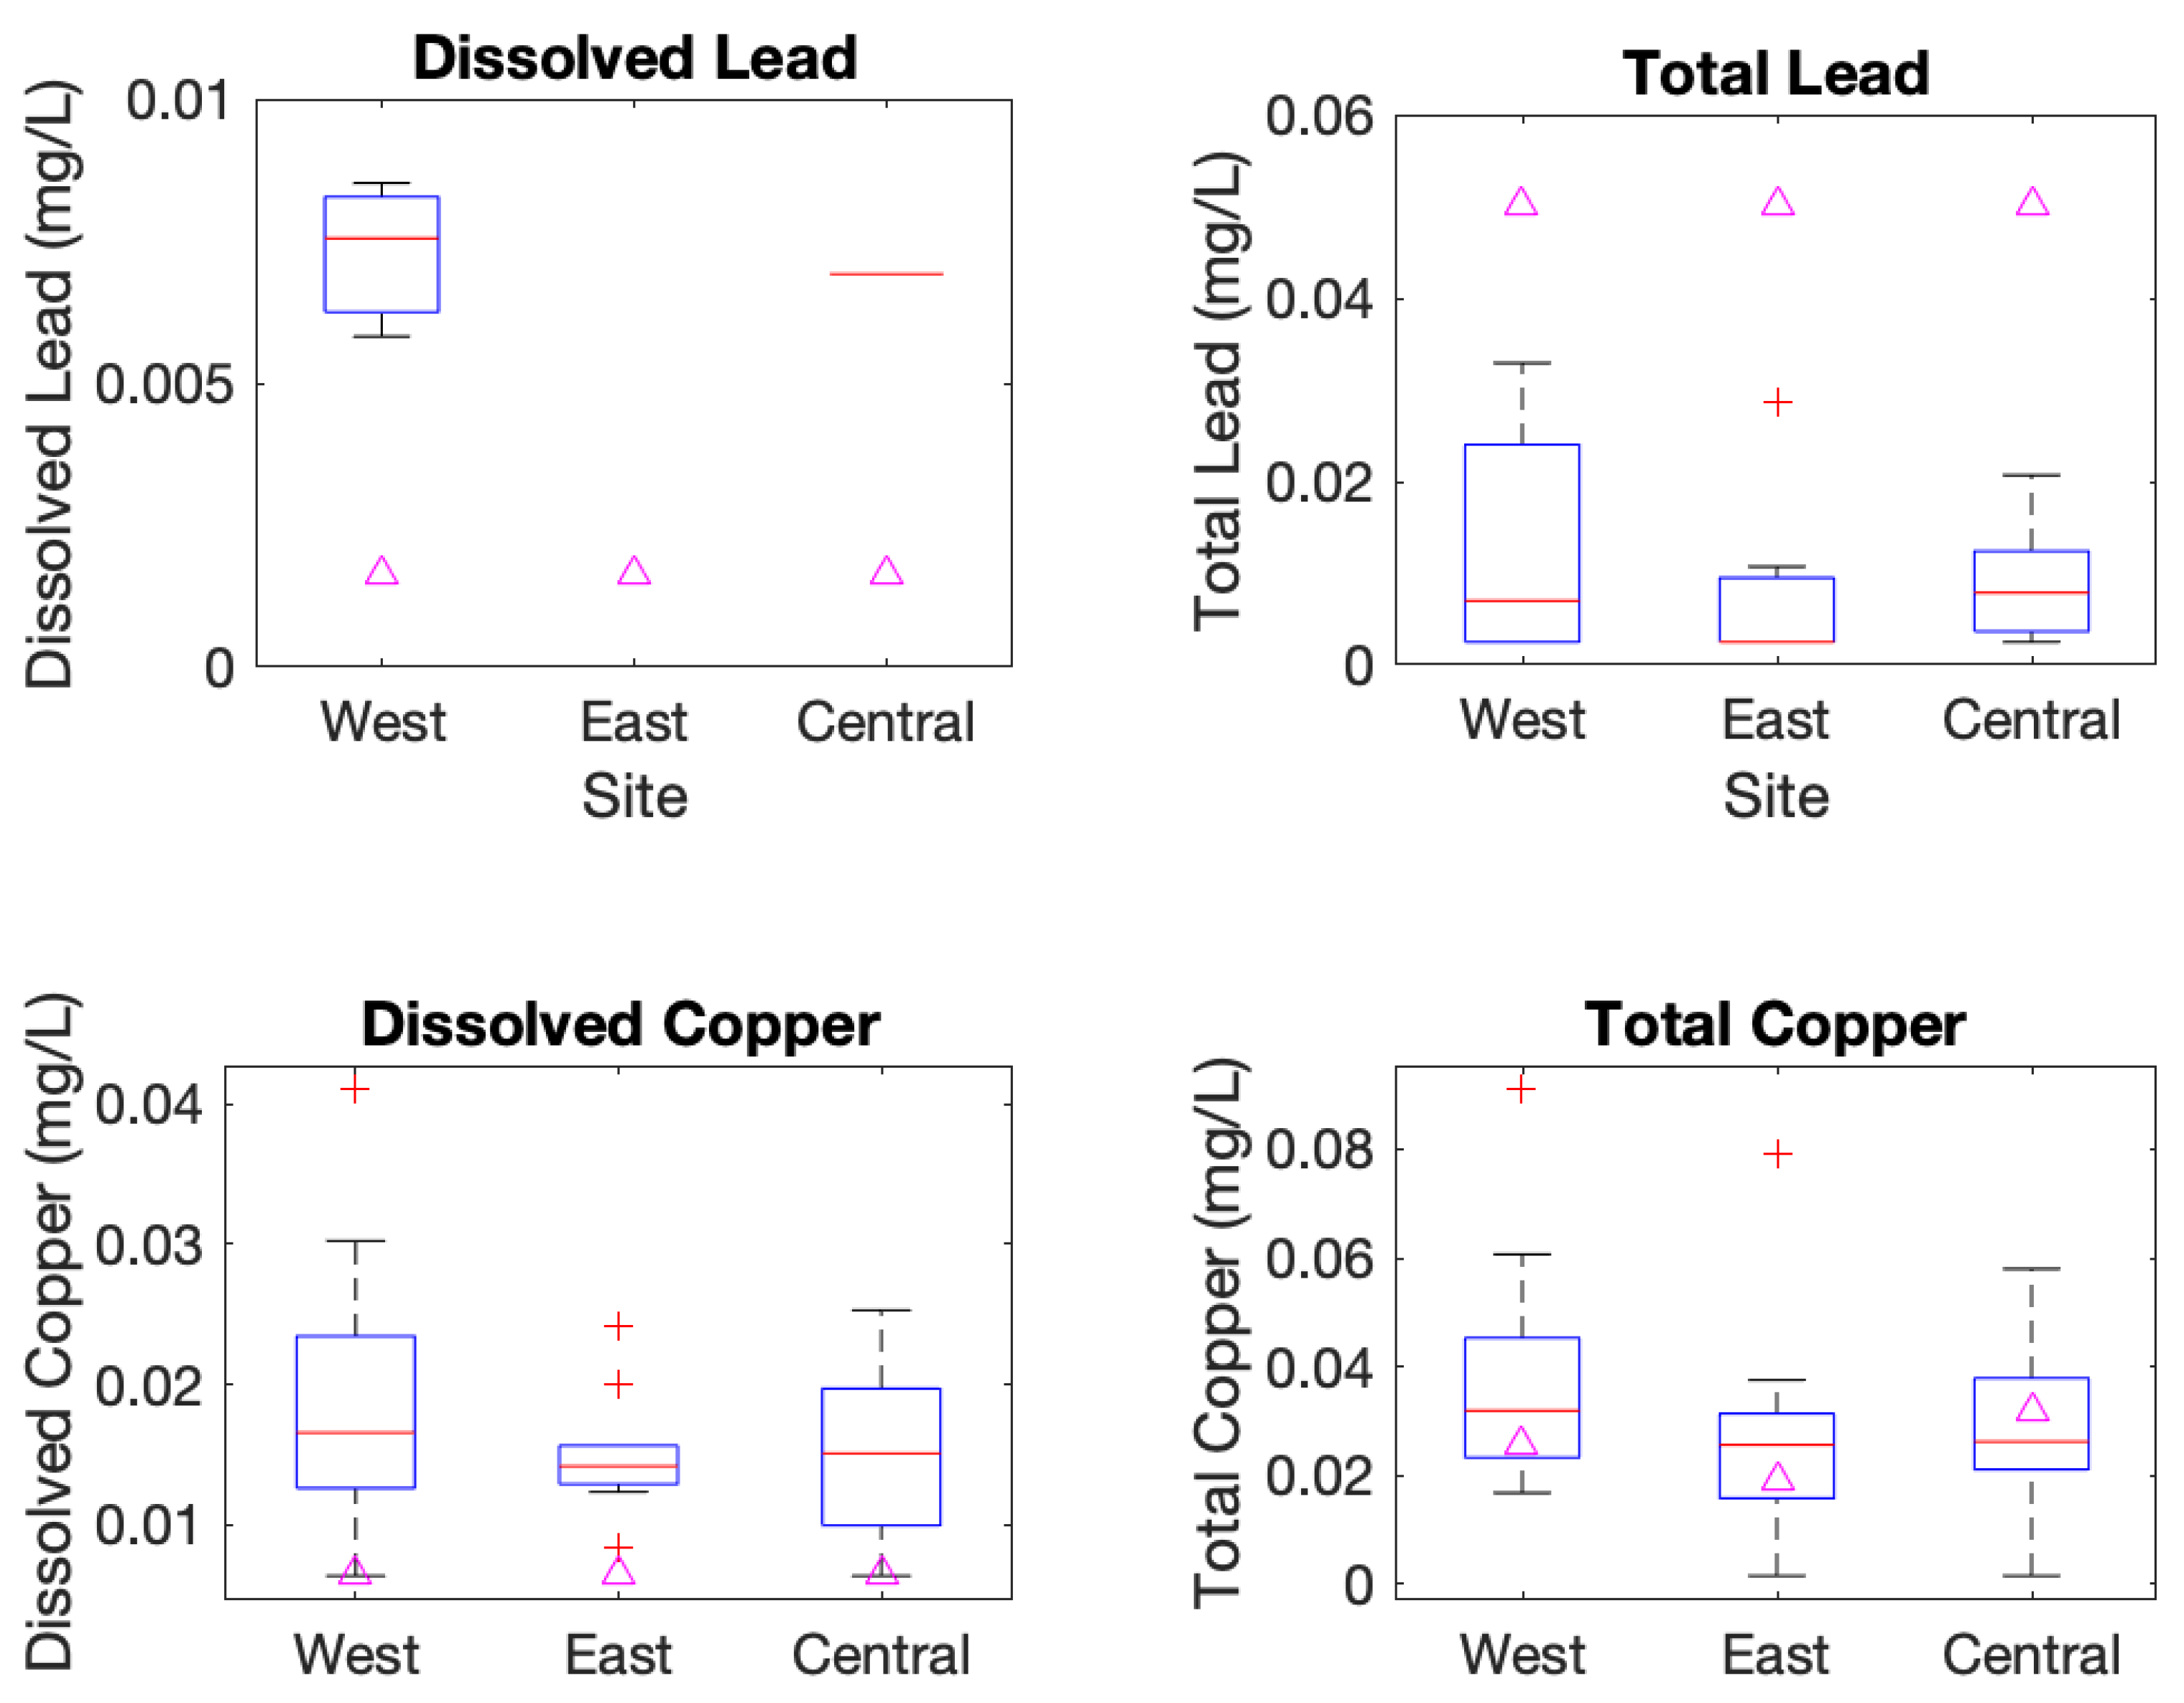
There were no statistically significant differences between local-scale EMCs for any analyte between the three basins regardless of differences in impervious coverage, zoning classifications, or infill redevelopment. Wet weather water quality showed very high levels of variability between storms, as shown by the boxplots of Appendix A Figure A1, Figure A2, Figure A3, Figure A4 and Figure A5. Owing primarily to this variability, there were no statistically significant differences in local-scale EMC values between the three sampling locations for any tested analyte, as previously mentioned. This variability complicates correlating local EMC values with changing impervious coverage. It is possible that the percentage impervious coverage between each sampling basins is not substantial enough to have an effect on water quality; however, the difference in impervious coverage between the East basin and the other two basins (47% vs. 56–59%) is certainly significant. A more likely factor is that, as mentioned earlier, each sampling basin already has very high imperviousness relative to the rest of Denver, or most cities, with relatively small increases in recent infill redevelopment. More significant conclusions may be drawn from a similar study that utilizes sampling locations with a larger range of imperviousness, although these would likely not be adjacent watersheds.
While there were no significant differences between sites for the analytes considered in this study, there were significant differences between local, neighborhood EMC values and the city-wide UDFCD regional EMC values for residential land use (recall, the average impervious area across Denver is 39%). Total nitrogen was significantly higher than city-wide values in the East basin (F(2,76) = 2.51, p = 0.06). Local EMCs for metals were also higher than the city-wide values, specifically for copper (p = 0.006), lead (p = 0.02), and zinc (p = 0.02). Our results agree with the Denver Urban Runoff Study, which showed TSS, total nitrogen, copper, lead, and zinc to contribute heavily to surface waters during rain events [19].
While it is difficult to pinpoint the exact reason EMCs from the three sampling locations are significantly higher than city-wide (i.e., UDFCD) values, it is likely due to recent changes in development patterns, land cover, and imperviousness. The city-wide values utilized a dataset comprising stormwater studies conducted in Denver with a range of imperviousness, type of residential development, and overall outdated land coverage. Many of the data points used for the UDFCD city-wide values were from studies conducted over two decades prior, which may not be representative of current land cover conditions in residential areas in Denver that have experienced infill redevelopment. The changes in land coverage should have a substantial effect on stormwater quality, rendering the application of the UDFCD values useful for certain areas of Denver that have undergone limited infill redevelopment or substantially altered land cover. The local EMC values determined in this study should be considered more applicable to areas of high imperviousness (i.e., between 46 and 59%) that have undergone similar levels of infill redevelopment. Some recent data (2019) collected over the entire city by UDFCD and a contracted consulting company are generally consistent with the older UDFCD water-quality data [45]. This observation suggests that the scale of data collection may be more responsible for water-quality changes than changes in urban land use over time; however, a much more detailed analysis would be needed to confirm this contention.
Peak rainfall intensity showed significant but weak correlations with phosphorus (R = 0.72), ammonia (R = 0.57), TSS (R = 0.75), total arsenic (R = 0.52), total copper (R = 0.64), total lead (R = 0.56), total zinc (R = 0.75), and dissolved copper (R = 0.51), as seen in Appendix A Table A1 and Table A2. Total rainfall depth showed significant but weak negative correlations with TDS (R = −0.46) and total arsenic (R = −0.42). The negative linear correlation is likely linked to TDS and arsenic concentrations being diluted with increasing runoff volumes. These relatively weak correlations may be related to non-linearity between concentrations and rainfall intensity, as reported by Liu et al. [21].
Correlation with antecedent dry days showed similar results to peak rainfall intensity but correlation coefficients were very weak. Highest significant correlations occurred with phosphorus (R = 0.66) and total lead (R = 0.57). These results agree with the Denver Urban Runoff Study conducted from 1974 to 1979, which did not show significant effects of water quality on antecedent dry conditions [19]. Correlations with imperviousness did not prove illustrative due to the limited amount of sampling locations. Imperviousness did not have significant correlations with any of the analytes. Results from direct correlation of EMC values and impervious coverage might be more conclusive if sampling sites with more variable impervious coverage were utilized.
Some correlation relationships that were expected proved not to be significant. Namely, it was expected that total coliforms and E. coli should positively correlate with TSS concentration. This was not supported by the correlation analysis, with R-values of 0.10 for total coliforms and 0.21 for E. coli. It is likely that FIB are more influenced by local site conditions and biofilm growth than by factors controlling TSS or antecedent dry periods. The lack of strong and significant correlations between local EMC values and antecedent dry days was unexpected due to conclusions presented in previously reported studies [21,23]. Liu et al. [21] concluded that stormwater quality is not linearly associated with rainfall intensity, but a correlation should exist if both rainfall intensity and duration are accounted for. It is possible that additional relationships exist within the collected dataset but are not simple linear relationships that can be illustrated by using a Pearson Correlation analysis. The pervasive data variability between sites and storms also makes statistically significant correlations less likely, even if physically valid [46].
Results from ANCOVA, as seen in Appendix A Table A3, Table A4 and Table A5, clarify the effects of peak rainfall intensity, antecedent dry days, and total rainfall depth, respectively, suggesting that the limited variability is explained by the selected confounding variables (i.e., the partial eta-squared values being near or lower than 0.2). It was possible for any of those uncontrolled factors to influence comparisons between sites, but results from this study (see Appendix A Table A3, Table A4 and Table A5) conclusively show limited variability, which can be explained by these factors alone. This result agrees with findings from the Denver Urban Runoff Program [19], which showed that antecedent dry conditions did not significantly affect water quality. Liu et al. [21] also reported similar findings, in the sense that the relationship between water quality and rainfall intensity is non-linear and the intensity may not explain water-quality variability. These results also illustrate that the data variability derives from other unquantified sources.
The high rates of variability seen in this dataset is due to highly variable local conditions and non-systematic causes. Many complicated factors contribute to this variability but most of it is likely due to small changes in the drainage area that affect water quality. Examples of actions or variables that affect water quality could include pet waste distribution, frequency and intensity of lawn fertilization, lawn care and leaf litter, improper disposal of consumer waste, car washing in streets using various automotive cleaning supplies, local traffic patterns and traffic control devices, building material degradation, leaking automotive fluids, and many others [47]. These variables are not systematic and a practical method to assess them at the basin scale does not exist.
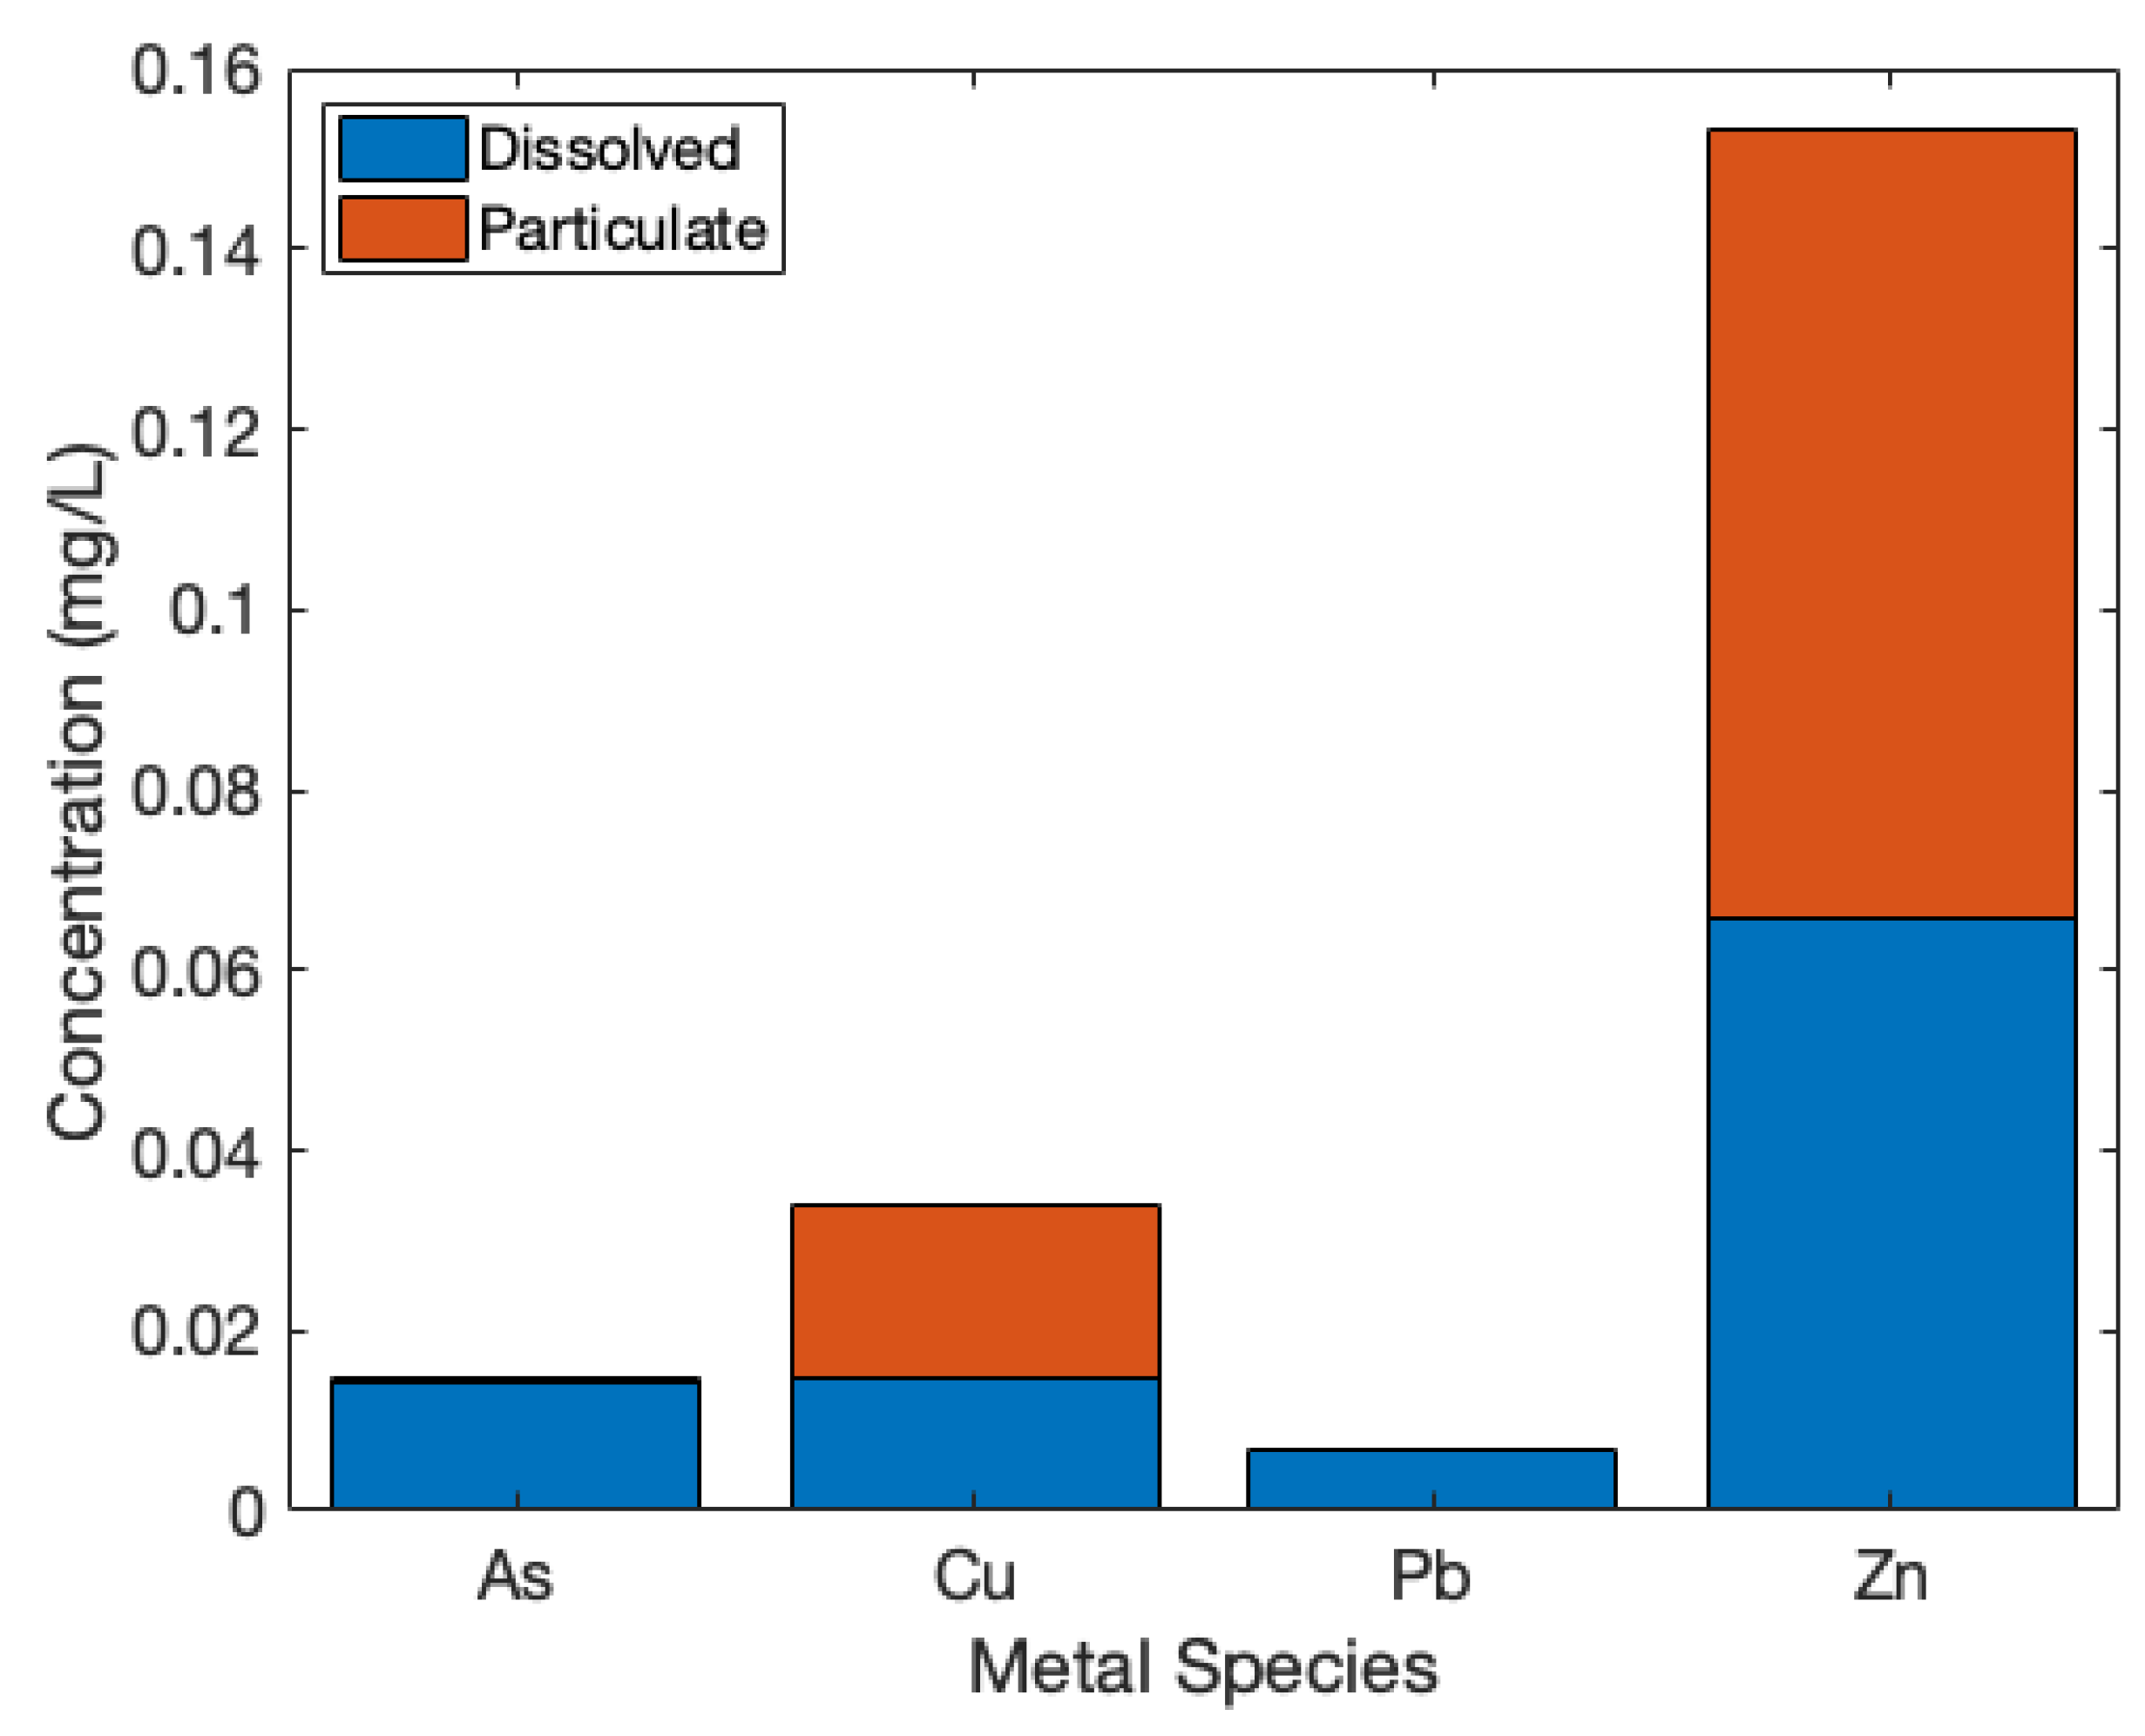
Mean EMCs for particulate and dissolved metals, as shown in Appendix A Figure A6, indicate that arsenic and lead exist in stormwater predominantly as a dissolved species, with only limited loading from particulate associated to both metals. Both metals are highly toxic and very costly to remove, even with traditional water treatment methods. Because there is a current CDPHE in-stream water-quality standard for dissolved and total recoverable arsenic and lead in the receiving stretch of Clear Creek [40], BMP treatment in this area would be beneficial for stream quality. Copper and zinc, on the other hand, exist in nearly equal concentrations as both dissolved and particulate forms, being zinc the metal with highest concentrations (see Appendix A Figure A6. BMPs that utilize fine filtration have the potential to reduce surface water particulate-phase loading of these metals.
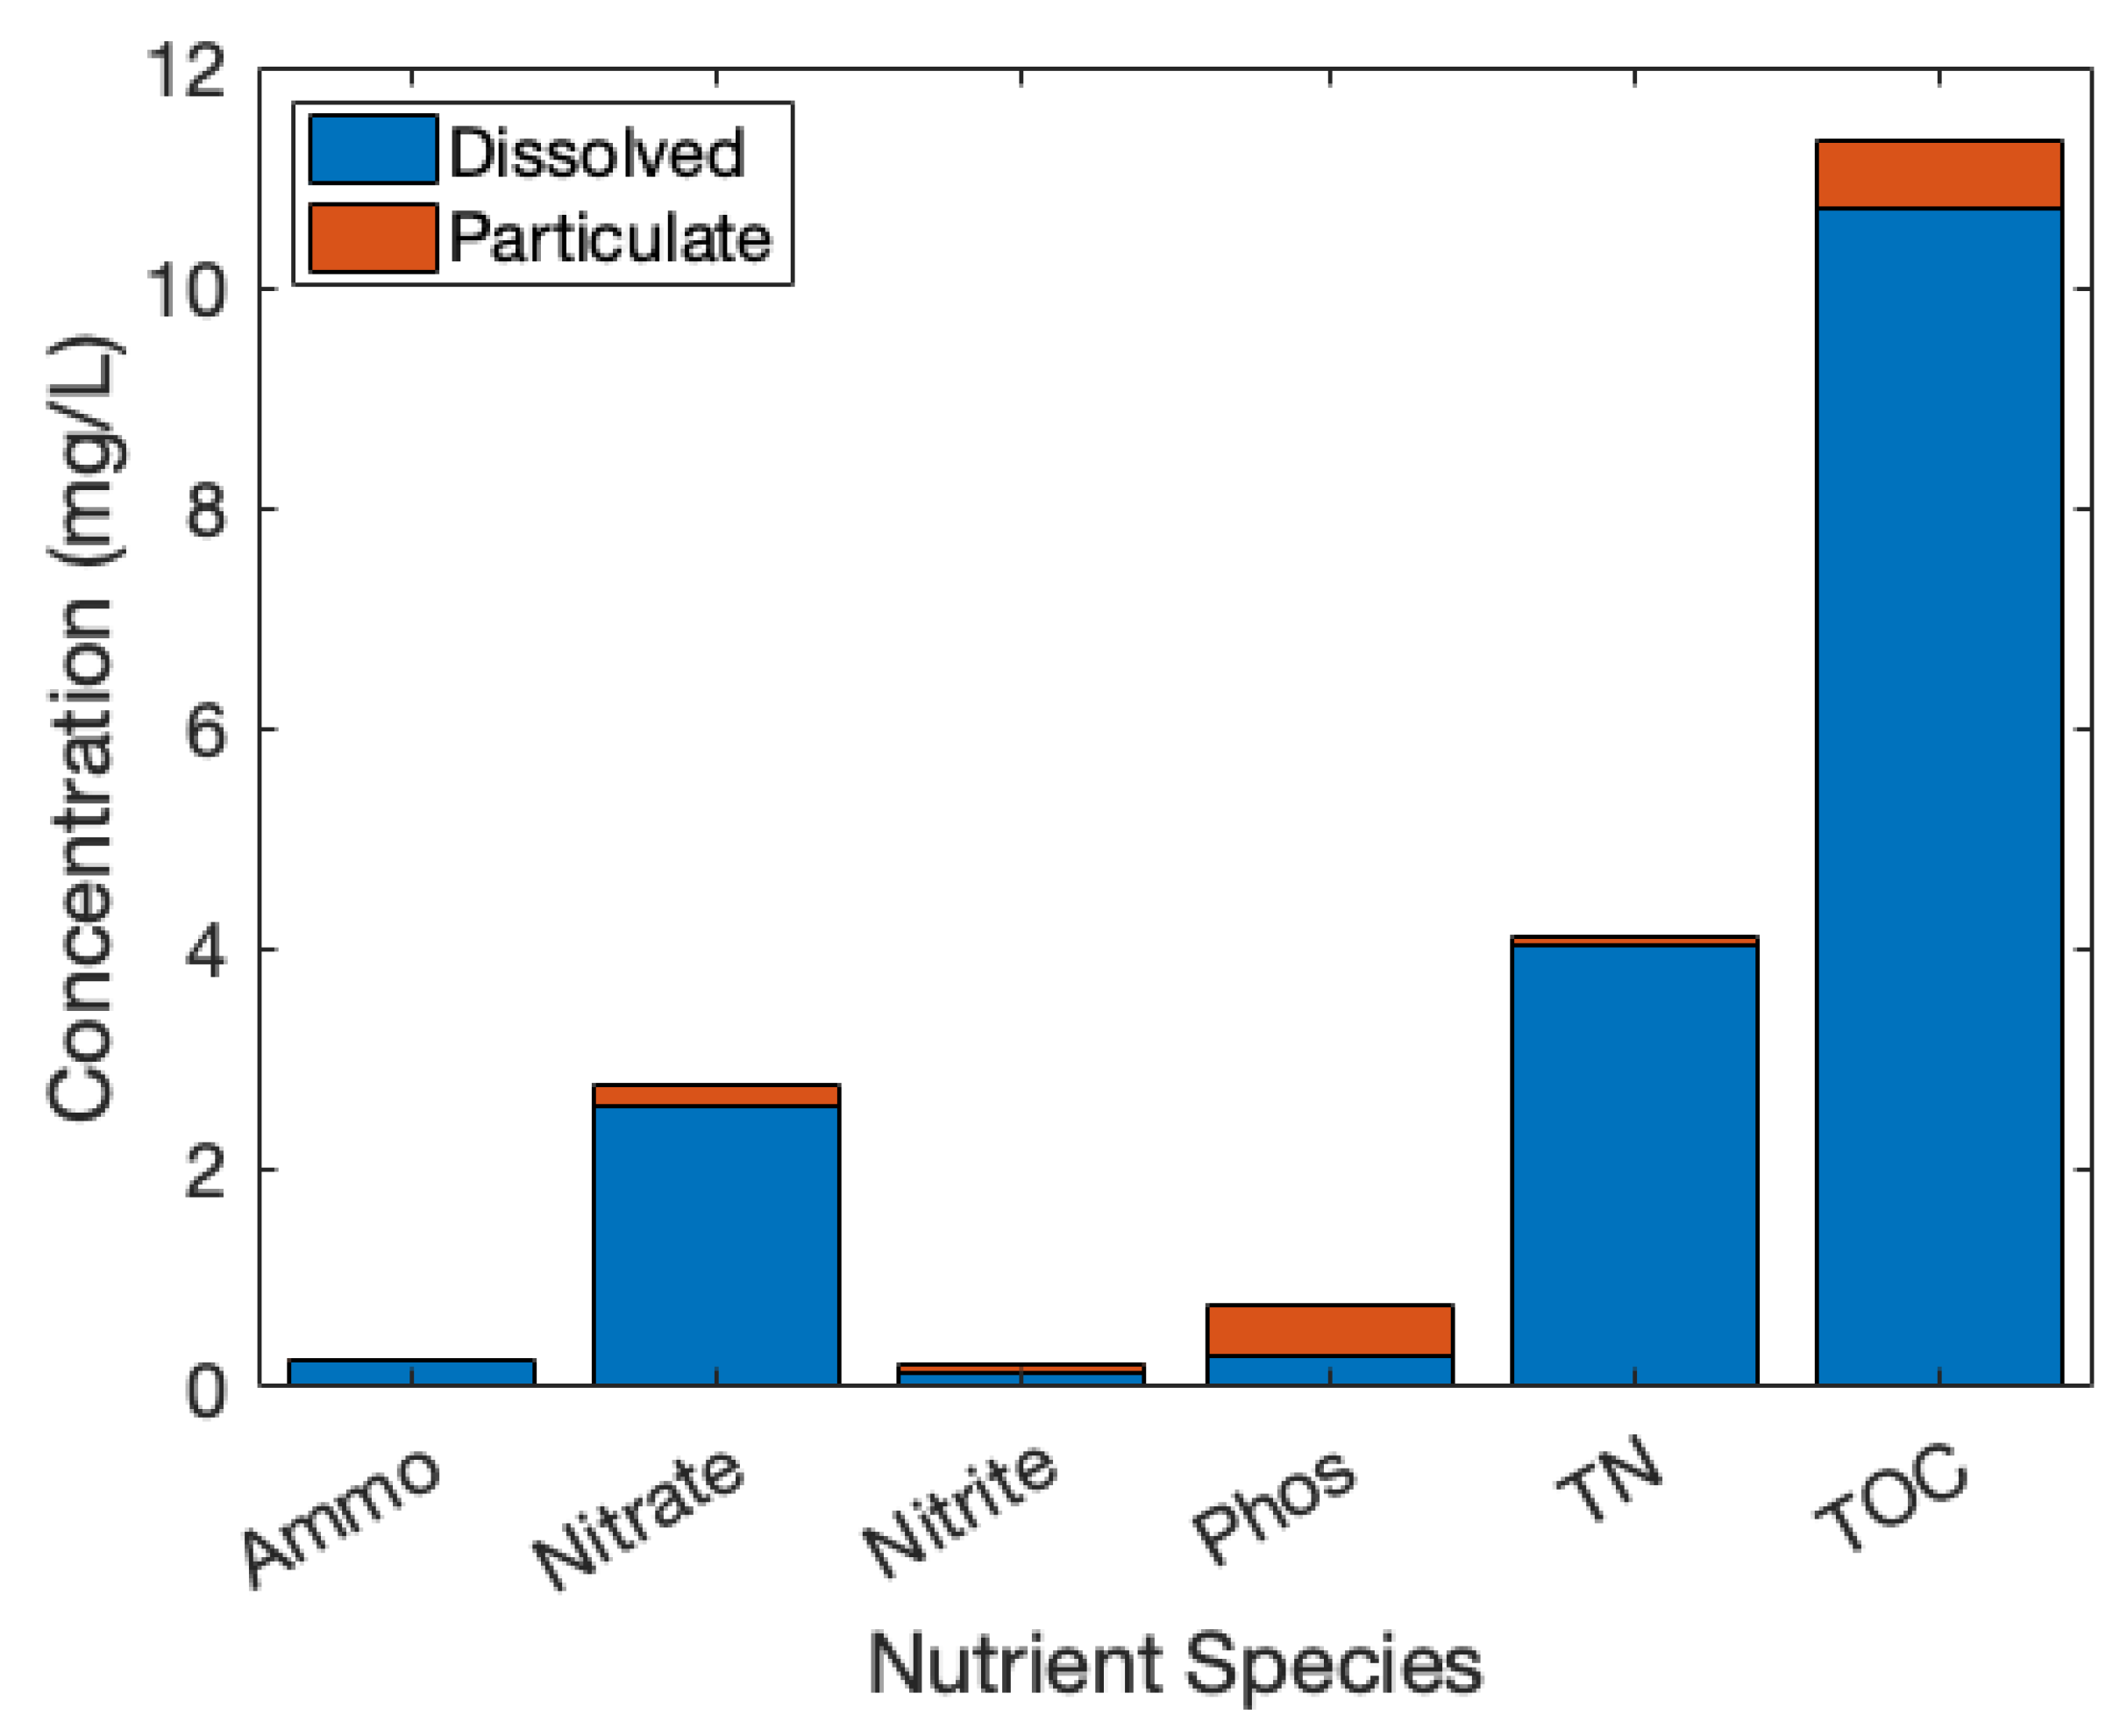
Three storms were analyzed to assess the relative proportion of dissolved and particulate-associated nutrients, and the results are displayed in Figure A7 The majority of nutrient species is present in stormwater as dissolved species. The exceptions are phosphorus and nitrite, which are 60% and 48% associated with particulates, respectively. Porous media BMPs devices are more likely to treat dissolved species via microbiological transformation or physicochemical processes (i.e., sorption, chemical precipitation, etc.). Phosphorus is one of the leading concerns to stormwater managers due to eutrophication issues in downstream watersheds [48]. Phosphorus will become even more important in Denver based on new regulations from the state that require use of phosphates during water treatment to minimize lead-pipe corrosion. As discussed previously, local EMCs for phosphorus are already higher than CDPHE standards for Clear Creek. The presence of 60% particulate-associated phosphorus means filtration-focused BMPs could be used to substantially reduce phosphorus loading from Berkeley stormwater.
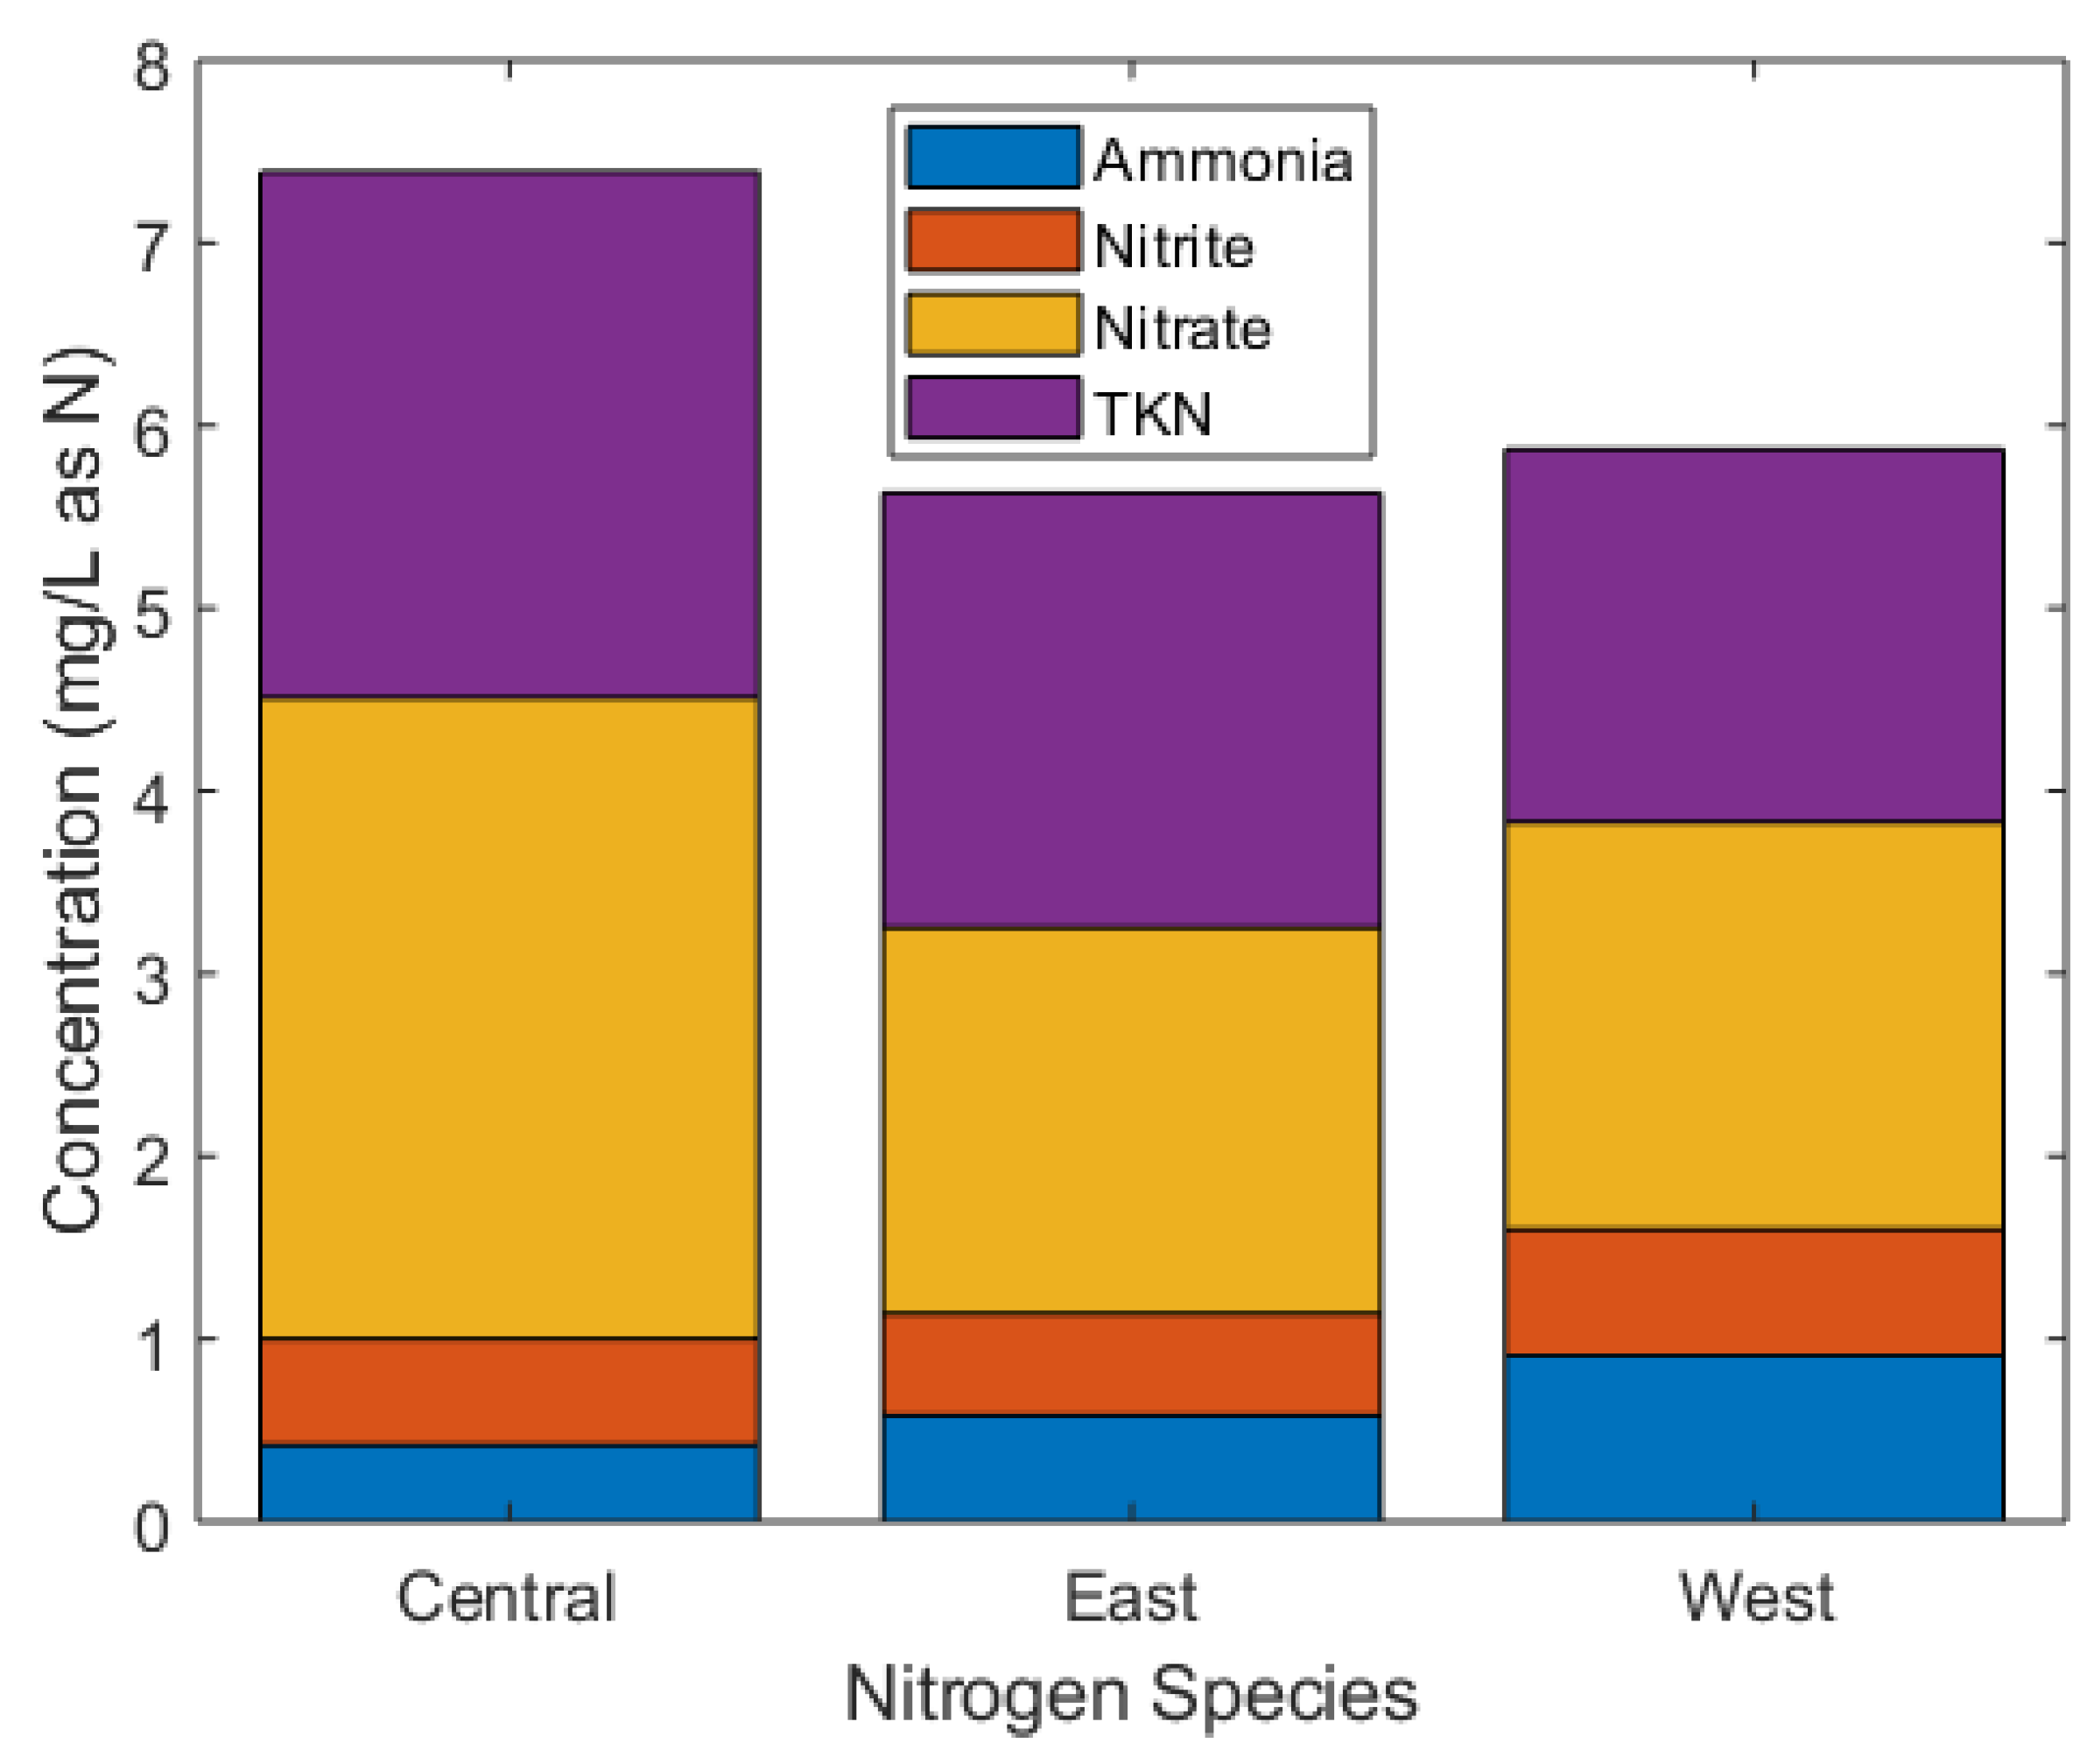
The distribution of nitrogen species may be of concern to stormwater managers in areas because of an active TMDL for ammonia in Segment 15 of Clear Creek (COSPCL15), where the Berkeley neighborhood’s storm system drains [41]. Figure A8 shows the distribution of nitrogen species between ammonia, nitrite, nitrate, and Total Kjeldahl Nitrogen (TKN) at each sampling location. TKN (i.e., organic nitrogen plus ammonia) and nitrate are the dominant nitrogen species at each location, both of which account of around 30% of total nitrogen. Nitrite and ammonia both contribute substantially less nitrogen and account for an average of 8% and 7%, respectively, meaning the TKN is primarily organic nitrogen, which can transform microbiologically to ammonia (called ammonification) under certain environmental conditions. Ammonification occurs more rapidly in oxidative conditions (expected in urban streams), but also depends on temperature, pH, and C/N ratio, and is more typically associated with microbes in soil. In any case, ammonification is not occurring in these urban surface water. CDPHE has established interim water-quality standards for total nitrogen on the receiving reach of Clear Creek [40]. By knowing the distribution of nitrogen species, stormwater managers can better understand which species is of greatest impact to total nitrogen concentrations and which can be best controlled by using tailored BMPs or other institutional controls.
Comparison of mean wet weather EMC values with CDPHE standards for Clear Creek show that some contaminants should be of concern to stormwater managers. Mean values of E. coli, acute copper, and chronic arsenic are all over CDPHE water-quality standards. These concentrations will be diluted with lake overflow prior to discharge to Clear Creek but the sampled basins are contributing to surface water contamination. Ammonia, nitrite, nitrate, lead, acute arsenic, and zinc are below state-regulated standards.
To better assess true changes to water quality due to increasing infill redevelopment, a longer-term study could buttress the findings in this study. The high rates of variability in contaminant EMCs for wet weather events complicate drawing conclusions between sites due to relatively small differences in land cover and increased infill redevelopment. The collected data from 2018 to 2019 showed no significant differences between the three basins for any contaminant (ANOVA/ANCOVA, p > 0.05), even though the three sampling basins have substantially different zoning, impervious coverage, and rates of infill redevelopment. Building off this data and continuing a longer-term study, possibly choosing sites with stronger development gradients (as previously mentioned), or sampling sub-watersheds where the impacts of infill development are more different between sites, could clarify findings and provide additional data for whether or not infill is influencing water quality. Each sampling basin will continue to undergo infill changes and a long-term study with more data could demonstrate significant changes with more confidence.
Percent imperviousness thresholds for other water-quality impact measures have been determined in other studies. For example, nutrients have been shown to drastically increase at over 42% imperviousness, stream and lake eutrophication increases at 30% imperviousness, metals concentrations increase at 50%, and TSS concentrations increase between 20 and 50% [28]. These percentages are below that of many redeveloping, neighborhood-scale urban watersheds in Denver, which are typically above 40% due to infill redevelopment. Water-quality degradation for the higher imperviousness common with infill redevelopment has not been previously investigated. The low imperviousness thresholds for impacting water quality require a multi-faceted approach to stormwater management to offset the effects. Currently, Denver requires water-quality controls for development greater than 1 acre (0.4 ha) However, most infill redevelopment occurs on much smaller lots; according to Cherry et al. [32], the average size of a redeveloped lot in the Berkely neighborhood is 0.10 ha, and 86% of redevelopment across the city occurs on lots less than 1 acre (0.4 ha). Consequently, the City of Denver has considered requiring water-quality controls for smaller redeveloped lot parcels (Personal communication with Denver stormwater engineers, 2018). However, because the impacts of infill redevelopment on urban water quality are assumed and not known, and data obtained from this study were proposed to evaluate whether new regulations are justified. Because re-development is occurring in discrete neighborhoods in discrete time periods, local (neighborhood-scale) stormwater sampling campaigns are most appropriate and promote “data-based decision making”.
Though urban hydrology studies generally focus on stormwater evacuation (a very important field of research) (e.g., References [49,50,51]), stormwater quality is equally relevant, as it directly affects aquatic ecosystems (e.g., References [52,53,54,55] and many others) and groundwater resources. This investigation was based on the findings by Gustafson [56] and represent the beginning of a new research approach to evaluate how changes on urban imperviousness (at a neighborhood scale) can potentially damage our environment.

4. Conclusions

Due to high variability in analyzed samples, it was determined that no significant differences existed between local, neighborhood-scale EMCs among the three sites, as supported by ANOVA. This result complicates correlating increases in imperviousness to water-quality values and is likely due to variations in actions and variables that could affect water quality that cannot be accurately quantified, such as lawn fertilization, leaf litter, improper disposal of consumer waste, car washing in streets using various automotive cleaning supplies, local traffic patterns and traffic control devices, building material degradation, leaking automotive fluids, and many others. Another explanation is the already high levels of imperviousness at each sampling location. The West, Central, and East basins have imperviousness of 56%, 59%, and 46%, respectively, which is substantially higher than the city-wide average of 39% and higher than values considered in nearly all the studies described in the literature review of this paper. Each basin had higher local EMCs of dissolved phosphorous, TDS, total copper, total nitrogen, and total zinc than the previously reported city-wide EMC values [43], while local EMCs for TSS and total recoverable lead were lower than city-wide values for residential land use. The East basin, which had the most impervious coverage, showed higher concentrations of TSS than the other basins, while also showing the lowest concentrations of ammonia. No significant correlations between water quality and land-use or zoning categories were found.
Within the collected dataset, some water-quality constituents had weak but significant correlations with storm variables such as rainfall intensity and antecedent dry days. Peak rainfall intensity showed the strongest positive correlation with ammonia, TSS, total arsenic, total copper, total lead, and total zinc. Weak but significant correlations were seen between antecedent dry days and total lead. Some correlation results match comparable results from the literature, but a more significant correlation with antecedent dry conditions was expected. Additional variability due to uncontrolled, confounding variables such as rainfall intensity, antecedent dry days, and rainfall depth were determined to not significantly affect the results of the Pearson Correlation assessment. Contrary to what was expected, total coliforms and E. coli were not correlated with TSS. Finally, first-flush effect observed for nutrients and TSS, but not for TDS, conductivity, pH, and FIB.
Despite the above, the most relevant finding of this study is that, although there were no significant differences in local EMC values between the three basins, several local (neighborhood-scale) EMC values were significantly different than established city-wide values. This indicates that the city-wide EMC values are not rigorously applicable to smaller portions of a city experiencing noticeable land cover change or infill redevelopment, which is mostly occurring at the neighborhood scale. This is an important finding, suggesting that local-scale stormwater sampling provides a more accurate picture of non-point source pollution emanating from urban areas than would otherwise be expected based on currently used city-wide EMC values.
Nevertheless, this study had limitations, being the main one a lack of sufficient changes on infill redevelopment among the three evaluated urban watersheds. Considering the above statement, the authors suggest further studies to replicate what has been done here, but including a set of urban drainage areas with larger infill redevelopment differences among study sites. Similarly, other contaminants could be included such as polycyclic aromatic hydrocarbons (PAH), benzene, toluene, ethylbenzene, and xylene (BTEX), and other traffic-related pollutants.
Results suggest that locally focused stormwater monitoring can aid data-driven decision-making by city planners where redevelopment is occurring at local “neighborhood scales”, particularly for the implementation and management related to green infrastructure and water-quality regulations.

Author Contributions

Conceptualization, J.E.M., K.R.G., and K.M.S.; methodology, J.E.M., K.R.G., and K.M.S.; validation, J.O.S. and P.A.G.-C.; writing—original draft preparation, K.R.G. and P.A.G.-C.; writing—review and editing, J.E.M., J.O.S., and P.A.G.-C.; project administration, J.E.M. and K.M.S.; funding acquisition, J.E.M. All authors have read and agreed to the published version of the manuscript.

Funding

This work was supported by the National Science Foundation-funded Engineering Research Center (ERC) for Reinventing the Nation’s Urban Water Infrastructure (ReNUWIt) (NSF EEC-1028968), a grant from the Colorado Higher Education Competitive Research Authority.

Institutional Review Board Statement

Not applicable.

Informed Consent Statement

Not applicable.

Data Availability Statement

The data presented in this study are available in the Appendix A.

Acknowledgments

We gratefully acknowledge Darren Mollendor and Jeff Williams from the City and County of Denver for installment and providing access to automated flow measurement devices and associated data in the storm sewers, and for providing expert advice during this research.

Conflicts of Interest

The authors declare no conflict of interest.

Appendix A

Table A1. Person’s Correlation R-values for wet weather water quality, excluding metals. Highlighted values are R-values that are statistically significant at the 5% significance level.
R-ValuesPhosphorusAmmoniaNitriteNitrateTNTSSTDSTotal ColiE. ColiDry DaysRainfall IntensityTotal Rainfall
Phosphorus1
Ammonia0.861
Nitrite0.490.41
Nitrate0.310.350.551
TN0.370.390.70.981
TSS0.580.530.180.060.091
TDS0.280.240.710.660.7201
Total coliforms−0.060.06−0.09−0.03−0.040.1−0.161
E. Coli0.060.34−0.1−0.07−0.090.21−0.210.521
Dry days0.660.560.360.020.10.380.31−0.180.21
Rainfall intensity0.720.570.120.120.130.750.06−0.09−0.140.441
Total rainfall−0.12−0.04−0.2−0.16−0.190.09−0.460.070.30.040.11
Imperviousness0.11−0.010.070.160.160.03−0.20.1−0.060.090.030.05
Table A2. Person’s Correlation R-values for wet weather water quality, including metals. Highlighted values are R-values that are statistically significant at the 5% significance level.
R-ValuesAs, TotalCu, TotalPb, TotalZn, TotalAs, DissolvedCu, DissolvedPb, DissolvedZn, DissolvedDry DaysRainfall IntensityTotal Rainfall
As, Total1
Cd, Total−0.07
Cu, Total0.621
Pb, Total0.640.841
Zn, Total0.620.960.841
As, Dissolved0.14−0.19−0.19−0.261
Cd, Dissolved0.37−0.18−0.03−0.180.08
Cu, Dissolved0.550.910.740.87−0.221
Pb, Dissolved−0.26−0.02−0.1−0.11−0.07−0.071
Zn, Dissolved0.210.760.570.68−0.040.840.111
Dry Days0.490.370.570.41−0.320.4200.181
Rainfall intensity0.520.640.560.75−0.350.51−0.220.210.441
Total rainfall−0.42−0.33−0.3−0.24−0.1−0.350.36−0.210.040.11
Imperviousness−0.010.070.120.13−0.320.070.270.070.090.030.05
Table A3. ANCOVA results with rainfall intensity as the confounding variable.
AnalyteDegrees of Freedom, between GroupsDegrees of Freedom, within GroupsF-Ratiop-ValuePartial Eta-Squared
Phosphorus, Dissolved2280.250.780.02
Ammonia, Dissolved2281.730.20.12
Nitrite, Dissolved2280.050.95<0.01
Nitrate, Dissolved2280.360.70.03
Total Nitrogen260.070.940.02
TDS2280.30.740.02
TSS2282.80.080.2
Total Coliforms2240.240.790.02
E. coli2210.690.510.07
Arsenic, Total270.410.680.12
Arsenic, Dissolved250.630.570.25
Lead, Total2200.420.660.04
Lead, Dissolved2BDLBDLBDLBDL
Copper, Total2250.120.890.01
Copper, Dissolved2252.10.140.17
Zinc, Total2251.340.280.11
Zinc, Dissolved2261.880.170.14
Table A4. ANCOVA results with antecedent dry days as the confounding variable.
AnalyteDegrees of Freedom, between GroupsDegrees of Freedom, within GroupsF-Ratiop-ValuePartial Eta-Squared
Phosphorus, Dissolved2280.290.750.02
Ammonia, Dissolved2280.040.96<0.01
Nitrite, Dissolved2280.30.740.02
Nitrate, Dissolved2280.910.410.07
Total Nitrogen264.150.070.02
TDS2280.110.90.01
TSS2280.240.790.02
Total Coliforms2240.070.930.01
E. coli2210.280.760.03
Arsenic, Total270.510.620.15
Arsenic, Dissolved250.090.920.04
Lead, Total2200.490.620.05
Lead, Dissolved2BDLBDLBDLBDL
Copper, Total2250.090.920.01
Copper, Dissolved2251.10.350.09
Zinc, Total2250.020.98<0.01
Zinc, Dissolved2260.20.820.02
Table A5. ANCOVA results with total rainfall depth as the confounding variable.
AnalyteDegrees of Freedom, between GroupsDegrees of Freedom, within GroupsF-Ratiop-ValuePartial Eta-Squared
Phosphorus, Dissolved2280.020.98<0.01
Ammonia, Dissolved2280.080.920.01
Nitrite, Dissolved2280.310.730.02
Nitrate, Dissolved2280.130.880.01
Total Nitrogen260.120.890.04
TDS2280.460.630.03
TSS2280.850.440.06
Total Coliforms2242.70.090.22
E. coli2210.650.530.06
Arsenic, Total270.390.690.11
Arsenic, Dissolved250.510.630.2
Lead, Total2200.770.480.08
Lead, Dissolved2BDLBDLBDLBDL
Copper, Total2250.690.510.06
Copper, Dissolved2250.040.97<0.01
Zinc, Total2250.080.920.01
Zinc, Dissolved2260.120.890.01
Figure A1. Wet weather water quality—dissolved-nutrient boxplots. Red plus signs indicate outliers and triangles represent Colorado Department of Public Health and Environment (CDPHE) in-stream standards, where relevant.
Water 13 00988 g0a1
Figure A2. Wet weather water quality—TSS and TDS. Red plus signs indicate outliers.
Water 13 00988 g0a2
Figure A3. Wet weather water quality—total coliforms and E. coli. Red plus signs indicate outliers and triangles represent CDPHE in-stream standards, where relevant.
Water 13 00988 g0a3
Figure A4. Wet weather water quality—arsenic and zinc boxplots. Red plus signs indicate outliers and triangles represent CDPHE in-stream standards, where relevant.
Water 13 00988 g0a4
Figure A5. Wet weather water quality—copper and lead boxplots. Red plus signs indicate outliers and triangles represent CDPHE in-stream standards, where relevant.
Water 13 00988 g0a5
Figure A6. Distribution bar plot of dissolved and particulate-associated metals concentrations.
Water 13 00988 g0a6
Figure A7. Distribution bar plot of dissolved and particulate associated nutrient concentrations.
Water 13 00988 g0a7
Figure A8. Nitrogen species comparison between sites.
Water 13 00988 g0a8

References

  1. Wijesiri, B.; Liu, A.; Egodawatta, P.; McGree, J.; Goonetilleke, A. Decision Making with Uncertainty in Stormwater Pollutant Processes: A Perspective on Urban Stormwater Pollution Mitigation; Springer: Singapore, 2019. [Google Scholar]
  2. Paul, M.J.; Meyer, J.L. Streams in the urban landscape. Annu. Rev. Ecol. Syst. 2001, 32, 333–365. [Google Scholar] [CrossRef]
  3. Müller, A.; Österlund, H.; Marsalek, J.; Viklander, M. The pollution conveyed by urban runoff: A review of sources. Sci. Total Environ. 2020, 709, 136125. [Google Scholar] [CrossRef] [PubMed]
  4. Gunawardena, J.M.A. Relating Vehicle Generated Pollutants to Stormwater Quality. Ph.D. Thesis, Queensland University of Technology, Science and Engineering Faculty, Brisbane, QLD, Australia, 2012; p. 289. [Google Scholar]
  5. Burant, A.; Selbig, W.; Furlong, E.T.; Higgins, C.P. Trace organic contaminants in urban runoff: Associations with urban land-use. Environ. Pollut. 2018, 242, 2068–2077. [Google Scholar] [CrossRef] [PubMed]
  6. Göbel, P.; Dierkes, C.; Coldeway, W.G. Storm water runoff concentration matrix for urban areas. J. Contam. Hydrol. 2007, 91, 26–42. [Google Scholar] [CrossRef]
  7. Gasperi, J.; Zgheib, S.; Cladière, M.; Rocher, V.; Moilleron, R.; Chebbo, G. Priority pollutants in urban stormwater: Part 2-Case of combined sewers. Water Res. 2011, 46, 6693–6703. [Google Scholar] [CrossRef] [Green Version]
  8. Zgheib, S.; Moilleron, R.; Chebbo, G. Influence of the land use pattern on the concentrations and fluxes of priority pollutants in urban stormwater. Water Sci. Technol. 2011, 64, 1450–1458. [Google Scholar] [CrossRef]
  9. Brown, J.N.; Peake, B.M. Sources of heavy metals and polycyclic aromatic hydrocarbonsin urban stormwater runoff. Sci. Total Environ. 2006, 359, 145–155. [Google Scholar] [CrossRef]
  10. Strickman, R.J.; Mitchell, C.P.J. Methylmercury production and accumulation in urban stormwater ponds and, habitat wetlands. Environ. Pollut. 2017, 221, 326–334. [Google Scholar] [CrossRef]
  11. Miguntanna, N.S.; Egodawatta, P.; Kokot, S.; Goonetilleke, A. Determination of a set of surrogate parameters to assess urban stormwater quality. Sci. Total Environ. 2010, 408, 6251–6259. [Google Scholar] [CrossRef] [Green Version]
  12. Jaeschke, J.B.; Cozzarelli, I.M.; Masoner, J.R.; Fleger, K.L. Geochemical Composition of Urban Stormwater Runoff within the Conterminous United States from Samples Collected in 2016–2017. U.S. Geological Survey Data Release. 2018. Available online: https://www.sciencebase.gov/catalog/item/5bd863cde4b0b3fc5ce9d8fa (accessed on 10 March 2020).
  13. O’Keefe, B.; D’Arcy, B.; Davidson, J.; Barbarito, B.; Clelland, B. Urban diffuse sources of fecal indicators. Water Sci. Technol. 2005, 51, 183–190. [Google Scholar] [CrossRef]
  14. Pratt, J.M.; Coler, R.A.; Godfrey, P.J. Ecological effects of urban stormwater runoff on benthic macroinvertebrates inhabiting the Green River, Massachusetts. Hydrobiologia 1981, 83, 29. [Google Scholar] [CrossRef]
  15. Masoner, J.R.; Kolpin, D.W.; Cozzarelli, I.M.; Barber, L.B.; Burden, D.S.; Foreman, W.T.; Forshay, K.J.; Furlong, E.T.; Groves, J.F.; Hladik, M.L.; et al. Urban stormwater: An overlooked pathway of extensive mixed contaminants to surface and groundwaters in the United States. Environ. Sci. Technol. 2019, 53, 10070–10081. [Google Scholar] [CrossRef] [Green Version]
  16. United States Geological Survey (USGS). Urban Stormwater Quality, Event-Mean Concentrations, and Estimates of Stormwater Pollutant Loads; Dallas-Fort Worth Area, Texas (1992–1993); Water-Resources Investigations Report; U.S. Geological Survey: Austin, TX, USA, 1998; p. 51.
  17. Bannerman, R.T.; Owens, D.W.; Dodds, R.B.; Hornewer, N.J. Sources of pollutants in Wisconsin stormwater. Water Sci. Technol. 1993, 8, 241–259. [Google Scholar] [CrossRef]
  18. Lopes, T.J.; Fossum, K.D.; Phillips, J.V.; Monical, J.E. Statistical Summary of Selected Physical, Chemical, and Microbial Characteristics, and Estimates of Constituent Loads in Urban Stormwater, Maricopa County, Arizona; Water-Resources Investigations Report; U.S. Geological Survey: Austin, TX, USA, 1995; p. 62.
  19. Ellis, S.R.; Mustard, M.H. A Summary of Urban Runoff Studies in the Denver Metropolitan Area, Colorado; Water-Resources Investigation Report; U.S. Geological Survey: Austin, TX, USA, 1985; p. 31.
  20. Guerard, P.V.; Weiss, W.B. Water Quality of Storm Runoff and Comparison of Procedures for Estimating Storm-Runoff Loads, Volume, Event-Mean-Concentrations, and the Mean Load for a Storm for Selected Properties and Constituents for Colorado Springs, Southeastern Colorado, 1992; Water-Resources Investigation Report; U.S. Geological Survey: Austin, TX, USA, 1995; p. 68.
  21. Liu, A.; Egodawatta, P.; Guan, Y.; Goonetilleke, A. Influence of rainfall and catchment characteristics on urban stormwater quality. Sci. Total Environ. 2013, 444, 255–262. [Google Scholar] [CrossRef] [Green Version]
  22. Chong, M.N.; Aryal, R.; Sidhu, J.; Tang, J.; Toze, S.; Gardner, T. Urban stormwater quality monitoring: From sampling to water quality analysis. In Proceedings of the 2011 Seventh International Conference on Intelligent Sensors, Sensor Networks and Information Processing, Adelaide, Australia, 6–9 December 2011; pp. 174–179. [Google Scholar]
  23. Kim, L.H.; Kayhanian, M.; Stenstrom, M.K. Event mean concentration and loading of litter from highways during storms. Sci. Total Environ. 2004, 330, 101–113. [Google Scholar] [CrossRef]
  24. Environmental Protection Agency (EPA). Results of the Nationwide Urban Runoff Program—Volume 1—Final Report; Environmental Protection Agency—Water Planning Division: Washington, DC, USA, 1983; p. 198.
  25. Urban Drainage and Flood Control District (UDFCD). Colorado Regulation 85 Nutrient Data Gap Analysis Report; Urban Drainage and Flood Control District—Colorado Stormwater Council: Denver, CO, USA, 2013; p. 86.
  26. Panos, C.L.; Hogue, T.S.; Gilliom, R.L.; McCray, J.E. High-resolution modeling of infill development impact on stormwater dynamics in Denver, Colorado. J. Sustain. Water Built Environ. 2018, 4, 04018009. [Google Scholar] [CrossRef]
  27. Schueler, T.R. The importance of imperviousness. Watershed Prot. Tech. 1994, 1, 100–111. [Google Scholar]
  28. Brabec, E.; Schulte, S.; Richards, P.L. Impervious surfaces and water quality: A review of current literature and its implications for watershed planning. J. Plan. Lit. 2002, 16, 499–514. [Google Scholar] [CrossRef]
  29. Hatt, B.; Fletcher, T.D.; Walsh, C.J.; Taylor, S.L. The influence of urban density and drainage infrastructure on the concentrations and loads of pollutants in small streams. Environ. Manag. 2004, 34, 112–124. [Google Scholar] [CrossRef]
  30. Shaver, E.; Horner, R.; Scupien, J.; May, C.; Ridley, G. Fundamentals of Urban Runoff Management: Technical and Institutional Issues, 2nd ed.; North American Lake Management Society: Madison, WI, USA, 2007; p. 327. [Google Scholar]
  31. Goble, P. Colorado Enciclopedia. 2021. Available online: https://coloradoencyclopedia.org/article/colorado-climate (accessed on 28 March 2021).
  32. Cherry, L.; Eisenstein, B.; Peterman, K.; Hogue, T.S.; McCray, J.E. Predicting parcel-scale redevelopment using linear and logistic regression—the Berkeley neighborhood Denver, Colorado case study. Sustainability 2019, 11, 1882. [Google Scholar] [CrossRef] [Green Version]
  33. Denver Water. Collection System of Denver Water. 2019. Available online: https://www.denverwater.org/your-water/water-supply-and-planning/collection-system (accessed on 9 August 2019).
  34. Hamm, K. Where Is Denver Residential Development Happening? The Denver Post. 2019. Available online: https://www.denverpost.com/2019/02/22/denver-residential-development-map/ (accessed on 2 May 2020).
  35. City of Denver. Denver Open Data Catalog. 2018. Available online: https://www.denvergov.org/opendata (accessed on 5 August 2019).
  36. Alley, W.M.; Veenhuis, J.E. Effective impervious area in urban runoff modeling. J. Hydraul. Eng. 1983, 109, 313–319. [Google Scholar] [CrossRef]
  37. Vieux and Associates, Inc. RainVieux. 2019. Available online: http://vflo.vieuxinc.com/rainvieux.html (accessed on 5 August 2019).
  38. Teledyne ISCO. Flowlink® 5.1 Software. 2019. Available online: https://www.teledyneisco.com/en-us/water-and-wastewater/flowlink-5-1 (accessed on 5 August 2019).
  39. McCarthy, D.T.; Zhang, K.; Westerlund, C.; Viklander, M.; Bertrand-Krajewski, J.L.; Fletcher, T.D.; Deletic, A. Assessment of sampling strategies for estimation of site mean concentrations of stormwater pollutants. Water Res. 2018, 129, 297–304. [Google Scholar] [CrossRef] [PubMed]
  40. Colorado Department of Public Health and Environment (CDPHE). Colorado Department of Public Health and Environment Water Quality Control Commission for South Platte River Basin, Laramie River Basin Republican River Basin, Smoky Hill River Basin. Regulation 2016, 38, 1–133. [Google Scholar]
  41. EPA. 303(d) Impaired Waterbody History Report for COSPCL15A. EPA Impaired Waterbody History Report. 2019. Available online: https://ofmpub.epa.gov/waters10/attains_wb_history.control?p_listed_water_id=COSPCL15_A&p_cycle=2016 (accessed on 12 August 2019).
  42. Denver Public Works. Denver Storm Drainage Master Plan; Denver Public Works: Denver, CO, USA, 2014; p. 226.
  43. White, M.P.; Alcock, I.; Wheeler, B.W.; Depledge, M.H. Would you be happier living in a greener urban area? A fixed-effects analysis of panel data. Psychol. Sci. 2013, 24, 920–928. [Google Scholar] [CrossRef]
  44. Urban Drainage and Flood Control District (UDFCD). Urban Storm Drainage Criteria Manual. Stormwater Best Management Practices; Urban Drainage and Flood Control District: Denver, CO, USA, 2010; Volume 3, p. 565.
  45. Wright Water Engineers. Colorado Regulation 85 Nutrient Data Gap Analysis Report. Urban Drainage and Flood Control District; Colorado Stormwater Council: Denver, CO, USA, 2013; p. 86. [Google Scholar]
  46. Leecaster, M.K.; Schiff, K.; Tiefenthaler, L.L. Assessment of Efficient Sampling Designs for Urban Stormwater Monitoring. Water Res. 2002, 36, 1556–1564. [Google Scholar] [CrossRef]
  47. Walsh, C.J.; Roy, A.H.; Feminella, J.W.; Cottingham, P.D.; Groffman, P.M.; Morgan, R.P. The Urban Stream Syndrome: Current Knowledge and the Search for a Cure. J. N. Am. Benthol. Soc. 2005, 24, 706–723. [Google Scholar] [CrossRef]
  48. Patten, G. Water Quality Model in Barr Lake, Milton Reservoir Watershed | Colorado Riparian Association. Integral Consulting Report. 2009. Available online: http://www.coloradoriparian.org/water-quality-modeling-in-the-barr-lake-and-milton-reservoir-watershed/ (accessed on 15 July 2019).
  49. Maiolo, M.; Palermo, S.A.; Brusco, A.C.; Pirouz, B.; Turco, M.; Vinci, A.; Spezzano, G.; Piro, P. On the use of a real-time control approach for urban stormwater management. Water 2020, 12, 2842. [Google Scholar] [CrossRef]
  50. Kordana-Obuch, S.; Starzec, M. Statistical approach to the problem of selecting the most appropriate model for managing stormwater in newly designed multi-family housing estates. Resources 2020, 9, 110. [Google Scholar] [CrossRef]
  51. Nóblega Carriquiry, A.; Sauri, D.; March, H. Community involvement in the implementation of sustainable urban drainage systems (SUDSs): The case of Bon Pastor, Barcelona. Sustainability 2020, 12, 510. [Google Scholar] [CrossRef] [Green Version]
  52. Liu, Y.; Wang, C.; Yu, Y.; Chen, Y.; Du, L.; Qu, X.; Peng, W.; Zhang, M.; Gui, C. Effect of urban stormwater road runoff of different land use types on an urban river in SDhenzhen, China. Water 2019, 11, 2545. [Google Scholar] [CrossRef] [Green Version]
  53. Souza, F.P.; Costa, M.E.L.; Koide, S. Hydrological modelling and evaluation of detention ponds to improve urban drainage system and water quality. Water 2019, 11, 1547. [Google Scholar] [CrossRef] [Green Version]
  54. Silva, T.F.G.; Vinçon-Leite, B.; Lemaire, B.J.; Petrucci, G.; Giani, A.; Figueredo, C.C.; Nascimento, N.d.O. Impact of urban stormwater runoff on cyanobacteria dynamics in a tropical urban lake. Water 2019, 11, 946. [Google Scholar] [CrossRef] [Green Version]
  55. Ren, J.; Liang, J.; Ren, B.; Zheng, X.; Guo, C. New patterns of temporal and spatial variation in water quality of a highly artificialized urban river-course—A case study in the Tongzhou section of the Beiyun River. Water 2018, 10, 1446. [Google Scholar] [CrossRef] [Green Version]
  56. Gustafson, K. Quantifying the Effects of Residential Infill Redevelopment on Urban Stormwater Quality. Master’s Thesis, Colorado School of Mines, Department of Civil and Environmental Engineering, Golden, CO, USA, 2019; p. 183. [Google Scholar]
Figure 1. Redevelopment increasing impervious coverage in Denver. Left: pre-redevelopment in 2014; right: post-redevelopment in 2017. The street in the center is Tennyson Street (Images from Google Earth).
Water 13 00988 g001
Figure 2. Map of delineated sampling basins within Denver (approximately 39°46′36.17″ N, 105°2′21.44″ W), showing locations of increased impervious coverage between 2004 and 2018 (increased impervious coverage shown in red).
Water 13 00988 g002
Figure 3. Discretely analyzed storm showing evidence of first-flush effect for phosphorous and ammonia at the Central basin for the storm occurring on 5 September 2018. The blue line represents the hydrograph and the orange line represents the phosphorus concentration.
Water 13 00988 g003
Figure 4. Discretely analyzed storm showing evidence of first-flush effect for TSS at the West basin for the storm occurring on 7 July 2018. Blue line represents the hydrograph, and the red line represents the TSS concentration.
Water 13 00988 g004
Figure 5. Discretely analyzed storm showing no evidence of first-flush effect for TDS at the East basin for the storm occurring on 18 August 2018. Blue line represents the hydrograph, and the orange line represents the TDS concentration.
Water 13 00988 g005
Table 1. Auto-sampler sampling schedule.
Sampling PeriodSampling Protocol
Hours 1–4150 mL sample every 5 min3 samples per bottle16 bottles filled, 1 every 15 min
Hours 5–8150 mL sample every 10 min3 samples per bottle7 bottles filled, 1 every 30 min
Table 2. Analytical methods and hold times.
Water-Quality AnalyteLab Method/Analysis EquipmentMaximum Sample Hold Time
TSSEPA Standard Method 2540D7 days
TDS and ConductivityCole-Parmer Traceable24 h
pHAccumet AB1524 h
Total recoverable metalsEPA Standard Method 3015A/ICP–AES7 days
Total dissolved metalsICP–AES7 days
PhosphorousHach TNT 84324 h
AmmoniaHach TNT 83124 h
NitrateHach TNT 83524 h
NitriteHach TNT 83924 h
FIB and E. coliIdexx Colilert24 h
DOC/TOCShimadzu TOCV–TNM–LCSH24 h
Total Nitrogen (TN)Shimadzu TOCV–TNM–LCSH24 h
TSS, total suspended solids; TDS, total dissolved solids; FIB, fecal indicator bacteria; DOC, dissolved organic carbon; TOC, total organic carbon.
Table 3. Catchment area and imperviousness by basin (2018).
West BasinCentral BasinEast Basin
Catchment Area (Hectares)13332159
Total Impervious Area (Hectares)751974
Total Imperviousness (%)565946
Effective Impervious Area (Hectares)44743
Effective Imperviousness (%)332027
Table 4. Impervious surface increases by basin from 2004 to 2018. “Percentage of impervious surface increase by type” refers to the percentage of total impervious coverage change broken down by what type of new development caused the increase.
West BasinCentral BasinEast Basin
Area of Impervious Increase (Hectares)5.11.61.3
Percent Change in Imperviousness3.80%5.00%0.80%
Percentage of impervious surface increase by type
Building51%66%68%
Driveway9%12%13%
Parking19%0%2%
Sidewalk13%12%9%
Other8%10%9%
Table 5. Zoning areas by basin and zoning category.
West BasinCentral BasinEast Basin
Single Unit (Hectares)78.67.3114.9
Multi-Unit (Hectares)0.61.11.1
Mixed Use (Hectares)21.43.612.8
Two Unit (Hectares)20.916.32.8
Open Space/Parks (Hectares)2.50.424.8
Main Street (Hectares)5.33.52.3
Table 6. Rain-event characteristics for each sampling event.
DateAntecedent Dry DaysStorm DurationRainfall (mm)Peak Rainfall Intensity (mm/5 min)Samples Collected
EastCentralWest
2 July 2018830 min0.50.1 X
7 July 201852 h6.11.4 X
15 July 201882 h9.90.6 X
23 July 2018710 min2.80.4X X
24 July 2018110 min0.80.5X X
18 August 2018310 min5.13.5XX
21 August 2018230 min1.30.3XXX
5 September 201851 h10.22.5XX
5 October 20x18210 min3.01.3X X
10 April 201942 h0.80.1XXX
21 April 2019810 min1.55.1XXX
29 April 201982 h1.01.3XXX
20 May 201922 h2.30.3XXX
28 May 2019210 min2.50.1XXX
17 June 201962 h3.01.1XXX
Table 7. Wet weather water-quality descriptive statistics (mean ±95% CI).
AnalyteUnitWestCentralEastUDFCD Denver—Residential [44]
Phosphorus *mg/L0.995 (±0.417)0.949 (±0.511)0.877 (±0.312)0.240 (±0.020)
Ammonia *mg/L1.28 (±0.478)0.803 (±0.447)0.982 (±0.450)Not Reported
Nitrite *mg/L0.385 (±0.349)0.453 (±0.360)0.363 (±0.266)Not Reported
Nitrate *mg/L2.54 (±1.06)2.97 (±1.84)2.31 (±0.980)Not Reported
TSSmg/L115.6 (±74.1)126.9 (±74.7)113.0 (±88.3)221 (±36.0)
TDSmg/L228.0 (±95.9)242.0 (±137.2)306.0 (±101.4)146 (±100.0)
Coliforms (T)MPN/100 mL1,750,000 (±1,860,000)578,000 (±432,000)720,000 (±370,000)Not Reported
E. ColiMPN/100 mL403,000 (±414,000)40,200 (±69,800)243,600 (±224,400)Not Reported
Cu *ug/L17.0 (±5.0)15.0 (±6.0)15.0 (±4.0)Not Reported
Cu (T)ug/L37.0 (±14.0)29.0 (±14.0)28.0 (±13.0)22.0 (±3.0)
Pb *ug/L7.0 (±4.0)BDLBDLNot Reported
Pb (T)ug/L12.0 (±8.0)9.0 (±6.0)8.0 (±7.0)14.0 (±3.0)
As *ug/L10.0 (±1.0)12.0 (±58.0)17.0 (±14.0)Not Reported
As (T)ug/L17.0 (±8.0)14.0 (±9.0)13.0 (±6.0)Not Reported
Zn *ug/L82.0 (±32.0)62.0 (±21.0)58.0 (±16.0)Not Reported
Zn (T)ug/L171 (±77.0)165 (±82.0)124 (±67.0)115 (±16.0)
* Indicates “dissolved”. MPN, most probable number; BDL, below detection limit. UDFCD, Urban Drainage and Flood Control District.
Table 8. Surface water loading for each contaminant during typical rain events. Values are monthly averages based on flow and storm frequency.
AnalyteUnitWestCentralEast
Phosphorus *kg0.130.050.25
Ammonia *kg0.150.040.26
Nitrite *kg0.040.020.11
Nitrate *kg0.290.121.15
TSSkg14.94.1843
TDSkg27.810.6160
Coliforms (T)MPN378,00019,600183,000
E. coliMPN79,30060462,000
Cu *kg0.0020.0010.004
Cu (T)kg0.0050.0010.01
Pb *kg0.001<0.001<0.001
Pb (T)kg0.001<0.0010.001
As *kg<0.001<0.0010.007
As (T)kg0.001<0.0010.005
Zn *kg0.0110.0030.02
Zn (T)kg0.0190.0070.042
* Indicates “dissolved”.
Publisher’s Note: MDPI stays neutral with regard to jurisdictional claims in published maps and institutional affiliations.

