
Factors Driving Long Term Declines in Inland Fishery Yields in the Mekong Delta


1
Fisheries Ecology and Aquatic Resources Division, Research Institute for Aquaculture No.2, 116 Nguyen Dinh Chieu St., District 1, Ho Chi Minh City, Vietnam
2
Institute of Land, Water and Society, Charles Sturt University, P.O. Box 789, Albury, NSW 2640, Australia
*
Author to whom correspondence should be addressed.
Water 2021, 13(8), 1005; https://doi.org/10.3390/w13081005
Submission received: 29 January 2021
/
Revised: 21 March 2021
/
Accepted: 24 March 2021
/
Published: 7 April 2021
(This article belongs to the Special Issue Channels for Change: Integrating Multiple Disciplines for New Frontiers in Managing the Mekong River Basin)
Abstract
:The Mekong basin’s fisheries are important sources of food, income, and livelihoods for millions of people in six countries. However, fish yields appear to have declined in recent years according to reports from local fishers throughout the basin. It is important to understand the factors driving the decline in fisheries so that they can be adequately managed. We analysed interview data from 1020 fishers in the Mekong Delta in Vietnam in 2014 to identify trends in catch rates and the possible factors driving the trends. Most of the fishers (68–90%) reported that their catch rates had declined over the previous five years, although some fishers stated that their fish catches had remained stable or even increased. They identified eleven factors that they believed contribute to declines in fish catches, among which the use of illegal gears and overfishing were considered most important, with other factors relatively unimportant. Separately, long-term datasets (1995–2016) showed a general decline in commercial fish catches, which was positively correlated with peak water levels (which indicate flood levels), and negatively correlated with the intensification of rice farming, especially where flooding has been prevented to allow a third annual rice crop. Some data suggests that fishing effort has declined significantly in recent years, so an apparent downward trend in catches is not likely to be a result of overfishing as believed by fishers, which suggests that fishers are not aware of or under-rate the significance of hydrological and land-use/landscape changes. Due to the exceptional importance of the Mekong fishery and the interactions with other more dominant sectors, improved data collection is required to quantify changes in fisheries that result from land use and hydrological changes, and to guide planning which would better resolve competing demands for water and land use.
1. Introduction
In 2015, inland capture fisheries worldwide provided at least 11.47 million tonnes of high-quality nutrient-rich food for millions of people [1]. Despite their importance for food and livelihoods, inland fisheries continue to be largely ignored in development planning [1,2]. Altered hydrological regimes, habitat loss or modification, and overfishing are the key threats to freshwater fisheries production and biodiversity [3,4]. Worldwide, 30% of freshwater fish species are at risk of extinction; in particular migratory fish and large species are vulnerable to anthropogenic impacts [5]. Hence, it is necessary to raise awareness of the importance of fisheries and the need for a multi-sectoral approach to development.
The Mekong River, which flows through six countries in Southeast Asia supports the second-highest number of fish species in the world after the Amazon River, [6,7]. The basin’s fisheries provide important food, income, and livelihoods for more than 60 million residents, particularly the rural poor who rely heavily on fisheries, with about 40–50 million residents involved in inland fisheries to varying degrees [8]. Capture fisheries of the Lower Mekong Basin (LMB) produce about 2.3 million tonnes per year of fish and other aquatic animals (OAAs), with a value estimated at 11 billion USD per year [8]. The products provide 47–80% of animal protein in regional diets, with an average consumption of 50.3 kg per person per year in the LMB [9,10].
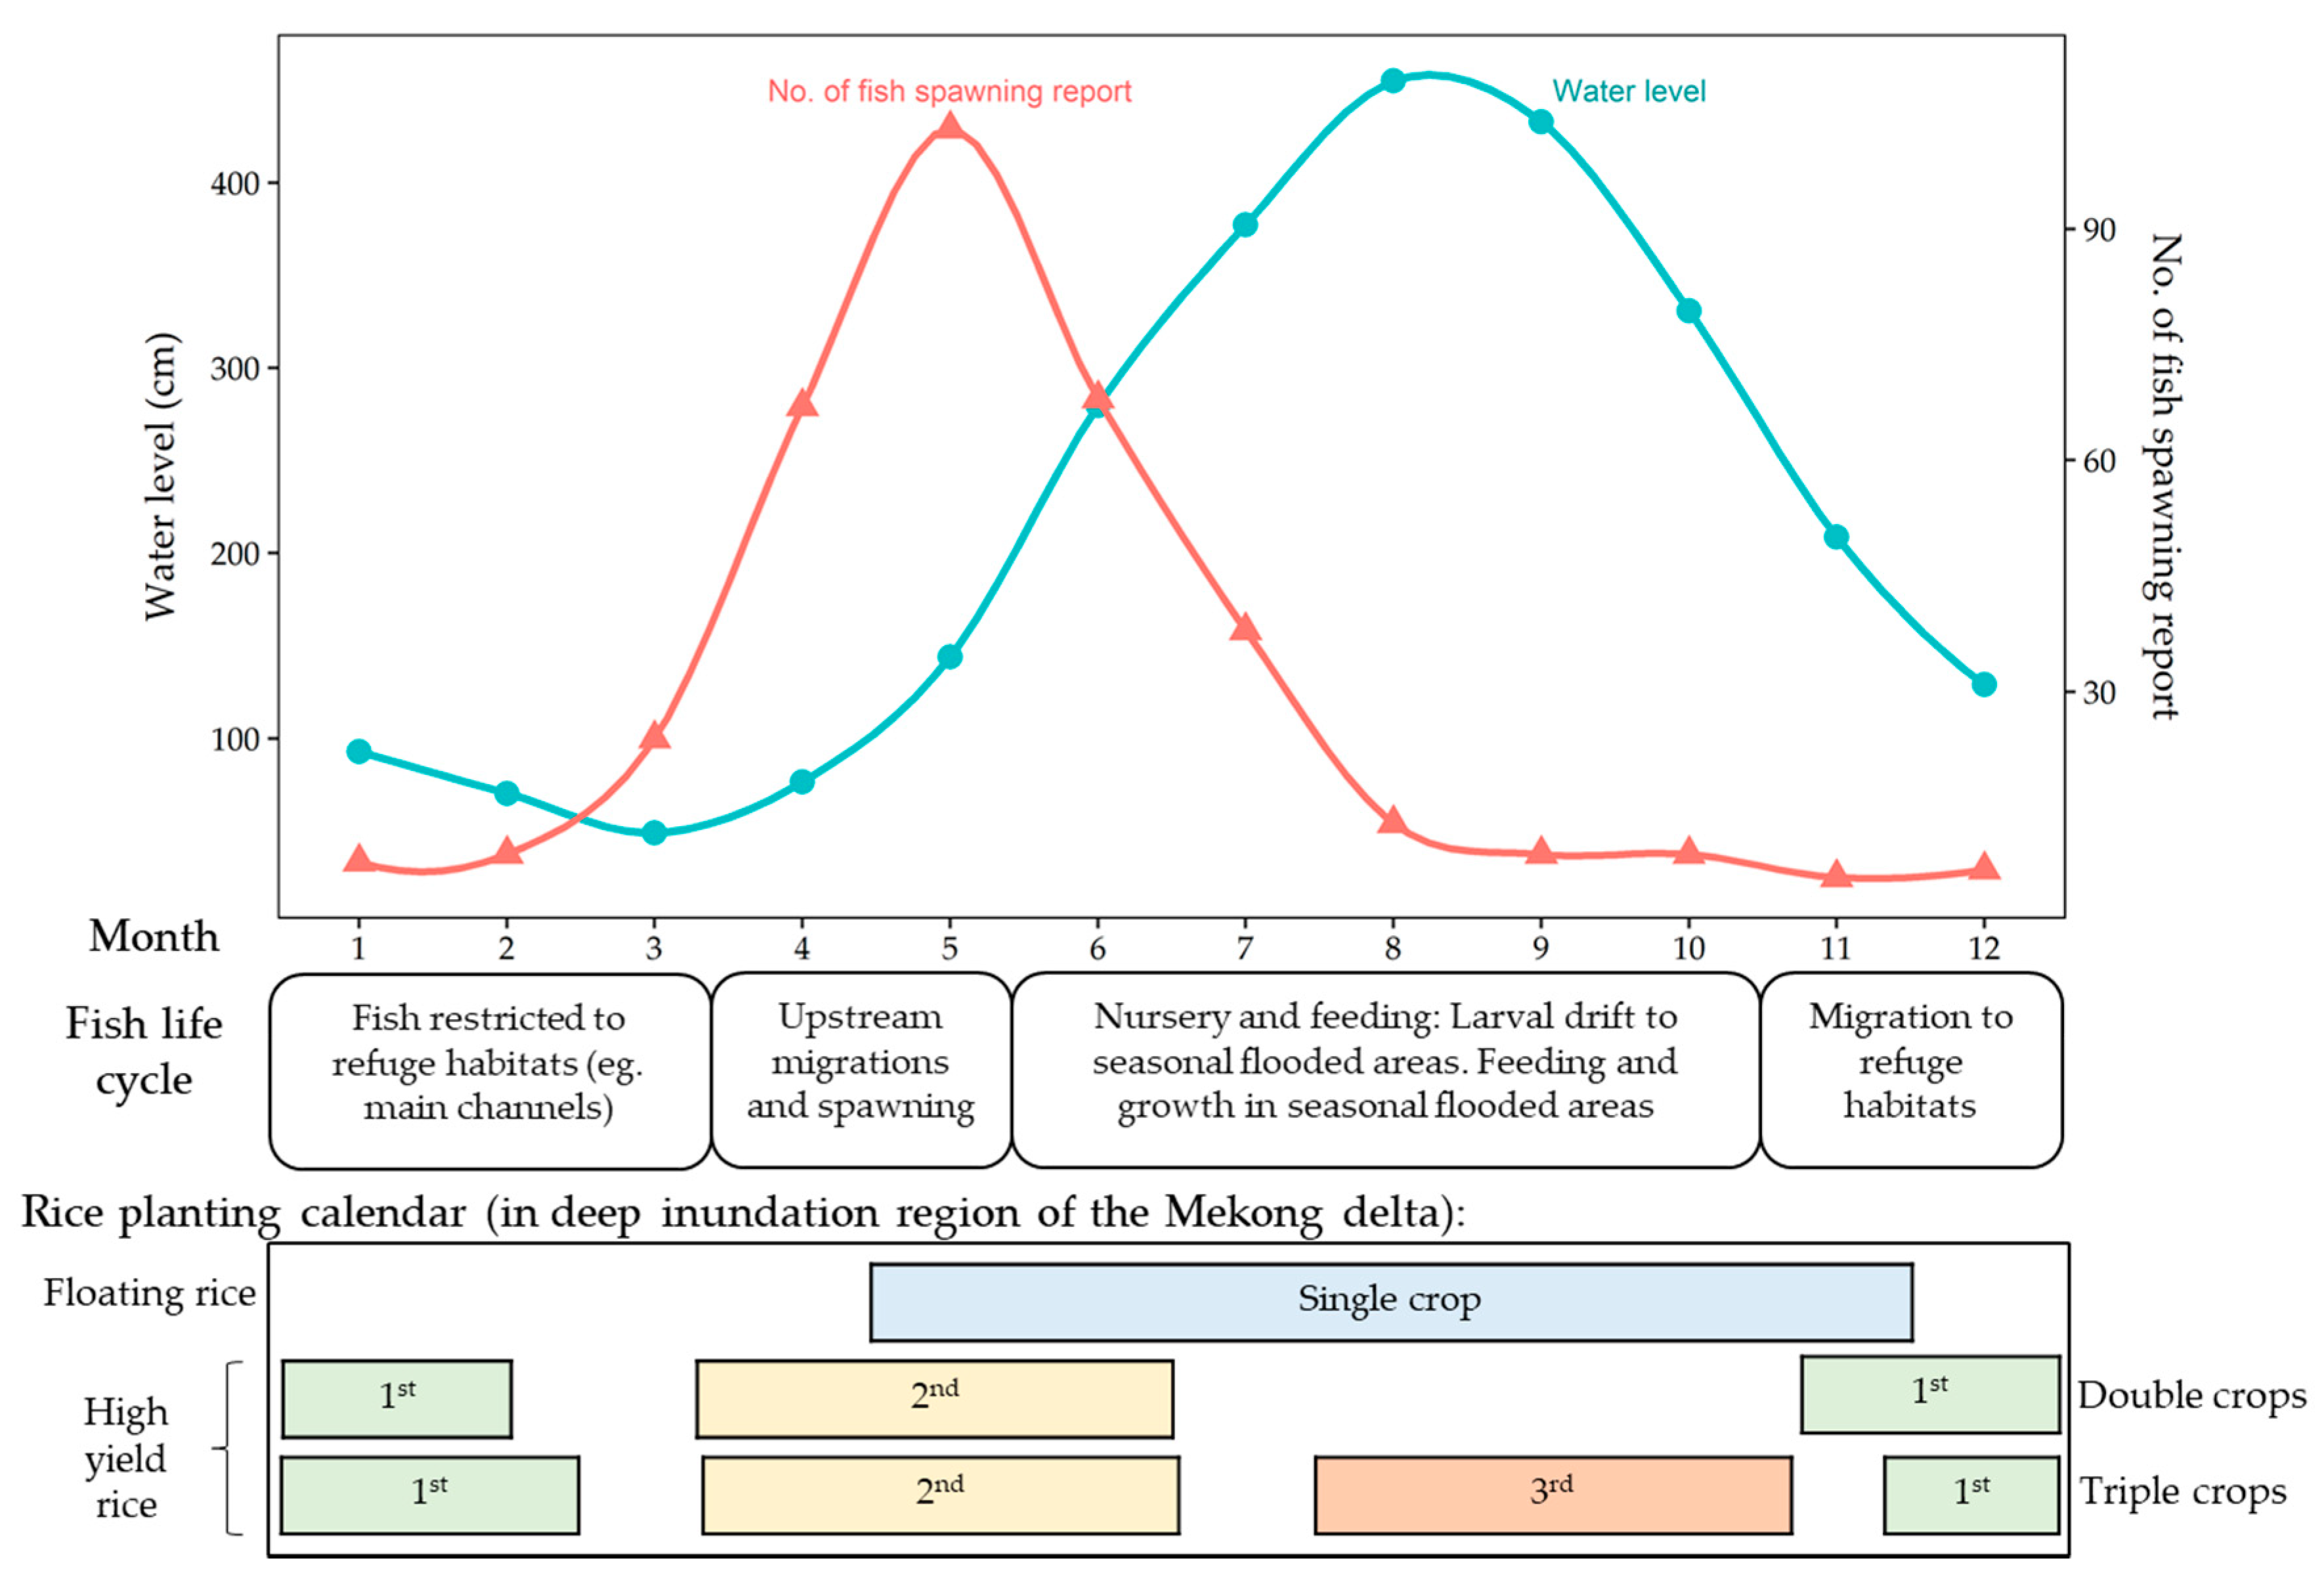
Most Mekong fishes spawn at the beginning of the rainy season (May to August; Figure 1) where river discharge and water levels increase substantially. Many fish actively migrate onto productive flooded areas to breed and feed, and the larvae of many river-spawning fishes drift with the rising waters onto floodplains [11]. However, most flat agricultural land (e.g., high yield rice farming) including in the Mekong Delta of Vietnam (MDV) is being progressively enclosed by dyke systems to prevent flooding, which restricts any aquatic productivity and blocks access by fish. Any reduction in the extent or duration of flooding is likely to reduce fish production and catches, as has been shown for the Tonle Sap system upstream in Cambodia [12,13].
Fishers throughout the LMB complain about declining catch rates and a trend to smaller and less valuable species [17,18]. For example, a decrease of about 50% in the MDV commercial fish catches was observed in the past two decades [19]. Most people participate in fishing for household consumption in the LMB. For example, it was estimated that in 2000, about 80% of households in rural areas of Laos, Thailand, and Cambodia, and 60–95% of households in the MDV participate in fishing to a certain extent [9]. However, a survey during 2014 of 360 households in 3 representative MDV districts found that only 31% of those households participated in fishing [20], indicating a significant decrease in participation in fisheries since 2000.
It should also be noted that the MDV has undergone a huge aquaculture expansion since the 1990s, which has made fish cheap and readily available and employed many people, who no longer need to go fishing. Various other industries have also expanded since the 1990s, so a decrease in fisheries participation rates is entirely plausible. People who depend on fisheries may be highly vulnerable as catches decline. Therefore, it is necessary to understand the likely causes of such declines and what can be done to mitigate them.
The MDV covers 40,814 km2, or about 5% of the Mekong basin’s catchment, and is the most densely populated part of the basin, with about 17.8 million residents at a density of 436 people per km2 in 2018 [19]. Most land (51%) in the MDV is used for rice farming, and 6% for forestry. Although the MDV accounts for only 12% of Vietnam’s territory, it produces about half of Vietnam’s inland fisheries yield (termed production in official statistics) and contributes about one-third of the total fisheries yield of the LMB [9,19]. The MDV is low-lying; based on GIS data the most part (>90%) is lower than 4 m above mean sea level [21]. About half of the Delta is located within the major flood zone, where inundation by floodwaters may last up to five months per year [10,22].
As mentioned above fishing is important for food security and livelihood for millions of people in the region. In An Giang Province, representative of the major flood zone, a survey in 1999 found that two-thirds of households participated in fishing to varying extents to provide food and/or income for their family [23]. Most of the fishers went fishing or collecting OAAs part-time and they fished most intensively during the flooding season. Local fishers used a variety of gears with over 120 inland fishing gear types described in the Mekong Delta [24]. Most of the gears are simple and can be constructed by local fishers using cheap mass-produced materials.
Inland fisheries are important but not well-documented or recognised, rather development planning generally focuses on agriculture and aquaculture, with the Mekong Delta producing about 56% of Vietnam’s rice production in 2019 [19], from about 50% of the land area, which is cropped two or three times per year [10,19]. Rice production increased significantly over recent years due to the expansion of the cultivated area and intensification of water management and agricultural inputs. Under intensive cultivation of improved rice varieties, each crop cycle takes about 110 days from planting to harvesting, so the main driver of increased production since the 1970s has been the move from single (annual) to double cropping, with a fallow period during the flood season of about 4 months. During the fallow period, floodwaters deposit fertile sediment in rice fields, flush out pesticides and support the production of fish and OAAs. Triple cropping can further increase rice yields but requires that floodwaters are excluded entirely to allow continuous cultivation of the land, which drastically reduces the extent and depth of the total area flooded each year.
Key factors driving the Mekong basin’s fisheries are likely to include altered hydrology (flood extent, duration, and timing), quality of floodplain environments (flooded vegetation and built structures), fish passage and barriers to fish migrations, and fishing pressure [12,25]. The objectives of this paper are to identify and evaluate possible factors contributing to the apparent decline in the Mekong Delta inland fishery in Vietnam and to recommend measures to improve fisheries management. Combining monitoring data with interview data from local fishers can improve our understanding of the impacts of anthropogenic impacts on fisheries [26,27].
2. Materials and Methods
2.1. Primary Data
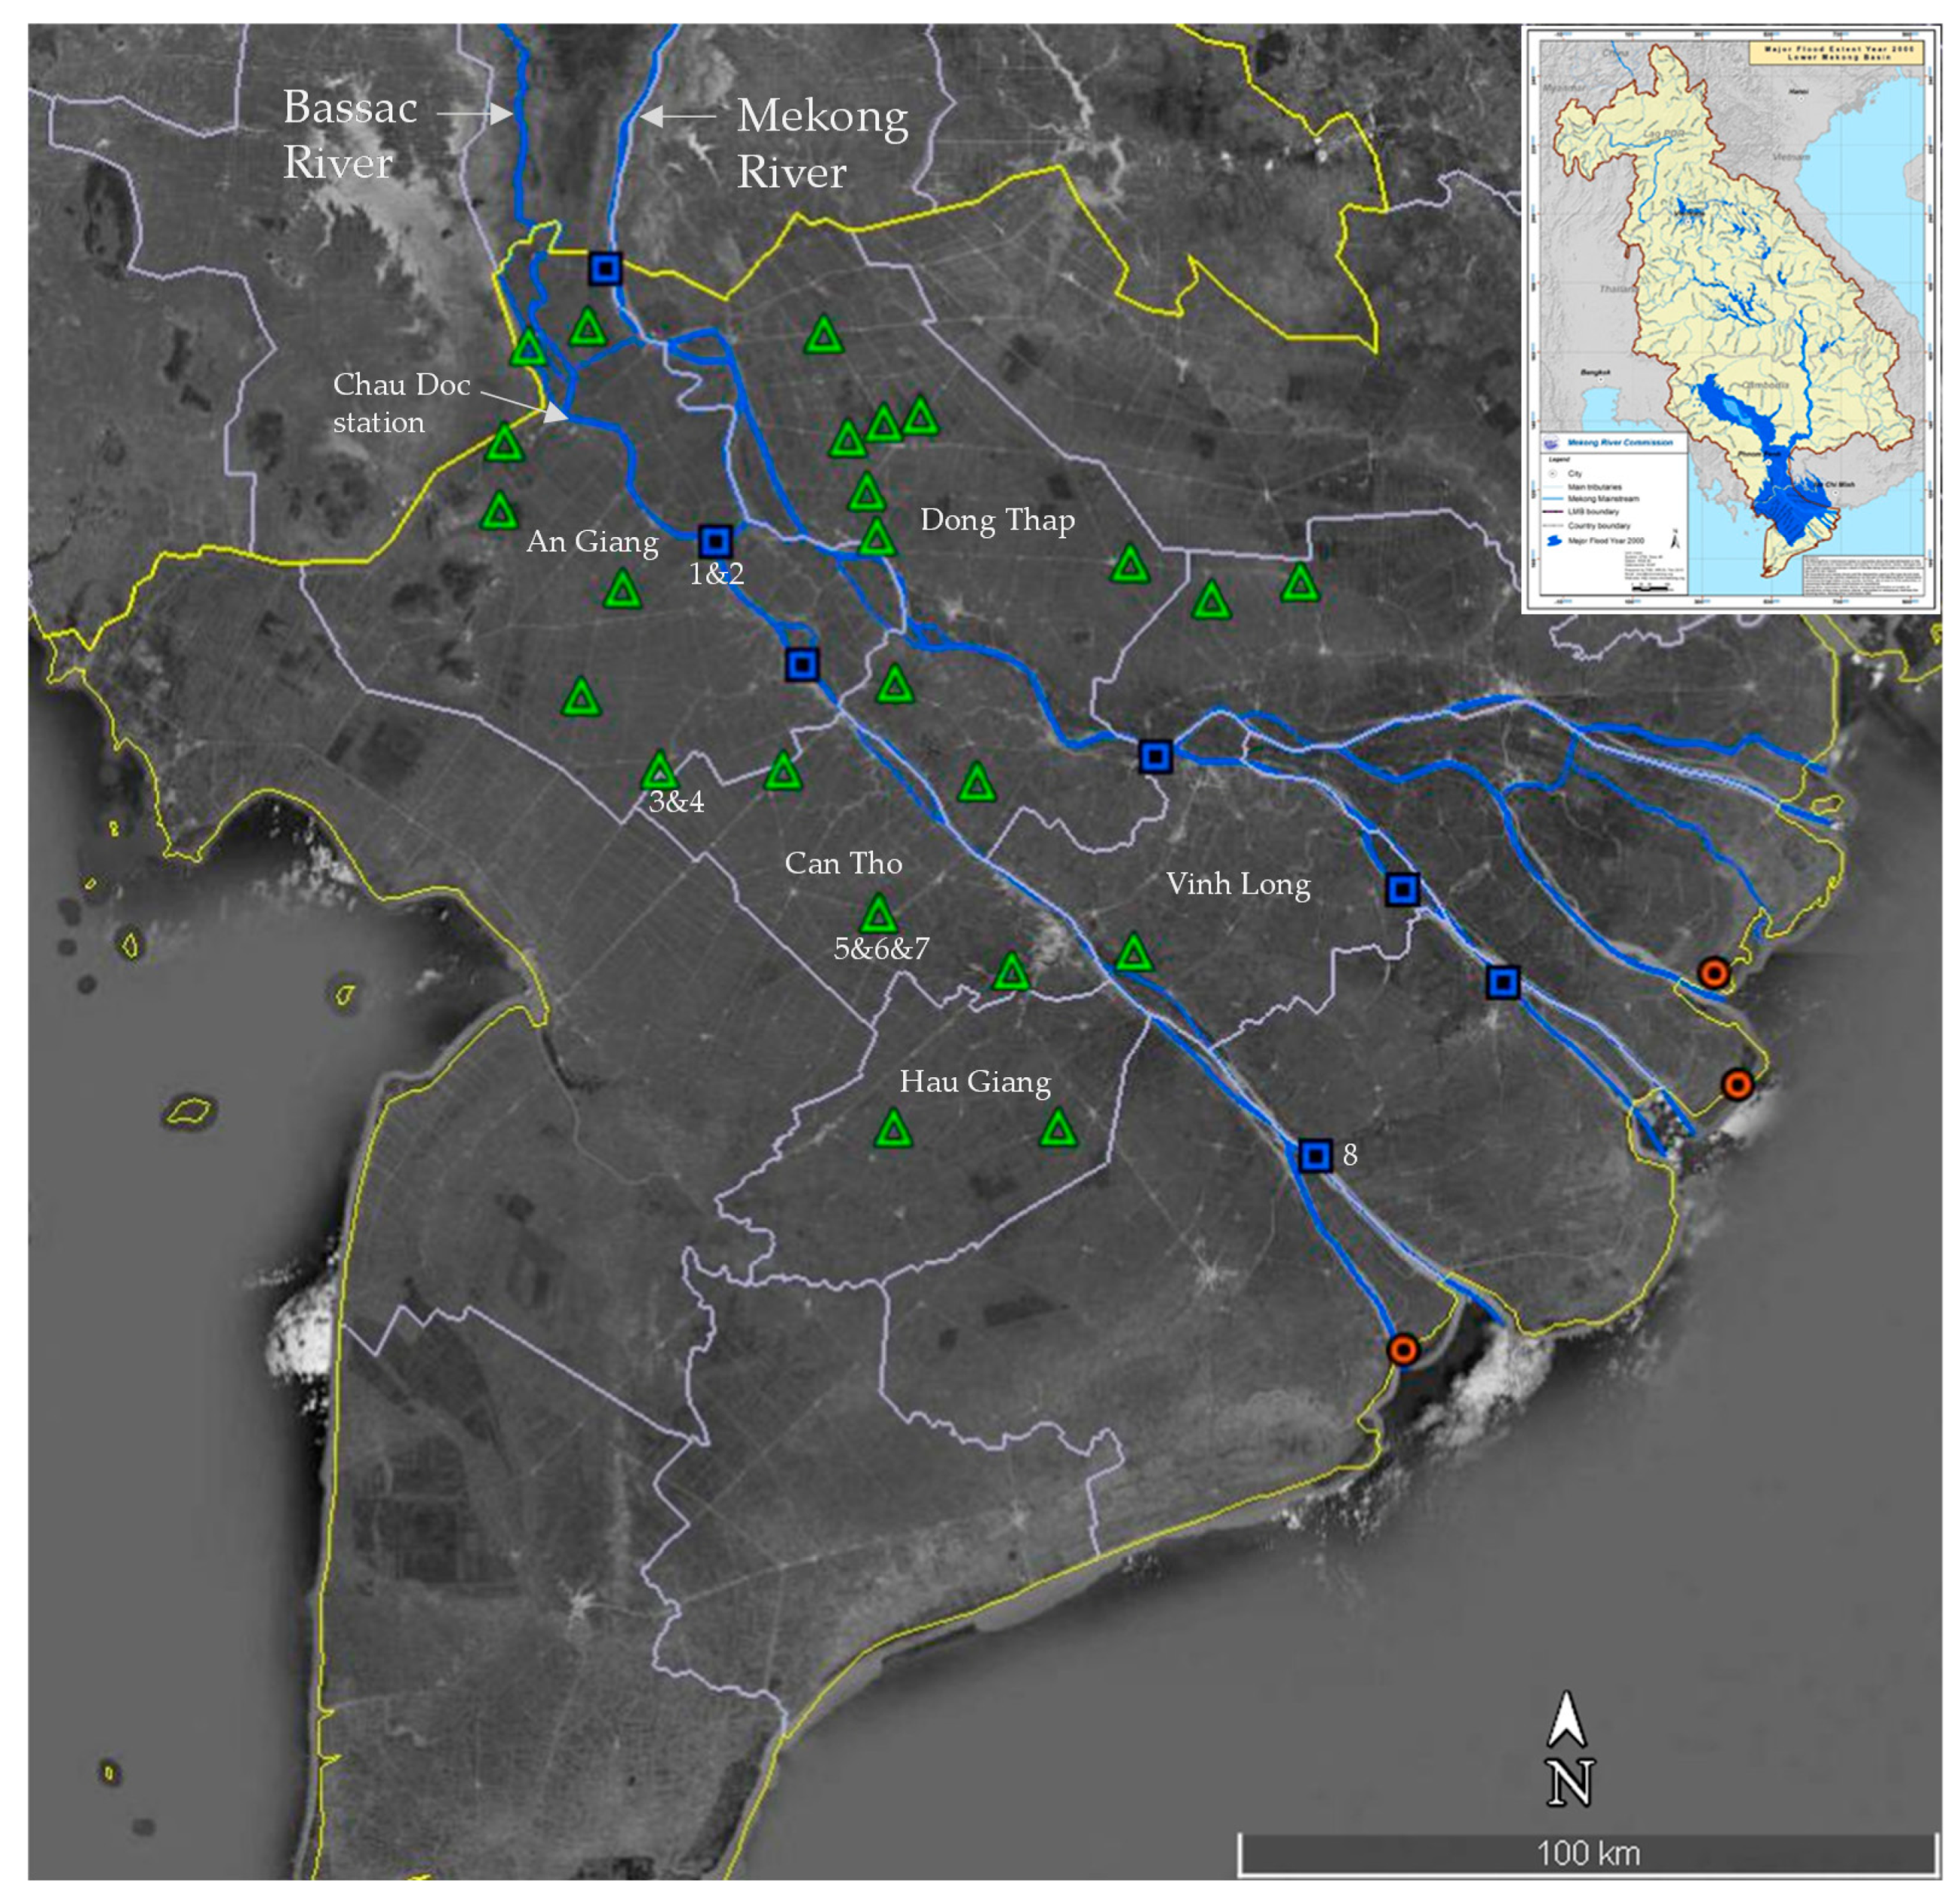
In this study, 34 sites in different habitats representative of the main stem, “tributary”, and coastal areas in the MDV were chosen in which to select fishers for interviewing (Figure 2). Most of the interview sites (24 sites) were located along “tributaries”, which in this context describes the canalised environment between the main river channels, where large primary canals connect the main river channels laterally to balance flows, and secondary and tertiary canals distribute irrigation water and provide drainage. Water flows in both directions in these highly engineered canal systems, where much of the original landscape was swamplands. A further seven sites were selected along the main channels and three sites were selected near the coast. A total of 1020 fishers (30 fishers per site) were interviewed in 2014, using structured questionnaires to obtain information on: (1) their recall of trends in their fish catches in the previous five years (increase, decrease, stable, or do not know); (2) their opinions of the factors driving trends in their fish catches; (3) their fishing gears and methods used; (4) the occupations of fishers aside from or as well as fishing; and (5) their fishing experience. Fishers with relatively long-term fishing experience were selected for interviews because we aimed to investigate long-term changes. The selection of fishers followed consultation with local authorities who knew the fishing households, after which fishers were interviewed by project staff and local officers. Participating in an interview was based on the willingness of fishers. To avoid bias we did not provide any gifts or financial support. To ensure consistency, each interviewer was trained and provided with guidelines that explained the interviewing procedure and each question’s purpose. Among 1020 fishers selected for interviewing, there were coincidentally eight fishers who had recorded their catches and effort each day under a separate program by the Research Institute for Aquaculture No.2 (RIA2) which was funded by the Mekong River Commission (MRC; Figure 2). Daily catches of these eight fishers from 2009 to 2014 were examined to determine if any trends were evident and for comparison with our interview data, which was based on recall.
2.2. Secondary Data
Statistics on annual inland fisheries capture yield and rice farming (area and production) of the MDV are collected by districts, which report them to provinces, where they are aggregated, and sent to the central government for national reporting and compiled by the General Statistics Office, from which we used data for the period from 1995 to 2016 [19].
The methods of fisheries data collection are not published, but in some provinces, they are reported to represent catches by registered fishers using large commercial gears [28,29]. We assumed that although the approach may vary, the methods in any province are likely to be consistent over time, so the aggregated statistics are likely to represent trends in commercial catches. It should be noted that the official catch statistics neglect household catches, which are usually a much larger component of total catches than commercial catches [28,29] as is a common problem in inland fisheries monitoring [30]. Official statistics on fish yield in coastal provinces include both inland and marine fishery products, therefore, fish yield data was collected only from inland provinces within the major flood zone (An Giang, Dong Thap, Vinh Long, Can Tho and Hau Giang) of the Mekong Delta for this study.
Most rice farmers cultivate two or three crops per year and annual rice farming areas are the sum of the area cropped each time; so for example, if 1 ha is cultivated three times then the total area cropped is recorded as 3 ha for that farmer for that year. Hence the total cropped area is likely between 2 and 3 times the actual land area farmed for rice each year. However, some farmers cultivate other crops on the same land.
Data on daily water levels at Chau Doc station on the Bassac River (the second-largest channel of the Mekong in the delta) were also compiled from the Mekong River Commission for the period 1995–2016. We could not obtain long-term data on flood extent and duration in the Delta, but we assumed that flooding is likely to be highly correlated with the water level, assuming no landscape change over time (such as enclosure and exclusion of floodwater).
2.3. Data Analysis
Responses from all respondents were coded before processing data to check and correct errors and generate descriptive statistics. We then explored factors that were believed by fishers to influence catches. Official data from 1995 to 2016 were analysed to test relationships between annual inland fisheries yield (including fish and OAAs) and other variables related to rice farming (annual rice farming areas and rice production) and flooding regime indicators (maximum, minimum, average, and standard deviation of the Bassac River water levels) by correlation analysis.
3. Results
3.1. Fishers’ Profile
Most (63%) of the interviewees reported that they were part-time fishers who used up to 4 fishing gears. They had other occupations, especially farming and labouring (Table 1). In “tributary” habitats, a much lower proportion (13%) of interviewees reported that they were full-time fishers, compared with the mainstem and coastal fishers. Fishers who live near “tributaries” usually had some land for farming, and they fished mainly for their household consumption, whereas people who live near large water bodies tend to specialise in fisheries, investing in boats and larger gears to catch commercial quantities of fish.
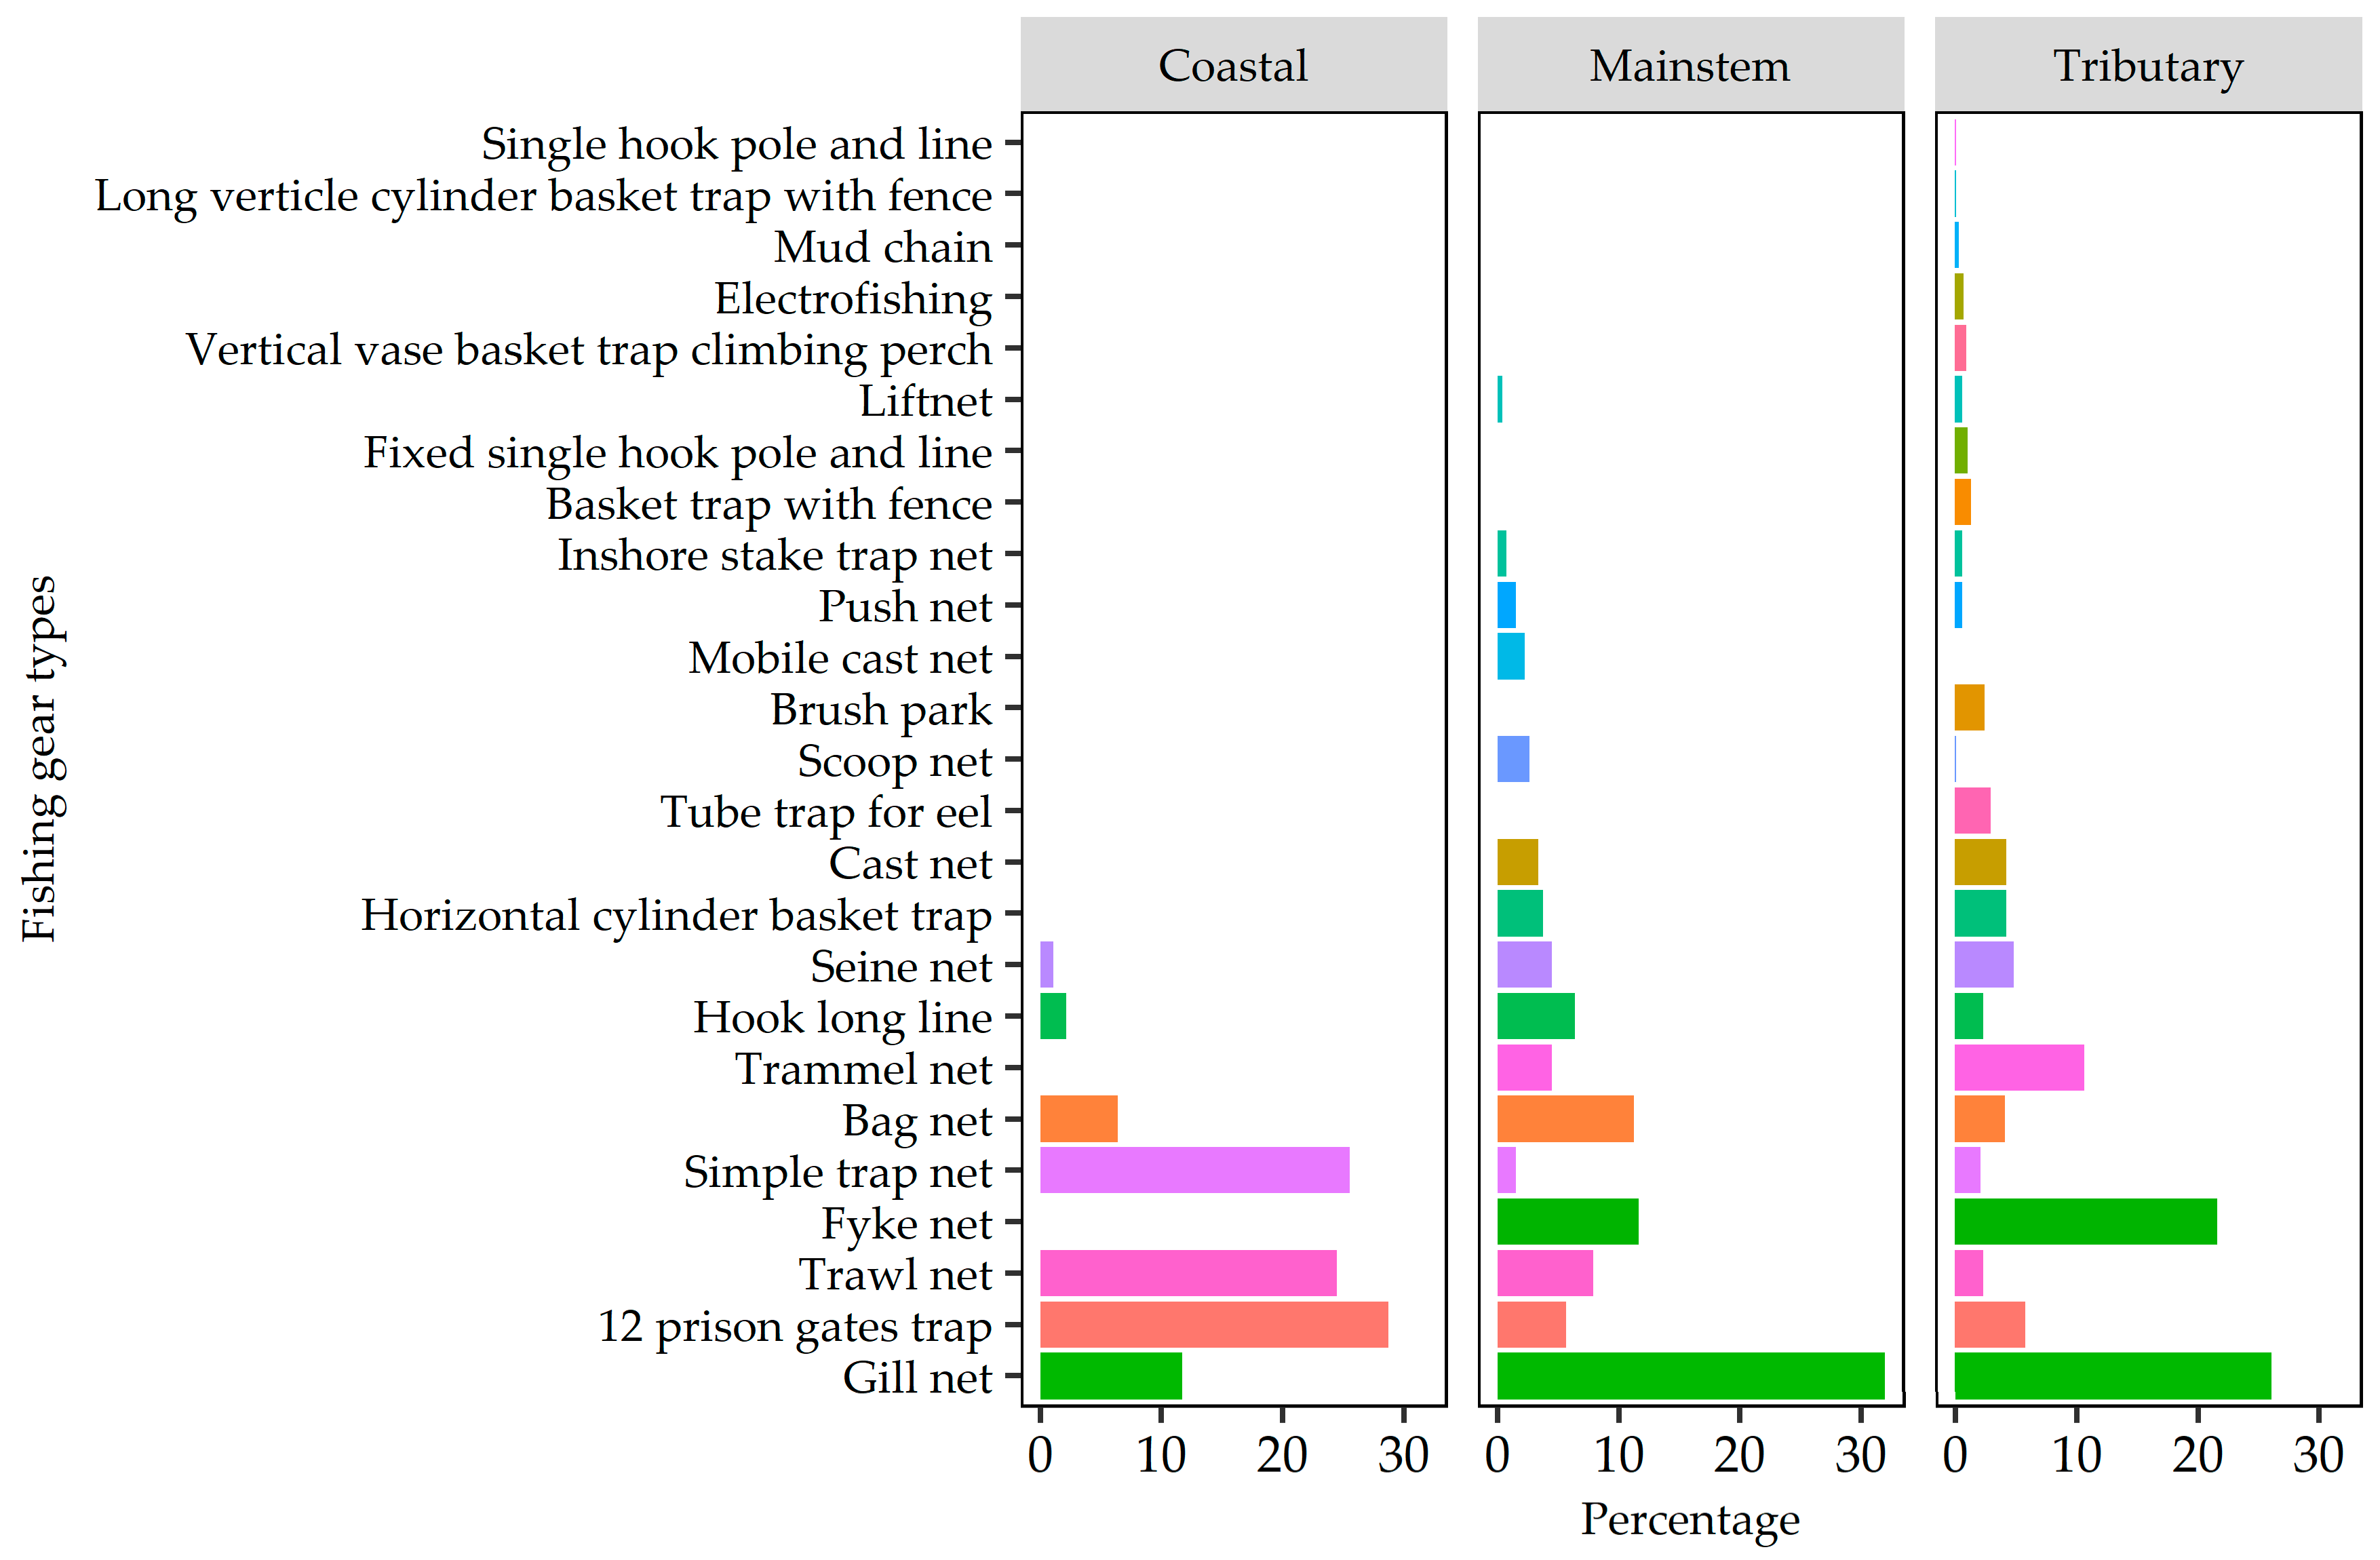
Interviewees reported that they used 25 types of fishing gears (Figure 3). Gill-nets, fyke-nets, and trammel-nets were popular gears, used by about 52% of interviewees. Gill-nets were the most common fishing gears (26% of interviewees). At least two illegal fishing gears (fyke-nets and electrofishers), accounted for 18% of total gear reports in this study. Fyke-nets consist of long wings (up to several kilometres long) that guide fish towards the entrance of cylindrical bags. These traps are usually made from mosquito netting which has a mesh aperture of about 2 mm, which catches fish and OAAs of all sizes (including larvae). “Electrofishing” in this study included backpack models and any gears that were equipped with electricity.
3.2. Interview Results on Trends in the Inland Capture Fishery and Driving Factors
Most of the fishers in all three environments claimed that both catch rates and fish size (reported as length) in their catch declined over the previous five years. In terms of total catch biomass, almost all fishers (90%) reported that their catches decreased. This trend was consistent between environments (Table 2). Interestingly, a few fishers (1%) in tributary habitats believed that their fish catch had increased as they used more efficient but illegal gears (e.g., fyke-nets with smaller mesh-sizes than permitted) or novel gears that were more effective at catching fish (e.g., 12-prison-gate trap).
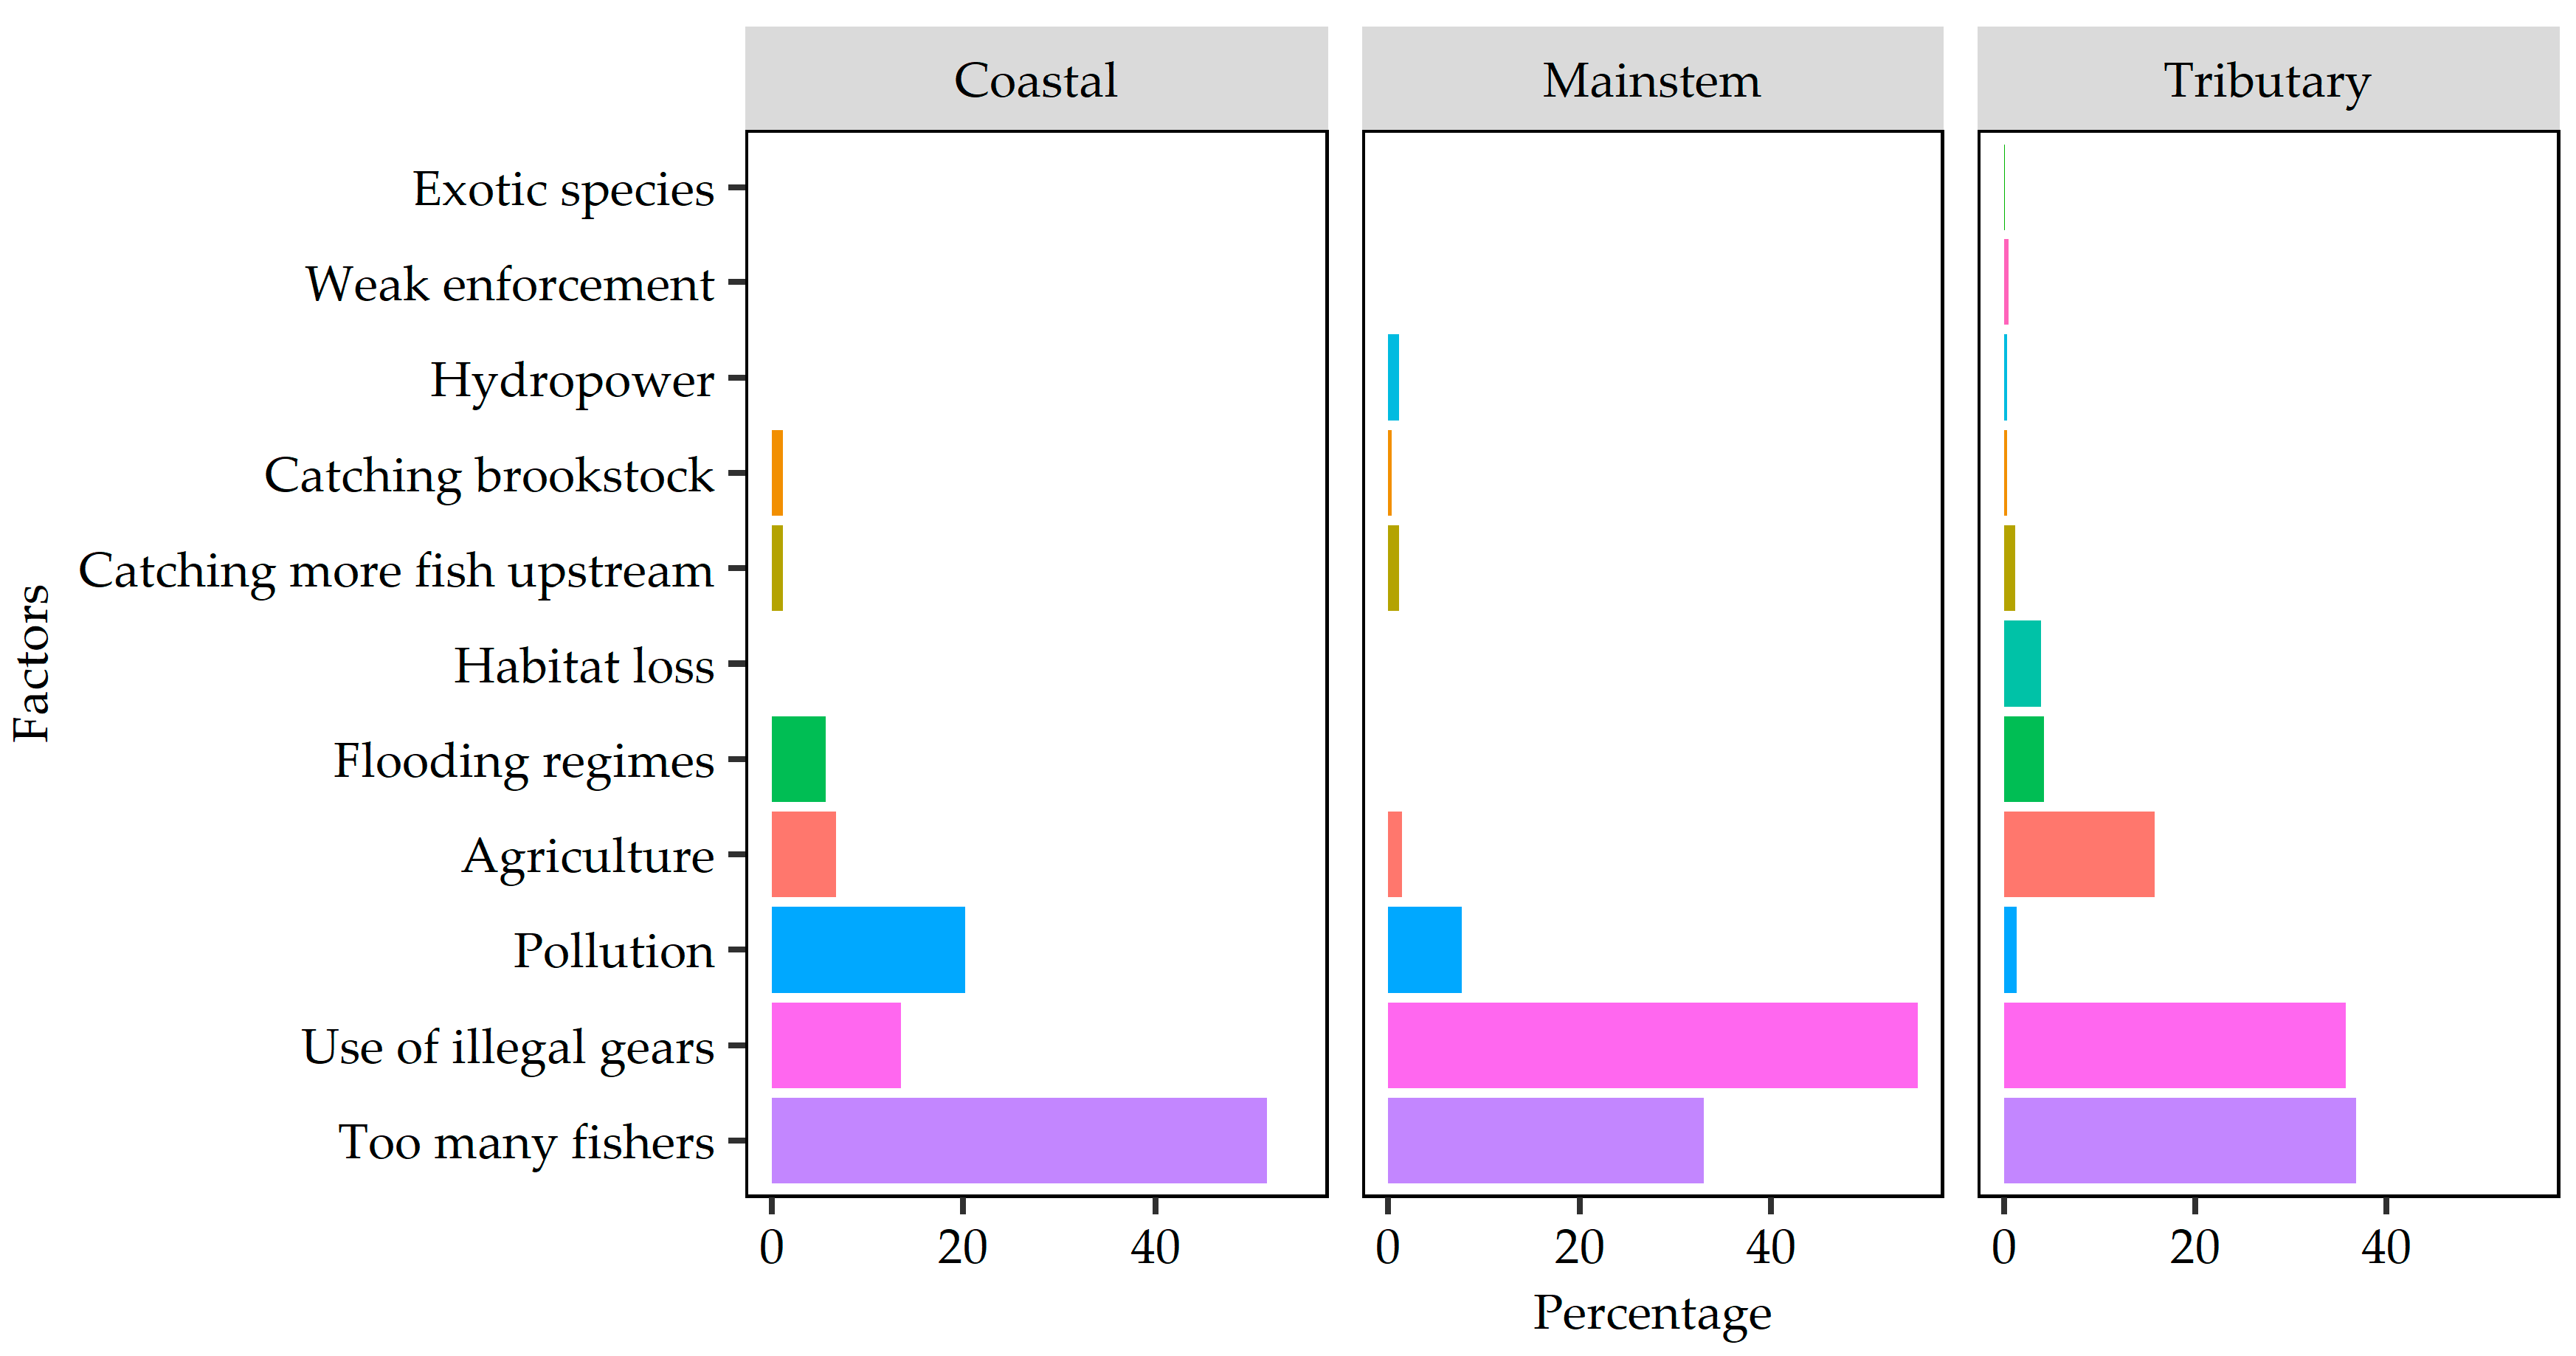
Eleven factors were reported to contribute to the perceived decline in fish catches in this study (Figure 4). Among the factors, the use of illegal gears and overfishing were believed by the fishers to be the main factors driving the perceived decline in fish catches. Other driving factors included agricultural activities, hydrological regimes, pollution, habitat loss, and other minor factors.
3.3. Logbook Monitoring Results from Eight Fishers
All eight fishers under the catch monitoring program of RIA2/MRC said in interviews that their catches had declined over the period 2009–2014, the five prior years referred to in the interviews. However, the catch monitoring program showed that of eight fishers, actual catch rates (as kg/day) declined for only three fishers (38%), increased for four fishers and were stable for one fisher. However, effort (indicated by average soak hours) and total catch increased for five fishers, were stable for one and decreased for two fishers, with catch rates expressed as “kg/soaking hour/100 m2 of net” decreasing for five fishers (75%; Figure 5), increasing for one and stable for one. These limited data suggest that total catches were not declining, but the effort by individual fishers was increasing to compensate for falling catch per unit effort.
3.4. Official Inland Fisheries Catch Statistics and Water Levels
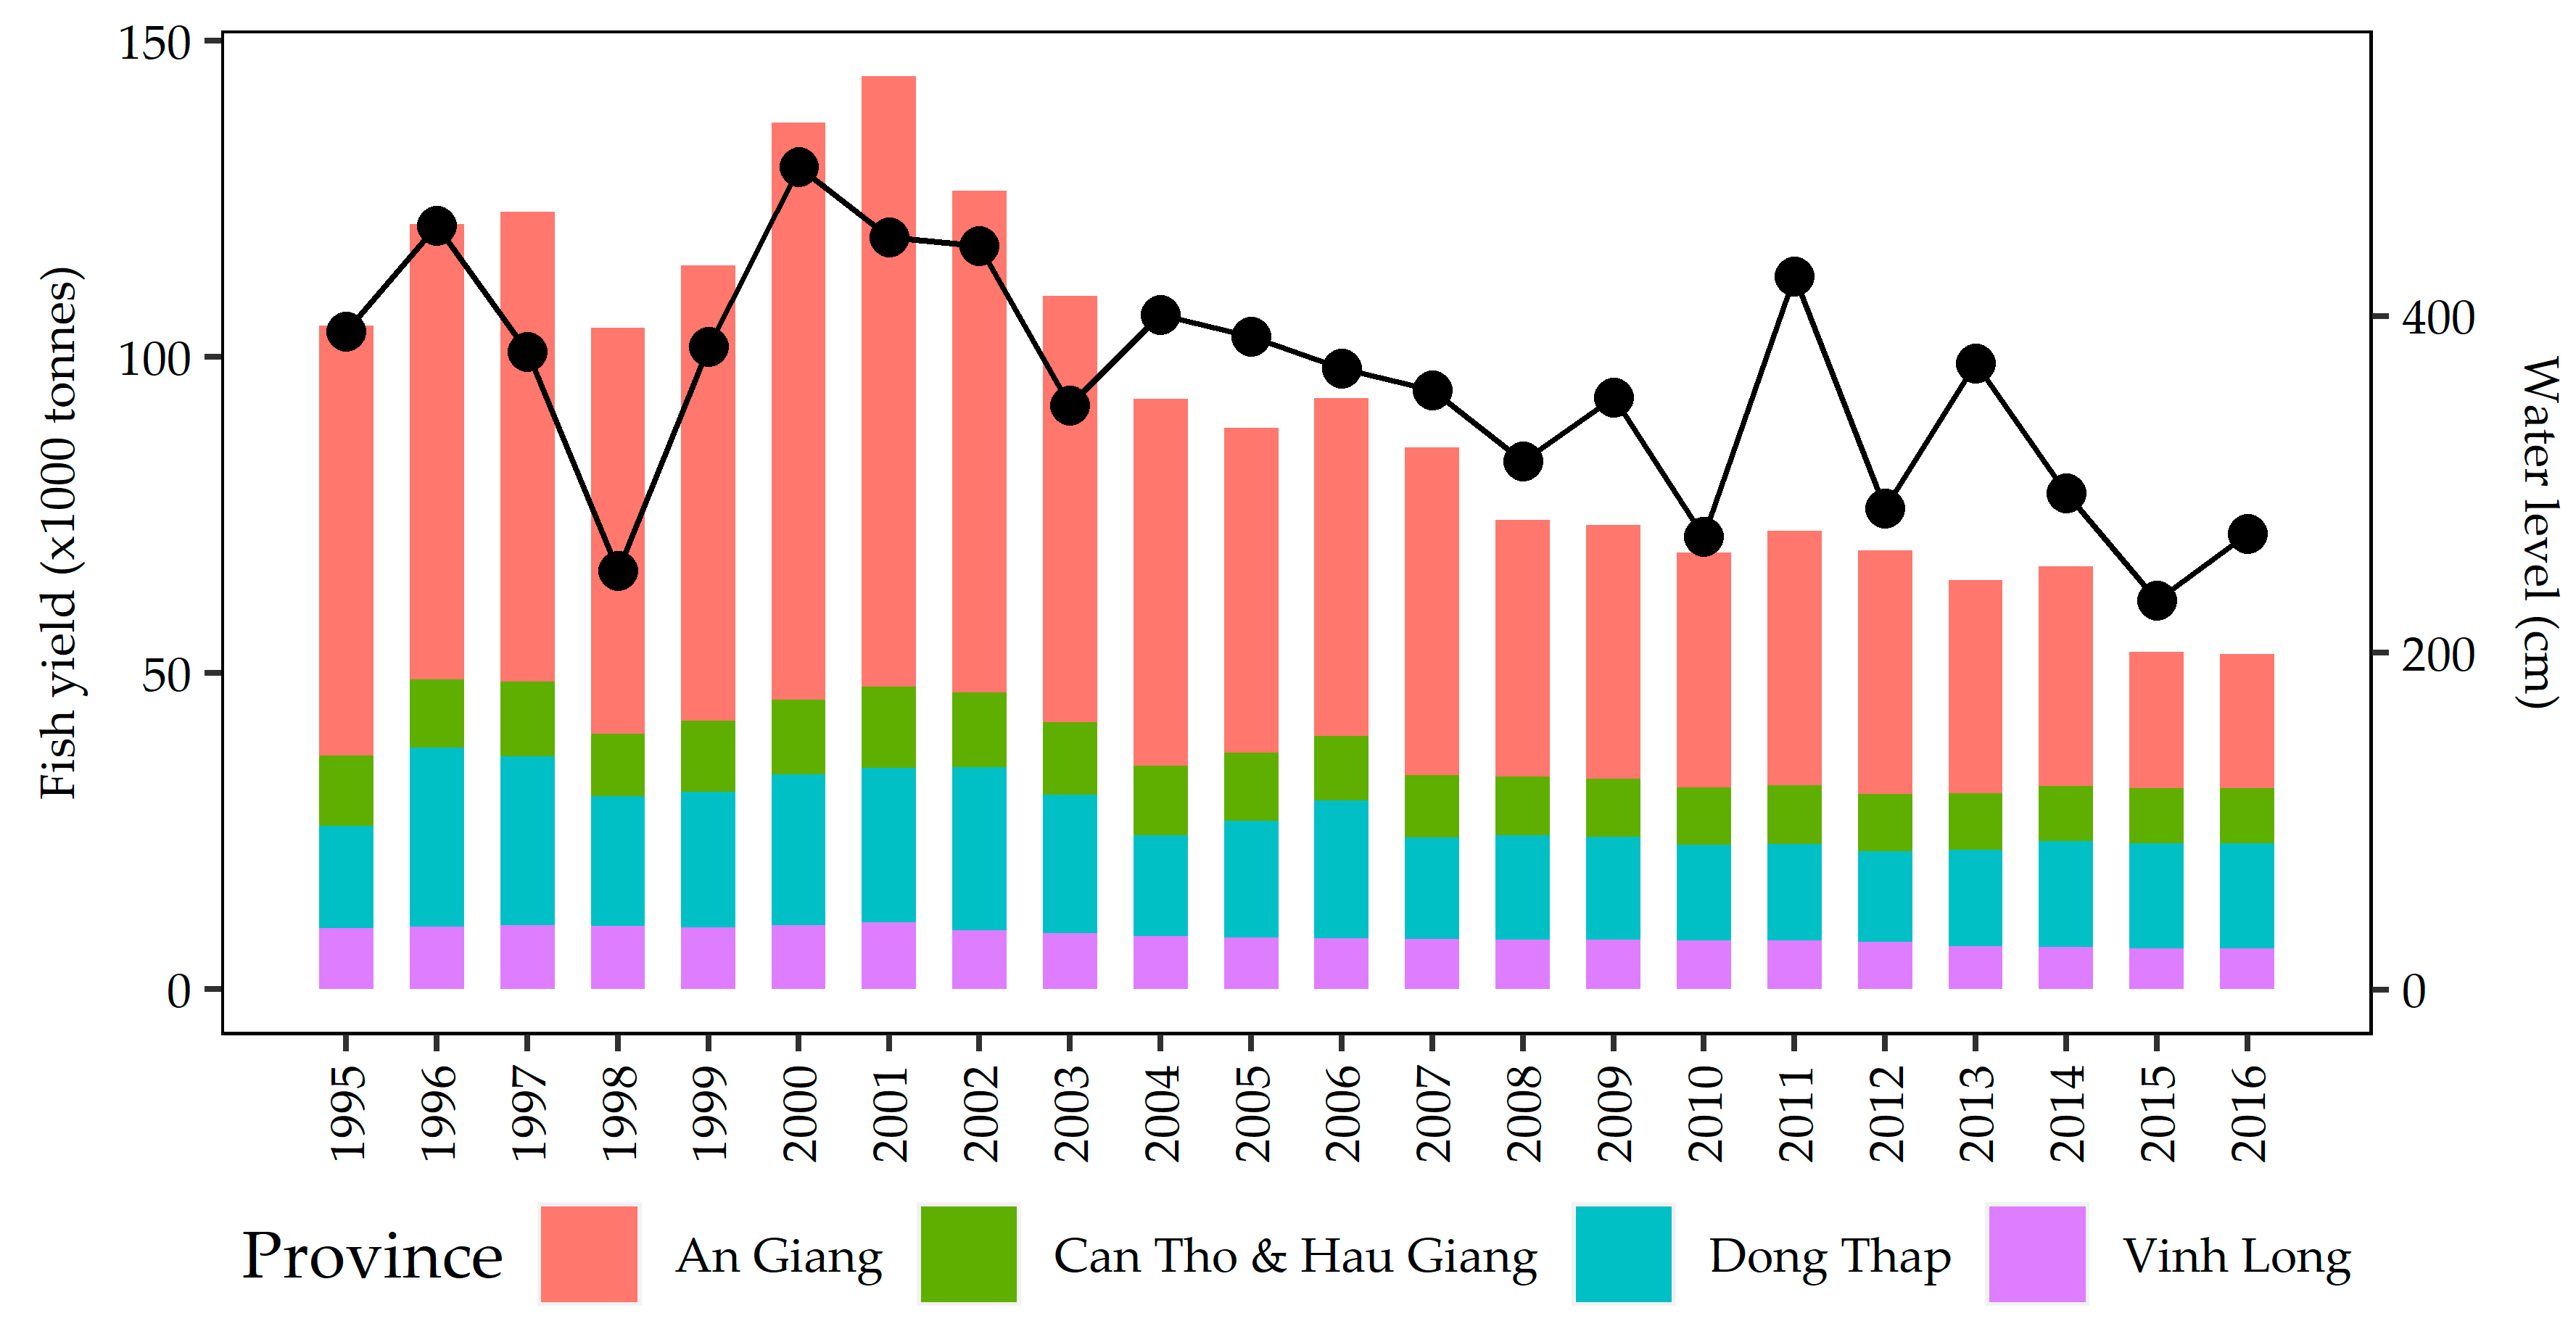
Official figures show fish catches increased, declined then increased again between 1995 and 2003; then declined by 50% over a 13-year period, 2004–2016 (Figure 6). An Giang province contributed most (59%) of the total fish yield on average, and also showed the largest relative decline in catches. The decline was also partly attributable to Dong Thap, with catches from the two other provinces relatively stable.
Over the 22-year period, 1995–2016 the Delta experienced its highest peak water levels (and largest floods) in descending order during 2000, 1996, 2001 and 2002, with a 9-year lag from 2002 to the next-largest flood in 2011 (Figure 6). The period 1995 to 2003 was a relatively wet period, with large floods in four of nine years, and with above-average flood levels in 7 of 9 years. By contrast, the subsequent 13 years were relatively dry, with only one large flood, in 2011, and with 9 of 13 years having below-average peak flood levels.
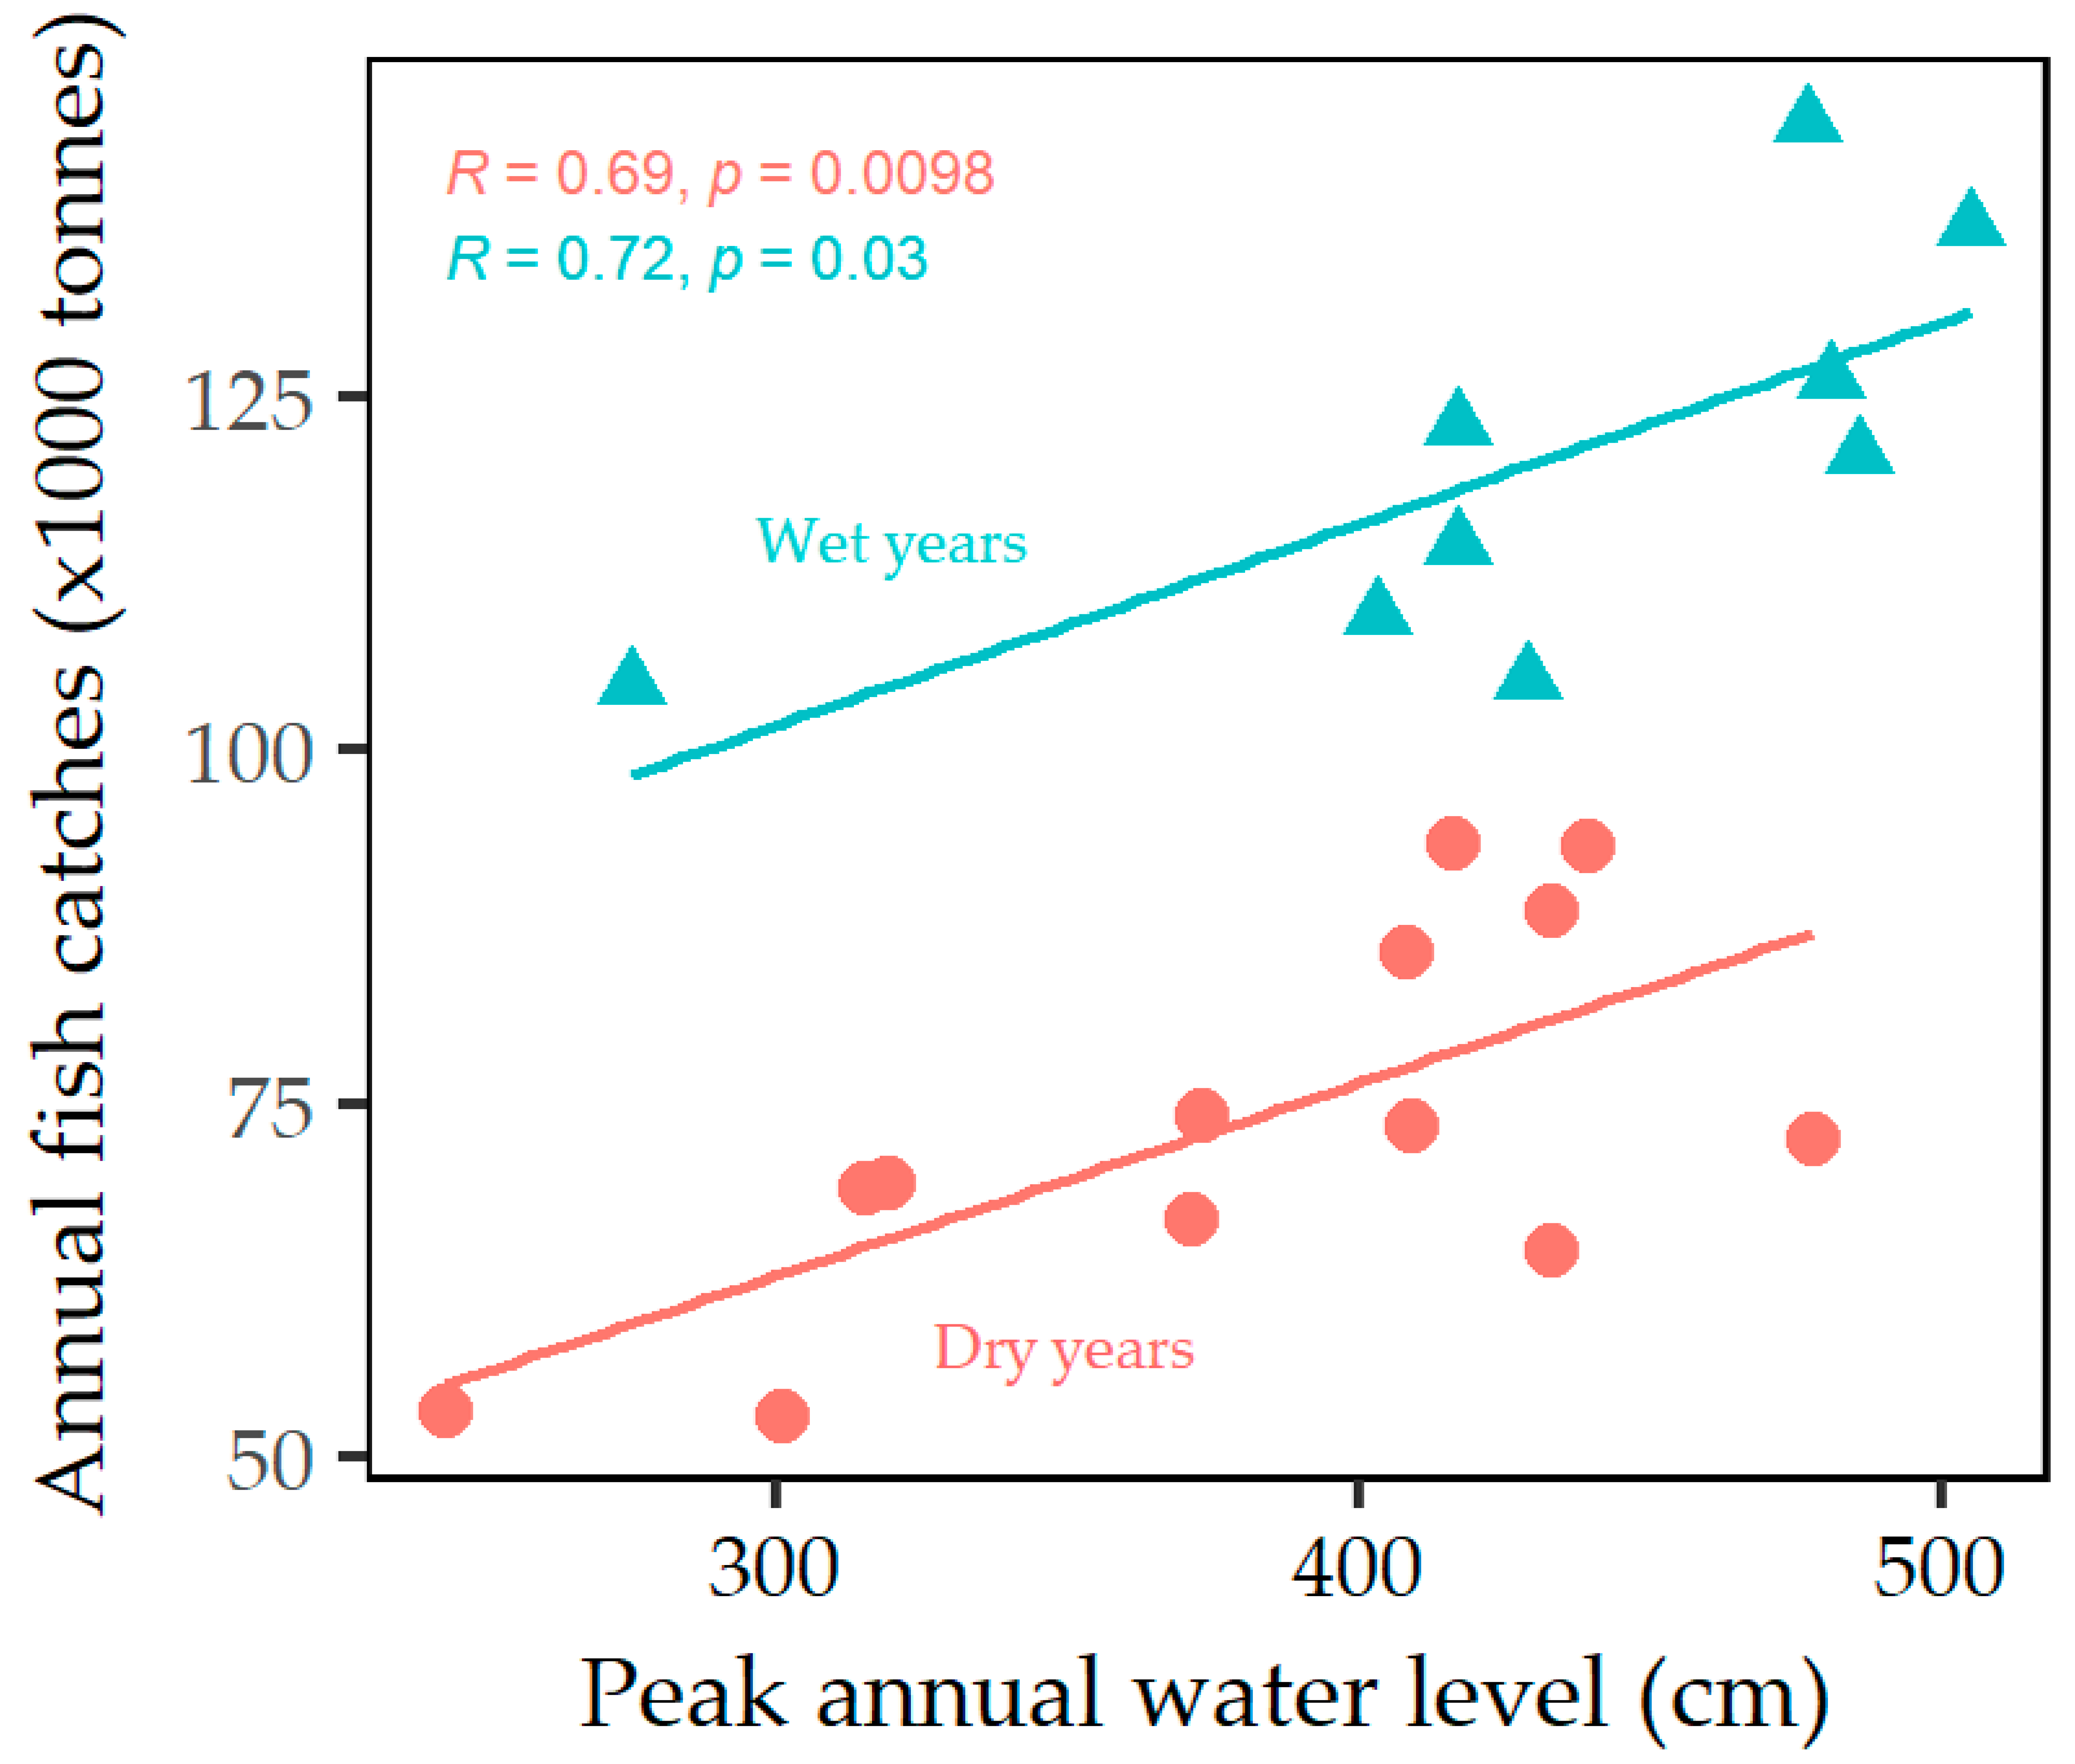
Over the entire 22-year period “official” catches generally declined. Over the first “wet” period 1995–2003, the relationship between flooding and fish catches was more significant (r = 0.72; p = 0.03, n = 9) than during the second “dry” period (r = 0.69, p = 0.01, n = 13). Fish catches during the dry period were not only generally less than during the wet period but were less than would be predicted by the water level-catch relationship from the preceding wet period (Figure 7). The water level-catch regressions for the two periods are clearly separated with no overlap between individual data points, indicating a significant change in the catch-water levels regression between the two periods, with any effect of flooding on fish catches in the dry period being apparently less than during the preceding wet period.
3.5. Official Inland Fisheries Catch Statistics and Rice Farming
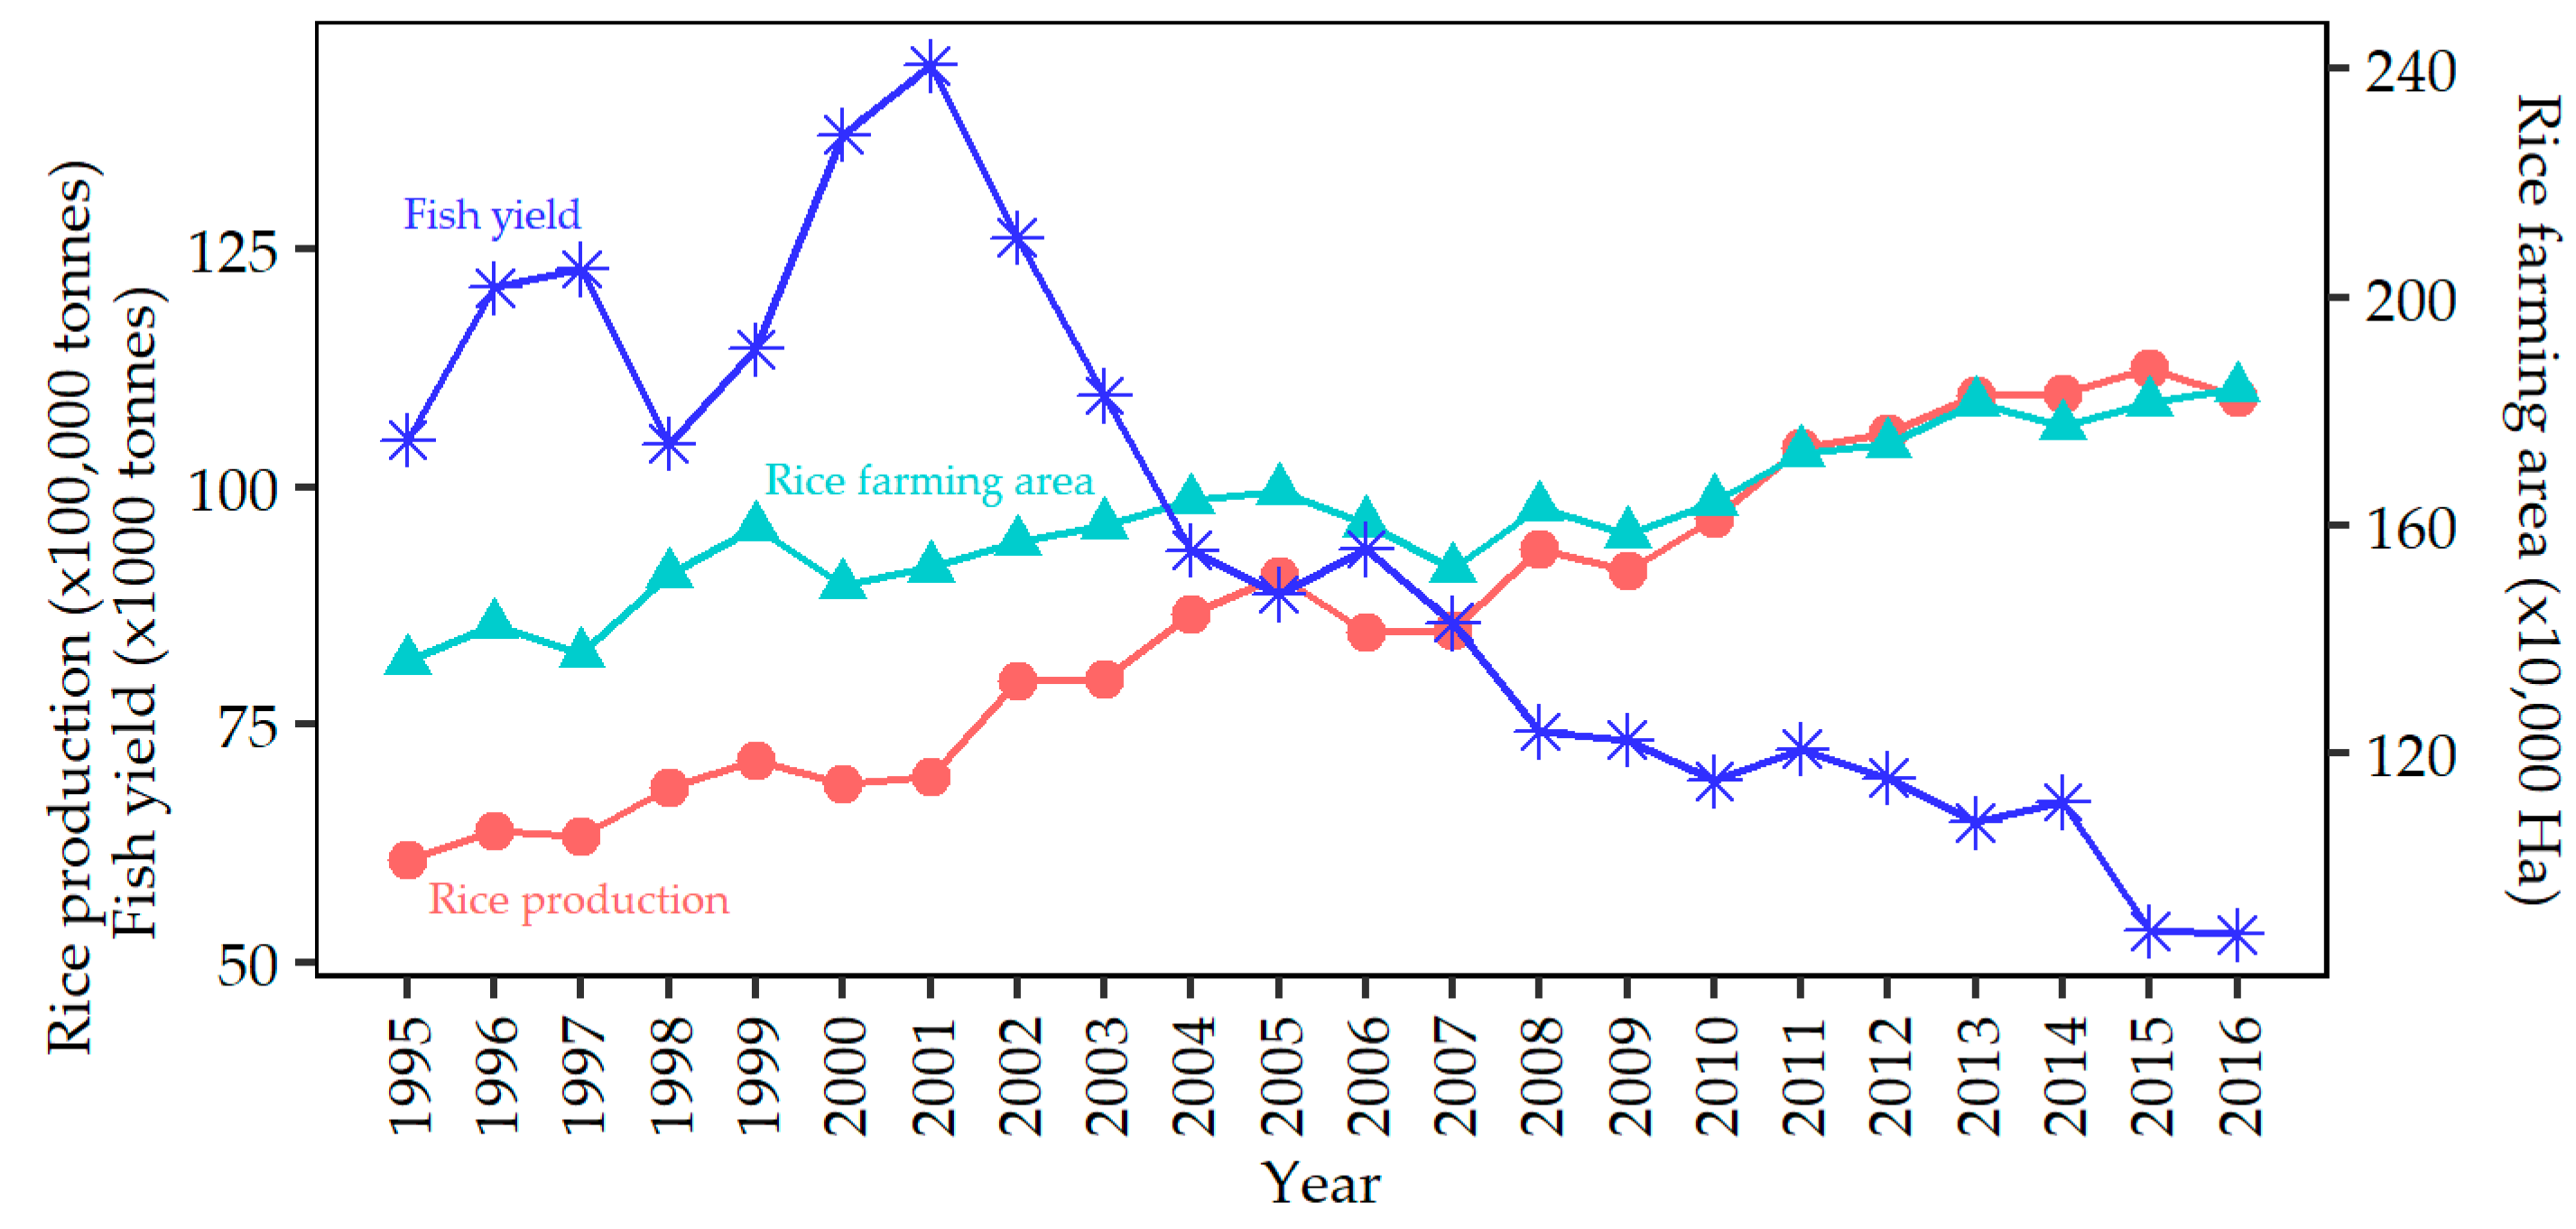
There was a steady increase in both rice farming area and rice production over the period 1995–2016, corresponding with the reported decline in fish catches (Figure 8). In particular, large proportions of land were dyked and converted to triple rice farming area in An Giang (46%) and Dong Thap (40%) provinces in 2013. Correlation analysis found that fish yield was significantly positively correlated with all parameters of annual water levels, as these are all inter-correlated, but the fish yield was negatively correlated with rice farming area and production (p < 0.05; Table 3).
4. Discussion
Official fishery statistics showed that there was a substantial decline in fish catches over the study period in the MDV. Over the same period, there were significant increases in the areas farmed for rice and the annual production of rice, particularly in the two most inland provinces, which are where the declines in official catches are most pronounced. Fish catches were highly negatively correlated with increasing rice production (Table 3), which entails enclosing land with dykes to exclude floodwaters, and intensifying inputs of fertilisers, pesticides and high-yield rice. Impacts on fisheries would be expected because of the reduction in flooded areas caused by enclosure, and the increased use of pesticides, so the negative correlation is not likely to be an artefact [31,32]. However, while rice production and area farmed have increased, there has also been a series of dry years (2004–2016), with below-average peak water levels, which would lead to reduced flooding, which would be likely to cause fewer fisheries production independently of land-use changes. Our analysis however takes account of this possible confounding factor and shows that during the period of dry years, official fish catches were less than predicted from the preceding relationship with peak water levels (Figure 7), suggesting that the water level/catch relationship changed significantly after 2003. A likely explanation is that because of the enclosure of farmland and exclusion of floodwaters from about 2004, subsequently, any given water level indicated a smaller flood extent than formerly, with flood extent (and duration) being the actual (but unmeasured) factors driving fisheries production. A similar correlation of fish growth rates and catches with flooding has been found for the Tonle Sap dai fishery in Cambodia (about 200 km upstream of the Vietnam delta) over a similar period (1999–2015) when water level (and flooding) variations were similar to those discussed here, but where apparent declines in the fishery were attributed (without evidence) to an increase in fishing pressure [33]. Declining catches in the Vietnam delta are likely to be due in part to the impact of dry periods on fish production further upstream, including in the Tonle Sap, given the importance of upstream productivity to catches in the delta [34]. Conversely, impacts in the MDV may cause impacts upstream, given the importance of migratory species in the Mekong, an upstream-directed impact that is rarely discussed in consideration of transboundary impacts in the LMB.
The limited data we analysed suggests that the two main factors driving the apparent decline in inland fisheries catch are hydrology and land-use changes. A series of relatively wet years (1995–2003) was followed by a series of relatively dry years (2004–2016), with the impacts of climatic variation on river flows perhaps exacerbated by damming upstream [35]. Total official fish catches correlated positively with water levels, with the actual drivers likely to be flood extent and duration, deposition of nutrient-rich sediment, and availability of water in dry season refuges [36]. During the years when the MDV experienced this wet period followed by a dry period, agriculture intensified in the delta, with enclosure of large areas of An Giang and Dong Thap resulting in the exclusion of floodwaters that deposit sediment and flush out pesticides; intensification also entails increased use of pesticides to support a third rice crop. After 2003 the relationship between water level and fish catches changed significantly, probably because, as a result of the enclosure, flood extent (the actual driver of fisheries production) was less for a given water level than formerly, with impacts perhaps compounded by pesticide toxicity or some other correlates of increasing intensification of land-use [37].
A large majority of the 1020 fishers who were interviewed believed that their catches had declined in the five years prior to the interview (2009–2014), and most attributed that decline to increase fishing pressure from more fishers and the increasing use of illegal and more efficient gears. The perceptions of recent declines in catches were not consistent with actual monitoring data from a small subset of those fishers, nor for the official catch figures over that 5-year period which showed no consistent change (Figure 5). The fishers’ general beliefs that their catches had recently declined could reflect a misunderstanding of the intended subject period (prior 5 years) during the interviews and is also consistent with the common recall bias of “telescoping or omission errors”, where distant events (such as larger catches in the early 2000s) could seem more recent and recent events seem more distant than they were [38]. The interview data might also suffer from various other recall biases, or perhaps include deliberate misinformation.
The fishers’ general belief that increased fishing pressure was the main cause of perceived declines in fish catches is inconsistent with the evidence of declining fishing pressure in the MDV since 2000 (based on participation rates) [20,23] as well as actual data from their own catches. Fishers’ concerns over the impacts of illegal fishing gears are understandable, but we note that such gears have been commonly used in the MDV and upstream in Cambodia since the 1990s. Alternative explanations for fish catch declines based on hydrology and land-use impacts seem much more probable, given the highly significant correlations discussed above, which we interpret as causal, based on plausible mechanisms for the impacts of hydrology and land-use on the productivity of aquatic ecosystems and fish catches.
5. Conclusions
This study identified eleven factors that fishers believed contributed to declines in their fish catch rates. Increased fishing pressure and the use of illegal gears (which increases fishing pressure but also has destructive impacts) were by far the factors of most concern for the fishers. Understandably, fishers observe and identify these factors, which they can directly observe each day while fishing. However, our analysis suggests that reduced flooding extent and duration, and land-use changes (especially associated with intensive rice cultivation), are likely to be the main factors impacting aquatic ecosystems and ultimately causing the apparent reductions in fish yields. Changes in land-use and hydrological variation affect large areas over lengthy periods, so they are not amenable to accurate observation or recall by casual observers who work in restricted locales. The mismatches between fishers’ perceptions, their own actual data in some cases, and the real underlying environmental causes of changes, highlight the need for more representative long-term monitoring data on important ecosystem attributes, and calibration of any interviews against actual monitoring data.
Our study highlights the potential impacts of water-related sectors (e.g., agriculture, irrigation and hydropower) on inland fisheries, which are important for food security and livelihoods; such impacts need to be considered and managed for sustainable development in the Mekong region.
Author Contributions
Conceptualization, A.V.V. and D.N.N.; methodology, A.V.V. and D.N.N.; software, A.V.V. and K.G.H.; validation, A.V.V. and K.G.H.; formal analysis, A.V.V., K.G.H. and D.N.N.; investigation, A.V.V. and D.N.N.; resources, A.V.V. and D.N.N.; data curation, A.V.V. and D.N.N.; writing—original draft preparation, A.V.V.; writing—review and editing, A.V.V. and K.G.H.; visualization, A.V.V. and K.G.H.; supervision, A.V.V. and D.N.N.; funding acquisition, A.V.V. and D.N.N. All authors have read and agreed to the published version of the manuscript.
Funding
This research received no external funding.
Institutional Review Board Statement
This study includes a review of secondary survey data collected by other agencies, as well as some primary interview data of villagers in Vietnam, which was collected by RIA2, the employer of the first and last authors. No animals were involved in this study and interviews were entirely voluntary. The authors complied with all policies of RIA2 and all laws of Vietnam. The second author was not involved in the primary data collection.
Informed Consent Statement
Informed consent was obtained from all subjects involved in the study.
Data Availability Statement
Secondary data referred to in this study can be accessed from website of the Government Statistical Office of Vietnam. Primary data which are summarised in this paper are the property of RIA2 and can be accessed by correspondence with the first author and subject to internal approval and suitable acknowledgement in and/or co-authorship of any resulting publications.
Acknowledgments
We gratefully thank the staff of the Research Institute for Aquaculture No.2 for data collection and the Vietnam National Mekong Committee for the use of interviewing dataset. Finally, the authors thank anonymous reviewers for providing recommendations to greatly improve this manuscript.
Conflicts of Interest
The authors declare no conflict of interest.
References
- Funge-Smith, S. Review of the State of the World Fishery Resources: Inland Fisheries; Food and Agriculture Organization of the United Nations: Rome, Italy, 2018. [Google Scholar]
- Funge-Smith, S.; Bennett, A. A fresh look at inland fisheries and their role in food security and livelihoods. Fish Fish. 2019, 20, 1176–1195. [Google Scholar] [CrossRef] [Green Version]
- Lintermans, M. Conservation and management. In Ecology of Australian Freshwater Fishes; Humphries, P., Walker, K., Eds.; CSIRO Publishing: Victoria, Australia, 2013; pp. 283–316. [Google Scholar]
- Peter, B.M.; Catherine, A.R.L.; Carmen, R. Linking freshwater fishery management to global food security and biodiversity conservation. Proc. Natl. Acad. Sci. USA 2016, 113, 12880–12885. [Google Scholar] [CrossRef] [Green Version]
- WWF. The World’s Forgotten Fishes; World Wide Fund For Nature: Gland, Switzerland, 2021; p. 47. [Google Scholar]
- Mekong River Commission (MRC). Overview of the Hydrology of the Mekong Basin; Mekong River Commission: Vientiane, Laos, 2005. [Google Scholar]
- Junk, W.J.; Soares, M.G.M.; Bayley, P.B. Freshwater fishes of the Amazon River basin: Their biodiversity, fisheries, and habitats. Aquat. Ecosyst. Health Manag. 2007, 10, 153–173. [Google Scholar] [CrossRef]
- So, N.; Phommakone, S.; Ly, V.; Theerawat, S.; Nguyen, H.S.; Khumsri, M.; Ngor, P.B.; Sovanara, K.; Degen, P.; Starr, P. Lower Mekong fisheries estimated to be worth around $17 billion a year. Catch Cult. 2015, 21, 4–7. [Google Scholar]
- Hortle, K.G. Consumption and the Yield of Fish and other Aquatic Animals from the Lower Mekong Basin. In MRC Technical Paper No.16; Mekong River Commission: Vientiane, Laos, 2007; p. 87. [Google Scholar]
- Hortle, K.G. Fisheries of the Mekong River Basin. In The Mekong: Biophysical Environment of an International River Basin; Campbell, I.C., Ed.; Elsevier: New York, NY, USA, 2009; pp. 199–253. [Google Scholar]
- Poulsen, A.F.; Hortle, K.G.; Valbo-Jorgensen, J.; Chan, S.; Chhuon, C.K.; Viravong, S.; Bouakhamvongsa, K.; Suntornratana, U.; Yoorong, N.; Nguyen, T.T.; et al. Distribution and ecology of some important riverine fish species of the Mekong River Basin. In MRC Technical Paper No.10; Mekong River Commission: Vientiane, Laos, 2004; p. 116. [Google Scholar]
- Baran, E.; Makin, I.; Baird, I.G. Bayfish: A Model of Environmental Factors Driving Fish Production in the Lower Mekong Basin; Food and Agriculture Organization of the United Nation & Mekong River Commission: Phnom Penh, Cambodia, 2004; pp. 1–20. [Google Scholar]
- Halls, A.S.; Paxton, B.R.; Hall, N.; Hortle, K.G.; So, N.; Chea, T.; Chheng, P.; Putrea, S.; Lieng, S.; Ngor, P.B.; et al. Integrated analysis of data from MRC fisheries monitoring Programmes in the Lower Mekong Basin. In MRC Technical Paper No.33; Mekong River Commission: Phnom Penh, Cambodia, 2013; p. 130. [Google Scholar]
- MRC. Mekong Fish Database. A Taxonomic Fish Database for the Mekong Basin; CD-ROM; Mekong River Commission: Phnom Penh, Cambodia, 2003. [Google Scholar]
- Nguyen, K.V.; Vo, O.V.; Huynh, D.N. Comparing the costs and benefits of floating rice-based and Intensive rice-based farming system in the Mekong Delta. Asian J. Agric. Rural Dev. 2015, 5, 202–217. [Google Scholar] [CrossRef] [Green Version]
- Nguyen, V.K.V.; Nguyen, D.V.; Merz, B.; Apel, H. Towards risk-based flood management in highly productive paddy rice cultivation—Concept development and application to the Mekong Delta. Nat. Hazards Earth Syst. Sci. 2018, 18, 2859–2876. [Google Scholar] [CrossRef] [Green Version]
- Baran, E.; Myschowoda, C. Have fish catches been declining in the Mekong River Basin? In Modern Myths of the Mekong; Kummu, M., Keskinen, M., Varis, O., Eds.; Helsiniki University of Technology: Helsinki, Finland, 2008; pp. 55–64. [Google Scholar]
- Ngor, P.B.; McCann, K.S.; Grenouillet, G.; So, N.; McMeans, B.C.; Fraser, E.; Lek, S. Evidence of indiscriminate fishing effects in one of the world’s largest inland fisheries. Sci. Rep. 2018, 8, 8947. [Google Scholar] [CrossRef] [PubMed] [Green Version]
- General Statistics Office. Statiscital Yeakbook of Vietnam 2018; Statiscical Publishing House: Ha Noi, Vietnam, 2019.
- Phan, L.T.; Doan, B.V.; Nguyen, D.T.; Nguyen, S.H.; Degen, P.; So, N.; Hortle, K.G. Survey of Fisheries Yield at Landscape Scale in the Mekong River Delta, Viet Nam; Mekong River Commission & Research Institute for Aquaculture No.2: Ho Chi Minh City, Vietnam, 2016; p. 146. [Google Scholar]
- Minderhoud, P.S.J.; Coumou, L.; Erkens, G.; Middelkoop, H.; Stouthamer, E. Mekong delta much lower than previously assumed in sea-level rise impact assessments. Nat. Commun. 2019, 10, 3847. [Google Scholar] [CrossRef] [PubMed]
- Hortle, K.G.; Bamrungrach, P. Fisheries habitat and yield in the Lower Mekong Basin. In MRC Technical Paper No. 47; Mekong River Commission: Phnom Penh, Cambodia, 2015; p. 80. [Google Scholar]
- Sjorslev, J.G.; Coates, D.; Visser, T.; Jorgensen, J.V.; Phan, L.T.; Pham, P.M.; Nguyen, T.T. An Giang Fisheries Survey; Mekong River Commission & Research Institute for Aquaculture No.2: Ho Chi Minh City, Vietnam, 2002; p. 70. [Google Scholar]
- Nguyen, D.N.; Smallwood, C.; Nguyen, H.V.; Nguyen, X.T.; Nguyen, T.T. Inland Fishing Gears Album of the Mekong Delta (in Vietnamese); Labor Publishing House: Ho Chi Minh City, Vietnam, 2006; p. 354. [Google Scholar]
- Baran, E.; Myschowoda, C. Dams and fisheries in the Mekong Basin. Aquat. Ecosyst. Health Manag. 2009, 12, 227–234. [Google Scholar] [CrossRef]
- Silvano, R.; Valbo-Jørgensen, J. Beyond fishermen’s tales: Contributions of fishers’ local ecological knowledge to fish ecology and fisheries management. Environ. Dev. Sustain. 2008, 10, 657–675. [Google Scholar] [CrossRef]
- Gray, T.N.E.; Phommachak, A.; Vannachomchan, K.; Guegan, F. Using local ecological knowledge to monitor threatened Mekong megafauna in Lao PDR. PLoS ONE 2017, 12, e0183247. [Google Scholar] [CrossRef] [PubMed] [Green Version]
- Sjorslev, J.G. An Giang Fisheries Survey. In An Giang Province—Viet Nam.; Draft Report; RIA2, Dept of Fisheries An Giang, Fisheries Dept, Can Tho University, AMFC of MRC Fisheries Programme: Vientiane, Laos, 2002; p. 70. [Google Scholar]
- Phan, T.L.; Pham, M.P.; Visser, T.; Sjorslev, J.G.; Hortle, K.G. Inland fisheries activities and fish consumption in Tra Vinh Province, Viet Nam. In MRC Conference Series; Mekong River Commission: Phnom Penh, Cambodia, 2003; Volume 4, pp. 127–139. [Google Scholar]
- Coates, D. Inland capture fishery statistics of Southeast. In Asia: Current Status and Information Needs; RAP Publication No. 2002/11: Bangkok, Thailand, 2002; p. 114. [Google Scholar]
- Tam, N.T. Pesticide Use in Rice Farming and Its Impacts on Climing Perch (Anabas Testudineus) in the Mekong Delta of Vietnam. Ph.D. Thesis, Stockholm University, Stockholm, Sweden, 2016. [Google Scholar]
- Berg, H. Pesticide use in rice and rice–fish farms in the Mekong Delta, Vietnam. Crop. Prot. 2001, 20, 897–905. [Google Scholar] [CrossRef]
- Halls, A.S.; Hortle, K.G. Flooding is a key driver of the Tonle Sap dai fishery in Cambodia. Sci. Rep. 2021, 11, 3806. [Google Scholar] [CrossRef] [PubMed]
- Hortle, K.G.; Bamrungrach, P. Fisheries habitats and yield in the lower Mekong Basin. MRC Tech. Pap. 2015, 47, 80. [Google Scholar]
- Lin, Z.; Qi, J. Hydro-dam—A nature-based solution or an ecological problem: The fate of the Tonlé Sap Lake. Environ. Res. 2017, 158, 24–32. [Google Scholar] [CrossRef] [PubMed]
- Halls, A.S.; Paxton, B.R.; Hall, N.; Peng Bun, N.; Lieng, S.; Ngor, P.; So, N. The stationary trawl (Dai) fishery of the Tonle Sap-Great lake, Cambodia. In MRC Technical Paper No.32; Mekong River Commission: Phnom Penh, Cambodia, 2013; p. 142. [Google Scholar]
- Tam, N.; Berg, H.; Van Cong, N. Evaluation of the joint toxicity of chlorpyrifos ethyl and fenobucarb on climbing perch (Anabas testudineus) from rice fields in the Mekong Delta, Vietnam. Environ. Sci. Pollut. Res. 2018, 25, 13226–13234. [Google Scholar] [CrossRef] [PubMed]
- Andrews, W.; Papacostas, K.; Foster, J. A comparison of recall error in recreational fisheries surveys with one- and two-month reference periods. N. Am. J. Fish. Manag. 2018, 38, 1284–1298. [Google Scholar] [CrossRef] [Green Version]
Figure 1.
Fish spawning in relation to flooding regimes and rice planting calendar in the Mekong Delta. Fish spawning data from [14]; water levels measured at Chau Doc station in 2000; fish life cycle adopted from [11]; rice planting calendar from [15,16]. Floating rice with low yield (2 tonnes/ha/crop and long farming period (6 months) while high yield rice with higher yield (8 tonnes/ha/crop) and shorter farming period (3 months) [15].

Figure 2.
Study sites in the Mekong Delta of Vietnam (triangle symbols: tributaries sites; square symbols: main stem sites; and circle symbols: coastal sites); numbers (1 to 8) next to symbols indicating eight fishers under the catch monitoring program of RIA2/MRC. The small top-right map shows the major flood zone (blue) of the Lower Mekong Basin.

Figure 3.
Fishing gears used in the Mekong Delta.

Figure 4.
Perspectives of fishers on the main factors contributing to perceived declines in fish catches in the Mekong Delta.
Figure 4.
Perspectives of fishers on the main factors contributing to perceived declines in fish catches in the Mekong Delta.

Figure 5.
Annual variation of gill-net length used for fishing, fishing hour, catch rates (expressed as kg/day and kg/soak hour/100 m2 gill-net area) together with a standard deviation of eight fishers under the fisher catch monitoring program of RIA2/MRC from 2009 to 2014.
Figure 5.
Annual variation of gill-net length used for fishing, fishing hour, catch rates (expressed as kg/day and kg/soak hour/100 m2 gill-net area) together with a standard deviation of eight fishers under the fisher catch monitoring program of RIA2/MRC from 2009 to 2014.

Figure 6.
Trend of officially recorded commercial catches (bar chart) and maximum annual water level (line) for over 20 years period in the Mekong Delta. Data from inland provinces only; water levels recorded at Chau Doc Station, Bassac River.
Figure 6.
Trend of officially recorded commercial catches (bar chart) and maximum annual water level (line) for over 20 years period in the Mekong Delta. Data from inland provinces only; water levels recorded at Chau Doc Station, Bassac River.

Figure 7.
Relationships between fish catches and peak annual water levels. Data are as in Figure 6. Each point represents one year in the period 1995–2016. Upper line and data are for the wet period 1995–2003; lower line and data are for the dry period 2004–2016.
Figure 7.
Relationships between fish catches and peak annual water levels. Data are as in Figure 6. Each point represents one year in the period 1995–2016. Upper line and data are for the wet period 1995–2003; lower line and data are for the dry period 2004–2016.

Figure 8.
Trends in annual fish yield, rice farming area and rice production over a 20-year period in the Mekong Delta of Vietnam. Data from inland provinces only.
Figure 8.
Trends in annual fish yield, rice farming area and rice production over a 20-year period in the Mekong Delta of Vietnam. Data from inland provinces only.


Table 1.
General profile of fishers.
| Category | Mainstem (n = 210) | Tributary (n = 720) | Coastal (n = 90) | Average (n = 1020) |
|---|---|---|---|---|
| Average household dependents | 4.3 | 4.5 | 4.3 | 4.5 |
| Average fishing experience (years) | 13.6 | 12.8 | 11.7 | 12.9 |
| Fishing gears used (%) | ||||
| 1 gear | 78.1 | 86.4 | 95.6 | 85.5 |
| 2 gears | 18.6 | 12.2 | 4.4 | 12.8 |
| 3 gears | 1.9 | 1.3 | – | 1.3 |
| 4 gears | 1.4 | 0.1 | – | 0.4 |
| Fishers’ occupation (%) | ||||
| Fishing only | 44.8 | 13 | 48.9 | 22.5 |
| Fishing + agriculture | 18.1 | 53.9 | 38 | 45.4 |
| Fishing + labouring | 31.4 | 29.6 | 3.3 | 27.6 |
| Fishing + trading | 4.3 | 2.3 | 8.7 | 3.2 |
| Fishing + aquaculture | 1.4 | 1.2 | 1.1 | 1.2 |
Table 2.
Trend in fish catches (% of interviewees).
| Category | Mainstem (n = 210) | Tributary (n = 720) | Coastal (n = 90) | Average (n = 1020) | ||||
|---|---|---|---|---|---|---|---|---|
| Biomass Caught | Length (Size) of Fish) | Biomass Caught | Length (Size) of Fish) | Biomass Caught | Length (Size) of Fish) | Biomass Caught | Length (Size) of Fish) | |
| Decrease | 92.9 | 77.6 | 88.9 | 67.4 | 96.7 | 47.8 | 90.4 | 67.7 |
| No change | 4.8 | 15.7 | 5.7 | 25.1 | 1.1 | 13.3 | 5.1 | 22.2 |
| Do not know | 2.4 | 6.7 | 3.5 | 6.3 | 2.2 | 37.8 | 3.1 | 9.1 |
| Increase | – | – | 1.9 | 1.3 | – | 1.1 | 1.4 | 1.0 |
Table 3.
Relationships between annual fish yield and other variables.
| Variables | Pearson Correlation (r) 1 | p-Value 2 |
|---|---|---|
| I. Annual water levels | ||
| Average | 0.71 | 0.000 |
| Maximum | 0.72 | 0.000 |
| Minimum | 0.85 | 0.000 |
| Standard deviation | 0.65 | 0.001 |
| II. Annual rice farming | ||
| Rice farming area | −0.78 | 0.000 |
| Rice production | −0.89 | 0.000 |
1: positive values indicate a positive relationship while negative values show a negative relationship; 2: p-value < 0.05 indicate significant differences between variables.
Publisher’s Note: MDPI stays neutral with regard to jurisdictional claims in published maps and institutional affiliations. |
© 2021 by the authors. Licensee MDPI, Basel, Switzerland. This article is an open access article distributed under the terms and conditions of the Creative Commons Attribution (CC BY) license (https://creativecommons.org/licenses/by/4.0/).
Share and Cite
MDPI and ACS Style
Vu, A.V.; Hortle, K.G.; Nguyen, D.N. Factors Driving Long Term Declines in Inland Fishery Yields in the Mekong Delta. Water 2021, 13, 1005. https://doi.org/10.3390/w13081005
AMA Style
Vu AV, Hortle KG, Nguyen DN. Factors Driving Long Term Declines in Inland Fishery Yields in the Mekong Delta. Water. 2021; 13(8):1005. https://doi.org/10.3390/w13081005
Chicago/Turabian StyleVu, An V., Kent G. Hortle, and Du N. Nguyen. 2021. "Factors Driving Long Term Declines in Inland Fishery Yields in the Mekong Delta" Water 13, no. 8: 1005. https://doi.org/10.3390/w13081005
Note that from the first issue of 2016, this journal uses article numbers instead of page numbers. See further details here.