Article

Hotspots of Legacy Phosphorus in Agricultural Landscapes: Revisiting Water-Extractable Phosphorus Pools in Soils

Department of Environmental Science and Technology, University of Maryland, College Park, MD 20547, USA
*
Author to whom correspondence should be addressed.
Water 2021, 13(8), 1006; https://doi.org/10.3390/w13081006
Submission received: 16 March 2021 / Revised: 3 April 2021 / Accepted: 4 April 2021 / Published: 7 April 2021
(This article belongs to the Section Water Quality and Contamination)

Abstract

:
Controlling phosphorus (P) losses from intensive agricultural areas to water bodies is an ongoing challenge. A critical component of mitigating P losses lies in accurately predicting dissolved P loss from soils, which often includes estimating the amount of soluble P extracted with a laboratory-based extraction, i.e., water-extractable P (WEP). A standard extraction method to determine the WEP pool in soils is critical to accurately quantify and assess the risk of P loss from soils to receiving waters. We hypothesized that narrower soil-to-water ratios (1:10 or 1:20) used in current methods underestimate the pool of WEP in high or legacy P soils due to the equilibrium constraints that limit the further release of P from the solid-to-solution phase. To investigate P release and develop a more exhaustive and robust method for measuring WEP, soils from eight legacy P fields (Mehlich 3–P of 502 to 1127 mg kg−1; total P of 692 to 2235 mg kg−1) were used for WEP extractions by varying soil-to-water ratios from 1:10 to 1:100 (weight:volume) and in eight sequential extractions (equivalent to 1:800 soil-to-water ratio). Extracts were analyzed for total (WEPt) and inorganic (WEPi) pools, and organic (WEPo) pool was calculated. As the ratios widened, mean WEPi increased from 23.7 mg kg−1 (at 1:10) to 58.5 mg kg−1 (at 1:100). Further, WEPi became the dominant form, encompassing 92.9% of WEPt at 1:100 in comparison to 79.0% of WEPt at 1:10. Four of the eight selected soils were extracted using a 1:100 ratio in eight sequential extractions to fully exhaust WEP, which removed a cumulative WEPt of 125 to 549 mg kg−1, equivalent to 276–416% increase from the first 1:100 extraction. Although WEP concentrations significantly declined after the first sequential extraction, WEP was not exhausted during the subsequent extractions, indicating a sizeable pool of soluble P in legacy P soils. We conclude that (i) legacy P soils are long-term sources of soluble P in agricultural landscapes and (ii) the use of a 1:100 soil-to-water ratio can improve quantification and risk assessment of WEP loss in legacy P soils.

Graphical Abstract

1. Introduction

Long-term application of manures and fertilizers in agricultural watersheds has resulted in the accumulation of phosphorus (P) in many soils beyond crop needs. This has created legacy P fields in agricultural landscapes, which pose a long-term risk of P loss and a threat to water quality [1,2,3,4]. Legacy P soils contribute P to water bodies through leaching and surface runoff. The high P concentration in receiving water bodies is one of the key drivers of eutrophication [5,6,7]. This is especially concerning in areas with high hydrologic connectivity from land to receiving waters, e.g., the lower Eastern Shore of Maryland, which is part of the Chesapeake Bay watershed (165,760 km2, ~19 million people). Many agricultural soils in this watershed have received historical inputs of manure and fertilizers beyond plant needs, resulting in legacy P soils [3,8,9]. While the definition of legacy P soils is broad, we define fields with Mehlich 3–P (M3–P) > 500 mg kg−1 as legacy P soils in this paper. Even with the adoption of best management practices (BMPs) and limitations on further P applications, soil P levels can remain above environmental thresholds for decades [10,11]. An accurate estimation of P pools (e.g., water-extractable, soil test, and recalcitrant forms) in legacy P soils is fundamental for assessing the long-term P loss risk to water bodies.
Tools used for risk assessment in fields saturated with P, such as the P site index (PSI) in the United States, are commonly based on soil P tests such as M3–P. In Maryland, fields with M3–P levels above approximately 150 mg kg−1 require the PSI to determine the P application rate [11,12]. In high P loss risk fields (M3–P: >500 mg kg−1), P applications are banned. Currently, Maryland has about 92,673 ha of agricultural land with M3–P >150 mg kg−1, including 6354 ha or 11% of total agricultural land in the Lower Eastern Shore with M3–P >500 mg kg−1 [13]. Despite M3–P being used as an indicator of plant-available P for management purposes, attempts to characterize the relationship between M3–P and P loss have produced ambiguous results. For instance, Sharpley [14] found a significant relationship between M3–P and dissolved P in surface flows but argued that this relationship is soil-specific and related to the soil P sorption saturation rather than traditional soil test P measures. Other researchers suggested that environmental soil tests, e.g., water-extractable P (WEP), were better at predicting P loss than M3–P in surface and subsurface flows [15,16,17].
In soils, WEP represents the pool of immediately available P to both plants and loss pathways. However, inconsistencies in WEP extraction methods and analyses are problematic for comparisons across the studies. Different soil-to-water ratios, extraction time, and analysis methods have been used in the scientific literature. For example, the most common method for extracting WEP in soils includes using a 1:10 or 1:20 soil-to-water ratio [18]. Other variants of the method include the Hedley fractionation scheme, where the first extractant used is water, typically at a 1:60 soil-to-water ratio [19,20,21]. A standardized protocol would facilitate comparisons among WEP measurements, which are required to set environmental thresholds at regional and national scales. Furthermore, protocols for WEP extraction were established long before the recognition of legacy P soils, and these soils may not have the capacity to adequately exhaust the WEP pool due to the equilibrium constraints at narrow soil-to-water ratios. These constraints were important for estimating readily available P in manures and biosolids, which resulted in developing a method to extract WEP using a 1:100 soil-to-water ratio [22,23,24]. The same attention must be given to legacy P soils to accurately assess the risk and develop BMPs to mitigate P loss from soils.
Conventional methods must effectively extract desired P pools or be modified if not. We hypothesized that the conventional WEP procedures aimed to extract P between 1:10 and 1:60 soil-to-water ratios do not adequately exhaust the WEP pool in soils and therefore may underestimate the P loss risk in legacy P soils. This is because legacy P soils have a large reservoir of soluble P, which on extraction at narrower ratios reach an equilibrium between soil solution and the solid phase. This equilibrium prevents any further release of P from the solid to solution pool, resulting in underestimating the WEP pool. In fields saturated with P, the equilibrium is controlled by the soil-solution P pool, which after plant uptake, runoff and leaching losses are replenished from the soil-solids pool. Whereas in low P soils, narrow extraction ratios work well due to the lower amount of soluble P, which is sufficiently extracted. In fact, the use of higher extraction ratios in low P soils can result in concentrations in soil-solution below method detection limits.
This paper investigates the relationship of soil-to-water ratios and the WEP pool across a wide range of extraction ratios to determine whether standard procedures are acceptable for legacy P soils. We then propose a modification to standard protocols to extract most of the WEP from legacy P soils. Specifically, the research objectives were to (i) investigate the impact of varying the soil-to-solution extraction ratios on the total, inorganic, and organic WEP pools and (ii) examine the use of wider extraction ratios through sequential extractions to completely exhaust the WEP pool in the legacy P soils.

2. Materials and Methods

2.1. Site Characteristics

In consultation with the University of Maryland Extension Agents, we identified eight agricultural fields with soil test P (M3–P) values above 500 mg kg−1 for field sampling. These fields are located in the Eastern Shore of Maryland in Caroline (one field), Dorchester (five fields), and Somerset (two fields) counties. A detailed description of field sites and soil properties is included in Table 1. In brief, the soil texture across the eight fields ranged from loamy sand to silt loam, pH from 6.14 to 7.25, organic matter from 0.6 to 2.9%, sand from 51.3 to 86.1%, silt from 11.4 to 40.6%, and clay from 2.5 to 10.4%. Total P in the eight fields varied from 692 to 2235 mg kg−1 and M3–P ranged from 502 to 1127 mg kg−1 (Table 1). The information about soil classification according to the United States Department of Agriculture-Natural Resources Conservation Service (USDA-NRCS) and corresponding World Reference Base (WRB) is included in Table 1. All fields are under long-term crop production, with four fields under commodity crops, i.e., corn–soybean rotation (sites 3, 4, 5, and 6) and four fields under vegetable production (sites 1, 2, 7, and 8). Although a detailed history of manure and fertilizer application for field sites was not available because of changes in land ownership over the years, these fields have received a combination of poultry manure and fertilizer P. As such, these fields are currently under the State of Maryland regulations that restrict any P applications to fields exceeding the environmental soil P (M3–P) threshold value of 500 mg kg−1.

2.2. Soil Collection

For soil sample collection, a uniform transact (middle of the fields) consisting of an area of 4 × 7 m was identified in each field, from where 10 samples were randomly collected with a soil corer at 0–5 cm depth, and then a composite soil sample was taken from each field in October 2019. This depth was chosen because the surface layer is most prone to surface runoff P loss in legacy P soils [25,26]. Samples were air-dried at 35 °C, ground to pass through a 2 mm sieve, and stored in sealed containers at room temperature until analyses.

2.3. Sample Extractions

The WEP extractions were conducted, in duplicates, with varying soil-to-water (deionized water, DI) ratios. The current method of WEP extraction includes using DI water to ensure similar water composition across various studies and regions. For the first experiment, 2.50, 1.25, 0.50, and 0.25 g of each soil was weighed and placed in 50 mL centrifuge tubes, and then 25 mL of DI water was added to create soil-to-water extraction ratios of 1:10, 1:20, 1:50, and 1:100 (w:v). We varied the amount of soil instead of water to ensure consistent headspace in centrifuge tubes during the extraction procedure. For the second experiment, soil samples from four sites (2, 4, 6, and 7) were randomly selected and extracted in eight sequential extractions using soil-to-water ratios of 1:100 (0.25 g soil: 25 mL DI). Each sequential extraction consisted of filtering the supernatant and adding 25 mL of DI water to the same 0.25 g of soil. A total of eight sequential extractions were repeated to obtain a cumulative soil-to-water ratio of 1:800. After each addition of DI water, all centrifuge tubes were shaken on an end-over-end shaker for 1-h, centrifuged at 5000 rpm for 5 min, and filtered through a 0.45 µm glass filter paper (Pall Corporation, Ann Arbor, MI, USA) before analysis.

2.4. Sample Analysis

The filtered aliquots from both experiments were analyzed for inorganic WEP (WEPi) on a Lachat QuikChem 8500 Automated Ion Analyzer (Hach, Loveland, CO, USA) using the phosphomolybdate blue method of Murphy and Riley [27]. Although the phosphomolybdate method can hydrolyze a small fraction of labile organic P, this method is typically used to determine inorganic P in water samples. Total WEP (WEPt) in the filtered aliquots was analyzed on an ICAP 7600 Duo View inductively coupled plasma–optical emission spectrometer (ICP–OES) (Thermo Fisher Scientific, Waltham, MA, USA), which converts organic P to inorganic P. Thus, the difference between WEPt and WEPi was determined as organic WEP (WEPo).
Soil particle analysis to determine the percentage of sand, silt, and clay was conducted using a modified pipette method [28]. Mehlich 3–P in soils was determined using the method reported by Wolf and Beegle [29], followed by analysis on ICP–OES. Total P (TP) in soils was determined by the EPA 3050B method [30].

2.5. Statistical Analysis

Statistical analysis was performed using the software R (version 4.0.3). Analysis of variance (ANOVA) was used to assess the effect of extraction ratios on the WEP in the first experiment. The experimental design was a randomized complete block design with replicates. Soil was considered a blocking factor (i = 8 soils), and extraction ratios (j = 4; 1:10, 1:20, 1:50, 1:100) the treatment of interest. The duplicated combinations of soil and extraction ratios constituted a sample size (n) of 64. The interaction term between block and treatment was examined as well as the assumptions of normality, constant variance, and independence of the residuals. Whenever violations of the ANOVA assumptions were identified, a Box-Cox transformation was performed, and a new ANOVA was conducted using the transformed data. Once a significant effect of extraction ratios was identified, Tukey’s range test, a multiple comparison test (p = 0.05), was conducted. For the second experiment, one-way ANOVA was used to analyze the effect of the eight sequential extractions on WEP (i = 8 factor levels; n = 8 samples per factor level). Multiple comparisons (Tukey’s range test; p = 0.05) were also conducted as a post hoc analysis.

3. Results and Discussion

3.1. Water-Extractable Phosphorus across Extraction Ratios

The amount of WEPi extracted per unit of soil depended on the soil-to-water ratio, where increasing the ratio significantly (p < 0.05) extracted more WEPi in legacy P soils, averaging from 23.7 mg kg−1 (at 1:10) to 58.5 mg kg−1 (at 1:100) (Figure 1, Table A1). As the ratio widened from 1:10 to 1:100, WEPi became more dominant, from 78.6 to 92.9% of WEPt. The overall increase in WEPi is attributed to a large WEP pool in the legacy P soils. We suggest that an equilibrium between the solid-phase P and soil-solution P was reached at narrower soil-to-water ratios (1:10 to 1:20), which prevented a further release of WEPi from the solid phase. However, as the ratios widened, a shift in the P equilibrium from the solid phase to soil solution resulted in greater release and thus extraction of WEPi. This implies that soils saturated with legacy inputs of P have a large reservoir of WEP and greater potential for P loss than would be predicted with a standard 1:10 extraction.
Although few published studies exist for comparison, Furhman et al. [31] observed an increase of 12.2 mg kg−1 in WEPi from 1:10 to 1:50, compared to the increase of 21.8 mg kg−1 from 1:10 to 1:50 in our study. It is established that soil P release increases as soil-to-water ratios widen [32]; however, the increases in WEPi are not always significant at higher ratios (>1:50). Therefore, these legacy soils warrant the use of wider ratios, while WEP in low P soils may be adequately quantified with standard methods using narrower soil-to-water ratios. The variability in absolute and relative amounts of WEP at different ratios limits simplified conversions used in the literature to convert WEP between extraction ratios. For example, Sharpley et al. [21] converted WEP values from 1:10 to 1:25 by using a factor of 2.5, which our data suggest would lead to overestimation of the WEP concentrations.
Mean WEPo showed an initial nonsignificant increase from 6.3 mg kg−1 (at 1:10) to 7.5 mg kg−1 (at 1:20), followed by a nonsignificant decrease to 5.7 mg kg−1 (at 1:50) and 4.6 mg kg−1 (at 1:100) (Figure 1). Of WEPt, WEPo was 21.4% at 1:10, 17.8% at 1:20, 10.8% at 1:50, and decreased to 7.1% at 1:100 ratio. The ratio at which the WEPo pool declined was different for individual sites. For example, sites 1 and 8 with the lowest soil TP (691–749 mg kg−1) showed WEPo decline at 1:20, five sites (3, 4, 5, 6, and 7) in the middle range of TP (832–1461 mg kg−1) showed WEPo decline at 1:50, and site 2 with the highest TP (2235 mg kg−1) showed no WEPo decline until 1:100 (Table A1). We hypothesize that the decrease in WEPo at higher extraction ratios could be due to the greater preferential sorption of WEPo on the newly vacated sites on the soil surface where WEPi was initially present [33]. If wider soil-to-water ratios increase the potential for WEPi loss, then we should expect these soils, when saturated during large storm events over time, to release greater WEPi into transport pathways. This is problematic as WEPi is the most readily available P pool to the primary producers inflicting eutrophication. This indicates a need for analysis methods to quantify WEP pools when assessing the risk of dissolved P in runoff. Since the decline in WEPo was observed at different extraction ratios related to the TP of soils, we argue that the decreasing amount of WEPo is largely attributed to the preferential sorption of WEPo. For example, in soils with the lower TP, an equilibrium between the soil solution and solid-phase WEPi was reached at lower extraction ratios. This equilibrium resulted in vacant P fixing sites where WEPi was once weakly sorbed and allowed a part of the WEPo present in the soil solution to sorb back onto the solid phase. Therefore, analysis methods such as colorimetry, commonly coupled with extraction methods, disregard the WEPo pool and are more problematic at lower soil-to-water ratios.
The overall significant increase in mean WEPt as the soil-to-water ratio widened from 1:10 (30.04 mg kg−1) to 1:100 (63.16 mg kg−1) suggests that these legacy P soils contain a large amount of WEP and thus raises concern for using low extraction ratios as this could lead to underestimating the risk of WEP, especially those with high hydrological connectivity. The difference in mean WEPt values between the 1:50 and 1:100 soil-to-water ratios was statistically significant (Figure 1). WEPt in individual sites increased between 5 and 44% at the 1:100 ratio, warranting the adoption of the 1:100 ratio over the 1:50 ratio. It is possible that even more WEPt could be extracted using wider ratios beyond 1:100. While the wider ratios beyond 1:100 were not included in the first experiment due to equipment limitations, the second experiment was performed to address this possibility.

3.2. Water-Extractable Phosphorus as a Proportion of Mehlich 3–Phosphorus and Total Phosphorus

Mehlich 3–P in eight soils ranged from 502 to 1127 mg kg−1 (Table 1). The proportion of WEP as M3–P was examined at each of the four extraction ratios (Figure 2A, Table A2). As the extraction ratios widened, the mean % WEPi of M3–P increased from 3.3 to 8.2%, whereas the mean % WEPo of M3–P remained constant at around 1% (range: 0.63–1.03%). The overall trend in % WEPt of M3–P showed a consistent significant increase of 1.6% by doubling the solution per unit of soil (Figure 2A). This steady increase further exemplifies the constraints on soluble P release at low soil-to-water ratios. A study of WEP as a percentage of M3–P at the 1:10 ratio reported a 16% extraction in untreated soils and a 3% extraction in heavy manure-treated soils [34]. This suggests that the legacy P soils analyzed in the present study possess WEP pools more characteristic of manure-amended than untreated soils. Further, the low percentage of M3–P extracted as WEP may complicate the predictiveness and use of M3–P to determine P loss risk from legacy soils. We suggest that the extractions at wider ratios and a fractionation scheme to separate P pools of various lability would provide more insights into the interconnectedness of P pools in legacy P soils.
Interestingly, the high variability in extracted WEP values (mg kg−1) among sites dissipated when taken as a percent of total P (Figure 2B). For example, in eight individual sites, even though WEPt at the 1:10 extraction ratio ranged from 18.4 to 54.0 mg kg−1, % WEPt of TP only varied from 1.8 to 2.9% (Table A3). Mean % WEPi of TP also exhibited low variability throughout the extraction ratios and steadily increased from 1.9 to 4.6%, while % WEPo of TP ranged from 0.35 to 0.57%. These results are significant for three reasons: (i) the consistent WEP pools as a percent of TP across eight sites at each extraction ratio, given the wide range in WEP (mg kg−1), indicates an equilibrium-induced barrier to further exhausting the WEP pool at low ratios; (ii) the low values of % WEPt of TP (<6%) extracted by these ratios raise concerns about using WEP in legacy P soils to estimate the long-term P loss potential; and (iii) if an equilibrium is reached before exhausting the WEP pool at the conventionally narrower extraction ratios, as our results alluded, this limitation on further P release from the WEP pool does not allow an adequate comparison with other low P or nonlegacy P soils.

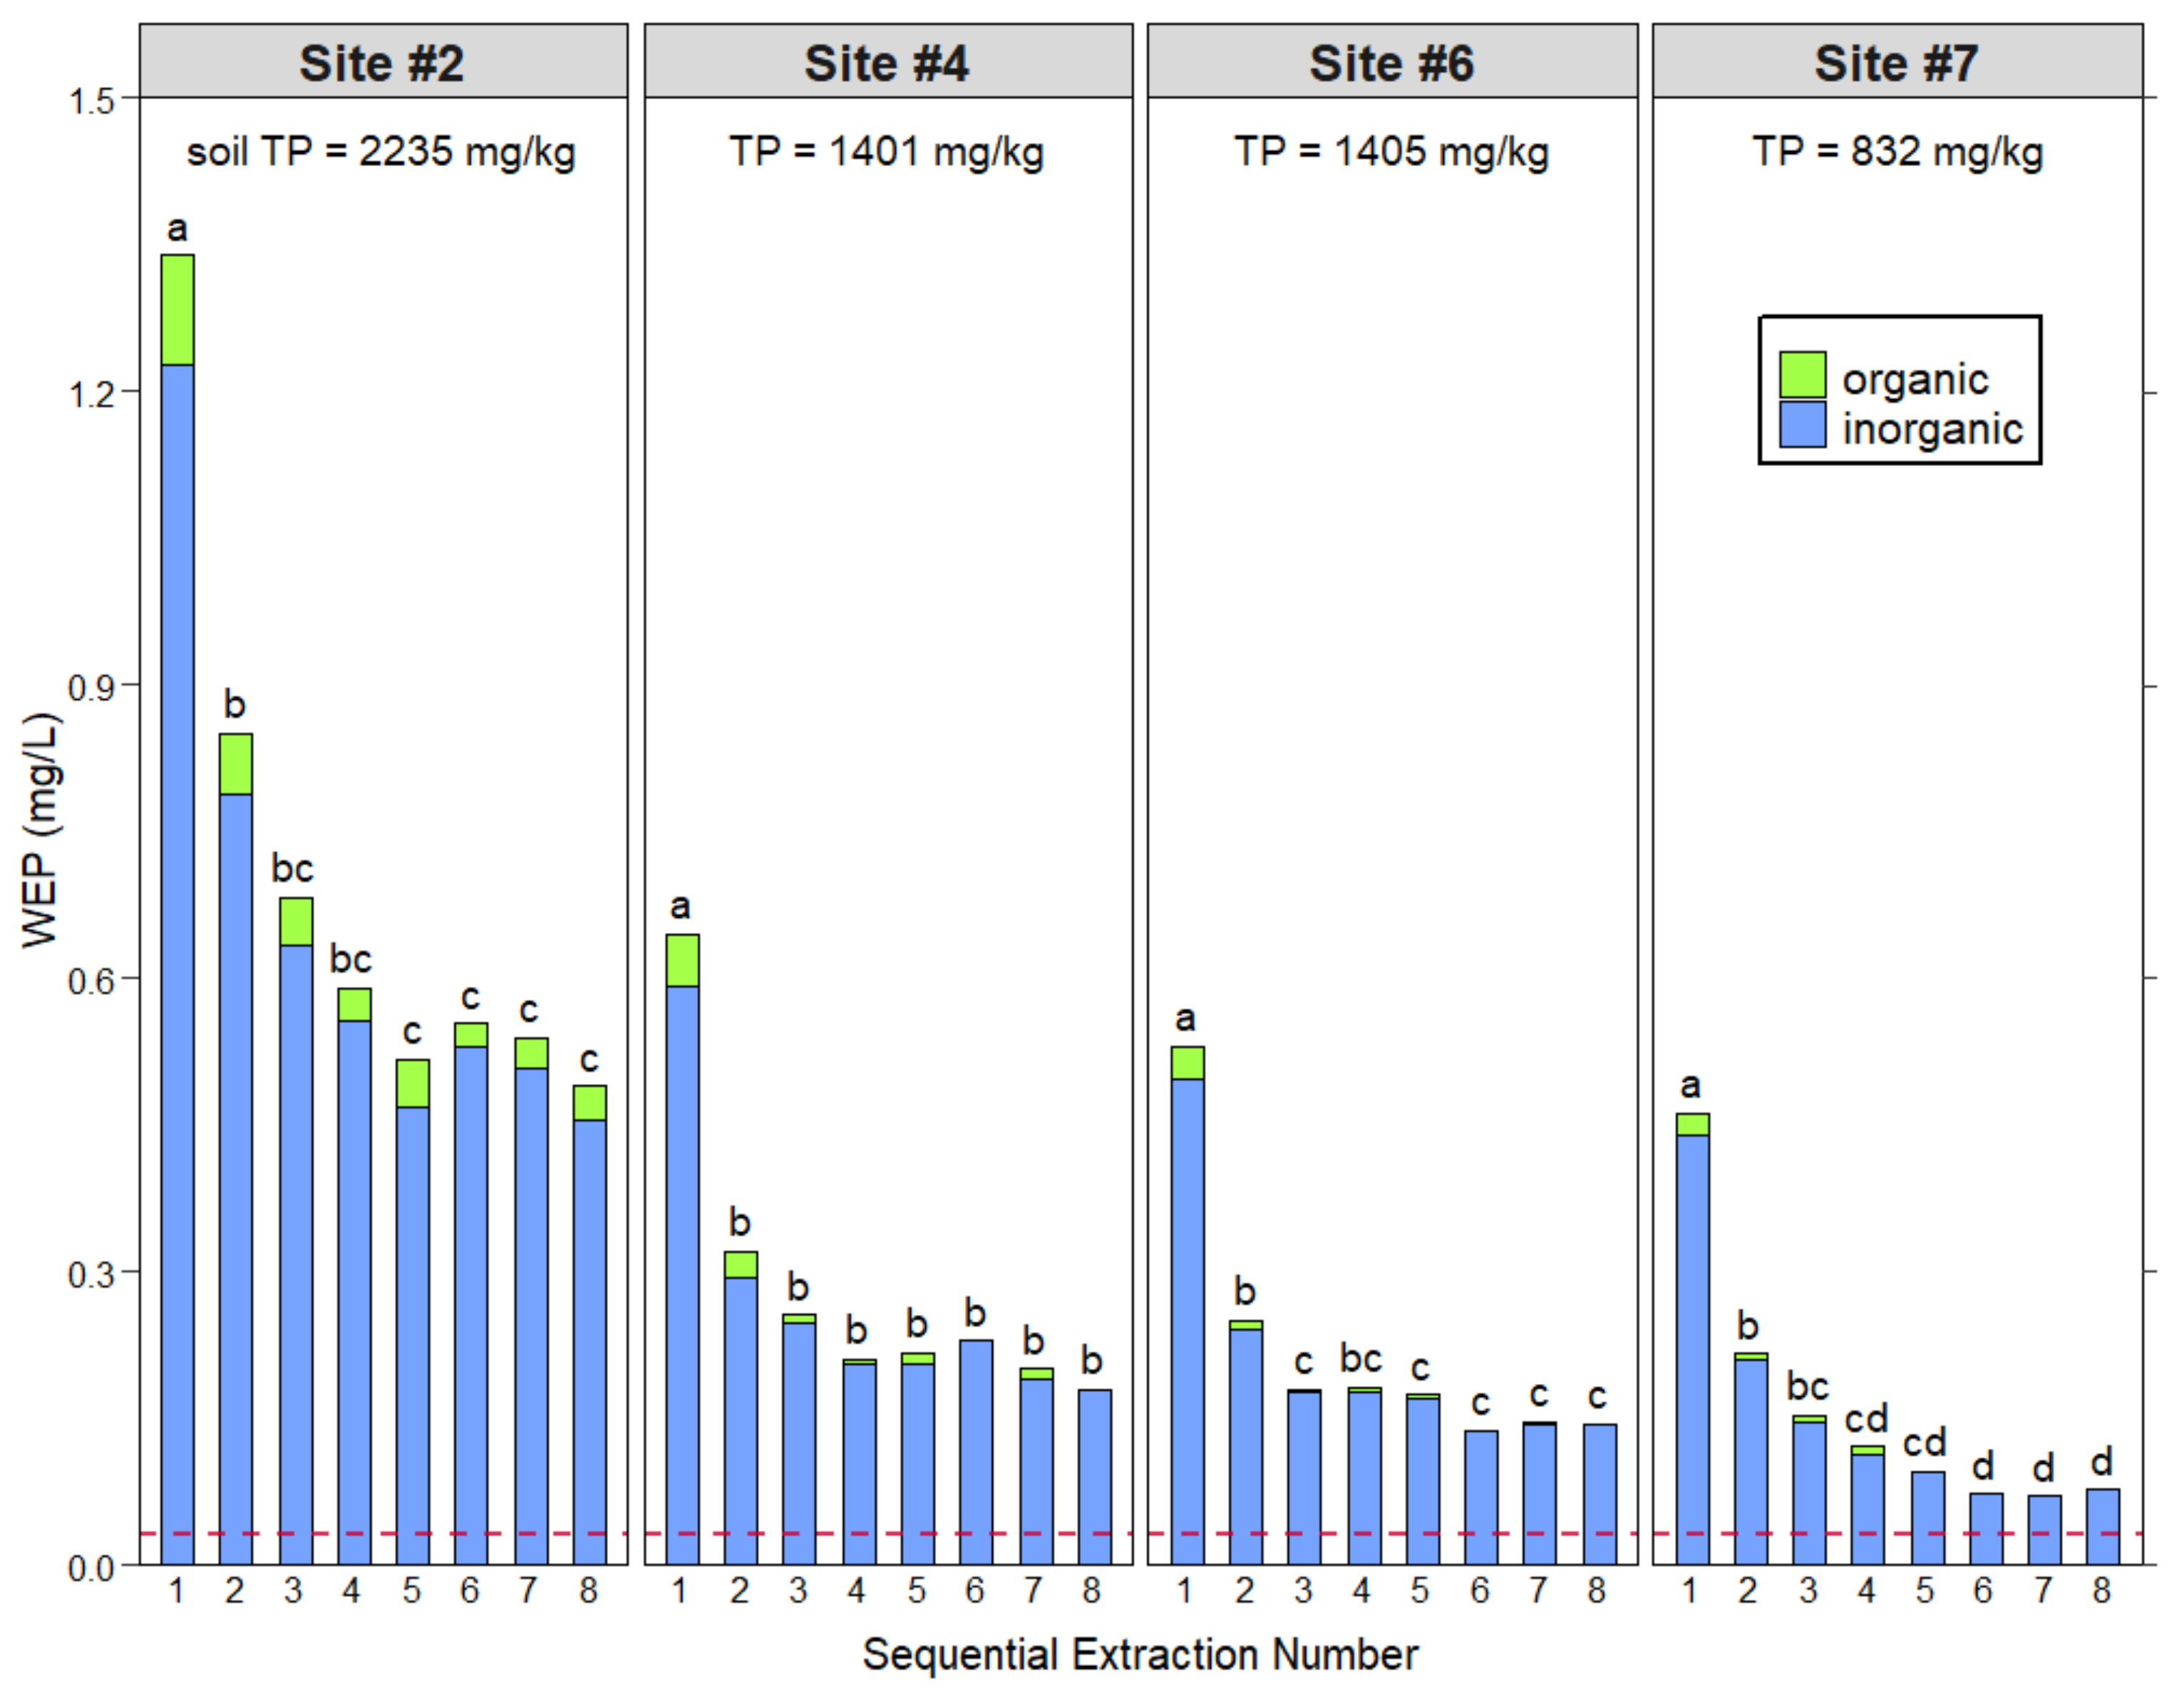
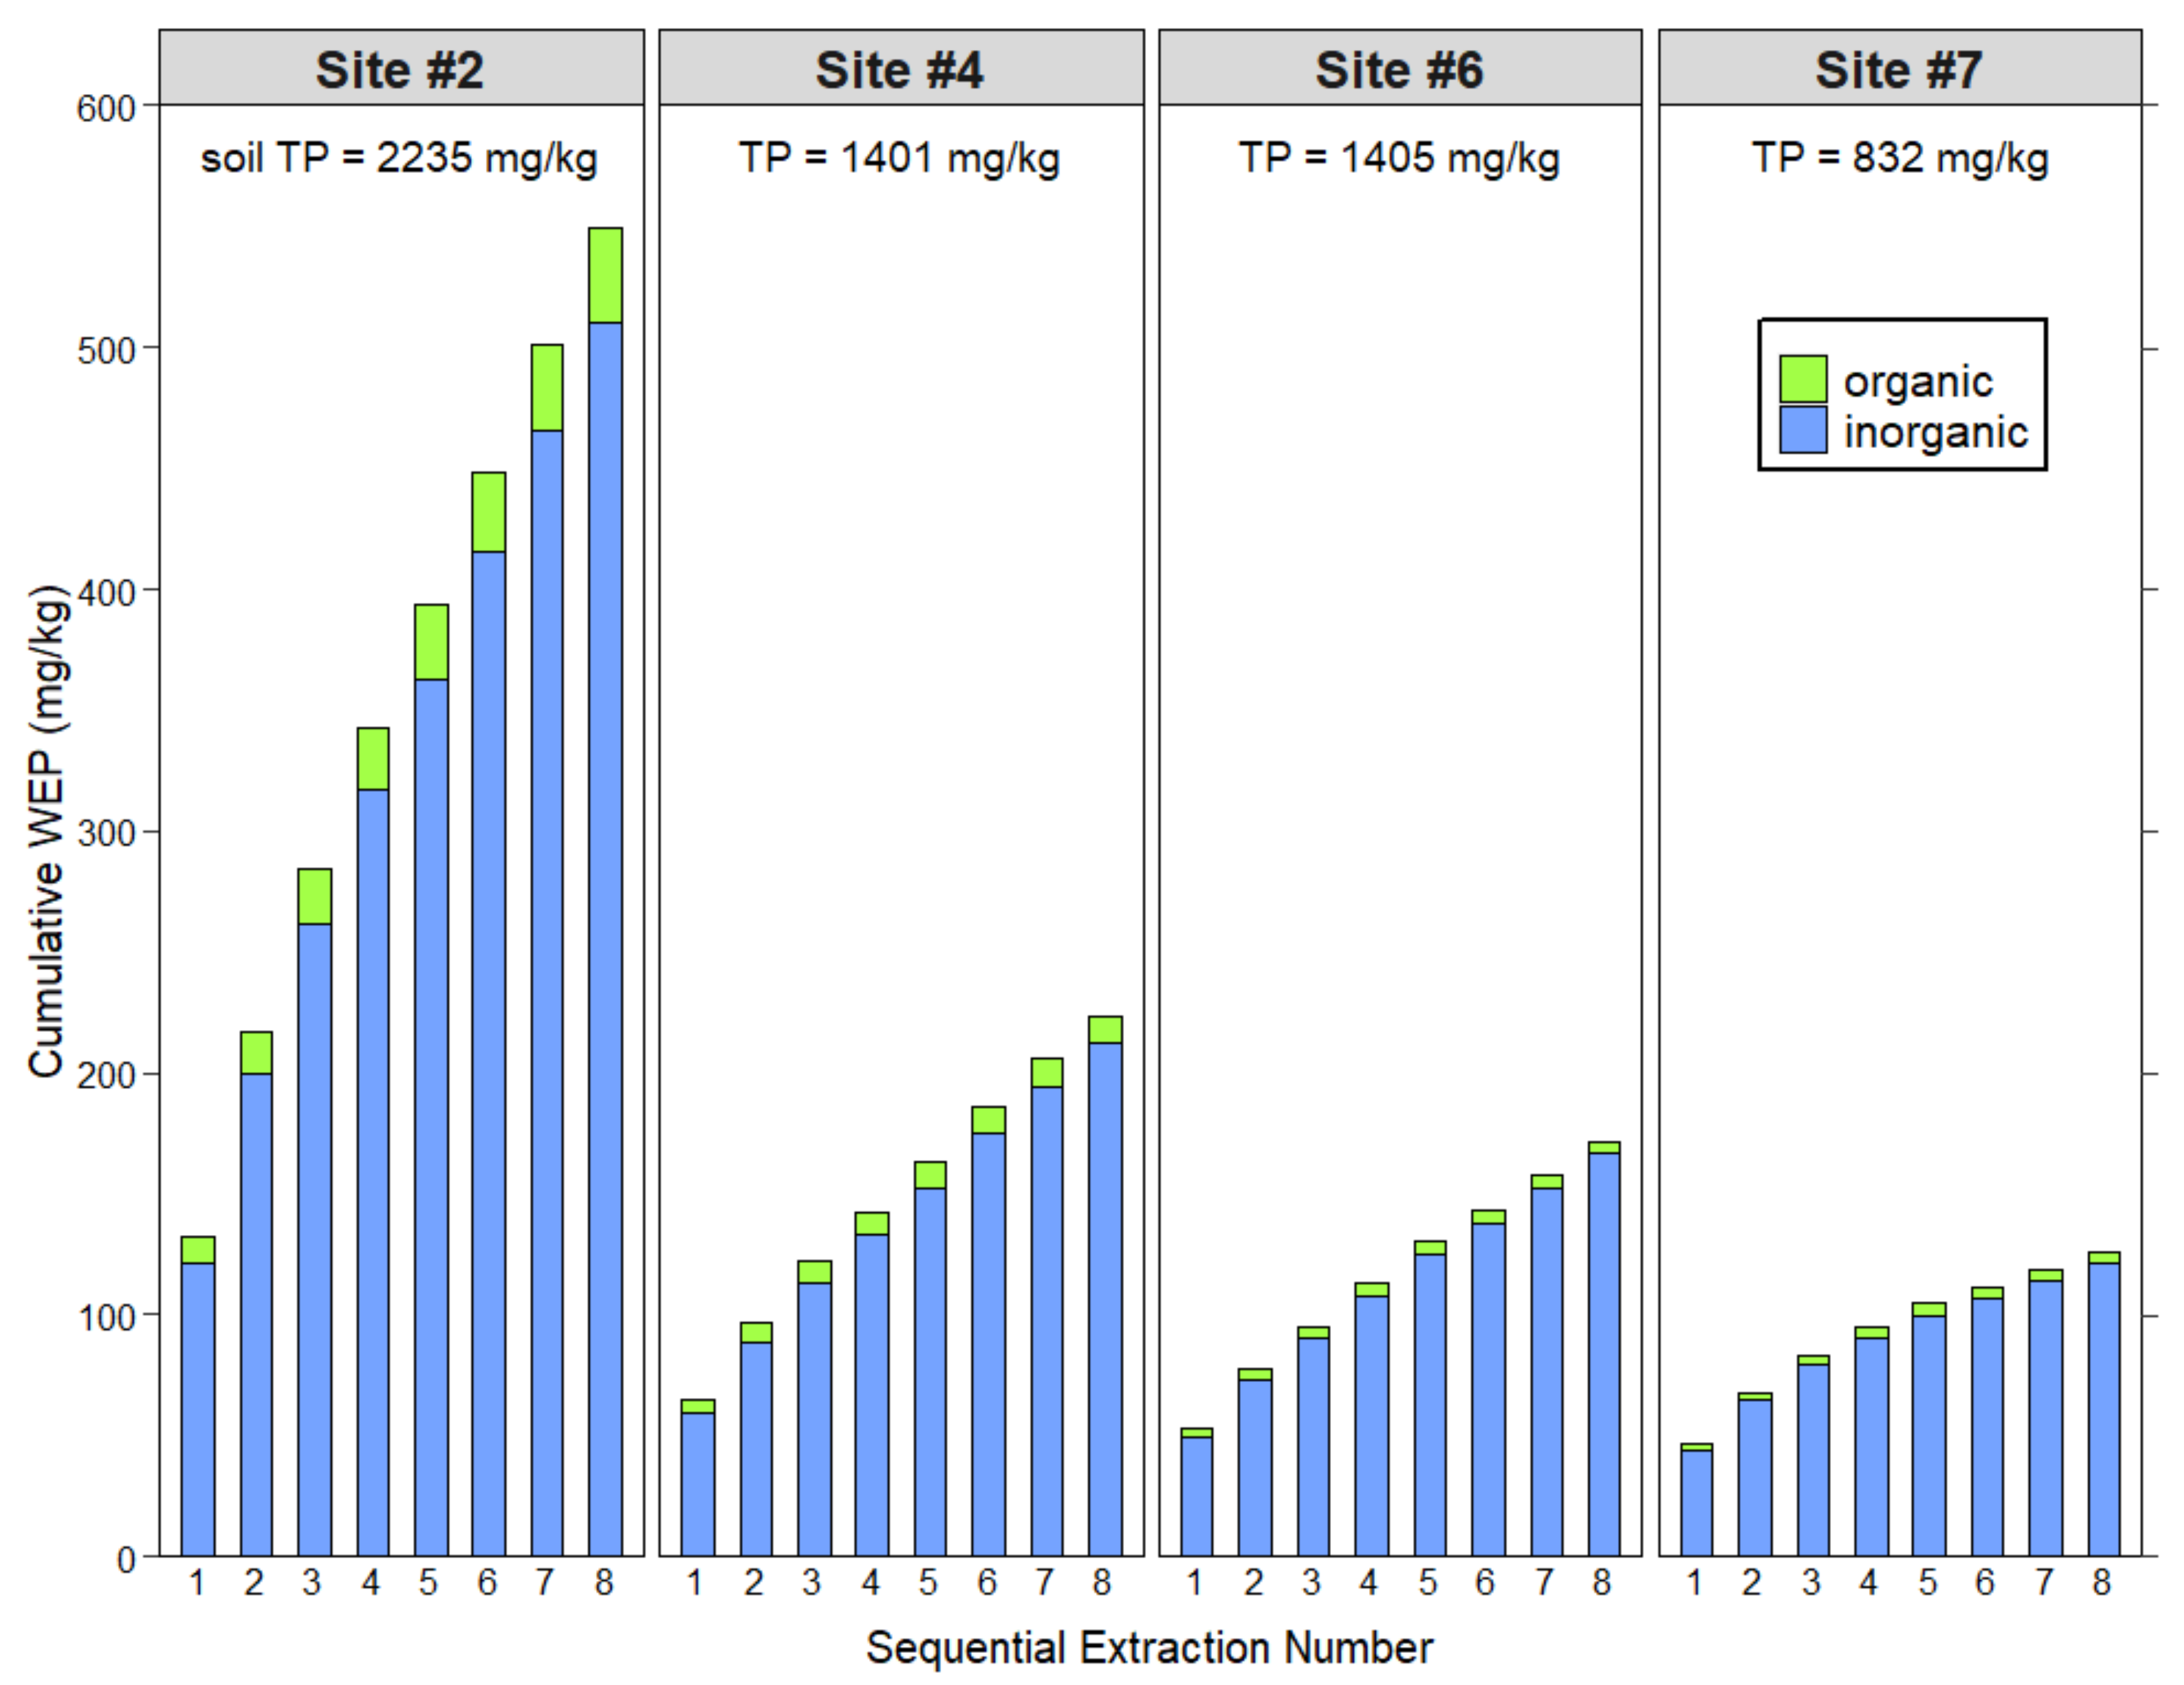
3.3. Sequential Water Extractions to Exhaust Water-Extractable Phosphorus

The increase in WEP as the extraction ratios widened prompted an investigation to determine if the WEP pool can be fully exhausted and quantified using wider extraction ratios. As such, four sites (2, 4, 6, and 7) with TP of 832–2235 mg kg−1 and M3–P of 602–1127 mg kg−1 (Table 1) were randomly selected for further investigation, beginning with a 1:100 ratio and conducting eight sequential extractions to achieve a final 1:800 soil-to-water ratio.
Concentrations of WEP in the four sites during the eight sequential extractions were highest in the first extraction and began declining before stabilizing (Figure 3). As detectable WEP was present after each of the eight sequential extractions, these extractions did not fully exhaust the WEP pool. In the later extractions (2nd onwards), WEP reached a nonzero equilibrium, i.e., nonsignificant decrease. A Tukey test for significant differences was conducted to determine at which extraction ratio this equilibrium was reached. For sites 2 and 4 with TP of 2235 and 1401 mg kg−1, an average WEP of 0.56 ± 0.09 and 0.23 ± 0.06 mg L−1 was continuously extracted after the second (equivalent to 1:200 for site 2) and first (equivalent to 1:100 for site 4) ratios. Site 6 has a similar TP (to site 4) of 1405 mg kg−1 but reached a lower equilibrium value of 0.16 ± 0.02 mg L−1 at the third extraction (equivalent to 1:300 ratio). Site 7, which contained the least TP of 832 mg kg−1, extracted an average of 0.09 ± 0.02 mg L−1 at the fourth extraction (equivalent to 1:400 ratio). In all sites, WEP extracted in the first extraction was significantly higher than subsequent extractions (2nd to 8th). These results build off the previous experiment to show that a 1:100 ratio is a sufficiently wide WEP extraction ratio to extract most of the WEP in legacy P soils since widening the ratio even further would result in nonsignificant WEP increases.
The cumulative WEPt (at 1:800) ranged from 125 to 549 mg kg−1 across the four sites, with an increase of 276 to 416% from the first sequential 1:100 extraction (Figure A1). The WEPo decreased after the first 1:100 extraction for most sites. A few later extractions had negative values of WEPo (Table A4 and Table A5); thus, the cumulative WEPi at the 1:800 ratio was 93 to >100% of WEPt. The decline and disappearance of WEPo during the later sequential extractions support our previous assertion of sorption to vacated P sites. A study on manure-treated noncalcareous soils (0–5 cm layer) in the Netherlands found that organic P in the form of orthophosphate monoesters was preferentially bound to Al and Fe oxides over orthophosphate [35]. Therefore, if sorption is the underlying mechanism, undetectable WEPo throughout the 1:800 ratio would indicate low lability of the resorbed organic P. A study in Texas using a modified Hedley fractionation scheme found a decrease in labile organic P extracted with water and sodium bicarbonate and a 217% increase in HCl extractable organic P forms in legacy P soils compared with unamended soils [36]. Although conducted on calcareous soils and may only apply to our site 2, this suggests that repeated additions of manure and other organic amendments which resulted in legacy P reserves in soil increase the more recalcitrant organic P pools, causing a shift in equilibrium between pools that leads to more inorganic labile P. Regardless of the mechanism, our results suggest that water extractions could not accurately quantify WEPo in legacy P soils, further mystifying its extent and fate in P loss.
The equilibrium WEPt concentrations in the last (8th) sequential extraction were 0.49, 0.18, 0.14, and 0.08 mg L−1 for sites 2, 4, 6, and 7, respectively (Figure 3, Table A4). These values represent the soil-solution pool that is still present after an equilibrium shift has occurred despite significant WEP depletion during the previous seven sequential extractions. These WEP concentrations (0.08 to 0.49 mg L−1) were 2 to 15 times higher than the US EPA recommended limit of 0.03125 mg L−1 total P for Eastern Coastal Plains (Ecoregion XIV) streams and rivers [37]. This suggests that these fields will remain the sources of WEP in the landscape even after depletion and will continue to release and contribute P to waterways. For example, considering average soil bulk densities between 1.3 and 1.5 g kg−1 (taken from the USGS web soil survey) in these soils and an average rainfall of ~1100 mm in our study region, the upper surface soil layer could experience yearly soil-to-water ratio equivalents to 1:20. Therefore, after 40 years of curbed P input in these legacy P soils, soils could be depleted to the degree the sequential extractions achieved (1:800 ratio) and still be detrimental to losing dissolved P to waterways. Thus, in legacy P fields, approaches to transform the chemical nature of labile P in soils to recalcitrant forms using amendments containing Fe and Al can be effective to reduce WEP in soils, reduce P losses, and meet load reductions in the water bodies.

3.4. Impact of Phosphorus Saturation on the Magnitude of Water-Extractable Phosphorus

Knowledge of the P saturation in soils can be used to understand the magnitude of the WEP pool and the risk of P loss in legacy P soils. The threshold P saturation ratio based on the M3 extract (i.e., M3–PSR) has been used to evaluate P risk in many studies across the eastern United States [38,39,40]. The relationship of M3–PSR with WEP exhibits a changepoint or a value above which WEP begins to desorb into the solution at an expedited rate [41]. These changepoints are thought to be the cusp of environmentally stable levels of M3–PSR and WEP in soils, and thus these relationships are usually evaluated when making management decisions. Common M3–PSR values reported in literature range between 0.0 and 0.5, with corresponding WEP from ~0 to 25 mg kg−1 at 1:10 soil-to-water extraction ratio [40,41]. Their associated M3–PSR changepoints range between 0.10 to 0.15. Our legacy P soils had M3–PSR beyond these reported values and ranged between 0.42 and 0.81 (excluding site 2 with 7.25 pH and the highest amount of M3–Ca of 2662 mg kg−1). Corresponding mean WEPt values were 26.6 ± 6.36 mg kg−1 (range: 18.4–34.4 mg kg−1) at 1:10, which increased to 35.7 ± 6.63 mg kg−1 (range: 24.3–43.6 mg kg−1) at 1:20, 45.3 ± 9.23 mg kg−1 (range: 33.7–56.6 mg kg−1) at 1:50, and 53.3 ± 12.60 mg kg−1 (range: 36.5–68.0 mg kg−1) at 1:100 soil-to-water extraction ratios (Figure 1, Table A1). In other words, WEPt values could be upwards of two times as much (26.6 to 53.3 mg kg−1) as reported in previous studies, depending on the extraction ratio used. Further, in our legacy P soils, M3–PSR values were between 4 and 8 times greater than the established environmental changepoints. These results suggest a need to reevaluate the relationship between M3–PSR and WEP (at various extraction ratios) for legacy P soils.

4. Conclusions

We investigated the extent of WEP pools in legacy P soils (M3–P > 500 mg kg−1) by employing various soil-to-water ratios. Our analysis was focused on the WEP pool as this is the soluble P pool that is susceptible to loss in soils saturated with historical applications of manures and fertilizers. Due to the large percentages of labile P in soils (i.e., WEP), our results suggest using a wider extraction ratio of 1:100 to adequately quantify most of the WEP pool in soils with M3–P above 500 mg kg−1. This ratio (1:100) is already recommended to determine WEP in high P sources such as manure and biosolids; therefore, it would not be an excessive burden to research and state soil-testing laboratories. Furthermore, using a ratio of 1:100 would eliminate the significant discrepancies between using colorimetry (WEPi measurement) and spectroscopy (WEPt measurement) to determine WEP. As the sequential extractions equivalent to 1:800 soil-water-ratios could not fully exhaust the WEP pool, a modified Hedley fractionation scheme could be used to investigate other less labile and recalcitrant P pools in legacy P soils. This could be coupled with advanced synchrotron techniques to understand the composition of solid-phase P minerals that control P equilibria in legacy P soils. By altering the extraction method in legacy P soils, we are equipped to better assess the risk of P loss and implement effective strategies to reduce P loss to waterways. Future research is suggested in runoff and leachate simulations and field monitoring, aiming to relate the WEPt estimated through the proposed methodology and observed P loss through surface and subsurface transport pathways.

Author Contributions

Conceptualization, T.R., E.L., Y.-Y.Y., G.S.T.; methodology, T.R., E.L., G.S.T.; software, T.R., Y.-Y.Y., C.B., I.S.P.C.S.; validation, T.R., C.B., I.S.P.C.S.; formal analysis, T.R.; investigation, T.R.; resources, G.S.T.; data curation, T.R.; writing—original draft preparation, T.R.; writing—review and editing, T.R., G.S.T.; visualization, T.R., C.B.; supervision, G.S.T.; project administration, G.S.T.; funding acquisition, G.S.T. All authors have read and agreed to the published version of the manuscript.

Funding

Gurpal S. Toor received partial funding from USDA Hatch project 1014496 and USDA-NIFA AFRI competitive grant 2018-09093.

Institutional Review Board Statement

Not applicable.

Informed Consent Statement

Not applicable.

Data Availability Statement

All data that support the findings of this study are included within the article and Appendix A.

Acknowledgments

We thank the participating farmers and the University of Maryland Extension Agents for their willingness to assist with sample collection. Special thanks to Stanley Schlosnagle, Agricultural Technician Supervisor in Toor lab at the University of Maryland, and personnel at the Pennsylvania State University Soil Testing Lab, for conducting various analyses.

Conflicts of Interest

The authors declare no conflict of interest.

Appendix A

Table A1. Inorganic (WEPi), organic (WEPo), and total (WEPt) water-extractable P in eight field sites.
Extraction
Ratio
Site 1 1Site 2Site 3Site 4Site 5Site 6Site 7Site 8
––––––––––––––––––––––––mg kg−1–––––––––––––––––––––––––––
WEPt1:1018.454.034.434.725.429.123.021.4
1:2024.370.443.640.838.238.932.631.3
1:5033.791.756.652.151.150.035.338.4
1:10041.7132.268.063.066.152.745.336.5
WEPi1:1014.844.726.827.219.822.117.616.8
1:2022.956.535.533.429.930.124.228.2
1:5028.476.552.147.947.244.231.934.9
1:10038.5121.162.957.861.549.243.134.2
WEPo1:103.59.27.67.55.67.05.34.6
1:201.413.98.27.48.38.88.53.1
1:505.315.24.44.33.95.83.43.5
1:1003.211.05.05.24.53.52.22.4
1 Sites 1, 2, 7, and 8 are under long-term vegetable production. Sites 3, 4, 5, and 6 are under long-term commodity crops (corn–soybean rotation, with and without cover crops) production.
Table A2. Inorganic (WEPi), organic (WEPo), and total (WEPt) water-extractable P as a percent of Mehlich 3–P in eight field sites.
Extraction RatioSite 1 1Site 2Site 3Site 4Site 5Site 6Site 7Site 8
––––––––––––––––––––––––% of Mehlich 3–P––––––––––––––
WEPt:M3–P1:103.44.84.35.05.13.73.83.4
1:204.66.25.45.97.65.05.45.0
1:506.38.17.07.510.26.45.96.2
1:1007.811.78.49.113.26.77.55.9
WEPi:M3–P1:102.84.03.33.94.02.82.92.7
1:204.35.04.44.86.03.84.04.6
1:505.36.86.56.99.45.65.35.6
1:1007.210.77.88.312.36.37.25.5
WEPo:M3–P1:100.70.80.91.11.10.90.90.7
1:200.31.21.01.11.61.11.40.5
1:501.01.30.60.60.80.70.60.6
1:1000.61.00.60.80.90.40.40.4
1 Sites 1, 2, 7, and 8 are under long-term vegetable production. Sites 3, 4, 5, and 6 are under long-term commodity crops (corn–soybean rotation, with and without cover crops) production.
Table A3. Inorganic (WEPi), organic (WEPo), and total (WEPt) water-extractable P as a percent of total P in eight field sites.
Extraction
Ratio
Site 1 1Site 2Site 3Site 4Site 5Site 6Site 7Site 8
–––––––––––––––––––––% of total P––––––––––––––––––––––
WEPt:TP1:102.72.42.42.51.82.12.82.9
1:203.53.23.02.92.62.83.94.2
1:504.94.13.93.73.53.64.25.1
1:1006.05.94.74.54.63.75.44.9
WEPi:TP1:102.12.01.81.91.41.62.12.2
1:203.32.52.42.42.12.12.93.8
1:504.13.43.63.43.33.13.84.7
1:1005.65.44.34.14.33.55.24.6
WEPo:TP1:100.50.40.50.50.40.50.60.6
1:200.20.60.60.50.60.61.00.4
1:500.80.70.30.30.30.40.40.5
1:1000.50.50.30.40.30.20.30.3
1 Sites 1, 2, 7, and 8 are under long-term vegetable production. Sites 3, 4, 5, and 6 are under long-term commodity crops (corn–soybean rotation, with and without cover crops) production.
Table A4. Concentrations of inorganic (WEPi), organic (WEPo), and total (WEPt) water-extractable P in eight sequential extracts at 1:100 soil-to-water ratio in four field sites.
Sequential Extraction NumberSite 2 1Site 4Site 6 Site 7
WEPtWEPiWEPoWEPtWEPiWEPoWEPtWEPiWEPoWEPtWEPiWEPo
––––––––––––––––––––––––––––––––––––––––– mg L−1 –––––––––––––––––––––––––––––––––
11.341.230.110.650.590.050.530.500.030.460.440.02
20.850.790.060.320.290.030.250.240.010.220.210.01
30.680.630.050.260.250.010.180.180.000.150.150.01
40.590.560.030.210.210.000.180.180.010.120.110.01
50.520.470.050.220.210.010.170.170.000.100.090.00
60.550.530.020.230.230.000.130.140.000.070.07−0.01
70.540.510.030.200.190.010.150.140.000.070.070.00
80.490.460.030.180.180.000.140.140.000.080.080.00
1 Sites 2 and 7 are under long-term vegetable production. Sites 4 and 6 are under long-term commodity crops (corn–soybean rotation, with and without cover crops) production.
Table A5. Amounts of inorganic (WEPi), organic (WEPo), and total (WEPt) water-extractable P in eight sequential extracts at 1:100 soil-to-water ratio in four field sites.
Sequential Extraction NumberSite 2 1Site 4Site 6Site 7
WEPtWEPiWEPoWEPtWEPiWEPoWEPtWEPiWEPoWEPtWEPiWEPo
–––––––––––––––––––––––––––––––––––––––– mg kg−1 ––––––––––––––––––––––––––––––––
1132.2121.111.063.057.85.252.749.23.545.343.12.2
284.077.96.232.029.32.624.723.90.821.520.90.7
367.562.74.825.524.70.817.817.40.315.214.40.7
458.354.93.420.920.40.518.017.50.512.111.20.9
551.046.14.921.420.31.217.116.70.49.59.40.2
654.752.32.422.822.9−0.113.313.5−0.26.67.2−0.6
753.250.13.119.918.91.014.514.10.37.07.00.0
848.445.03.417.617.8−0.213.814.2−0.47.67.70.0
Cumulative (1–8)549.3510.139.3223.1212.111.0171.8166.65.2124.9120.84.1
1 Sites 2 and 7 are under long-term vegetable production. Sites 4 and 6 are under long-term commodity crops (corn–soybean rotation, with and without cover crops) production.
Figure A1. Cumulative amounts of inorganic water-extractable P (WEPi) and organic water-extractable P (WEPo) in eight sequential extracts at 1:100 soil-to-water ratio in four fields.
Water 13 01006 g0a1

References

  1. Kleinman, P.J.A.; Fanelli, R.M.; Hirsch, R.M.; Buda, A.R.; Easton, Z.M.; Wainger, L.A.; Brosch, C.; Lowenfish, M.; Collick, A.S.; Shirmohammadi, A.; et al. Phosphorus and the Chesapeake Bay: Lingering Issues and Emerging Concerns for Agriculture. J. Environ. Qual. 2019, 48, 1191–1203. [Google Scholar] [CrossRef] [Green Version]
  2. Kusmer, A.S.; Goyette, J.-O.; Macdonald, G.K.; Bennett, E.M.; Maranger, R.; Withers, P.J.A. Watershed Buffering of Legacy Phosphorus Pressure at a Regional Scale: A Comparison Across Space and Time. Ecosystems 2019, 22, 91–109. [Google Scholar] [CrossRef] [Green Version]
  3. Toor, G.S.; Sims, J.T. Managing Phosphorus Leaching in Mid-Atlantic Soils: Importance of Legacy Sources. Vadose Zone J. 2015, 14. [Google Scholar] [CrossRef]
  4. Toor, G.S.; Yang, Y.; Morris, M.; Schwartz, P.; Darwish, Y.; Gaylord, G.; Webb, K. Phosphorus Pools in Soils Under Rotational and Continuous Grazed Pastures. Agrosyst. Geosci. Environ. 2020, 3, 20103. [Google Scholar] [CrossRef]
  5. Daniel, T.C.; Sharpley, A.N.; Edwards, D.R.; Wedepohl, R.; Lemunyon, J.L. Minimizing Surface Water Eutrophication from Agriculture by Phosphorus Management. J. Soil Water Conserv. 1994, 49, 30. [Google Scholar]
  6. Carpenter, S.R. Phosphorus Control is Critical to Mitigating Eutrophication. Proc. Natl. Acad. Sci. USA 2008, 105, 11039–11040. [Google Scholar] [CrossRef] [Green Version]
  7. Osterholz, W.R.; Hanrahan, B.R.; King, K.W. Legacy Phosphorus Concentration–Discharge Relationships in Surface Runoff and Tile Drainage from Ohio Crop Fields. J. Environ. Qual. 2020, 49, 675–687. [Google Scholar] [CrossRef]
  8. Toor, G.S.; Sims, J.T. Phosphorus Leaching in Soils Amended with Animal Manures Generated from Modified Diets. J. Environ. Qual. 2016, 45, 1385–1391. [Google Scholar] [CrossRef]
  9. Toor, G.S.; Sims, J.T. Managing Legacy and New Sources of Phosphorus to Reduce Leaching in Mid-Atlantic Soils. Crop. Soils 2016, 49, 40–47. [Google Scholar] [CrossRef]
  10. Kleinman, P.J.; Allen, A.L.; Needelman, B.A.; Sharpley, A.N.; Vadas, P.A.; Saporito, L.S.; Folmar, G.J.; Bryant, R.B. Dynamics of Phosphorus Transfers from Heavily Manured Coastal Plain Soils to Drainage Ditches. J. Soil Water Conserv. 2007, 62, 225–235. [Google Scholar]
  11. Sharpley, A.N.; Weld, J.L.; Beegle, D.B.; Kleinman, P.J.; Gburek, W.J.; Moore, P.A.; Mullins, G. Development of Phosphorus Indices for Nutrient Management Planning Strategies in the United States. J. Soil Water Conserv. 2003, 58, 137–152. [Google Scholar]
  12. Osmond, D.L.; Cabrera, M.L.; Feagley, S.E.; Hardee, G.E.; Mitchell, C.C.; Moore, P.A.; Mylavarapu, R.S.; Oldham, J.L.; Stevens, J.C.; Thom, W.O.; et al. Comparing Ratings of the Southern Phosphorus Indices. J. Soil Water Conserv. 2006, 61, 325–337. [Google Scholar]
  13. Maryland Department of Agriculture. Soils Data Collection and Verification as of January 2019; Maryland Department of Agriculture: Annapolis, MD, USA, 2019.
  14. Sharpley, A.N. Dependence of Runoff Phosphorus on Extractable Soil Phosphorus. J. Environ. Qual. 1995, 24, 920–926. [Google Scholar] [CrossRef] [Green Version]
  15. Pote, D.H.; Daniel, T.C.; Moore, P.A.; Nichols, D.J.; Sharpley, A.N.; Edwards, D.R. Relating Extractable Soil Phosphorus to Phosphorus Losses in Runoff. Soil Sci. Soc. Am. J. 1996, 60, 855–859. [Google Scholar] [CrossRef]
  16. Hooda, P.S.; Rendell, A.R.; Edwards, A.C.; Withers, P.J.A.; Aitken, M.N.; Truesdale, V.W. Relating Soil Phosphorus Indices to Potential Phosphorus Release to Water. J. Environ. Qual. 2000, 29, 1166–1171. [Google Scholar] [CrossRef] [Green Version]
  17. Maguire, R.O.; Sims, J.T. Soil Testing to Predict Phosphorus Leaching. J. Environ. Qual. 2002, 31, 1601–1609. [Google Scholar] [CrossRef]
  18. Self-Davis, M.L.; Moore, P.A., Jr.; Joern, B.C. Determination of Water- and/or Dilute Salt-extractable Phosphorus. In Methods Phosphorus Analysis for Soils, Sediments, Residuals, and Waters; Southern Cooperative Series Bulletin No. #396; North Carolina State University: Raleigh, NC, USA, 2000; pp. 24–26. [Google Scholar]
  19. Beauchemin, S.; Hesterberg, D.; Chou, J.; Beauchemin, M.; Simard, R.R.; Sayers, D.E. Speciation of Phosphorus in Phosphorus-Enriched Agricultural Soils Using X-Ray Absorption Near-Edge Structure Spectroscopy and Chemical Fractionation. J. Environ. Qual. 2003, 32, 1809–1819. [Google Scholar] [CrossRef] [PubMed]
  20. Hedley, M.J.; Stewart, J.W.B.; Chauhan, B.S. Changes in Inorganic and Organic Soil Phosphorus Fractions Induced by Cultivation Practices and by Laboratory Incubations. Soil Sci. Soc. Am. J. 1982, 46, 970–976. [Google Scholar] [CrossRef]
  21. Sharpley, A.N.; McDowell, R.W.; Kleinman, P.J.A. Amounts, Forms, and Solubility of Phosphorus in Soils Receiving Manure. Soil Sci. Soc. Am. J. 2004, 68, 2048–2057. [Google Scholar] [CrossRef] [Green Version]
  22. Kleinman, P.; Sullivan, D.; Wolf, A.; Brandt, R.; Dou, Z.; Elliott, H.; Kovar, J.; Leytem, A.; Maguire, R.; Moore, P.; et al. Selection of a Water-Extractable Phosphorus Test for Manures and Biosolids as an Indicator of Runoff Loss Potential. J. Environ. Qual. 2007, 36, 1357–1367. [Google Scholar] [CrossRef] [Green Version]
  23. Kleinman, P.J.A.; Sharpley, A.N.; Wolf, A.M.; Beegle, D.B.; Moore, P.A. Measuring Water-Extractable Phosphorus in Manure as an Indicator of Phosphorus in Runoff. Soil Sci. Soc. Am. J. 2002, 66, 2009–2015. [Google Scholar] [CrossRef] [Green Version]
  24. Toor, G.S.; Haggard, B.E.; Reiter, M.S.; Daniel, T.C.; Donoghue, A.M. Phosphorus Solubility in Poultry Litters and Granulates: Influence of Litter Treatments and Extraction Ratios. Trans. ASABE 2007, 50, 533–542. [Google Scholar] [CrossRef]
  25. Sharpley, A.N. Depth of Surface Soil-runoff Interaction as Affected by Rainfall, Soil Slope, and Management. Soil Sci. Soc. Am. J. 1985, 49, 1010–1015. [Google Scholar] [CrossRef] [Green Version]
  26. Vadas, P.A.; Mallarino, A.P.; McFarland, A. The Importance of Sampling Depth When Testing Soils for their Potential to Supply Phosphorus to Surface Runoff. In Extension Fact Sheets; 2005; p. 14. Available online: https://www.ars.usda.gov/research/publications/publication/?seqNo115=188150 (accessed on 6 April 2021).
  27. Murphy, J.; Riley, J. A Modified Single Solution Method for the Determination of Phosphate in Natural Waters. Anal. Chim. Acta 1962, 27, 31–36. [Google Scholar] [CrossRef]
  28. Gee, G.W.; Orr, D. 2.4 Particle-Size Analysis. Methods Soil Anal. 2002, 5, 255–293. [Google Scholar]
  29. Wolf, A.M.; Beegle, D.B. Recommended Soil Tests for Macronutrients. Recomm. Soil Test. Proced. Northeast. USA 2011, 493, 39–47. [Google Scholar]
  30. USEPA. Method 3050B Acid Digestion of Sediments, Sludges, and Soils; Revision 2; USEPA: Washington, DC, USA, 1996; pp. 1–12. Available online: https://www.epa.gov/sites/production/files/2015-06/documents/epa-3050b.pdf (accessed on 6 April 2021).
  31. Fuhrman, J.K.; Zhang, H.; Schroder, J.L.; Davis, R.L.; Payton, M.E. Water-Soluble Phosphorus as Affected by Soil to Extractant Ratios, Extraction Times, and Electrolyte. Commun. Soil Sci. Plant Anal. 2005, 36, 925–935. [Google Scholar] [CrossRef]
  32. Sharpley, A.N. Effect of Soil Properties on the Kinetics of Phosphorus Desorption. Soil Sci. Soc. Am. J. 1983, 47, 462–467. [Google Scholar] [CrossRef]
  33. Leytem, A.B.; Mikkelsen, R.L.; Gilliam, J.W. Sorption of Organic Phosphorus Compounds in Atlantic Coastal Plain Soils. Soil Sci. 2002, 167, 652–658. [Google Scholar] [CrossRef] [Green Version]
  34. Waldrip, H.M.; Pagliari, P.H.; He, Z.; Harmel, R.D.; Cole, N.A.; Zhang, M. Legacy Phosphorus in Calcareous Soils: Effects of Long-Term Poultry Litter Application. Soil Sci. Soc. Am. J. 2015, 79, 1601–1614. [Google Scholar] [CrossRef]
  35. Koopmans, G.F.; Chardon, W.J.; McDowell, R.W. Phosphorus Movement and Speciation in a Sandy Soil Profile after Long-Term Animal Manure Applications. J. Environ. Qual. 2007, 36, 305–315. [Google Scholar] [CrossRef] [PubMed]
  36. Dodd, R.; Sharpley, A. Recognizing the Role of Soil Organic Phosphorus in Soil Fertility and Water Quality. Resour. Conserv. Recycl. 2015, 105, 282–293. [Google Scholar] [CrossRef]
  37. USEPA. Ambient Water Quality Criteria Recommendations Information Supporting the Development of State and Tribal Nutrient Criteria Rivers and Streams in Nutrient Ecoregion XIV; EPA 822-B-00-022; USEPA: Washington, DC, USA, 2000. [Google Scholar]
  38. Nair, V.D.; Portier, K.M.; Graetz, D.A.; Walker, M.L. An Environmental Threshold for Degree of Phosphorus Saturation in Sandy Soils. J. Environ. Qual. 2004, 33, 107–113. [Google Scholar] [CrossRef]
  39. Sims, J.T.; Maguire, R.O.; Leytem, A.B.; Gartley, K.L.; Pautler, M.C. Evaluation of Mehlich 3 as an Agri-Environmental Soil Phosphorus Test for the Mid-Atlantic United States of America. Soil Sci. Soc. Am. J. 2002, 66, 2016–2032. [Google Scholar] [CrossRef]
  40. Dari, B.; Nair, V.D.; Sharpley, A.N.; Kleinman, P.; Franklin, D.; Harris, W.G. Consistency of the Threshold Phosphorus Saturation Ratio across a Wide Geographic Range of Acid Soils. Agrosyst. Geosci. Environ. 2018, 1, 1–8. [Google Scholar] [CrossRef] [Green Version]
  41. Lucas, E.R.; Toor, G.S.; McGrath, J.M. Agronomic and Environmental Phosphorus Decline in Coastal Plain Soils after Cessation of Manure Application. Agric. Ecosyst. Environ. 2021, 311, 107337. [Google Scholar] [CrossRef]
Figure 1. The proportion (A) and amount (B) of inorganic water-extractable P (WEPi), organic water-extractable P (WEPo), and total water-extractable P (WEPt) at four soil-to-water ratios in legacy P soils. Each value represents data from eight fields with two replicate samples (n = 16). Boxplots depict median values (thick black line), mean values (diamond), 25th to 75th percentiles (colored boxes), 1.5 times the interquartile range (whiskers), and outlier values (points). Letters (a, b, c, and d) indicate statistically significant values for each of the WEP pools across extraction ratios at p < 0.05.
Water 13 01006 g001
Figure 2. The proportion of inorganic water-extractable P (WEPi), organic water-extractable P (WEPo), and total water-extractable P (WEPt) at four soil-to-water ratios in legacy P soils as (A.1,A.2) percent of Mehlich 3–P and (B.1,B.2) percent of total P. Each value represents data from eight fields with two replicate samples (n = 16). Boxplots depict median values (thick black line), mean values (diamond), 25th to 75th percentiles (colored boxes), 1.5 times the interquartile range (whiskers), and outlier values (points). Letters (a, b, c, and d) indicate statistically significant values for WEPt across extraction ratios at p < 0.05.
Water 13 01006 g002
Figure 3. Inorganic water-extractable P (WEPi) and organic water-extractable P (WEPo) concentrations (mg L−1) in eight sequential extractions at 1:100 soil-to-water ratio for four selected sites. Letters (a, b, c, and d) indicate statistically significant values for WEPt (WEPi + WEPo) across sequential extraction numbers for each site at p < 0.05. Sites 2 and 7 are under long-term vegetable production. Sites 4 and 6 are under long-term commodity crops (corn–soybean rotation, with and without cover crops) production. The dotted red line indicates the US EPA total P limit (0.03125 mg L−1) for surface waters [37].
Water 13 01006 g003
Table 1. Physical and chemical characteristics of eight field sites.
Soil CharacteristicsSite 1 1Site 2Site 3Site 4Site 5Site 6Site 7Site 8
pH6.557.256.566.366.146.226.356.38
Organic Matter (%)0.561.871.872.112.892.081.000.99
CEC (meq/100 g)6.4015.1011.7012.5013.2010.205.908.30
% Sand77.753.967.751.356.953.685.086.1
% Silt17.540.623.739.232.738.612.111.4
% Clay4.85.58.69.510.47.83.02.5
Texture Loamy SandSandy LoamSandy LoamLoamSandy LoamSandy LoamLoamy SandLoamy Sand
USDA-NRCS soil classification Coarse-loamy, siliceous, semiactive, mesic Typic HapludultsFine-loamy, mixed, active, mesic Typic EndoaquultsFine-loamy, mixed, semiactive, mesic Typic HapludultsFine-loamy, mixed, active, mesic Typic EndoaquultsFine-loamy, mixed, active, mesic Typic EndoaquultsFine-loamy, mixed, active, mesic Typic EndoaquultsCoarse-loamy, siliceous, semiactive, mesic Aquic HapludultsCoarse-loamy, siliceous, semiactive, mesic Aquic Hapludults
WRB Soil ClassificationAcrisolGleysolAcrisolGleysolGleysolGleysolAcrisolAcrisol
Acidity (meq/100 g)2.00.02.82.83.92.82.02.0
Total P (mg/kg)691.92235.21460.71401.11446.41405.4832.4749.4
M3–P (mg/kg)534.01127.0806.0692.0502.0785.0602.0620.0
M3–Fe (mg/kg)281.6270.5357.8316.7275.6183.0185.4164.1
M3–Al (mg/kg)789.1586.4784.4586.7905.01006.0767.3615.1
M3–PSR0.501.370.730.810.420.620.610.78
M3–P:Total P0.770.500.550.490.350.560.720.83
M3–Ca (mg/kg)721.42662.41375.11605.31495.11203.7591.7995.3
M3–Mg (mg/kg)58.0167.0180.0162.0158.0104.089.0111.0
1 Sites 1, 2, 7, and 8 are under long-term vegetable production. Sites 3, 4, 5, and 6 are under long-term commodity crops (corn–soybean rotation, with and without cover crops) production.
Publisher’s Note: MDPI stays neutral with regard to jurisdictional claims in published maps and institutional affiliations.

