
Preparation of PANI Modified ZnO Composites via Different Methods: Structural, Morphological and Photocatalytic Properties


1
Department of Chemistry, Faculty of Arts and Sciences, Kirsehir Ahi Evran University, Kirsehir 40100, Turkey
2
Institute of Environmental Sciences, Bogazici University, Bebek, Istanbul 34342, Turkey
*
Author to whom correspondence should be addressed.
Water 2021, 13(8), 1025; https://doi.org/10.3390/w13081025
Submission received: 10 March 2021
/
Revised: 30 March 2021
/
Accepted: 6 April 2021
/
Published: 8 April 2021
(This article belongs to the Special Issue New Perspectives in Photocatalytic Water Treatment)
Abstract
:Polyaniline modified zinc oxide (PANI-ZnO) photocatalyst composites were synthesized by focusing on dissolution disadvantage of ZnO. In-Situ chemical oxidation polymerization method was performed under neutral conditions (PANI-ES) whereas in hybridization method physical blending was applied using emeraldine base of polyaniline (PANI-EB). PANI-ZnO composites were prepared in various ratios of aniline (ANI) to ZnO as 1%, 3%, 6% and 9%. The alterations on the structural and morphological properties of PANI-ZnO composites were compared by Fourier Transform Infrared (FT-IR), Raman Spectroscopy, X-ray Diffraction (XRD) and Scanning Electron Microscopy-Energy Dispersive X-ray Analysis Unit (SEM-EDAX) techniques. FT-IR and Raman spectroscopy confirmed the presence of PANI in all composites. SEM images revealed the morphological differences of PANI-ZnO composites based on PANI presence and preparation methods. Photocatalytic performances of PANI-ZnO specimens were investigated by following the degradation of methylene blue (MB) in aqueous medium under UVA irradiation. The effects of catalyst dose and initial dye concentration were also studied. MB degradation was followed by both decolorization extents and removal of aromatic fractions. PANI-ZnO composites expressed enhanced photocatalytic performance (~95% for both methods) as compared to sole ZnO (~87%). The hybridization method was found to be more efficient than the In-Situ chemical oxidation polymerization method emphasizing the significance of the neutral medium.
1. Introduction
Due to the continuous release of contaminants to the environment, application of photocatalysis as an alternative advanced oxidation treatment process is attracting the main focus of researchers. Besides TiO2, ZnO is the second most extensively used photocatalyst exhibiting excellent photocatalytic activity, stability and almost similar band gap energy (Ebg 3.2 eV and 3.0 eV, respectively) [1,2,3,4]. The major advantage of ZnO is its broad band in ultraviolet-visible (UV-vis) region in the wavelength range of 350–470 nm enabling charge transfer from oxide 2p orbitals (valence band) to 3d orbitals of Zn2+ cations (conduction band) [5]. ZnO has more negative conduction band potential and has a higher exciton binding energy compared to TiO2. Comparative studies on the use of TiO2, ZnO and TiO2/ZnO photocatalysts for pollutant abatement were also reported in the literature [6,7,8,9,10,11,12].
To overcome the disadvantages of n-type semiconductors expressing large band gaps, coupling with conducting polymers exhibiting small bandgaps and extended π–e− systems drew current interest. With respect to attained beneficial effect via “sensitization”, coupling of p-type conducting polymers with an n-type semiconductor opened a new area of research. In recent years, the synthesis of p-conjugated polymer modified ZnO materials gained great attention for photocatalytic applications [13,14,15,16,17]. PANI is the most popular conducting polymer containing structures either benzenoid, quinoid or even both of them. The combination of a p-type polymer as PANI with an n-type semiconductor e.g., ZnO results in p-n junction thereby reducing the rate of electron-hole recombination and inhibiting photocorrosion [18]. Moreover, PANI could also act as e− donor and h+ acceptor [19]. Besides being a low-cost material, PANI could be synthesized easily and express high environmental stability. Accordingly, PANI is regarded as a good polymer candidate in preparation of PANI-ZnO composites suitable for photocatalytic systems [16,17,20,21].
The main challenge of synthesis of PANI-ZnO composites is to prevent the dissolution of ZnO both in highly acidic (release of Zn2+ ions) and alkaline aqueous conditions (formation of Zn(OH)42− due to the reactivity of amphoteric ZnO as expressed by the following reactions 1 and 2:
In extreme acidic aqueous environment,
ZnO + 2H+ → Zn2+ + H2O
In extreme alkaline aqueous environment,
ZnO + H2O + 2OH− → Zn(OH)42−
On the other hand, photocorrosion of ZnO under UVA irradiation could also be eliminated by coupling with a conducting polymer i.e., PANI (reactions 3–5).
ZnO + hν (E > Ebg = 3.2 eV) → ZnO*(hVB+ + eCB−)
(hVB+ + eCB−) → hVB+ + eCB−
ZnO + h+ + nH2O → Zn(OH)n (2−n)+ + ½ O2 + nH+
PANI synthesis starts from the combined usage of monomers such as aniline ANI or its derivatives and free radical initiators such as ammonium persulfate (APS), potassium persulfate, potassium dichromate etc. acting as effective oxidants. The mostly used dopants are hydrochloric acid, sulfuric acid and dodecylbenzenesulfonic acid [20]. PANI under acidic conditions (pH < 4) exists as polyaniline emeraldine salt form (PANI-ES) and converts to PANI-EB above pH 4–6.
The standard synthesis of PANI is performed by using a strong acid such as HCl at pH < 2.5 [22]. There have also been studies on modified composites of PANI e.g., most commonly investigated with titanium dioxide (PANI-TiO2) by In-Situ chemical oxidation polymerization at lower pH values [23,24,25,26,27]. The dissolution problem of ZnO could only be avoided by achieving the synthesis of PANI-ZnO composites under neutral pH conditions. Thus, Gilja and colleagues have successfully synthesized PANI-ZnO composites in neutral medium without using acidic dopants via In-Situ chemical oxidation polymerization mechanism preventing the dissolution issue of ZnO [14].
As an alternative approach, PANI-ZnO composites could also be prepared via the hybridization method that was based on conversion of PANI-ES to emeraldine base PANI-EB and physically mixed with ZnO [15,28,29]. Performance studies of thus prepared PANI-ZnO composites mainly focused on degradation of model substrates (dyes such as acid blue, methylene blue and malachite green) and organic pollutants (antibiotics such as ampicillin) [13,14,15,29].
Therefore, the preparation of the PANI-ZnO composites under neutral conditions expressed prime importance to be investigated. To fulfill this gap, the present study was designed to synthesize PANI-ZnO composites safely by two main pathways as In-Situ chemical oxidation polymerization and hybridization methods. Structural and morphological properties of the composites were elucidated by FT-IR and Raman spectroscopy, XRD and SEM-EDAX analysis. Photocatalytic activities of thus prepared photocatalysts were assessed by following the degradation of a model substrate in neutral aqueous medium under UV light irradiation in a comparative manner. Methylene blue (MB) as a cationic dye was selected due to its resistance to biodegradation thereby being widely employed almost as a standard dye for photocatalytic activity tests [30]. In addition, photocatalyst dose and initial dye concentration effects on the removal efficiencies of MB were also examined.
2. Materials and Methods
2.1. Materials
Zinc oxide (99%) was used as the primary photocatalyst. ANI, ammonium persulfate (APS), hydrochloric acid (37%), tetrahydrofuran and ammonia solution (25%) were used in various preparation steps. ZnO, MB (C16H18ClN3S⋅2H2O) and all other chemicals were provided from Merck and used without further purification. All aqueous solutions were prepared with distilled water (conductivity 2 µS/cm at 25 °C).
2.2. Preparation of PANI-ZnO Composites
Prior to synthesis of composites, PANI-ES was synthesized by In Situ-chemical oxidation polymerization method, then converted to PANI-EB by adding alkaline solution. PANI-ZnO composites were prepared by In Situ chemical oxidation polymerization and hybridization methods.
2.2.1. Preparation of PANI-ES and PANI-EB
PANI-ES was synthesized by In-Situ chemical oxidation polymerization method with reference to the procedure reported by Li and colleagues [24]. Solution A was prepared by dissolving 17.13 g APS in 240 mL of 1 M HCl solution and placed in a dropping funnel. Solution B was prepared by adding ANI (6.99 g) slowly into 240 mL of 1 M HCl solution in a flat-bottomed flask placed in an ice bath with vigorous stirring by magnetic stirrer. Afterwards, solution A was added dropwise (approximately one drop/second) into the solution B in the ice bath. The stirring was continued for another 24 h at room temperature to achieve polymerization. PANI-ES was filtered through Gooch funnel and extensively washed with distilled water and ethanol and dried in an air oven at 80 °C for 24 h.
The obtained PANI-ES was further converted to PANI-EB. The base treatment was applied with adding 12.1 mL ammonia solution (10%) to 2 g PANI-ES and the solution stirred for 2 h. The filtered PANI-EB was then washed in turn with distilled water and ethanol and finally dried at 80 °C until reaching constant weight. The synthesized PANI-ES and PANI-EB samples were kept in glass bottles at room temperature.
2.2.2. In-Situ Chemical Oxidation Polymerization Method
PANI-ZnO composites (PZI) using In-Situ chemical oxidation polymerization method were synthesized by following the procedure reported by Gilja and colleagues [14]. The mole ratio of ANI to APS was kept constant as 1:0.25 in all samples. Weight percentages (wt%) of ANI/ZnO were adjusted to 1%, 3%, 6% and 9%, and these composites were denoted as PZI-1, PZI-3, PZI-6 and PZI-9, respectively. In a typical synthesis of PZI-1, solution A was prepared by adding 0.031 g APS to 240 mL of distilled water and placed in a dropping funnel. Solution B was prepared by dissolving 5 g ZnO in 240 mL distilled water via sonication in ultrasonic bath for 15 min to obtain a uniform and stable solution. 0.05 g ANI was added slowly into Solution B. Solution A placed in a dropping funnel was dropwise added (approximately one drop/second) into Solution B in a flask placed in an ice bath with vigorous stirring to obtain oxidative polymerization. The reaction mixture was further stirred for 24 h at room temperature. The obtained composite was filtered, washed with distilled water and dried in an air oven at 80 °C for 24 h. PZI-3, PZI-6 and PZI-9 were prepared accordingly.
2.2.3. Hybridization Method
PANI-ZnO composites (PZS) by hybridization method were synthesized by simple physical mixing of PANI-EB and ZnO. Four different PANI-hybridized ZnO composites with different mass ratios containing 1%, 3%, 6% and 9% were prepared and the composites were labelled as PZS-1, PZS-3, PZS-6 and PZS-9, respectively. In a typical synthesis of PZS-1, the mixture of 5 g ZnO and 0.05 g PANI-EB in 50 mL tetrahydrofuran was sonicated for 15 min in an ultrasonic bath and continuously stirred for 24 h at room temperature. The formed composite was filtered, washed with distilled water and followed by drying in an air oven at 80°C for 24 h. PZS-3, PZS-6 and PZS-9 were prepared accordingly. A schematic of PANI-ZnO preparation method including the ways preventing ZnO dissolution is presented as Figure S1, in Supplementary information (SI Part 1, Figure S1).
2.3. Characterization Techniques
FT-IR spectra were recorded in the range between 4000–400 cm−1 using Thermo Scientific Nicolet 6700 Spectrometer. All samples were prepared as KBr pellets. Raman spectroscopy was acquired by Thermo Scientific DXR Raman Microscope using Ar+ laser excitation at λ = 532 nm. The laser power and spectral resolution were 10 mW and 2 cm−1, respectively. XRD patterns were recorded on a Rigaku-D/MAX-Ultima diffractometer using Cu Kα radiation (λ = 1.54 Å). The scan varied between 5 to 80 (2θ) with a scan rate of 2° min−1. The operating voltage and current were 40 kV and 40 mA, respectively. SEM analysis was employed on a FEI-Philips XL30 Scanning Electron Microscope equipped with an EDAX unit operating at 10 kV using catalyst powders supported on carbon tape.
2.4. Photocatalytic Activity
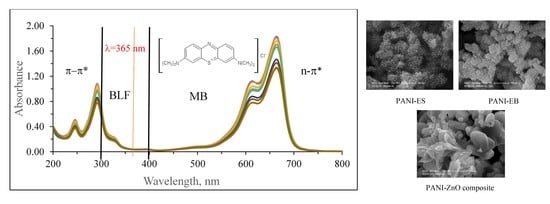
Photocatalytic activity testing was performed in a cylindrical Pyrex reaction vessel containing 50 mL of 10 mg/L MB solution and 0.25 g/L photocatalyst without pH adjustment. The reaction vessel was illuminated from the top with a 125 W black light fluorescent lamp (BLF). BLF light source emitted radiation in a wavelength range between 300 nm and 420 nm with a maximum at λ = 365 nm. The light intensity reaching the reaction medium was quantified by solution-phase potassium ferrioxalate actinometer [31].
Irradiation time-based (0 min-150 min) changes in the concentration of MB were monitored by examining the variations in maximal absorption in UV-visible spectra at 664 nm mainly attributed to decolorization, and two minor peaks located at λ = 292 nm and λ = 246 nm. Accordingly, MB was characterized by UV-vis parameters designated as A664, A292 and A246 with reference to the corresponding absorption wavelengths. Respective molar absorption coefficients were calculated using concentration vs. absorbance values and reported as MB concentration. Thermo Scientific Genesys 10S double beam UV-vis spectrophotometer was employed using 1 cm quartz cells.
Following each treatment period, the photocatalysts were immediately removed from the reaction medium via double filtration through 0.45 μm and 0.20 μm membrane filters immediately to avoid post-adsorption of the organics onto photocatalyst specimens. The reproducibility of the results was determined as <5% via preliminary experiments performed in triplicate prior to the main experimental part.
Preliminary experiments were performed (i), under irradiation in the absence of light, and (ii),under dark conditions in the absence of photocatalyst. Complementary experiments under similar conditions were also carried out to elucidate the effect of initial MB concentration (5 mg/L, 10 mg/L, 20 mg/L and 30 mg/L) by using constant 0.25 g/L photocatalyst dose and the effect of photocatalyst loading (0.125 g/L, 0.25 g/L and 0.50 g/L) in 10 mg/L MB dye solution.
3. Results
The yields of PANI-ES and PANI-EB were found as 95% and 77%, respectively, and all PANI-ZnO composites were obtained in high yields as 95% ± 2.8 irrespective of the preparation methodology.
3.1. Characterization of the PANI-ZnO Composites
3.1.1. FT-IR Spectroscopy
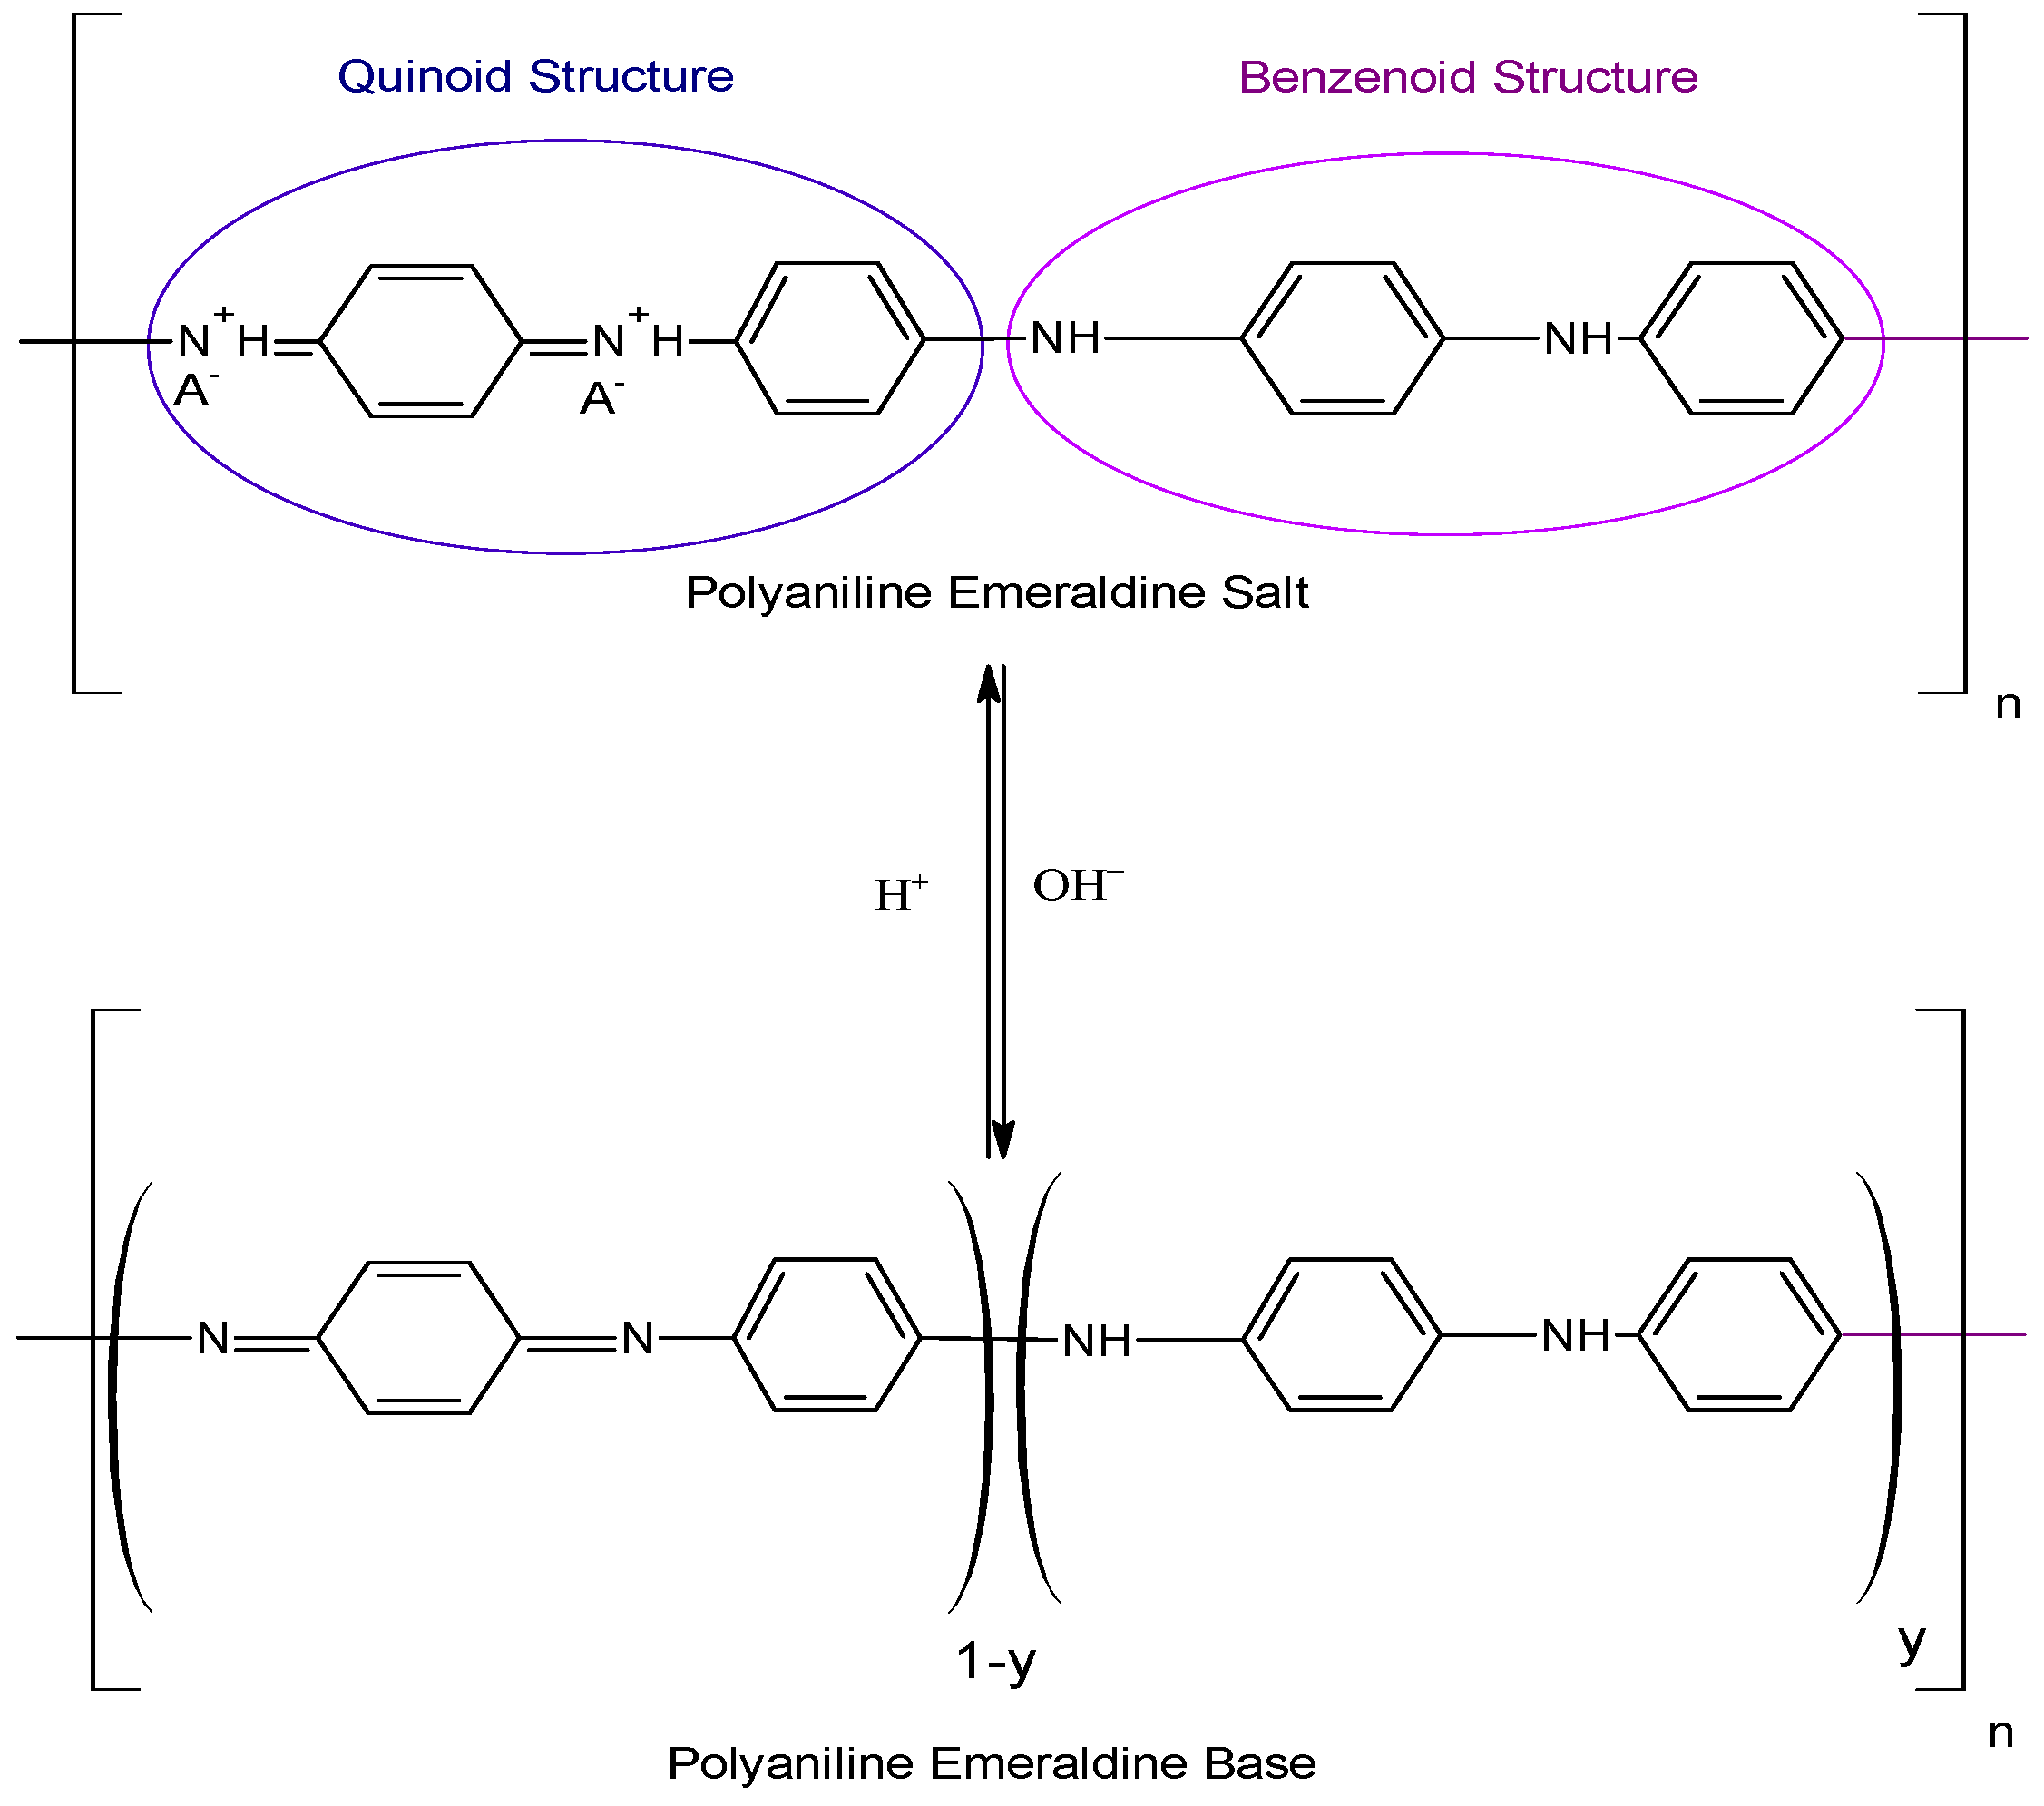
FT-IR spectroscopy was used to monitor possible structural changes due to interactions between PANI and the prepared composites. PANI-ES is one of the oxidative states of PANI containing both benzenoid and quinoid structure units. The partially reduced unit in PANI-ES consists of benzenoid structure where hydrogen atoms are attached to nitrogen atoms, while the partially oxidized unit is comprised quinoid structure where no hydrogen atom is bonded to nitrogen [20]. PANI-EB is the deprotonated form of PANI-ES in alkaline medium [32]. The structures of these oxidized forms of PANI are presented in Figure 1.
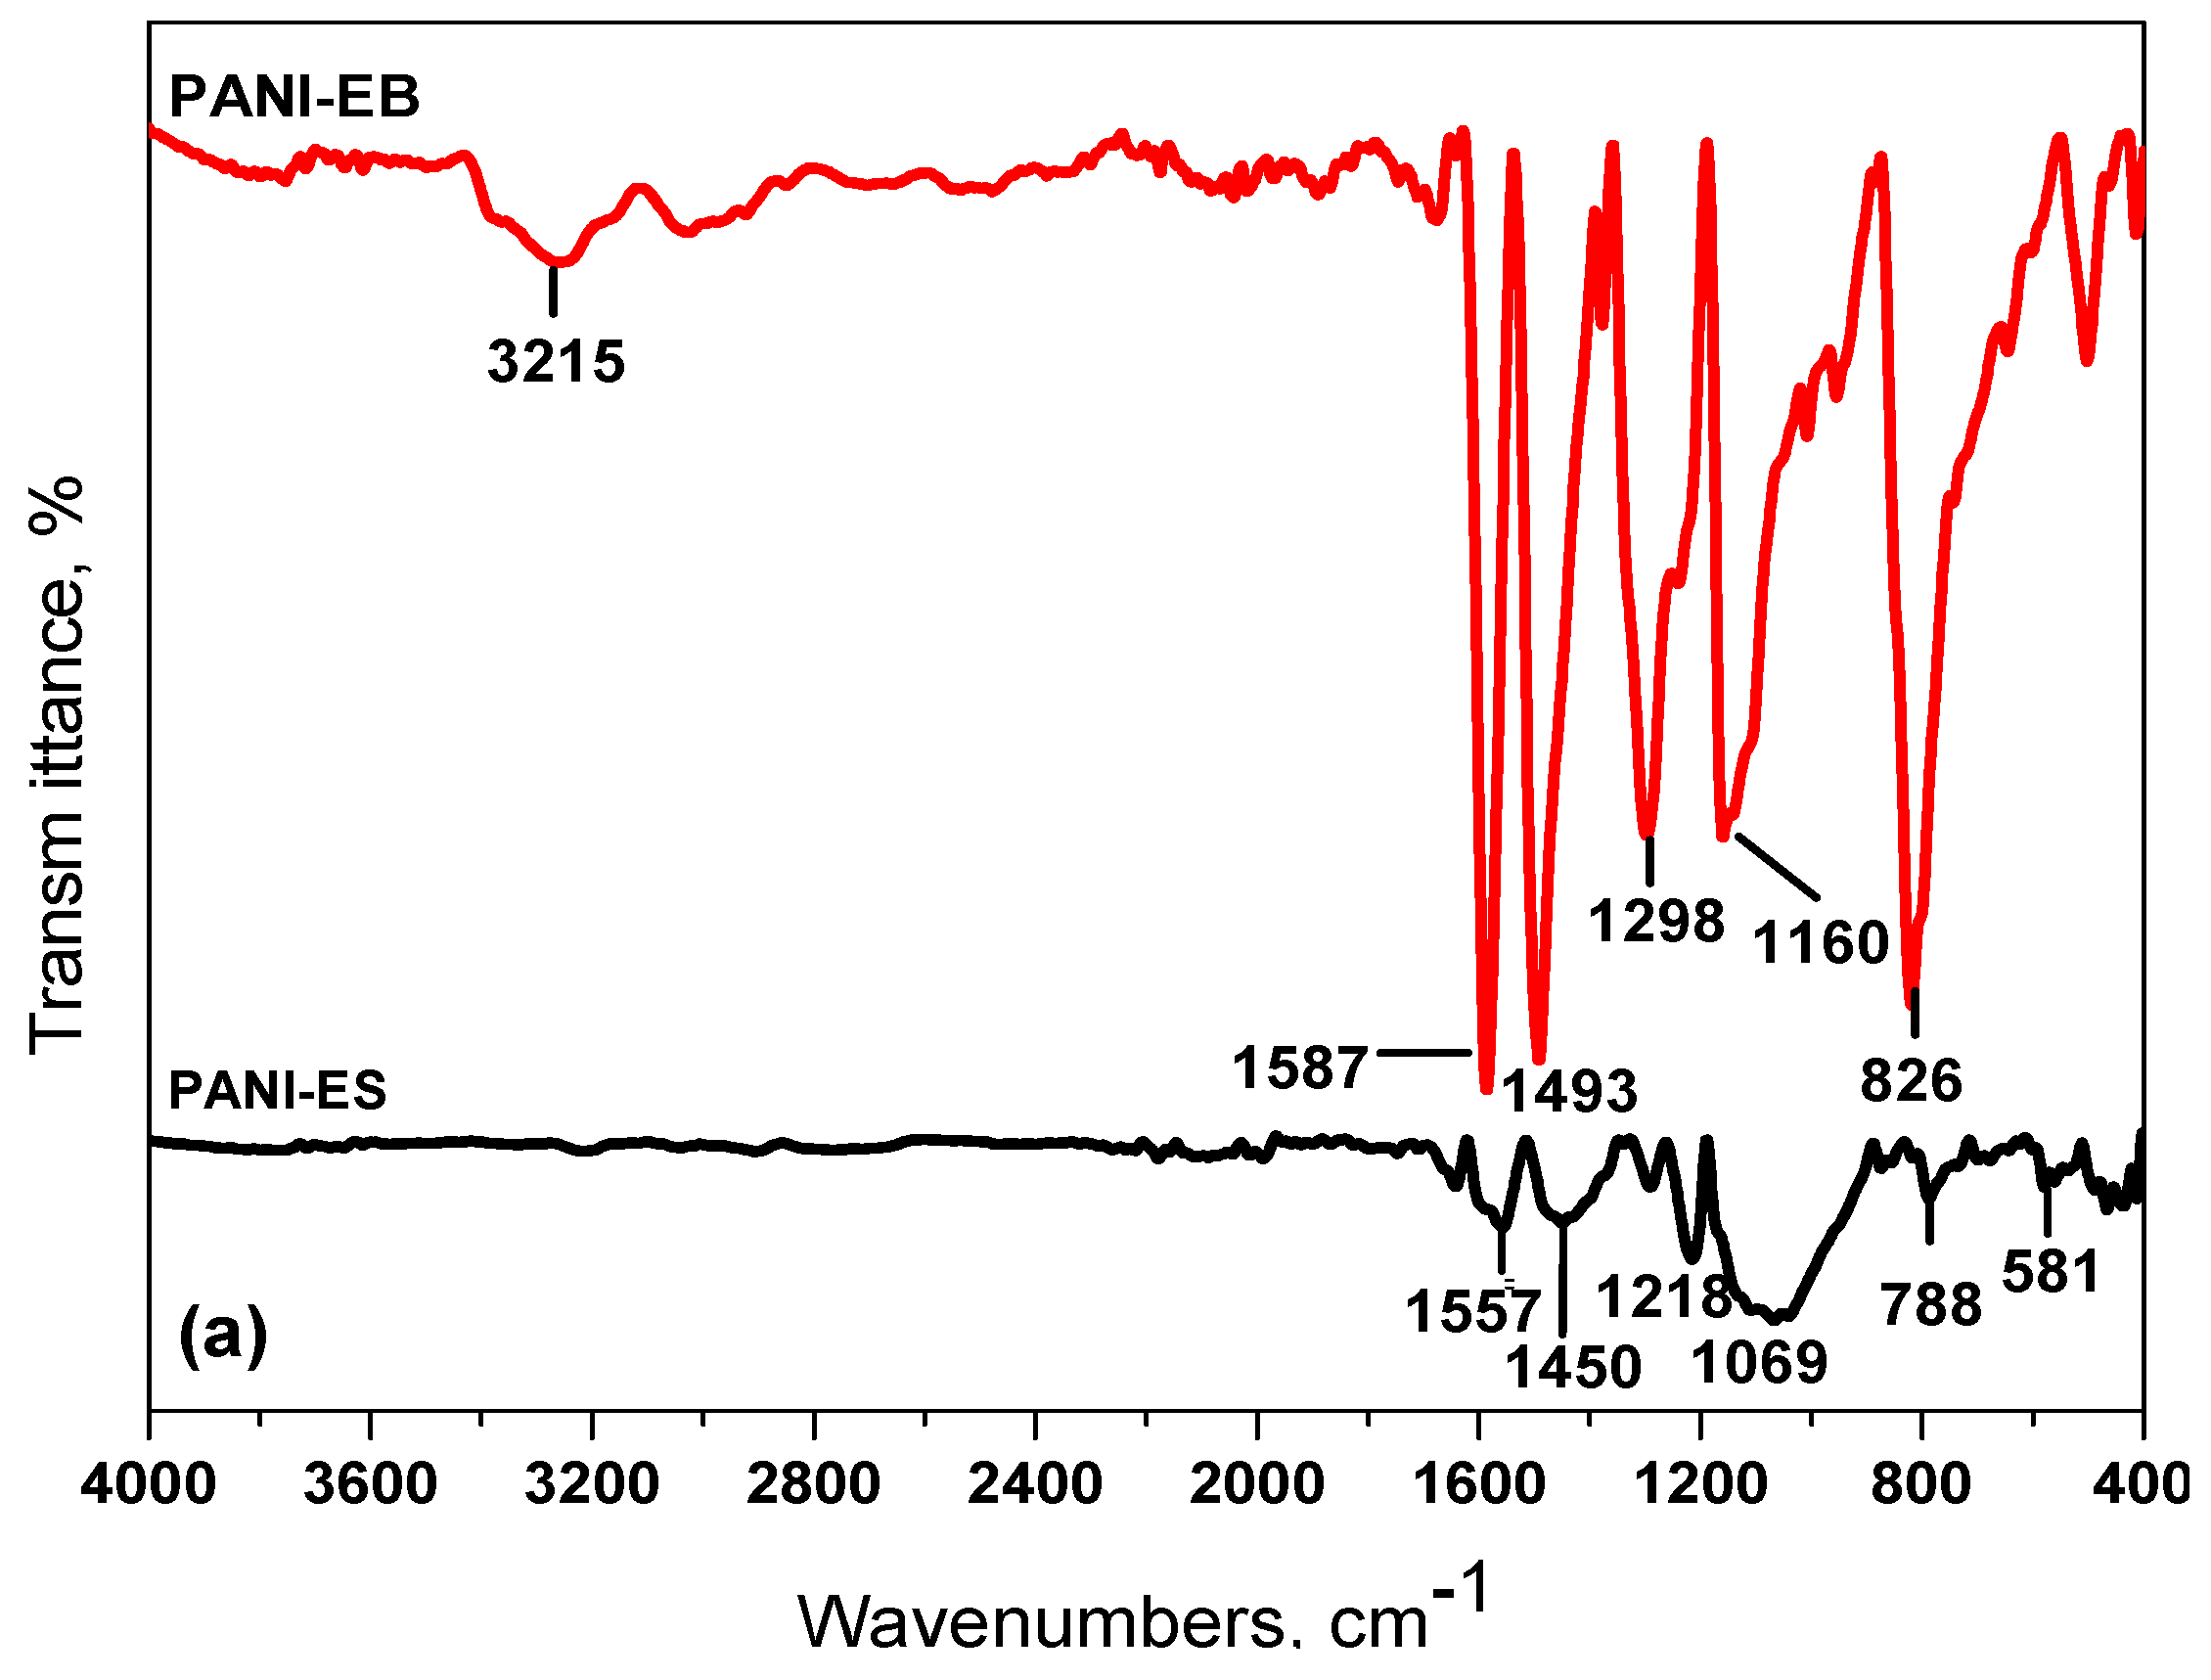
FT-IR spectral variations of PANI-ES and PANI-EB could be visualized by the presence of strong vibrations of PANI-EB in comparison to PANI-ES (Figure 2a). The main characteristic peaks in PANI-ES recorded at 1450 cm−1 and 1557 cm−1 were attributed to the stretching vibrations of benzenoid unit and quinoid unit groups, respectively [20,33]. The broad shoulder located around 3400 cm−1 could be assigned to N-H stretching [14]. The peaks at 1290 cm−1 and 788 cm−1 corresponded to secondary aromatic amine C–N stretching and aromatic C–H out of plane bending, respectively [33]. These peaks were moved to higher wavenumbers, which were located at 1298 cm−1 and 820 cm−1 in PANI-EB. The peaks related to benzenoid and quinoid shifted to 1493 and 1587 cm−1. Furthermore, 1218 cm−1 was related to C–N+• stretching vibration in PANI-ES and this peak disappeared in the FT-IR spectrum of PANI-EB [34,35]. The peaks were observed at 1069 cm−1 and 581 cm−1 indicating residual sulfate anions due to the usage of the oxidant source of ammonium peroxydisulfate. In PANI-EB, the peaks corresponding to the presence of sulfate anions disappeared while a new peak appeared at 1160 cm−1 that was ascribed to the aromatic C–H in plane bending vibration [34].
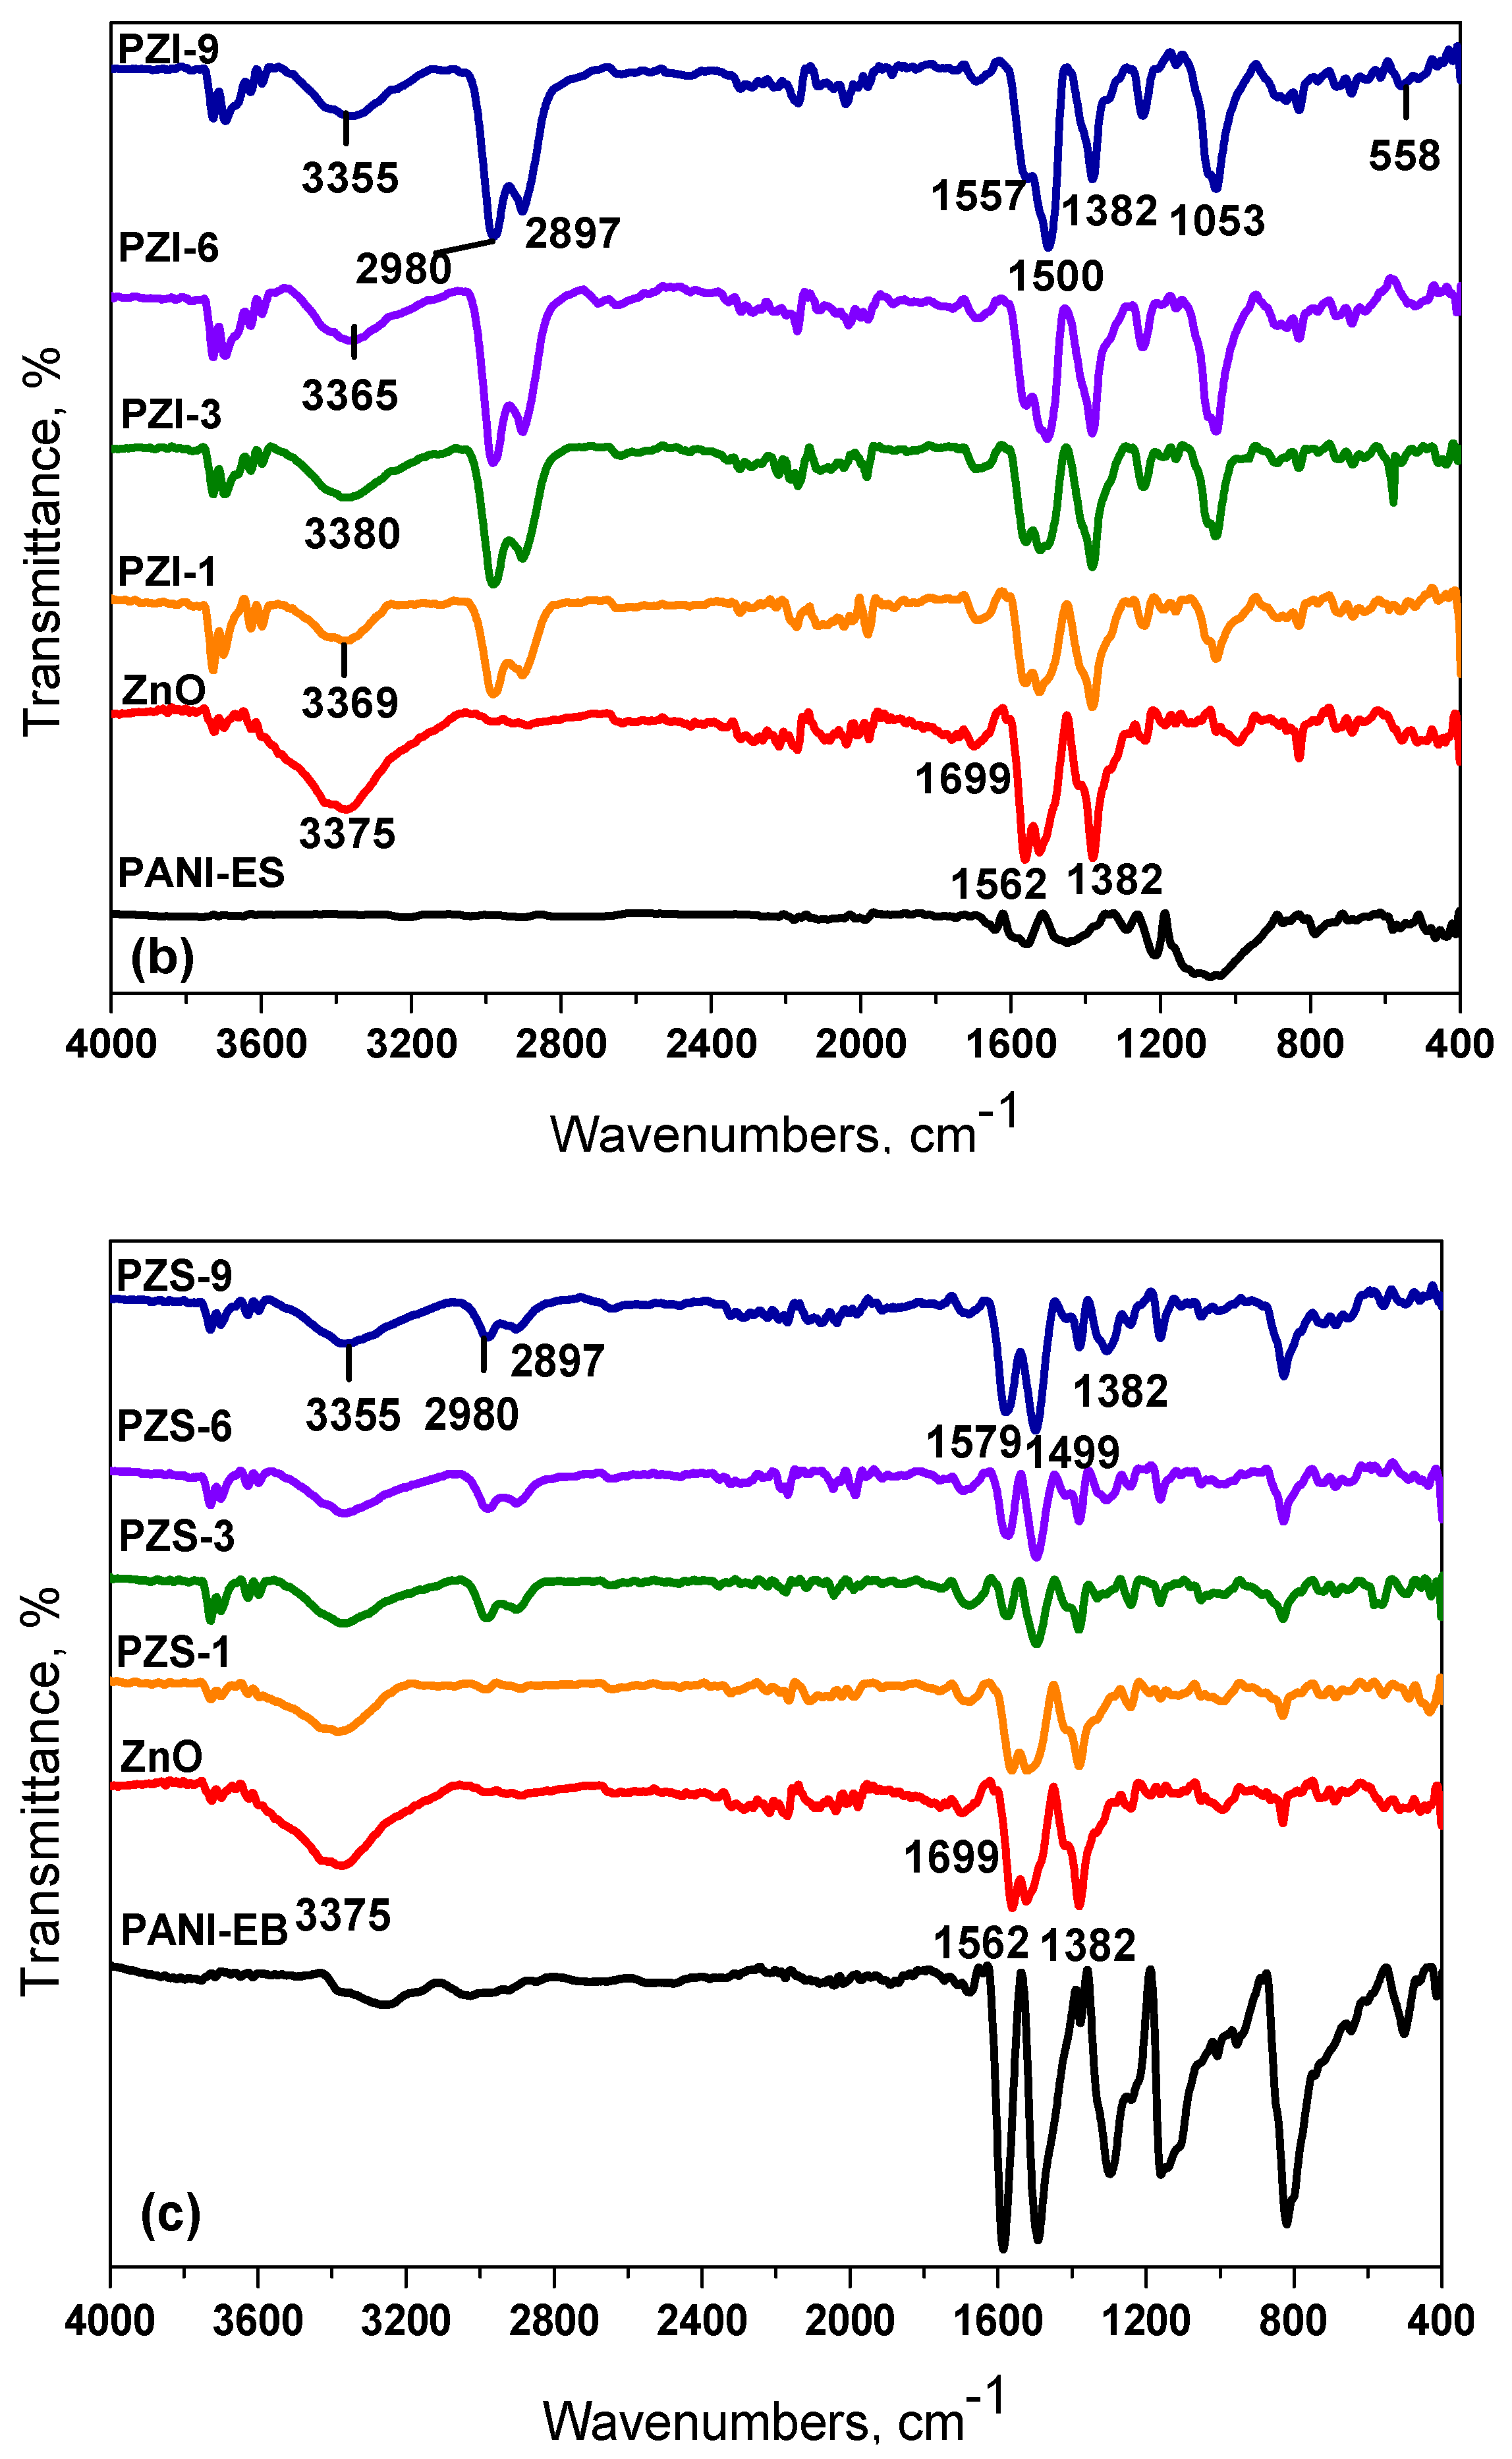
FT-IR spectra of ZnO and PZI composites along with PANI-ES were displayed in Figure 2b. A broad peak centered a maximum at 3375 cm−1 represented the stretching of water molecules in ZnO spectrum, while the maxima was located in the range of 3355–3379 cm−1 in PZI composites [36]. Another peak in the FT-IR spectrum of ZnO at 1699 cm−1 corresponded to H–O–H bending due to the presence of H2O in the ZnO nanoparticles and PZI composites [37]. The peaks at ~2980 cm−1 and ~2897 cm−1 were formed due to C–H stretching modes of alkyl groups [38,39]. The asymmetric and symmetric C=O stretching modes of zinc acetate residue on the surface of the particles were manifested by the peaks at 1562 cm−1 and 1382 cm−1, respectively [40]. In PZI samples, the intensity of these alkyl modes was much higher compared to ZnO. The peaks at ~1380 cm−1, ~1500 cm−1 and ~1550 cm−1 corresponded to C-N stretching, C=C stretching of benzenoid rings and C=C stretching of quinoid rings, respectively [41]. These peaks were slightly shifted compared to PANI. The reason could be attributed to the existing of interactions such as the formation of hydrogen bonding between NH group of PANI and ZnO surface [15,36]. Moreover, a peak overlap was observed at ~1560 cm−1 for quinoid and symmetric C=O stretching peak. The peak related to benzenoid unit in PANI-ES shifted to ~1500 cm−1 in PZI composites and confirmed the presence of PANI in composites. It could be clearly seen that the intensity of this peak increased in composites containing higher PANI amounts. The residual sulfate peaks were slightly shifted to lower wavenumbers located at ~1050 cm−1 and ~560 cm−1 in PZI spectra. Furthermore, the peaks were positioned in the region of 430–870 cm−1 were assigned to Zn–O–Zn and Zn–O stretching vibrations and presented in ZnO and PZI composites [14].
All peaks detected in PZI composites were also recorded in the spectra of PZS composites (Figure 2c). The strong peaks at ~1500 cm−1 and ~1585 cm−1 corresponded to benzenoid and quinoid units, respectively. Besides, the peak represented quinoid unit was clearly evident as compared to PZI composites.
3.1.2. Raman Spectroscopy
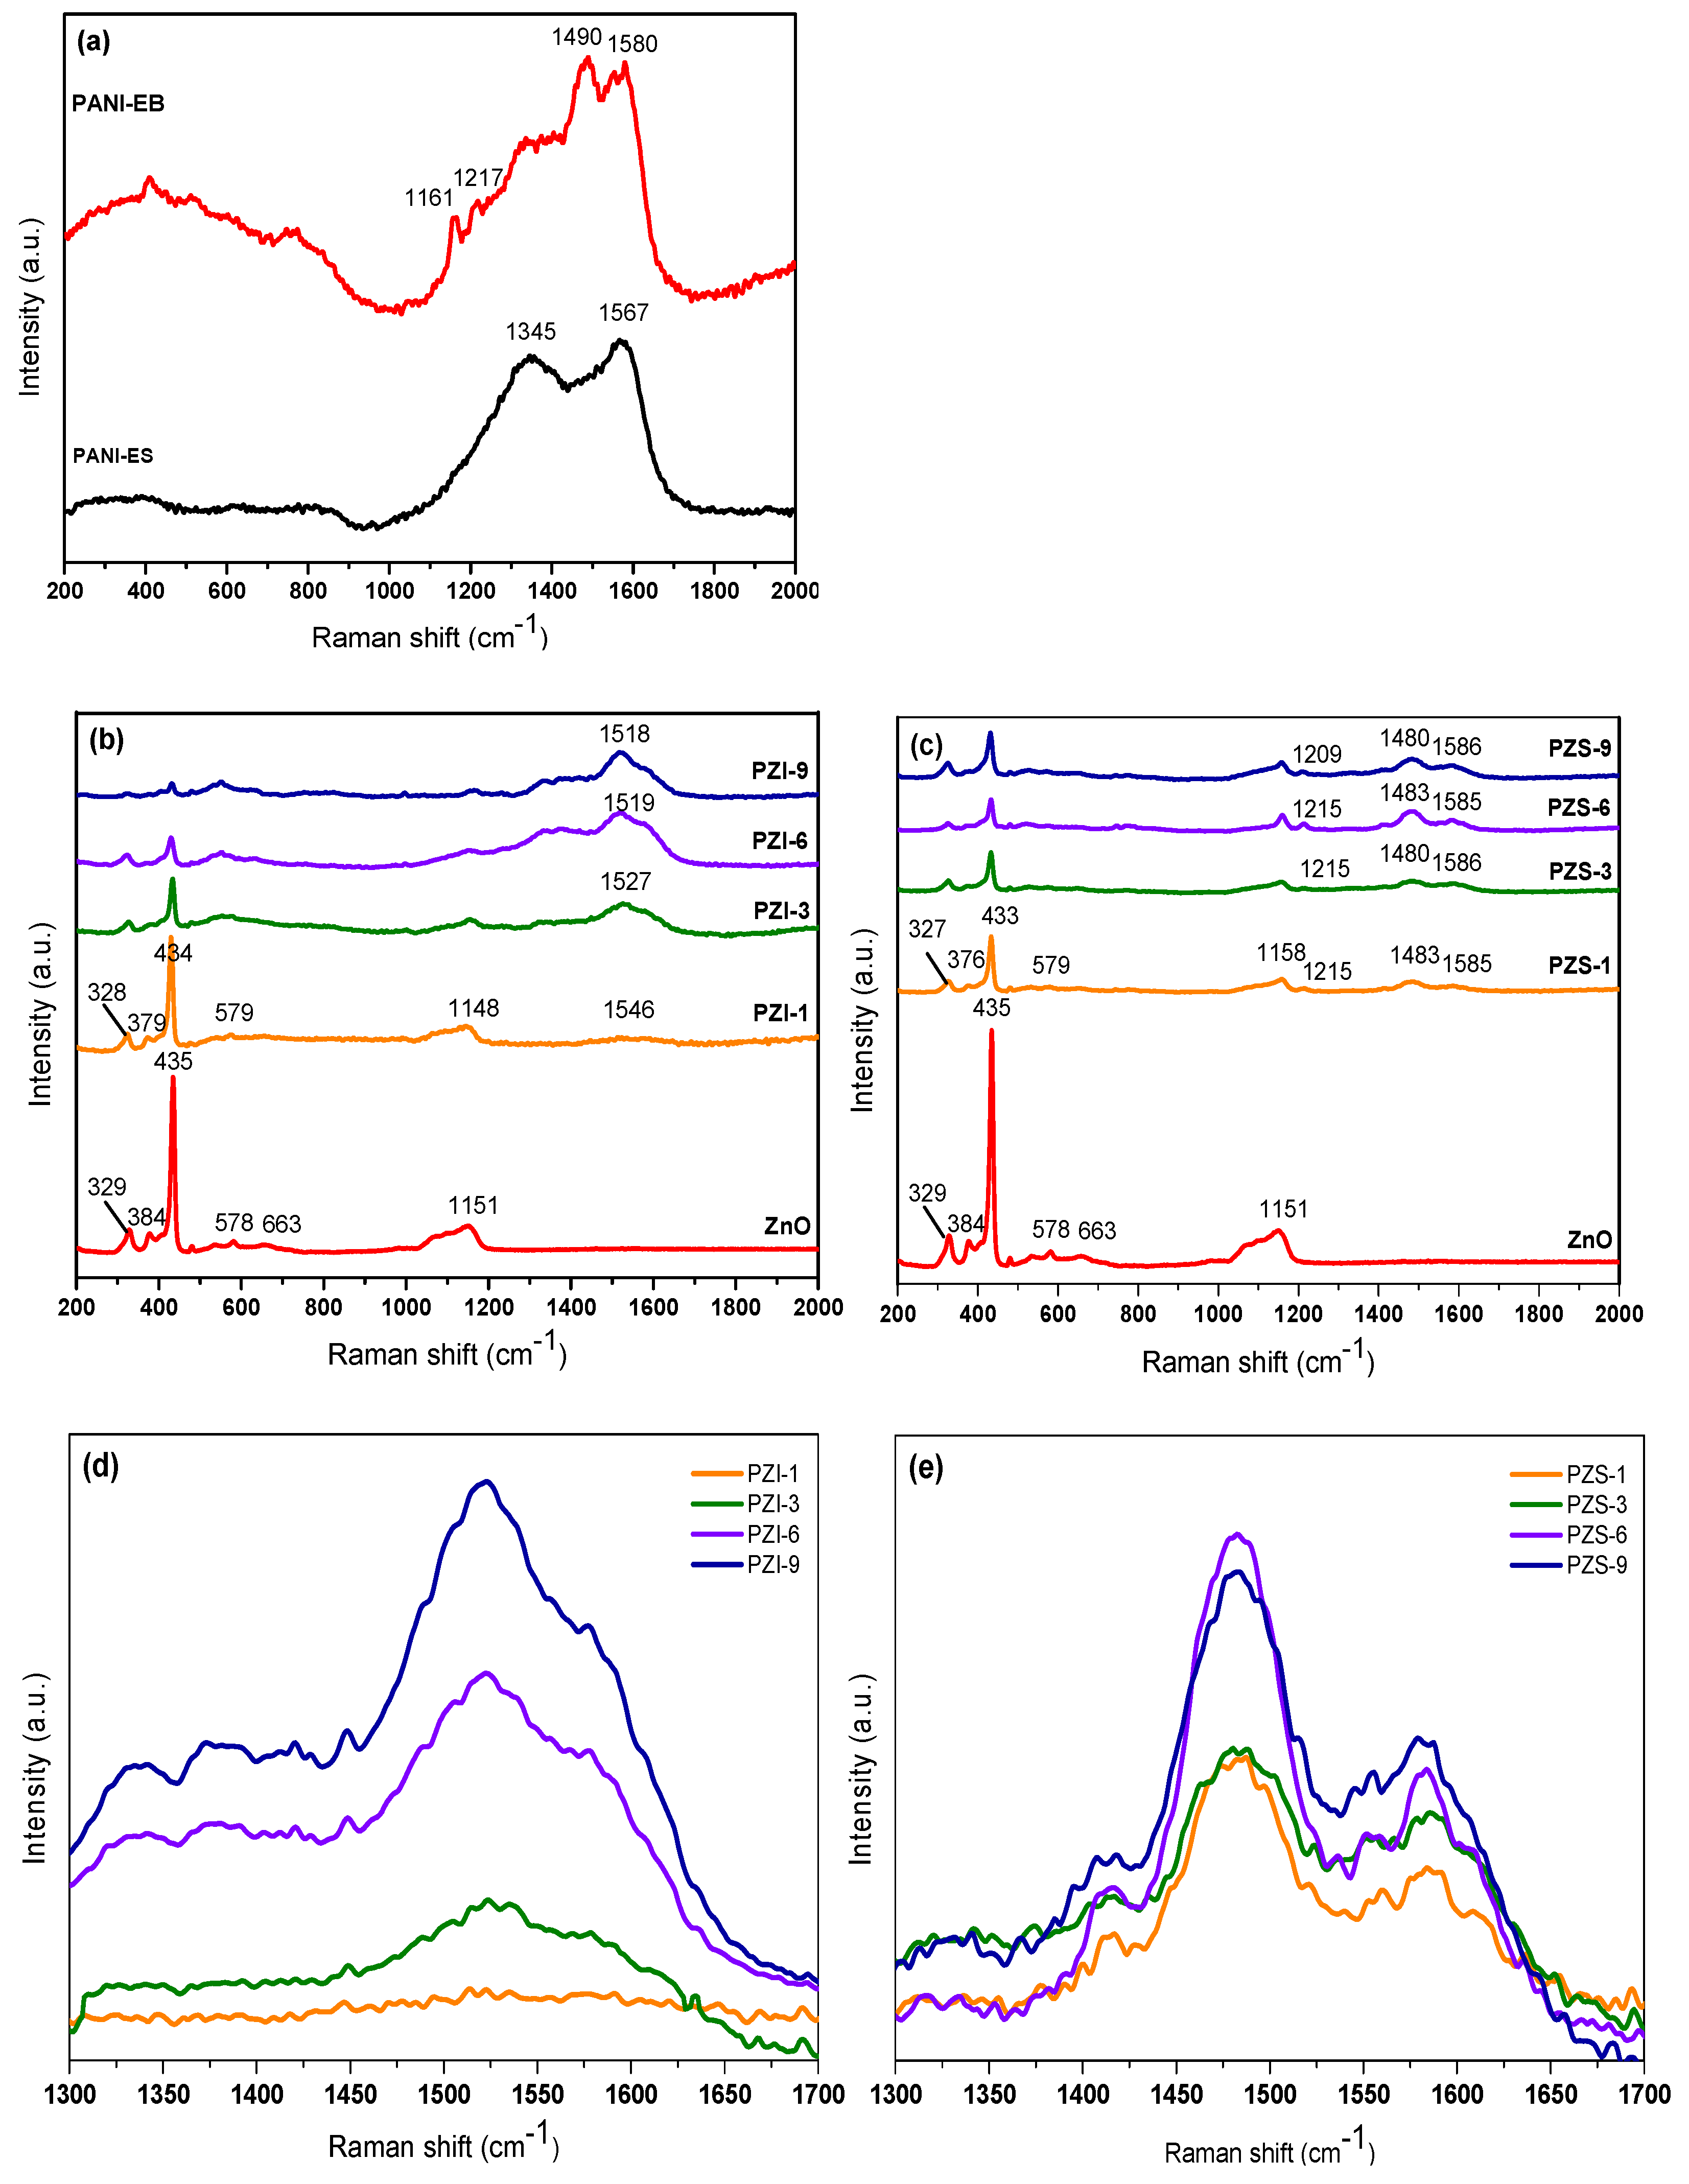
Raman spectrum of PANI-ES displayed two main bands at 1567 cm−1 and 1345 cm−1 corresponded to C=C stretching of quinoid units and C–N+• stretching (Figure 3a). The quinoid unit band was shifted to a slightly higher frequency (1580 cm−1) and the radical cation band C–N+• was vanished in PANI-EB. The vibration bands observed at 1161 cm−1, 1217 cm−1 and 1490 cm−1 were assigned to C–H bending in-plane of benzenoid or quinoid unit, C–N bending in-plane of benzenoid unit and N=C=N stretching in quinoid units, respectively [41,42,43,44].
Raman spectrum of ZnO displayed a main and sharp band located at 435 cm−1 representing E2 (high) mode as expected (Figure 3b). The source of this band was the oxygen atoms present in ZnO. The other bands at 329 cm−1, 384 cm−1, 578 cm−1, 663 cm−1 and 1151 cm−1 could be attributed to 2E2 mode, A1 (TO) mode, A1 (LO) modes, TA+LO, contributions of 2A1 (LO) and 2E1 (LO) modes, respectively [42,45]. The bands related to ZnO modes slightly shifted towards a lower frequency in PZI-1 spectrum, while quinoid unit band of PANI-ES was observed as a broad band at 1546 cm−1. This shift in quinoid unit band of PANI-ES suggested a decrease in the conjugated structure of PANI-ES and interaction between PANI and ZnO [43]. Incremental increase of PANI ratio in PZI composites amplified the intensities of the characteristic bands of PANI-ES along with decreases in the intensities of ZnO bands. This situation had also been observed especially in PZI-9 spectrum and the quinoid unit band of PANI-ES especially shifted to 1518 cm−1. On the other hand, PANI-EB bands at 1214 cm−1, 1487 cm−1 and 1584 cm−1 shifted to lower frequencies and the band at 1161 cm−1 disappeared in the Raman spectrum of PZS-1 (Figure 3c). In Raman spectrum of ZnO, the bands of 2E2 mode, A1 (TO) mode, E2 (high), A1 (LO) mode, TA+LO and 2E1 (LO) modes shifted to 327 cm−1, 376 cm−1, 433 cm−1, 579 cm−1 and 1158 cm−1, respectively. Moreover, the observed band intensity increases in PANI-EB could be correlated with the increasing PANI amount in composites.
From a general perspective, the intensities of the characteristic bands of PANI-ES and PANI-EB increased with increasing PANI amount in PZI and PZS composites (Figure 3d,e). The intensity of the characteristic ZnO Raman bands (especially E2 (high) band at 433 cm−1) was reduced in both PZI and PZS composites compared to bare ZnO the reason of which could be explained by the formation of a strong interaction between PANI and ZnO. Furthermore, the band related to the oxygen deficiency in ZnO at ~580 cm−1 was present in all PZI and PZS composites indicating surface defects [41]. This interaction was supported by FT-IR spectral features confirming the presence of PANI in PANI-ZnO composites.
3.1.3. XRD Spectroscopy and Crystal Structure
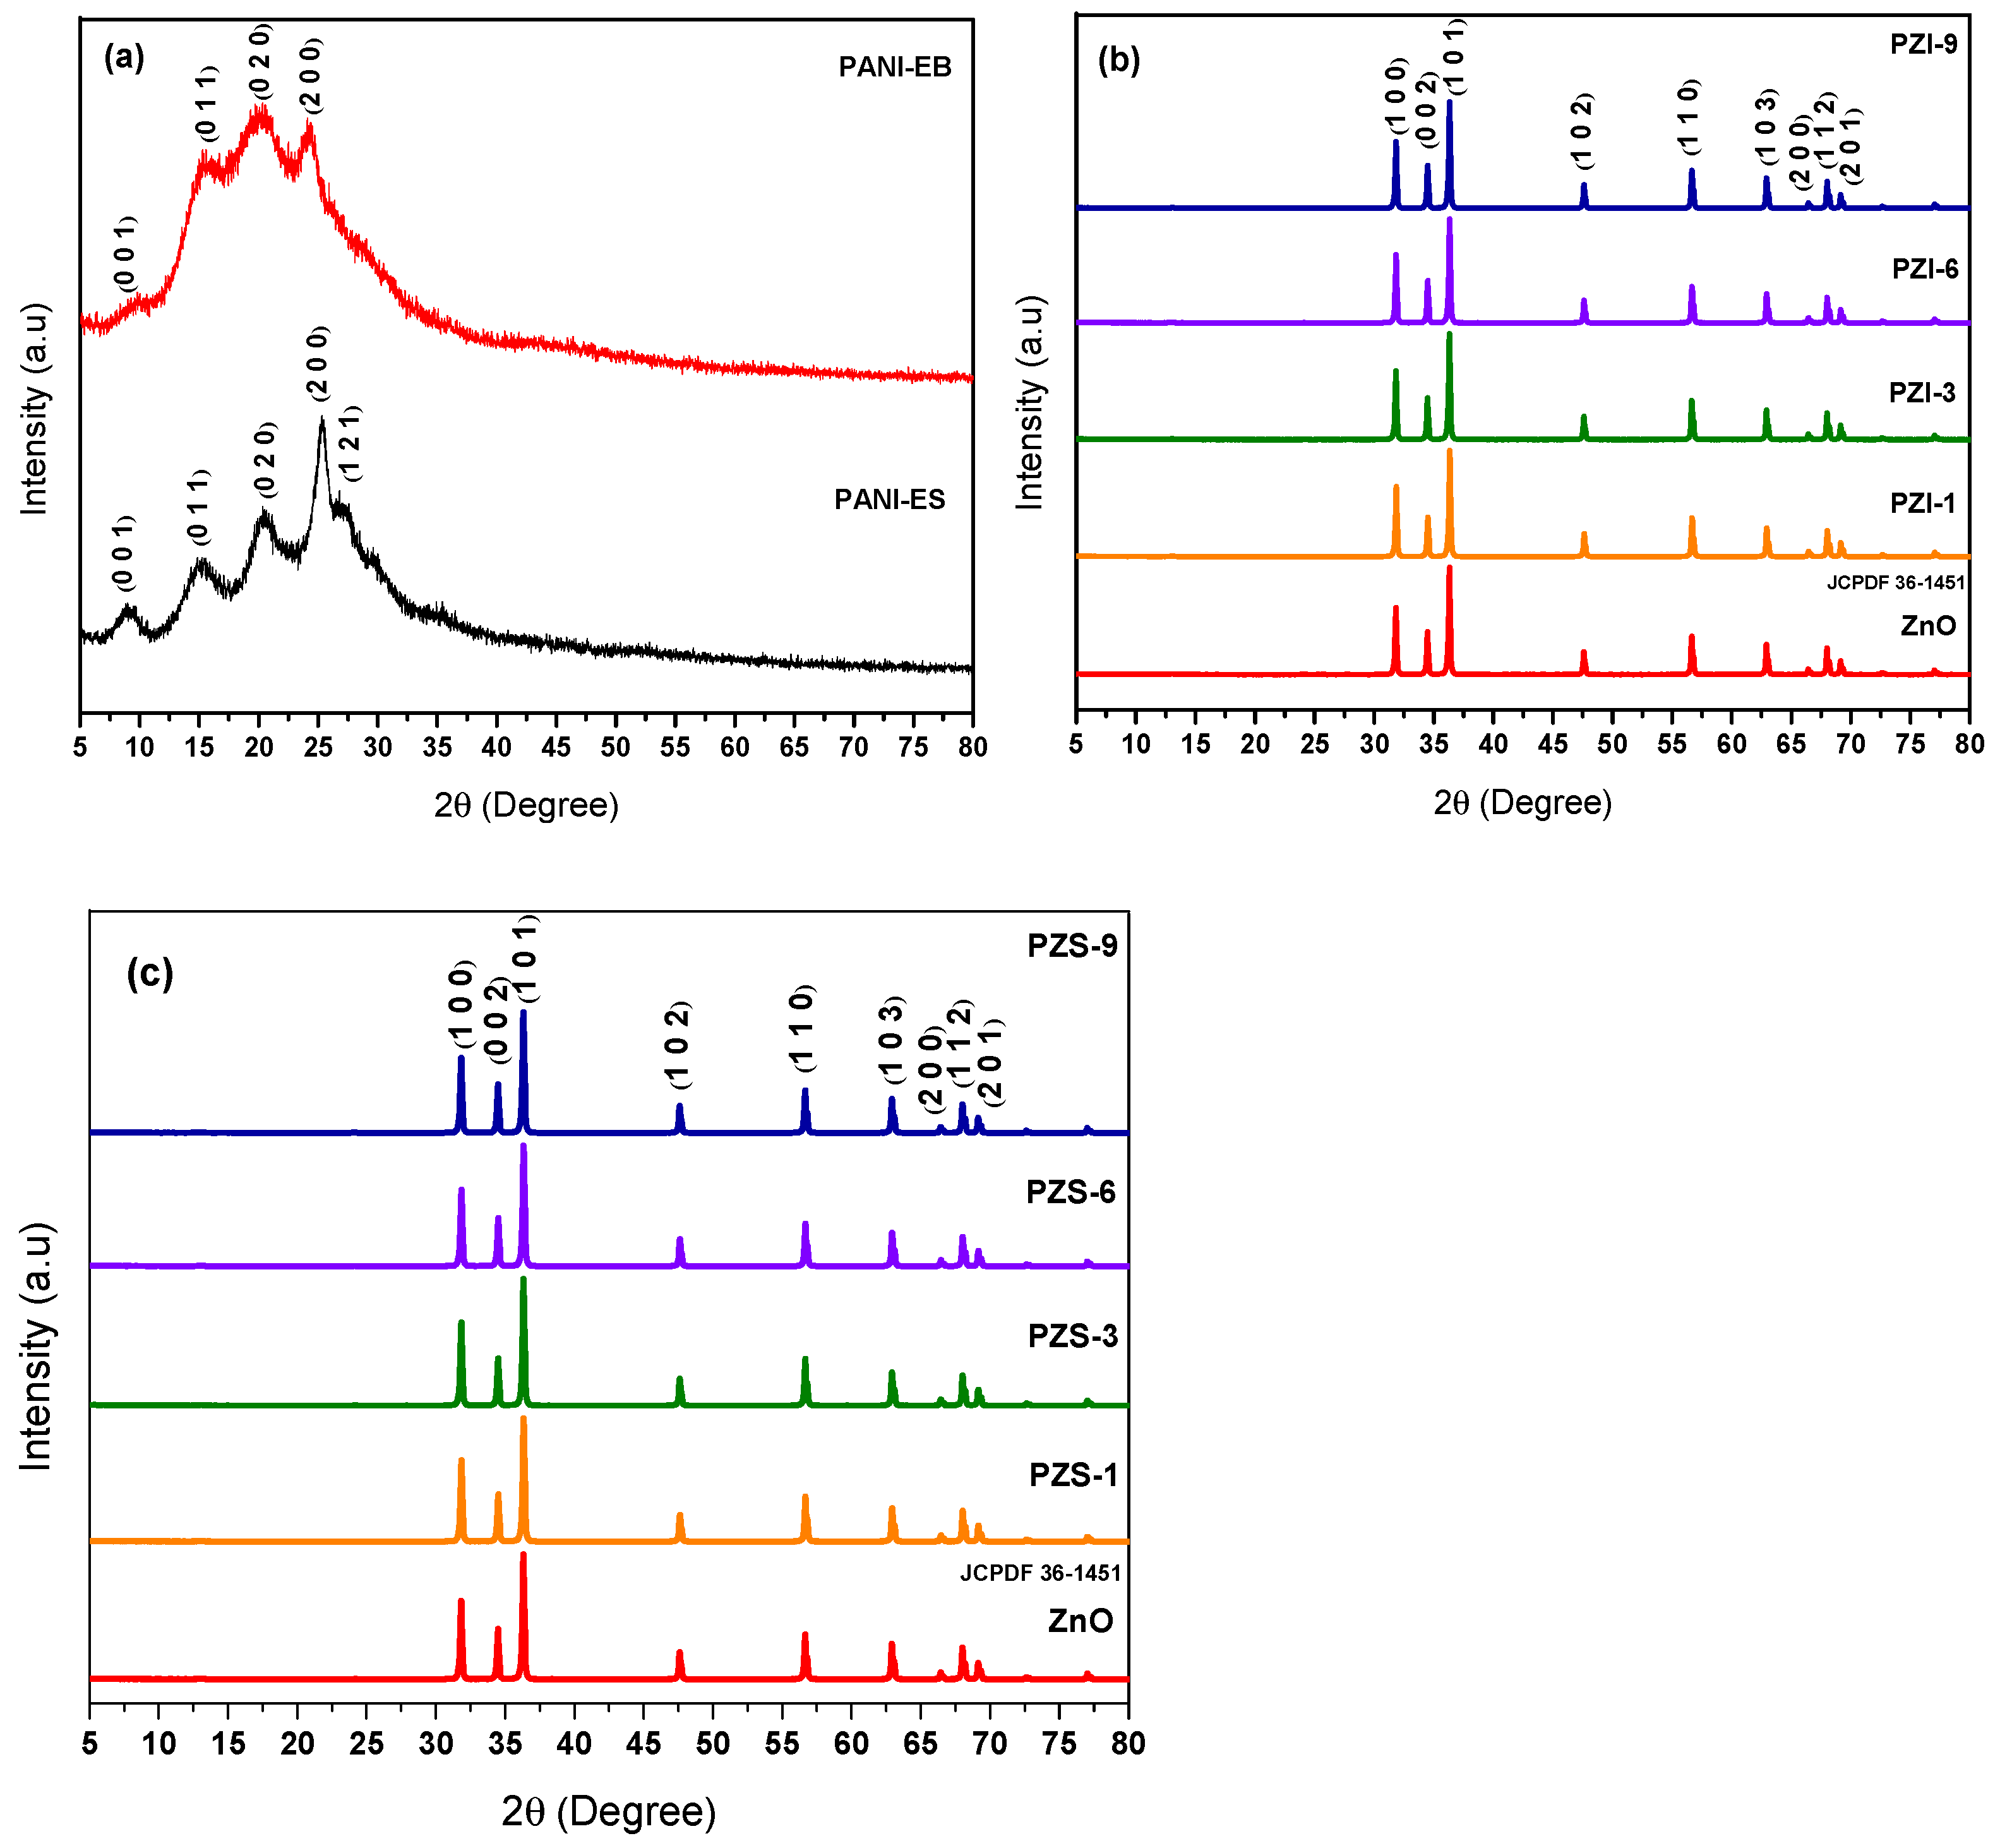
The XRD diffractograms of PANI-ES and PANI-EB showed several weak peaks with reasonable intensities (Figure 4a). The peak diffracted at an angle of 2θ = 20.34° and 2θ = 5.30° (d spacing of 4.366 Å and 3.520 Å, respectively) showed low crystallinity of the conductive polymers due to the repetition of benzenoid and quinoid rings in PANI chains [46]. PANI-ES and PANI-EB expressed a semi-crystalline phase. The characteristic peaks of PANI-ES were present in the region of 2θ = 5°–30°. These peaks located at 2θ = 8.99°, 15.42°, 20.34°, 25.30° and 27.18° corresponded to (0 0 1), (0 1 1), (0 2 0), (2 0 0) and (1 2 1) reflections in PANI-ES which were slightly shifted and broadened in PANI-EB [47]. XRD diffractogram of PANI-EB displayed the peaks at 2θ = 9.82°, 15.82°, 20.31° and 24.38° whereas the peak at 2θ = 27.18° could be related to the acidity of the medium [47]. The diffractogram of ZnO (JCPDF 36-1451) exhibited the characteristic peaks at 2θ = 31.92°, 34.58°, 36.40°, 47.68°, 56.72°, 62.99°, 66.52°, 68.08° and 69.20° corresponding to (1 0 0), (0 0 2), (1 0 1), (1 0 2), (1 1 0), (1 0 3), (2 0 0), (1 1 2) and (2 0 1) planes of zincite, respectively.
The XRD diffractograms of PZI and PZS composites displayed the presence of ZnO peaks with no remarkable shifts (Figure 4b,c). The reason of unobservable PANI peaks could be attributed to the suppression exerted by high intensity of ZnO peaks related to the interaction of ZnO and PANI via hydrogen bonding between H–N and oxygen of ZnO and the low amount of PANI concentration in the composites [46]. The intensities of the peaks related to ZnO were gradually decreased in composites due to the dilution by PANI as expected. The interplanar spacing for ZnO and PANI-ZnO composites were almost the same (~2.472 Å) that corresponded to the spacing between (1 0 0) planes. Based on the diffraction plane (1 0 0) of zincite, the crystallite size (D, nm) of the composites could be calculated by using Scherrer Equation (6) as expressed below:
where K = 0.9, λ = 1.5418 Å for Cu Kα, θ = Bragg angle and β = full width at half maximum intensity (FWHM, radians) [48]. The crystallite size of ZnO was calculated as 46 nm and a very slight decrease was acquired for PANI-ZnO composites. Average 2θ were found to be insignificantly different from each other with an average of 36.32° ± 0.0096 resulting in primary particle size (crystal size) as 45.78 ± 0.44 nm. Therefore, it could be deduced that PANI coating of ZnO surface did not significantly affect the crystallite sizes of the composites mainly existing as agglomerates or forming bridges rather than complete encapsulation [28,42,43].
3.1.4. SEM-EDAX Analysis and Morphological Structure
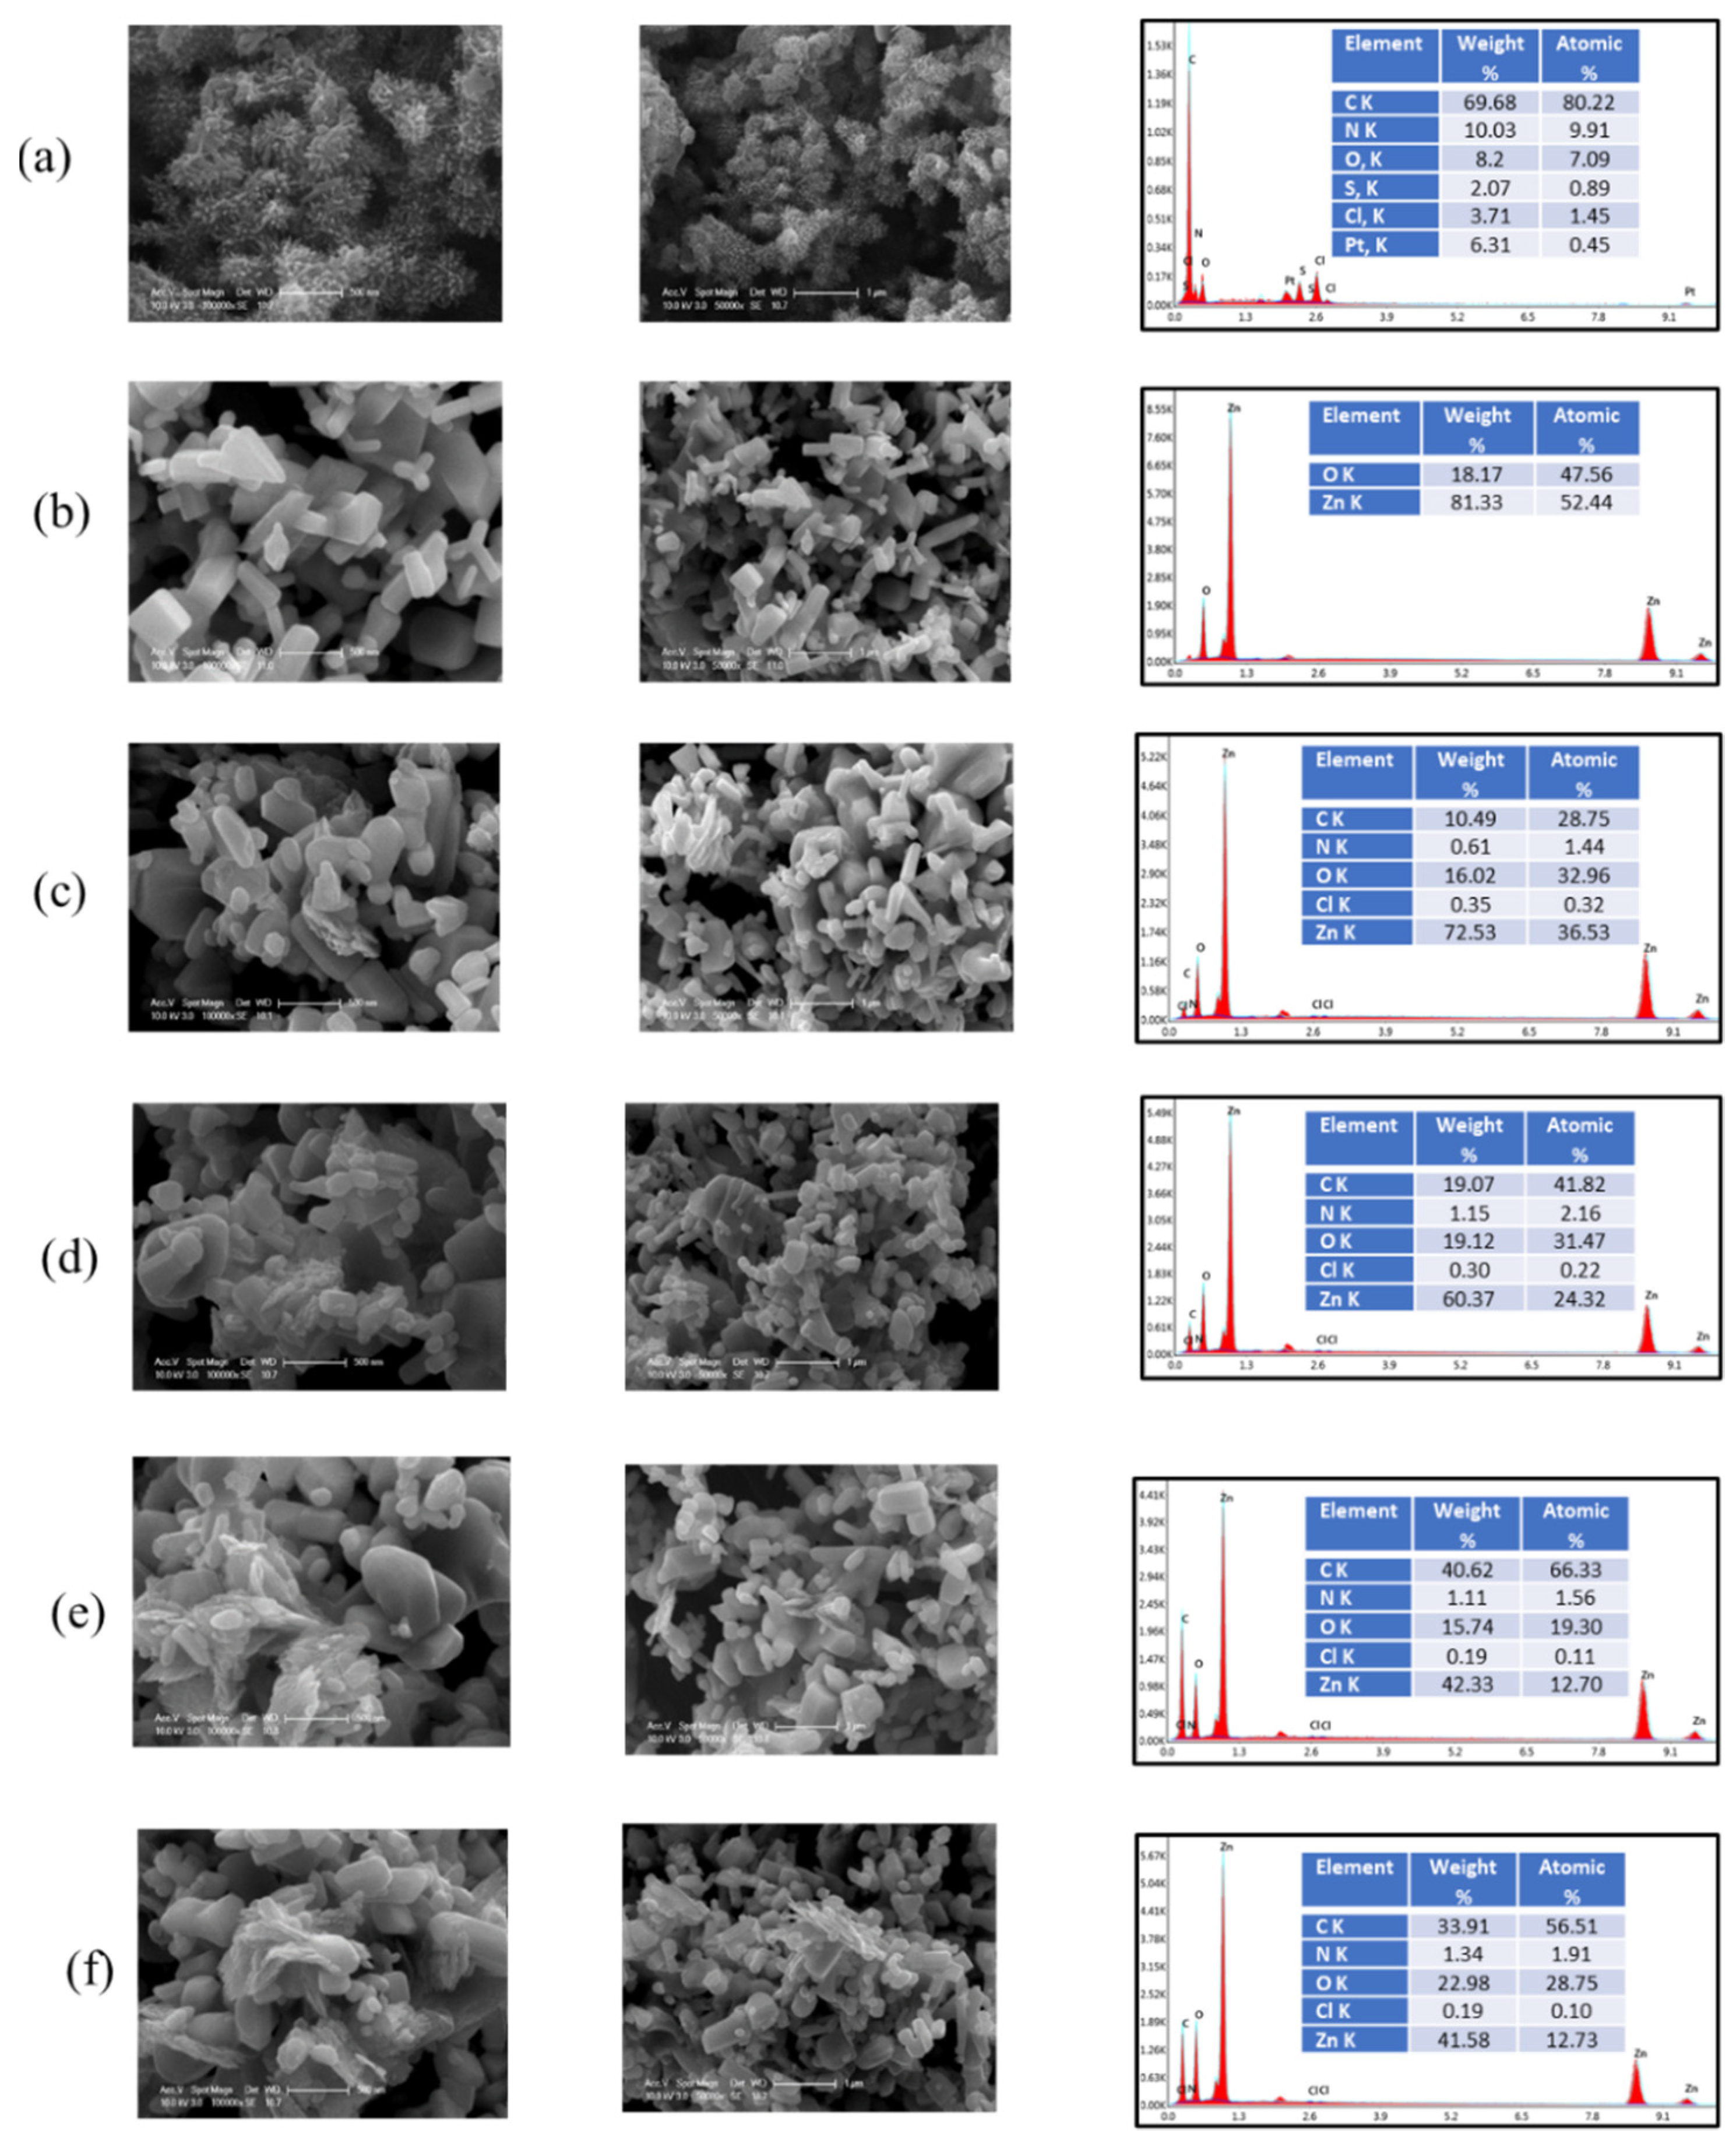
The morphologies of PANI-ES, PANI-EB, ZnO and PANI-ZnO composites were examined at two different magnifications (×50,000 and ×100,000) by SEM analysis accompanied by EDAX analysis to express both quantitative and qualitative elemental data about chemical structure (Figure 5a–f and Figure 6a–f). SEM image of PANI-ES displayed the presence of slightly agglomerated particles in almost uniform and homogeneous distribution (Figure 5a). The flower like morphology of PANI-ES particles expressed a dandelion like shape the diameter of which could be envisioned as 300–500 nm [49]. The EDAX analysis of PANI-ES indicated the presence of C, N, Cl and S (Figure 5a).
SEM image of ZnO consisted of various polyhedral shapes with particle sizes changing in the range from 100 to 500 nm (presented both in Figure 5b and Figure 6b for easiness of comparison). It should also be indicated that ZnO could display morphological variations with respect to source and surface area properties as shown by SEM images [11].
PZI-1 composite morphology was rather similar to ZnO with a slightly distorted dandelion like shape of polyaniline particles (Figure 5c). The observed change in ZnO morphology was reflected as an enhancement in size of aggregates due to the increase in PANI concentration especially in PZI-6 and PZI-9 where the flower like shape of PANI was slightly distorted. The EDAX spectra of PZI composites indicated the major components as Zn, O and C with low levels of N, and Cl elements. This finding confirmed the existence of both PANI and ZnO in PZI samples. The EDAX results also implied that PANI amount was effective on the weight percentage of carbon in PZI-6 and PZI-9. Even though no impurities were observed in all EDAX spectra it should also be emphasized that the compositional differences mostly relied on the sampling point rather than the actual variations.
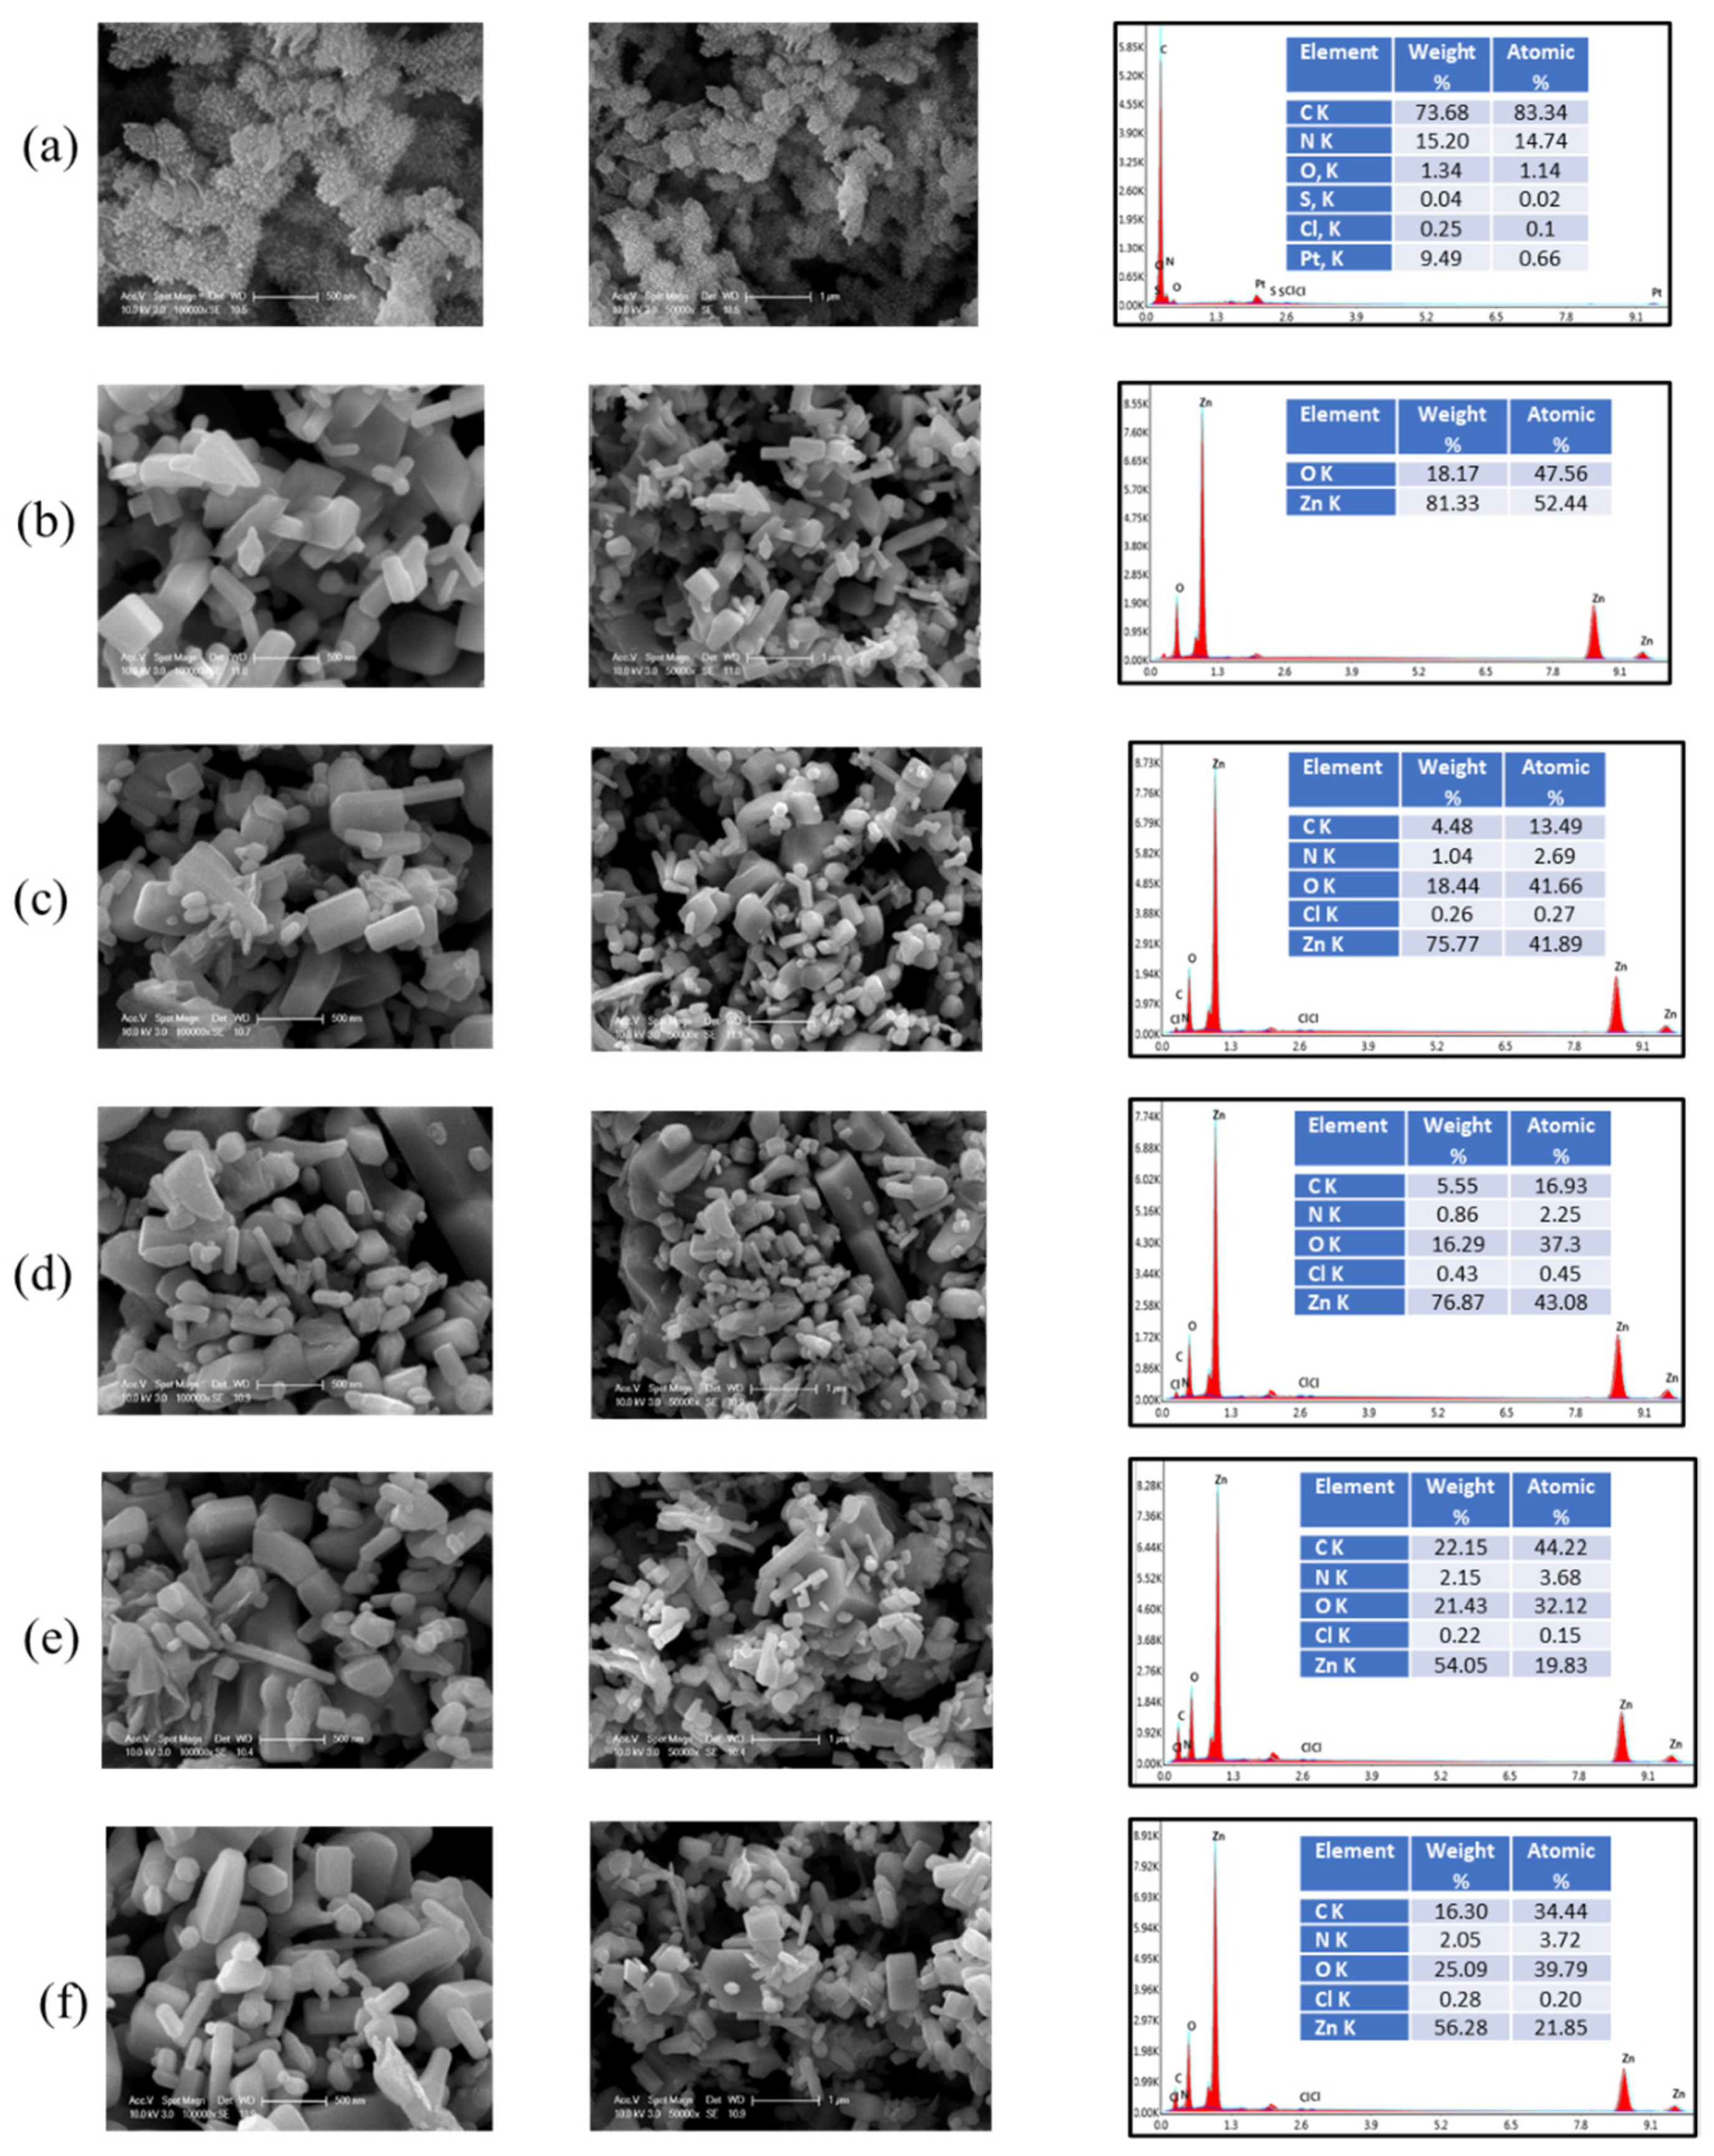
SEM image of PANI-EB expressed the presence of dandelion-like shaped particles revealing a more condensed distribution thereby higher agglomeration compared to PANI-ES specimen (Figure 6a). The dense structure of PANI-EB could be attributed to the change in crystallinity of the polymer after conversion as compared to PANI-ES [50]. The average diameter size of the dense-shaped dandelions was observed at ~300 nm. The EDAX analysis of PANI-EB also indicated the presence of C, N and Cl. The weight percent of Cl remarkably decreased and reached to a nearly negligible value in PANI-EB. As well, sulfur completely vanished in PANI-EB and this finding also confirmed FT-IR results as explained above.
PZS-1 showed polyhedron particles due to slight surface modification of ZnO with PANI-EB resulting in deformation of flower like shape of PANI-EB that could hardly be detected in the image of PZS-1 although the existence of PANI-EB could be clearly verified in EDAX spectra (Figure 6b). Agglomeration phenomena of PZS composites increased with respect to increase in PANI-EB concentration due to prevailing interactions between PANI-EB and ZnO [28].
SEM images of composites displayed the presence of PANI polymer chains in between ZnO particles either as partial encapsulation form or extending in the periphery domain of ZnO particles. Furthermore, a major outcome could be that low PANI coating of PZS was more evident compared to PZI composites. The reason could be attributed to the poor hydrogen bonding on the surface between PANI molecules and ZnO nanoparticles.
3.2. Photocatalytic Activity Experiments
Due to the possibility of various reactions prevailing between components, mono- and binary systems were defined as follows:
Interactions under irradiation; (i), light and sole MB revealing direct photolysis of MB to be described by UV-vis spectral features, (ii), light and sole PANI specimens expressing stability under irradiation followed by UV-vis spectral analysis, (iii), light and “MB and photocatalyst specimens” indicating photocatalysis described by UV-vis spectral analysis, parameters as well as kinetic modeling.
Interactions under dark conditions: (i), sole PANI specimens expressing stability under dark conditions followed by UV-vis spectral analysis, (ii), MB adsorption onto all photocatalyst specimens revealing surface interactions followed by UV-vis spectral features.
3.2.1. Direct Photolysis of MB
UV-vis spectrum of MB displayed one main absorption band with a maximum at λ = 664 nm (A664) with a shoulder at λ = 613 nm in visible region, while two minor bands were located at λ = 246 nm (A246) and λ = 292 nm (A292) in the UV region. The conjugation system between the dimethylamines through sulfur and nitrogen atoms in substituted aromatic rings were responsible for the chromophores and auxochromes present in MB structure (SI Part 1, Figure S2). The small shoulder at λ = 613 nm is the well-known effect of dye dimmer [51,52]. The absorption peaks located in the UV region indicated the conjugated system of phenothiazine species and benzene ring structures. Upon irradiation (Io = 1.65 × 10¹⁶ quanta/sec), direct photodegradation of sole MB (10 mg/L) was not expected due to the non-overlapping trend of BLF lamp output spectrum and MB absorption spectral features. UV-vis spectral features were monitored for 60 min and no change was attained as expected irradiation (SI Part 1, Figure S2).
3.2.2. Adsorptive Interactions in the Absence of Light
Since photocatalytic degradation of substrates occurs predominantly on the photocatalyst surface, adsorptive interactions of the components hold prime importance. Primarily, these interactions prevailing between MB and either PANI-ES or PANI-EB were investigated under dark conditions.
Insignificant amount of MB (A664: ~1%) was retained on the surface of both PANI specimens. The pH of zero-point charge (pHpzc) of PANI-ES was 8.25 while PANI-EB exhibited negative zeta potential at all pH values due to dedoping process via alkali treatment [53]. Since MB as a cationic dye was positively charged, both repulsive (PANI-ES and MB) and attractive (PANI-EB and MB) electrostatic interactions should be considered under working pH ~4.5 conditions. However, insignificant initial adsorption extents could simply imply that the binary system was far beyond equilibrium conditions as expected [54]. Due to structural properties of PANI specimens (amine and imine groups) and MB, N to N hydrogen bonding and π-π attractions should also be considered [53,55]. However, upon use of sole ZnO (pHzpc = 9), initial adsorption extent of MB (A664) was 15% although both counterparts were positively charged most probably due to dominating hydrophobic and van der Waals forces. The possible role of very low surface area of ZnO (BET surface area = ~5 m2/g) should also be encountered [5].
In the presence of PANI/ZnO composites the extent of surface interactions did not display any consistent trend with respect to both the preparation method and PANI percentage (SI Part 1, Figure S3). All UV-vis absorbing groups of MB displayed almost similar adsorptive behavior towards the surfaces of the photocatalyst specimens. Since MB is known as a cationic dye expressing a positive charge, all of the surface interactions were simplified by excluding pH dependent variations in electrostatic attractions. However, one major difference was attained upon use of PZI-1 in comparison to the other specimens. Highest adsorption was attained through attractions between the color forming groups and PZI-1 surface followed by a decreasing order of A292 and A246 reflecting the binding sites of MB. Moreover, PZI3-PZI-9 samples displayed almost similar adsorption extents with ZnO whereas PZS specimens expressed sample specific behavior in all UV-vis parameters. The most remarkable difference was observed for PZS-6 and PZS-9 specimens implying all counterparts present in the structure of the composites expressed diverse tendencies towards MB. From a general perspective, PZS specimens were quite different than PZI specimen indicating that the preparation method played the major role in surface interactions that was the prerequisite step for surface-oriented nature of photocatalysis.
3.2.3. Photocatalytic Degradation of MB using PANI-ZnO Specimens
Fundamentally, upon irradiation with UV/visible light, semiconductors catalyze redox reactions in presence of air/O2 and water. Through the formation of reactive oxygen and radical species degradation/decomposition reactions take place. Under the specified reaction conditions, photocatalytic progression was monitored by UV-vis spectral features of MB during exposure of 0–150 min in 10 min intervals using all photocatalyst specimens i.e., PANI-ES, PANI-EB, ZnO and PANI-ZnO composites (Figure 7 and Figure 8).
From a general perspective, A664 gradually decreased indicating the degradation of auxochrome group irrespective of the type of the photocatalyst specimens. Even though A292 and A246 peaks were also gradually diminished revealing the degradation of the conjugated system of phenothiazine species and the benzene ring structures, no new bands were recorded indicating that no further transformation products or intermediates were formed.
During photocatalysis, the color of MB solution became less intensive due to hypochromic effect degrading all or part of the auxochrome groups related to methyl or methylamine under UV light irradiation [56]. The reason of the blue-shift could be explained by N-demethylation of MB via oxidative degradation (SI Part 1, Figure S4). These absorption bands recorded at wavelengths as 655–648 nm (tirr = 20 min), 634–620 nm (tirr = 40 min), 606–614 nm (tirr = 60 min) and 604 nm (tirr = 90 min) were attributed to Azure B, Azure A, Azure C and thionine (N-demethylated intermediates of MB), respectively [56,57,58,59].
In a similar fashion, A246 and A292 also decreased significantly and vanished completely upon prolonged irradiation periods i.e., in 150 min. There were no new absorption bands in UV spectra indicating complete oxidative degradation of the phenothiazine species has occurred and any intermediate containing a phenothiazine moiety was not formed [56]. The maximum intensity diminished slightly, without revealing any blue-shift in the UV-vis spectrum of both PANI-ES and PANI-EB specimens.
The underlying mechanism of photocatalytic degradation of MB was presented by Lin and colleagues revealing various intermediates and final products initiated by sole attack of hydroxyl radical directly to the N-S- conjugated linkage of the aromatic sub-groups. The plausible pathway was explained by irradiation time dependent formation and successive removal of substances defined by ESI-MS m/z values primarily as C8H11N2SO3 and C8H12N2. Upon further irradiation periods, C6H4NSO5, C6H6SO3, C6H10O2, C8H11NO and C6H6O2 were formed which were also degraded to C3H6O2 and C3H4O4 [60]. Upon use of the specified specimens, considering the hydroxyl radical as the main oxidative species a similar mechanism could be expected. Each of these compounds could also contribute to the UV-vis spectral features under continuously and simultaneously operating formation and removal pathways during photocatalysis.
Prior to treatment of MB using either PANI-ES or PANI-EB, stability tests of these specimens were performed both under dark and irradiation conditions. Similar reaction settings (reactor configuration) were applied using a constant dose of 0.25 mg/mL in aqueous solution for a period of 60 min. Possible release of any organics were monitored by UV-vis spectra following double filtration through 0.45 µm and 0.20 µm membrane filters. No detectable absorbance was recorded indicating that both PANI-ES and PANI-EB were stable under the specified experimental conditions.
3.2.4. Kinetics of Photocatalytic Degradation
As evidenced by spectral features (Figure 7 and Figure 8), all UV-vis parameters (A664, A292 and A246) displayed logarithmic decay profiles (SI, Part II, Figures S5–S9) following pseudo first-order kinetic model expressed by Equation (7):
where,
- R: pseudo first order rate (cm−1min−1),
- Ao: initial absorbance of MB expressed as A664,o, A292,o and A246,o,
- A: absorbance of MB expressed as A664, A292 and A246 at time t,
- t: irradiation time, min,
- k: pseudo first order reaction rate constant, min−1.
- Half-life (t1/2, min) could easily be calculated by the following equation, t1/2 = 0.692/k.
- Kinetic model parameters (R2 > 0.85) were presented in Table 1.
Upon use of ZnO, the decolorization rate constant of MB (A664) was calculated as k = 5.39 × 10⁻² min−1 and rate as R = 9.70 × 10⁻² cm−1 min−1. Degradation of aromatic domains revealed rate constants as k = 3.32 × 10⁻² min−1 and 2.36 × 10⁻² min−1 for A292 and A246, respectively. Respective half-life (t1/2, min) values for A664 were in the range of 9.73–12.9 and in the following ranges as 17.9–22.2 and 27.9–35.9 for A292 and A246, respectively.
PANI-ZnO composites expressed enhanced photocatalytic activities in an inconsistent trend irrespective of the photocatalyst specimen types. PANI acts as a photosensitizer with a narrow band gap, Ebg = 2.8 eV since the excitation between HOMO and LUMO levels is low [24,26]. The reason could also be explained by an electron transfer from the valence band of PANI to the conduction band of ZnO under irradiation because of their excellent matching of energy levels [43]. Thus, hydroxyl radicals were synchronously formed which were the most important reactive oxygen species in photocatalytic degradation processes [14]. Comparison of two methods revealed that the composites prepared by hybridization method (PZS’s) exhibited better photocatalytic activity compared to the photocatalyst specimens prepared by In-Situ polymerization method (PZI’s). A plausible explanation could be related to the SEM images of PZI composites displaying more aggregated particles than PZS composites. The fastest decolorization rate constant was achieved upon use of PZS-3 among PZS composites and PZI-6 among PZI composites.
Upon use of all specimens the trend in photocatalytic degradation rate constants could be presented in a decreasing order as:
A664: PZS-3 > PZS-6 > PZS-1 > PZI-6 > PZI-3 > PZI-1 = PZS-9 > PZI-9 > ZnO.
A292: PZS-3 > PZS-6 > PZS-1 > PZI-6 > ZnO > PZS-9 > PZI-3 > PZI-1 > PZI-9.
A246: PZS-6 > PZS-3 > ZnO > PZS-1> PZS-9 > PZI-6 > PZI-3 > PZI-9 > PZI-1.
It could also be plausible that through “breakage” of MB structure via N- and S- linkages, formation of new aromatic structures possibly depressed the removal kinetics of A292 and A246.
Photocatalytic activity results showed that PANI amount played an important role on the photocatalytic decolorization process. The lowest photocatalytic rate constants were attained in the composites containing the highest PANI concentration (PZI-9 and PZS-9) prepared by both methods due to aggregation issue observed in SEM images. The decolorization rate constants attained upon use of PZS-9 and PZI-1 composites were the same as k = 5.73 × 10⁻² min−1 (Table 1). In addition, the surface coverage of these composites was also the same (~17%) and slightly lower than the other composites and ZnO. The PANI amount in composites influenced the adsorption extents of MB due to the different preparation methods. The composite containing the highest PANI concentration by hybridization method while the one containing the lowest PANI amount by In-Situ oxidation polymerization method exhibited the lowest initial adsorption. In PZS method, PANI-EB was used to prepare PZS composite while protonated form of PANI (PANI-ES) was used in PZI method. The reason could be explained by the fact that PANI-EB was more efficient in adsorption of anionic dyes than PANI-ES [22]. This implied that the lower molar ratio of PZS sample containing PANI-ES exhibited the same surface coverage with PZS-9. Besides pre-adsorption conditions, under irradiation, surface interactions via adsorption and desorption processes would take place continuously within the species present in the reaction medium.
Furthermore, the degree of MB decolorization by using PANI-ES, PANI-EB, sole ZnO and PANI-ZnO composites (Figure 7 and Figure 8) was also calculated by the following Equation (8):
where A664,o = initial absorbance of MB and A664 = absorbance of MB at irradiation time t.
Decolorization, % = ((A664,o − A664)/A664,o)) × 100
A slight decolorization percentage of MB was observed in the presence of PANI-ES, ca 14% under 60 min UVA irradiation. This result proved that PANI-ES had a minor ability to decolorize MB under UV light. The removal percentage of PANI-EB was two times higher (ca 28%) than PANI-ES. As the irradiation time increased the decolorization of MB also increased slightly.
Decolorization percentages attained upon use of sole ZnO and PANI-ZnO composites were found to be directly proportional to irradiation time. A prolonged period up to 120 min resulted in an almost complete decolorization of MB upon use of sole ZnO and PANI-ZnO composites. After 150 min irradiation time, complete decolorization was achieved due the cleavage of peaks that belong to the auxochrome and chromophore groups. From a general perspective, decolorization percentage of MB from aqueous solution upon use of PANI-ZnO composites was slightly higher as compared to sole ZnO following 60 min of irradiation.
Furthermore, the decolorization percentage of MB in the presence of PZI-1 exhibited the highest performance following 60 min irradiation upon use of all PZI samples, while PZS-3 and PZS-6 composites revealed almost highest decolorization percentages. Conversely, the decolorization percentage of MB in the presence of both PZI-9 and PZS-9 composites was considerably lower than other PANI-ZnO composites. The reason could be attributed to the fact that agglomeration expressed a negative effect on photocatalysis by diminishing light absorption thereby influencing the photocatalytic activity [61,62]. This implied that the formation agglomerated particles resulted in a decrease on photocatalytic degradation in agreement with SEM results. Besides, it was also demonstrated that the photocatalytic activity decreased with an enhancement of polymer content in synthesized photocatalysts [29].
Photocatalytic degradation of MB was also related to concentration through using calibration curves mainly revealing molar absorption coefficients. Since MB solution could be considered primarily composed of a monomer structure with a distinct absorption maximum at 664 nm (A664) and absorption coefficient as ε = 39,440 cm−1M−1. In a similar manner, absorption coefficients were calculated as ε = 30,749 cm−1M−1 and as ε = 15,256 cm−1M−1 for A292 and A246, respectively. Degradation efficiencies were found to be ~20% lower than the removal efficiencies expressed by A664, A2924 and A264. The reason could be attributed to the minor blue shifts in spectral profiles especially observed in higher concentrations. Therefore, no explicit correlation could be demonstrated between the removal of UV-vis parameters and MB concentration.
Most of the studies using MB as the model substrate excluded UV spectral features (A292 and A264) and considered only decolorization (A664) as the main reaction pathway to explain decomposition and or degradation. It is highly recommended that decolorization should also be supported by mineralization extents expressed by DOC contents. Moreover, besides Cl−, release of oxyanions of N (NO3−) and S (SO42−) could also be considered as by-products of decolorization. However, under the specified experimental conditions, all of these ions could not be detected most probably due to the adsorptive removal by sequential filtration thereby being below the detection limits of the applied methods.
It should also be mentioned that the main interest in this study was directed to the preparation of the PANI modified ZnO specimens using two different methodologies rather than focusing on the degradation pathways of MB under the specified experimental conditions.
3.2.5. Photocatalyst Dose Effect
Photocatalyst dose effect was investigated using 0.125 g/L, 0.25 g/L and 0.50 g/L of each specimen as PANI-ES, PANI-EB (Figure 9), ZnO (Figure 10) and PANI-ZnO composites (Figure 11 and Figure 12) and MB (10 mg/L) for irradiation periods of 30 min and 60 min. Initial surface coverage extents and degradation of MB was expressed by decolorization as A664.
From a general perspective, dose effect of both PANI specimens reflected the same increasing trend with respect to increase from 0.125 g/L to 0.25 g/L followed by a decrease upon use of 0.50 g/L. Lower doses such as 0.125 g/L exerted specimen specific and irradiation time dependent variations, such as decolorization attained by use of PANI-ES in 60 min which were slightly higher than PANI-EB in 30 min. Decolorization efficiencies attained by using PANI-EB were higher compared to PANI-ES (<15%) irrespective of the dose amount most possibly due to the enhanced electrostatic attractions under both irradiation periods. The lowest decolorization was attained upon use of 0.125 g/L PANI-ES in 30 min and the highest decolorization was observed upon use of 0.25 g/L PANI-EB.
Surface coverage of MB onto either PANI-ES or PANI-EB (mg/g) with respect to increasing dose reflected the following inconsistent trend as:
PANI-ES: 1.99 > 1.14 > 0.394 for 0.125 g/L, 0.50 g/L and 0.25 g/L, respectively.
PANI-EB: 3.28 > 2.14 > 0.460 for 0.125 g/L, 0.50 g/L and 0.25 g/L, respectively.
The reason could be attributed to the irregular dandelion shape of the PANI specimens (Figure 5 and Figure 6).
Surface coverage of MB onto ZnO (mg/g) with respect to increasing dose reflected as an inconsistent trend; 6.04 > 5.77 > 2.50 for 0.25 g/L, 0.125 g/L and 0.50 g/L, respectively. Even though increasing ZnO dose on initial adsorption followed a remarkable increase (7–15%) then a slight decrease (12.5%), a continuous increase in decolorization efficiencies were attained for irradiation periods of 30 min and 60 min irrespective of the applied ZnO dose. The lowest decolorization efficiency was attained as 85% for ZnO dose of 0.125 g/L however almost similar 97% decolorization efficiency was attained upon use of both 0.25 g/L and 0.50 g/L. Therefore, it could be demonstrated that 0.25 g/L dose could be regarded as suitable for photocatalytic treatment of MB using sole ZnO under BLF light irradiation.
Upon use of all PZI specimens, an inconsistent trend was observed with respect to initial adsorption extents (Figure 11). Lower dose as 0.125 g/L displayed sample specific initial adsorption extents in an order as PAZI-3 > PZI-1 > PZI-6 > PZI-9. On the other hand, high dose as 0.50 g/L reflected the effect of increasing PANI to ZnO ratio in PZI specimens. All PZI specimens followed a similar trend as 0.25 g/L, 0.125 g/L and 0.50 g/L except for PZI-3 as a decreasing trend with respect to increasing dose.
PZI-1 specimen:7.12 > 4.63 > 1.68 for 0.25 g/L, 0.125 g/L and 0.50 g/L, respectively.
PZI-3 specimen: 5.96 > 5.64 > 2.04 for 0.125 g/L, 0.25 g/L and 0.50 g/L, respectively.
PZI-6 specimen: 6.08 > 4.06 > 2.76 for 0.25 g/L, 0.125 g/L and 0.50 g/L, respectively.
PZI-9 specimen: 6.00 > 3.12 > 2.96 for 0.25 g/L, 0.125 g/L and 0.50 g/L, respectively.
During photocatalysis, an increase in decolorization efficiency was more remarkable by doubling from 0.125 g/L to 0.25 g/L in comparison to increase to 0.50 g/L irrespective of the PZI specimen type and initial surface coverage effects. On the other hand, upon longer irradiation period of 60 min, an average increase in decolorization percentages of MB from ~70% to ~90% was attained with increasing the dosage from 0.125 g/L to 0.50 g/L. The reason of this could be related to the possibility of the enhanced light harvesting capacity due to the increase in exposed surface area. However, working dose of 0.25 mg/mL was selected as evidenced by high removal efficiencies.
From a general perspective, upon use of all PZS specimens, a continuous increasing trend was observed in initial adsorption extents with respect to increasing dose covering sample specific differences within each dose (Figure 12). Lower dose as 0.125 g/L displayed more significant variations in surface coverage extents in an order as PZS-6 > PZS-9 > PZS-3 > PZS-1 (<10%). However, high dose as 0.50 g/L reflected a different trend as PZS-9 > PZS-1 ≈ PZS-3 > PZS-6 with a very slight insignificant change as 1%.
All PZS specimens followed a similar trend 0.25 g/L, 0.125 g/L and 0.50 g/L except for PZS-6 as a decreasing trend with respect to increasing dose.
PZS-1 specimen: 5.76 > 2.55 ≈ 2.50 for 0.25 g/L, 0.125 g/L and 0.50 g/L, respectively.
PZS-3 specimen: 6.68 > 3.11 > 2.46 for 0.25 g/L, 0.125 g/L and 0.50 g/L, respectively.
PZS-6 specimen: 6.24 > 4.04 > 2.30 for 0.125 g/L, 0.25 g/L and 0.50 g/L, respectively.
PZS-9 specimen: 6.92 > 3.78 > 2.76 for 0.25 g/L, 0.125 g/L and 0.50 g/L, respectively.
Upon photocatalysis, increase in decolorization efficiency was more remarkable by doubling the photocatalyst from 0.125 g/L to 0.25 g/L in comparison to increase to 0.50 g/L with minor variations with respect to PZS specimen. Dose effect was not found to be in correlation to PANI/ZnO ratio.
3.2.6. Effect of Initial Dye Concentration
Effect of initial MB concentration was investigated in the range of 5–30 mg/L (5 mg/L, 10 mg/L, 20 mg/L, 30 mg/L) in the presence of all photocatalyst specimens and expressed by decolorization percentages (A664).
Initial dye concentration exerted a negligible effect on the surface adsorption of MB onto both PANI-ES and PANI-EB samples (<10%) under dark conditions from 10 mg/L onwards (Figure 13). Due to prevailing attractive forces, PANI-EB was more effective than PANI-ES, however the effect was almost equalized for 30 mg/L due to higher MB concentration with respect to exposed surface area. As a comparison, adsorbed amount/adsorbent (mg/g) could be simply expressed as:
PANI-ES specimen: 3.13 > 2.26 > 0.816 > 0.394 for 30 mg/L, 20 mg/L, 5 mg/L and 10 mg/L, respectively.
PANI-EB specimen: 3.54 > 3.43 > 1.31 > 0.460 for 20 mg/L, 30 mg/L, 5 mg/L and 10 mg/L, respectively.
In this respect, upon irradiation, increasing MB concentration resulted in an incremental decreasing decolorization trend although remarkable increases were attained due to increased exposure periods being more significant for PANI-EB for lower MB concentrations.
Considering the very low surface area of ZnO (5 m2/g), initial surface coverage extent decreased from 21% to 8.5% upon increase from 5 mg/L to 30 mg/L MB possibly due to the decreased surface area with respect to the amount of substrate (Figure 14). Adsorbed amount of MB/ZnO (mg/g) could be simply expressed as; 10.3 ≈ 10.0 > 6.04 > 4.12 for 30 mg/L, 20 mg/L, 10 mg/L and 5 mg/L, respectively.
Accordingly, the decolorization efficiencies also decreased being more significant for higher amounts of MB. Even though higher MB decolorization efficiency was attained for lower concentration as 5 mg/L that could be related to the availability of the exposed area.
Upon use of PZI specimens, prior to initiation of light exposure, all samples displayed variations in surface coverage extents (A664 < 20%) irrespective of MB concentration and specimen type (Figure 15). The highest adsorption of MB onto PZI-1 was 18% and the lowest was 5% onto PZI-9. In a comparative manner, the initial adsorbed amount of MB onto PZI specimens were expressed as follows;
PZI-1 specimen: 7.95 > 7.12 > 6.86 > 2.86 for 20 mg/L, 10 mg/L, 30 mg/L and 5 mg/L, respectively.
PZI-3 specimen: 9.30 > 6.90 > 5.64 > 2.42 for 30 mg/L, 20 mg/L, 10 mg/L and 5 mg/L, respectively.
PZI-6 specimen: 8.81 > 6.38 > 6.08 > 2.18 for 30 mg/L, 20 mg/L, 10 mg/L and 5 mg/L, respectively.
PZI-9 specimen: 6.49 > 6.00 > 5.60 > 2.66 for 20 mg/L, 10 mg/L, 30 mg/L and 5 mg/L, respectively.
Accordingly, upon photocatalysis, efficiencies of decolorization were lower in the presence of 30 mg/L MB both for 30 min and 60 min irradiation periods. Even though 5 mg/L MB displayed highest removal efficiencies as the working MB concentration 10 mg/L could be visualized as the highest concentration revealing decolorization efficiencies >50 % irrespective of the PZI type.
On the other hand, use of PZS specimens expressed considerably similar inconsistent initial adsorption extent trend (A664 < 20%) (Figure 16). The highest adsorption of MB onto PZS-9 was 18% and the lowest was 3.4% onto PZS-6. On the other hand, the adsorbed amount of MB onto PZS specimens were presented in the following manner in terms as mg/g;
PZS-1 specimen: 6.28 > 5.76 > 4.84 > 2.10 for 20 mg/L, 10 mg/L, 30 mg/L and 5 mg/L, respectively.
PZS-3 specimen: 8.48 > 6.68 > 5.52 > 2.78 for 20 mg/L, 10 mg/L, 30 mg/L and 5 mg/L, respectively.
PZS-6 specimen: 6.85 > 4.49 > 4.04 > 1.95 for 20 mg/L, 30 mg/L, 10 mg/L and 5 mg/L, respectively.
PZS-9 specimen: 6.92 > 6.51 > 4.74 > 2.26 for 10 mg/L, 20 mg/L, 30 mg/L and 5 mg/L, respectively.
Consequently, upon irradiation during photocatalysis, decolorization efficiencies were found to be lower in the presence of 30 mg/L MB both for 30 min (<25%) and 60 min (<50%) irradiation periods. The reason could be attributed to the masking effect resulting in diminished light intensity thereby reducing the capacity of generation of reactive oxygen species especially hydroxyl radicals [58]. In a similar fashion to PZI samples, although 5 mg/L MB displayed highest removal efficiencies, 10 mg/L MB concentration could be regarded as the working concentration revealing decolorization efficiencies >80 % irrespective of the PZS type.
Comparison of PZI and PZS specimens demonstrated that both preparation methods could be considered as successful in case that MB as a cationic dye was used as the model compound and the light source was specially chosen to exclude any direct photolysis of the substrate. Under all conditions including PANI-ES, PANI-EB and even ZnO, surface adsorption extents were very low due to surface-oriented nature of photocatalysis. Moreover, since uniform encapsulating of ZnO was not visualized by SEM images, partial surface area of ZnO could be directly exposed to irradiation. The role of PANI could possibly be related to the “harvesting of MB” to the close proximity of ZnO core during photocatalysis. On the other hand, very high efficiencies were attained as expressed by UV-vis parameters (A664, A292 and A264) expressing both decolorization and removal of aromatic structures thereby decomposition and degradation of MB.
Based on the above presented information, the mechanism and kinetics of MB degradation upon use of PANI-ZnO composites deserve to be investigated under simulated solar light conditions and by using different model dye compounds.
4. Discussion
The core part of this study is the preparation of PANI-modified ZnO photocatalysts by using two different methods. To achieve this goal, PANI-ZnO composites were successfully synthesized by (i), In Situ polymerization in neutral media and (ii), hybridization (physical blending) methods to overcome the dissolution problem of ZnO. PANI/ZnO composites were prepared in various ratios 1%, 3%, 3% and 9%. As intermediates thus formed PANI-ES and, PANI-EB, sole ZnO as the base photocatalyst and PANI-ZnO composites were all characterized by FT-IR, Raman spectroscopy, XRD and SEM-EDAX techniques. The presence of PANI in PANI-ZnO composites were proven with the determination of functional groups by FT-IR and Raman Spectroscopy. The surface defects and the interactions between PANI and ZnO were observed by Raman Spectroscopy. A remarkable change was not observed on the crystallite sizes of ZnO and PANI-ZnO composites. The flower like shape of PANI was seen with a deformation in composites and the agglomeration was enhanced with an increase in PANI concentration. Besides, the existence of PANI in composites was confirmed by EDAX spectra. In SEM images of PZI composites, more aggregation was detected compared to PZS samples. In addition, characterization techniques revealed the structural and morphological differences of PANI-ES and PANI-EB.
The synergic effect between PANI and ZnO was examined by the photocatalytic degradation of MB. As prepared by using either way, PANI modified photocatalyst specimens exhibited a comparatively better photocatalytic activity than ZnO. By comparing the calculated rate constants, the prepared composites by PZS method were more successful to degrade MB compared to the ones prepared by PZI method. It was observed that the dose effect of photocatalyst efficiency did not play a consistent effect on the degradation of MB. In a similar manner, initial concentration effect also displayed variations with respect to experimental conditions. As an outcome of this study, it could be emphasized that the synthesized composite photocatalysts especially PZS-3 could function better than the bare ZnO photocatalyst under the specified experimental conditions. The functionality expected by PANI modification should be related to the system specifications and operational conditions. Due to the applied sequential filtration process to obtain clear sample for spectroscopic analysis, reusability experiments were not considered. Therefore, development of one-step removal of PANI-ZnO specimens from the reaction medium it is highly recommended. This study presents the variations in performance of PANI-ZnO photocatalyst with respect to the preparation methods through a systematical approach to fulfill baseline study requirements. Further research is highly recommended to elucidate the effect of solar light using various model dyes.
Supplementary Materials
The following are available online at https://www.mdpi.com/article/10.3390/w13081025/s1, Figure S1: A schematic of PANI-ZnO preparation method including the ways preventing ZnO dissolution composites. Figure S2: Time dependent UV-vis spectra of MB under irradiation and BLF lamp output spectra. Figure S3: Dark interactions between MB and photocatalyst specimens. Figure S4: Chemical structures of MB and related compounds. Figure S5: Irradiation time dependent UV-vis absorption spectra of MB using (a) PANI-ES and (b) PANI-EB. Figure S6: Photocatalytic degradation of MB in the presence of PANI-ES and PANI-EB in comparison to photolysis of MB. (a) A664, (b) A292, and (c) A246. Figure S7: Decolorization A664 kinetic plots of MB for (a) ZnO and PZI composites, and (b) ZnO and PZS composites. Figure S8: Decolorization A292 kinetic plots of MB for (a) ZnO and PZI composites, and (b) ZnO and PZS composites. Figure S9: Decolorization A246 kinetic plots of MB for (a) ZnO and PZI composites, and (b) ZnO and PZS composites.
Author Contributions
Conceptualization, Y.K., M.B. and N.T.; methodology, Y.K. and N.T.; investigation, N.T.; writing—original draft preparation, N.T.; writing—review and editing, M.B. and Y.K.; project administration, Y.K. and N.T.; funding acquisition, Y.K. and N.T. All authors have read and agreed to the published version of the manuscript.
Funding
Financial support provided by Research Fund of Kirsehir Ahi Evran University through Project FEF.A4.20.008 and FEF.A4.20.009 is gratefully acknowledged.
Institutional Review Board Statement
Not applicable.
Informed Consent Statement
Not applicable.
Data Availability Statement
The data presented in the study is available on request from the corresponding author.
Acknowledgments
The authors are thankful to Bogazici University Advanced Technologies Research & Development Center for SEM-EDAX and XRD measurements.
Conflicts of Interest
The authors declare that they have no known competing financial interests or personal relationships that could have appeared to influence the work reported in this paper.
References
- Byrne, C.; Subramanian, G.; Pillai, S.C. Recent advances in photocatalysis for environmental applications. J. Environ. Chem. Eng. 2018, 6, 3531–3555. [Google Scholar] [CrossRef]
- Lee, K.M.; Lai, C.W.; Ngai, K.S.; Juan, J.C. Recent developments of zinc oxide based photocatalyst in water treatment technology: A review. Water Res. 2016, 88, 428–448. [Google Scholar] [CrossRef] [PubMed]
- Ong, C.B.; Ng, L.Y.; Mohammad, A.W. A review of ZnO nanoparticles as solar photocatalysts: Synthesis, mechanisms and applications. Renew. Sustain. Energy Rev. 2018, 81, 536–551. [Google Scholar] [CrossRef]
- Samadi, M.; Zirak, M.; Naseri, A.; Khorashadizade, E.; Moshfegh, A.Z. Recent progress on doped ZnO nanostructures for visible-light photocatalysis. Thin Solid Films 2016, 605, 2–19. [Google Scholar] [CrossRef] [Green Version]
- Sakthivel, S.; Neppolian, B.; Shankar, M.V.; Arabindoo, B.; Palanichamy, M.; Murugesan, V. Solar photocatalytic degradation of azo dye: Comparison of photocatalytic efficiency of ZnO and TiO2. Sol. Energy Mater. Sol. Cells 2003, 77, 65–82. [Google Scholar] [CrossRef]
- Das, A.; Kumar, P.M.; Bhagavathiachari, M.; Nair, R.G. Hierarchical ZnO-TiO2 nanoheterojunction: A strategy driven approach to boost the photocatalytic performance through the synergy of improved surface area and interfacial charge transport. Appl. Surf. Sci. 2020, 534, 147321. [Google Scholar] [CrossRef]
- Ghosh, M.; Manoli, K.; Shen, X.; Wang, J.; Ray, A.K. Solar photocatalytic degradation of caffeine with titanium dioxide and zinc oxide nanoparticles. J. Photochem. Photobiol. A Chem. 2019, 377, 1–7. [Google Scholar] [CrossRef]
- Gupta, D.; Chauhan, R.; Kumar, N.; Singh, V.; Srivastava, V.C.; Mohanty, P.; Mandal, T.K. Enhancing photocatalytic degradation of quinoline by ZnO:TiO2 mixed oxide: Optimization of operating parameters and mechanistic study. J. Environ. Manag. 2020, 258, 110032. [Google Scholar] [CrossRef]
- Munguti, L.; Dejene, F. Influence of annealing temperature on structural, optical and photocatalytic properties of ZnO-TiO2 composites for application in dye removal in water. Nano-Struct. Nano-Objects 2020, 24, 100594. [Google Scholar] [CrossRef]
- Štrbac, D.; Aggelopoulos, C.A.; Štrbac, G.; Dimitropoulos, M.; Novaković, M.; Ivetić, T.; Yannopoulos, S.N. Photocatalytic degradation of naproxen and methylene blue: Comparison between ZnO, TiO2 and their mixture. Process. Saf. Environ. 2018, 113, 174–183. [Google Scholar] [CrossRef]
- Turkten, N.; Bekbolet, M. Photocatalytic performance of titanium dioxide and zinc oxide binary system on degradation of humic matter. J. Photochem. Photobiol. A Chem. 2020, 401, 112748. [Google Scholar] [CrossRef]
- Upadhyay, G.K.; Rajput, J.K.; Pathak, T.K.; Kumar, V.; Purohit, L.P. Synthesis of ZnO:TiO2 nanocomposites for photocatalyst application in visible light. Vacuum 2019, 160, 154–163. [Google Scholar] [CrossRef]
- Eskizeybek, V.; Sarı, F.; Gülce, H.; Gülce, A.; Avcı, A. Preparation of the new polyaniline/ZnO nanocomposite and its photocatalytic activity for degradation of methylene blue and malachite green dyes under UV and natural sun lights irradiations. Appl. Catal. B Environ. 2012, 119, 197–206. [Google Scholar] [CrossRef]
- Gilja, V.; Vrban, I.; Mandic, V.; Zic, M.; Hrnjak-Murgic, Z. Preparation of a PANI/ZnO composite for efficient photocatalytic degradation of acid blue. Polymers 2018, 10, 940. [Google Scholar] [CrossRef] [PubMed] [Green Version]
- Nosrati, R.; Olad, A.; Maramifar, R. Degradation of ampicillin antibiotic in aqueous solution by ZnO/polyaniline nanocomposite as photocatalyst under sunlight irradiation. Environ. Sci. Pollut. Res. Int. 2012, 19, 2291–2299. [Google Scholar] [CrossRef]
- Nowakowska, M.; Szczubiałka, K. Photoactive polymeric and hybrid systems for photocatalytic degradation of water pollutants. Polym. Degrad. Stab. 2017, 145, 120–141. [Google Scholar] [CrossRef]
- Riaz, U.; Ashraf, S.M.; Kashyap, J. Enhancement of photocatalytic properties of transitional metal oxides using conducting polymers: A mini review. Mater. Res. Bull. 2015, 71, 75–90. [Google Scholar] [CrossRef]
- Jin, X.; Liu, G.; Bao, C.; Chen, M.; Huang, Q. Improved stability and dispersity of ZnO@PANI nanocomposites aqueous suspension. Appl. Organomet. Chem. 2018, 32, 4411. [Google Scholar] [CrossRef]
- Radoičić, M.; Šaponjić, Z.; Janković, I.A.; Ćirić-Marjanović, G.; Ahrenkielc, S.P.; Čomor, M.I. Improvements to the photocatalytic efficiency of polyaniline modified TiO2 nanoparticles. Appl. Catal. B Environ. 2013, 136, 133–139. [Google Scholar] [CrossRef]
- Bhandari, S. Polyaniline blends, composites, and nanocomposites. In Polyaniline Blends, Composites, and Nanocomposites, 1st ed.; Visakh, P.M., Pina, C.D., Falletta, E., Eds.; Elsevier: Amsterdam, The Netherlands, 2018; pp. 23–60. [Google Scholar]
- Ćirić-Marjanović, G. Recent advances in polyaniline research: Polymerization mechanisms, structural aspects, properties and applications. Synth. Met. 2013, 177, 1–47. [Google Scholar] [CrossRef]
- Stejskal, J. Interaction of conducting polymers, polyaniline and polypyrrole, with organic dyes: Polymer morphology control, dye adsorption and photocatalytic decomposition. Chem. Pap. 2020, 74, 1–54. [Google Scholar] [CrossRef]
- Deng, Y.; Tang, L.; Zeng, G.; Dong, H.; Yan, M.; Wang, J.; Hu, W.; Wang, J.; Zhou, Y.; Tang, J. Enhanced visible light photocatalytic performance of polyaniline modified mesoporous single crystal TiO2 microsphere. Appl. Surf. Sci. 2016, 387, 882–893. [Google Scholar] [CrossRef]
- Li, X.; Wang, D.; Cheng, G.; Luo, Q.; An, J.; Wang, Y. Preparation of polyaniline-modified TiO2 nanoparticles and their photocatalytic activity under visible light illumination. Appl. Catal. B Environ. 2008, 81, 267–273. [Google Scholar] [CrossRef]
- Wang, F.; Min, S.X. TiO2/polyaniline composites: An efficient photocatalyst for the degradation of methylene blue under natural light. Chin. Chem. Lett. 2007, 18, 1273–1277. [Google Scholar] [CrossRef]
- Yang, C.; Dong, W.; Cui, G.; Zhao, Y.; Shi, X.; Xia, X.; Tang, B.; Wang, W. Enhanced photocatalytic activity of PANI/TiO2 due to their photosensitization-synergetic effect. Electrochim. Acta 2017, 247, 486–495. [Google Scholar] [CrossRef]
- Zhang, L.; Liu, P.; Su, Z. Preparation of PANI-TiO2 nanocomposites and their solid-phase photocatalytic degradation. Polym. Degrad. Stab. 2006, 91, 2213–2219. [Google Scholar] [CrossRef]
- Zhang, H.; Zong, R.; Zhu, Y. Photocorrosion inhibition and photoactivity enhancement for zinc oxide via hybridization with monolayer polyaniline. J. Phys. Chem. C 2009, 113, 4605–4611. [Google Scholar] [CrossRef]
- Zou, T.; Wang, C.; Tan, R.; Song, W.; Cheng, Y. Preparation of pompon-like ZnO-PANI heterostructure and its applications for the treatment of typical water pollutants under visible light. J. Hazard. Mater. 2017, 338, 276–286. [Google Scholar] [CrossRef]
- Lee, S.-K.; Mills, A.; Wells, N. Assessing photocatalytic activity using methylene blue without dye sensitization. Catal. Today 2018, 313, 211–217. [Google Scholar] [CrossRef] [Green Version]
- Hatchard, C.G.; Parker, C.A. A new sensitive chemical actinometer—II. Potassium ferrioxalate as a standard chemical actinometer. Proc. R. Soc. Lond. Proc. Ser. A Math. Phys. Eng. Sci. 1956, 235, 518–536. [Google Scholar]
- Bandgar, D.K.; Khuspe, G.D.; Pawar, R.C.; Lee, C.S.; Patil, V.B. Facile and novel route for preparation of nanostructured polyaniline (PANI) thin films. Appl. Nanosci. 2012, 4, 27–36. [Google Scholar] [CrossRef] [Green Version]
- Abdiryim, T.; Xiao-Gang, Z.; Jamal, R. Comparative studies of solid-state synthesized polyaniline doped with inorganic acids. Mater. Chem. Phys. 2005, 90, 367–372. [Google Scholar] [CrossRef]
- Blinova, N.V.; Stejskal, J.; Trchová, M.; Prokeš, J.; Omastová, M. Polyaniline and polypyrrole: A comparative study of the preparation. Eur. Polym. J. 2007, 43, 2331–2341. [Google Scholar] [CrossRef]
- Trchová, M.; Šeděnková, I.; Stejskal, J. In-Situ polymerized polyaniline films 6. FTIR spectroscopic study of aniline polymerisation. Synth. Met. 2005, 154, 1–4. [Google Scholar] [CrossRef]
- Moosavian, M.A.; Moazezi, N. Removal of cadmium and zinc ions from industrial wastewater using nanocomposites of PANI/ZnO and PANI/CoHCF: A comparative study. Desalination Water Treat. 2015, 57, 1–20. [Google Scholar] [CrossRef]
- Ashokkumar, M.; Muthukumaran, S. Microstructure, optical and FTIR studies of Ni, Cu co-doped ZnO nanoparticles by co-precipitation method. Opt. Mater. 2014, 37, 671–678. [Google Scholar] [CrossRef]
- Cristovan, F.H.; Pereira, E.C. Polymeric varistor based on PANI/ABS composite. Synth. Met. 2011, 161, 2041–2044. [Google Scholar] [CrossRef]
- Wang, S.-H.; Griffiths, P.R. Resolution enhancement of diffuse reflectance i.r. spectra of coals by Fourier self-deconvolution. Fuel 1985, 64, 229–236. [Google Scholar] [CrossRef]
- Maensiri, S.; Laokul, P.; Promarak, V. Synthesis and optical properties of nanocrystalline ZnO powders by a simple method using zinc acetate dihydrate and poly (vinyl pyrrolidone). J. Cryst. Growth 2006, 289, 102–106. [Google Scholar] [CrossRef]
- Bera, S.; Khan, H.; Biswas, I.; Jana, S. Polyaniline hybridized surface defective ZnO nanorods with long-term stable photoelectrochemical activity. Appl. Surf. Sci. 2016, 383, 165–176. [Google Scholar] [CrossRef]
- Dhingra, M.; Shrivastava, S.; Senthil Kumar, P.; Annapoorni, S. Polyaniline mediated enhancement in band gap emission of zinc oxide. Compos. B Eng. 2013, 45, 1515–1520. [Google Scholar] [CrossRef]
- Pei, Z.; Ding, L.; Lu, M.; Fan, Z.; Weng, S.; Hu, J.; Liu, P. Synergistic effect in polyaniline-hybrid defective ZnO with enhanced photocatalytic activity and stability. J. Phys. Chem. C 2014, 118, 9570–9577. [Google Scholar] [CrossRef]
- Tao, S.; Hong, B.; Kerong, Z. An infrared and Raman spectroscopic study of polyanilines co-doped with metal ions and H+. Spectrochim. Acta A Mol. Biomol. Spectrosc. 2007, 66, 1364–1368. [Google Scholar] [CrossRef]
- Šćepanović, M.; Grujić-Brojčin, M.; Vojisavljević, K.; Bernik, S.; Srećković, T. Raman study of structural disorder in ZnO nanopowders. J. Raman Spectrosc. 2010, 41, 914–921. [Google Scholar] [CrossRef]
- Shi, L.; Wang, X.; Lu, L.; Yang, X.; Wu, X. Preparation of TiO2/polyaniline nanocomposite from a lyotropic liquid crystalline solution. Synth. Met. 2009, 159, 2525–2529. [Google Scholar] [CrossRef]
- Stejskal, J.; Riede, A.; Hlavatá, D.; Prokeš, J.; Helmstedt, M.; Holler, P. The effect of polymerization temperature on molecular weight, crystallinity, and electrical conductivity of polyaniline. Synth. Met. 1998, 96, 55–61. [Google Scholar] [CrossRef]
- Scherrer, P. Estimation of the size and internal structure of colloidal particles by means of röntgen. Nachr. Ges. Wiss. Göttingen 1918, 2, 96–100. [Google Scholar]
- Zhu, Y.; Li, J.; Wan, M.; Jiang, L. Superhydrophobic 3D microstructures assembled from 1D nanofibers of polyaniline. Macromol. Rapid Commun. 2008, 29, 239–243. [Google Scholar] [CrossRef]
- Łużny, W.; Śniechowski, M.; Laska, J. Structural properties of emeraldine base and the role of water contents: X-ray diffraction and computer modelling study. Synth. Met. 2002, 126, 27–35. [Google Scholar] [CrossRef]
- Rauf, M.A.; Meetani, M.A.; Khaleel, A.; Ahmed, A. Photocatalytic degradation of methylene blue using a mixed catalyst and product analysis by LC/MS. Chem. Eng. J. 2010, 157, 373–378. [Google Scholar] [CrossRef]
- Yogi, C.; Kojima, K.; Wada, N.; Tokumoto, H.; Takai, T.; Mizoguchi, T.; Tamiaki, H. Photocatalytic degradation of methylene blue by TiO2 film and Au particles-TiO2 composite film. Thin Solid Films 2008, 516, 5881–5884. [Google Scholar] [CrossRef]
- Shen, J.; Shahid, S.; Amura, I.; Sarihan, A.; Tiana, M.; Emanuelsson, E.A.C. Enhanced adsorption of cationic and anionic dyes from aqueous solutions by polyacid doped polyaniline. Synth. Met. 2018, 245, 151–159. [Google Scholar] [CrossRef]
- Duhan, M.; Kaur, R. Nano-structured polyaniline as a potential adsorbent for methylene blue dye removal from effluent. J. Compos. Sci. 2021, 5, 7. [Google Scholar] [CrossRef]
- Sarkar, K.; Deb, K.; Debnath, A.; Arun Bera, A.; Debnath, A.; Saha, B. Polaron localization in polyaniline through methylene blue dye interaction for tuned charge transport and optical properties. Colloid Polym. Sci. 2018, 296, 1927–1934. [Google Scholar] [CrossRef]
- Zhang, T.; Oyama, T.; Aoshima, A.; Hidaka, H.; Zhao, J.; Serpone, N. Photooxidative N-demethylation of methylene blue in aqueous TiO2 dispersions under UV irradiation. J. Photochem. Photobiol A Chem. 2001, 140, 163–172. [Google Scholar] [CrossRef]
- Mathew, R.M.; John, J.; Zachariah, E.S.; Jose, J.; Titus, T.; Abraham, R.; Joseph, A.; Thomas, V. Metal free, phosphorus doped carbon nanodot mediated photocatalytic reduction of methylene blue. React. Kinet. Mech. Cat. 2020, 129, 1131–1143. [Google Scholar] [CrossRef]
- Sohrabnezhad, S. Study of catalytic reduction and photodegradation of methylene blue by heterogeneous catalyst. Spectrochim. Acta A Mol. Biomol. Spectrosc. 2011, 81, 228–235. [Google Scholar] [CrossRef] [PubMed]
- Zhang, T.; Oyama, T.K.; Horikoshi, S.; Hidaka, H.; Zhao, J.; Serpone, N. Photocatalyzed N-demethylation and degradation of methylene blue in titania dispersions exposed to concentrated sunlight. Sol. Energy Mater. Sol. Cells 2002, 73, 287–303. [Google Scholar] [CrossRef]
- Lin, J.; Luo, Z.; Liu, J.; Li, P. Photocatalytic degradation of methylene blue in aqueous solution by using ZnO-SnO2 nanocomposites. Mater. Sci Semicond. Process. 2018, 87, 24–31. [Google Scholar] [CrossRef]
- Melcher, J.; Barth, N.; Schilde, C.; Kwade, A.; Bahnemann, D. Influence of TiO2 agglomerate and aggregate sizes on photocatalytic activity. J. Mater. Sci. 2016, 52, 1047–1056. [Google Scholar] [CrossRef]
- Pellegrino, F.; Pellutiè, L.; Sordello, F.; Minero, C.; Ortel, E.; Hodoroaba, V.-D.; Maurino, V. Influence of agglomeration and aggregation on the photocatalytic activity of TiO2 nanoparticles. Appl. Catal. B Environ. 2017, 216, 80–87. [Google Scholar] [CrossRef]
- Ghadimi, M.; Zangenehtabar, S.; Homaeigohar, S. Overview of the Water Remediation Potential of Nanomaterials and Their Ecotoxicological Impacts. Water 2020, 12, 1150. [Google Scholar] [CrossRef] [Green Version]
- Adochite, C.; Andronic, L. Aquatic Toxicity of Photocatalyst Nanoparticles to Green Microalgae Chlorella Vulgaris. Water 2021, 13, 77. [Google Scholar] [CrossRef]
Figure 1.
Chemical structures of polyaniline emeraldine salt form (PANI-ES) and polyaniline emeraldine base form (PANI-EB), where A denotes an anion such as Cl−. Adapted from Stejskal, 2020 [22].
Figure 1.
Chemical structures of polyaniline emeraldine salt form (PANI-ES) and polyaniline emeraldine base form (PANI-EB), where A denotes an anion such as Cl−. Adapted from Stejskal, 2020 [22].

Figure 2.
Stacked Fourier Transform Infrared (FT-IR) spectra of (a) PANI-ES and PANI-EB, (b) PANI-ES, zinc oxide (ZnO) and PANI-ZnO composites using In-Situ chemical oxidation polymerization method (PZI), (c) PANI-EB, ZnO and PANI-ZnO composites by hybridization method (PZS).
Figure 2.
Stacked Fourier Transform Infrared (FT-IR) spectra of (a) PANI-ES and PANI-EB, (b) PANI-ES, zinc oxide (ZnO) and PANI-ZnO composites using In-Situ chemical oxidation polymerization method (PZI), (c) PANI-EB, ZnO and PANI-ZnO composites by hybridization method (PZS).


Figure 3.
Raman spectra of (a) PANI-ES and PANI-EB, (b) ZnO and PZI composites, (c) ZnO and PZS composites, (d) regional enlarged spectra of PZI composites and (e) regional enlarged spectra of PZS composites.
Figure 3.
Raman spectra of (a) PANI-ES and PANI-EB, (b) ZnO and PZI composites, (c) ZnO and PZS composites, (d) regional enlarged spectra of PZI composites and (e) regional enlarged spectra of PZS composites.

Figure 4.
X-ray Diffraction (XRD) spectra of (a) PANI-ES and PANI-EB, (b) ZnO and PZI composites and (c) ZnO and PZS composites.
Figure 4.
X-ray Diffraction (XRD) spectra of (a) PANI-ES and PANI-EB, (b) ZnO and PZI composites and (c) ZnO and PZS composites.

Figure 5.
SEM images (left) ×50,000, (right) ×100,000 and Energy Dispersive X-ray Analysis Unit (EDAX) elemental analysis (a) PANI-ES, (b) ZnO, (c) PZI-1, (d) PZI-3, (e) PZI-6 and (f) PZI-9.
Figure 5.
SEM images (left) ×50,000, (right) ×100,000 and Energy Dispersive X-ray Analysis Unit (EDAX) elemental analysis (a) PANI-ES, (b) ZnO, (c) PZI-1, (d) PZI-3, (e) PZI-6 and (f) PZI-9.

Figure 6.
Scanning Electron Microscopy (SEM) images (left) ×50,000, (right) ×100,000 and EDAX elemental analysis (a) PANI-EB, (b) ZnO, (c) PZS-1, (d) PZS-3, (e) PZS-6 and (f) PZS-9.
Figure 6.
Scanning Electron Microscopy (SEM) images (left) ×50,000, (right) ×100,000 and EDAX elemental analysis (a) PANI-EB, (b) ZnO, (c) PZS-1, (d) PZS-3, (e) PZS-6 and (f) PZS-9.

Figure 7.
Ultraviolet-visible (UV-vis) absorption spectra of methylene blue (MB) using PANI-ES, ZnO and PZI composites.
Figure 7.
Ultraviolet-visible (UV-vis) absorption spectra of methylene blue (MB) using PANI-ES, ZnO and PZI composites.


Figure 8.
UV-vis absorption spectra of MB using PANI-EB, ZnO and PZS composites.

Figure 9.
Photocatalytic degradation of MB upon use of PANI-ES and PANI-EB: Dose effect.

Figure 10.
Photocatalytic degradation of MB upon use of sole ZnO: Dose effect.

Figure 11.
Photocatalytic degradation of MB upon use of PZI specimens: Dose effect.


Figure 12.
Photocatalytic degradation of MB upon use of PZS specimens: Dose effect.


Figure 13.
Photocatalytic degradation of MB upon use of PANI-ES and PANI-EB: Initial MB concentration effect.
Figure 13.
Photocatalytic degradation of MB upon use of PANI-ES and PANI-EB: Initial MB concentration effect.

Figure 14.
Photocatalytic degradation of MB upon use of sole ZnO: Initial MB concentration effect.

Figure 15.
Photocatalytic degradation of MB upon use of PZI specimens: Initial MB concentration effect.
Figure 15.
Photocatalytic degradation of MB upon use of PZI specimens: Initial MB concentration effect.


Figure 16.
Photocatalytic degradation of MB upon use of PZS specimens: Initial MB concentration effect.
Figure 16.
Photocatalytic degradation of MB upon use of PZS specimens: Initial MB concentration effect.


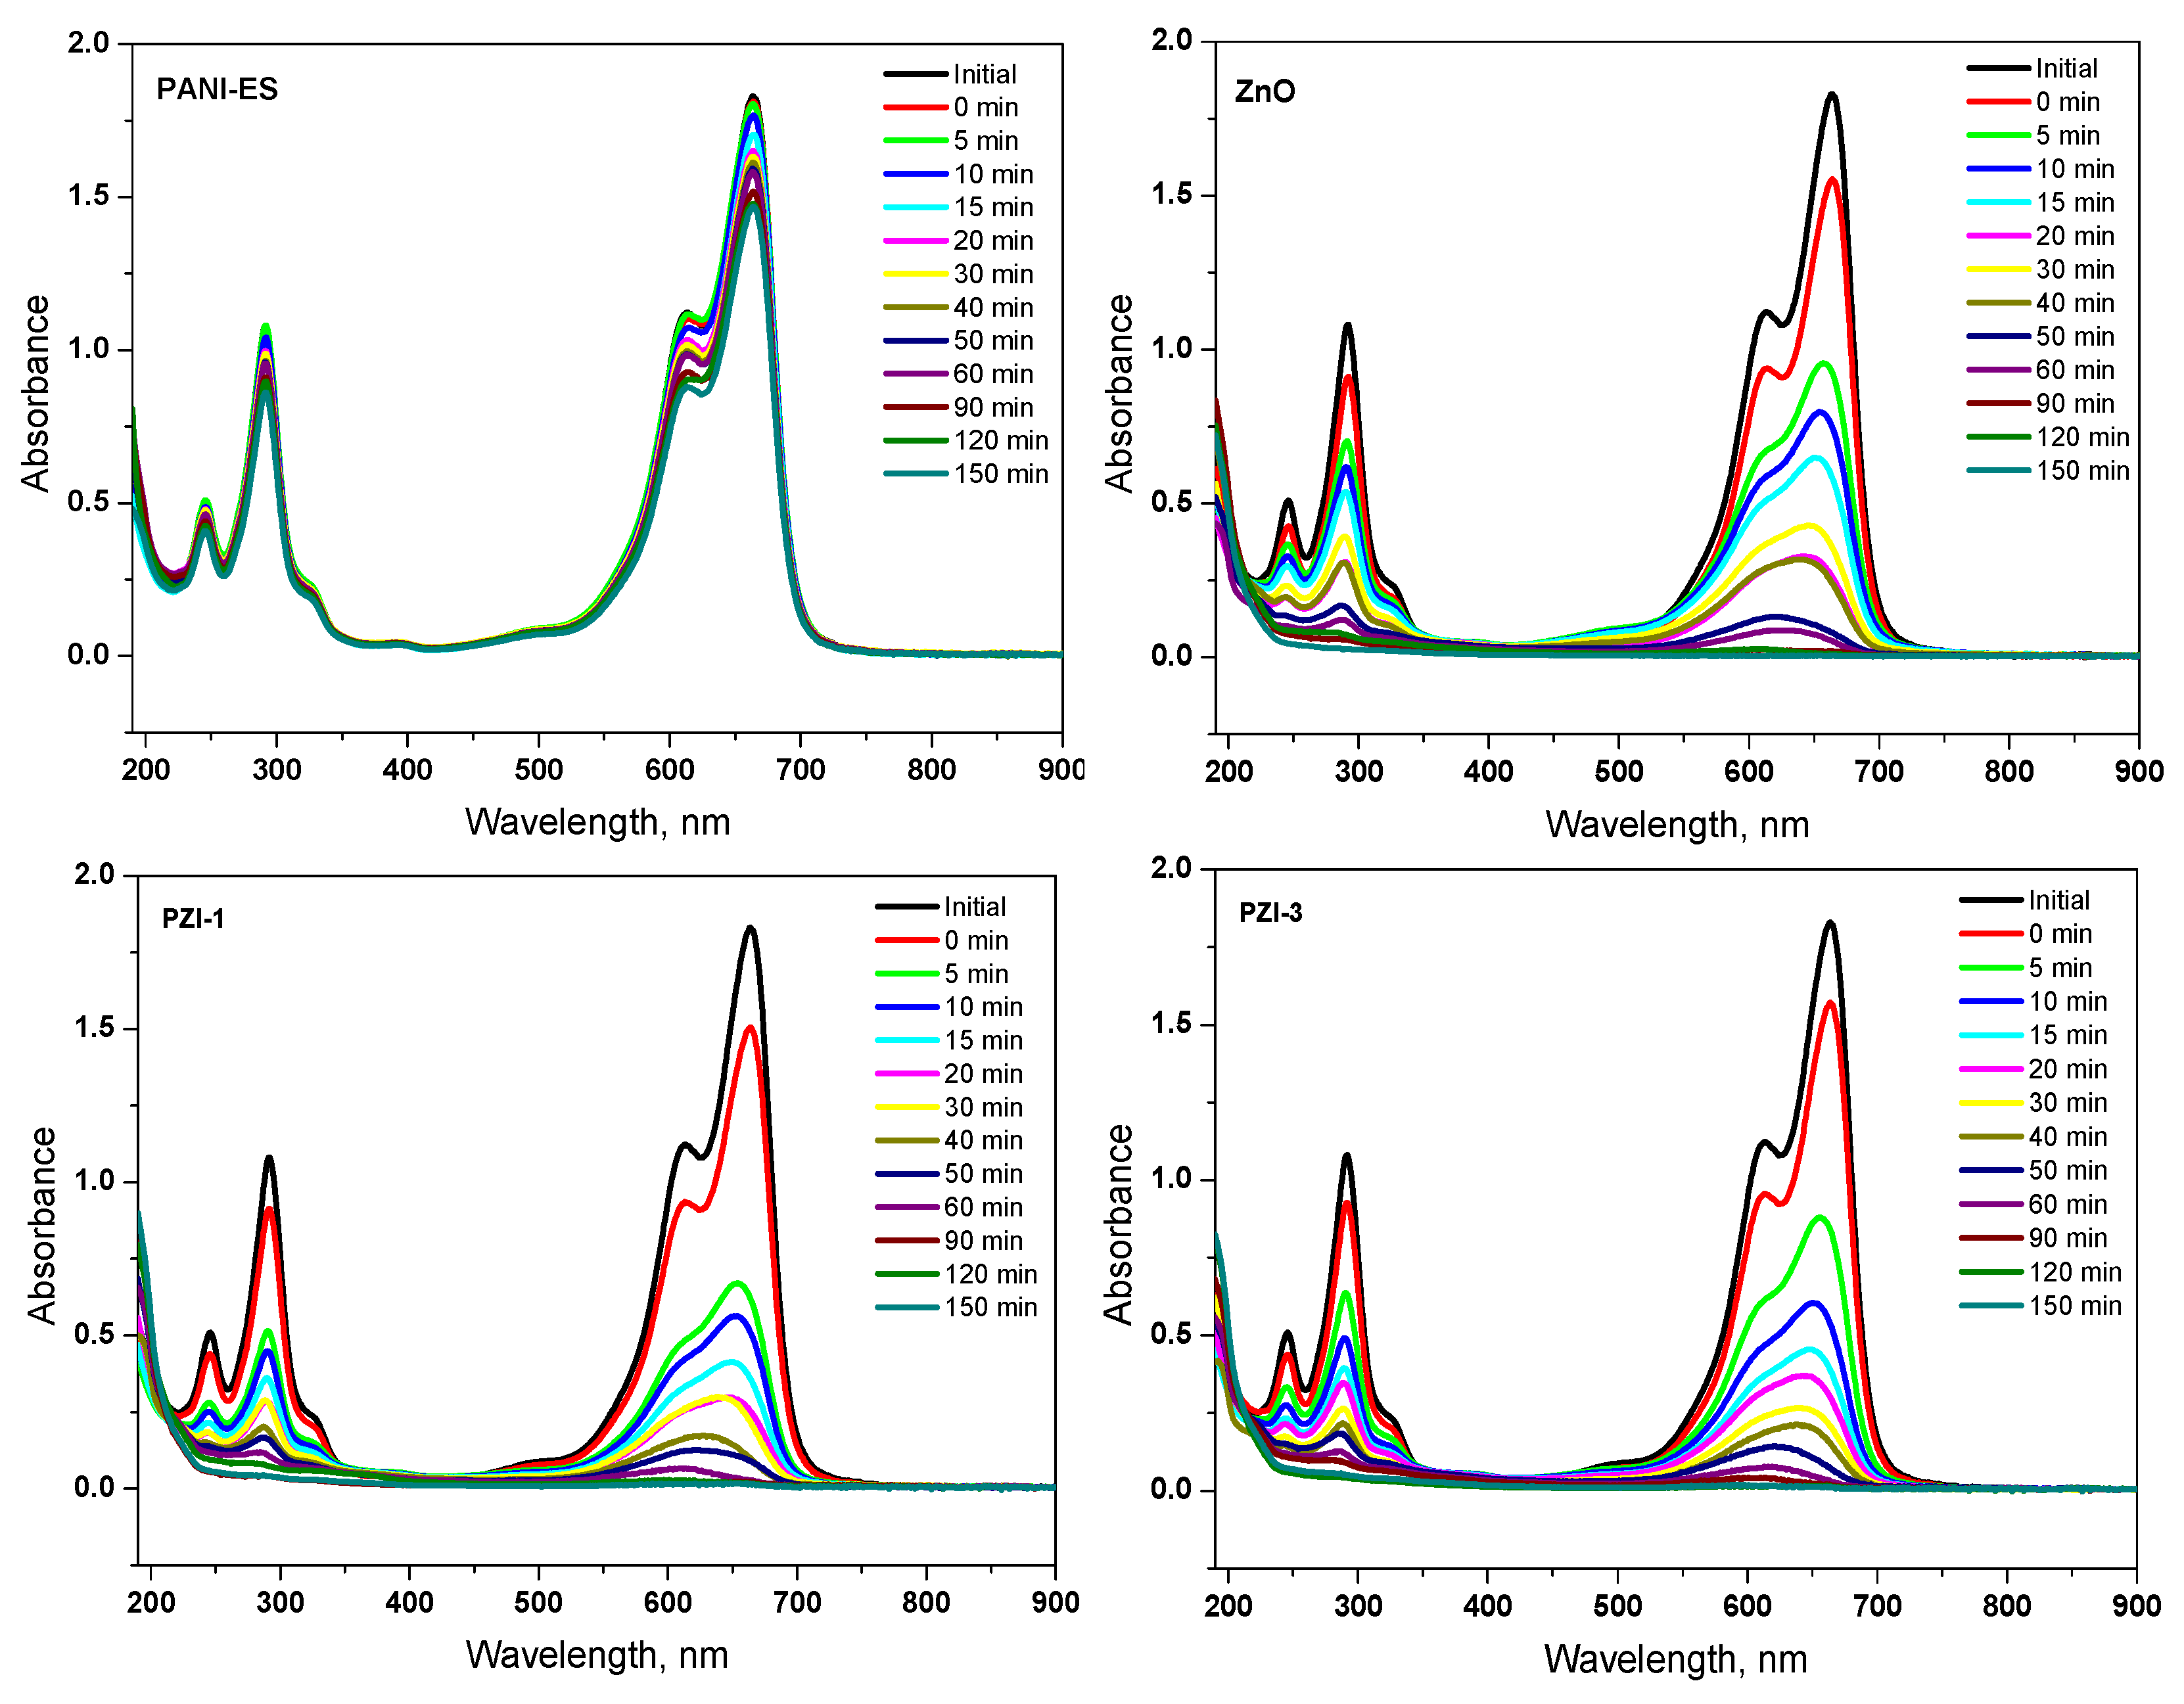
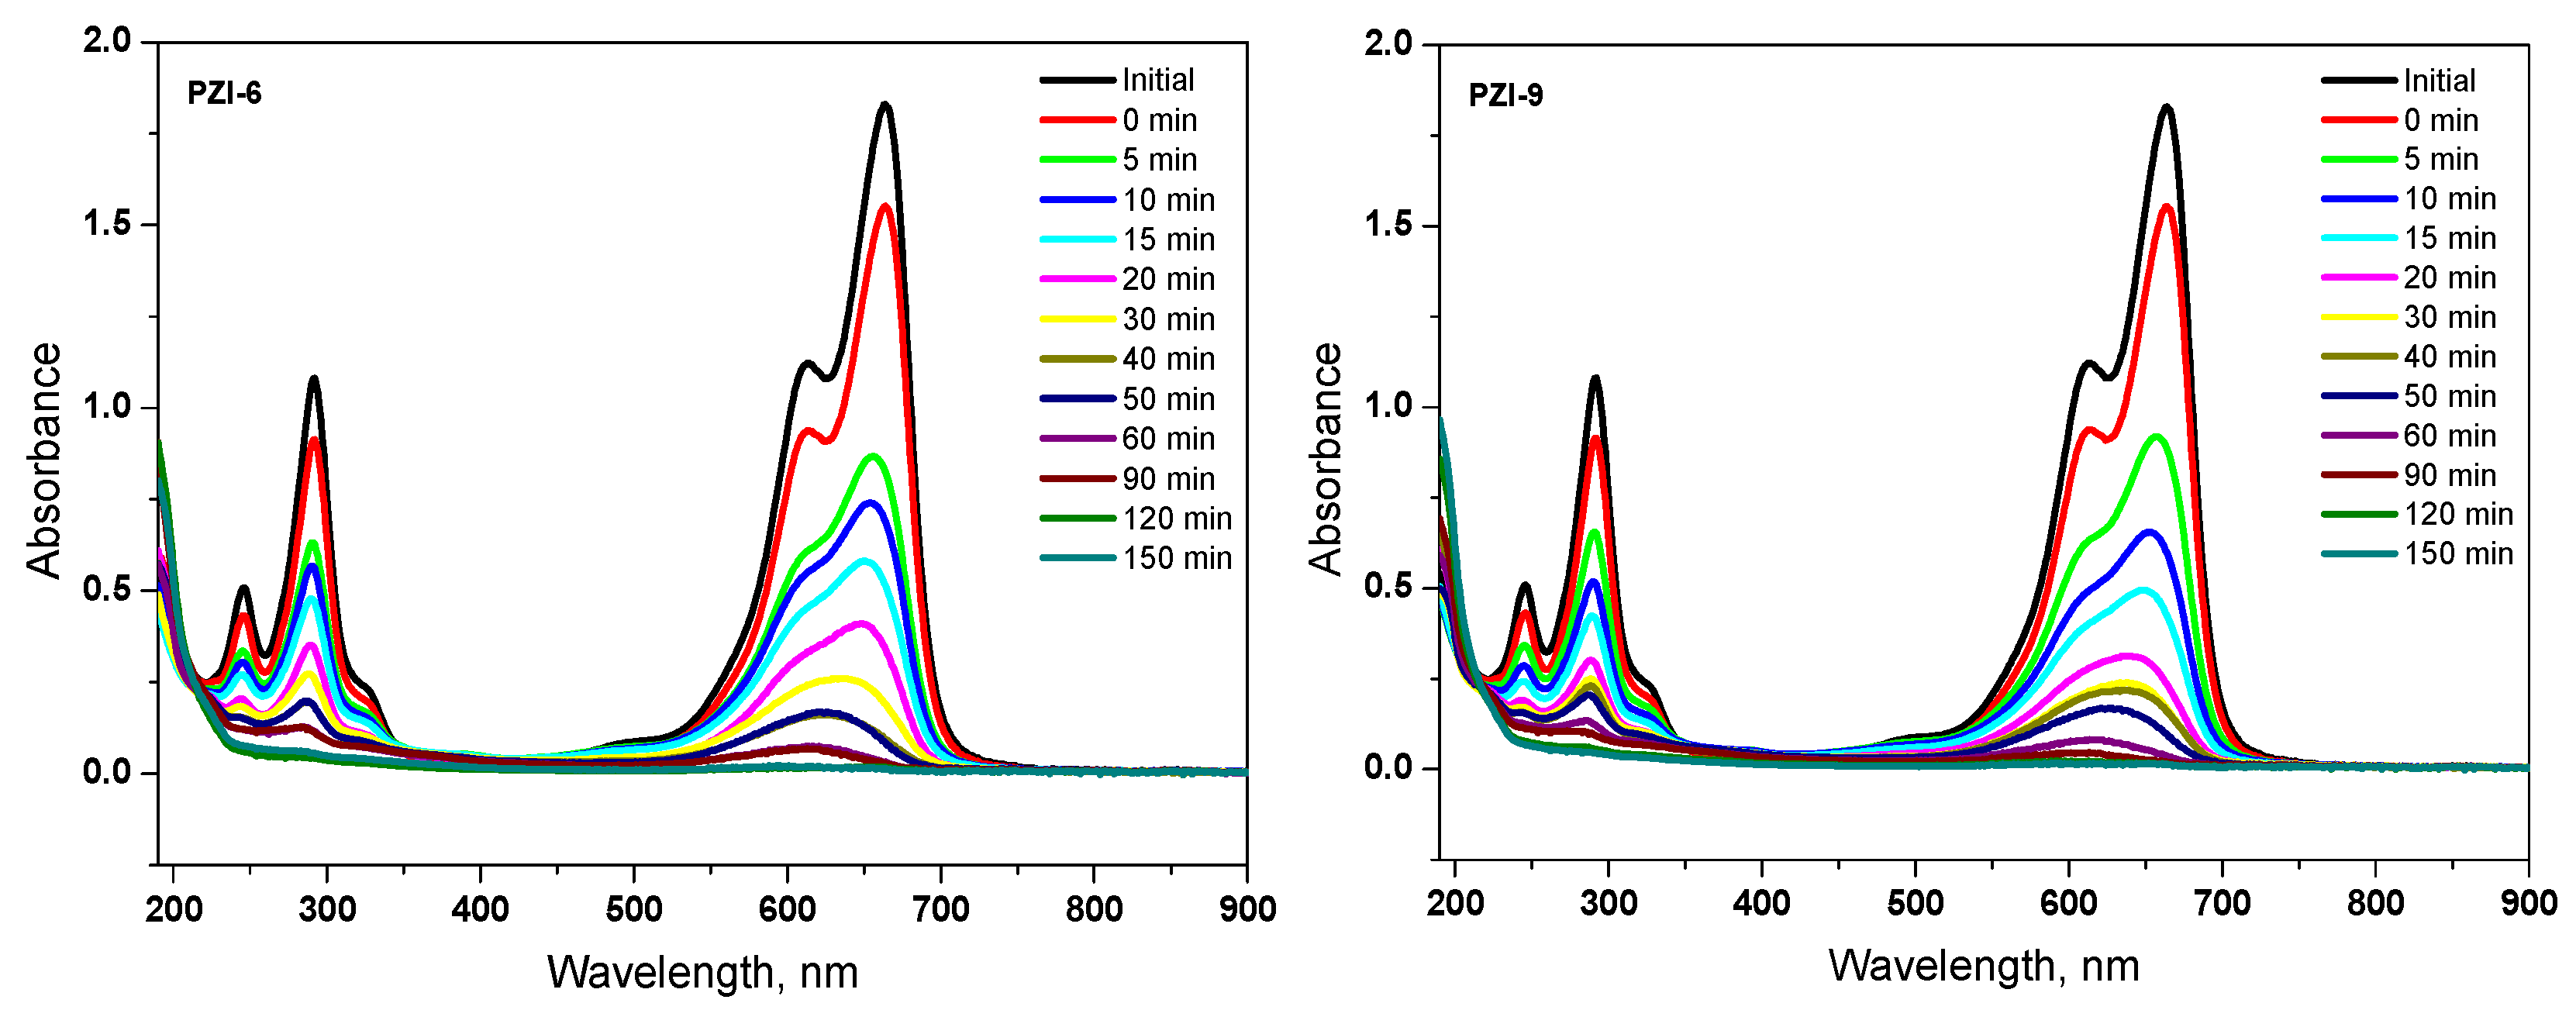
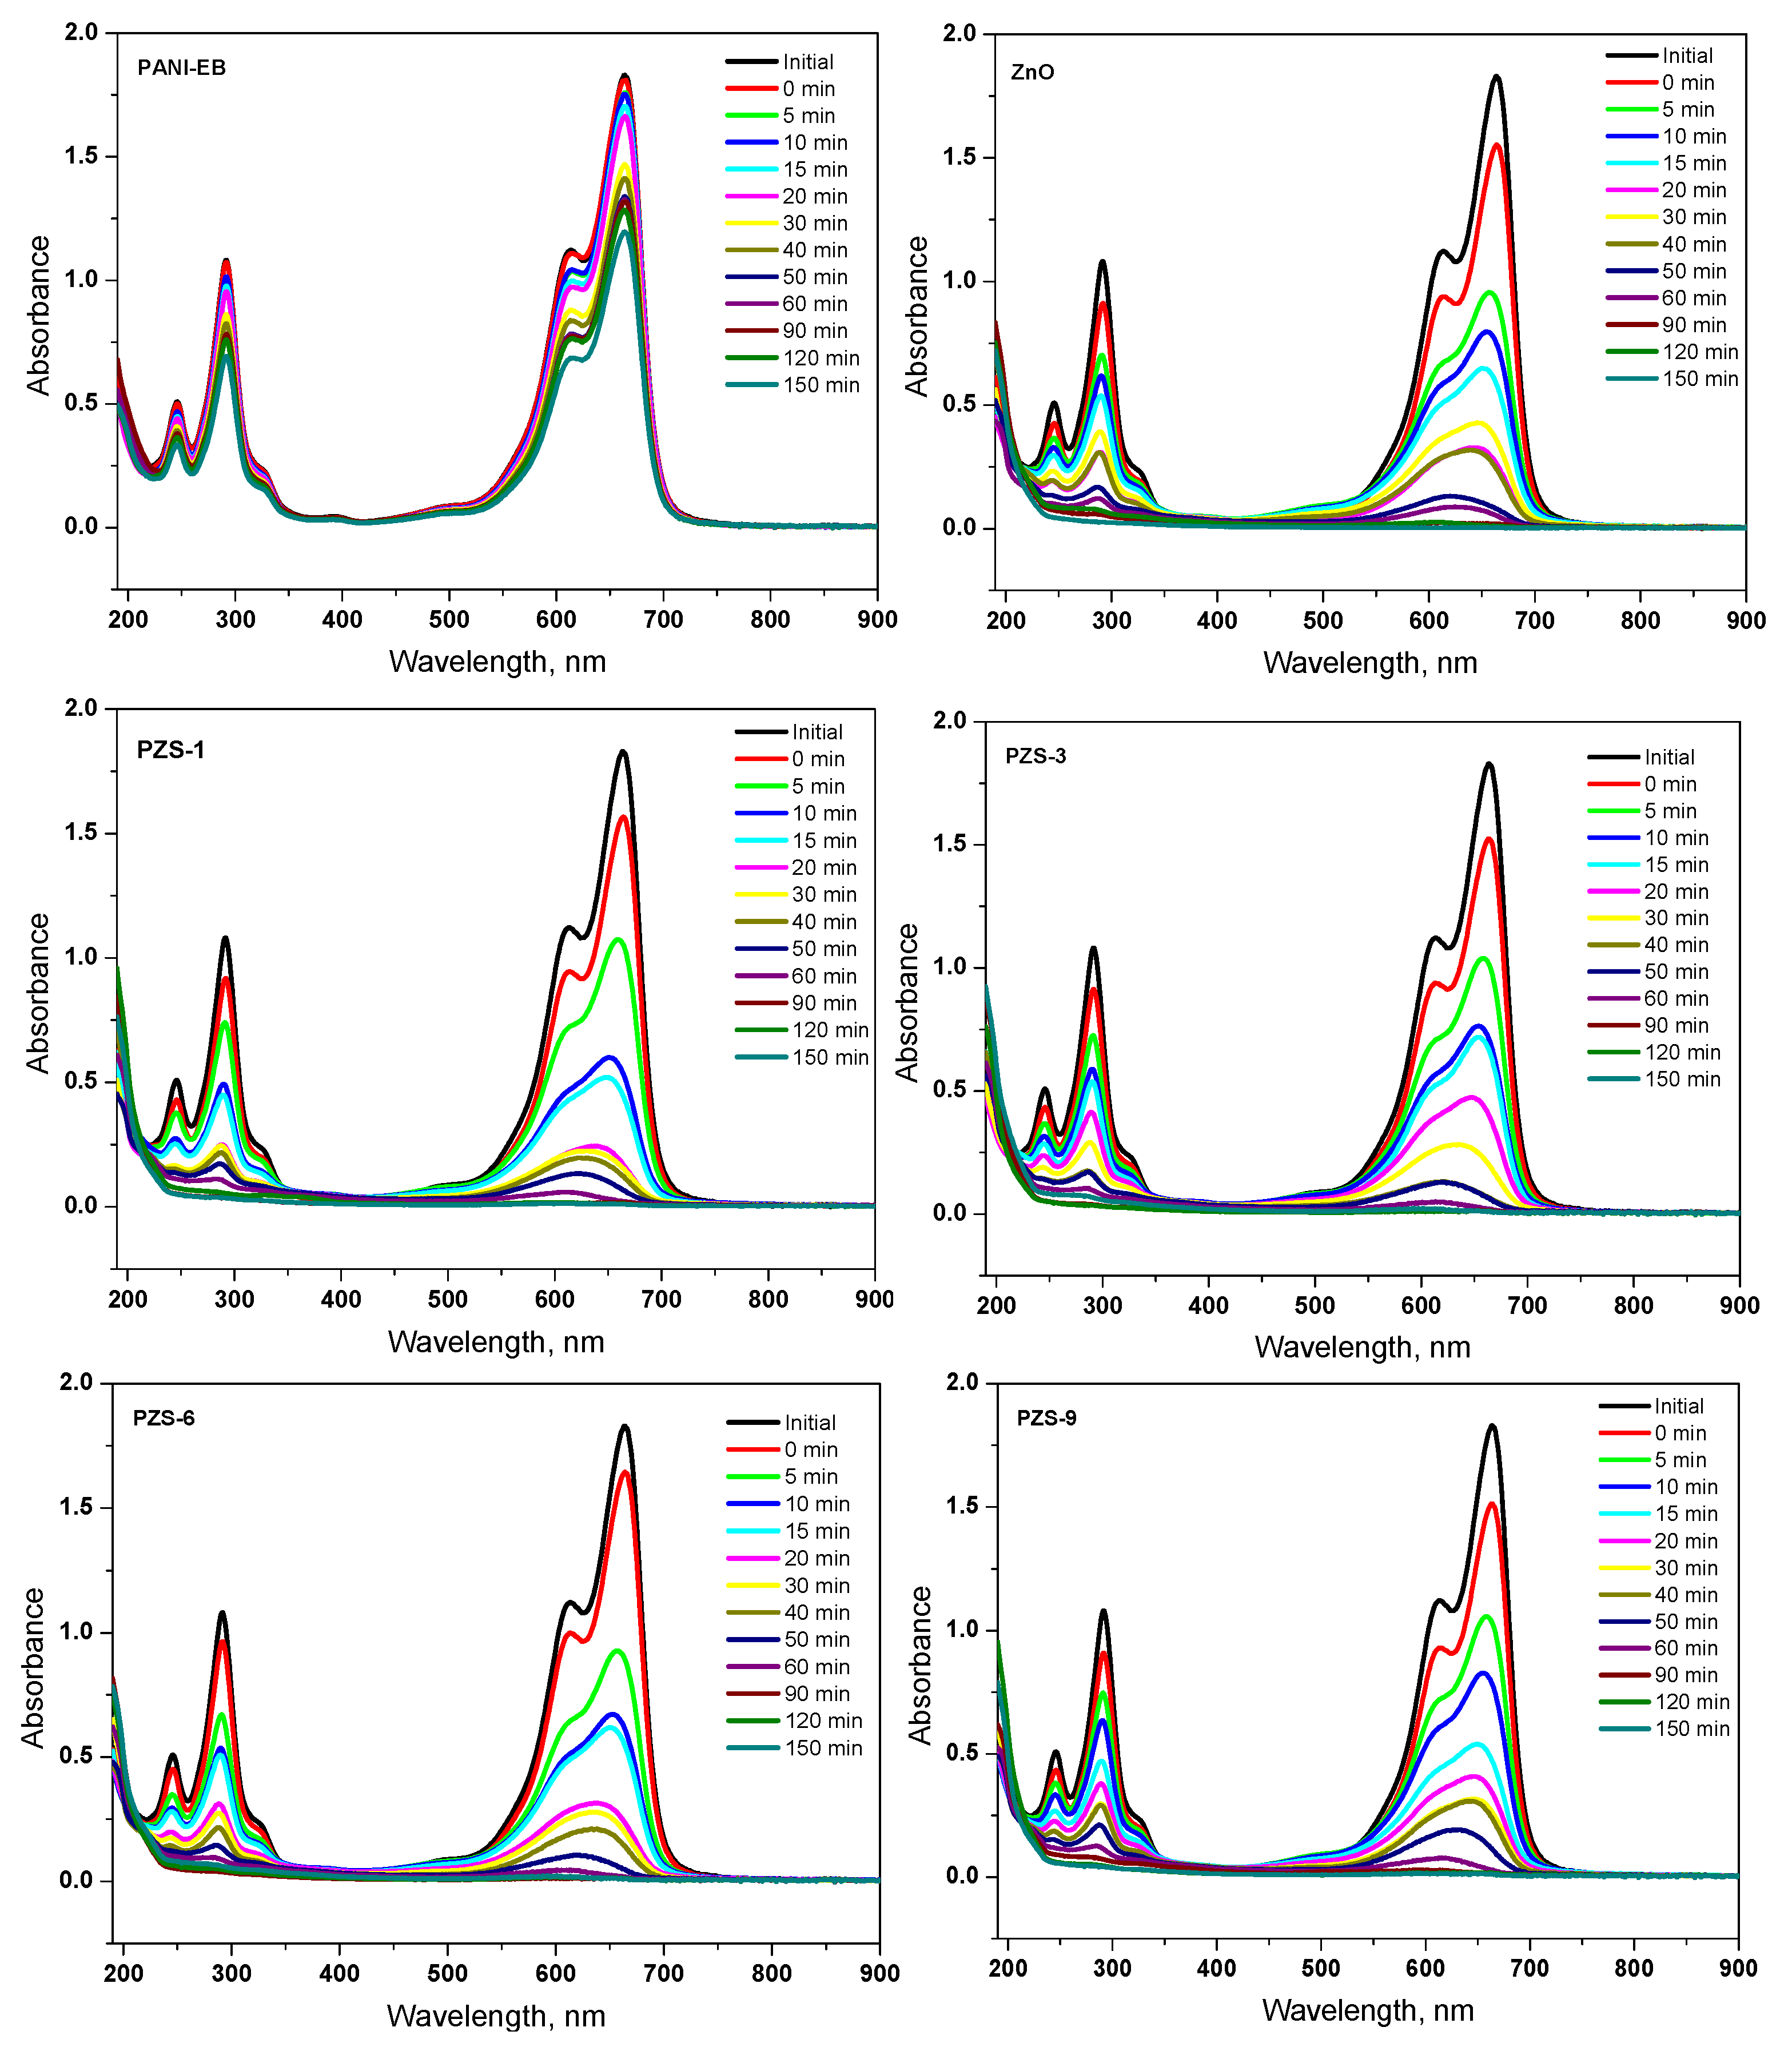
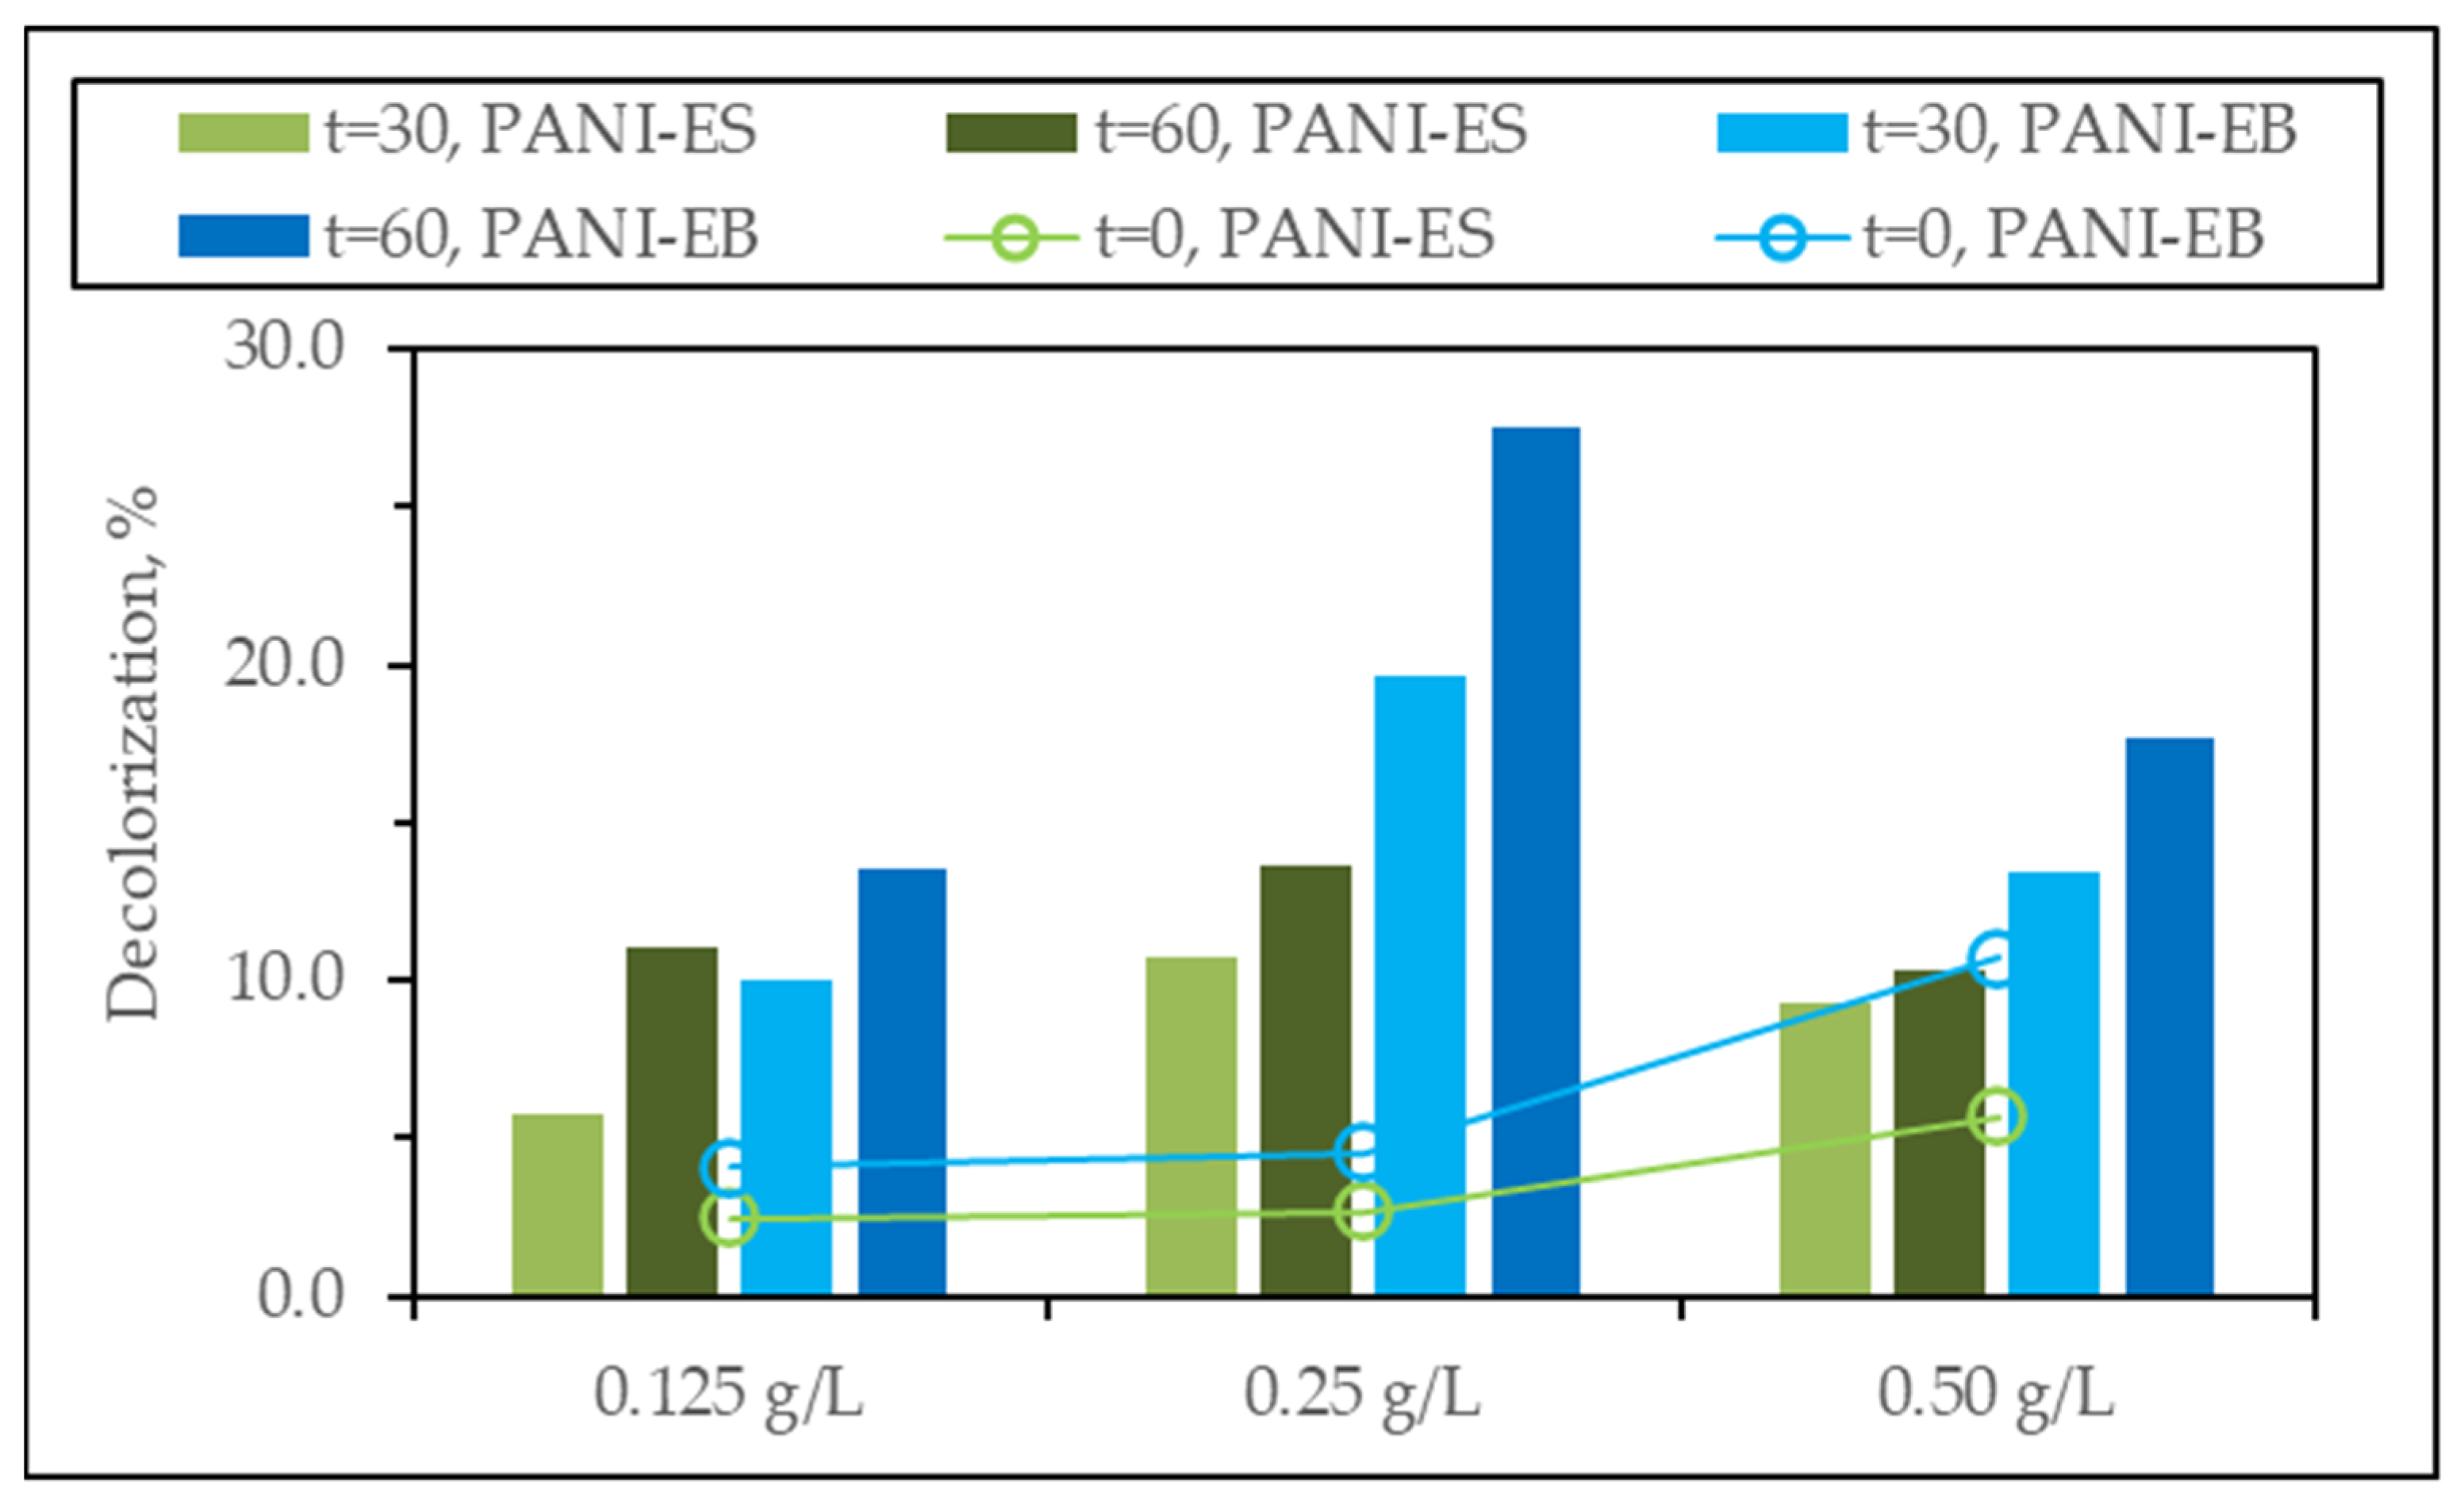
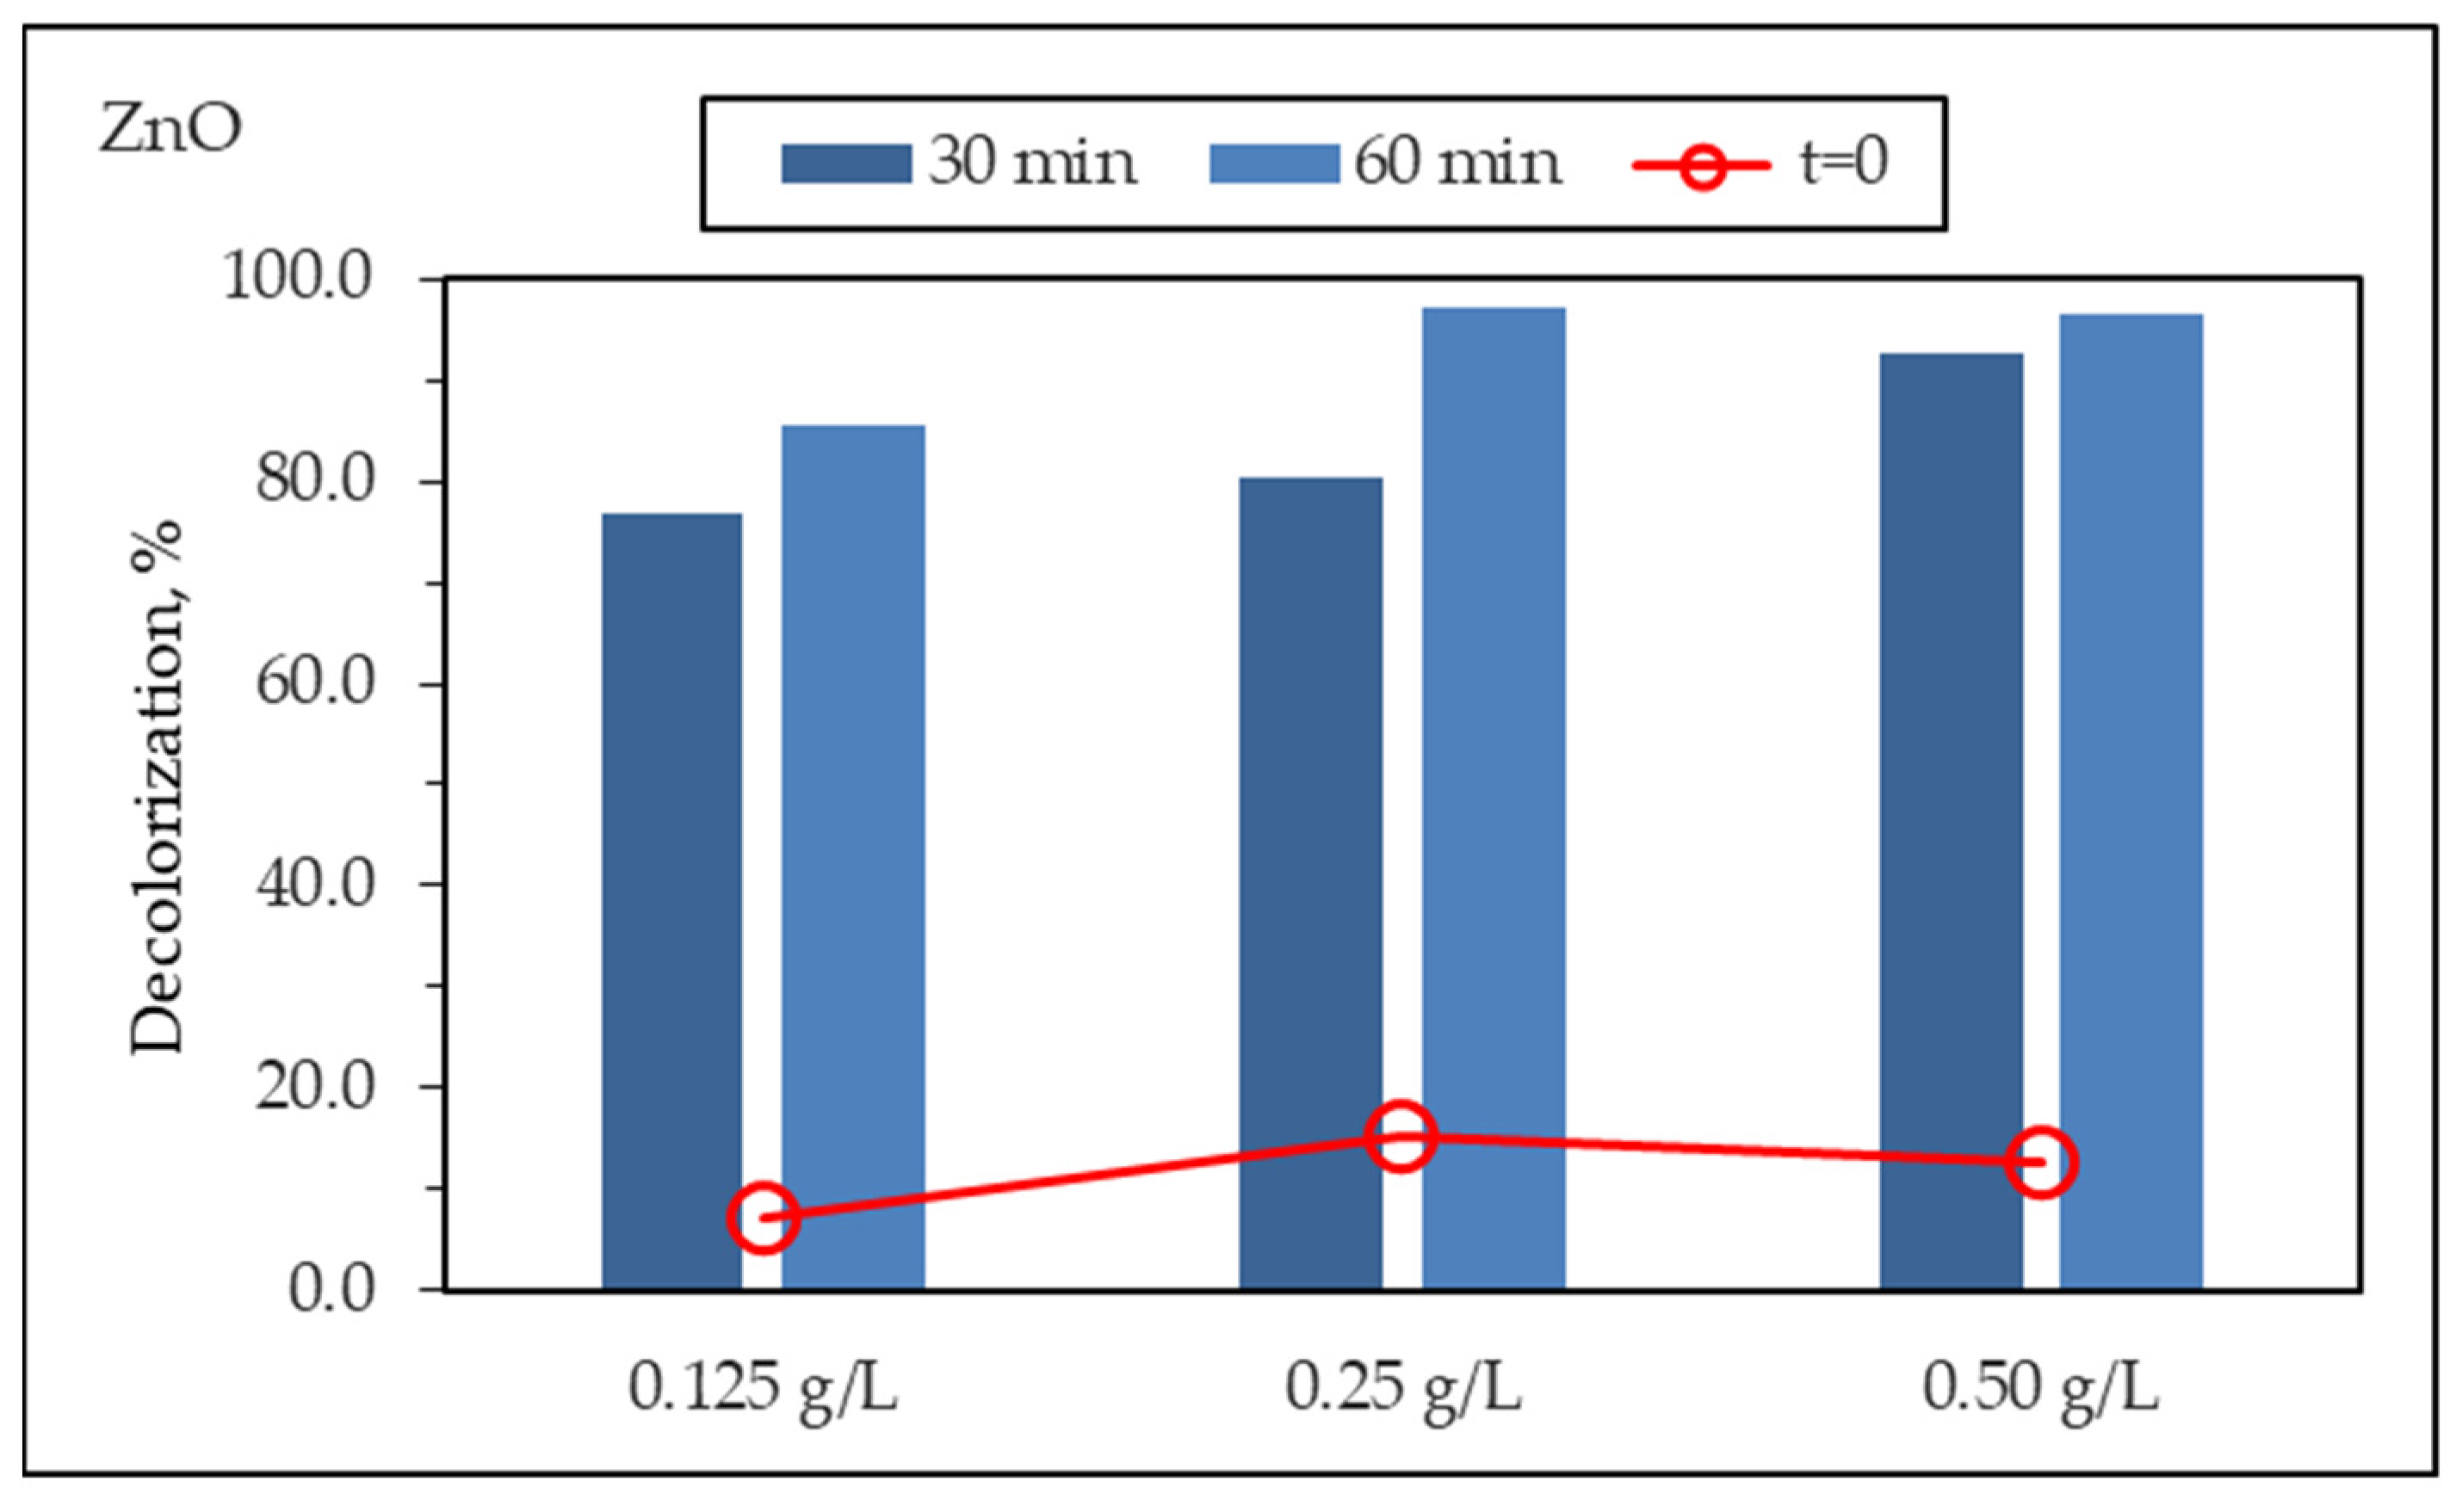
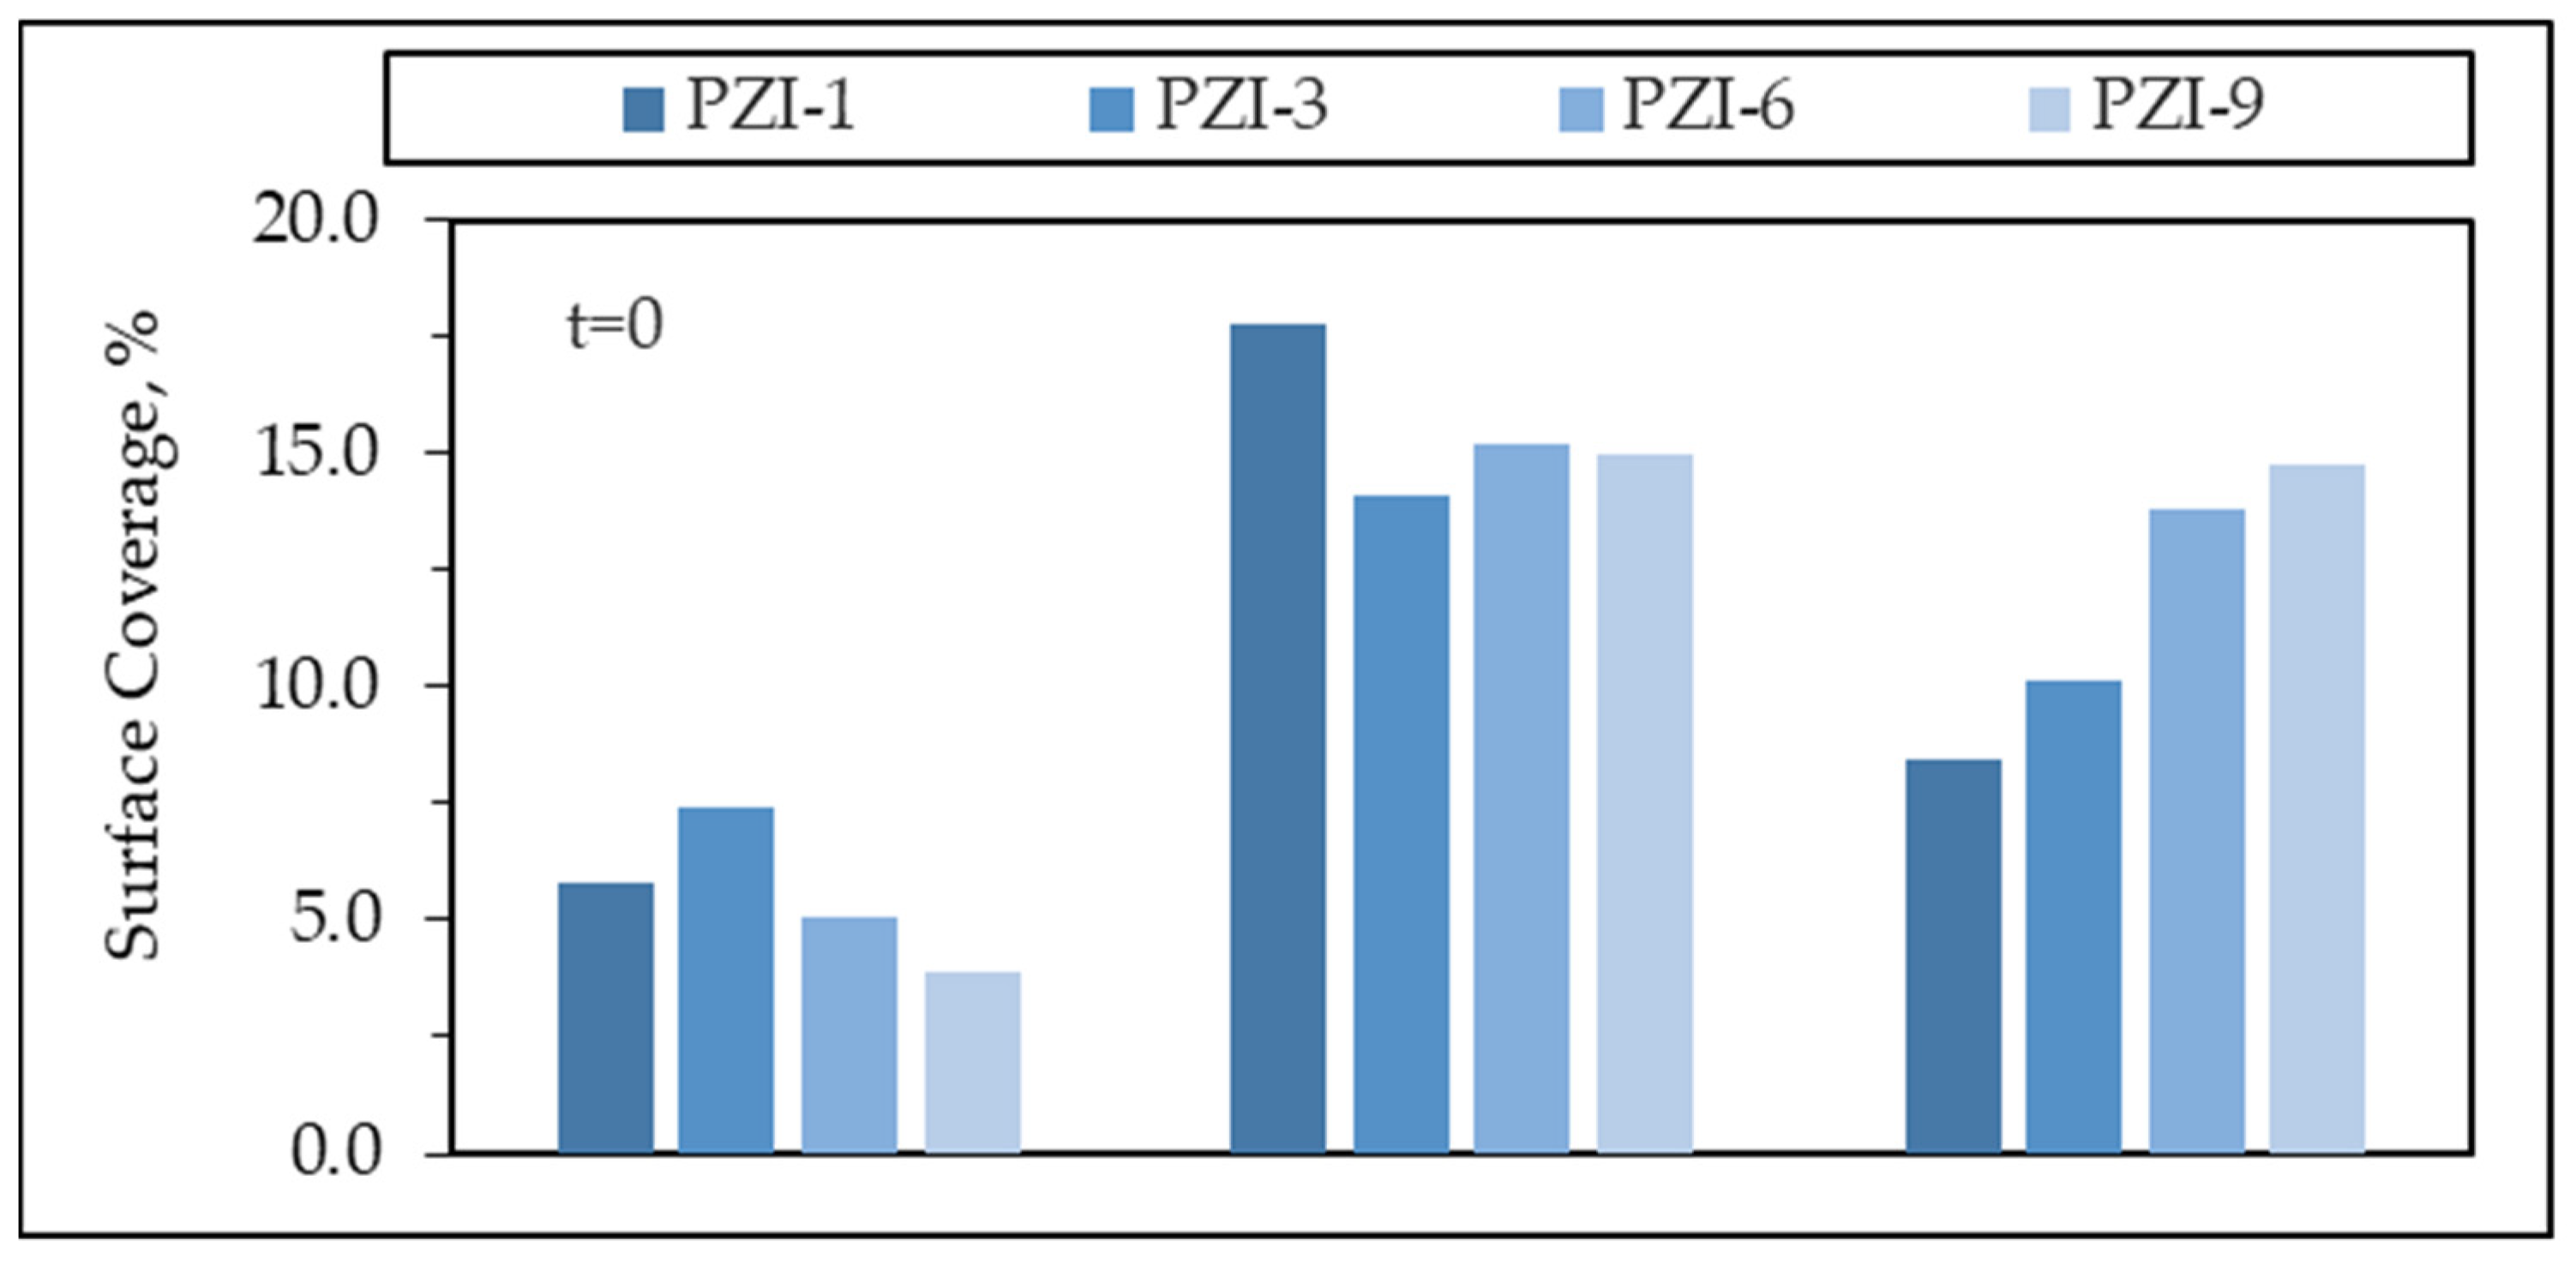
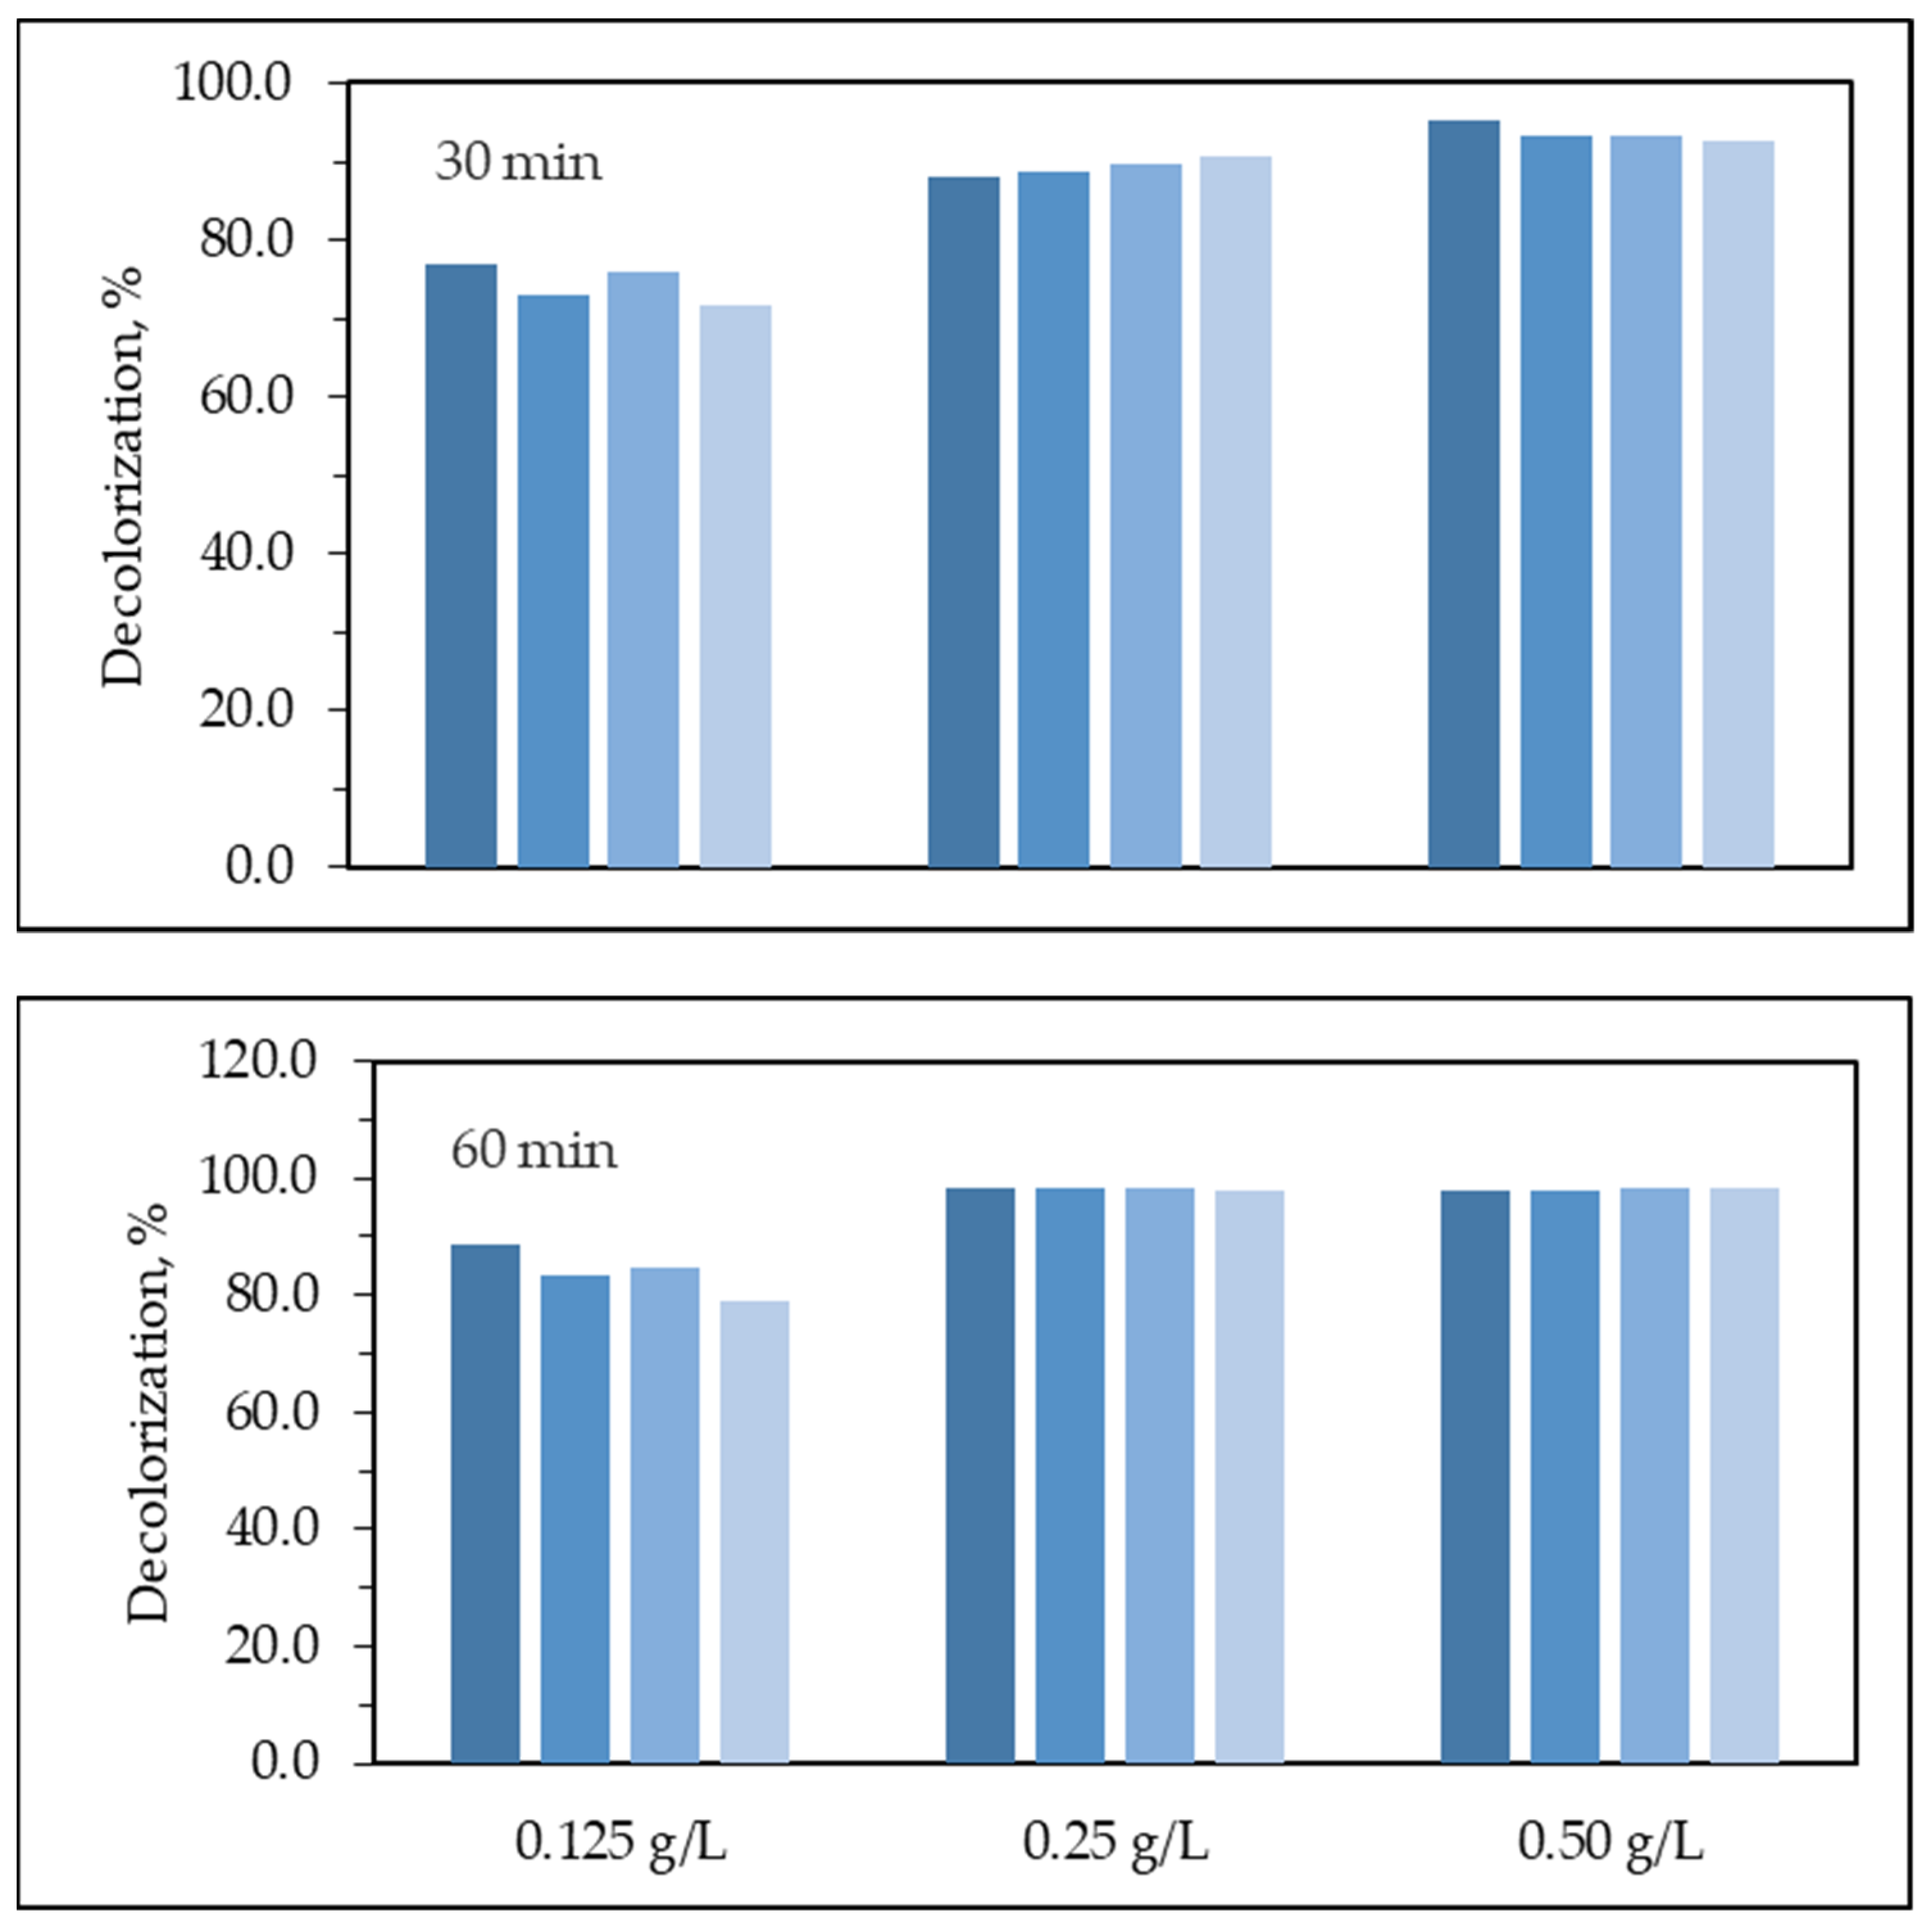
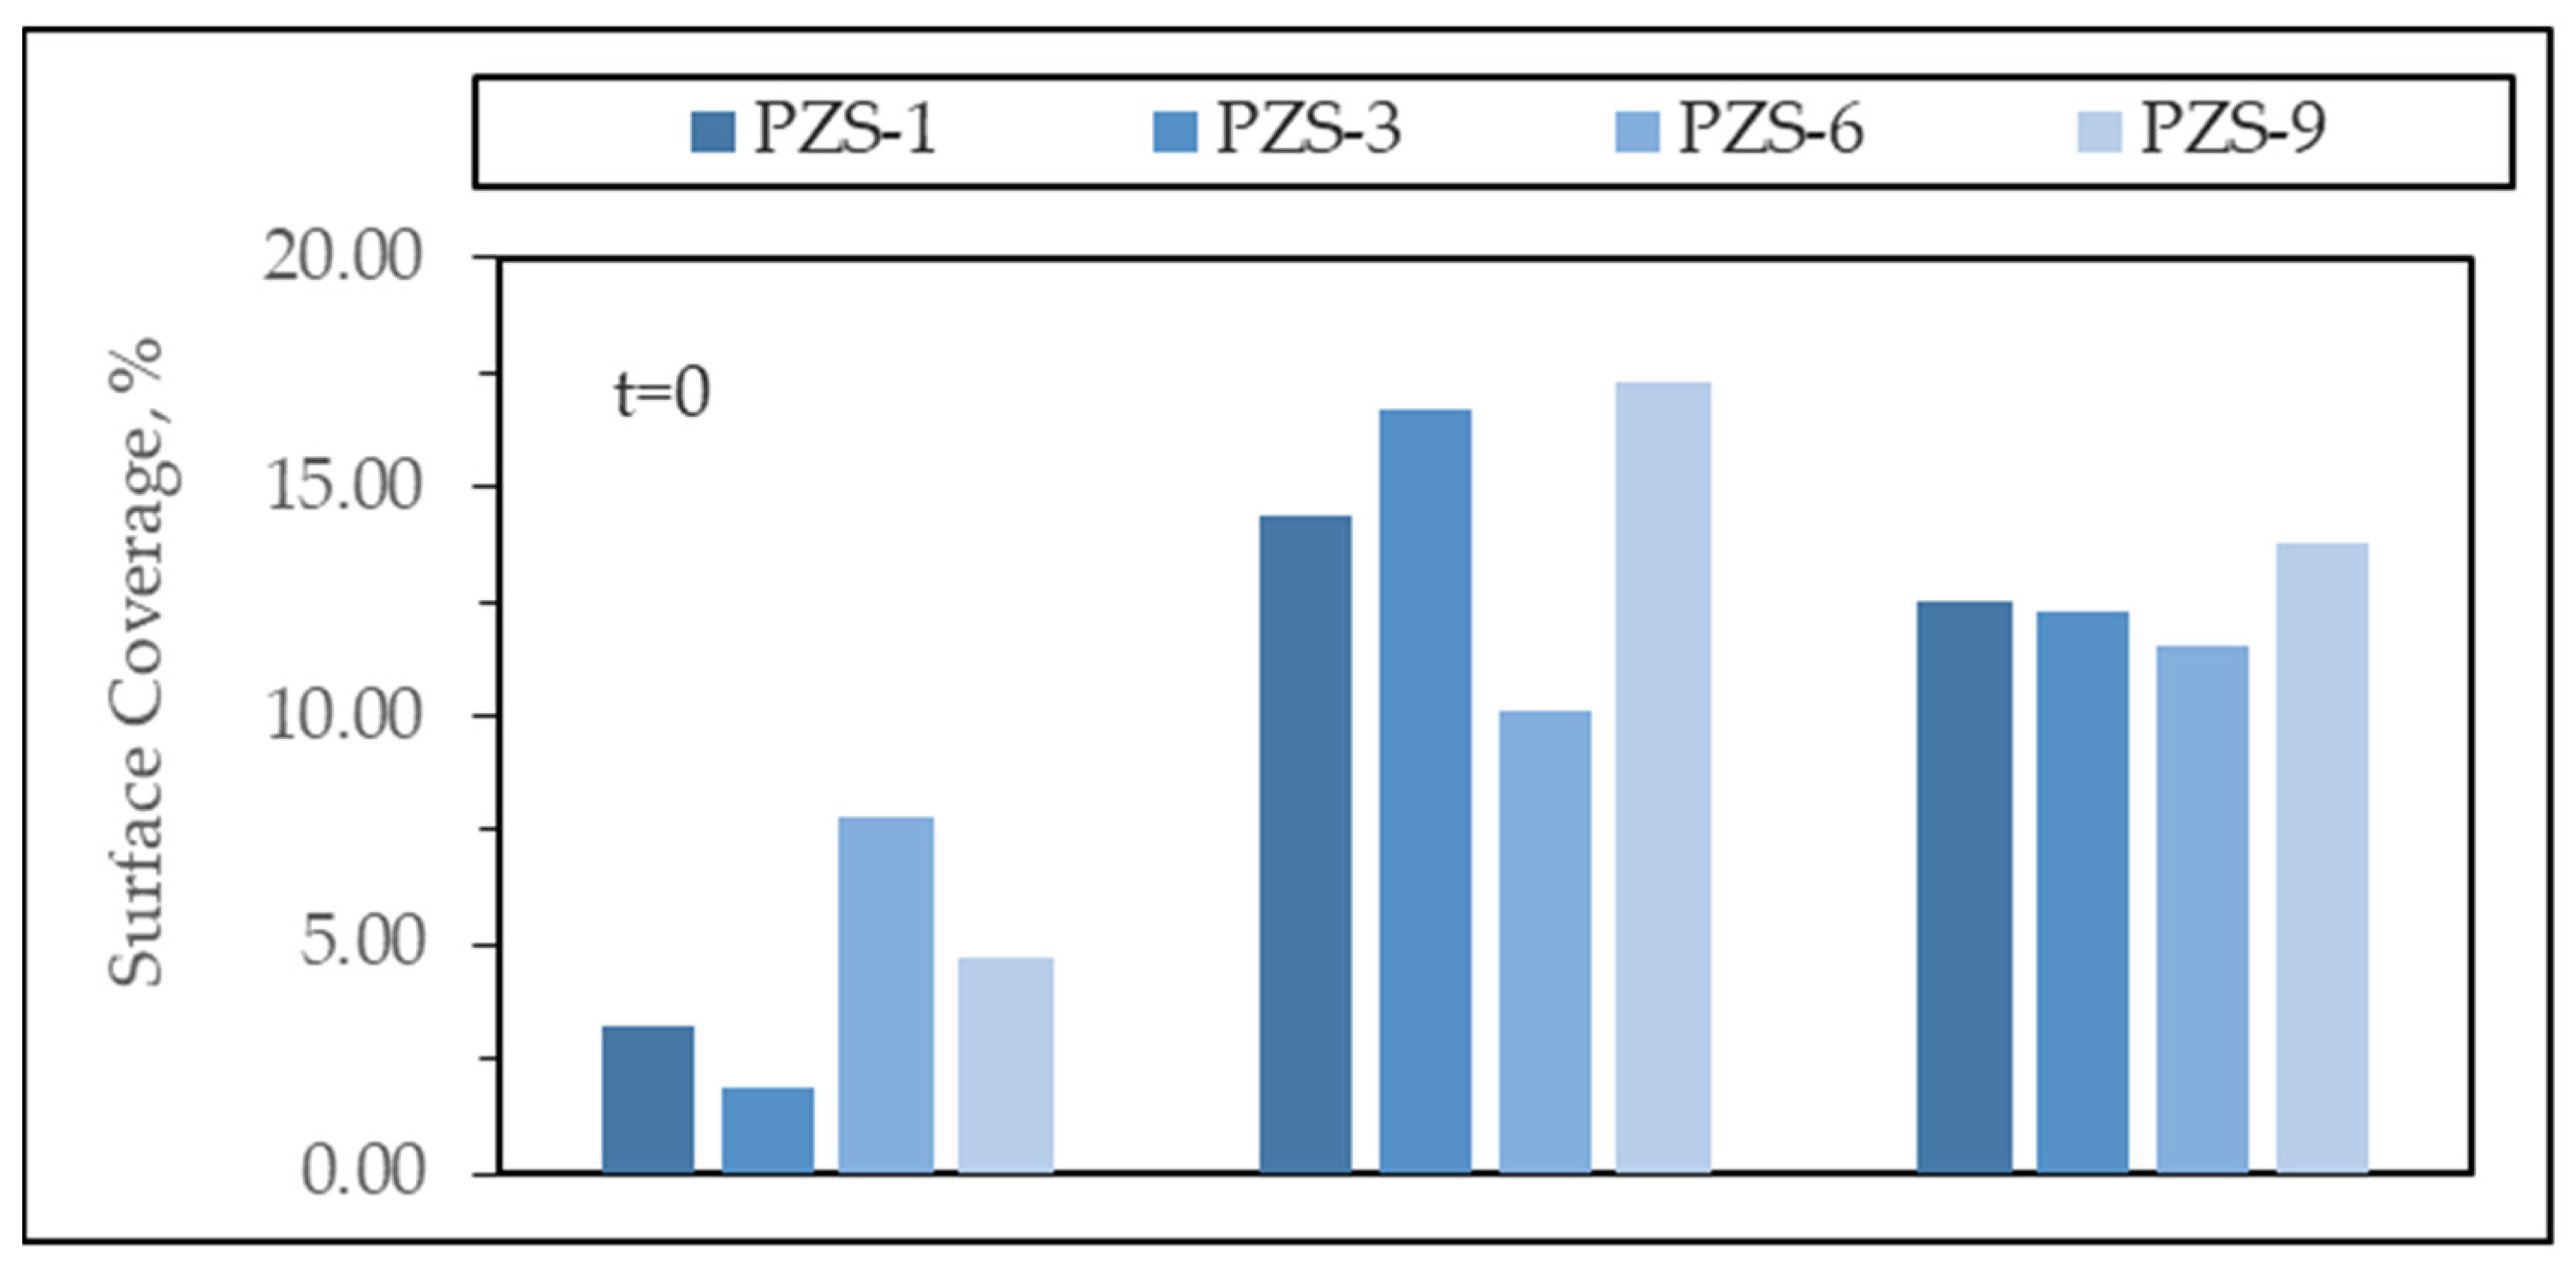
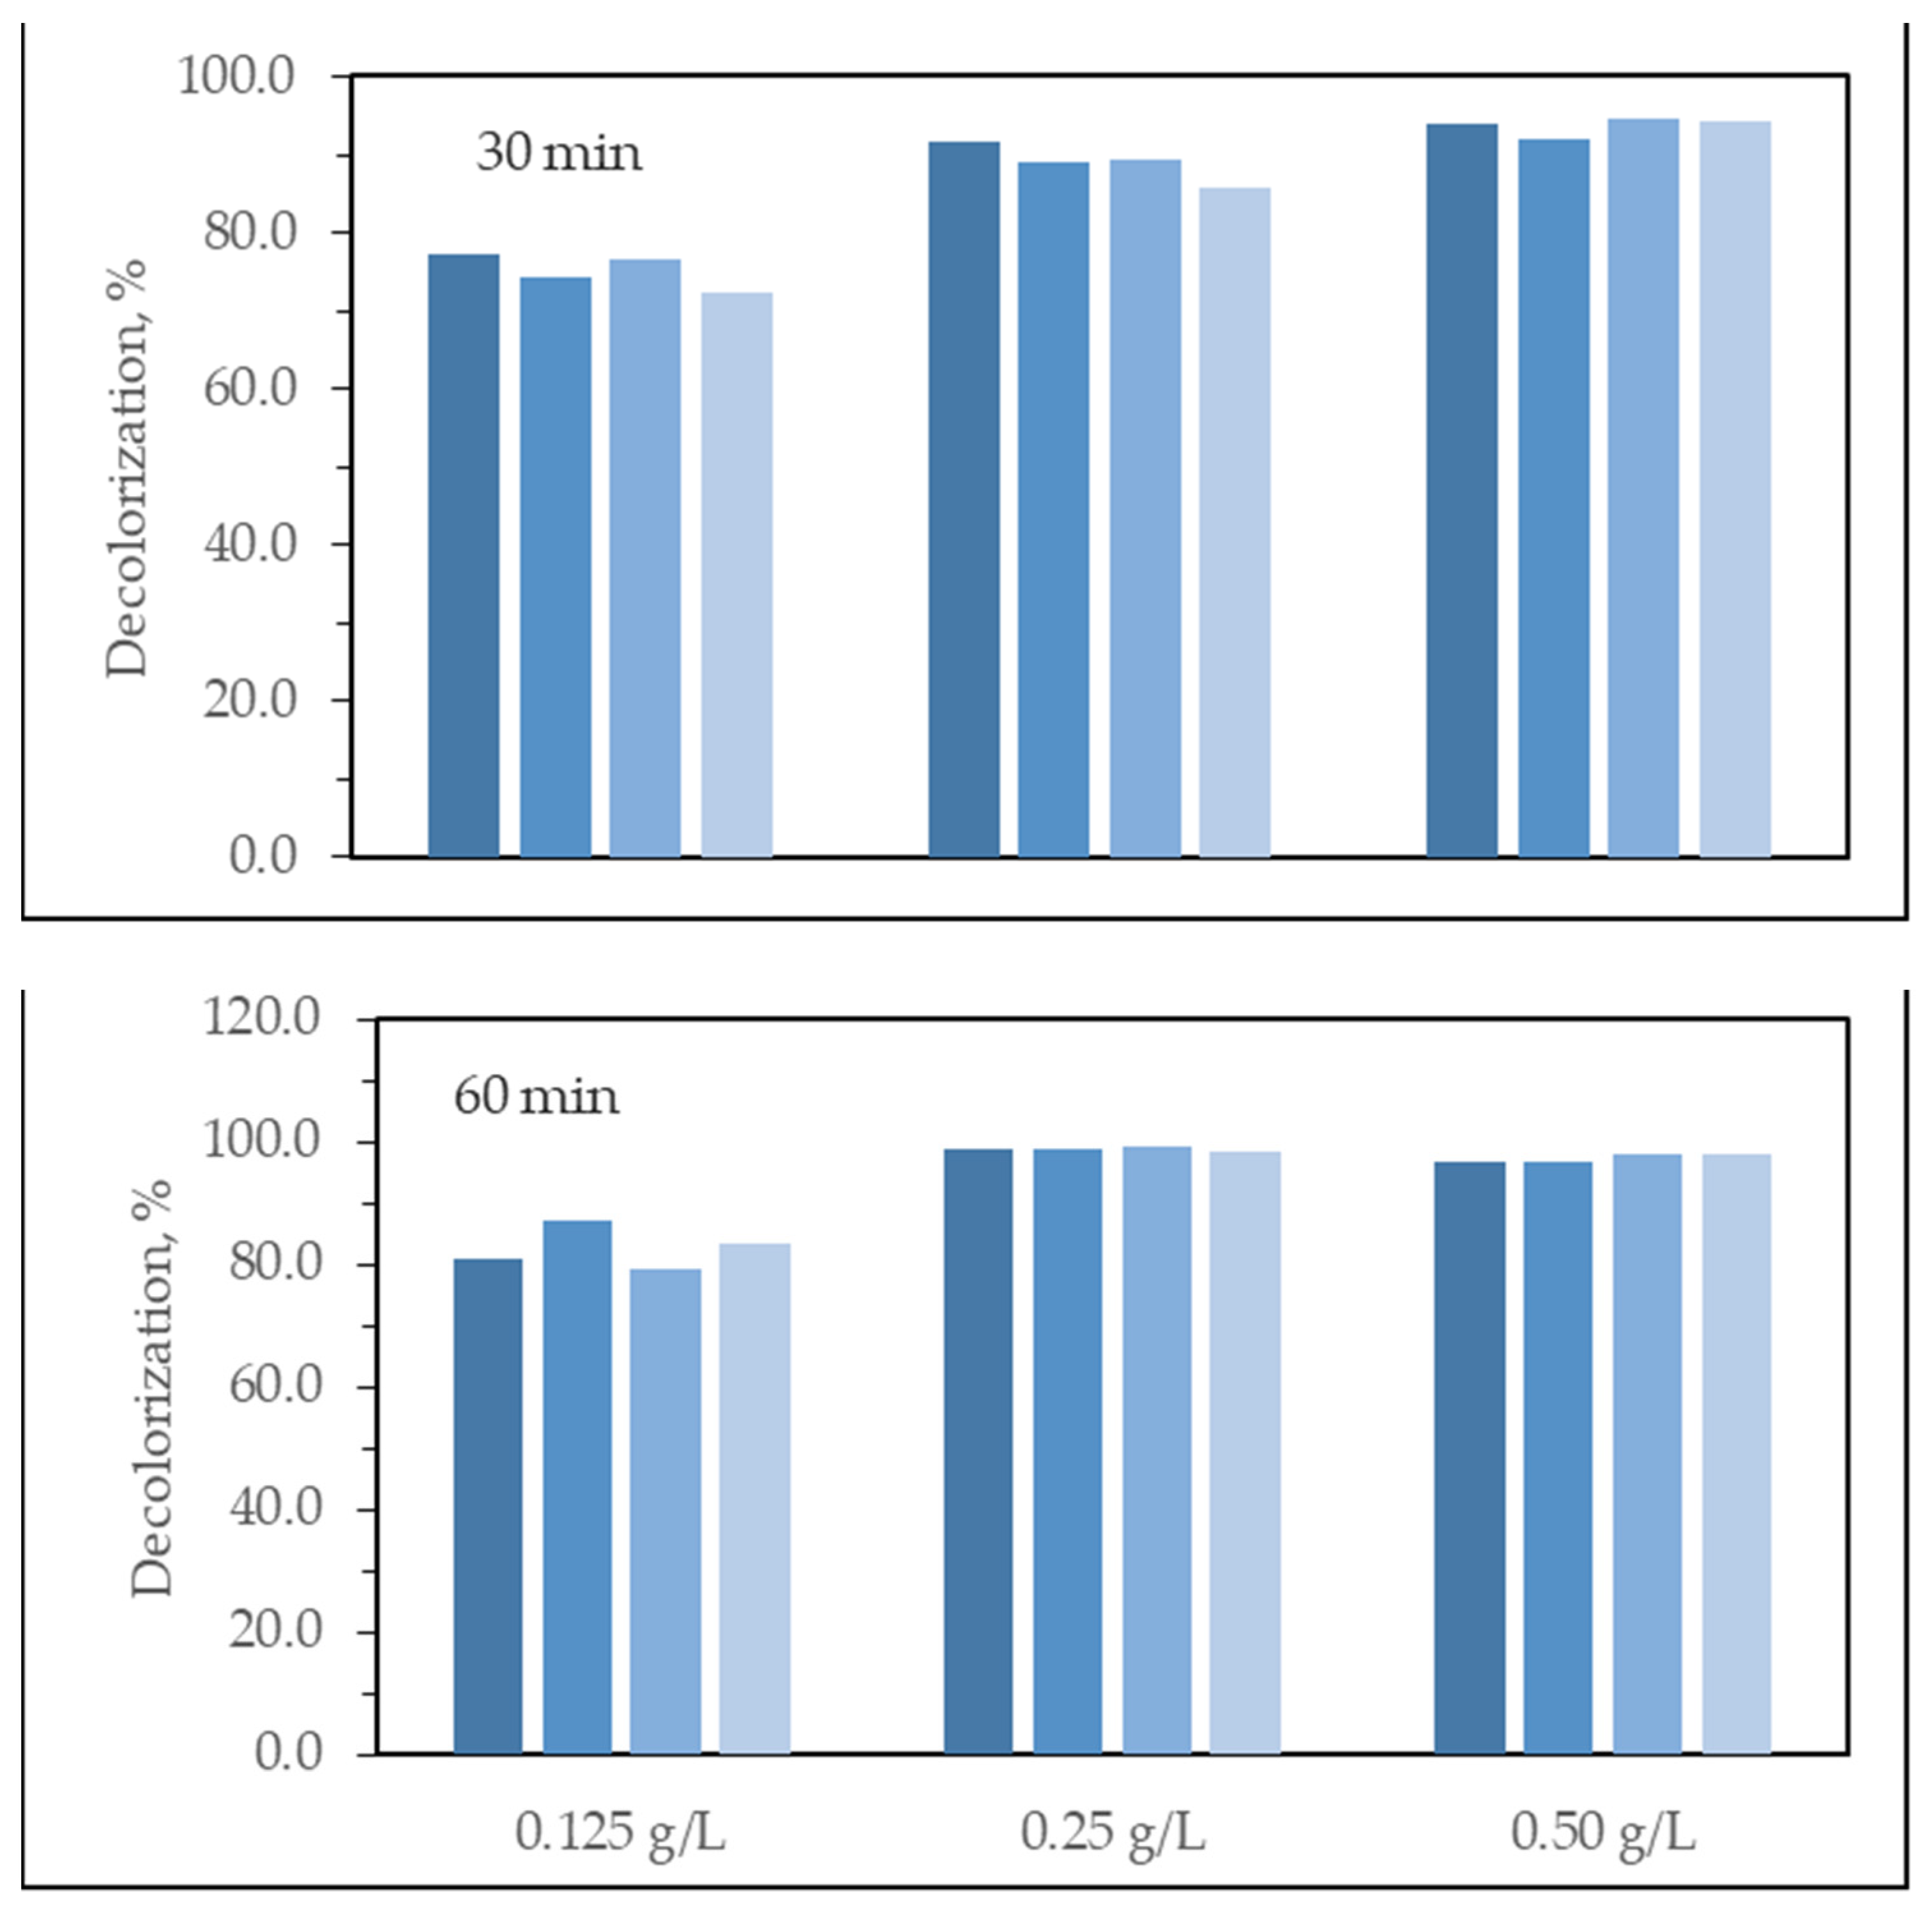
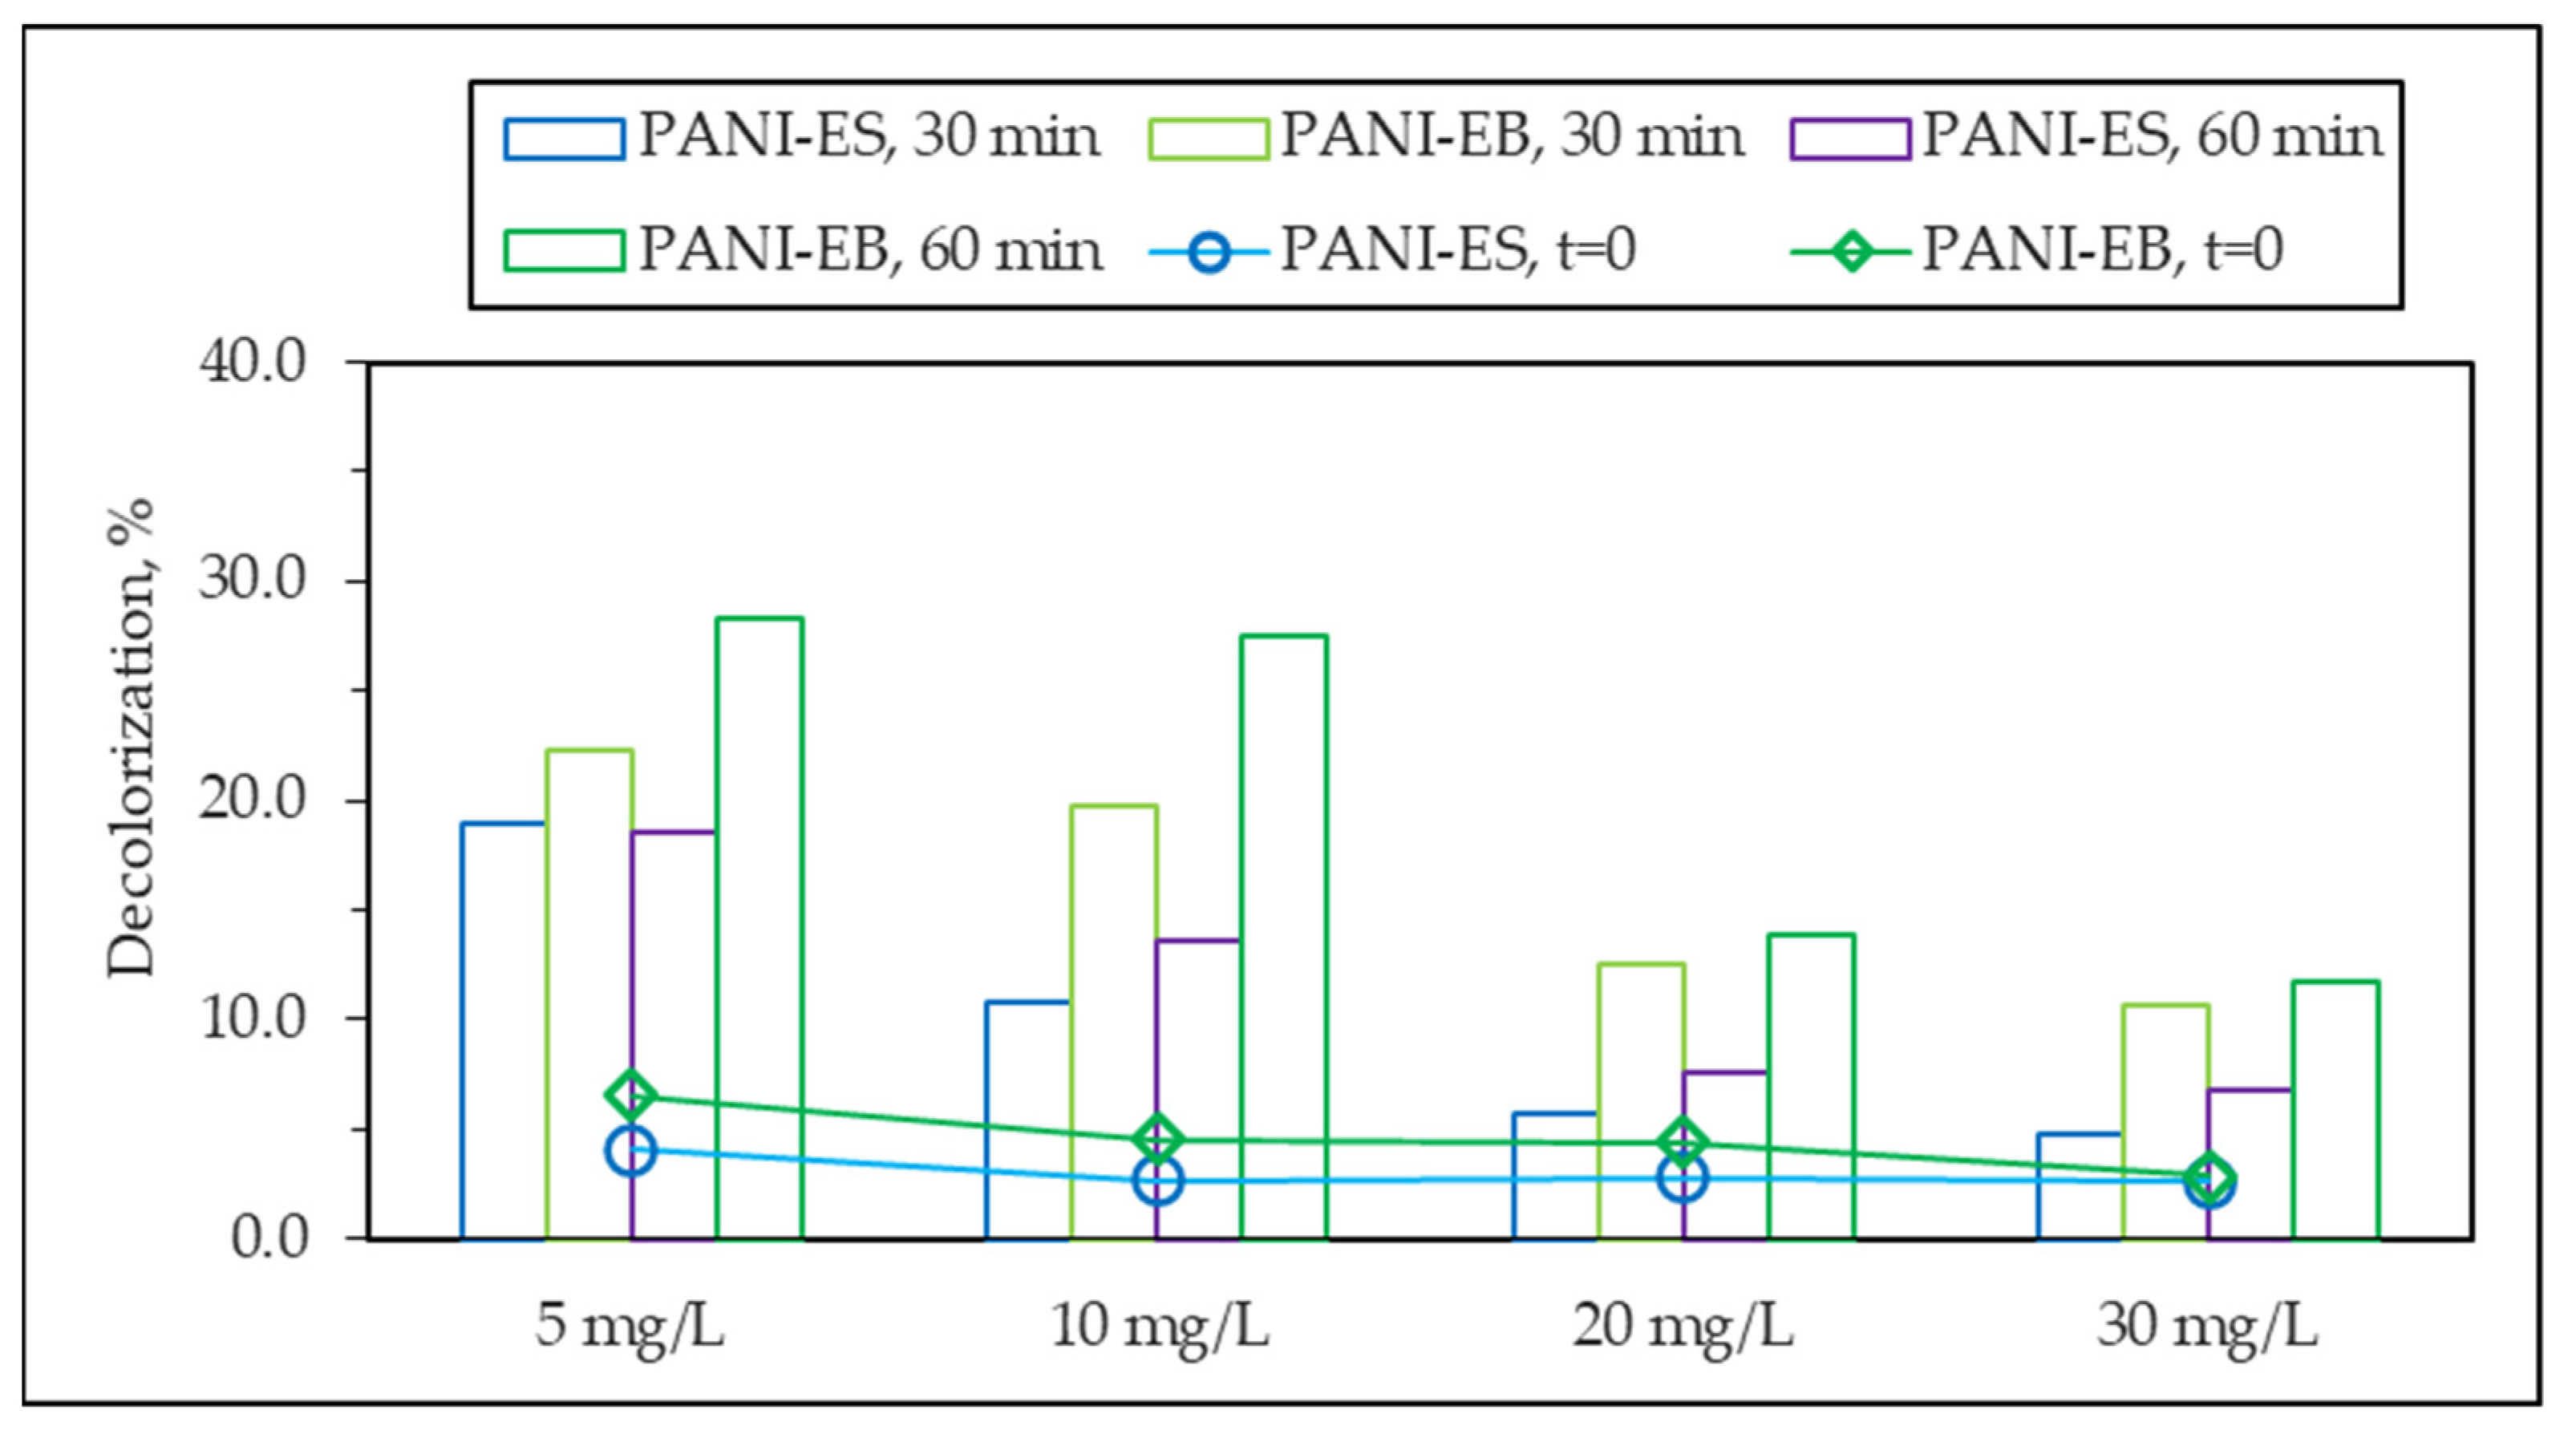
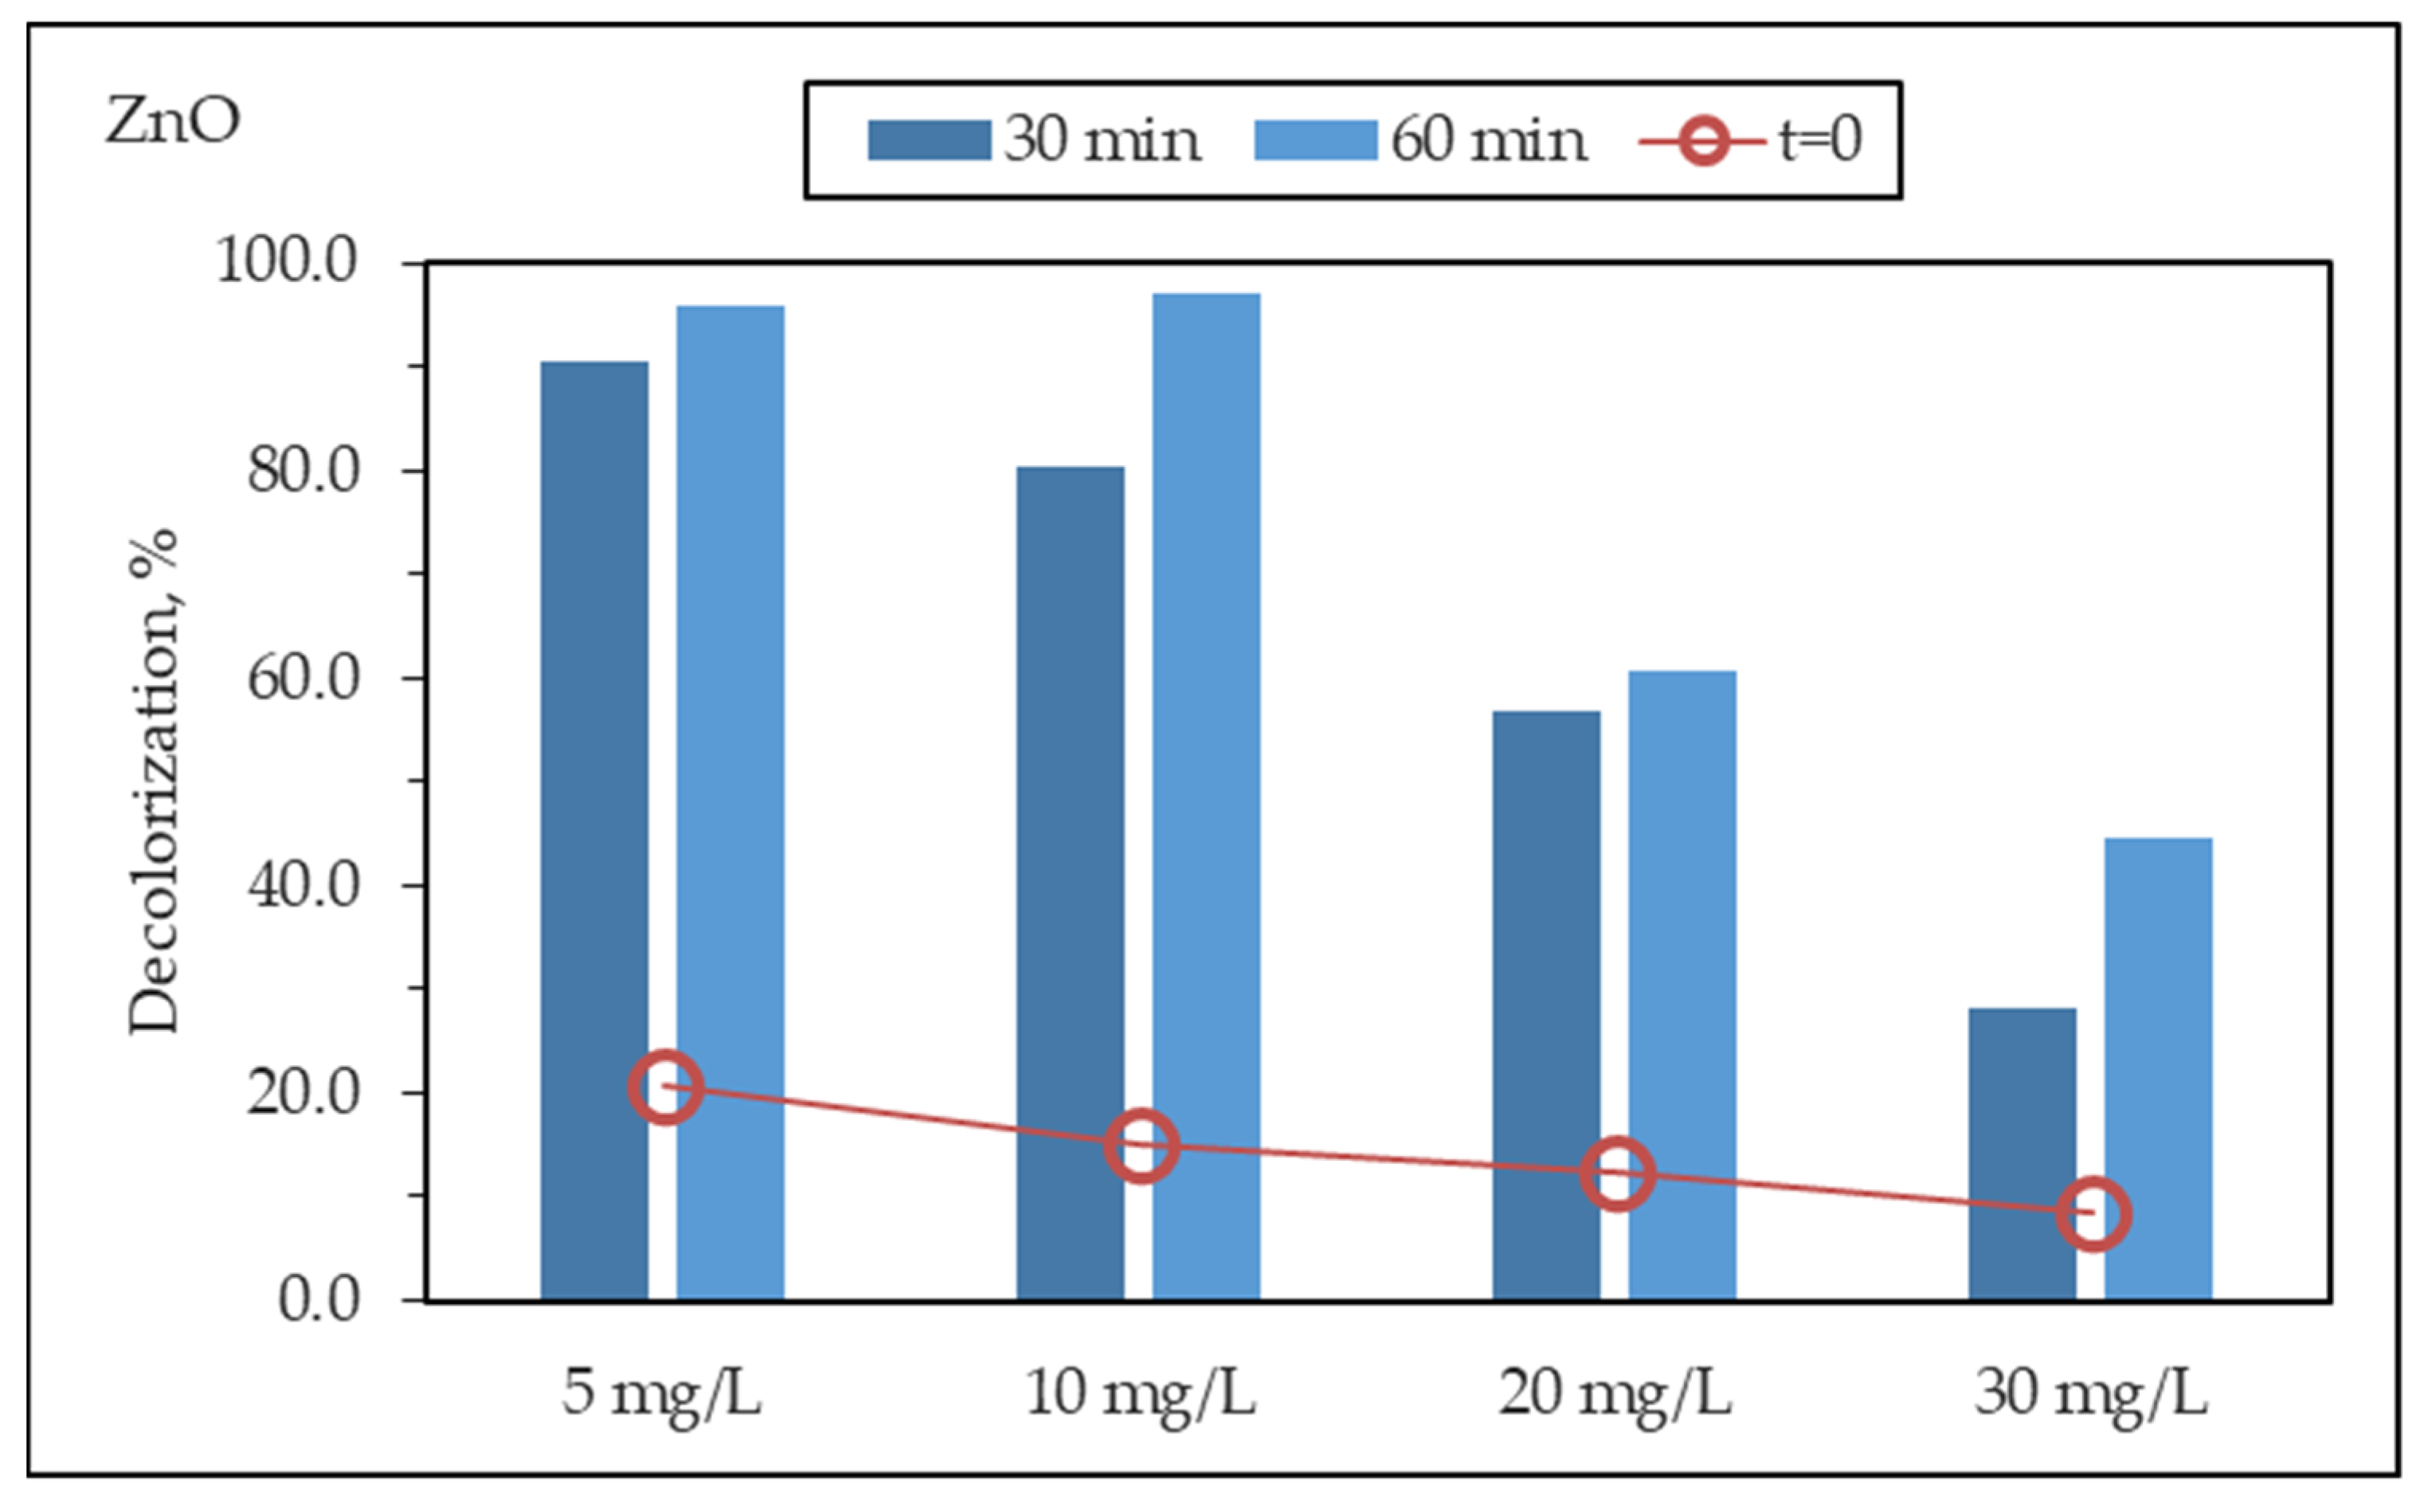
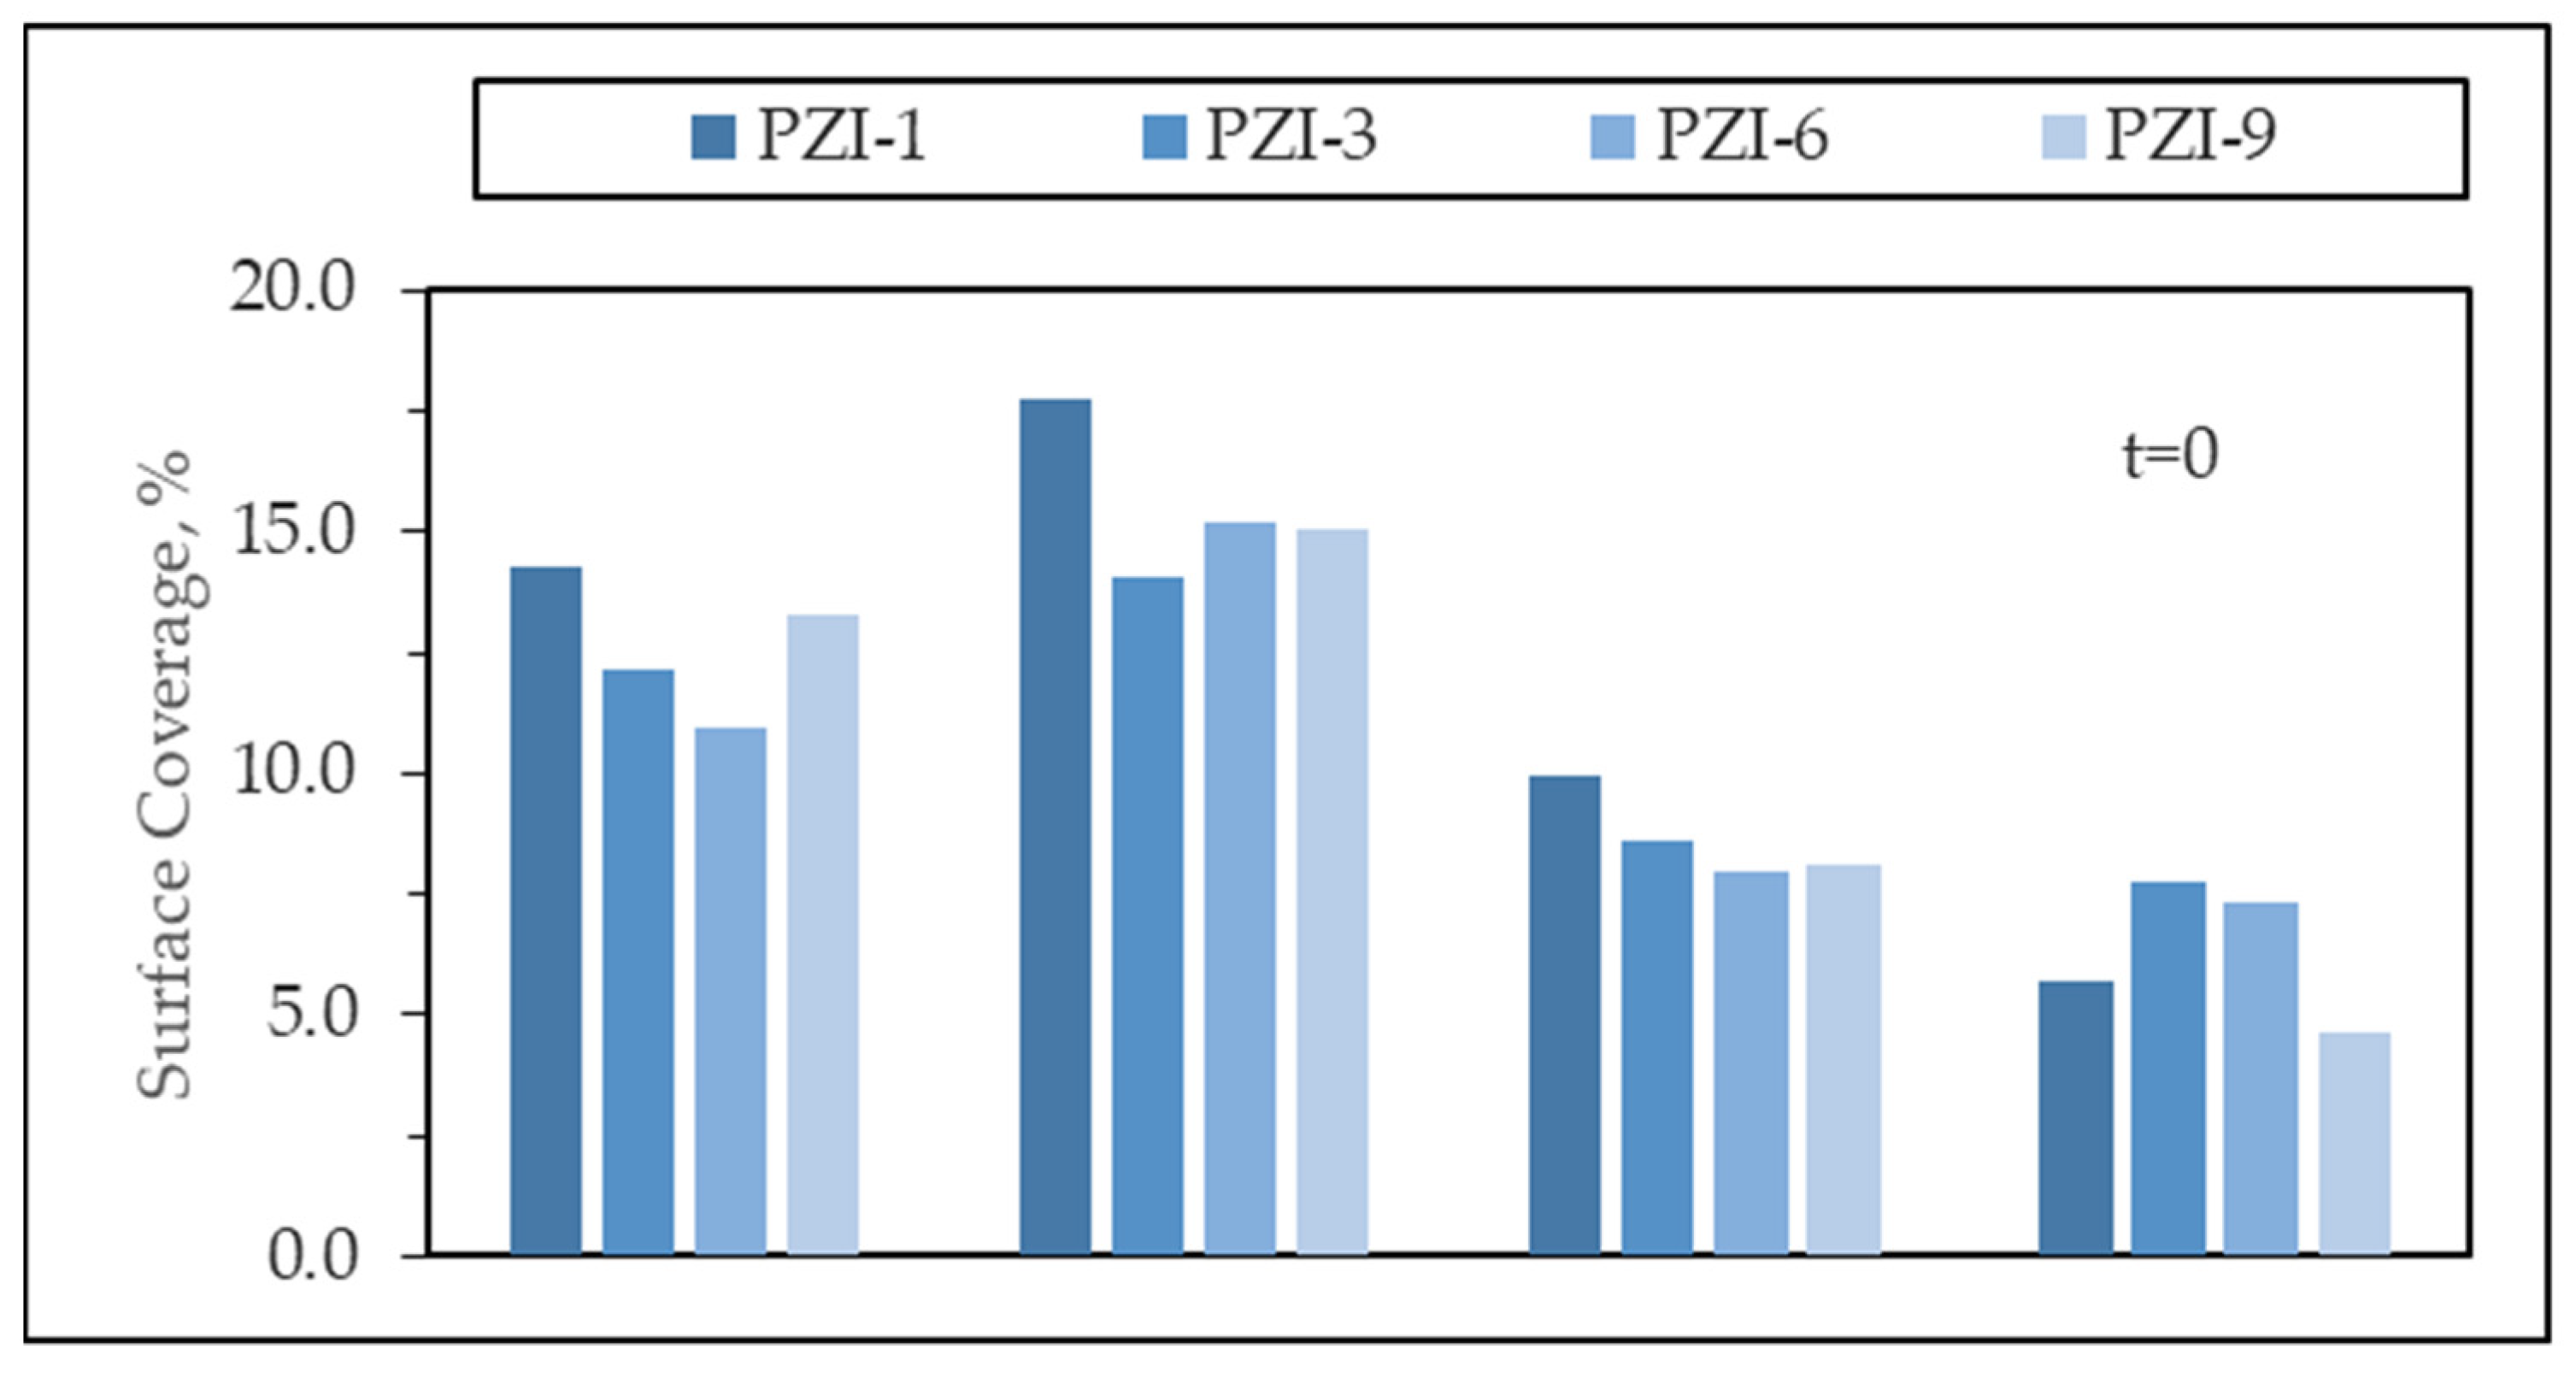
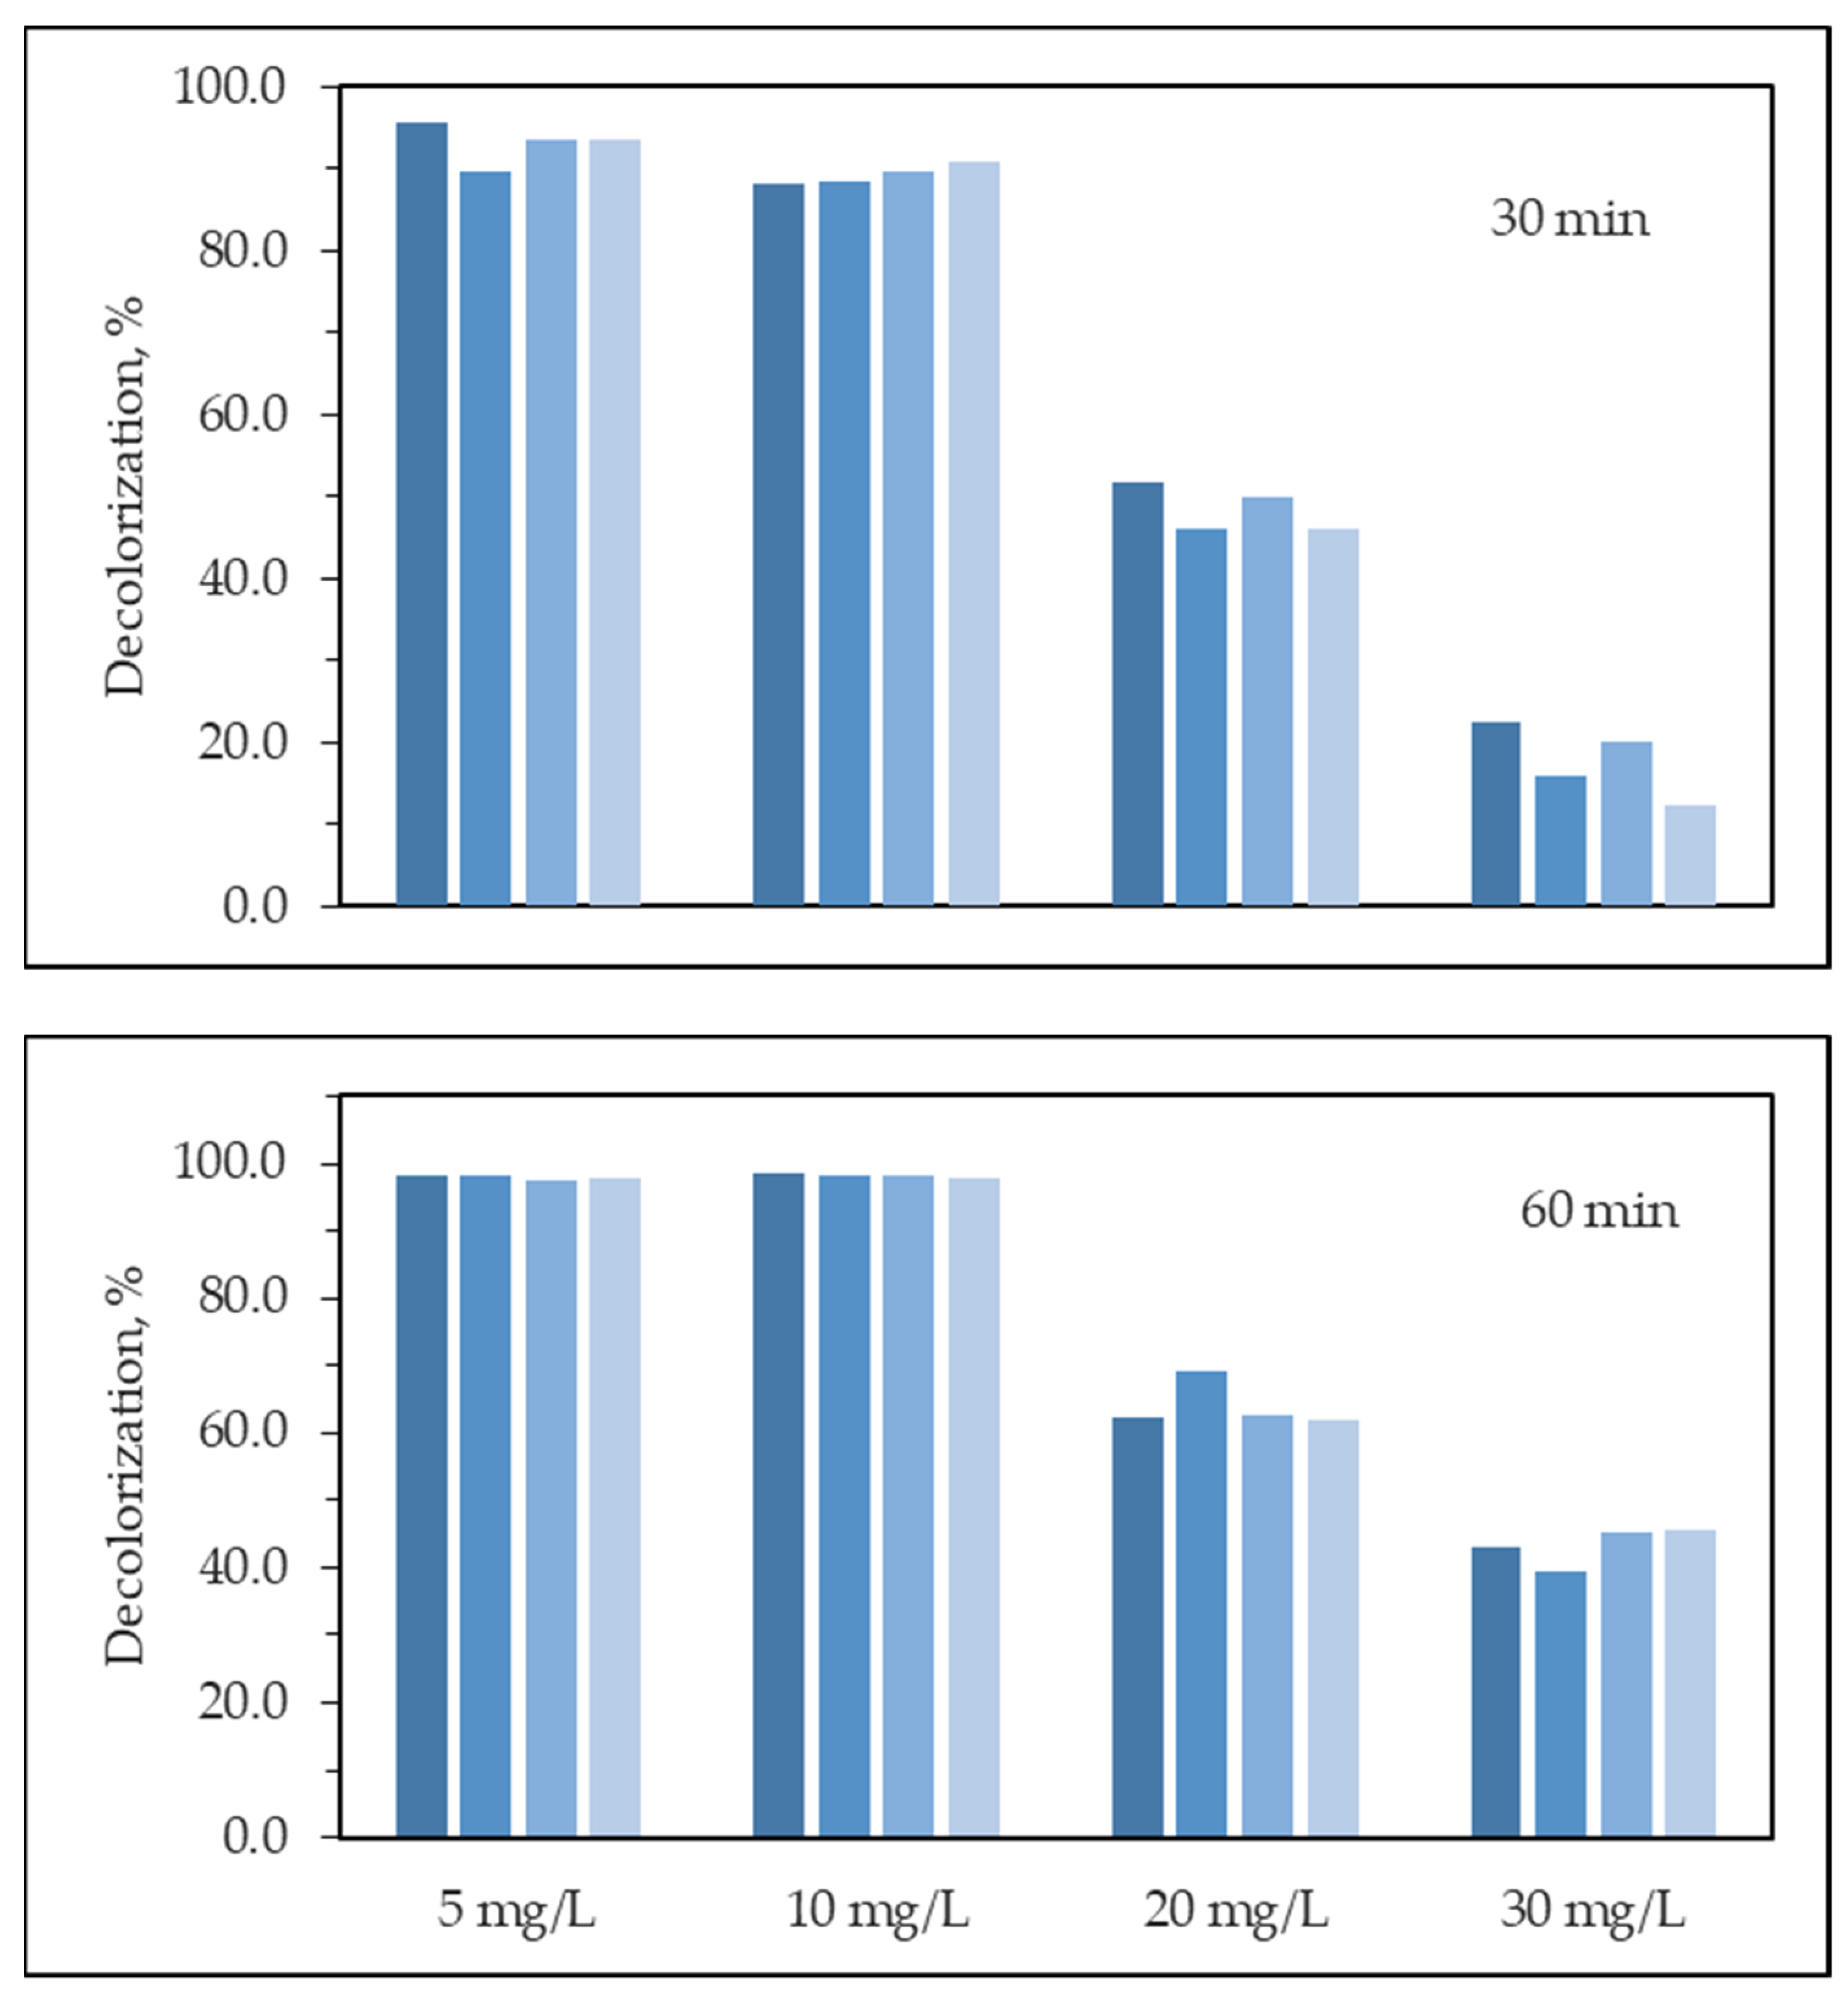
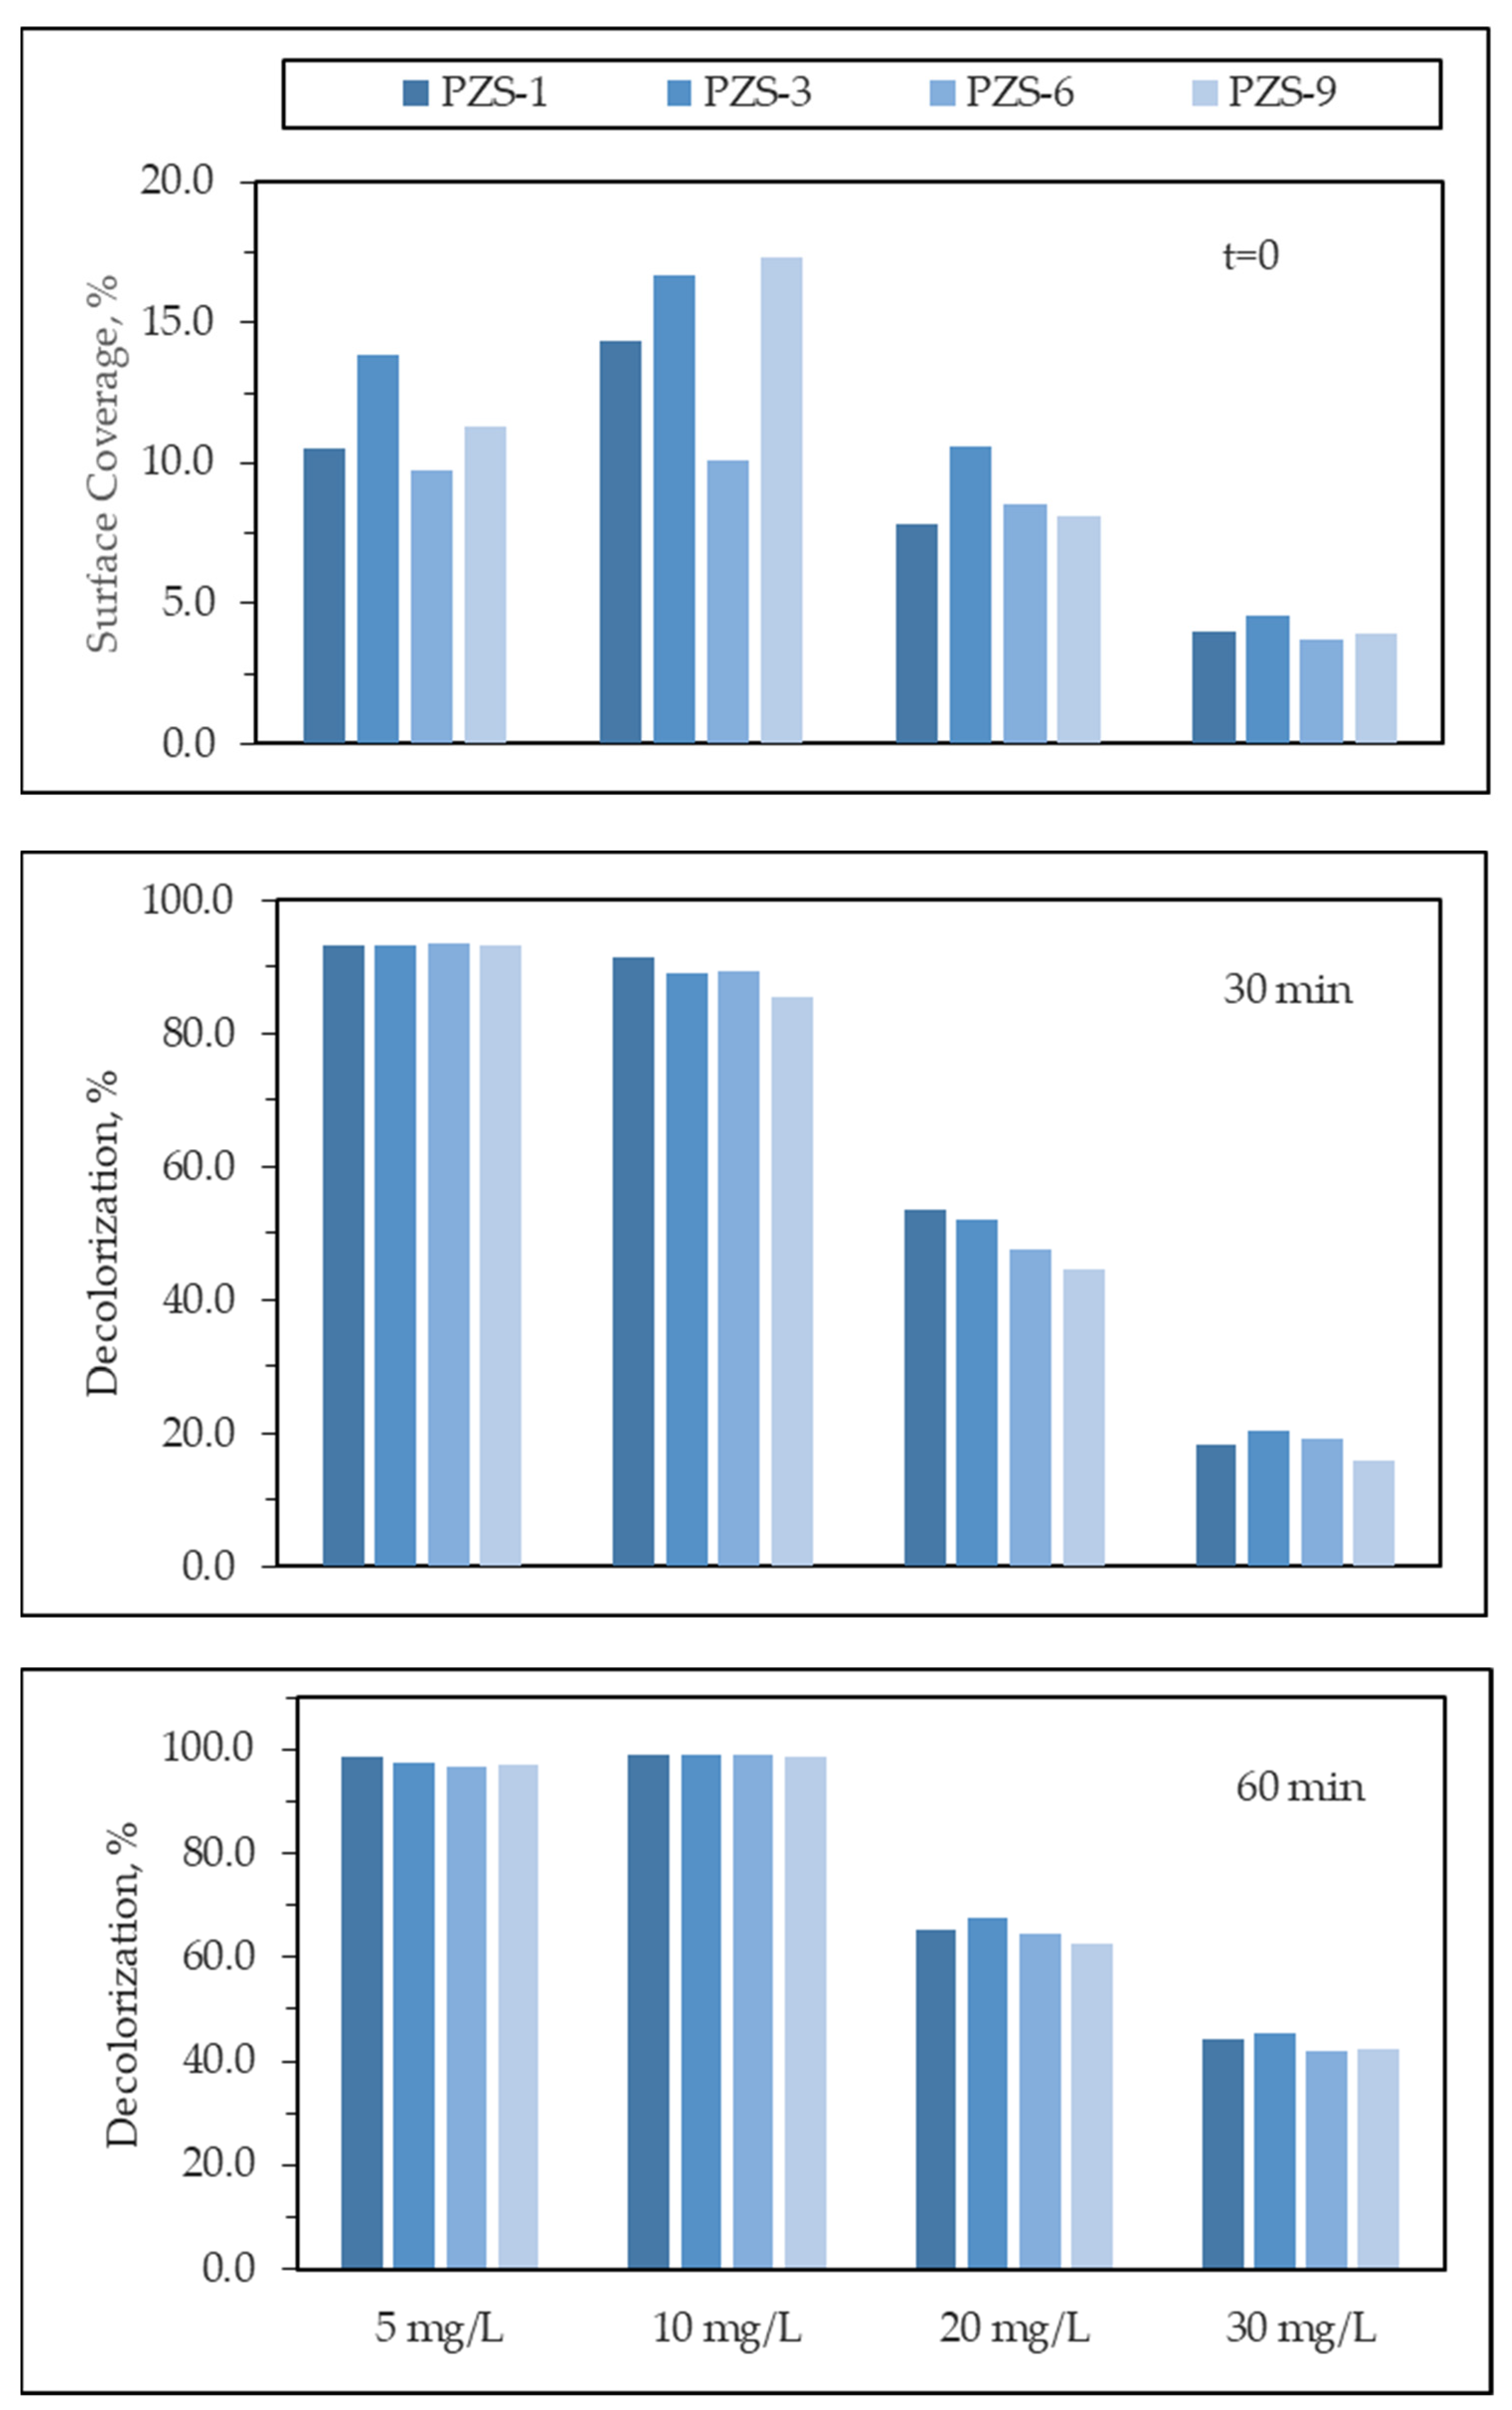
Table 1.
Photocatalytic degradation kinetics of MB expressed by A664, A292 and A246.
| First Order Kinetic Parameters | |||
|---|---|---|---|
| A664 | k × 10−2, min−1 | t1/2, min | Rate, cm−1 min−1 |
| ZnO | 5.39 | 12.9 | 0.0970 |
| PZI-1 | 5.73 | 12.1 | 0.105 |
| PZI-3 | 5.85 | 11.8 | 0.107 |
| PZI-6 | 6.14 | 11.3 | 0.112 |
| PZI-9 | 5.55 | 12.4 | 0.102 |
| PZS-1 | 6.47 | 10.7 | 0.118 |
| PZS-3 | 7.13 | 9.73 | 0.130 |
| PZS-6 | 6.82 | 10.2 | 0.125 |
| PZS-9 | 5.73 | 12.1 | 0.105 |
| A292 | |||
| ZnO | 3.32 | 20.9 | 0.0359 |
| PZI-1 | 3.18 | 21.8 | 0.0343 |
| PZI-3 | 3.22 | 21.5 | 0.0348 |
| PZI-6 | 3.34 | 20.7 | 0.0361 |
| PZI-9 | 3.12 | 22.2 | 0.0337 |
| PZS-1 | 3.51 | 19.8 | 0.0379 |
| PZS-3 | 3.87 | 17.9 | 0.0418 |
| PZS-6 | 3.82 | 18.1 | 0.0413 |
| PZS-9 | 3.28 | 21.1 | 0.0355 |
| A246 | |||
| ZnO | 2.36 | 29.4 | 0.0120 |
| PZI-1 | 1.93 | 35.9 | 0.00983 |
| PZI-3 | 2.07 | 33.6 | 0.0105 |
| PZI-6 | 2.10 | 33.0 | 0.0107 |
| PZI-9 | 2.00 | 34.7 | 0.0102 |
| PZS-1 | 2.24 | 30.9 | 0.0114 |
| PZS-3 | 2.43 | 28.5 | 0.0124 |
| PZS-6 | 2.48 | 27.9 | 0.0126 |
| PZS-9 | 2.19 | 31.7 | 0.0111 |
Publisher’s Note: MDPI stays neutral with regard to jurisdictional claims in published maps and institutional affiliations. |
© 2021 by the authors. Licensee MDPI, Basel, Switzerland. This article is an open access article distributed under the terms and conditions of the Creative Commons Attribution (CC BY) license (https://creativecommons.org/licenses/by/4.0/).
Share and Cite
MDPI and ACS Style
Turkten, N.; Karatas, Y.; Bekbolet, M. Preparation of PANI Modified ZnO Composites via Different Methods: Structural, Morphological and Photocatalytic Properties. Water 2021, 13, 1025. https://doi.org/10.3390/w13081025
AMA Style
Turkten N, Karatas Y, Bekbolet M. Preparation of PANI Modified ZnO Composites via Different Methods: Structural, Morphological and Photocatalytic Properties. Water. 2021; 13(8):1025. https://doi.org/10.3390/w13081025
Chicago/Turabian StyleTurkten, Nazli, Yunus Karatas, and Miray Bekbolet. 2021. "Preparation of PANI Modified ZnO Composites via Different Methods: Structural, Morphological and Photocatalytic Properties" Water 13, no. 8: 1025. https://doi.org/10.3390/w13081025
Note that from the first issue of 2016, this journal uses article numbers instead of page numbers. See further details here.