
The Different Spatial and Temporal Variability of Terrestrial Water Storage in Major Grain-Producing Regions of China
by
 , ,
, ,
Zheng Chen
1,2, 
Wenjie Wang
2,*,
Weiguo Jiang
3,4,*,
Mingliang Gao
5,
Beibei Zhao
2 and
Yunwei Chen
2 1
Chinese Research Academy of Environmental Sciences, Beijing 100012, China
2
Technical Centre for Soil, Agriculture and Rural Ecology and Environment, Ministry of Ecology and Environment, Beijing 100012, China
3
Key Laboratory of Environmental Change and Natural Disaster, Beijing Normal University, Beijing 100875, China
4
Faculty of Geographical Science, Beijing Normal University, Beijing 100875, China
5
College of Resources Environment and Tourism, Capital Normal University, Beijing 100048, China
*
Authors to whom correspondence should be addressed.
Water 2021, 13(8), 1027; https://doi.org/10.3390/w13081027
Submission received: 2 March 2021
/
Revised: 1 April 2021
/
Accepted: 1 April 2021
/
Published: 9 April 2021
(This article belongs to the Section Hydrology)
Abstract
:Irrigation is an important factor affecting the change of terrestrial water storage (TWS), especially in grain-producing areas. The Northeast China Plain (NECP), the Huang-Huai-Hai Plain (HHH) and the middle and lower reaches of the Yangtze River Basin Plain (YRB) are major grain-producing regions of China, with particular climate conditions, crops and irrigation schemes. However, there are few papers focusing on the different variation pattern of water storage between NECP, HHH and YRB. In this paper, the characteristics of terrestrial water storage anomaly (TWSA) and groundwater storage in the three regions mentioned above from 2003 to 2014 were analyzed, and the main reasons for water storage variations in the three regions were also discussed. The result shows that although effective irrigated areas increased in all three regions, TWSA only decreased in HHH and TWSA in the other two regions have shown an increasing trend. Spatially, the water storage deficit was more serious in middle and south NECP and HHH. In the three regions, water storage variations were impacted by meteorological condition and anthropogenic stress (e.g., irrigation). However, irrigation water consumption has a greater impact on water storage deficit in HHH than the other two regions, and water storage variation in YRB was mainly impacted by meteorological conditions. In this case, we suggest that the structure of agricultural planting in HHH should be adjusted to reduce the water consumption for irrigation.
1. Introduction
Freshwater is a significant resource to sustain agriculture and ensure food security. Water consumption in irrigation accounts for about 70% of global freshwater [1,2]. Terrestrial water storage (TWS), as an important component of water cycle, is strongly impacted by irrigation. Because of the diversity of climate conditions and human activity intensity, TWS changes are different from various regions [3]. The Northeast China Plain, the Huang-Huai-Hai Plain HHH and the middle-lower reaches of the Yangtze River Basin (YRB) are three major grain-producing regions of China with diverse climate conditions and agriculture planting characteristics. Thus, what is the difference of TWS variability in the three grain-producing areas?
TWS is defined as all forms of water stored above and underneath the surface of the Earth, and is a combination of snow, ice, soil moisture (SM), groundwater, surface water and biomass [4,5]. At present, TWS change is monitored in three ways, including in situ observations, global hydrological models and satellite remote sensing. Because of the coarse distribution and difficult obtain, in situ measurements are impractical for water storage change studies at a large scale [6,7]. Hydrological models and land surface models simulate surface water storage (SWS), soil moisture storage (SMS) and groundwater storage (GWS) changes comprehensively considering natural and human impact factors [6,8,9]. However, model outputs may suffer from uncertainties due to limitations or errors in forcing, representation of physical processes and parameter calibration [10]. The GRACE satellites launched in 2002 has provide an opportunity to detect TWS changes at a large scale [11]. It provides accurate mass change information and has been used to study TWS changes over many regions worldwide, e.g., in the Amazon [12,13], Tibetan Plateau [14], India [15], Australia [16,17] and California’s Central Valley in the USA [18,19].
TWS changes in agricultural regions has attracted a great deal of attention [20]. Because of groundwater withdrawal for irrigation and drought, TWS changes in India, the North China Plain and the Yangzte River Basin has been in the limelight in recent years. India is the largest country of groundwater-fed irrigation, of which over 70% of irrigation agriculture produces of food grain [1,21]. The GWS declined from 2002 to 2013 and persistent drought has enhanced groundwater deficit [21,22]. A significant GWS depletion has been detected by GRACE data in the North China Plain during 2002–2014 [3,23,24]. TWS increased in Yangtze River Basin during 2003–2015 and water storage deficit was evaluated by the water storage deficit index (WSDI) derived from GRACE data [25,26]. In addition, GWS variations in the Songhua River Basin and West Liaohe River Basin were also estimated by GRACE data [5,27].
Although prior studies have reported TWS changes in these regions, results did not provide comprehensive or even thorough comparisons. The aims of this study are: (1) to provide a comprehensive comparison of TWS changes in the three major grain-producing regions of China; (2) to investigate water storage deficit variations using WSDI derived from GRACE; (3) to assess correlations of TWS changes and impact factors (i.e., dry/wet conditions and irrigation).
2. Materials and Methods
2.1. Study Area
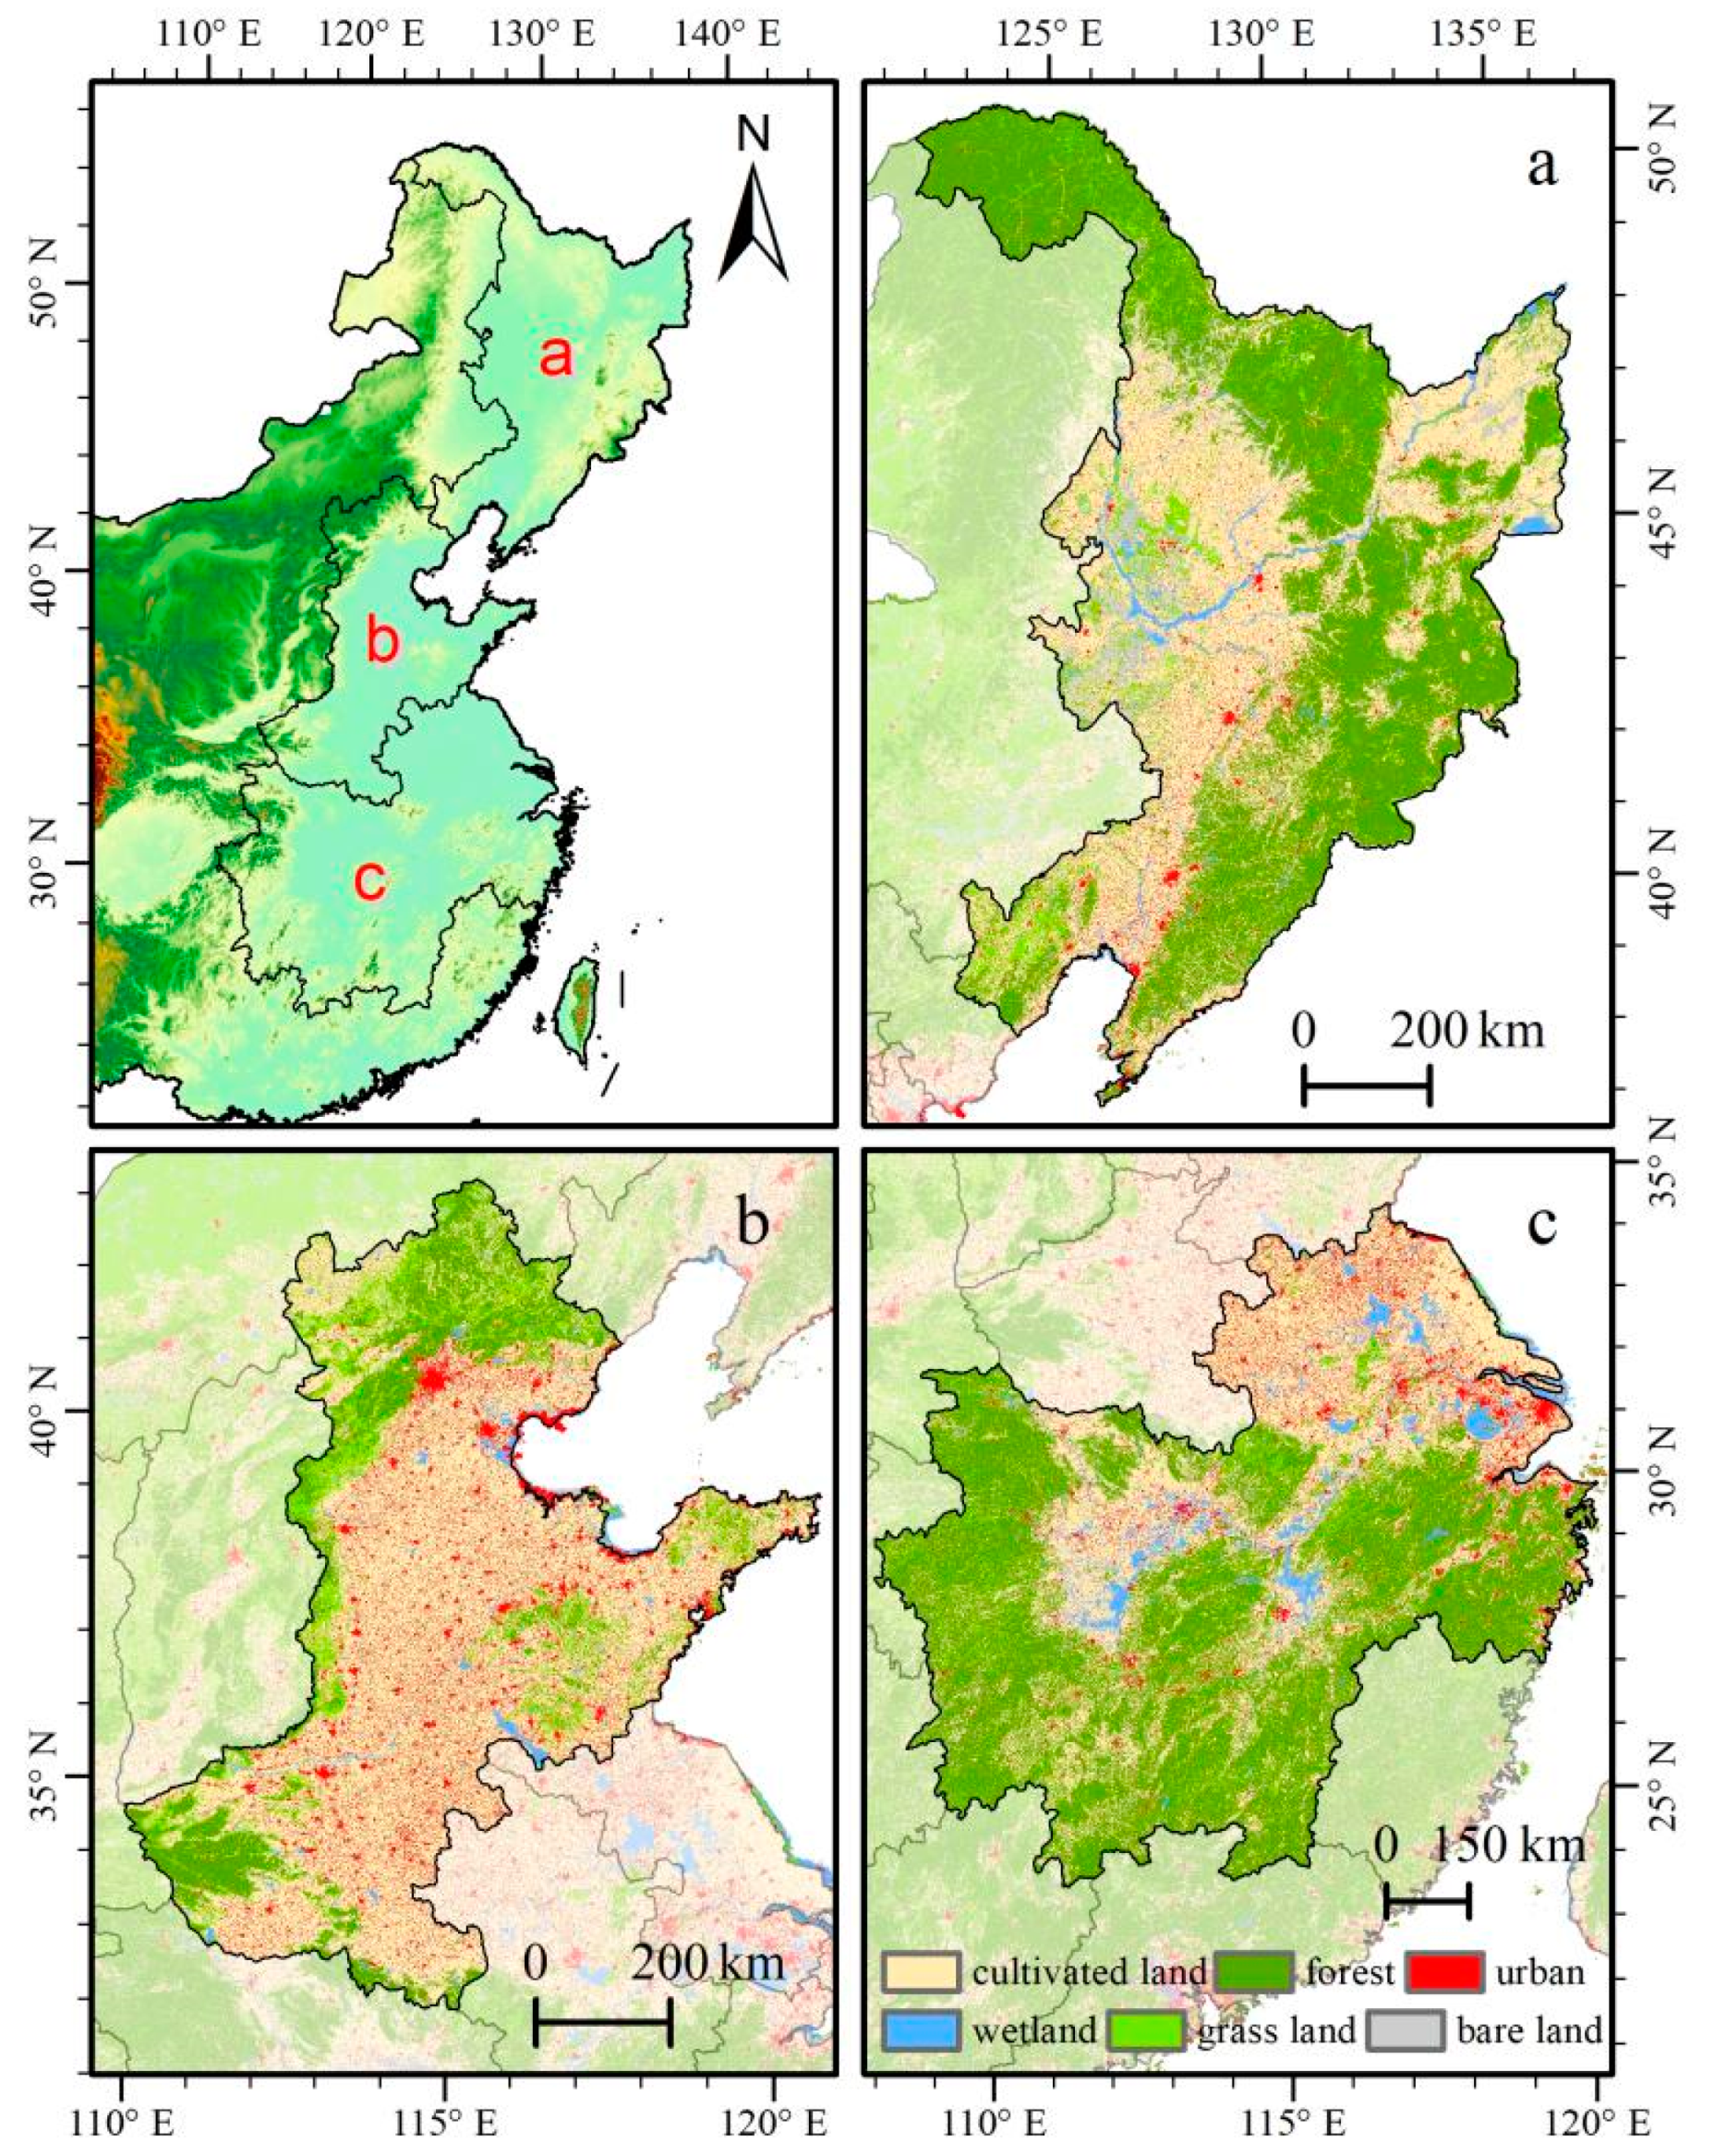
The Northeast China Plain (NECP) is located in Northeast China (Figure 1a), with an area of 728,000 km2 (and the crop land accounts for 38.7%). It belongs to the temperate monsoon climate, which experiences hot and humid conditions in summer and dry and cold conditions in winter. The annual precipitation ranges from 350 to 1200 mm and the mean annual temperature ranges from −4.8 to 11.3 °C [28]. The cropping system brings in one harvest per year and its main agricultural products are rice, maize and soybean. The Huang-Huai-Hai Plain (HHH) is located in North China (Figure 1b), with an area of 508,000 km2; the crop land accounts for 59%. The mean annual precipitation ranges from 600 to 800 mm and the annual accumulated temperature is about 4500 °C [29]. The main crops are wheat and maize, which can be harvested three times every two years. The middle and lower reaches of the Yangtze River Basin Plain (YRB) (Figure 1c) is located in a subtropical zone with an area of 916,000 km2; the crop land accounts for 37.8%. The annual precipitation ranges from 1100 to 1500 mm. The main crop is rice and the cropping system is yield two crops a year. Crops in NECP and HHH are mostly fed by groundwater, which has resulted in a groundwater deficit. Meanwhile, TWS changes in YRB is influenced both by climate change and human activities (i.e., the Three Gorges Dam, TGD) [30,31].
2.2. Datasets
The GRACE dataset was provided by the Center for Space Research at the University of Texas at Austin (CSR). Spherical harmonics for CSR RL05 were truncated at the maximum degree and order of 60, detriped and filtered using a 300 km Gaussian filter method to suppress GRACE measurement noise of high-degree and order spherical harmonics [32]. Gridded TWS anomalies (TWSA) data, which were derived from GRACE data CSR RL05 and resampled at a spatial resolution of 1 × 1°, were used to evaluate water storage deficit (WSD), covering the period from January 2003 to December 2014. The GRACE mission was the first to allow the monitoring of large-scale TWS anomalies [33]. Using this new information, in combination with external datasets, many studies analyzed the temporal evolution of GWS anomalies at regional and basin scales [34,35]. What needs to be explained is that the spatial resolution of GRACE data are coarse, and detailed spatial information of water storage change cannot be presented. The self-calibrating Palmer drought severity index (scPDSI) dataset and monthly precipitation dataset were used to characterize climate conditions of the three areas. The scPDSI dataset was developed by Wells et al. [36] and provided by the Climatic Research Unit at the University of East Anglia (CRU) at a spatial resolution of 0.5 × 0.5°. The weight coefficient and duration factor of scPDSI for each location is estimated based on the observations of that location only and it is more appropriate for geographical comparison [37]. The scPDSI data are appropriate for China according to [38]. The monthly precipitation dataset was provided by the National Meteorological Information Center (NMIC) of the Chinese Meteorological Administration (CMA). It is developed by the Thin Plate Spline (TPS) method based on 2472 meteorological stations in China at a spatial resolution of 0.5 × 0.5°.
The yearly irrigation water consumption (IWC) data and monthly GWS data, which were calculated based on WaterGAP 2.2 at a spatial resolution of 0.5 × 0.5°, were used to evaluate the impact of irrigation and groundwater storage variation, respectively. Here, water consumption is defined as the part of withdrawn water that does not return to the system but is rather evaporated or incorporated in products [8]. Temporal GWS changes are calculated as follows:
where is the groundwater storage changed over time t, Rg is the groundwater recharge, Qg is the base flow and NAg is the net extraction of the groundwater.
Information of datasets used in this study are shown as Table 1.
2.3. Methods
TWSA, derived from GRACE data, is used to calculate the water storage deficit and detect the difference in TWS variability. The interannual trends were derived from Seasonal and Trend decomposition using Loess (STL).
2.3.1. Water Storage Deficit Index
The monthly water storage deficit (WSD), which is defined as the difference between TWSA in any month and the average values, is used to measure hydrological drought characterization [19,25], as per Equation (2):
where WSDi,j represents the WSD for the jth month in year i, TWSAi,j is the GRACE-inferred TWSA time series for the jth month in year i and TWSAj is the long-term mean (from January 2003 to December 2014) of TWSA for the same month. Negative WSD represents that TWS is less than the normal value. To better characterize droughts based on WSD, Sun et al. [25] normalized WSD into the WSD index (WSDI) by the zero mean normalization method as Equation (3):
where μ and σ are the mean and standard deviation of the WSD time series, respectively. The magnitude of WSDI indicates the drought intensity [25].
2.3.2. Groundwater Storage Anomaly
GWSA is defined as the difference between GWS in any month and the average value. GWSA is used to indicate groundwater storage variation characterization, as per Equation (4):
where GWSi,j represents the GWS for the jth month in year i and is the long-term mean (from January 2003 to December 2014) of GWS for the same month.
2.3.3. Time Series Decomposition
The time series was composed of seasonal signal (Sseasonal), trend signal (Strend) and residuals based on the non-parametric STL approach (as per Equation (5)) [41]. STL decomposition have been applied to GRACE data to identify the signatures of extreme climate events such as droughts and floods on TWS [25,42].
where Stotal represents the original signal. The STL method is a robust and computationally efficient approach commonly used for detecting non-linear patterns in trend estimates [25]. In this work, STL approach is used for reducing the influence of seasonal variation on long-term trends. Interannual trends of TWSA and WSDI were extracted by performing the ‘data_decomp’ function provided by R and long-term trends were estimated by the linear regression method.
3. Results
3.1. Validation of WSDI
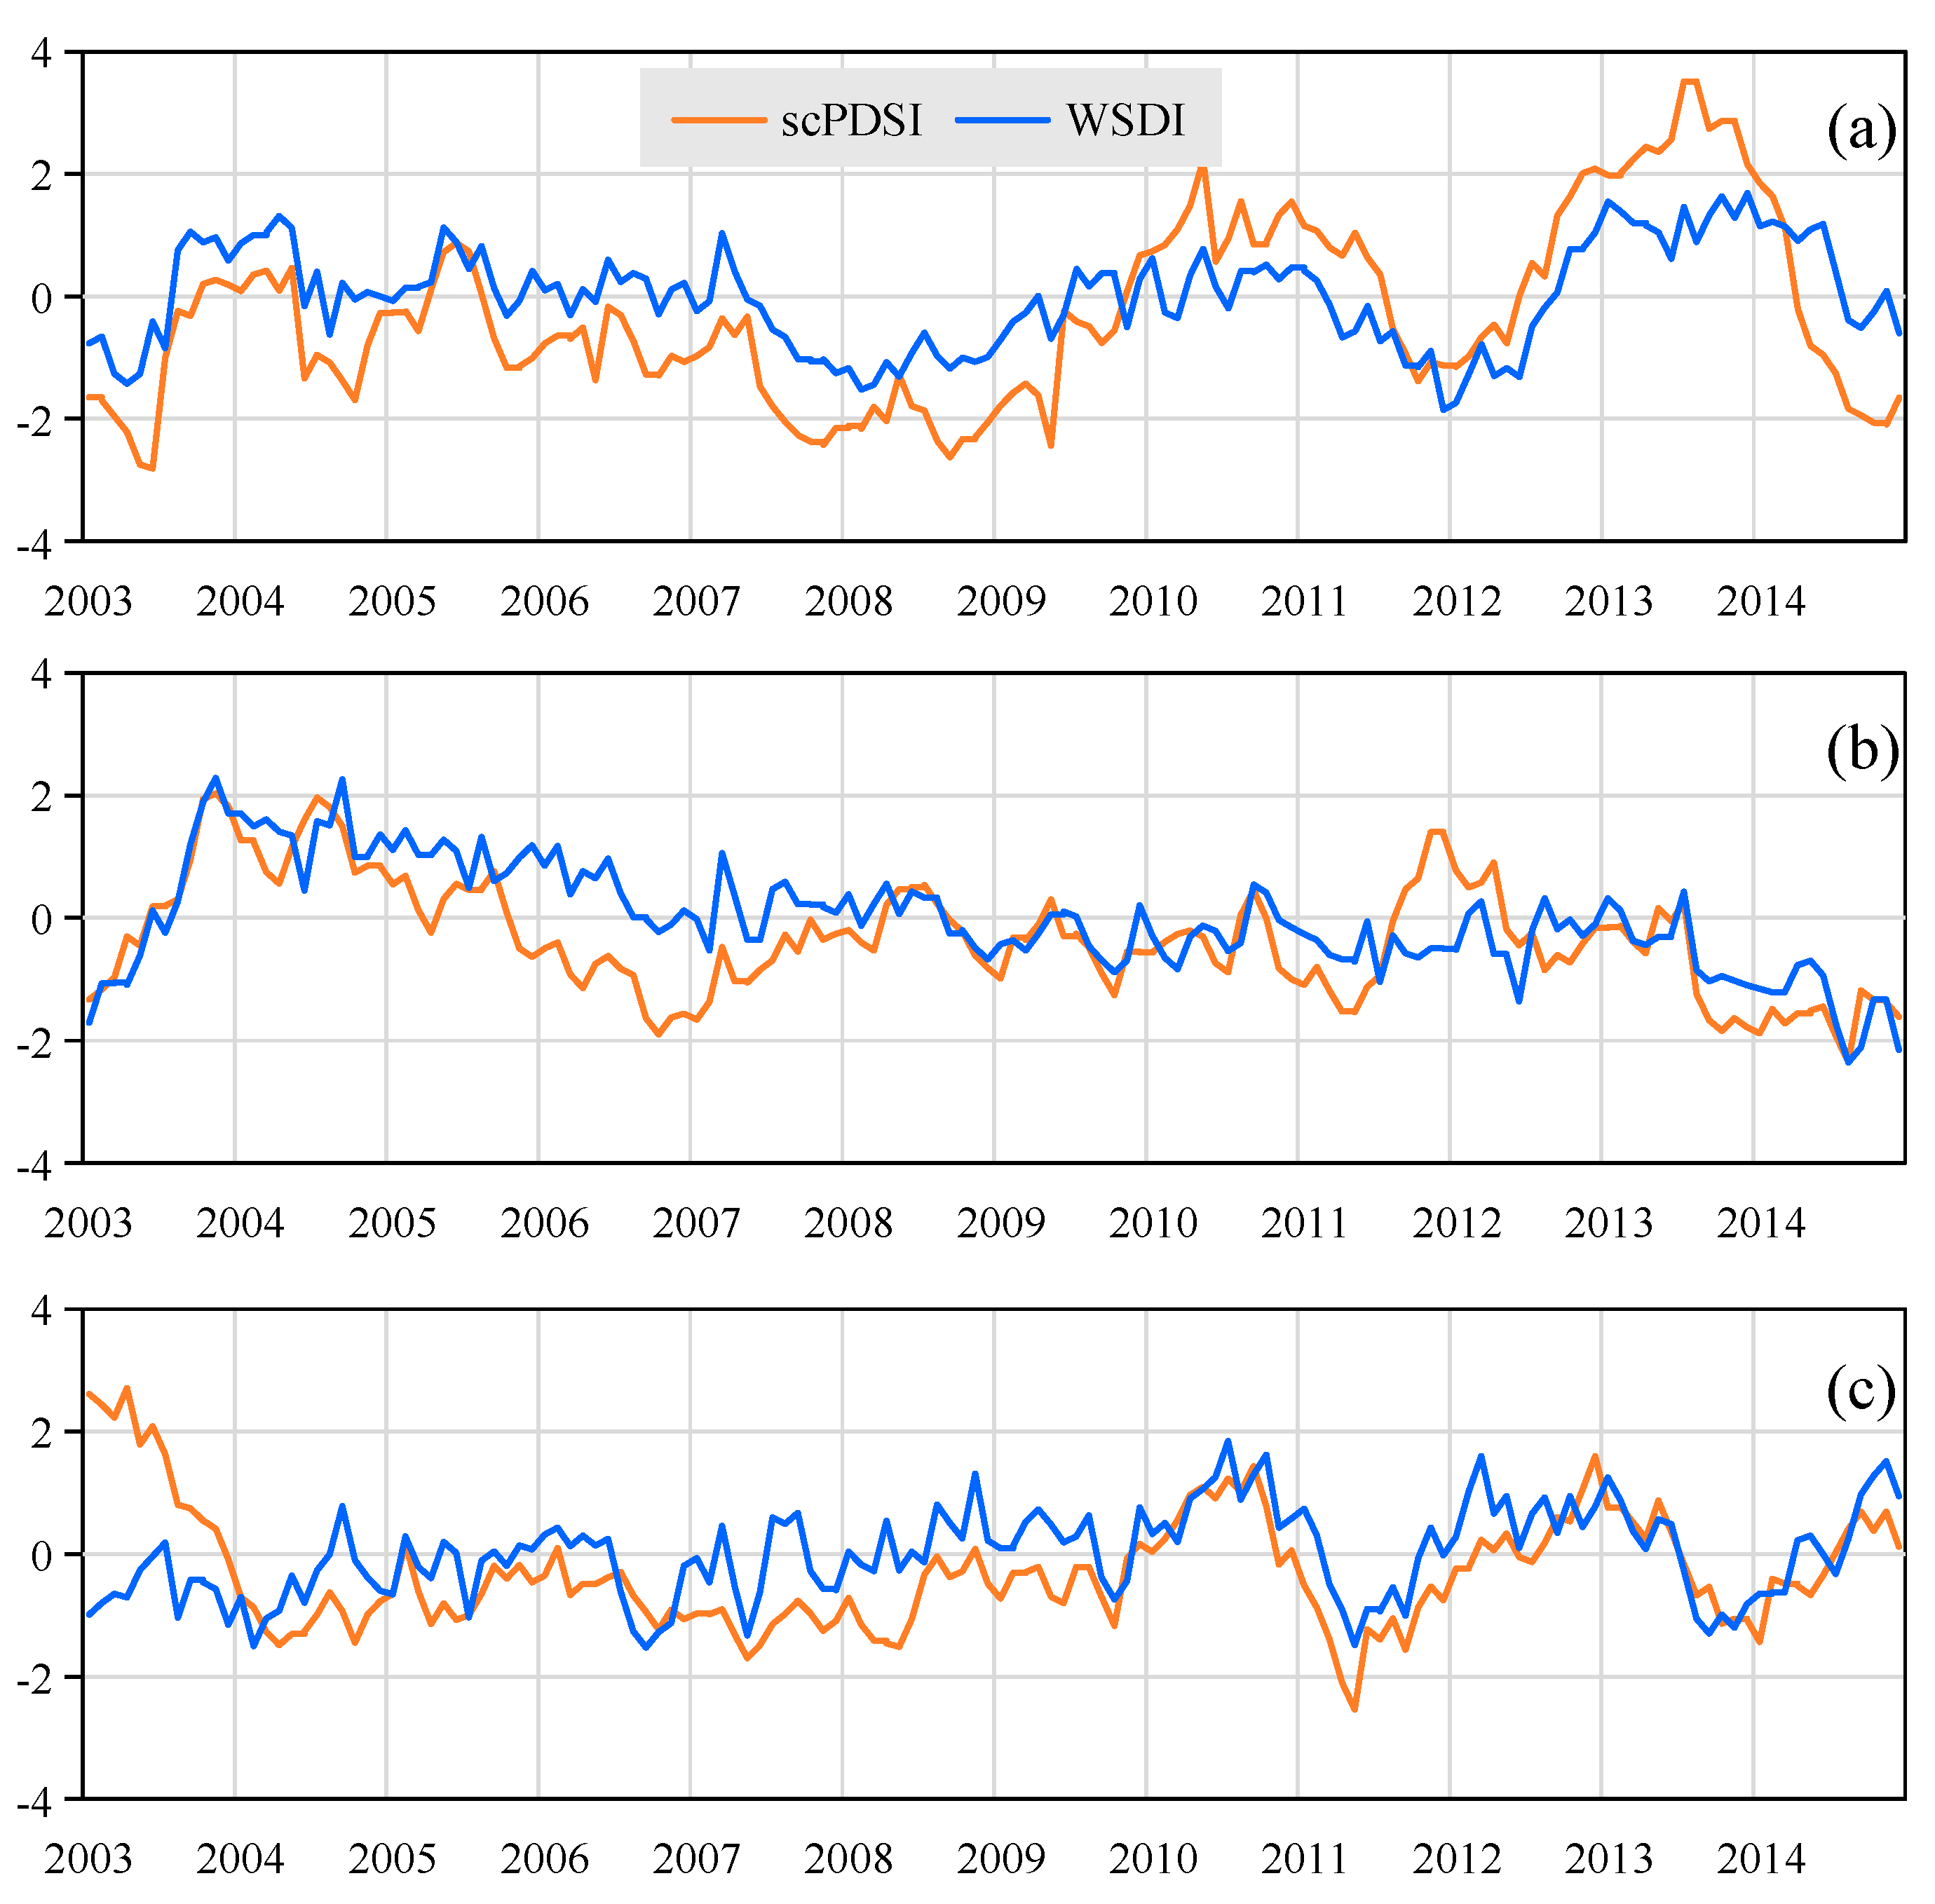
WSDI is a reliable indicator of drought [25]. WSDI shows changes in water storage more intuitively. In this paper, scPDSI was used as a reference to validate WSDI derived from GRACE production. Figure 2 shows the comparison of scPDSI and WSDI from 2003 to 2014 in the three major grain-producing regions. The variability of WSDI agreed well with that of scPDSI with correlation coefficients of 0.71, 0.69 and 0.41, respectively. However, there were also obvious differences between variations derived from scPDSI and WSDI. For instance, in NECP and HHH, WSDI was lower than scPDSI during the wet period, while it was higher than scPDSI during the drought period. In YRB, the characteristics of WSDI was obviously different from that of scPDSI in 2003, even though they agreed well with each other during 2004–2014, with a correlation coefficient of 0.73.
Possible reasons for those differences are as follows: (1) WSDI and scPDSI are calculated from different data sources and through different methods. For instance, WSDI is derived from TWSA, and scPDSI is estimated based on meteorological datasets; (2) resampling is required during the analysis, since the spatial resolutions of the two measurements are different (e.g., the spatial resolution of WSDI is 1 × 1°, while that of scPDSI is 0.5 × 0.5°); (3) WSDI is impacted not only by meteorological conditions but also by anthropogenic factors, while scPDSI is impacted only by meteorological conditions.
3.2. The Temporal Variation of Water Storage in Major Grain-Producing Regions
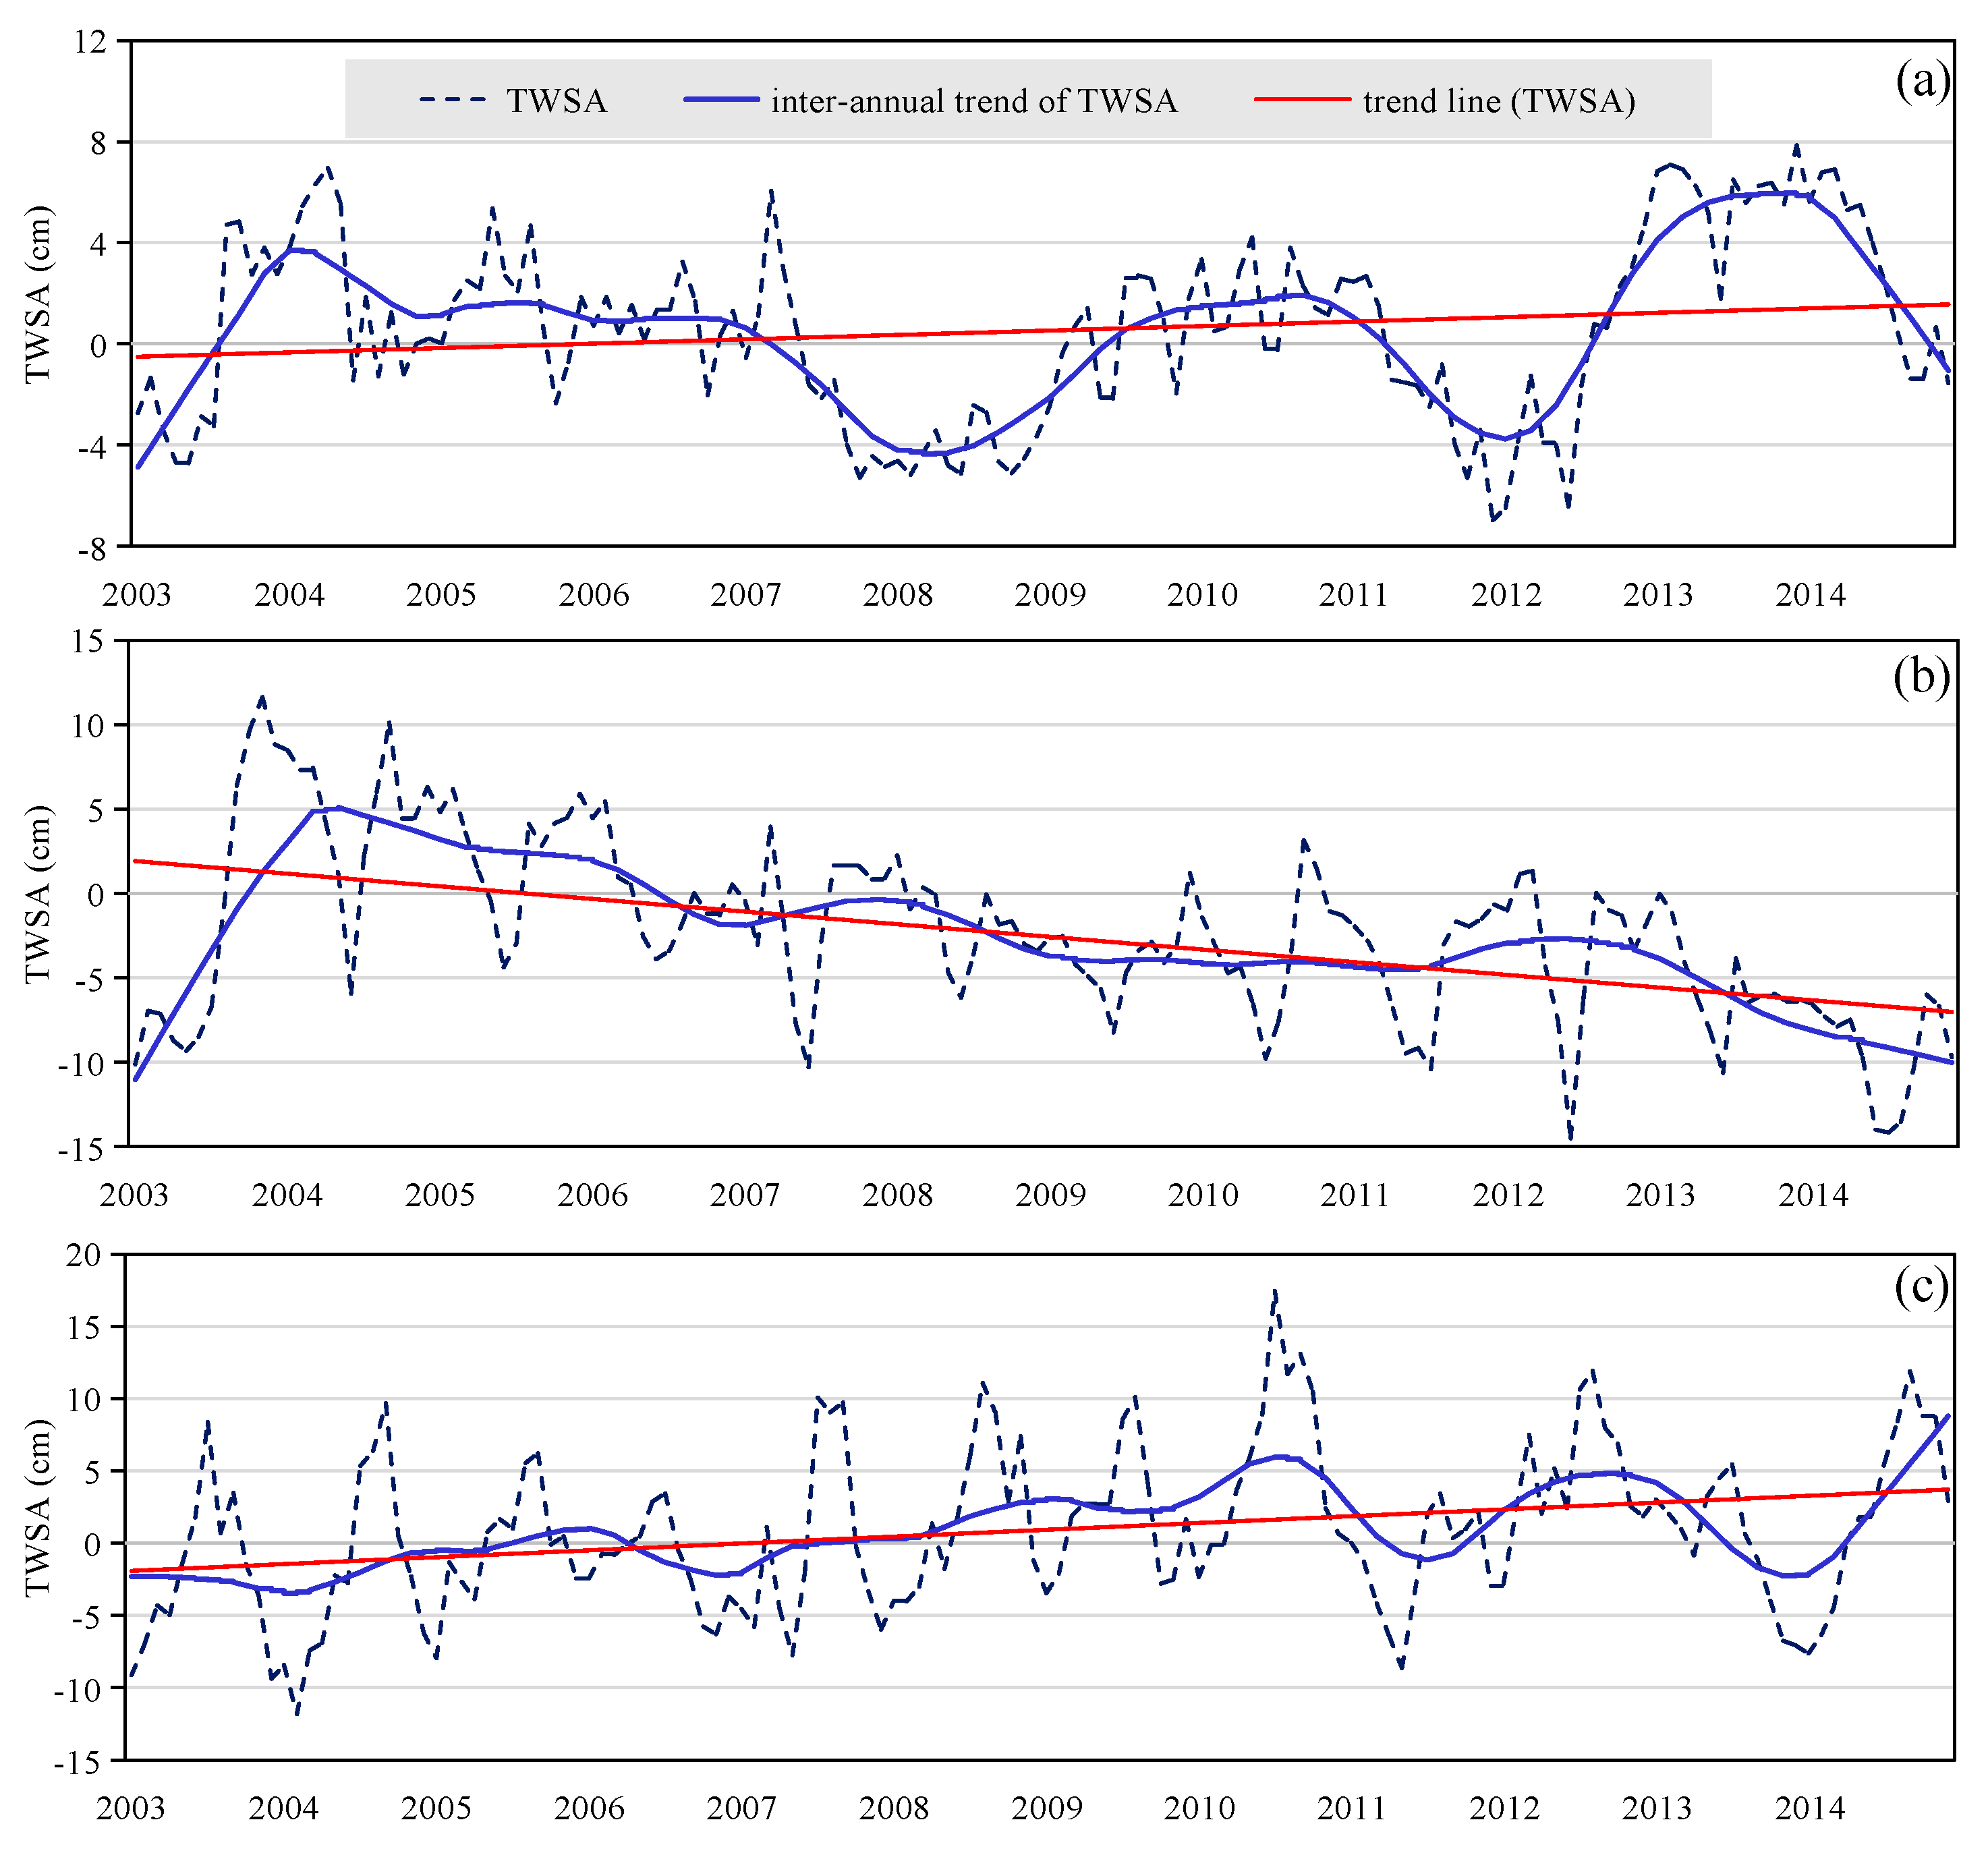
The interannual trend of TWSA was derived by STL method, while the seasonal signal was removed to reduce the impact to long-term trend. Figure 3 shows the temporal variability of TWSA in major grain-producing regions during 2003–2014. TWSA increased in NECP with a rate of 0.16 cm/yr during 2003–2014. More specifically, there are two troughs (2008 and 2012) and two crests (2010 and 2013) during 2007–2014 (as shown in Figure 3a). TWSA decreased during 2003–2008 and 2011, while it increased during 2009–2010 and 2012–2013. Correspondingly, TWSA declined significantly in HHH with a rate of 0.85 cm/yr (Figure 3b) and increased continuously in YRB with a rate of 0.44 cm/yr (Figure 3c). TWSA changed continuously in HHH and YRB while it undulated in NECP. Moreover, TWSA has changed the most in HHH during the past 12 years among the three grain-producing regions.
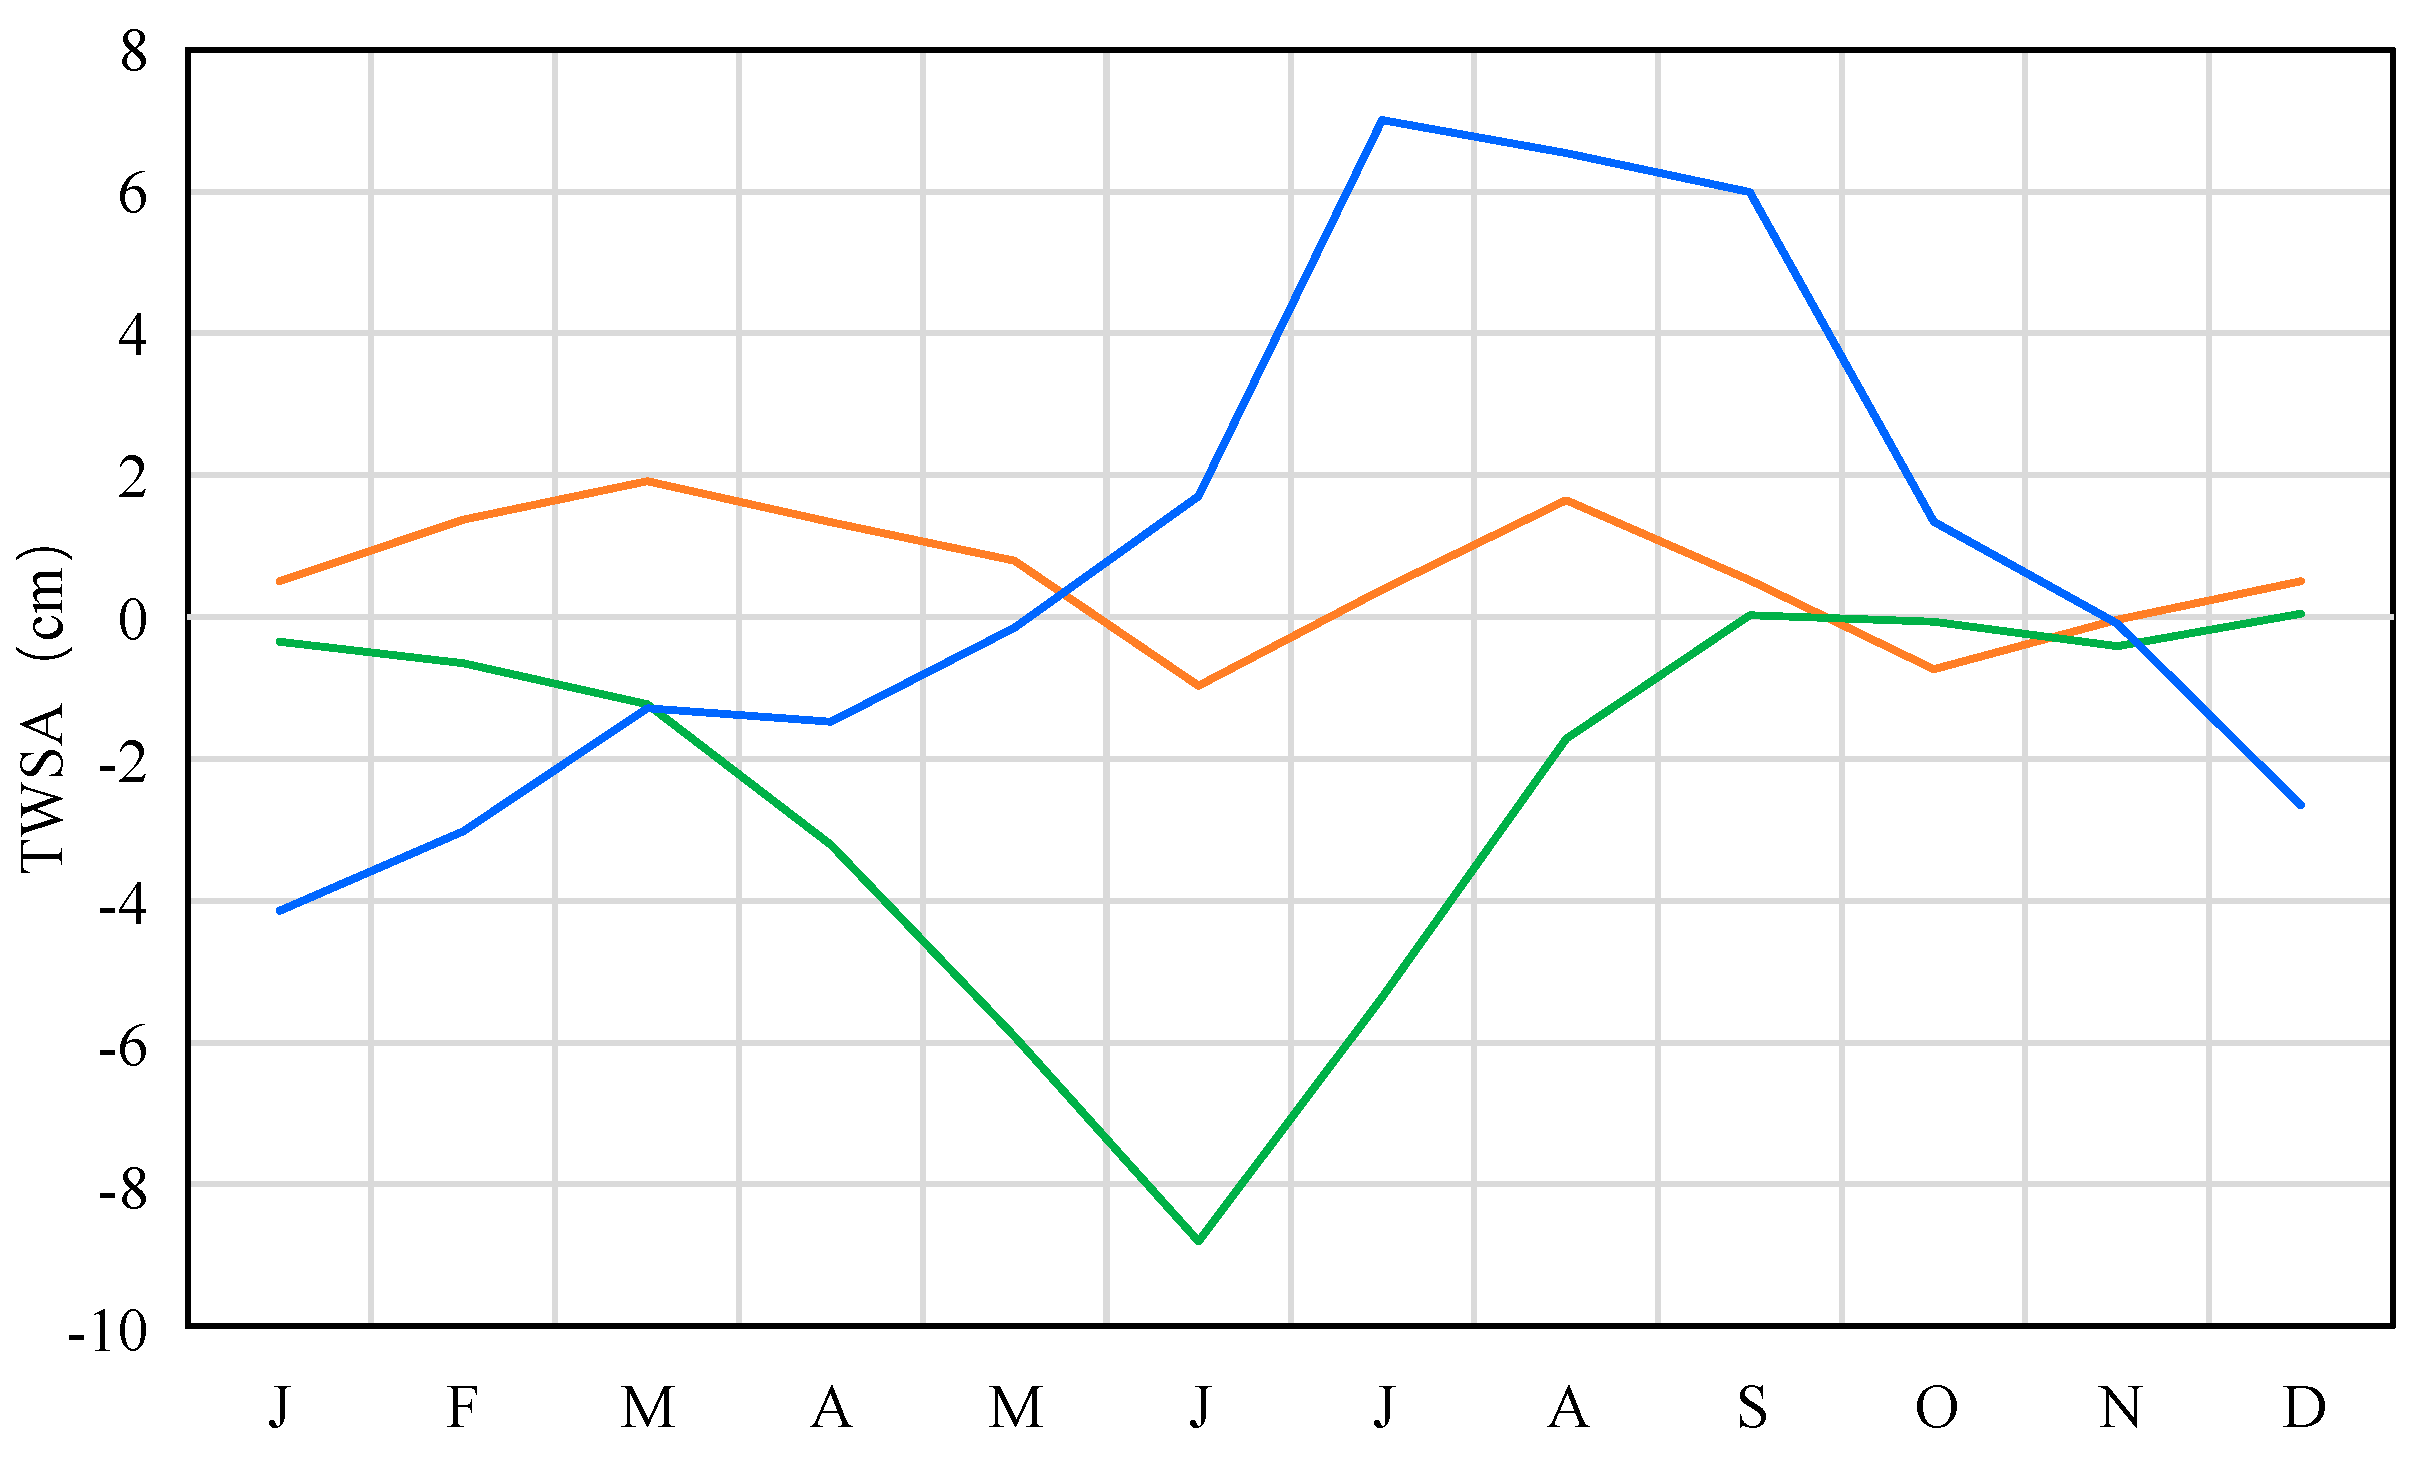
Figure 4 shows the annual variation of TWSAs in the three regions, and it can be seen that the annual differences in the three regions were relatively obvious. TWSA shows two crests in March and August, and two troughs in June and October in NECP, while TWSA minimized in June in HHH and peaked in July in YRB. In addition, compared with the drastic changes of TWSA in both YBR and HHH, there was no significant intra-annual change in NECP. It is worth noting that TWSA in HHH have shown a loss throughout the year.
3.3. Water Storage Deficit in Major Grain-Producing Regions
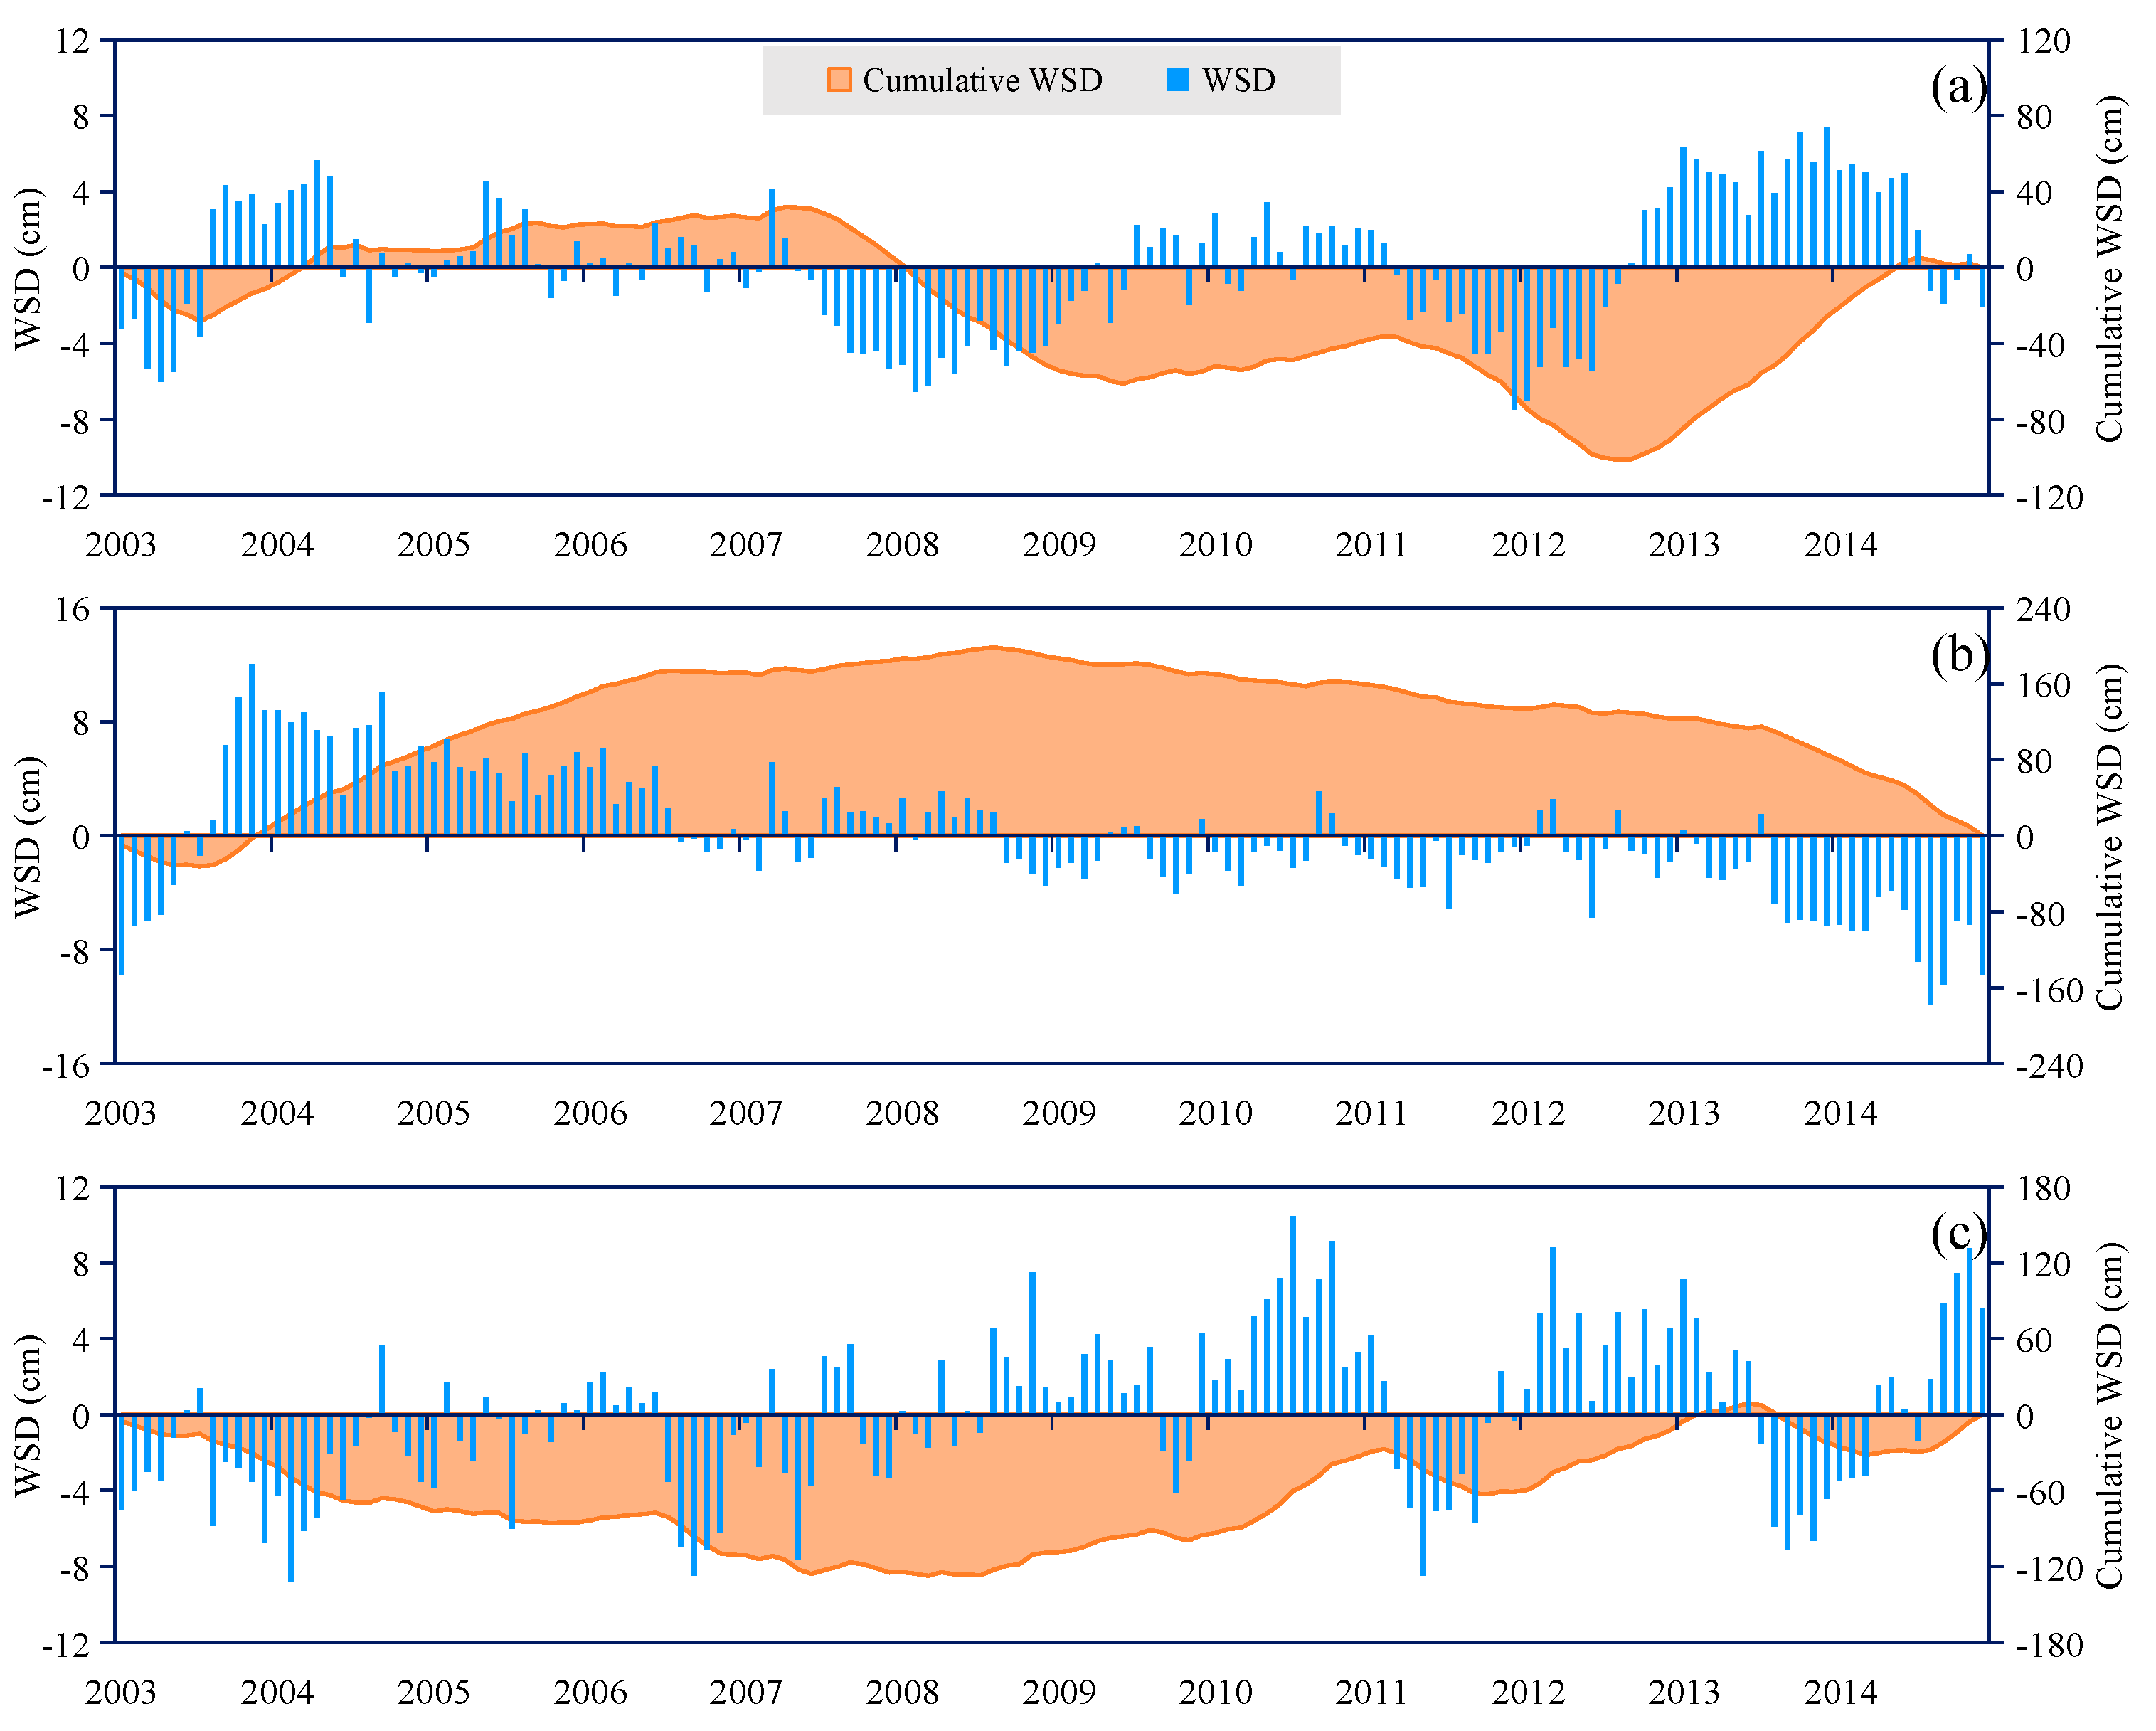
WSD is an important characteristic of drought. Figure 5 shows water storage deficit in NECP, HHH and YRB during 2003–2014, respectively. In NECP (as shown in Figure 5a), obvious water storage deficits were detected during 2007–2008 and 2011–2012, while water storage was in surplus during 2012–2014. As shown in Figure 5b, WSD increased in HHH, and the turning point from surplus to deficit was appeared in the middle of 2008. Moreover, as shown in Figure 5c, WSD decreased in YRB, and significant water storage deficits were detected in February 2004, September 2006 and May 2011, with −8.81 cm, −8.48 cm and −8.50 cm, respectively.
Cumulative WSD indicates the continuity of the water storage deficit. According to Sun et al. [25], a declining trend of cumulative WSD represents a lasting deficit, while an increasing trend represents a surplus. In NECP (as shown in Figure 5a), increasing trends were detected during 2003–2007 and 2013–2014, while a declining trend was found during 2007–2012. In addition, the cumulative WSD in NECP has been negative since 2008, which indicated the continued loss of water storage since then. As shown in Figure 5b, the cumulative WSD in HHH was positive during 2004–2014, but it has declined since August 2008. The cumulative WSD in YRB was generally negative during the whole period, which was consistent with the TWSA. The cumulative WSD in YRB decreased from 2003 to July 2008, and then increased until 2014 (as shown in Figure 5c). Furthermore, these turning points of WSD in NECP, HHH and YRB are consistent with that of the WSD in the three regions accordingly.
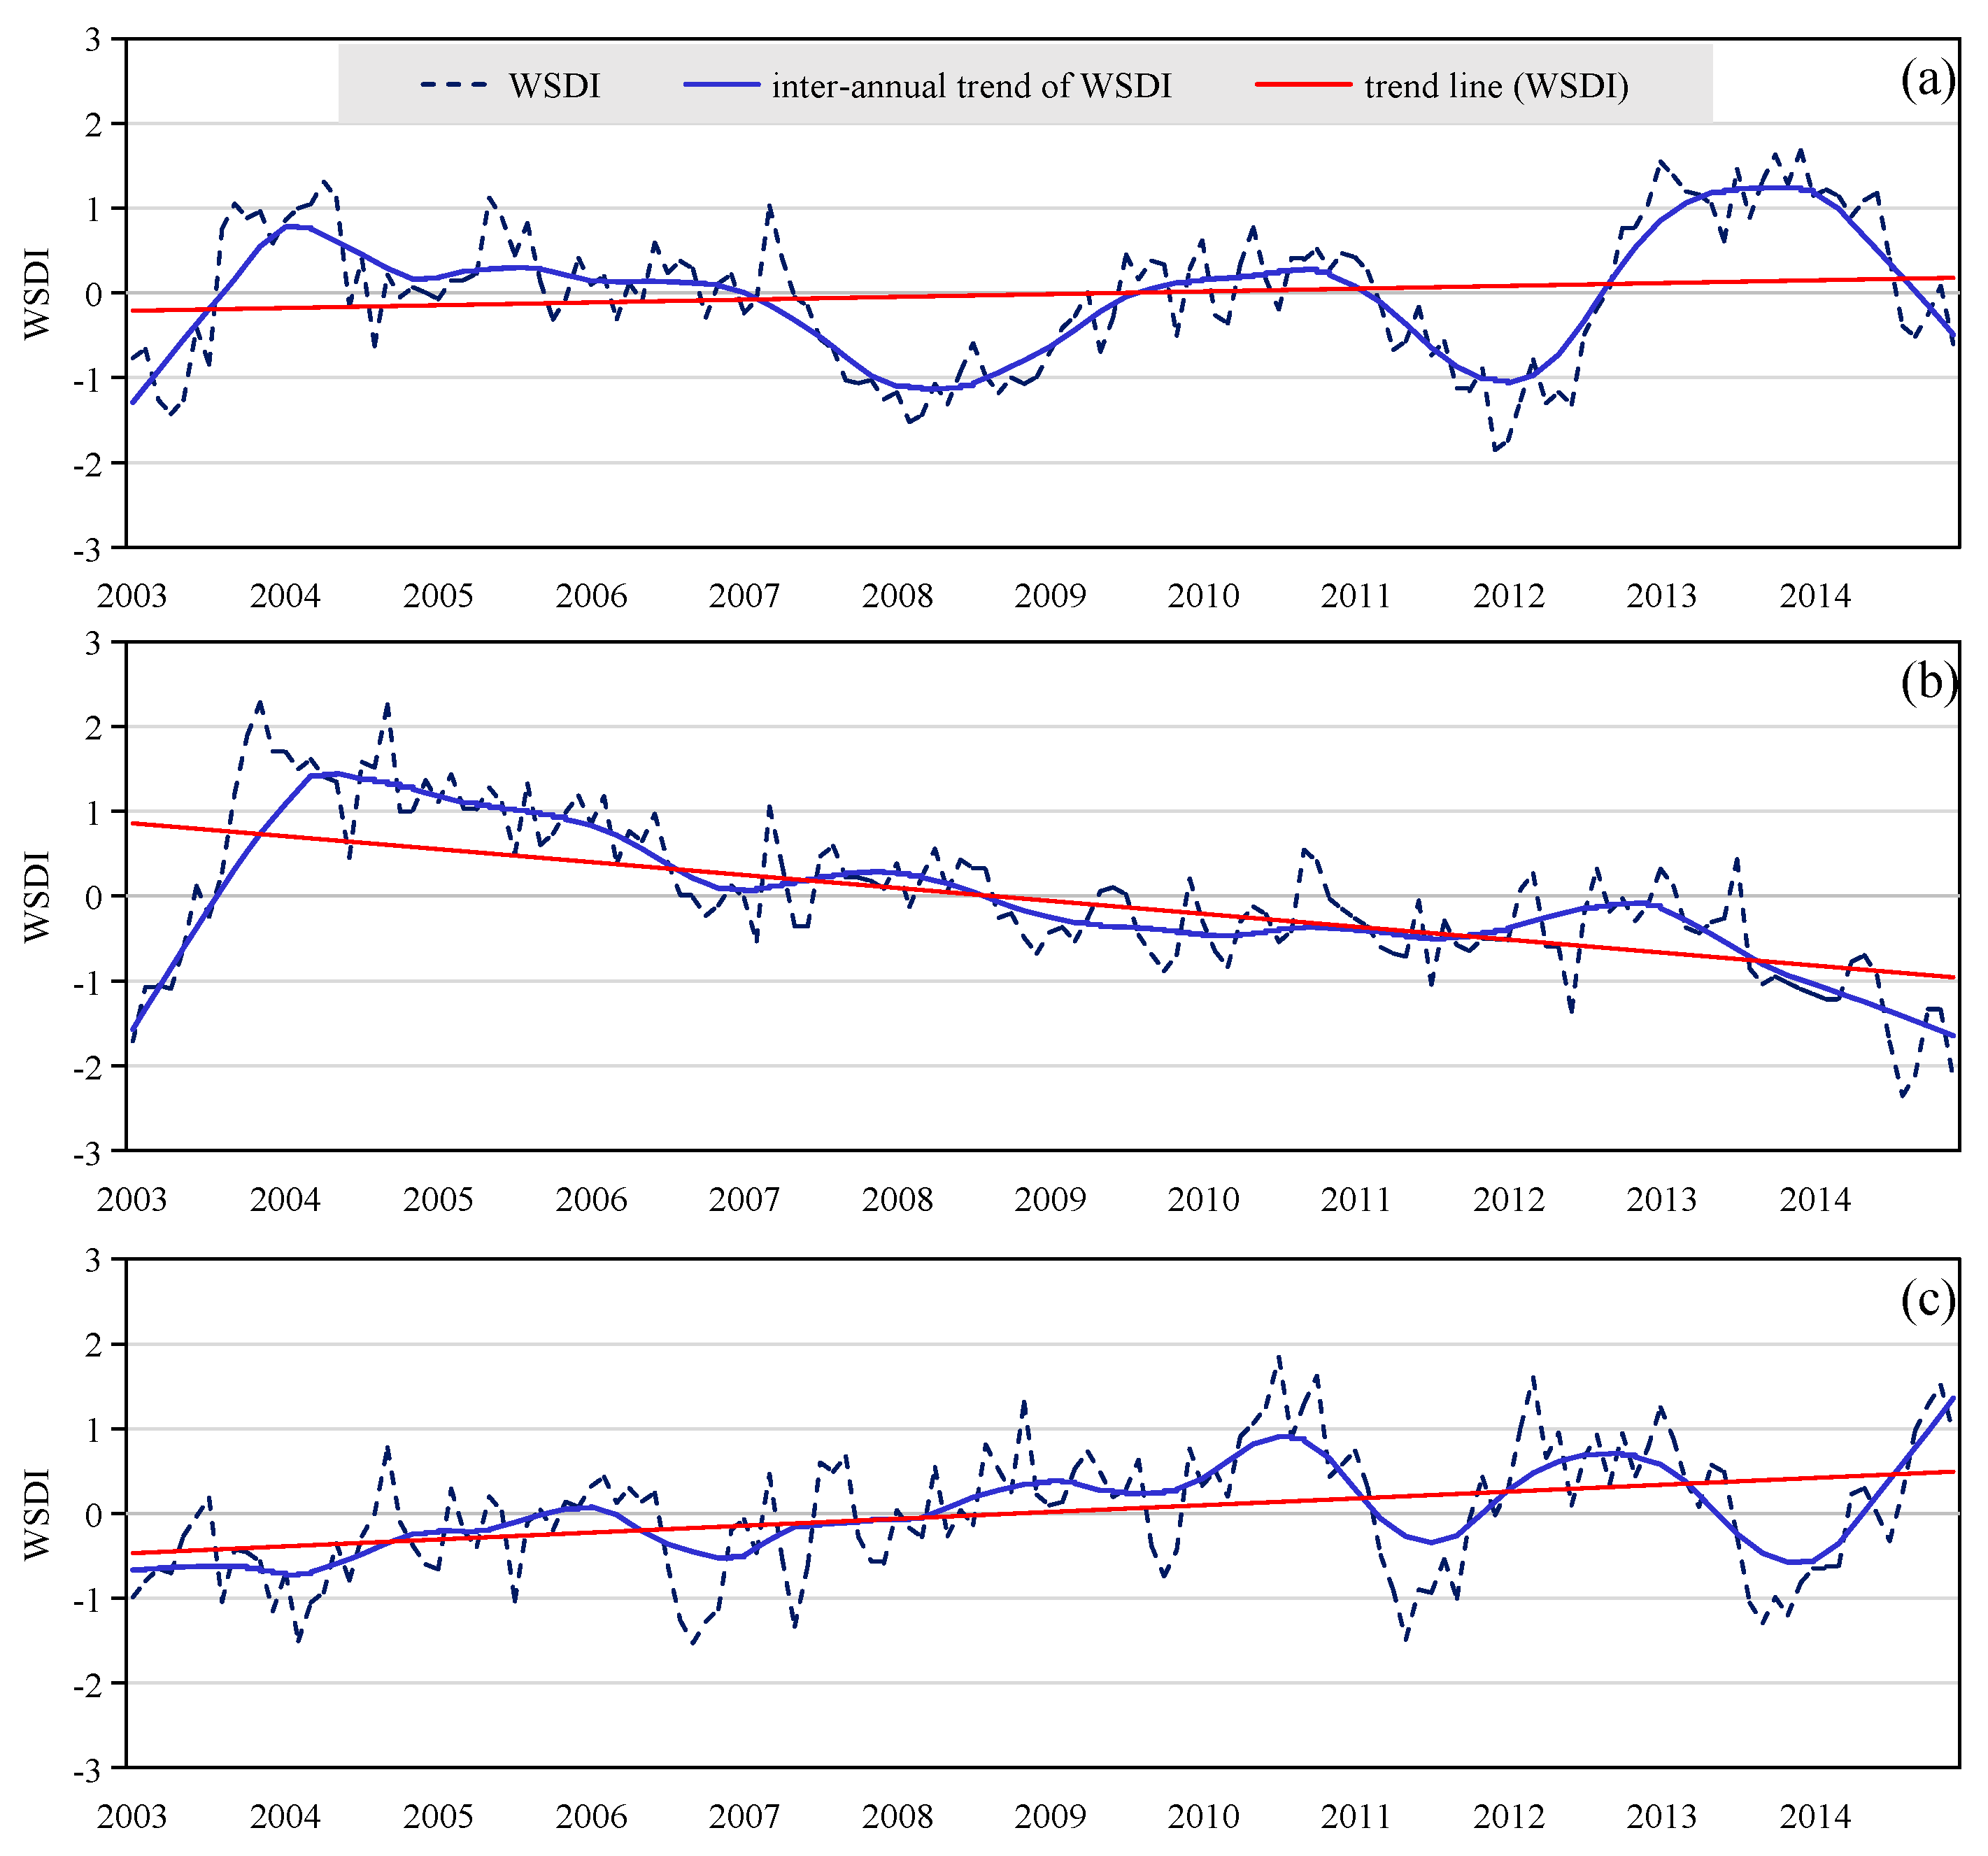
Figure 6 presents time variations in WSDI in the period of 2003–2014 and the seasonal trends were removed from WSDI time series by STL. As can be seen, the trend of WSDI was consistent with that of TWSA (shown in Figure 3) in three grain-producing regions accordingly. WSDI in NECP increased slightly from 2003 to 2014, with a rate of 0.03 (as shown in Figure 6a). WSDI was positive during 2003–2007 and 2013–2014, while it was generally negative during 2007–2009 and 2011–2012. Moreover, the turning points appeared in 2007, 2012 and 2014, respectively. In HHH and YRB, as shown in Figure 6b,c, WSDI declined with a rate of 0.17 and increased with a rate of 0.08, respectively. The turning points of WSDI in HHH (from drought to wet) and YRB (from wet to drought) appeared during 2008–2009, which is consistent with that of WSD, shown in Figure 5.
3.4. The Spatial Pattern of WSDI Variation in Major Grain-Producing Regions
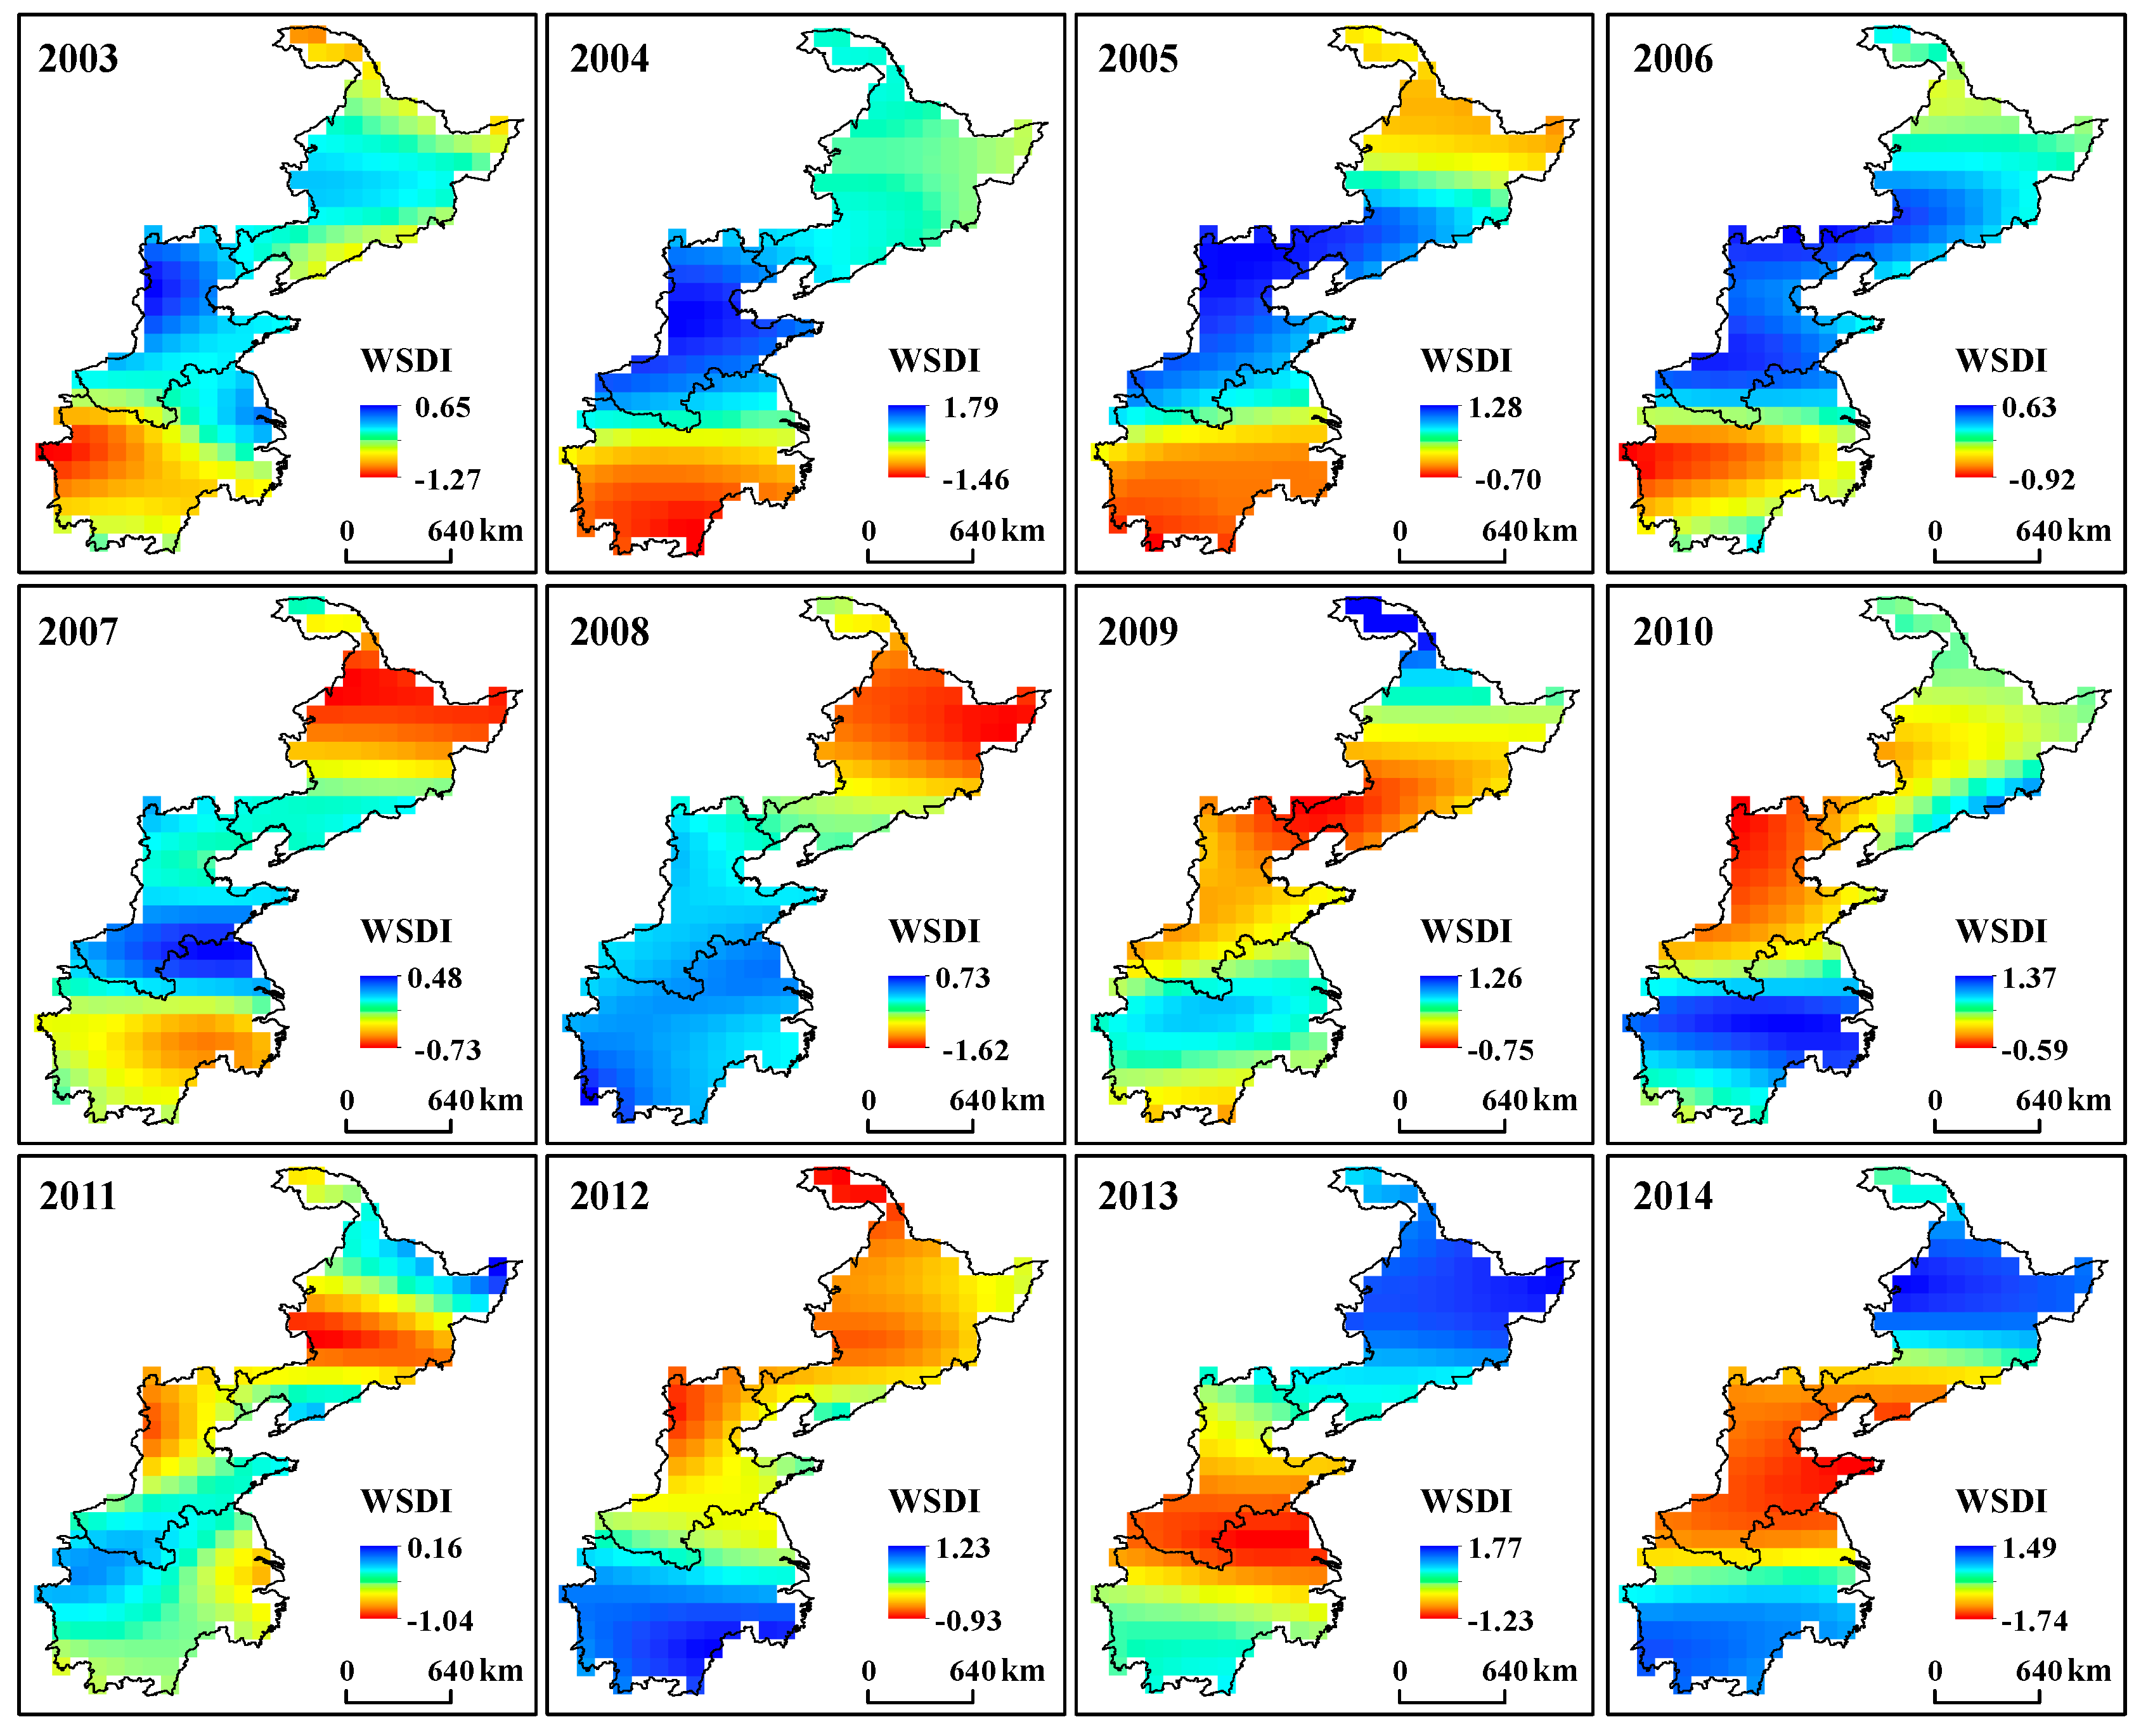
Annual average of WSDI from 2003 to 2014 were also calculated in order to analyze the spatial distribution of WSDI variation in major grain-producing regions. As can be seen from Figure 7, the WSDI shows uneven distribution characteristics in the entire study area. In north NECP, such as Beijing-Tianjin-Hebei Plain, water storage was depleted in 2005, 2007, 2008 and 2012, while it showed a surplus in the rest of the years; in middle NECP, water storage was depleted during 2007–2012; in south NECP, water storage has been depleted since 2009 (except 2013). In 2012, the water storage deficit was serious in the whole NECP. Regional difference of WSDI variations was not so significant in HHH during 2003–2014, except for the period of 2011–2013. Moreover, the water storage deficit in HHH became obvious in 2009. The water storage deficit in YRB lasted for 5 years from 2003 to 2007, after which WSDI has been increased since 2008 in almost the whole YRB.
As shown in Figure 7, WSDIs were negative in north NECP; however, it can be seen from Figure 6a that WSDI was positive in 2005. It suggested that the water storage deficit was not significant in north NECP in 2005. Furthermore, water storage deficit was serious in middle NECP in 2009 and 2011, as shown in Figure 6, although the water storage was surplus (as shown in Figure 5a). In the junctional zone of HHH and YRB, water storage deficit variations were different from other regions of YRB, but consistent with water storage deficit variations in HHH. The possible reasons for this difference are as follows: (1) the junctional region is located at the same latitude as south HHH and the climate conditions are similar; (2) the geographic elements (i.e., terrain, river system) in the junctional region are similar to south HHH; (3) water storage variations may be impacted by spatial autocorrelation.
3.5. GWS Variations in Major Grain-Producing Regions
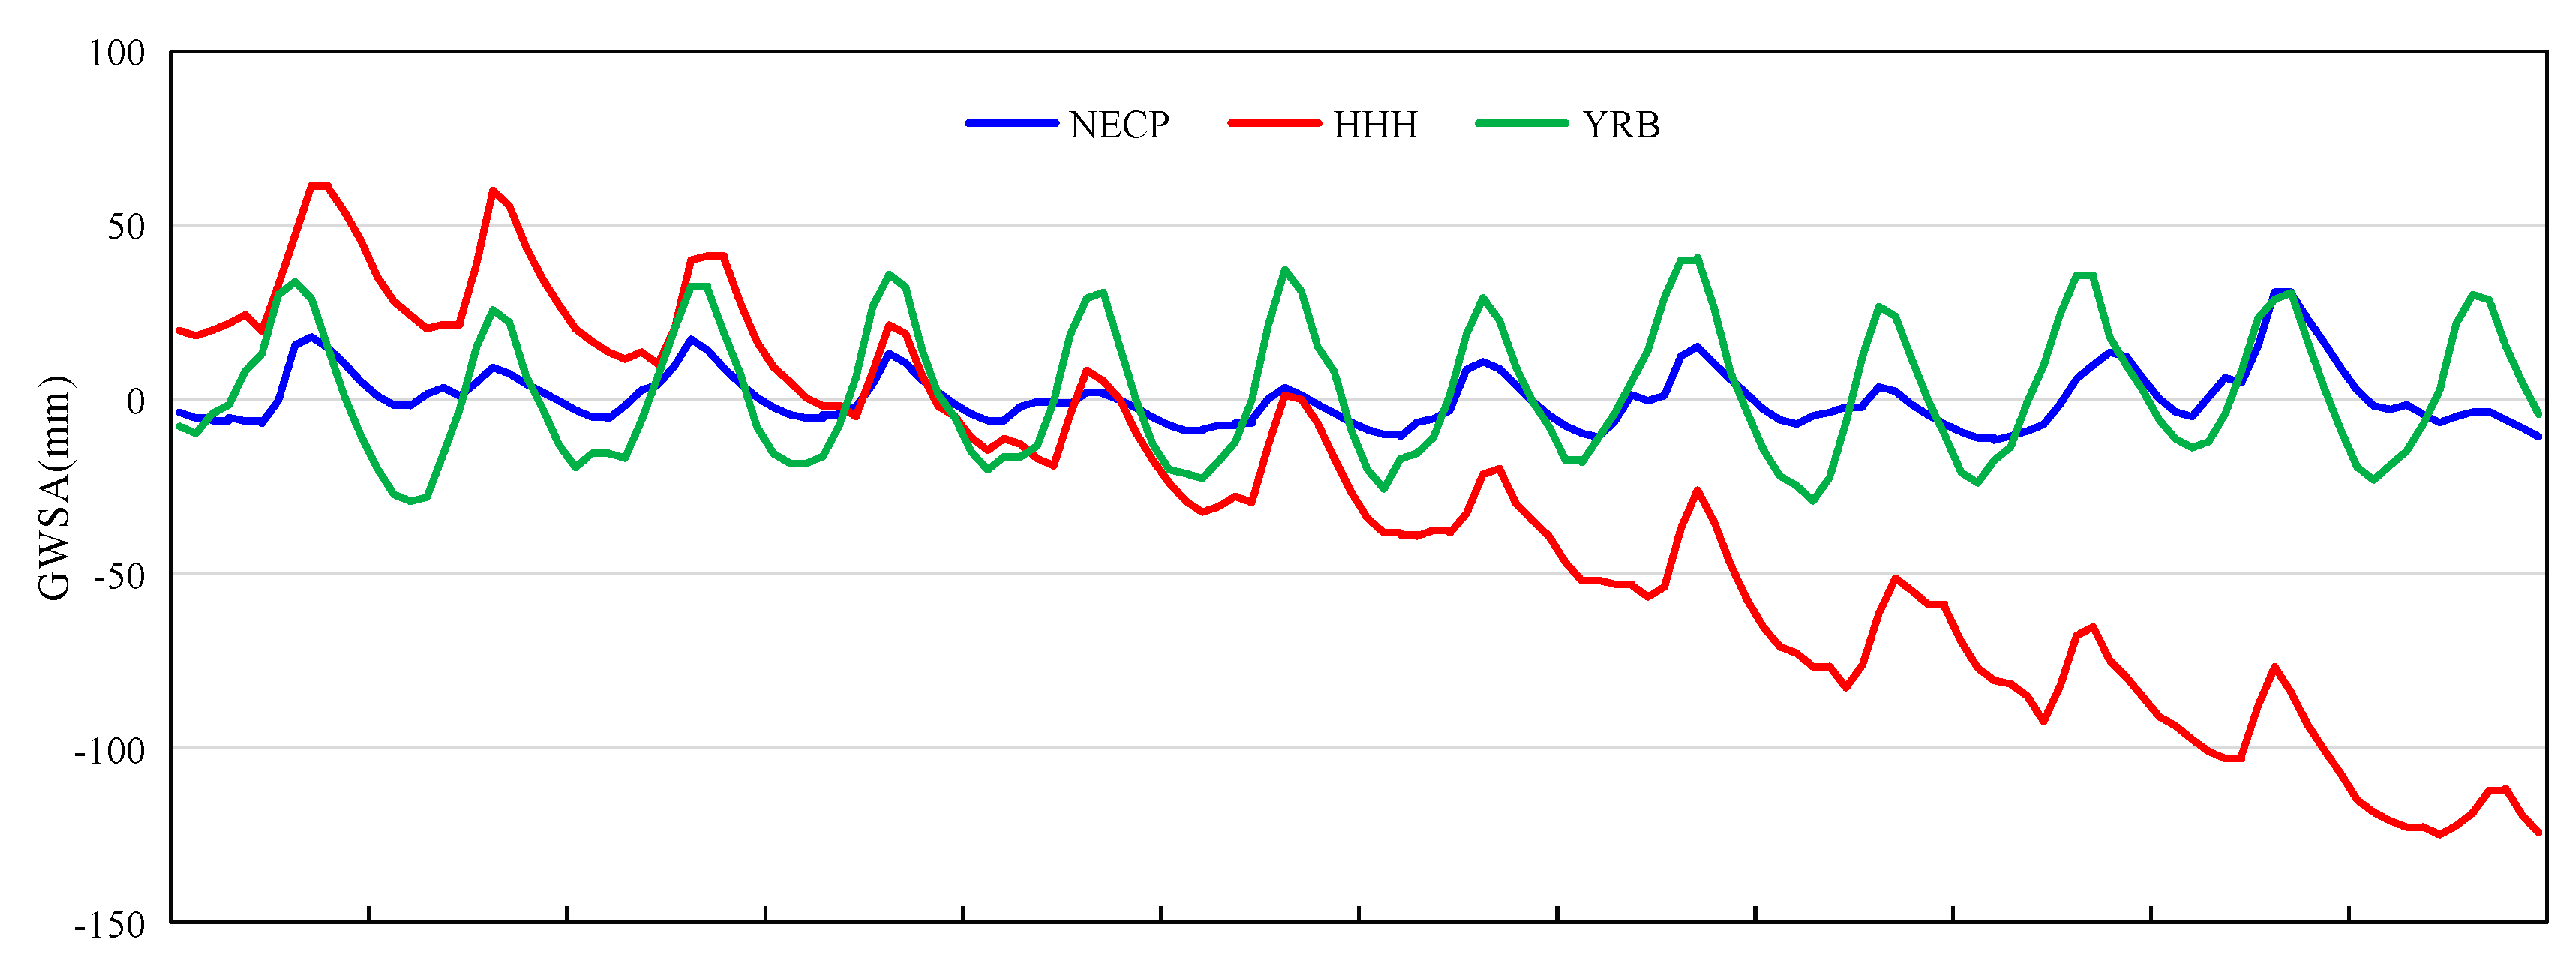
As mentioned above, the groundwater storage is an important component of TWS. Figure 8 shows that GWS was stable in NECP and YRB, while it decreased significantly in HHH, during 2003–2014. According to the average of GWSA (shows as Table 2), GWS was in serious deficit in HHH, with an average of −194.70 cm and a minimum of −288.64 cm. In contrast, GWS in YRB was relatively abundant, with an average of 72.94 cm and a minimum of 41.77 cm. The GWS in NECP was in the middle of the three grain-producing regions, with an average of 5.03 cm.
In addition, the maximum and minimum GWS in NECP and YRB correspond well to floods and drought events, such as the flood disaster in the Songhua River Basin in August 2013 and the severe drought events in the middle and lower reaches of the Yangtze River in 2003–2004. It can be seen from the spatial distribution of GWS change trend (as shown in Figure 9) that GWS in the northern part of NECP was increasing, while in the southern and central parts it showed a decreasing trend. The decreasing area accounted for about 35% of the total area of NECP. GWS had an increasing trend only in the northeast of HHH, and the decreasing area accounted for about 88% of the total area of HHH. GWS in the eastern part of YRB increased significantly, and the reduction areas were mainly distributed in the junction area with HHH; the reduction area accounted for about 22% of YRB.
4. Discussion
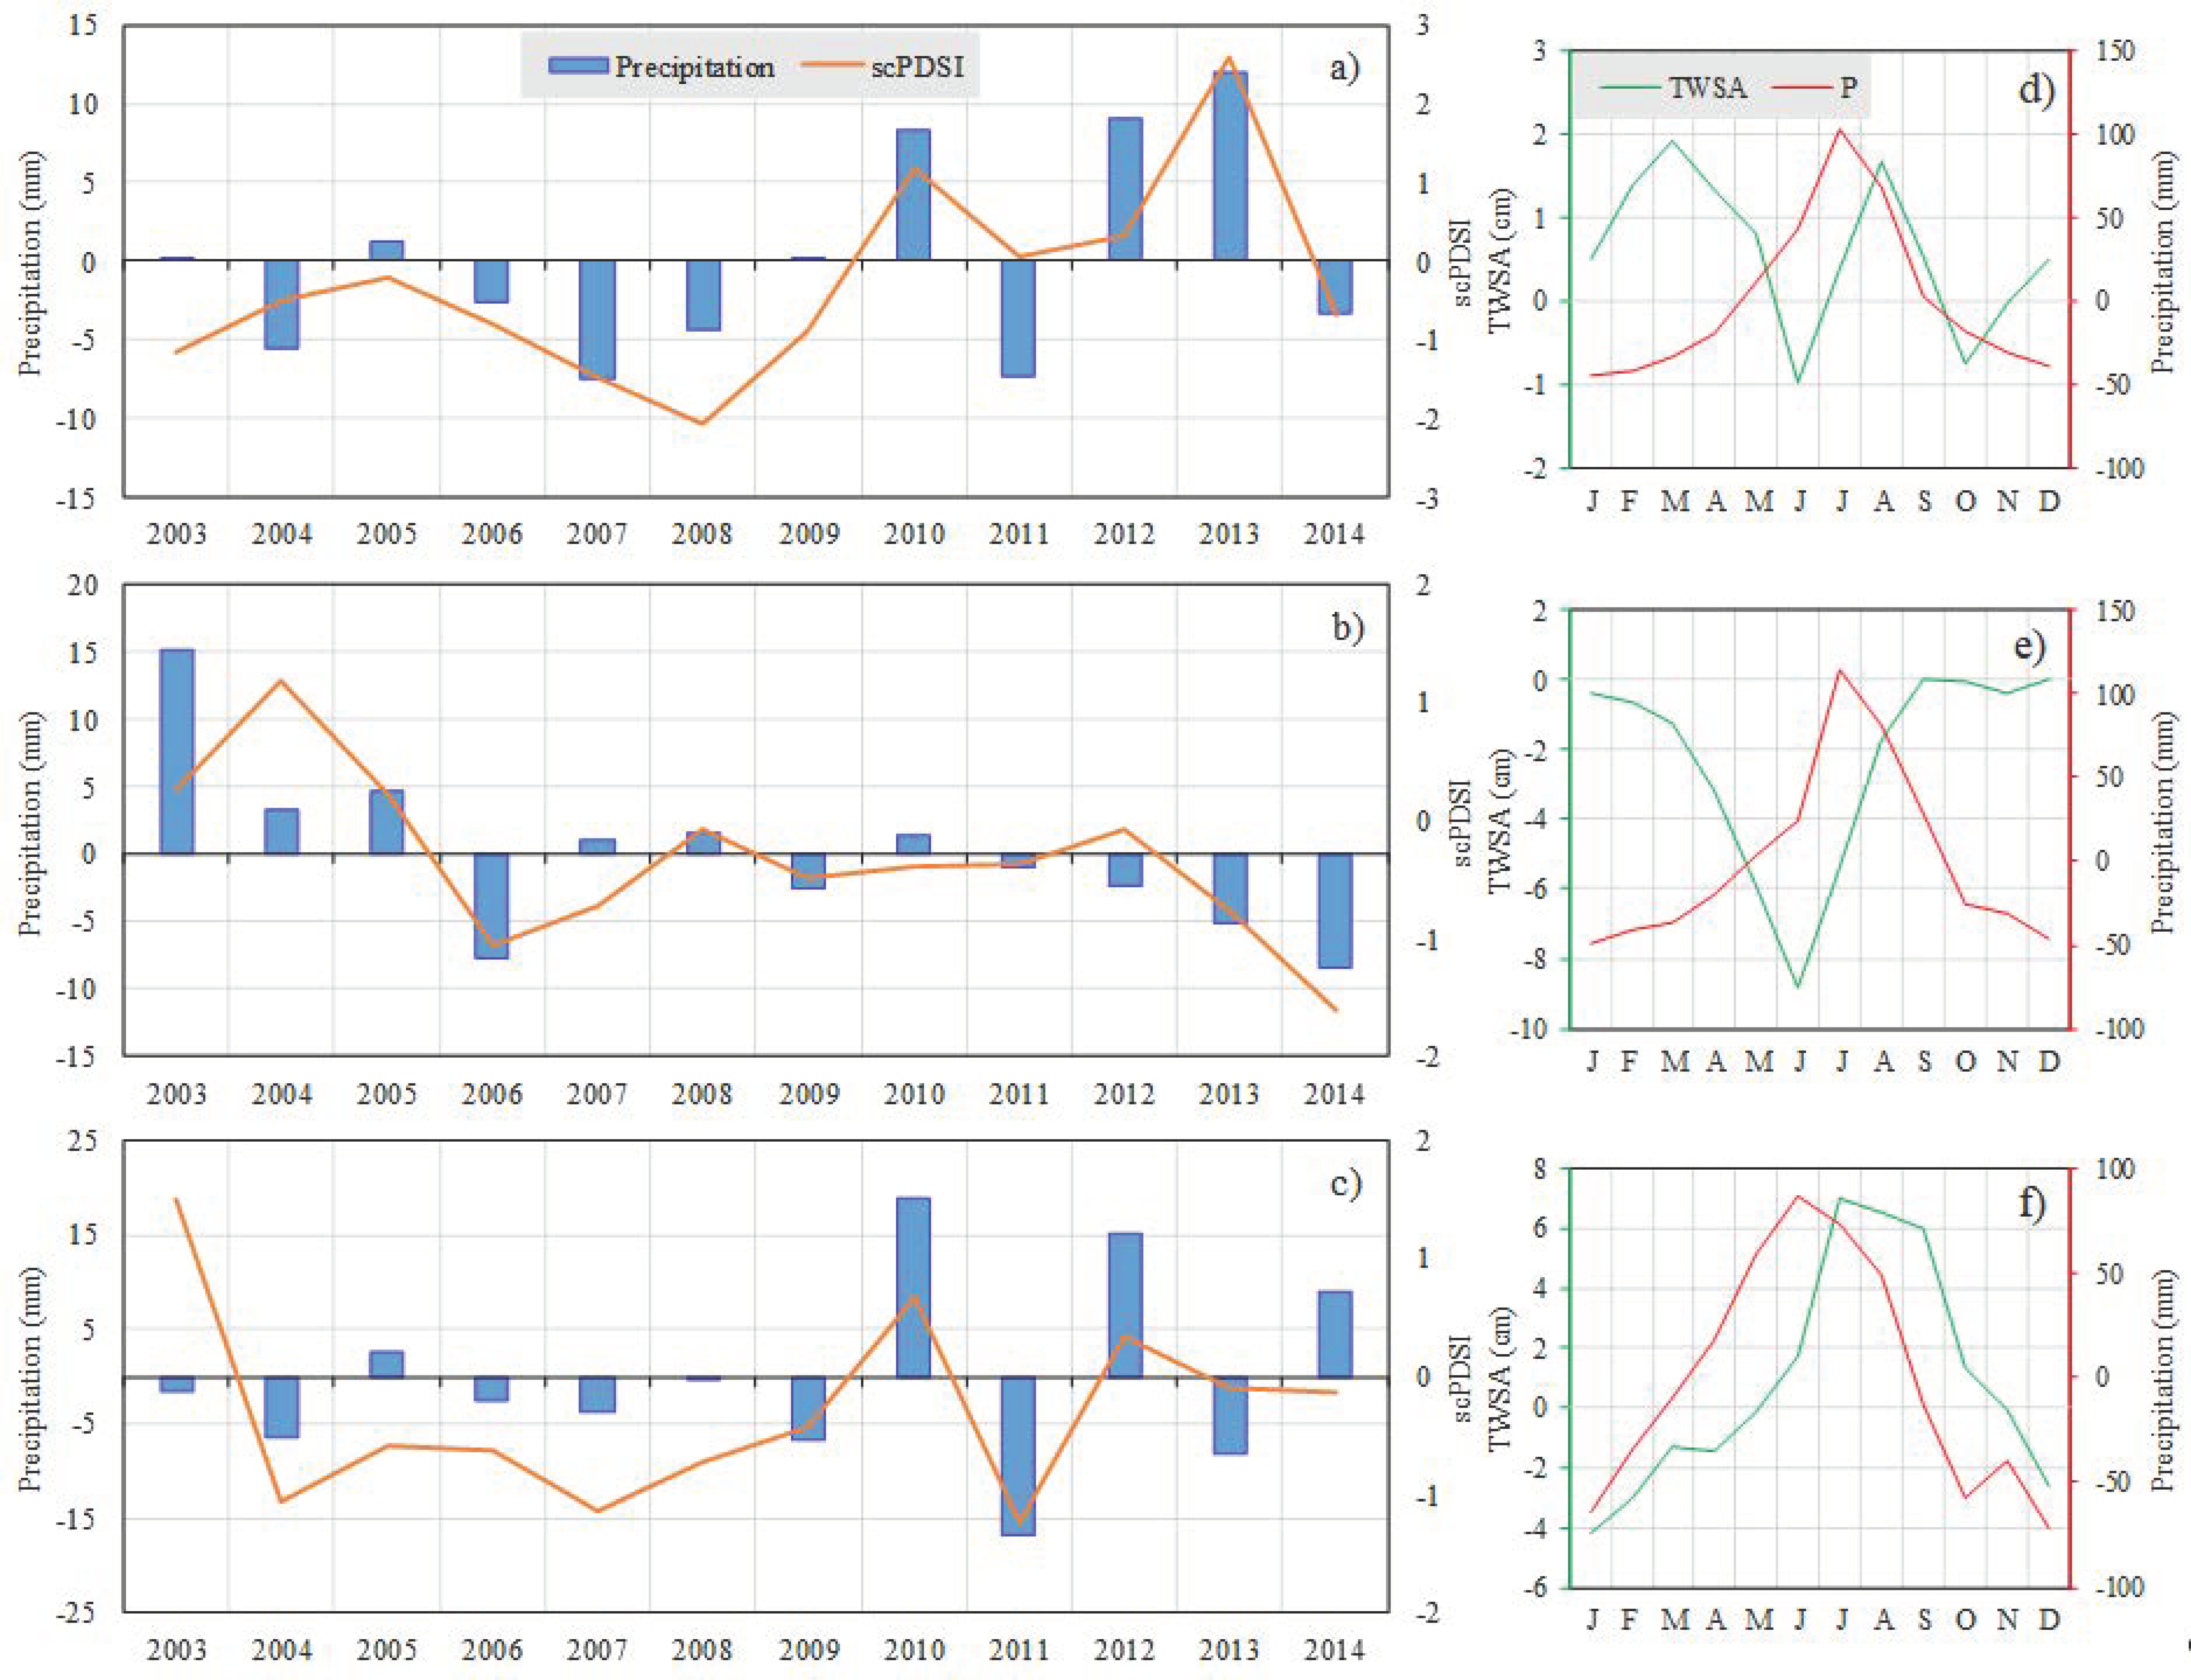
According to the water balance principle, water storage change is simultaneously impacted by meteorological condition and anthropogenic stress. Figure 10 shows the relationships between precipitation, scPDSI and TWSA in the three major grain-producing regions. As shown in Figure 10, the meteorological condition tended toward wet in NECP and YRB (Figure 10a,c), while it tended to drought in HHH (Figure 10b). Moreover, it suggested that variations of precipitation were consistent with that of scPDSI and WSDI (according to Figure 10). The annual average precipitation fluctuated greatly after 2009 in NECP and YRB. In addition, annual variations of TWSA and precipitation were inconsistent in the three regions.
On the one hand, TWSAs in YRB showed approximately one-month shorter lag to precipitation and TWSAs in HHH presented a time lag of two months to precipitation. while TWSAs showed two crests (in March and August) and two troughs (in June and October) yearly in NECP with only one peak in annual precipitation. This suggests that precipitation is not the most important reason for water storage change in NECP and HHH.
On the other hand, the seasonal variations of TWSA were different in the three regions (according to Figure 4). This may be caused by different agricultural irrigation and cropping systems; for example, in NECP, the main crops are ripe once in a year and the growing period is from April to October. Therefore, TWSA decreased from April to October, except for during the rainy season (from June to August) (Figure 10d). Similarly, TWSA decreased during the growing period of the main crops (winter wheat) in HHH but increased during the rainy season (Figure 10e). However, there was not significant decline in TWSA during the growing period of crops in YRB (Figure 10f), because of its abundant water resources. In general, variations of TWSA and precipitation were consistent with each other during 2003–2014, but the seasonal variations of them were different.
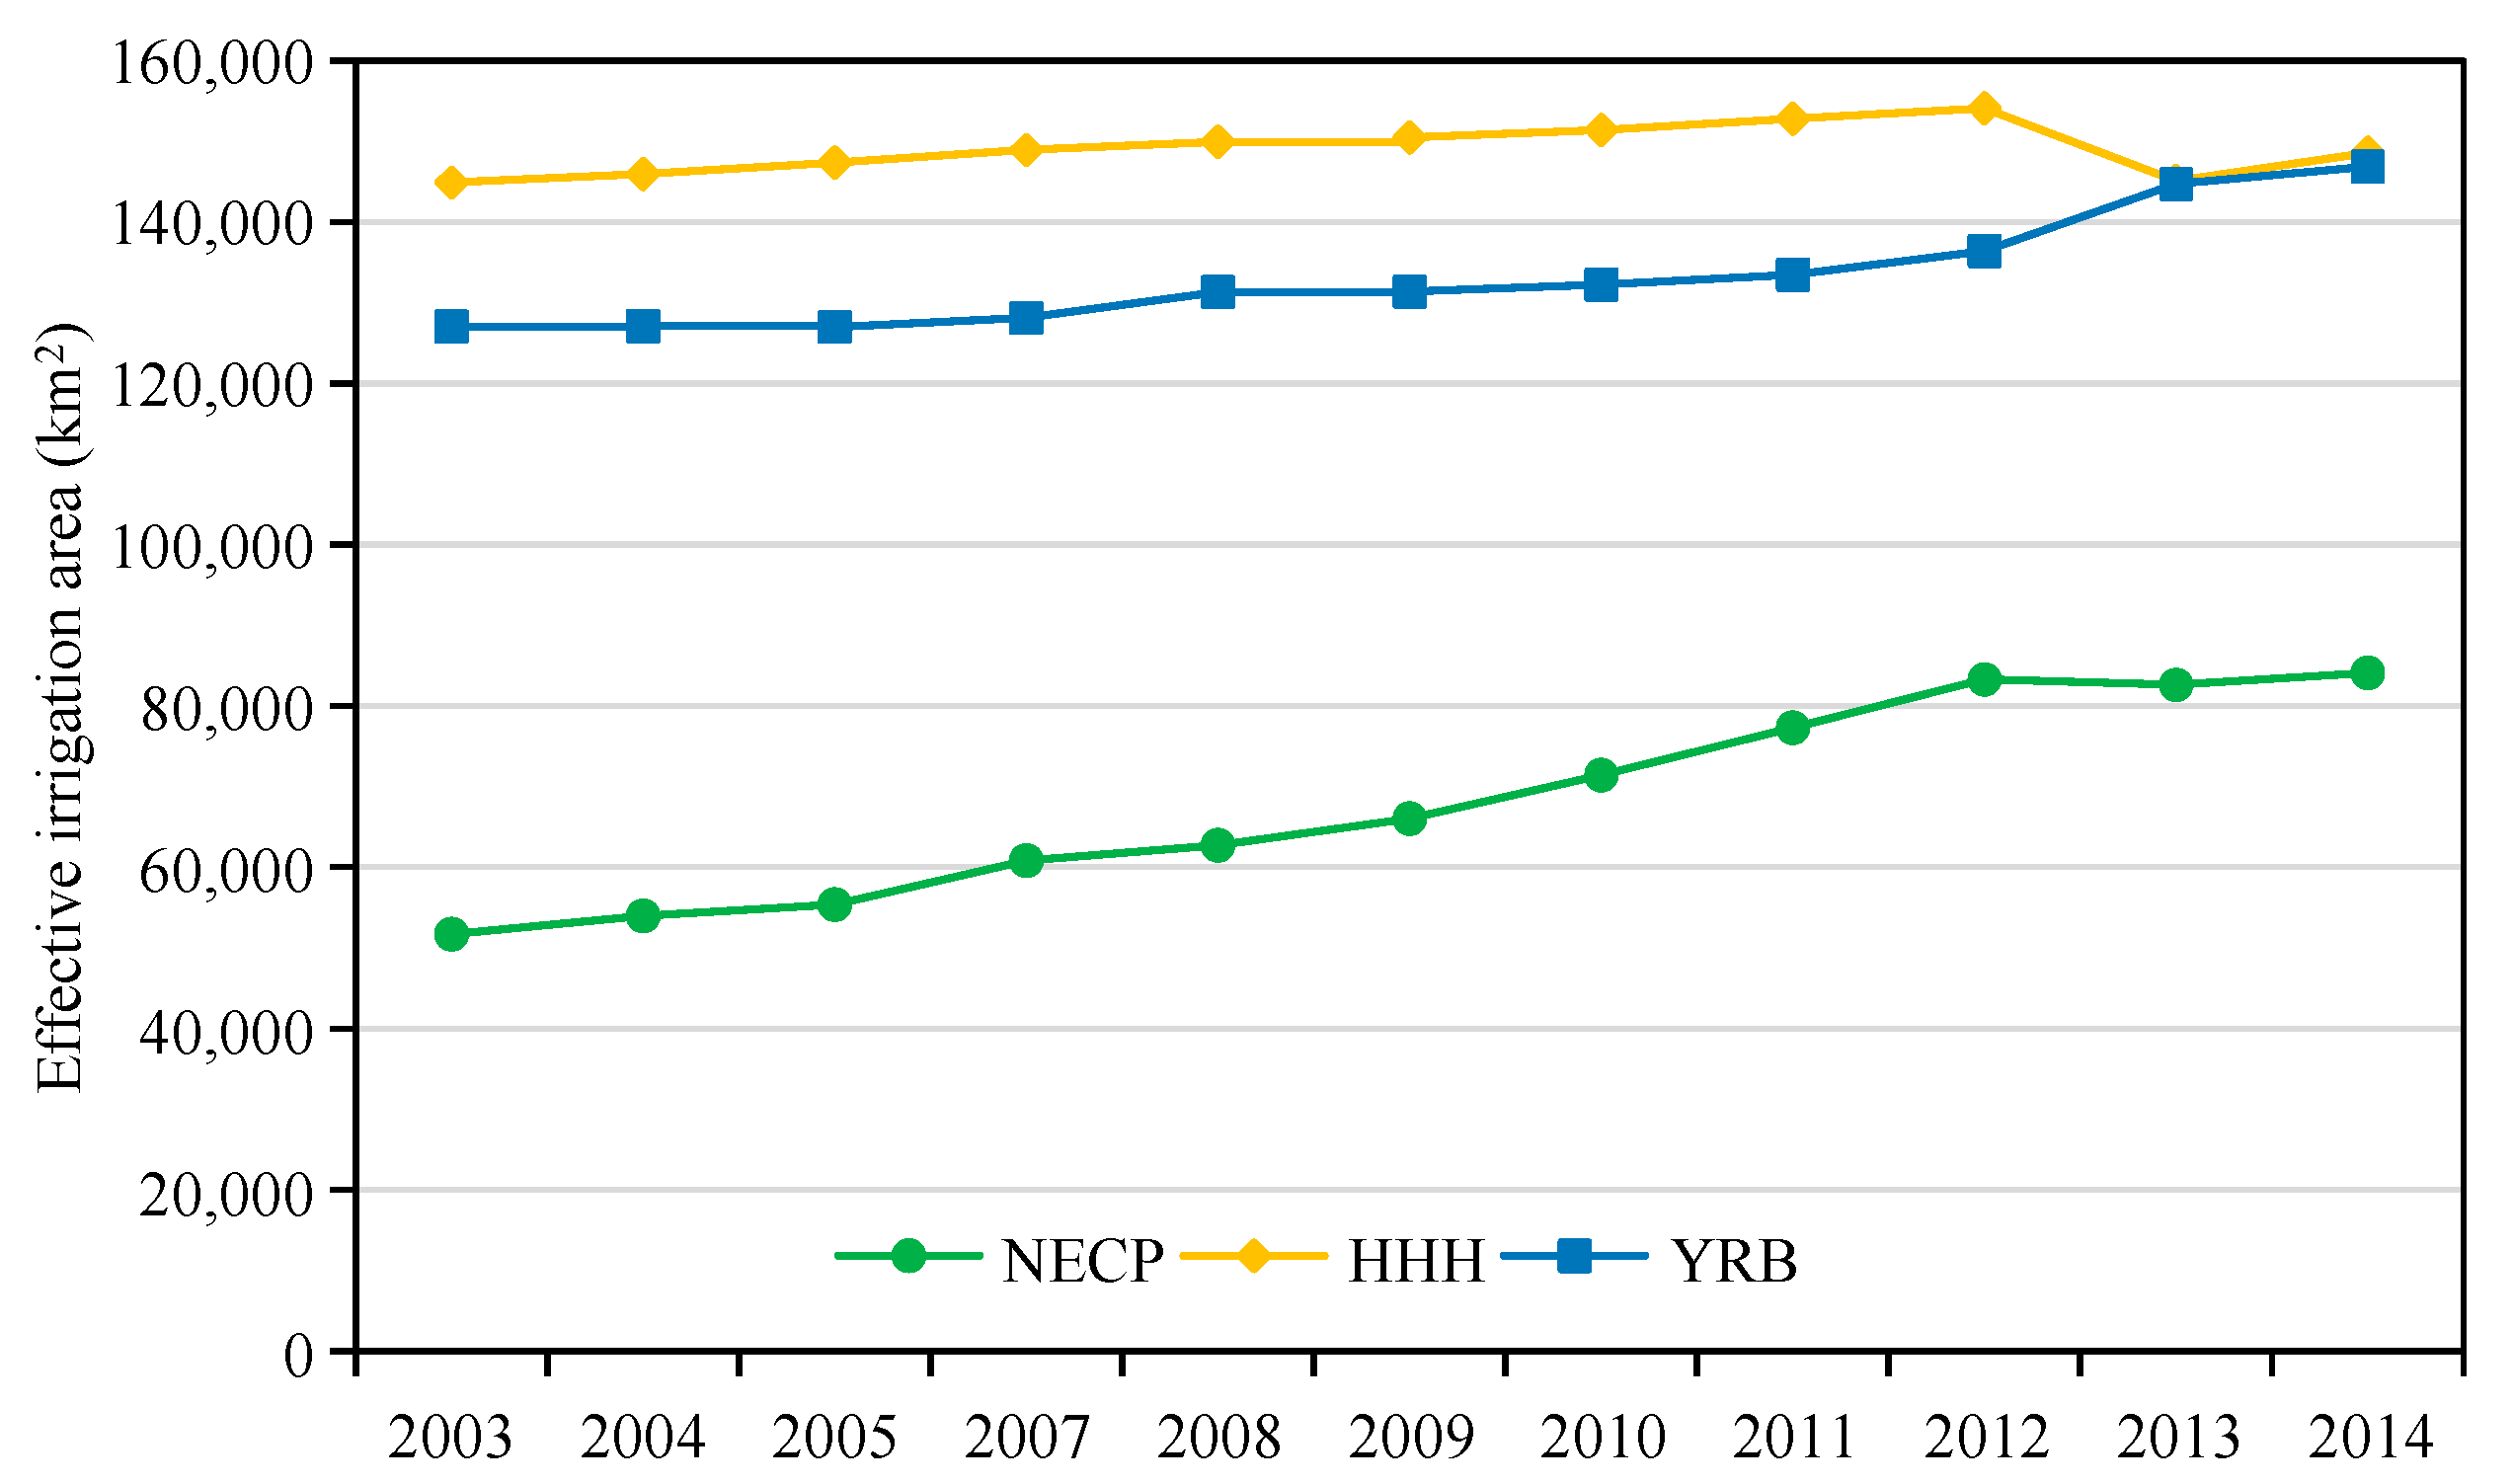
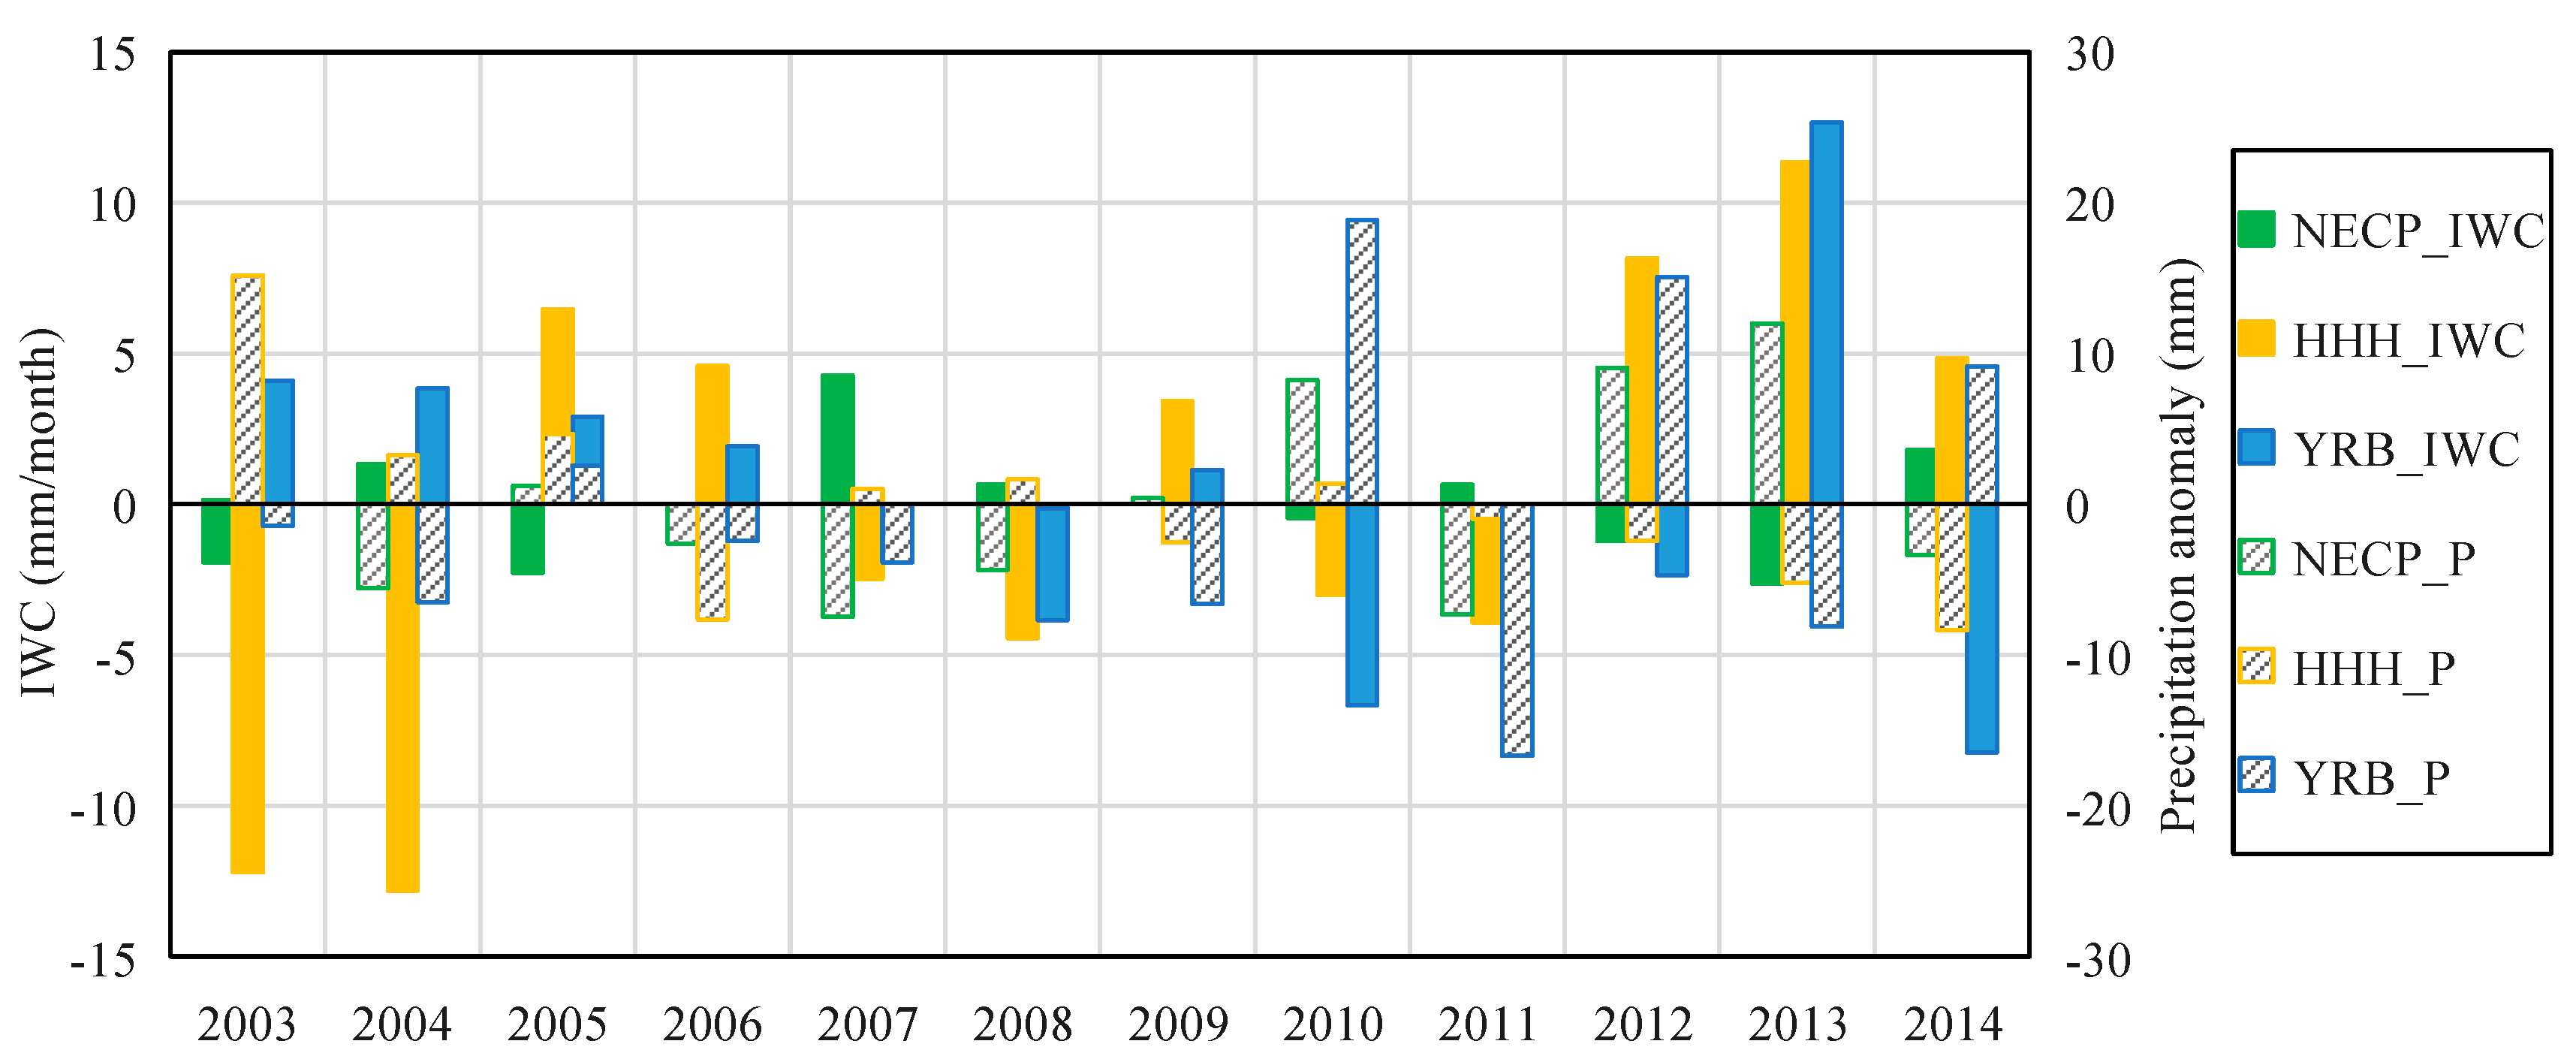
Furthermore, effective irrigation areas were increased in the three regions (Figure 11). However, IWCs did not vary with the effective irrigation area. In fact, IWC varied with meteorological conditions. Figure 12 shows the relationship between precipitation and IWC in the three major grain-producing regions. As can be seen, IWC was reduced as compared to a normal year when precipitation was plentiful (annual precipitation anomaly was positive); conversely, IWC was increased to assure grain production when precipitation was poor (the value is negative). For example, HHH is the important producing region of winter wheat and irrigation is the necessary way to ensure grain output. IWC increased in HHH because of the lack of precipitation, leading to the water storage deficit getting more serious during 2003–2014, according to Figure 5, Figure 6 and Figure 8. This indicated that under the superposition of poor precipitation and increased IWC, water storage reduction and water storage deficit were further aggravated, especially in HHH [43]. Thus, we suggest that the structure of agricultural planting in HHH should be adjusted to reduce the water consumption for irrigation in winter.
5. Conclusions
Due to differences in the meteorological condition and cropping systems, the water storage change characteristics vary from region to region. Based on GRACE CSR data, we analyzed variation features of TWSA in three major grain-producing regions of China over the period from 2003 to 2014. By calculating WSD and WSDI, we evaluated water storage deficits both temporally and spatially. Then, we validated WSDI by using scPDSI production. Finally, we discussed the relationship between TWSA variations and indicators and the possible main reason that caused the different variation patterns. We found that TWSA increased in NECP and YRB with different rates but decreased in HHH during 2003–2014. Moreover, TWSA changed continuously in HHH and YRB while volatility was seen in NECP. In NECP, WSD had two obvious turning points in April 2007 and August 2012; in HHH, WSD has been continuous since 2008, while in YRB, the water storage has showed a surplus since 2008. Spatially, WSDI represented significant differences over NECP. WSD was more serious in middle and south NECP than in the north. The spatial heterogeneity of WSDI was in apparent in HHH and YRB. Furthermore, in the junctional region of YRB and HHH, WSD variations were consistent with that in HHH, because of the similar geography and climate conditions and the impact of adjacent areas. Water storage change is impacted both by meteorological condition and anthropogenic stress. In the three major grain-producing regions, variations in TWSA and precipitation show similar trends during 2003–2014, though their seasonal change characteristics were different. The water storage deficit in HHH was the most serious, since the IWC has been increasing. Last but not the least, increasing IWC to assure grain production under poor precipitation may cause serious WSD. In this case, we suggest that the structure of agricultural planting in HHH should be adjusted to reduce the water consumption for irrigation in winter.
Author Contributions
Conceptualization, W.W. and W.J.; Data curation, Y.C.; Formal analysis, Z.C.; Funding acquisition, W.W.; Investigation, M.G. and B.Z.; Methodology, Z.C.; Resources, W.J.; Supervision, W.J.; Validation, M.G. and B.Z.; Writing—original draft, Z.C.; Writing—review and editing, Y.C. All authors have read and agreed to the published version of the manuscript.
Funding
This work was funded by the National Key Research and Development Program of China (grant no. 2016YFC0503002), the National Natural Science Foundation of China (grant no. 41731286) and the Postdoctoral Research Foundation of China (grant no. 2019M650797).
Data Availability Statement
This study did not report any data.
Acknowledgments
We thank the China Meteorological Administration (http://data.cma.cn (accessed on 4 December 2019)) for providing the meteorological data. We thank the Climatic Research Unit at University of East Anglia for providing the scPDSI data and are available at http://www.cru.uea.ac.uk/data (accessed on 27 March 2019). We would like to thank Müller Schmied H. for providing the irrigation consumption data.
Conflicts of Interest
The authors declare no conflict of interest.
References
- Siebert, S.; Burke, J.; Faures, J.M.; Frenken, K.; Hoogeveen, J.; Döll, P.; Portmann, F.T. Groundwater use for irrigation—A global inventory. Hydrol. Earth Syst. Sci. 2010, 14, 1863–1880. [Google Scholar] [CrossRef] [Green Version]
- Brocca, L.; Tarpanelli, A.; Filippucci, P.; Dorigo, W.; Zaussinger, F.; Gruber, A.; Fernández-Prieto, D. How much water is used for irrigation? A new approach exploiting coarse resolution satellite soil moisture products. Int. J. Appl. Earth Obs. Geoinf. 2018, 73, 752–766. [Google Scholar] [CrossRef]
- Feng, W.; Shum, C.K.; Zhong, M.; Pan, Y. Groundwater storage changes in China from satellite gravity: An overview. Remote Sens. 2018, 10, 674. [Google Scholar] [CrossRef] [Green Version]
- Tapley, B.D.; Bettadpur, S.; Watkins, M.; Reigber, C. The gravity recovery and climate experiment: Mission overview and early results. Geophys. Res. Lett. 2004, 31, L09607. [Google Scholar] [CrossRef] [Green Version]
- Chen, H.; Zhang, W.; Nie, N.; Guo, Y. Long-term groundwater storage variations estimated in the Songhua River Basin by using GRACE products, land surface models, and in-situ observations. Sci. Total Environ. 2019, 649, 372–387. [Google Scholar] [CrossRef]
- Long, D.; Pan, Y.; Zhou, J.; Chen, Y.; Hou, X.; Hong, Y.; Scanlon, B.R.; Longuevergne, L. Global analysis of spatiotemporal variability in merged total water storage changes using multiple GRACE products and global hydrological models. Remote Sens. Environ. 2017, 192, 198–216. [Google Scholar] [CrossRef]
- Koirala, S.; Jung, M.; Reichstein, M.; de Graaf, I.E.M.; Camps-Valls, G.; Ichii, K.; Papale, D.; Ráduly, B.; Schwalm, C.R.; Tramontana, G.; et al. Global distribution of groundwater-vegetation spatial covariation. Geophys. Res. Lett. 2017, 44, 4134–4142. [Google Scholar] [CrossRef]
- Müller Schmied, H.; Eisner, S.; Franz, D.; Wattenbach, M.; Portmann, F.T.; Flörke, M.; Döll, P. Sensitivity of simulated global-scale freshwater fluxes and storages to input data, hydrological model structure, human water use and calibration. Hydrol. Earth Syst. Sci. 2014, 18, 3511–3538. [Google Scholar] [CrossRef] [Green Version]
- Rodell, M.; Houser, P.R.; Jambor, U.; Gottschalck, J.; Mitchell, K.; Meng, C.J.; Arsenault, K.; Cosgrove, B.; Radakovich, J.; Bosilovich, M.; et al. The Global Land Data Assimilation System. Bull. Am. Meteorol. Soc. 2004, 85, 381–394. [Google Scholar] [CrossRef] [Green Version]
- Long, D.; Scanlon, B.R.; Longuevergne, L.; Sun, A.Y.; Fernando, D.N.; Save, H. GRACE satellite monitoring of large depletion in water storage in response to the 2011 drought in Texas. Geophys. Res. Lett. 2013, 40, 3395–3401. [Google Scholar] [CrossRef] [Green Version]
- Tapley, B.D.; Bettadpur, S.; Ries, J.C.; Thompson, P.F.; Watkins, M.M. GRACE measurements of mass variability in the earth system. Science 2004, 305, 503–505. [Google Scholar] [CrossRef] [PubMed] [Green Version]
- Alsdorf, D.; Han, S.C.; Bates, P.; Melack, J. Seasonal water storage on the Amazon floodplain measured from satellites. Remote Sens. Environ. 2010, 114, 2448–2456. [Google Scholar] [CrossRef]
- Frappart, F.; Papa, F.; Güntner, A.; Tomasella, J.; Pfeffer, J.; Ramillien, G.; Emilio, T.; Schietti, J.; Seoane, L.; da Silva Carvalho, J.; et al. The spatio-temporal variability of groundwater storage in the Amazon River Basin. Adv. Water Resour. 2019, 124, 41–52. [Google Scholar] [CrossRef] [Green Version]
- Xiang, L.; Wang, H.; Steffen, H.; Wu, P.; Jia, L.; Jiang, L.; Shen, Q. Groundwater storage changes in the Tibetan Plateau and adjacent areas revealed from GRACE satellite gravity data. Earth Planet. Sci. Lett. 2016, 449, 228–239. [Google Scholar] [CrossRef] [Green Version]
- Girotto, M.; De Lannoy, G.J.M.; Reichle, R.H.; Rodell, M.; Draper, C.; Bhanja, S.N.; Mukherjee, A. Benefits and Pitfalls of GRACE Data Assimilation: A Case Study of Terrestrial Water Storage Depletion in India. Geophys. Res. Lett. 2017, 44, 4107–4115. [Google Scholar] [CrossRef] [Green Version]
- Andrew, R.; Guan, H.; Batelaan, O. Estimation of GRACE water storage components by temporal decomposition. J. Hydrol. 2017, 552, 341–350. [Google Scholar] [CrossRef] [Green Version]
- Xie, Z.; Huete, A.; Restrepo-Coupe, N.; Ma, X.; Devadas, R.; Caprarelli, G. Spatial partitioning and temporal evolution of Australia’s total water storage under extreme hydroclimatic impacts. Remote Sens. Environ. 2016, 183, 43–52. [Google Scholar] [CrossRef]
- Xiao, M.; Koppa, A.; Mekonnen, Z.; Pagán, B.R.; Zhan, S.; Cao, Q.; Aierken, A.; Lee, H.; Lettenmaier, D.P. How much groundwater did California’s Central Valley lose during the 2012–2016 drought? Geophys. Res. Lett. 2017, 44, 4872–4879. [Google Scholar] [CrossRef]
- Thomas, B.F.; Famiglietti, J.S.; Landerer, F.W.; Wiese, D.N.; Molotch, N.P.; Argus, D.F. GRACE Groundwater Drought Index: Evaluation of California Central Valley groundwater drought. Remote Sens. Environ. 2017, 198, 384–392. [Google Scholar] [CrossRef]
- Liu, X.; Feng, X.; Ciais, P.; Fu, B.; Hu, B.; Sun, Z. GRACE satellite-based drought index indicating increased impact of drought over major basins in China during 2002–2017. Agric. For. Meteorol. 2020, 291, 108057. [Google Scholar] [CrossRef]
- Asoka, A.; Gleeson, T.; Wada, Y.; Mishra, V. Relative contribution of monsoon precipitation and pumping to changes in groundwater storage in India. Nat. Geosci. 2017, 10, 109–117. [Google Scholar] [CrossRef] [Green Version]
- Rodell, M.; Velicogna, I.; Famiglietti, J.S. Satellite-based estimates of groundwater depletion in India. Nature 2009, 460, 999–1002. [Google Scholar] [CrossRef] [PubMed] [Green Version]
- Chen, Z.; Jiang, W.; Wu, J.; Chen, K.; Deng, Y.; Jia, K.; Mo, X. Detection of the spatial patterns of water storage variation over China in recent 70 years. Sci. Rep. 2017, 7, 6423. [Google Scholar] [CrossRef] [PubMed] [Green Version]
- Huang, Z.; Pan, Y.; Gong, H.; Yeh, P.J.F.; Li, X.; Zhou, D.; Zhao, W. Subregional-scale groundwater depletion detected by GRACE for both shallow and deep aquifers in North China Plain. Geophys. Res. Lett. 2015, 42, 1791–1799. [Google Scholar] [CrossRef]
- Sun, Z.; Zhu, X.; Pan, Y.; Zhang, J.; Liu, X. Drought evaluation using the GRACE terrestrial water storage deficit over the Yangtze River Basin, China. Sci. Total Environ. 2018, 634, 727–738. [Google Scholar] [CrossRef]
- Huang, Y.; Salama, M.S.; Krol, M.S.; Su, Z.; Hoekstra, A.Y.; Zeng, Y.; Zhou, Y. Estimation of human-induced changes in terrestrial water storage through integration of GRACE satellite detection and hydrological modeling: A case study of the Yangtze River basin. Water Resour. Res. 2015, 51, 8494–8516. [Google Scholar] [CrossRef]
- Zhong, Y.; Zhong, M.; Feng, W.; Wu, D. Groundwater Depletion in the West Liaohe River Basin, China and Its Implications Revealed by GRACE and In Situ Measurements. Remote Sens. 2018, 10, 493. [Google Scholar] [CrossRef] [Green Version]
- Xie, W.; Yang, X.; Yang, J.; Liu, L.; Ye, Q.; Dong, Z.; Liu, Z.; Zhao, J. Spatio-temporal characteristics of drought for soybean under climate change in the three provinces of Northeast China. Acta Ecol. Sin. 2014, 34, 6232–6243. (In Chinese) [Google Scholar]
- Li, Z.; Liu, S.; Sun, R.; Liu, W. Identifying the temporal-spatial pattern evolution of the multiple cropping index in the Huang-Huai-Hai region. Acta Ecol. Sin. 2018, 38, 4454–4460. (In Chinese) [Google Scholar]
- Huang, Y.; Salama, M.S.; Krol, M.S.; Van Der Velde, R.; Hoekstra, A.Y.; Zhou, Y.; Su, Z. Analysis of long-term terrestrial water storage variations in the Yangtze River basin. Hydrol. Earth Syst. Sci. 2013, 17, 1985–2000. [Google Scholar] [CrossRef] [Green Version]
- Zhang, Z.; Chao, B.F.; Chen, J.; Wilson, C.R. Terrestrial water storage anomalies of Yangtze River Basin droughts observed by GRACE and connections with ENSO. Glob. Planet. Chang. 2015, 126, 35–45. [Google Scholar] [CrossRef]
- Long, D.; Shen, Y.; Sun, A.; Hong, Y.; Longuevergne, L.; Yang, Y.; Li, B.; Chen, L. Drought and flood monitoring for a large karst plateau in Southwest China using extended GRACE data. Remote Sens. Environ. 2014, 155, 145–160. [Google Scholar] [CrossRef]
- Tapley, B.D.; Watkins, M.M.; Flechtner, F.; Reigber, C.; Bettadpur, S.; Rodell, M.; Sasgen, I.; Famiglietti, J.S.; Landerer, F.W.; Chambers, D.P.; et al. Contributions of GRACE to understanding climate change. Nat. Clim. Chang. 2019, 9, 358–369. [Google Scholar] [CrossRef] [PubMed]
- Chen, J.; Famigliett, J.S.; Scanlon, B.R.; Rodell, M. Groundwater storage changes: Present status from GRACE observations. Surv. Geophys. 2016, 37, 397–417. [Google Scholar] [CrossRef]
- Frappart, F.; Ramillien, G. Monitoring groundwater storage changes using the Gravity Recovery and Climate Experiment (GRACE) satellite mission: A review. Remote Sens. 2018, 10, 829. [Google Scholar] [CrossRef] [Green Version]
- Wells, N.; Goddard, S.; Hayes, M.J. A self-calibrating Palmer Drought Severity Index. J. Clim. 2004, 17, 2335–2351. [Google Scholar] [CrossRef]
- Liu, Z.; Zhou, P.; Zhang, F.; Liu, X.; Chen, G. Spatiotemporal characteristics of dryness/wetness conditions across Qinghai province, Northwest China. Agric. For. Meteorol. 2013, 182, 101–108. [Google Scholar] [CrossRef]
- Yang, Q.; Li, M.; Zheng, Z.; Ma, Z. Regional applicability of seven meteorological drought indices in China. Sci. China Earth Sci. 2017, 60, 745–760. [Google Scholar] [CrossRef]
- Müller Schmied, H.; Adam, L.; Eisner, S.; Fink, G.; Flörke, M.; Kim, H.; Oki, T.; Portmann, F.T.; Reinecke, R.; Riedel, C.; et al. Variations of global and continental water balance components as impacted by climate forcing uncertainty and human water use. Hydrol. Earth Syst. Sci. 2016, 20, 2877–2898. [Google Scholar] [CrossRef] [Green Version]
- Döll, P.; Muller Schmied, H.; Schuh, C.; Portmann, F.T.; Eicker, A. Global-scale assessment of groundwater depletion and related groundwater abstractions: Combining hydrological modeling with information from well observations and GRACE satellites. Water Resour. Res. 2014, 50, 5698–5720. [Google Scholar] [CrossRef]
- Cleveland, R.B.; Cleveland, W.S.; McRae, J.E.; Terpenning, I. STL: A Seasonal-Trend Decomposition Procedure Based on Loess (with Discussion). J. Off. Stat. 1990, 6, 3–73. [Google Scholar]
- Frappart, F.; Ramillien, G.; Ronchail, J. Changes in terrestrial water storage versus rainfall and discharges in the Amazon basin. Int. J. Climatol. 2013, 33, 3029–3046. [Google Scholar] [CrossRef] [Green Version]
- Zheng, L.; Pan, Y.; Gong, H.; Huang, Z.; Zhang, C. Comparing groundwater storage changes in two main grain producing areas in china: Implications for sustainable agricultural water resources management. Remote Sens. 2020, 12, 2151. [Google Scholar] [CrossRef]
Figure 1.
Land use map of the main agricultural regions in China (i.e., (a) is the Northeast China Plain; (b) is the Huang-Huai-Hai Plain; (c) is the Middle and lower reaches of Yangtze River Plain). The data are provided by Resource and Environment Data Cloud Platform, http://www.resdc.cn/Default.aspx (accessed on 15 April 2019).

Figure 2.
Comparison of scPDSI and WSDI in major grain-producing regions of China: (a) NECP, (b) HHH and (c) YRB.
Figure 2.
Comparison of scPDSI and WSDI in major grain-producing regions of China: (a) NECP, (b) HHH and (c) YRB.

Figure 3.
TWSA time series in three regions: (a) NECP, (b) HHH and (c) YRB. The dashed lines represent a 12-year period (January 2003 to December 2014), the blue lines represent the TWSA time series with seasonal variations removed by STL method and the red lines represent the linear trend of TWSA.
Figure 3.
TWSA time series in three regions: (a) NECP, (b) HHH and (c) YRB. The dashed lines represent a 12-year period (January 2003 to December 2014), the blue lines represent the TWSA time series with seasonal variations removed by STL method and the red lines represent the linear trend of TWSA.

Figure 4.
Annual variation of TWSAs in NECP, HHH and YRB.

Figure 5.
WSD (blue bar) and cumulative WSD (orange area) time series for a 12-year period (January 2003 to December 2014) in (a) NECP, (b) HHH and (c) YRB.
Figure 5.
WSD (blue bar) and cumulative WSD (orange area) time series for a 12-year period (January 2003 to December 2014) in (a) NECP, (b) HHH and (c) YRB.

Figure 6.
WSDI time series in three regions: (a) NECP, (b) HHH and (c) YRB. The dashed lines represent a 12-year period (January 2003 to December 2014), the blue lines represent the TWSA time series with seasonal variations removed by STL method and the red lines represent the linear trend of WSDI.
Figure 6.
WSDI time series in three regions: (a) NECP, (b) HHH and (c) YRB. The dashed lines represent a 12-year period (January 2003 to December 2014), the blue lines represent the TWSA time series with seasonal variations removed by STL method and the red lines represent the linear trend of WSDI.

Figure 7.
Spatial map of annual average WSDI in major grain-producing regions of China from 2003 to 2014.
Figure 7.
Spatial map of annual average WSDI in major grain-producing regions of China from 2003 to 2014.

Figure 8.
Variation of groundwater storage anomaly (GWSA) in NECP, HHH and YRB.

Figure 9.
Spatial distribution of variation of groundwater storage anomaly (GWSA) in NECP, HHH and YRB.
Figure 9.
Spatial distribution of variation of groundwater storage anomaly (GWSA) in NECP, HHH and YRB.

Figure 10.
Time series of annual average precipitation anomaly and scPDSI during 2003–2014 in major grain-producing regions: (a) NECP, (b) HHH and (c) YRB. TWSA and precipitation anomaly variations in a year were shown as (d–f), accordingly. The monthly values were calculated with the mean value of observations in the same month of each year from 2003 to 2014.

Figure 11.
Effective irrigation area in the three major grain-producing regions from 2003 to 2014 (effective irrigation area in 2016 was missed).
Figure 11.
Effective irrigation area in the three major grain-producing regions from 2003 to 2014 (effective irrigation area in 2016 was missed).

Figure 12.
Annual average precipitation anomaly and IWC anomaly in the three major grain-producing regions from 2003 to 2014.
Figure 12.
Annual average precipitation anomaly and IWC anomaly in the three major grain-producing regions from 2003 to 2014.


Table 1.
Summary of the dataset used in this study.
| Data Source | Data Name | Spatial and Temporal Resolution | Time Span | Data Access |
|---|---|---|---|---|
| Satellite | TWSA | 1 × 1°, monthly | 2003–2014 | http://www2.csr.utexas.edu/grace/RL05_mascons.html (accessed on 14 January 2019) |
| Model | scPDSI | 0.5 × 0.5°, monthly | 2003–2014 | http://www.cru.uea.ac.uk/data (accessed on 27 March 2019) |
| Model | IWC | 0.5 × 0.5°, yearly | 2003–2014 | - |
| Model | GWS | 0.5 × 0.5°, yearly | 2003–2014 | - |
| Insitu | Precipitation | 0.5 × 0.5°, monthly | 2003–2014 | http://data.cma.cn/data (accessed on 4 December 2019) |
Table 2.
Groundwater storage deficit in NECP, HHH and YRB.
| Regions | NECP | HHH | YRB |
|---|---|---|---|
| average | 5.03 | −194.70 | 72.94 |
| Maximum | 35.41 | −102.23 | 111.78 |
| Minimum | −7.11 | −288.64 | 41.77 |
Publisher’s Note: MDPI stays neutral with regard to jurisdictional claims in published maps and institutional affiliations. |
© 2021 by the authors. Licensee MDPI, Basel, Switzerland. This article is an open access article distributed under the terms and conditions of the Creative Commons Attribution (CC BY) license (https://creativecommons.org/licenses/by/4.0/).
Share and Cite
MDPI and ACS Style
Chen, Z.; Wang, W.; Jiang, W.; Gao, M.; Zhao, B.; Chen, Y. The Different Spatial and Temporal Variability of Terrestrial Water Storage in Major Grain-Producing Regions of China. Water 2021, 13, 1027. https://doi.org/10.3390/w13081027
AMA Style
Chen Z, Wang W, Jiang W, Gao M, Zhao B, Chen Y. The Different Spatial and Temporal Variability of Terrestrial Water Storage in Major Grain-Producing Regions of China. Water. 2021; 13(8):1027. https://doi.org/10.3390/w13081027
Chicago/Turabian StyleChen, Zheng, Wenjie Wang, Weiguo Jiang, Mingliang Gao, Beibei Zhao, and Yunwei Chen. 2021. "The Different Spatial and Temporal Variability of Terrestrial Water Storage in Major Grain-Producing Regions of China" Water 13, no. 8: 1027. https://doi.org/10.3390/w13081027
Note that from the first issue of 2016, this journal uses article numbers instead of page numbers. See further details here.