Article

Environmental Assessment and Toxic Metal-Contamination Level in Surface Sediment of a Water Reservoir in the Brazilian Cerrado

by
João Batista Pereira Cabral
1,*,
Pollyanna Faria Nogueira
1,
Valter Antonio Becegato
2,
Vitor Rodolfo Becegato
2 and
Alexandre Tadeu Paulino
3,4,*
1
Federal University of Jataí, Cidade Universitária, BR 364, km 195, n. 3800, Jataí 75801-615, Goiás, Brazil
2
Department of Environmental and Sanitary Engineering, Santa Catarina State University, Av. Luiz de Camões, 2090, Conta Dinheiro, Lages 88520-000, Santa Catarina, Brazil
3
Postgraduate Program in Applied Chemistry, Santa Catarina State University, Rua Paulo Malschitzki, 200, Zona Industrial Norte, Joinville 89219-710, Santa Catarina, Brazil
4
Department of Food and Chemical Engineering, Santa Catarina State University, BR 282, km 574, Linha Santa Terezinha, 89870-000 Pinhalzinho, Santa Catarina, Brazil
*
Authors to whom correspondence should be addressed.
Water 2021, 13(8), 1044; https://doi.org/10.3390/w13081044
Submission received: 18 February 2021 / Revised: 17 March 2021 / Accepted: 28 March 2021 / Published: 10 April 2021
(This article belongs to the Section Water Quality and Contamination)

Abstract

:
Polluted sediments limit the useful and biotic life of a water reservoir. Therefore, the classification and verification of the contamination and pollution levels of water reservoirs are essentials for the preservation of the biota and to organize the actions of environmental management. Thus, the aim of this study is to determine the concentrations of potentially toxic metals [lead (Pb), zinc (Zn), nickel (Ni), copper (Cu), and cadmium (Cd)] in sediment samples collected in the water reservoir of the Foz do Rio Claro Hydroelectric Power Plant (FRCHEPP) and estimate the contamination level by using the geoaccumulation index (Igeo). All results were compared with the values established by the CONAMA Resolution 454/2012. The Cu and Cd concentrations in the sediment samples were above Level II for most of the analyzed points in comparison with the data of the CONAMA resolution, being classified as poor quality sediments. Moreover, the Igeo values indicated potential pollution of the water reservoir sediment by Cu and Cd. Hence, the water reservoir was classified between moderately and extremely polluted. From this work it is possible to conclude that the frequent monitoring of the sediment quality in the FRCHEPP water reservoir is an indispensable action for periodic evaluation of the hydrographic basin quality in the study region, considering its importance as water supply and power generation for the state of Goiás, Brazil. Overall, the results of this work can be important to study other water reservoirs around the world.

1. Introduction

Hydroelectric power plants (HEPP) are the main sources of electricity generation in Brazil. This type of hydraulic enterprise leads to the formation of large water non-natural reservoirs, resulting in hydrological, atmospheric, and biological changes in environmental sites. HEPP causes environmental impacts during and after their construction due to changes in the model of use and occupation in the watershed region [1,2,3]. However, the importance and role of hydraulic enterprises for either soil irrigation or electricity generation are indisputable. Generally, the construction of HEPP alters the fluvial dynamics of watercourses and sediment transports, which are deposited in the water non-natural reservoirs. Hence, potentially toxic metals existing in hydrographic basins are also deposited in these environmental sites [4,5,6]. The water contamination by toxic metals is a worldwide issue due to high amount of HEPP constructed in the last years, and, lack of environmental politics for the monitoring and management of HEPP direct influence areas [7].
Metals as Cr, Ni, Cu, Zn, Cd, Pb, and Hg are potentially toxic species that can be anthropologically transferred to aquatic and terrestrial organisms, changing the natural biodiversity [5]. Metals as Cu, Zn, and Ni can appear in the environment due to the pesticide use in agricultural crops as these metals are essential micronutrients for the plant growth [8,9]. Most of the fertilizers applied on agriculture and livestock has different metal concentrations, which are toxic at high concentrations [9]. These metals are easily transported for water bodies after leaching and precipitation processes in soils [10]. The excessive accumulation of toxic metals in water reservoirs, animals, and plants alters the food chain, generating harmful effects for the human beings [11,12]. Therefore, the quality of waters and sediments is determined according to the land use and cover in the watershed region [8]. High metal concentrations in water, soil, and sediment due to anthropological activities cause harmful effects on the biota [13,14,15,16]. Phosphate-based fertilizers employed in agropastoral activities generally have potentially toxic metal (Pb, Al, Cd, Cu, Fe, Zn, Ni, Mn, Cr) and radionuclide (232Th and 40K) contents, being one of the main anthropological sources of environmental site pollution [17,18,19].
Potentially toxic metal concentrations in sediments are commonly used for establishing the contamination and pollution levels of aquatic ecosystems [6]. These information are widely discussed with the use of statistical tools, error mathematical models, and standards explaining the environmental problems occurring in water reservoirs [3,6,19]. The toxic metals concentration in water reservoir sediments is useful to indicate the pollution degrees and sources of some pollutants such as Pb, Cd, and Zn [20]. These studies are also important to define pollution sources from industrial effluents, household waste slurries, agriculture activities, and land uses [21]. Environmental pollution and contamination levels of soils and sediments by toxic metals and radionuclides can be quantified by determining the pollutant concentration, estimating the existing risk for the human, plant, and animal health, and determining the accumulation degree during different periods of time [22,23,24].
The CONAMA resolution 454/2012 establishes maximum allowed concentrations of toxic metals in the environment to be considered non-polluted site. These values are then used for predicting the water and sediment contamination levels. The environmental site is not polluted when the metal concentration is below the allowed limit (Level I). In this case, there is lower probability of harmful effects on the biota. On the contrary, the environmental site is polluted when the metal concentration is above the allowed limit (Level II). In this case, there is higher probability of harmful effects on the biota [25]. One of the most used parameters for the evaluation of environmental impacts on the biota is the geoaccumulation index (Igeo) [26]. Igeo is commonly useful to determine the pollution degree, and it helps in the identification of polluting sources [14,27,28,29,30,31].
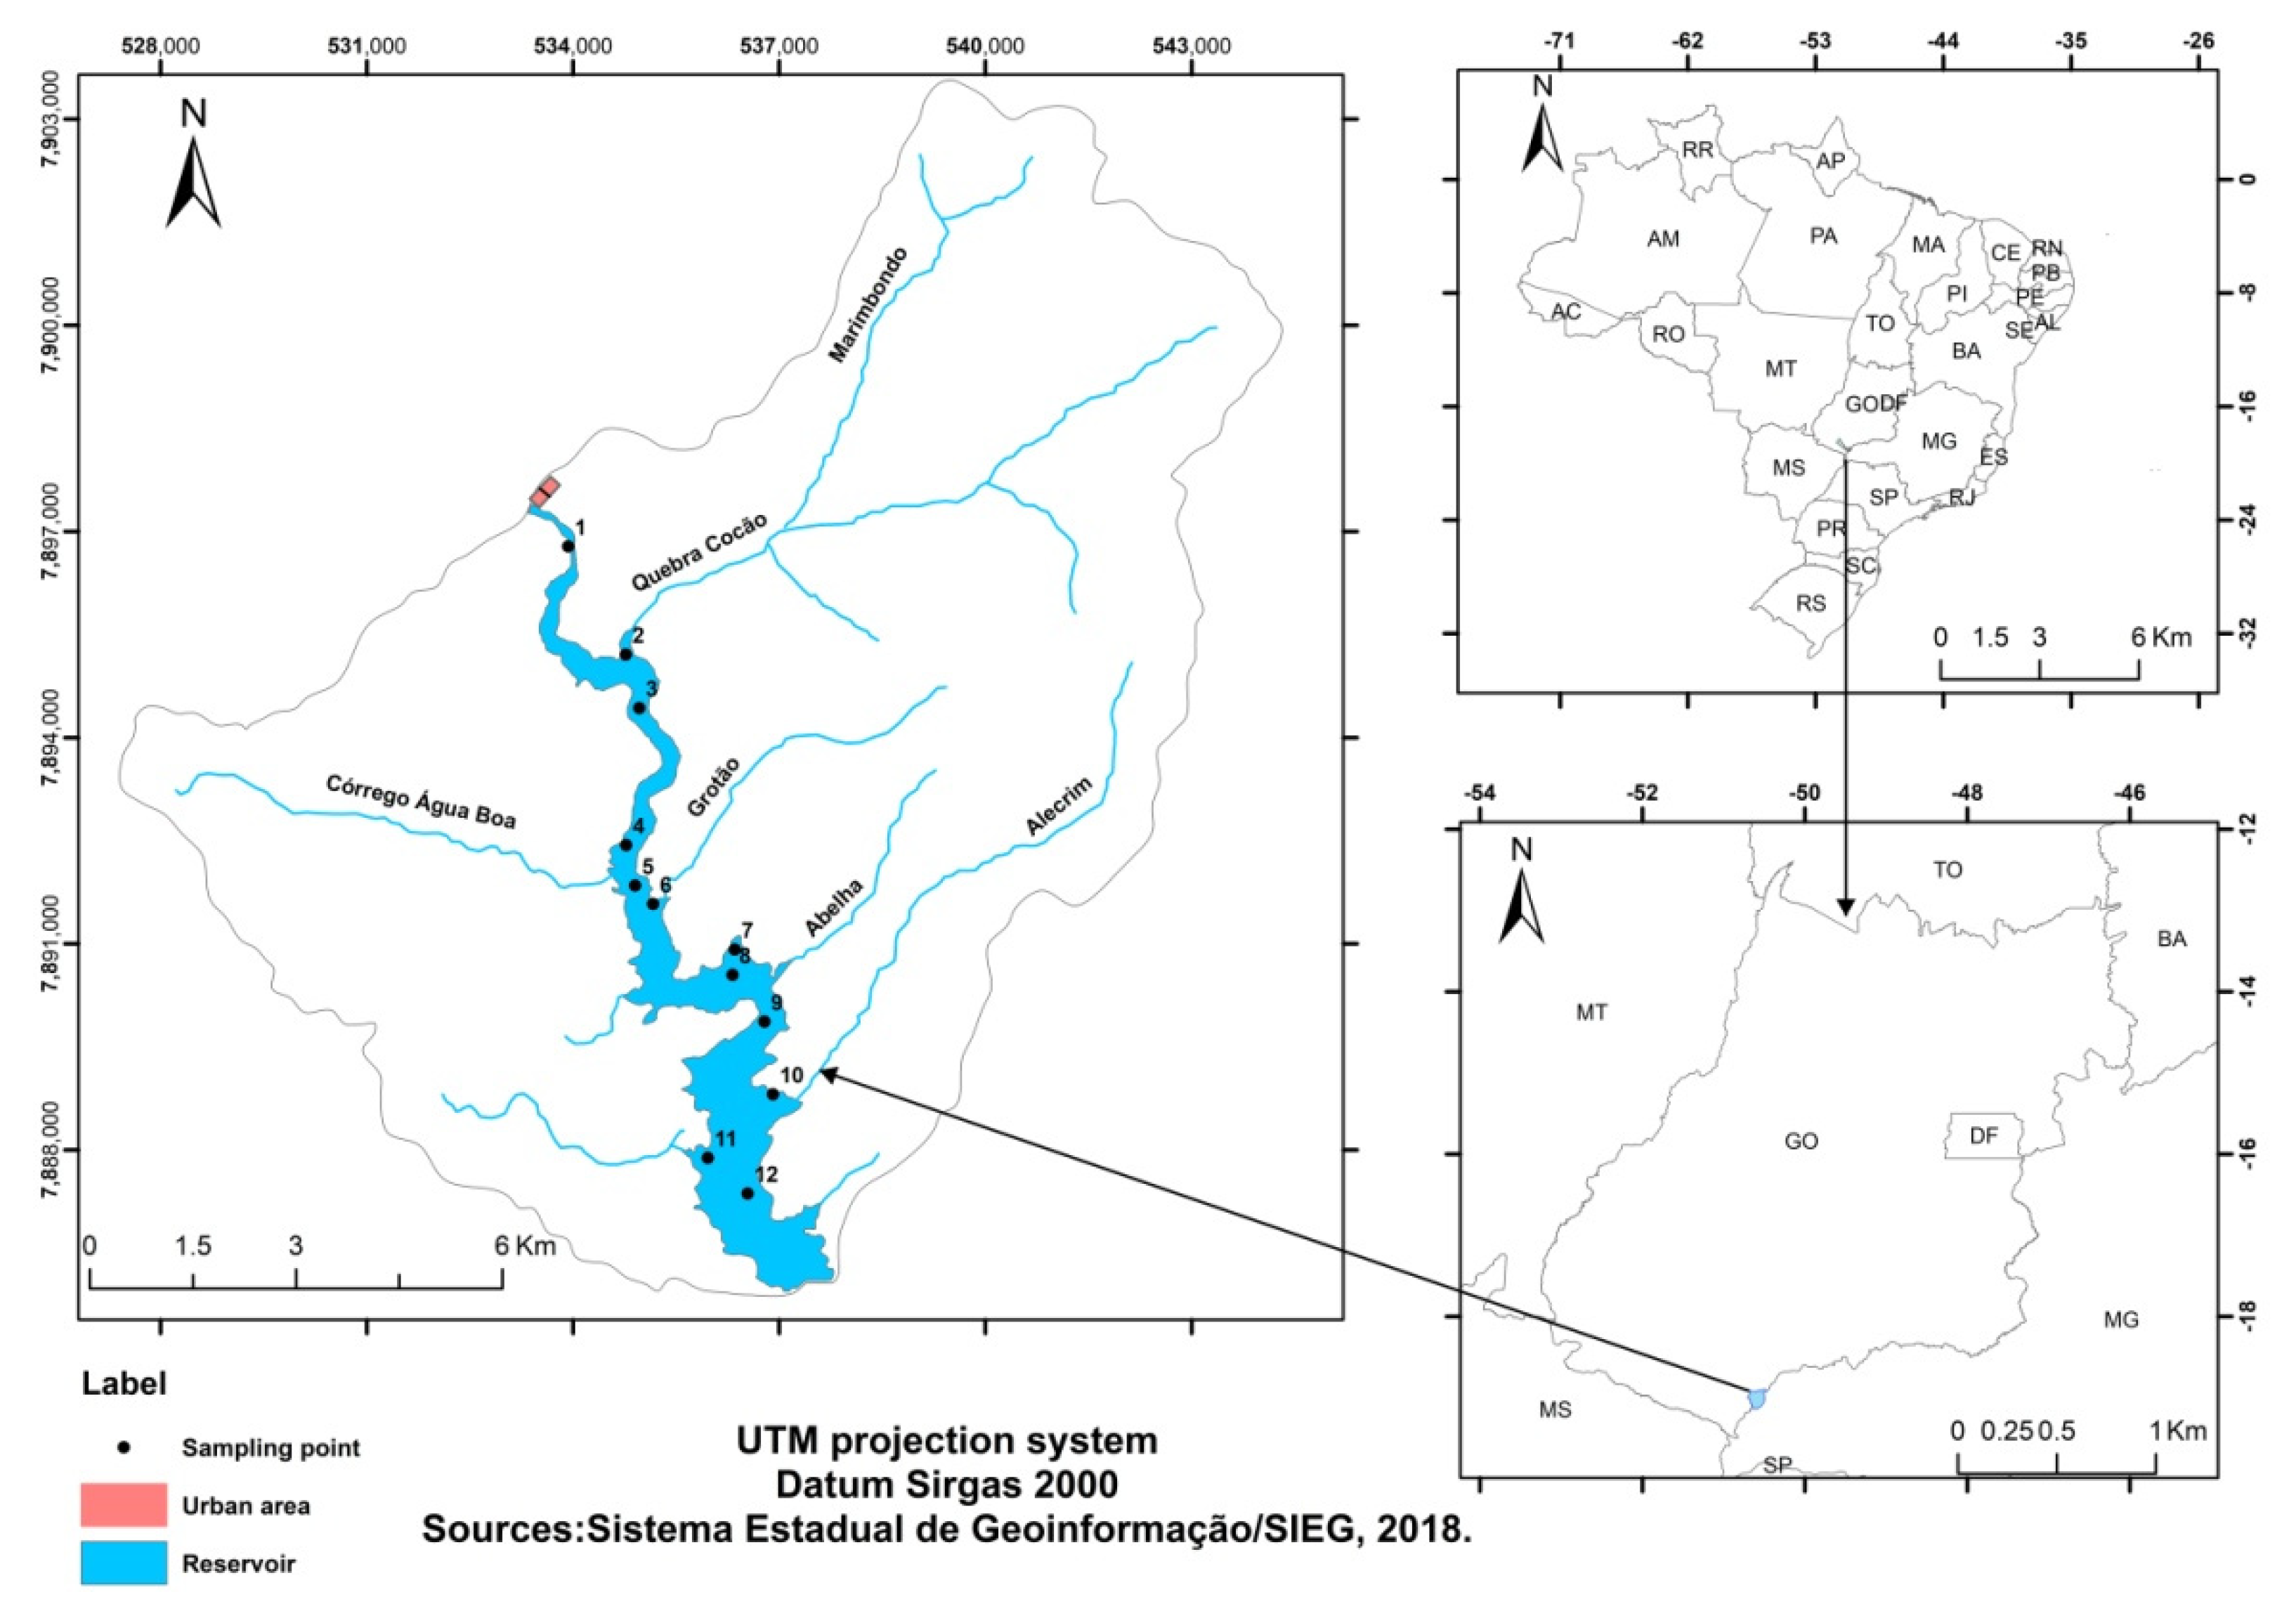
Thus, the aim of this study is to determine the concentrations of potentially toxic metals (Pb, Zn, Ni, Cu, Hg, and Cd) in sediment samples collected in the water reservoir of the Foz do Rio Claro Hydroelectric Power Plant (FRCHEPP), and estimate the contamination level by using the geoaccumulation index (Igeo). The FRCHEPP water reservoir was selected due to the land use and occupation on the Rio Claro hydrographic basin region. Currently, there are intense agricultural activities with sugarcane production, and several hydroelectric plant projects for construction in this region.

2. Material and Methods

2.1. Study Area

The FRCHEPP water reservoir is located between the municipalities of São Simão and Caçu, in the state of Goiás, Brazil (Figure 1). This enterprise occupies a total area of approximately 7.69 km2, with average water residence time of 4.9 days. The FRCHEPP is working since January 2010, generating 64.8 MW of electric energy for the country. The direct influence area of the FRCHEPP water reservoir is geologically located in the Paraná sedimentary basin, with two large lithostratigraphic groups: i) basalts of the serra geral formation of the são bento group, and ii) sandstones of the vale do rio do peixe formation of the bauru group [32]. This basin has soils with slopes ranging from flat to gently undulated [32]. The rainy season is from October to April, with higher rainfall indices ranging from 80 to 500 mm/month. The drier period lasts from May to September. Overall, this area is classified as Awa, tropical savannah, mesothermal. The average annual rainfall indices range from 1400 to 1750 mm. The main activities in this area are livestock and agriculture (sugarcane, maize, and soybean crops) [33].

2.2. Sample Preparation and Analysis Methods

Twelve points were selected for collecting sediment samples in the FRCHEPP water reservoir as shown in Figure 1. The sampling points were defined by satellite images with the aim of covering different water reservoir regions. All the sediment samples were collected on January, a period with high rainfall indices in the Brazilian Cerrado. This experiment was performed using a Kajak-type bottom sediment sampler. The collected samples were dried at room temperature for 30 days [34]. Afterwards, 50 g aliquots were added to digestion tubes, followed by the addition of approximately 9 mL of HNO3 and 3 mL of sub-distilled HCl [35]. These tubes were placed in a microwave (Ethos UP brand, Millestone) for 30 min for acidic digestion. Finally, these systems were removed from the microwave oven for cooling and filtering. The cold supernatants were transferred to 50-mL volumetric flasks, filling to the maximum volume with Milli-Q® water, and left at 4 °C prior to the metal determination by inductively coupled plasma optical emission spectrometry (ICP-OES: PERKIN ELMER brand, OPTIMA 8300 DV model) [35]. Detection limits of the ICP-OES: Cu (0.52 mg kg−1); Zn (0.57 mg kg−1); Ni (0.18 mg kg−1); Cd (0.13 mg kg−1); Pb (0.81 mg kg−1). The ICP-OES calibration solutions were prepared from 1000 mg L−1 stock standard metal solutions. Recovery tests were performed to guarantee the analytical quality control of the sample preparation and analysis methods. All experiments were performed in triplicate. The metal concentrations in the FRCHEPP water reservoir sediments were compared with those established by the CONAMA Resolution n° 454/2012 (Table 1).

2.3. Organic Matter (OM) Content

The organic matter (OM) content was determined by measuring 1.0 g crushed sediment weights. These samples were calcinated in a muffle furnace at 500 °C for 4 h. Next, the remaining ashes were cooled in moisture-free environment; with the OM contents calculated using Equation (1):
O M = W d W m W d × 100
in which, Wd is the total dried sample weight (mineral + OM), and Wm is the dried sample weight (mineral particles).

2.4. Geoaccumulation Index (Igeo)

The geoaccumulation index (Igeo) was determined using Equation (2) [26]:
I g e o = l o g 2 C n 1.5   ×   C B n
in which, Cn is the metal concentration in the sediment fine fraction to be classified, CBn is the average metal geochemical background concentration, and 1.5 is the correction factor for possible background variations caused by lithological differences.
Table 2 shows classification parameters for the sediment sample quality according to the geoaccumulation index.
The regional background values for Igeo were established based on the lowest natural metal concentration in the environment [36]. These values are shown in Table 3.

2.5. Particle Size Analysis

The particle size analysis was performed by placing the collected sediment samples in an oven at 105 °C for approximately 48 h. Next, the samples were pounded to break up clods and sieved using a 2-mm granulometric sieve, separating the sand fraction. The total clay fraction (diameter lower than 0.002 mm) was determined by pipetting following the Stokes’ Law, whereas the silt fraction (diameter from 0.05 to 0.002 mm) was calculated by the difference between the sum of sand and total clay fraction.

2.6. Linear Regression

The association and interference degree among the study variables was evaluated by linear regression. This correlation was conducted at intervals ranging from +1 to −1, and the base information are shown in Table 4 [37].
The correlation coefficient significance was evaluated using the Student test (t) with critical distribution for twelve samples, freedom degree for ten samples of 2.764, and significance level of 98%.

3. Results and Discussion

Table 5 shows the pH values, cation exchange capacities, organic matter, clay, silt and sand contents, and metal concentrations in the FRCHEPP water reservoir sediment samples.
The pH values (from 4.50 to 5.50) of the sediment samples during the study period indicated an acidic environment. This result is associated with the types of soils in the water reservoir direct influence area. In this case, the dystrophic red latosol (type of oxisol) found in this region have base saturation lower than 50% in the first 100 cm of the B horizon, whereas the dystroferric red latosol (type of oxisol) have base saturation higher than 50%, with presence of high Fe2O3, MnO, and TiO2 contents [38]. Overall, the pH values were similar to those determined in latosols from dense Cerrado in the Goiás southwest and native Forests in the state of Para, Brazil [39,40].
The lowest OM content was noticed in the sampling point 12, whereas the highest OM content was noticed in the sampling point 11. There are several phenolic and carboxylic functional groups in OM interacting with metal cations via ionic bond or complexation reaction, increasing the metal concentration in sediments [29]. However, these interactions were not predominant as at acidic pH the carboxylic groups tend to be protonated, decreasing the intermolecular interaction forces with metal cations. In this condition, the metallic species are bioavailable, being possibly toxic for the environment. The OM content variations can be associated to the presence of allochthonous materials deposited in the water reservoir, which transported considerable metal concentrations [3].
The CEC values ranged from 2.400 (point 1) to 24.00 cmolc kg−1 (point 5), indicating that most of sediment samples has high cation exchange capacity. High CEC values can be useful to adsorb metals and mitigate environmental impacts in water reservoirs [41]. Moreover, high silt, clay, and OM contents favor the metal cation adsorption in the sediment structure, decreasing the metal concentration in water. This can decrease the environmental impact due to presence of anthropological actions in hydrographic basin direct influence areas [42].
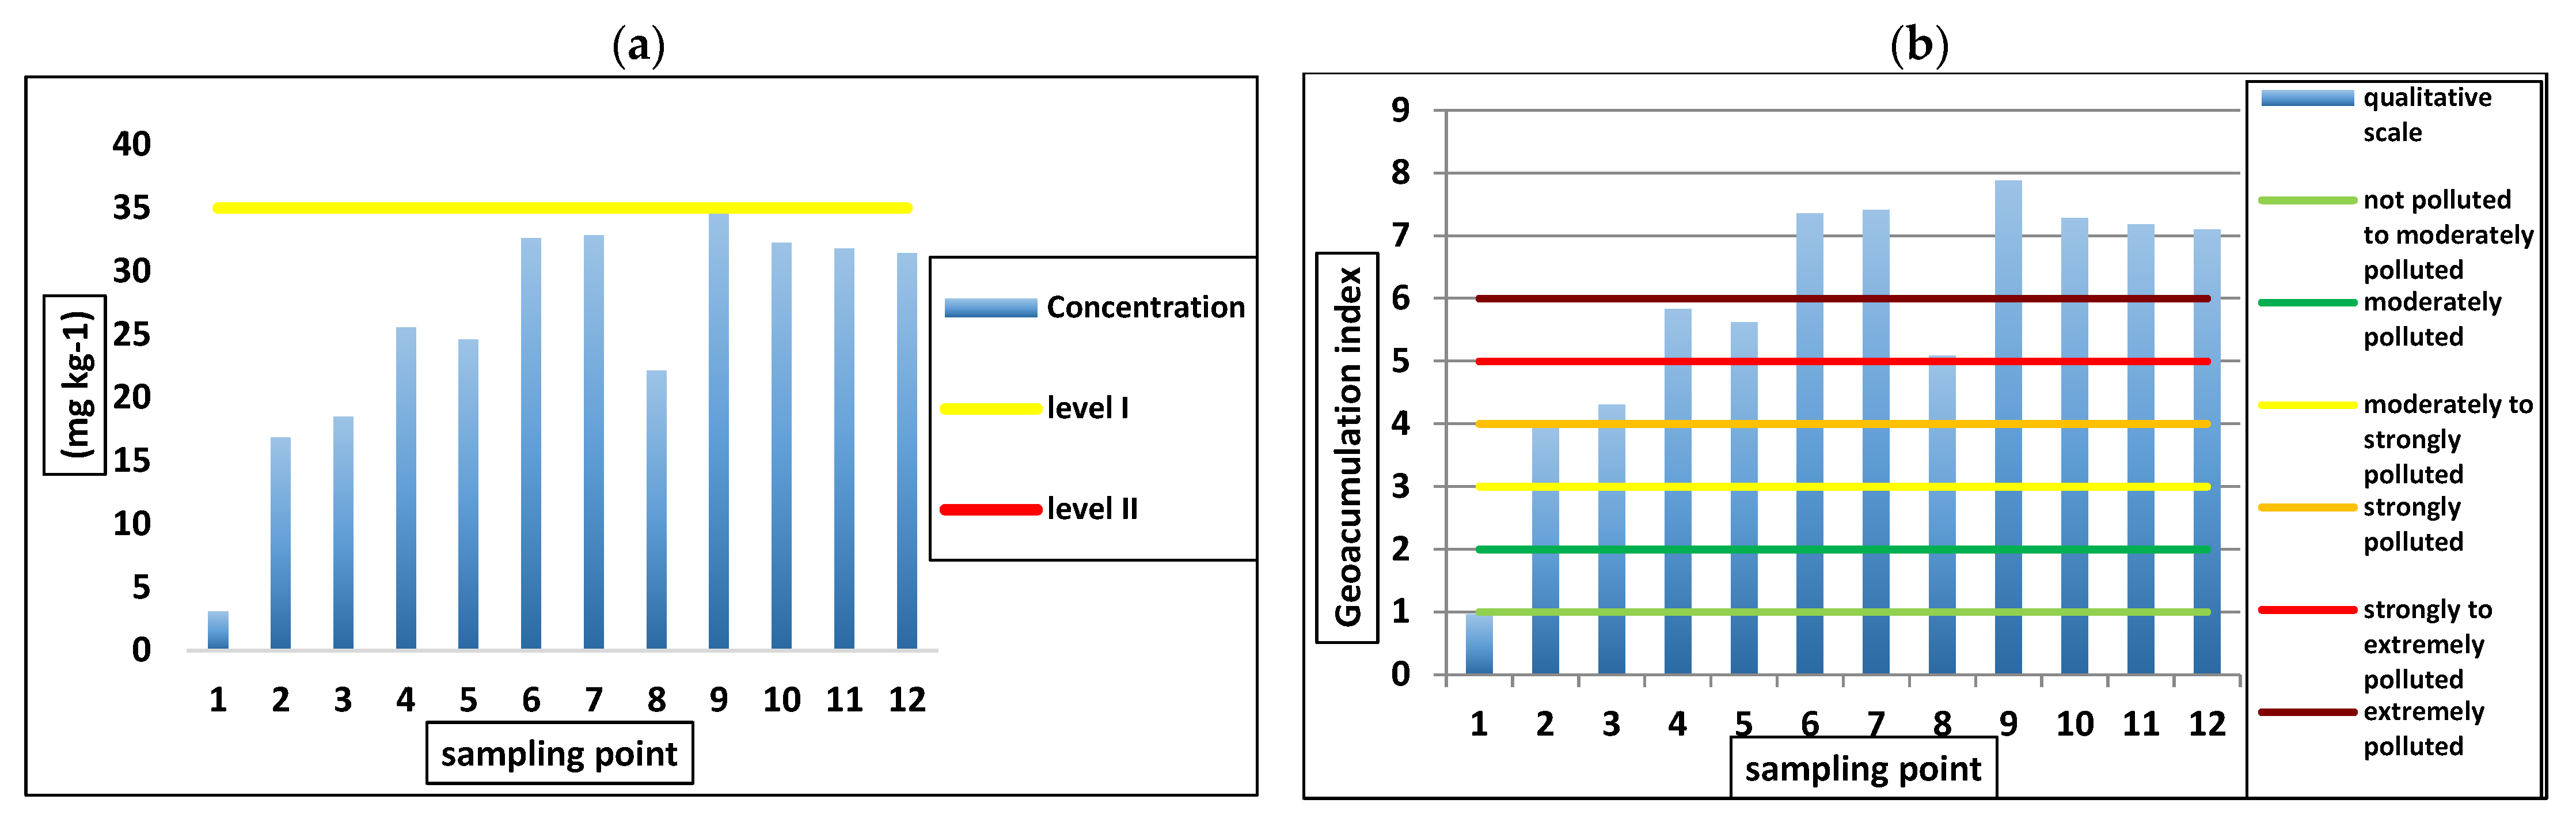
Figure 2 shows the Pb concentration (a) and geoaccumulation index (b) for the FRCHEPP water reservoir sediment samples.
The Pb concentration in the FRCHEPP water reservoir sediment samples was lower than that established by the CONAMA Resolution 454/2012 (35 mg kg−1), and this environmental site was classified as Level I for Pb [43]. Moreover, these samples were classified between the classes 1 to 6 according to the Igeo value. The lowest Pb concentration (point 1) was 3.080 mg kg−1, whereas the highest Pb concentration (point 9) was 35.02 mg kg−1. In this case, the Pb pollution level in the FRCHEPP water reservoir sediment samples was defined from not polluted to extremely polluted depending on the sampling point. The high sand content (97.0%) in the point 1 can be responsible for the lower Pb concentration as this sediment does not have the ability for adsorbing and pre-concentrating metals. Overall, there are lower influences of clays, hydroxides, oxides, humic acids, and colloids in the metal adsorption with higher sand contents. Higher silt, clay, and OM contents increase the cation adsorption capacity of sediments, whereas lower silt and clay contents decrease the cation adsorption capacity [44].
The Pb concentrations in the FRCHEPP water reservoir sediment samples were similar to those found for six water reservoirs (values ranging from 2.6 to 17.6 mg kg−1) in Poland [6]. High Pb concentrations found in the Rio do Peixe hydrographic basin were associated with the presence of industrial regions. This result was different from those determined in the FRCHEPP water reservoir sediment samples due to the absence of industrial district in the study direct influence area. As it is not common to find Pb in the basalts of the serra geral formation of the são bento group, and sandstones of the vale do rio do peixe formation of the bauru group (study direct influence area) [16], the Pb concentrations can have been originated from agricultural pesticides [45]. However, urban wastes could increase the Pb concentrations in hydrographic basins near urban areas [22]. According to the Igeo values, the sediments in the points 6, 7, 9, 10, 11, and 12 were classified as extremely polluted. The high metals concentration observed at these sampling sites were mainly associated to anthropogenic activities at the hydrographic basin and more specifically to livestock and agriculture activities. Moreover, lower watercourse speed and higher sediment residence time in these points favor the deposition of thinner particles in the bottom of the water reservoir, increasing the metal adsorption capacity. The pollution levels in the sampling points from 6 to 12 can also be associated to reservoir geometry facilitating the silt and clay deposition, and decreasing the suspended solid content. These pollution indices can cause harmful effects on humans such as cancer and neurological problems [46].
Figure 3 shows the Zn concentration (a) and geoaccumulation index (b) for the FRCHEPP water reservoir sediment samples.
The Zn concentration for nine sampling points was lower than 123 mg kg−1, inferring that these sediment samples are classified as Level I according to the CONAMA Resolution 454/2012. From Igeo values, the pollution levels were classified between the classes 1 to 4 (from not polluted to strongly polluted), being just the points 7 and 9 considered strongly polluted. These results were similar to those found in the Itá, Cogotí, Corrales, La Paloma, and Recoleta water reservoirs [47]. In these cases, the authors concluded that there were no values considered harmful for the environment in 9 sampling points. However, such studies also demonstrated concern as contaminated sediments could be harmful for the surface water and human health [48]. The highest Zn pollution levels in the FRCHEPP water reservoir sediment samples were noticed in the sampling points 7, 9, and 10 (degrees between 3 and 4), indicating possible contamination in the study direct influence area. Higher Zn concentrations in the sampling points 7, 9, and 10 (near the dam) were related with the deposition of silt, clay, OM, and humic acid in the bottom of the water reservoir due to lower water flow speed. This favored the Zn adsorption and increased its concentration in the sediment samples due to reservoir geometry as previously discussed for Pb analysis. As Zn is also not naturally found in the geological formation of the study area, its presence can be originated from agricultural activities [45].
Figure 4 shows the Ni concentration (a) and geoaccumulation index (b) for the FRCHEPP water reservoir sediment samples.
The Ni concentration in the sampling points 6 and 9 of the FRCHEPP water reservoir was higher than that established by the CONAMA resolution 454/2012 [43], being classified as Level II (values higher than 35.9 mg kg−1). The sampling points from 1 to 5, 7 to 8, and 10 to 12 were classified as Level I, inferring that there are lower possibilities of harmful effects on the biota in these situations. According to the Igeo values, most of study points were classified from moderately polluted to strongly polluted. However, the sampling point 9 was considered from strongly to extremely polluted, corroborating the Zn and Pb results. The highest Ni concentration was determined in the sampling point 9, which has pH 4.70, CEC 22.80 cmolc kg−1, OM content of 2.70%, sand content of 31.9% and silt plus clay content of 68.1%. The lowest Ni concentration was determined in the sampling point 1, with lower pH, CEC and silt plus clay content, confirming the occurrence of different interactions between Ni and sediment. The Ni concentration found in the study sampling points can be originated from weathering processes of basaltic rocks of the Serra Geral Formation [16]. Moreover, the agricultural activities in the Brazilian Cerrado contribute to the appearance of metals in soil due to the presence of metal sulfate in agricultural inputs. There is no information on mining activities with Ni in the study area when studying the Madeira River basin and fluvial systems of the Iron Quadrangle [36]. Possible Ni anthropological sources in hydrographic basin direct influence areas include urban and industrial wastes as described elsewhere [49,50,51]. In this sense, the high Ni concentration in the sampling point 2 could be associated to the discharge of urban wastes from the Itaguaçu city, in the state of Goiás, Brazil. The Ni pollution levels in this study worry as the intake of foods contaminated with this metal lead to harmful effects on the biota and human health [7,52].
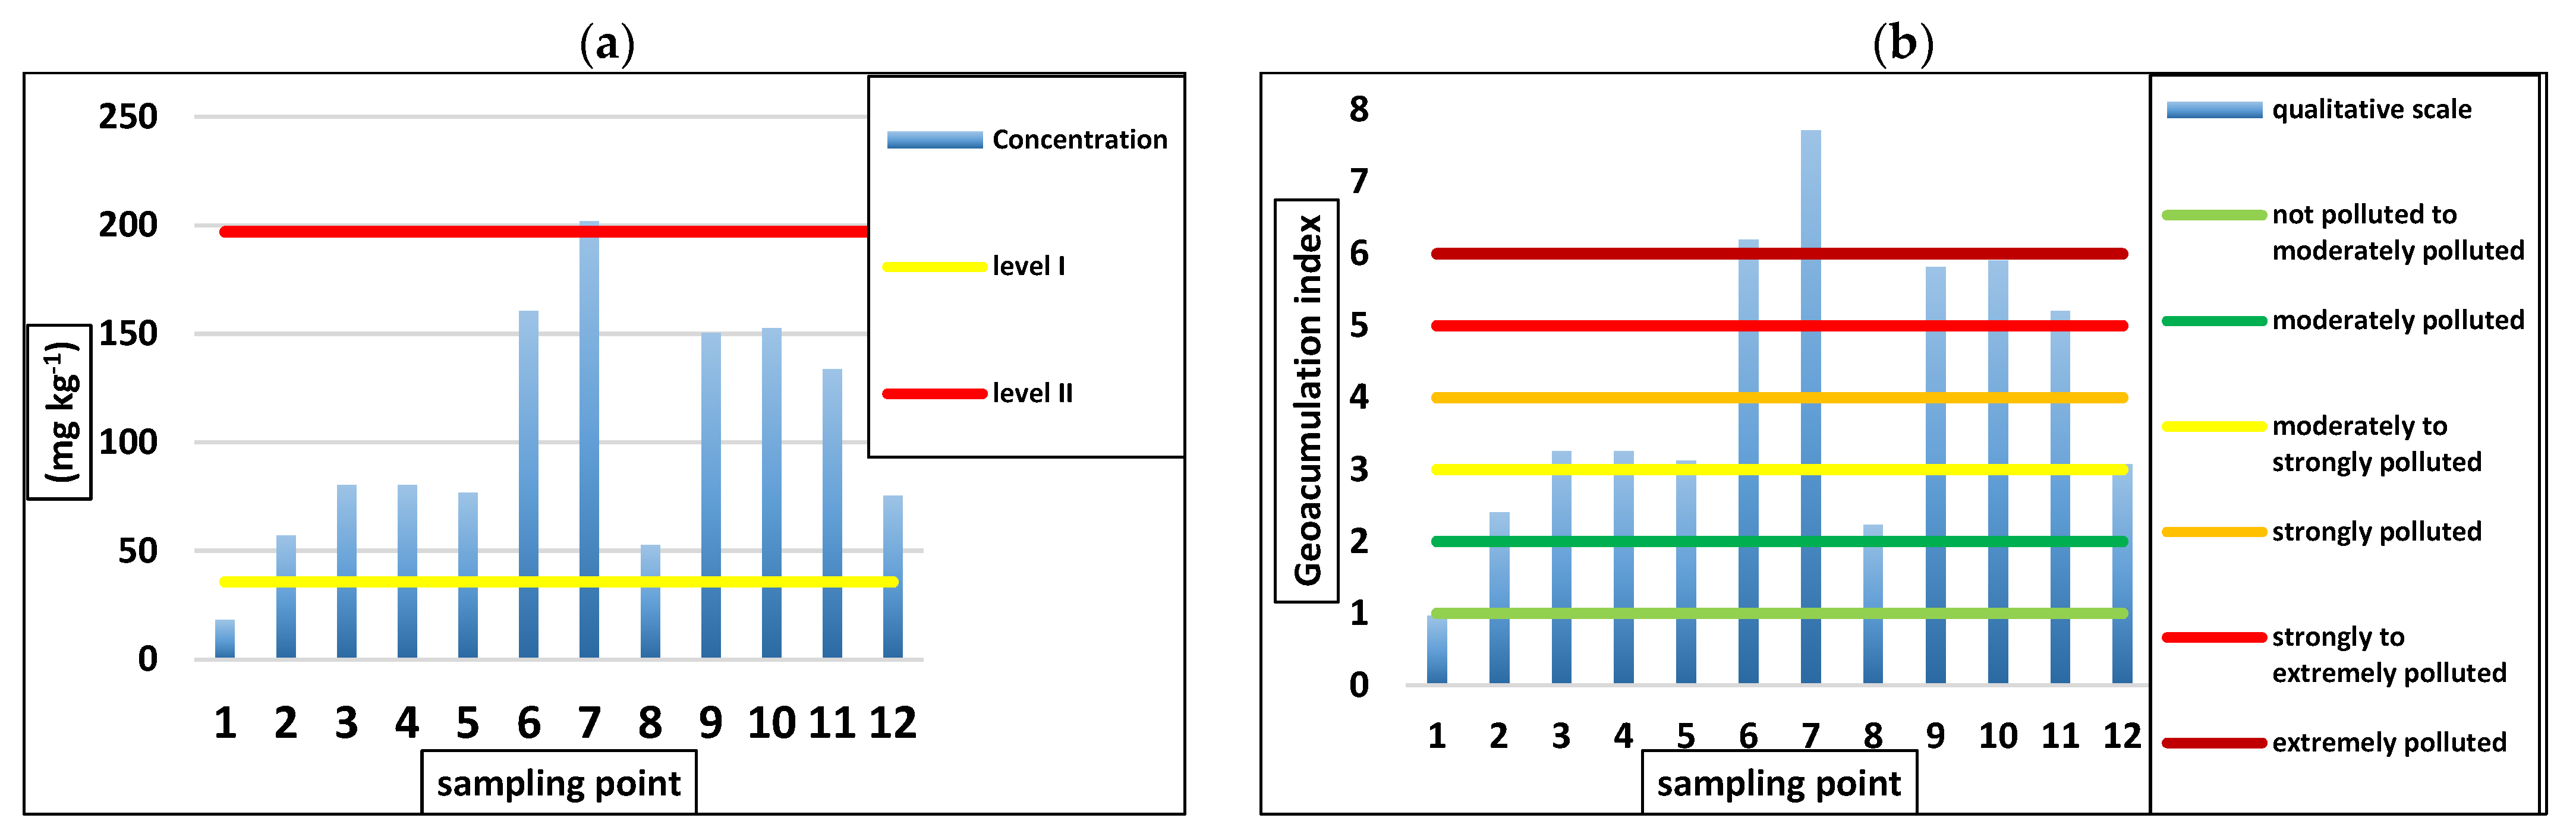
Figure 5 shows the Cu concentration (a) and geoaccumulation index (b) for the FRCHEPP water reservoir sediment samples.
The Cu concentration determined in the FRCHEPP water reservoir sediment samples ranged from approximately 20 to 205 mg kg−1. The sampling point 7 was classified as Level II (values higher than 197 mg kg−1), whereas the sampling points from 2 to 6, and 8 to 12 were classified as Level I (values higher than 35.7 mg kg−1). The sampling point 1 was considered not polluted (values lower than 35.7 mg kg−1) according to the CONAMA Resolution 454/2012 [43]. From geoaccumulation index values, the FRCHEPP water reservoir sediment samples were classified from not polluted to extremely polluted, depending on the sampling point. The highest Cu concentration was determined in the sampling point 7 due to the high CEC (21.30 cmolc kg−1) value, and high OM (6.89%) and silt plus clay (92.3%) contents [53]. Sediments having high OM, silt and clay contents adsorb high metal amounts due to the presence of active chemical groups in the material structure. This facilitates the transfer of pollutants from river water to solid matrices. The lowest Cu concentration was determined in the sampling point 1 due to the high sand content (97.0%). Moreover, acidic media (pH = 5.50) favor the carboxylic group protonation in the sediment structure, decreasing the cation adsorption capacity of the solid material. Suspended solids, high watercourse speed, and shallow soil depth decrease the metal concentrations in bottom sediment samples [54]. Generally, higher Cu concentrations are determined near to dam areas due to lower water flow speed when comparing with other reservoir sectors. In this case, longer sediment residence times in the water reservoirs facilitate the metal adsorption in the solid materials. Sometimes, high Cu concentrations in either water or sediment is the result of the metal bioavailability [19]. This species can appear in the environment due to the presence of CuSO4 used to control the phytoplankton (cyanobacteria) growth [55]. But, it is not a predominant factor in the FRCHEPP water reservoir area. However, the basalt soil mineralization could be a possible source of Cu origin in the study area [56]. Although Cu is essential for both plants and humans, high dosages in human organisms cause Wilson’s disease, intestinal and hepatic inflammation, hemolysis, and hyperglycemia [57,58]. On the contrary, Cu deficiency causes osteoporosis, white blood cell deficiency, and immune system problems [59,60].
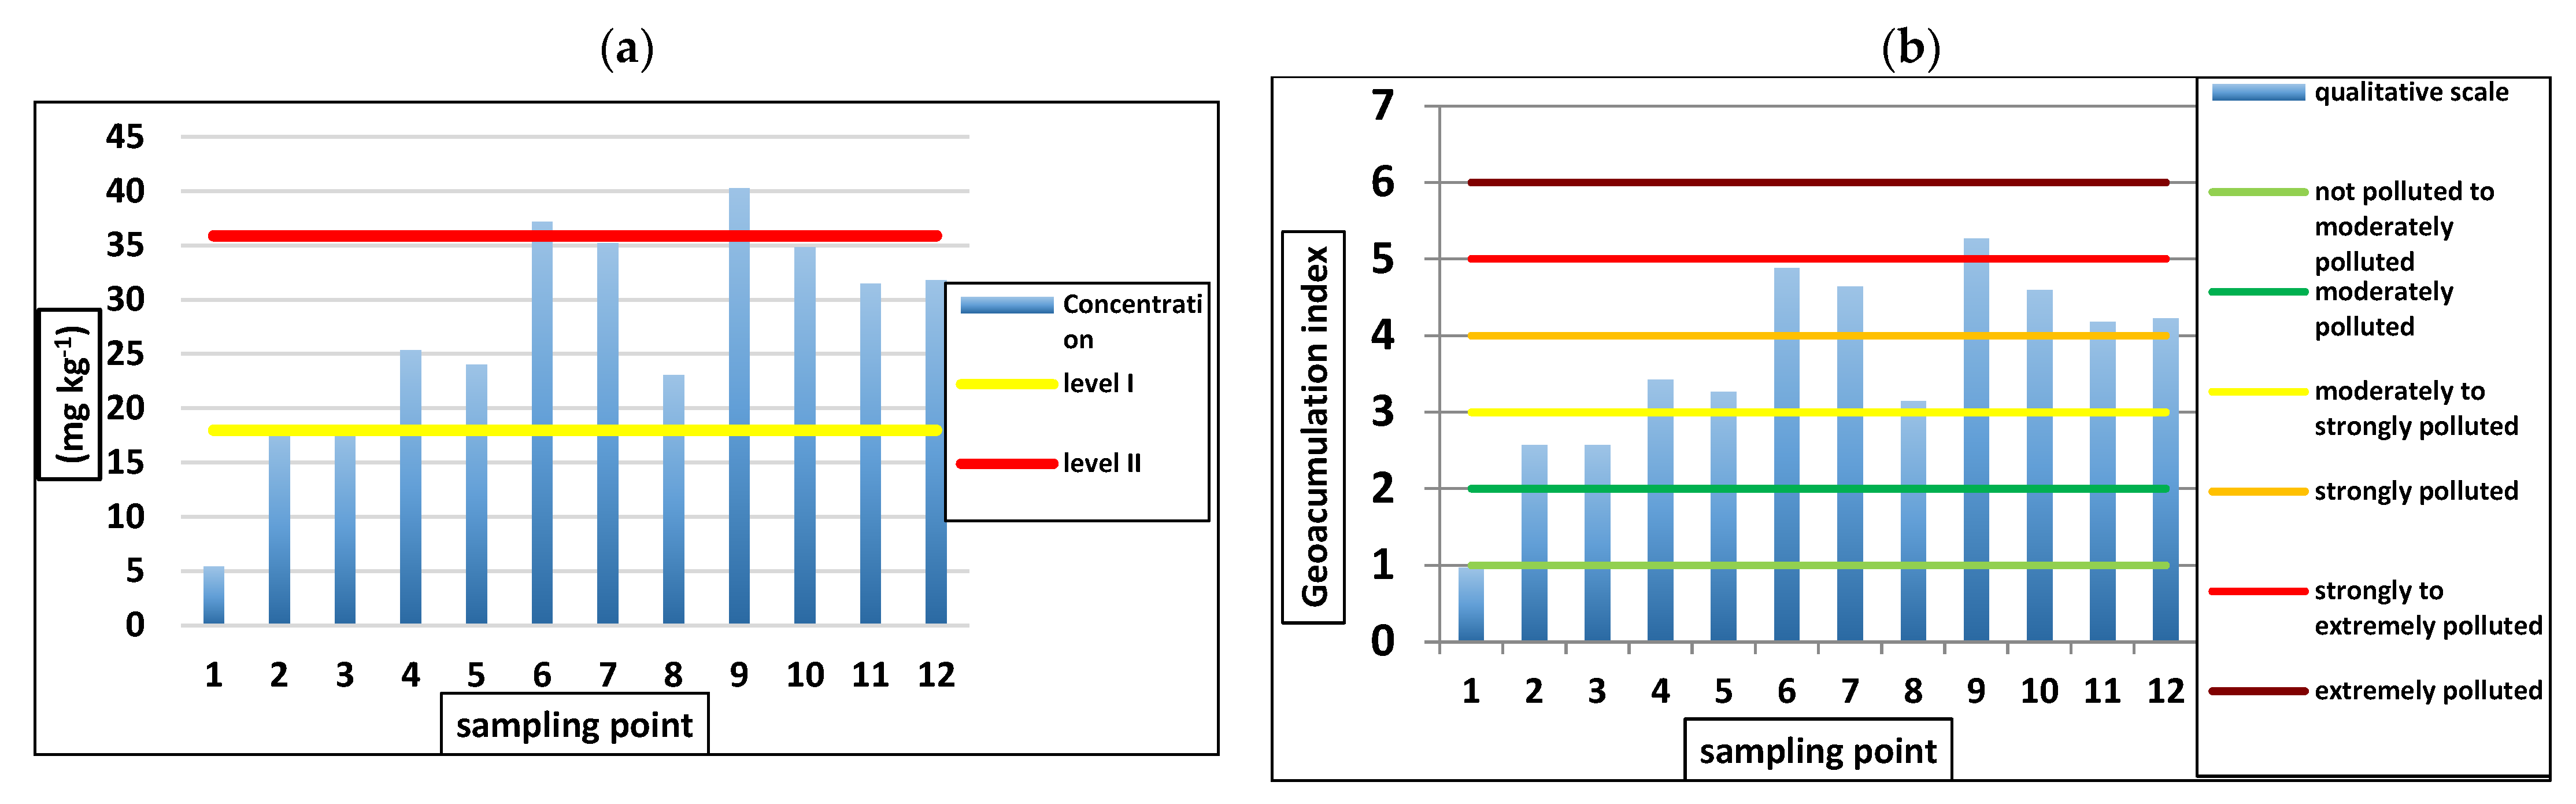
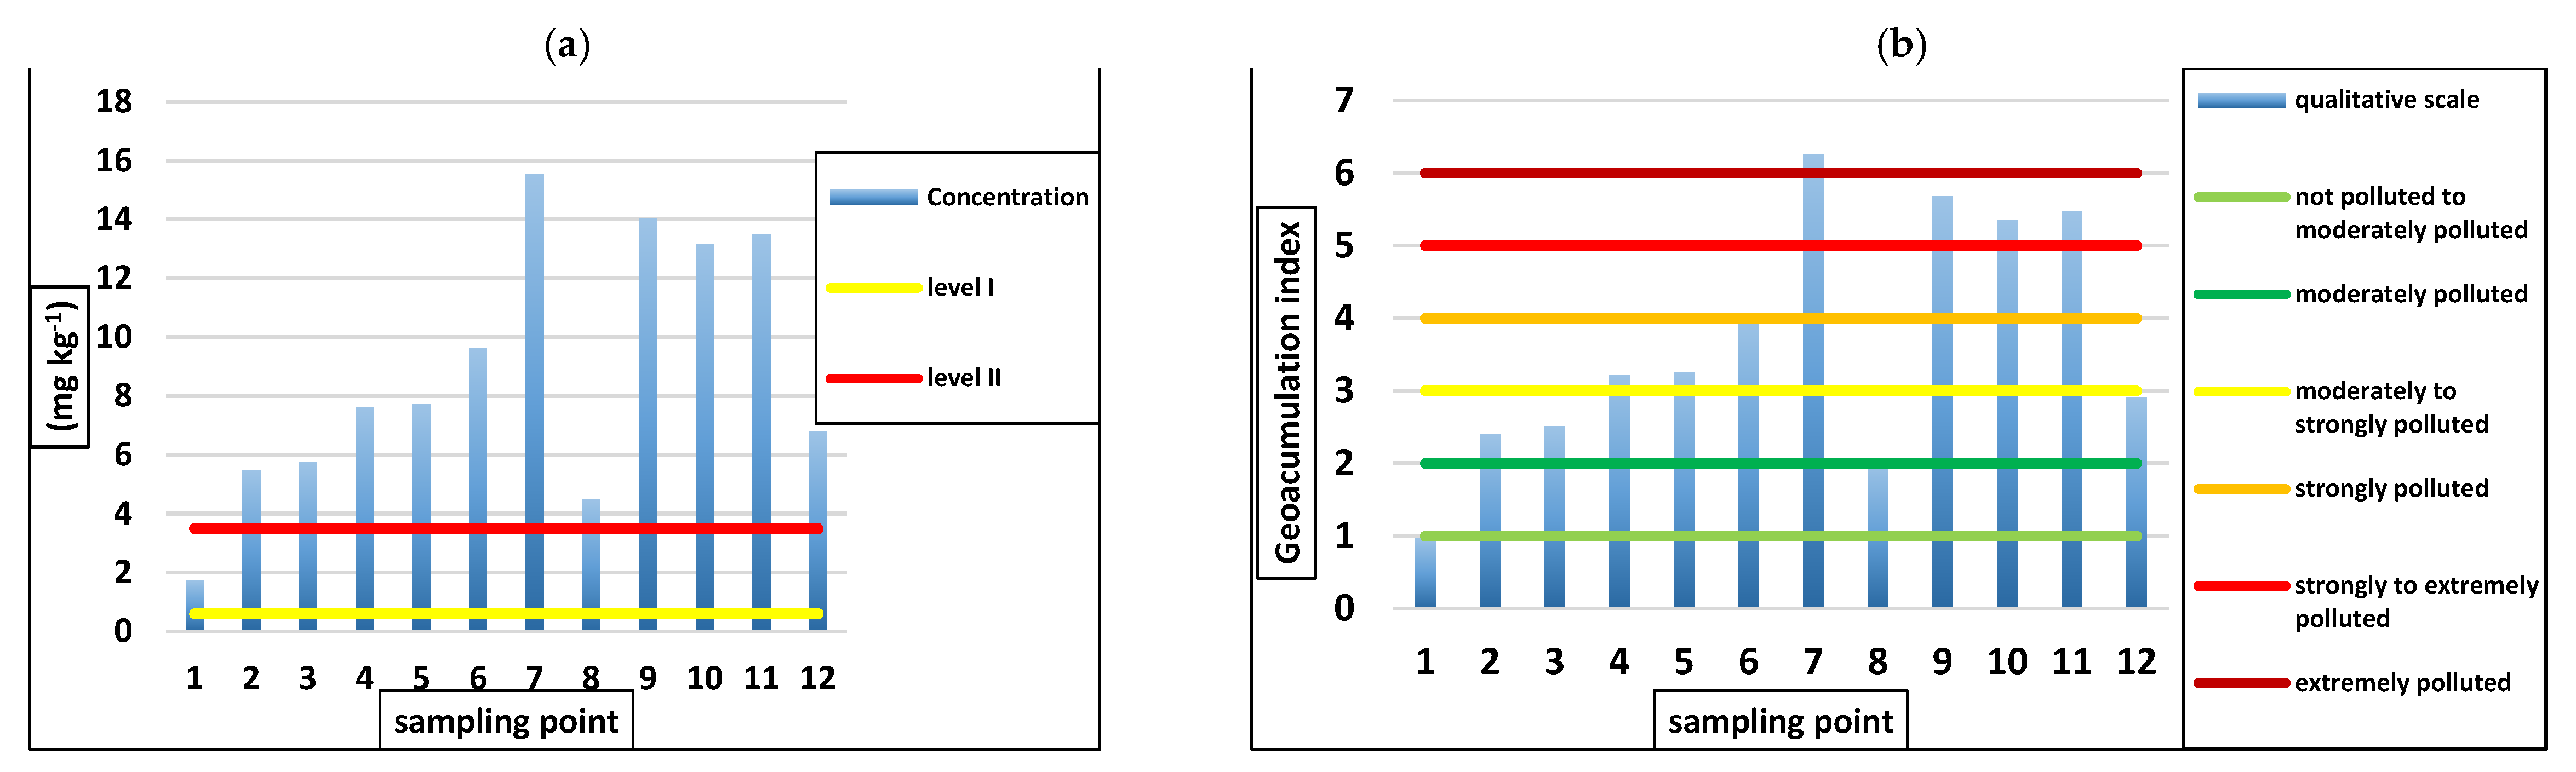
Figure 6 shows the Cd concentration (a) and geoaccumulation index (b) for the FRCHEPP water reservoir sediment samples.
The Cd concentration in the sampling points from 2 to 12 of the FRCHEPP water reservoir was higher than that value established by the CONAMA Resolution 454/2012, being classified as Level II (values higher than 3.5 mg kg−1) [43]. These Cd concentrations potentially cause harmful effects on the biota. From geoaccumulation index values, the sediment samples from 1 to 6, 8 and 12 were classified from not polluted to strongly polluted. Moreover, the sampling points 7, 9, 10, and 11 were classified from strongly to extremely polluted. The highest Cd concentration was determined in the sampling point 7, whereas the lowest Cd concentration was determined in the sampling point 1. Similar results were noticed for Zn and Cu in this work. This confirms that the reservoir geometry, water diffusion speed, and bottom sediment deposition influence the metal pollution indices in the FRCHEPP water reservoir. Higher Cd concentrations in the sampling point 7 can also be associated to the high CEC (21.30 cmolc kg−1) value, and OM (6.89%), silt plus clay (92.3%) contents. Similar results were determined in the Bonsucesso Lake located in the Rio Claro hydrographic basin in the state of Goiás, Brazil [61]. This basin is approximately 200 km from the FRCHEPP direct influence area. Moreover, studies in the Guarapiranga and Rio Grande reservoirs indicated that agropastoral anthropological activities are possible Cd pollution sources [3] as occurred in the FRCHEPP direct influence area. Cd pollution is commonly a result of either urban or rural activities in different countries [62,63]. Overall, the Cd concentrations determined in the FRCHEPP water reservoir sediments are potentially harmful to the environment. The Cd origin in the study area is mainly from anthropological sources due to the absence of Cd in the geological formation of the FRCHEPP water reservoir [64].
Correlations among physical and chemical variables determined in sediment samples were evaluated using the Pearson correlation coefficient (p < 0.02). Table 6 shows the correlation results for the study variables.
The correlations among Pb, Zn, Cu, and Cd with silt in the sediment samples were positive and weak, confirming that the increase in the silt content increases the metal adsorption capacity of the sediment samples. There is a stronger interaction tendency between Ni and silt due to positive moderate correlation. Positive correlations were also observed among metals and clay, with moderate intensities for Zn, Ni, Cu, and Cd. Significant positive correlations were recorded elsewhere for Hg and Pb at similar conditions [65]. The correlations among Pb, Zn, Ni, Cu, and Cd with sand were negative and moderate, indicating that the increase in the sand content decreases the metal accumulation capacity in the environment.
Strong correlations were noticed among CEC, Pb, and Ni, whereas moderate correlations were noticed among CEC, Zn, Cu, and Cd. Positive strong correlations were noticed with sand, and negative correlations with silt and clay. The clay content in sediment is crucial for metal adsorption due to the presence of active interaction groups in the solid material. It can be important to mitigate environmental impacts in hydrographic basins. Clays contained in tropical soils have mainly Fe and Al oxides for the occurrence of interactions with pollutants [66].
The correlations among metals, pH, and OM were not significant, as also described in other studied soils [67], due to probably lower metal concentrations extracted from sediment masses in strongly acidic medium. There were no significant correlations among Pb, Zn, Ni, Cu, and Cd, indicating the possible adsorption processes in oxyhydroxides [68]. Interactions among metals are normally affected by the atomic mass, ionic radius, and oxidation state of the chemical species [69]. The correlation coefficient values determined in the studies of the FRCHEPP water reservoir sediments were similar to those determined for surface sediments of the Awash River hydrographic Basin, Ethiopia [70]. High correlation coefficients for interactions among metals indicate the presence of similar contamination sources. Although these correlations do not necessarily point out a cause-effect relationship, they suggest a possible similar contamination source due to the use of agrochemicals in agropastoral activities [71].

4. Conclusions

The Foz do Rio Claro hydroelectric power plant water reservoir sediment samples were classified as Level I for Pb and Level II for Cd, according to CONAMA resolution 454/2012. Overall, lower metal concentrations were determined in sediments containing higher sand content, acidic pH, and lower OM content due to decreased metal adsorption capacity. On the contrary, higher metal concentrations were determined in sediments containing higher silt, clay, and OM contents, in addition to higher CEC values. According to Igeo classification, the Pb and Ni pollution levels in the Foz do Rio Claro hydroelectric power plant water reservoir sediments were classified from moderately polluted to strongly polluted. Moreover, the Zn and Cu pollution levels were classified from moderately to strongly polluted, and strongly to extremely polluted. Finally, the Cd pollution level was classified from not polluted to moderately polluted or strongly polluted. This demonstrates that further studies should be conducted to investigate the polluting-metal origin. Some high pollution levels recorded in the study sediments are indicatives of the need of sustainable management practices to ensure the environmental quality of the water reservoir direct influence area. The CEC values, and clay, silt, and sand contents indicated correlations varying from moderate and strong with Pb, Zn, Ni, Cu, and Cd. Mitigating practices such as restoration or remediation should be adopted to minimize the environmental liabilities, including sediment removal by dredging or remediation by using rhizofiltration techniques.

Author Contributions

Conceptualization, methodology and project administration, J.B.P.C.; validation, investigation and formal analysis, P.F.N.; writing-original draft preparation, V.A.B. and V.R.B.; supervision, writing—review and editing, visualization, A.T.P. All authors have read and agreed to the published version of the manuscript.

Funding

This research received no external funding.

Acknowledgments

J.B.P.C. thanks the Programa Nacional de Cooperação Acadêmica (PROCAD) da Cordenação de Aperfeiçoamento de Pessal de Nível Superior—CAPES/Brazil for financial support (Announcement 071/2013—Grant Number 88881.068465/2014-01). ATP thanks the Fundação de Amparo à Pesquisa e Inovação do Estado de Santa Catarina (FAPESC/Brazil) for financial support (Grant number: 2019/TR672) and Conselho Nacional de Desenvolvimento Científico e Tecnológico (CNPq/Brazil) for the research productivity scholarship (Grant number 312467/2019-2). This study was also financed in part by the CAPES/Brazil—Finance Code 001.

Conflicts of Interest

The authors declare no conflict of interest.

References

  1. Esteves, F.A. Fundamentos de Limnologia; Interciência: Rio de Janeiro, Brazil, 1998. [Google Scholar]
  2. CETESB. Relatório de Qualidade de Aguas Interiores no Estado de São Paulo; Governo do estado de São Paulo: São Paulo, Brazil, 2016. Available online: www.cetesb.sp.gov.br (accessed on 21 October 2020).
  3. Souza-Silva, L.; Ferreira, F.; Fávaro, D. Avaliação da concentração de metais tóxicos em amostras de sedimentos dos reservatórios do complexo Billings (Guarapiranga e Rio Grande). Geochim. Bras. 2017, 31, 37–56. [Google Scholar] [CrossRef]
  4. Abrid, D.; El Hmaidi, A.; Abdallaoui, A.; Essahlaoui, A.A. Study of Trace Metals in Surface Sediments of the Dam Reservoir Sidi Chahed (Meknes, Morocco). Int. J. Eng. Sci. 2014, 23–32. [Google Scholar]
  5. Dra, A.; El Gaidoumi, A.; Tanji, K.; Chaouni Benabdallah, A.; Taleb, A.; Kherbeche, A. Characterization and Quantification of Heavy Metals in Oued Sebou Sediments. Sci. World J. 2019, 2019, 1–9. [Google Scholar] [CrossRef] [PubMed] [Green Version]
  6. Sojka, M.; Jaskula, J.; Siepak, M. Heavy metals in bottom sediments of reservoirs in the lowland area of western Poland: Concentrations, distribution, sources and ecological risk. Water 2018, 11, 56. [Google Scholar] [CrossRef] [Green Version]
  7. Doria, H.B.; Voigt, C.L.; De Campos, S.X.; Randi, M.A.F. Metal pollution assessment in a Brazilian hydroelectric reservoir: Geophagus brasiliensis as a suitable bioindicator organism. Ambiente Água Interdiscip. J. Appl. Sci. 2017, 12, 575. [Google Scholar] [CrossRef]
  8. Papadopoulou-Vrynioti, K.; Alexakis, D.; Bathrellos, G.D.; Skilodimou, H.D.; Vryniotis, D.; Vassiliades, E.; Gamvroula, D. Distribution of trace elements in stream sediments of Arta plain (western Hellas): The influence of geomorphological parameters. J. Geochem. Explor. 2013, 134, 17–26. [Google Scholar] [CrossRef]
  9. Alexakis, D.; Gamvroula, D.; Theofili, E. Environmental availability of potentially toxic elements in an agricultural Mediterranean site. Environ. Eng. Geosci. 2019, 25, 169–178. [Google Scholar] [CrossRef]
  10. Cesar, R.; Colonese, J.; Silva, M.; Egler, S.; Bidone, E.; Castilhos, Z.; Polivanov, H. Distribuição de mercúrio, cobre, chumbo, zinco e níquel em sedimentos de corrente da bacia do Rio Piabanha, Estado do Rio de Janeiro. Geochim. Bras. 2011, 25, 35–45. [Google Scholar]
  11. Paulino, A.T.; Tessari, J.A.; Nogami, E.M.; Lenzi, E.; Nozaki, J. Lipid increase induced by lead accumulation in tilapia Oreochromis niloticus. Bull. Environ. Contam. Toxicol. 2005, 75, 42–49. [Google Scholar] [CrossRef]
  12. Wolf, M.; Paulino, A.T. Phytotoxicity Increase Induced by Zinc Accumulation in Cichorium intybus. Bull. Environ. Contam. Toxicol. 2020, 105, 405–410. [Google Scholar] [CrossRef]
  13. Gamvroula, D.; Alexakis, D.; Stamatis, G. Diagnosis of groundwater quality and assessment of contamination sources in the Megara basin (Attica, Greece). Arab. J. Geosci. 2013, 6, 2367–2381. [Google Scholar] [CrossRef]
  14. Franz, C.; Makeschin, F.; Weiß, H.; Lorz, C. Geochemical signature and properties of sediment sources and alluvial sediments within the Lago Paranoá catchment, Brasilia DF: A study on anthropogenic introduced chemical elements in an urban river basin. Sci. Total Environ. 2013, 452–453, 411–420. [Google Scholar] [CrossRef]
  15. Barbosa da Silva Costa, J.M.; De Lima Silva, V.; Samico, I.C.; Cesse, E.Â.P. Desempenho de intervenções de saúde em países da América Latina: Uma revisão sistemática. Saúde em Debate 2015, 39, 307–319. [Google Scholar] [CrossRef] [Green Version]
  16. De Carvalho Braga, C.; Cabral, J.B.P.; Lopes, S.M.F.; Oliveira, S.F.; Rocha, I.R. Da Qualidade dos sedimentos em relação à presença de metais pesados no reservatório da usina hidrelétrica de Caçu–GO. Rev. Bras. Geogr. Física 2018. [Google Scholar] [CrossRef]
  17. Islam, M.S.; Ahmed, M.K.; AL-Mamun, M.H.; Islam, S.M.A. Sources and Ecological Risks of Heavy Metals in Soils Under Different Land Uses in Bangladesh. Pedosphere 2019. [Google Scholar] [CrossRef]
  18. Filgueiras, R.A.; Silva, A.X.; Ribeiro, F.C.A.; Lauria, D.C.; Viglio, E.P. Baseline, mapping and dose estimation of natural radioactivity in soils of the Brazilian state of Alagoas. Radiat. Phys. Chem. 2020, 167, 108332. [Google Scholar] [CrossRef]
  19. Pompêo, M.; Padial, P.R.; Mariani, C.F.; Cardoso-Silva, S.; Moschini-Carlos, V.; Da Silva, D.C.V.R.; de Paiva, T.C.B.; Brandimarte, A.L. Ecological risk index for aquatic pollution control: A case study of coastal water bodies from the Rio de Janeiro State, southeastern Brazi. Geochim. Bras. 2013, 27, 104–119. [Google Scholar] [CrossRef]
  20. Frascareli, D.; Cardoso-Silva, S.; De Oliveira Soares-Silva Mizael, J.; Rosa, A.H.; Pompêo, M.L.M.; López-Doval, J.C.; Moschini-Carlos, V. Spatial distribution, bioavailability, and toxicity of metals in surface sediments of tropical reservoirs, Brazil. Environ. Monit. Assess. 2018. [Google Scholar] [CrossRef] [PubMed] [Green Version]
  21. Iqbal, J.; Saleem, M.; Shah, M.H. Spatial distribution, environmental assessment and source identification of metals content in surface sediments of freshwater reservoir, Pakistan. Chemie Erde 2016, 76, 171–177. [Google Scholar] [CrossRef]
  22. Belo, A.; Quináia, S.P.; Pletsch, A.L. Avaliação da contaminação de metais em sedimentos superficiais das praias do lago de Itaipu. Quim. Nova 2010, 33, 613–617. [Google Scholar] [CrossRef] [Green Version]
  23. Yamamoto, F.Y.; Pereira, M.V.M.; Lottermann, E.; Santos, G.S.; Stremel, T.R.O.; Doria, H.B.; Gusso-Choueri, P.; Campos, S.X.; Ortolani-Machado, C.F.; Cestari, M.M.; et al. Bioavailability of pollutants sets risk of exposure to biota and human population in reservoirs from Iguaçu River (Southern Brazil). Environ. Sci. Pollut. Res. 2016, 23, 18111–18128. [Google Scholar] [CrossRef] [PubMed]
  24. Wang, J.; Du, J.; Bi, Q. Natural radioactivity assessment of surface sediments in the Yangtze Estuary. Mar. Pollut. Bull. 2017, 114, 602–608. [Google Scholar] [CrossRef] [PubMed]
  25. Frohlich, M.F.; Naspolini, B.F.; Volchan Jr, I. A evolução do processo de avaliação e gerenciamento de material relacionado às atividades de dragagem no Brasil: Uma análise comparativa entre as Resoluções CONAMA n° 344/04 e n° 454/12. Eng. Sanit. Ambient. 2015, 20, 131–140. [Google Scholar] [CrossRef] [Green Version]
  26. Muller, G. Index of geoaccumulation in sediments of the Rhine River. Geol. J. 1969, 2, 108–118. [Google Scholar]
  27. Franklin, R.L.; Fávaro, D.I.T.; Damatto, S.R. Trace metal and rare earth elements in a sediment profile from the Rio Grande Reservoir, São Paulo, Brazil: Determination of anthropogenic contamination, dating, and sedimentation rates. J. Radioanal. Nucl. Chem. 2016, 307, 99–110. [Google Scholar] [CrossRef]
  28. Kaewtubtim, P.; Meeinkuirt, W.; Seepom, S.; Pichtel, J. Occurrence of heavy metals and radionuclides in sediments and seawater in mangrove ecosystems in Pattani Bay, Thailand. Environ. Sci. Pollut. Res. Int. 2017, 24, 7630–7639. [Google Scholar] [CrossRef]
  29. Vareda, J.P.; Valente, A.J.M.; Durães, L. Assessment of heavy metal pollution from anthropogenic activities and remediation strategies: A review. J. Environ. Manag. 2019, 246, 101–118. [Google Scholar] [CrossRef]
  30. Shui, L.; Pan, X.; Chen, X.; Chang, F.; Wan, D.; Liu, D.; Hu, M.; Li, S.; Wang, Y. Pollution Characteristics and Ecological Risk Assessment of Heavy Metals in Sediments of the Three Gorges Reservoir. Water 2020, 12, 1798. [Google Scholar] [CrossRef]
  31. Alexakis, D. Diagnosis of stream sediment quality and assessment of toxic element contamination sources in East Attica, Greece. Environ. Earth Sci. 2011, 63, 1369–1383. [Google Scholar] [CrossRef]
  32. SIEG Sistema Estadual de Estatísticas Informações Geografias de Goiás. Available online: www2.sieg.go.gov.br (accessed on 1 October 2020).
  33. Junior, V.S.Q.; Cabral, J.B.P.; Da Rocha, I.R.; De Barcelos, A.A. Uso de geotecnologias na caracterização da fragilidade ambiental da Bacia da UHE Foz do Rio Claro (GO). GeoFocus. Rev. Int. Cienc. Tecnol. Inf. Geográfica 2015, 193–212. [Google Scholar]
  34. Filizola, H.F.; Gomes, M.A.F.; Souza, M.D. Manual de Procedimentos de Coleta de Amostras em Áreas Agricolas para Análise da Qualidade Ambiental: Solo, Água e Sedimentos; Embrapa: Brasilia, Brazil, 2006; ISBN 8585771437. [Google Scholar]
  35. USEPA SW-846 Method 3051A–Microwave Assisted Acid Digestion of Sediments, Sludges, Soils, and Oils 2007, 30. Available online: www.epa.gov/sites/production/files/2015-12/documents/3051a.pdf. (accessed on 21 November 2020.).
  36. Do Nascimento, L.P.; Reis, D.A.; Roeser, H.M.P.; Da Santiago, A.F. Avaliação geoquímica de metais em sistemas fluviais afetados por atividades antrópicas no Quadrilátero Ferrífero. Eng. Sanitária Ambient. 2018, 23, 767–778. [Google Scholar] [CrossRef] [Green Version]
  37. Santos, C. Estatística Descritiva: Manual de Auto-Aprendizagem, 3rd ed.; Edições Sílabo: Lisbon, Portugal, 2018; ISBN 9789726189688. [Google Scholar]
  38. EMBRAPA. Sistema Brasileiro de Classificação de Solos, 5th ed.; EMBRAPA: Brasília, Brazil, 2018. [Google Scholar]
  39. Mohamad, S.; Rodrigues, A.; Martins, A.; Braz, D.S.; José, A.; Pedroso, S. Chemie der Erde Available contents of potentially toxic elements in soils from the Eastern Amazon. Chem. Erde Geochem. 2015, 75, 143–151. [Google Scholar] [CrossRef]
  40. Manejo, U.S.O.E.; Aurélio, M.; Carneiro, C.; De Souza, E.D.; Fialho, E.; Pereira, H.S. Solo De Cerrado Sob Diferentes Sistemas De. Rev. Bras. Cienc. Solo 2009, 33, 147–157. [Google Scholar]
  41. Bakatula, E.N.; Richard, D.; Neculita, C.M.; Zagury, G.J. Determination of point of zero charge of natural organic materials. Environ. Sci. Pollut. Res. 2018. [Google Scholar] [CrossRef] [PubMed]
  42. Huang, L.; Fang, H.; Ni, K.; Yang, W.; Zhao, W.; He, G.; Han, Y.; Li, X. Distribution and Potential Risk of Heavy Metals in Sediments of the Three Gorges Reservoir: The Relationship to Environmental Variables. Water 2018, 10, 1840. [Google Scholar] [CrossRef] [Green Version]
  43. CONAMA. Resolução No 454 de 01 de Novembro de 2012; Ministério do Meio Ambiente: Brasília, Brazil, 2012.
  44. Gomes, M.V.T.; Costa, A.S.; Garcia, C.A.B.; Passos, E.A.; do Patrocínio Hora Alves, J. Concentrações e associações geoquímicas de Pb e Zn em sedimentos do rio São Francisco impactados por rejeitos da produção industrial de zinco. Quim. Nova 2010, 33, 2088–2092. [Google Scholar] [CrossRef] [Green Version]
  45. De Lara, S.S.; Leopoldina, M.; Correa, M.; Barbosa, J.R.; Henrique, L. Spatial distribution of pesticide use in Brazil: A strategy for Health Surveillance. Cienc. Saude Coletiva 2017, 3281–3294. [Google Scholar] [CrossRef]
  46. Fu, F.; Wang, Q. Removal of heavy metal ions from wastewaters: A review. J. Environ. Manag. 2011, 92, 407–418. [Google Scholar] [CrossRef]
  47. Da Silva, F.L.; Moitas, M.L.; Bianchini, I.; Cunha-Santino, M.B. Qualidade dos sedimentos do rio Monjolinho: Índice de geoacumulação. Rev. Ciência Tecnol. Ambient 2016, 4, 79–87. [Google Scholar] [CrossRef]
  48. Dąbrowska, L. Chemical Forms of Heavy Metals in Bottom Sediments of the Mitręga Reservoir. Civ. Environ. Eng. Rep. 2016, 21, 15–26. [Google Scholar] [CrossRef] [Green Version]
  49. An, Y.-J.; Kampbell, D.H. Total, dissolved, and bioavailable metals at Lake Texoma marinas. Environ. Pollut. 2003, 122, 253–259. [Google Scholar] [CrossRef]
  50. De Oliveira, G.M.T.S.; De Oliveira, E.S.; de Souza Santos, M.L.; de Melo, N.F.A.C.; Krag, M.N. Concentrações de metais pesados nos sedimentos do lago Água Preta (Pará, Brasil). Eng. Sanitária Ambient. 2018, 23, 599–605. [Google Scholar] [CrossRef] [Green Version]
  51. Françozo, M.O.; Oliveira, T.M.N.; Ressel, K. Análise Da Presença De Metais Pesados E Sua Toxicidade Nos Sedimentos Do Rio Cachoeira–Joinville/SC Analysis of the Presence of Heavy Metals and Their Toxicity in Cachoeira River ’ S–Joinville/Sc. In Proceedings of the IX Simpósio Internacional de Qualidade Ambiental, Energia e Ambiente, Joinville, Brazil, 19–21 May 2014; pp. 1–15. [Google Scholar]
  52. CETESB. Relatório de Qualidade de Aguas Interiores no Estado de São Paulo; Governo do Estado de Sao Paulo: Sao Paulo, Brazil, 2005. Available online: www.cetesb.sp.gov.br (accessed on 21 October 2020).
  53. Campbell, P.G.C.; Lewis, A.G.; Chapman, P.M.; Crowder, A.A.; Fletcher, W.K.; Imber, B.; Luoma, S.N.; Stokes, P.M.; Winfrey, M. Biologically Available Metals in Sediments; Publications NRCC/CNRC: Ottawa, Canada, 1988. [Google Scholar]
  54. Nogueira, P.F.; Pereira Cabral, J.B.; Oliveira, S.F.; Rocha, I.R. Da Eutrofização no reservatório da UHE foz do rio claro (GO). Geogr. Dep. Univ. Sao Paulo 2015. [Google Scholar] [CrossRef] [Green Version]
  55. Shabbir, Z.; Sardar, A.; Shabbir, A.; Abbas, G.; Shamshad, S.; Khalid, S.; Murtaza, N.G.; Dumat, C.; Shahid, M. Copper uptake, essentiality, toxicity, detoxification and risk assessment in soil-plant environment. Chemosphere 2020, 259, 127436. [Google Scholar] [CrossRef]
  56. Kettanah, Y.A. Copper mineralization and alterations in Gercus Basalt within the Gercus. Ore Geol. Rev. 2019, 111, 102974. [Google Scholar] [CrossRef]
  57. Winter, M. Web-Elements. Available online: www.webelements.com. (accessed on 20 December 2020).
  58. Pavelhao, T.R. Valores Orientadores De Qualidade Para Metais Pesados Em Solos Cultivados No Município De Bandeirantes–PR; Maringá State University: Maringa, Brazil, 2015. [Google Scholar]
  59. CPRM Geologia e Saúde. Available online: www.cprm.gov.br. (accessed on 5 January 2021).
  60. Trindade, W.M.; Horn, A.H.; Ribeiro, E.V. Concentrações de metais pesados em sedimentos do rio são francisco entre três marias e Pirapora-MG: Geoquímica e classificação de risco ambiental. Geonomos 2012. [Google Scholar] [CrossRef] [Green Version]
  61. Martins, R.O.; Hoff Brait, C.H.; Santos, F.F. Dos Avaliação do teor de metais pesados e de parâmetros físico-químicos da água e sedimento do lago bonsucesso, Jataí–GO. Geoambiente On-Line 2018. [Google Scholar] [CrossRef] [Green Version]
  62. Zhu, L.; Liu, J.; Xu, S.; Xie, Z. Deposition behavior, risk assessment and source identification of heavy metals in reservoir sediments of Northeast China. Ecotoxicol. Environ. Saf. 2017, 142, 454–463. [Google Scholar] [CrossRef]
  63. Xu, J.; Chen, Y.; Zheng, L.; Liu, B.; Liu, J.; Wang, X. Assessment of Heavy Metal Pollution in the Sediment of the Main Tributaries of Dongting Lake, China. Water 2018, 10, 1060. [Google Scholar] [CrossRef] [Green Version]
  64. Stradioto, M.R.; Caetano-chang, M.R. Geociências Caracterização petrográfica e aspectos diagenéticos dos arenitos do Grupo Bauru na região sudoeste do Estado de São Paulo. Rem. Rev. Esc. Minas 2008, 61, 433–441. [Google Scholar] [CrossRef]
  65. Zhou, Z.; Wang, Y.; Teng, H.; Yang, H.; Liu, A.; Li, M.; Niu, X. Historical Evolution of Sources and Pollution Levels of Heavy Metals in the Sediment of the Shuanglong Reservoir, China. Water 2020, 12, 1855. [Google Scholar] [CrossRef]
  66. Alleoni, L.R.F.; Borba, R.P.; De Camargo, O.A. Heavy metals: From cosmogony to Brazilian soils. In Tópicos em Ciência do Solo; Torrado-Vidal, P., Alleoni, L.R.F., Cooper, M., Silva, A.P., Eds.; Sociedade Brasileira de Ciência do Solo: Viçosa, Brazil, 2005; pp. 1–42. [Google Scholar]
  67. De Sa Paye, H.; Vargas de Mello, J.W.; Bezzera de Melo, S. Métodos de análise multivariada no estabelecimento de valores de referência de qualidade para elementos-traço em solos. Rev. Bras. Ciência Solo 2012, 36, 1031–1042. [Google Scholar] [CrossRef] [Green Version]
  68. Yan, C.Z.; Li, Q.Z.; Zhang, X.; Li, G.X. Mobility and ecological risk assessment of heavy metals in surface sediments of Xiamen Bay and its adjacent areas, China. Environ. Earth Sci. 2010, 60, 1469–1479. [Google Scholar] [CrossRef]
  69. Marques, J.J.; Schulze, D.G.; Curi, N.; Mertzman, S.A. Trace element geochemistry in Brazilian Cerrado soils. Geoderma 2004, 121, 31–43. [Google Scholar] [CrossRef]
  70. Dirbaba, N.; Yan, X.; Wu, H.; Colebrooke, L.; Wang, J. Occurrences and Ecotoxicological Risk Assessment of Heavy Metals in Surface Sediments from Awash River Basin, Ethiopia. Water 2018, 10, 535. [Google Scholar] [CrossRef] [Green Version]
  71. Alexakis, D.; Gotsis, D.; Giakoumakis, S. Evaluation of Soil Salinization in a Mediterranean Site Agoulinitsa District–West Greece; Springer: Berlin/Heidelberg, Germany, 2015; pp. 1373–1383. [Google Scholar] [CrossRef]
Figure 1. Study area maps.
Water 13 01044 g001
Figure 2. Pb concentration (a) and geoaccumulation index (b) for the FRCHEPP water reservoir sediment samples.
Water 13 01044 g002
Figure 3. Zn concentration (a) and geoaccumulation index (b) for the FRCHEPP water reservoir sediment samples.
Water 13 01044 g003
Figure 4. Ni concentration (a) and geoaccumulation index (b) for the FRCHEPP water reservoir sediment samples.
Water 13 01044 g004
Figure 5. Cu concentration (a) and geoaccumulation index (b) for the FRCHEPP water reservoir sediment samples.
Water 13 01044 g005
Figure 6. Cd concentration (a) and geoaccumulation index (b) for the FRCHEPP water reservoir sediment samples.
Water 13 01044 g006
Table 1. Elements concentration established by the CONAMA Resolution n° 454/2012 for Level I and II.
Classification LevelNiCdPbCuZn
Level I (mg kg−1)18.00.635.035.7123.0
Level II (mg kg−1)35.93.591.3197.0315.0
Table 2. Classification parameters for the sediment sample quality according to the geoaccumulation index (Igeo).
Description of the Sediment QualityClassification IgeoIgeo Value
Extremely polluted6Igeo > 5
Strongly to extremely polluted54 < Igeo < 5
Strongly polluted43 < Igeo < 4
Moderately to strongly polluted32 < Igeo < 3
Moderately polluted21 < Igeo < 2
Not polluted to moderately polluted10 < Igeo < 1
Practically not polluted0Igeo ≤ 0
Table 3. Background values used for Igeo calculations in the sediment samples.
Background ValuesNiCdPbCuZn
5.411.743.0818.1526.38
Table 4. Linear correlation coefficient intervals for explaining the association and interference degree among the study variables.
Correlation CoefficientCorrelation
r = 1Perfect positive
0.7 ≤ r < 0.9Strong positive
0.4 ≤ r < 0.7Moderate positive
0.1 ≤ r < 0.4Weak positive
0Null
−0.4 < r ≤ −0.1Weak negative
−0.7 < r ≤ −0.4Moderate negative
−1 < r ≤ −0.7Strong negative
r = −1Perfect negative
Table 5. pH values, cation exchange capacities (CEC: cmolc kg−1), organic matter (OM: %), clay (%), silt (%), and sand (%) contents, and metal concentrations (mg kg−1) in the FRCHEPP water reservoir sediment samples.
PointsPbZnNiCuCdpHCECOMClaySiltSand
13.08026.385.41018.151.7415.502.4002.280.792.2097.0
216.8671.6718.4157.245.4704.6017.406.8545.044.210.8
318.4959.5218.3980.395.7624.5013.307.0315.075.39.70
425.5759.4925.3780.327.6214.5021.404.5536.039.324.7
524.5856.4324.0476.887.7204.5024.004.9013.080.07.00
632.60122.037.18160.59.6304.8020.203.2524.065.610.4
732.86159.635.23201.915.534.6021.306.8938.054.37.70
822.1348.9623.0552.674.4904.5015.908.0213.058.628.4
935.02137.840.30150.314.044.7022.802.7038.030.131.9
1032.27132.334.86152.713.184.7019.402.3114.061.924.1
1131.79119.331.49133.613.494.6019.9010.533.044.222.8
1231.4263.3331.8275.546.8014.6016.301.557.0042.450.6
Table 6. Correlation results for the study variables.
PbZnNiCu CdpH CECOMClaySiltSand
Pb1000
Zn0.785 *1000
Ni0.982 *0.839 *1000
Cu 0.820 *0.971 *0.858 *1000
Cd0.841 *0.951 *0.853 *0.938 *1000
pH −0.566−0.202−0.451−0.260−0.3201000
CEC0.825 *0.5900.779 *0.6290.696 *−0.748 *1000
OM−0.0130.058−0.1030.0400.109−0.4490.1551000
Clay0.3880.5440.4020.4680.527−0.4030.5830.3981000
Silt0.3870.1710.3090.2960.197-0.711*0.5420.288−0.0161000
Sand−0.542−0.452−0.486−0.512−0.4640.821 *−0.782 *−0.466−0.554−0.823 *1000
CorrelationPerfectStrongModerateWeakNull
=10.7≤ r <0.90.4≤ r <0.70.1≤ r <0.40
* Significance level of 98%.
Publisher’s Note: MDPI stays neutral with regard to jurisdictional claims in published maps and institutional affiliations.

