Article

Extraction of Organic Volatile Pollutants in Over-Saturated Water by Pervaporation Technique Using a Poly (Dimethylsiloxane)-Based Sealer as a Membrane

by
Wafa Nazzal Alharbi
,
Waseem Sharaf Saeed
*,
Abdulrahman A. Alwarthan
,
Ahmed Yacine Badjah-Hadj-Ahmed
and
Taieb Aouak
*
Chemistry Department, College of Science, King Saud University, P.O. Box 2455, Riyadh 11451, Saudi Arabia
*
Authors to whom correspondence should be addressed.
Water 2021, 13(8), 1049; https://doi.org/10.3390/w13081049
Submission received: 1 March 2021 / Revised: 30 March 2021 / Accepted: 9 April 2021 / Published: 11 April 2021
(This article belongs to the Section Wastewater Treatment and Reuse)

Abstract

:
SILICONE1200 is an inexpensive domestic poly (dimethylsiloxane)-based sealer that was used in this study to remove volatile organic compounds from over-saturated water using the pervaporation technique. A series of volatile organic liquid compounds representing an important part of polluting organic products released every day in water were chosen for this study. These products were alkyl halides (chloroform), aromatics (toluene), aliphatic hydrocarbons (heptanes), ketones and aldehydes (butanone), and organosulfides (thiophene). The mass transfer of these compounds and their mixtures through the SILICONE1200 membrane was assessed to predict the results of the separation process. The results indicate that the mechanism of diffusion obeyed a Fickian model. Different parameters affecting the pervaporation results, such as the membrane thickness, stirring rate, and temperature, were examined to determine the optimal conditions in terms of the total flux and selectivity. The optimized parameters were then applied to the separation of an organic mixture from polluted water using the dynamic pervaporation process with promising results.

1. Introduction

The world is experiencing unprecedented industrial development, particularly since the development of the petroleum industries in 1901. This development has contributed to the wellbeing of humanity but has caused considerable environmental degradation, which is in many cases irreversible in the short and medium terms. Indeed, the discharge of hydrocarbons into oceans and rivers, as well as the gases that escape from factories and various means of transport, has very harmful effects on the environment. International conferences on environmental protection continue to highlight this challenge. Indeed, the quality of water is affected by a range of pollution sources, such as industrial waste. Among these pollutants, volatile organic compounds (VOCs) have been used extensively as fuels, solvents, and adhesives and for other industrial applications [1]. The risk of VOCs arises from their toxicity to humans and the environment [2]. The decontamination of water from organic effluent has attracted considerable attention using various methods [2,3,4], such as the traditional treatment of water polluted with VOCs, including air stripping, carbon adsorption, biological treatment [5], and membrane separation techniques. Membrane separation processes generally consume less energy than other separation techniques and can be combined easily with other techniques. Membrane processes include a broad class of methods, such as microfiltration, ultrafiltration, nanofiltration, reverse osmosis, electrodialysis, vapor permeation, pervaporation (PV), and membrane distillation [6]. PV is a relatively recent membrane separation technique that has become an industrial process in recent years. PV is a separation process in which the liquid mixture is brought into contact with one side of the membrane, and the permeate part from the mixture is removed as a vapor at the other side [6,7]. The separation by pervaporation is based mainly on material transfer (selective sorption, diffusion, and desorption). Since the appearance of this technology, the number of publications, books, and industrial applications has increased, highlighting the growing importance of this technique as an effective membrane method for separating volatile organic and hydro-organic liquid mixtures [8,9,10,11,12]. Pervaporation has numerous advantages over other conventional techniques: high separation efficiency, efficiency in breaking azeotropes [13] and microemulsions [14,15,16]; being non-polluting, energy saving, easy to incorporate in production lines, used in industrial refining processes; and environment protection (water treatment). This process is mainly used for dehydrating organic and hydro-organic compounds [16,17,18], removing organic matter at low concentrations from aqueous solutions [19,20,21], and separating organic–organic compounds [22,23,24].
The first industrial applications of pervaporation were made at the end of the 1980s for the dehydration of alcohols using hydrophilic membranes. Environmental applications of this method in the elimination of organic compounds in small quantities dissolved in water using hydrophobic membranes began in 1997 [20]. The separation of organic compounds from water has attracted less research attention despite the particular interest of using these compounds in water recycling and wastewater treatment. Regarding the removal of volatile organic compounds (VOC)s, other separation technologies, such as distillation, liquid–liquid extraction, carbon absorption, and air stripping, are not used on an industrial scale because of limitations in feed conditions, large volume of by-products, or high cost of post-treatments. By contrast, pervaporation does not have these limitations and can be applied easily to decontaminate water containing organic effluent.
The removal of organic compounds is typically achieved using organophilic membranes. The cross-linked polydimethylsiloxane (PDMS) membrane is most commonly applied in this field because of its excellent thermal, chemical, and mechanical properties and high affinity toward organic compounds [25,26,27,28,29,30]. The elimination of organic substances from aqueous solutions is particularly advantageous for the recycling of contaminated water and valorizing organic substances. In the environmental industry, selective removal of VOCs by pervaporation, such as aliphatic and aromatic hydrocarbons, as well as oxygenates, chlorinated and sulfured hydrocarbons dissolved in water, is a challenge for researchers [20,31,32,33,34,35,36,37,38,39,40,41,42,43,44,45,46,47]. A literature search revealed a very small number of studies on the extraction by pervaporation of liquid organic pollutant mixtures released by industry containing aromatics, aliphatics, organohalides, organosulfides, and oxygenated organic compounds from supersaturated aqueous solutions. By contrast, an enormous number of publications on the separation of organic–organic and hydro-organic-water mixtures have been published. Table 1 and Table 2 list some binary organic-water and multinary organic systems, respectively, separated by pervaporation techniques using different membranes.
In this study, a series of organic compounds involving one of the families of saturated hydrocarbons (toluene), unsaturated hydrocarbons (heptanes), organohalides (chloroform), carbonyl derivatives (butanone), and organosulphides (thiophen) were extracted together from over-saturated water through pervaporation using a membrane made from a domestic silicone material (SILICONE1200), which is inexpensive, accessible to everyone, and easy to model. A preliminary study of material transfer through this membrane was carried out, in which the absorption and the diffusion phenomena were investigated through swelling and desorption measurements. The conditions leading to the optimal performance in terms of the total flux and the selectivity of this membrane toward the organic mixture were investigated by assessing various parameters of pervaporation, such as the time of the separation process, membrane thickness, the stirring rate, and temperature. During this step, the optimal conditions were applied to remove the organic mixture from water by pervaporation in a dynamic mode (continuous process).

2. Materials and Methods

2.1. Materials

SILICONE-1200, of a domestic grade, which is a polydimethylsiloxane-based sealer, was purchased from Anchor Allied Factory LLC (Sharjah, United Arab Emirates). Chloroform (purity, 99.5%), toluene (purity, 99.8%), heptanes (purity, 99%), thiophene (purity, 99%), and butanone (purity, 99%) were purchased from Merck (Darmstadt, Germany). All chemicals were used as received.

2.2. Membrane Preparation

A known quantity of SILICONE-1200 sealer paste was placed on a sheet of transparent polypropylene paper, framed with one or more layers of adhesive tape with known thickness held horizontally on a metal plate. The silicone paste was then covered with another sheet of transparent paper and spread out carefully using a rolling pin, as illustrated in Scheme 1. The resulting film was left to dry for 12 h at room temperature (25 °C). The residual solvent and reactants were extracted by placing the whole in a vacuum oven (20.3 mbar) at 60 °C until a constant mass was measured. This resulted in a transparent and thin film of uniform thickness. The residual monomers, oligomers, and non-volatile impurities encrusted in the film were removed by washing the film with each solvent used until saturation. The sorbed solvent was then extracted under high vacuum (1.6 mbar) at 60 °C until a constant weight was achieved. The thickness of each membrane was calculated with an error of ±2 μm from the arithmetic average of 4 or 5 measurements taken at different places. Four membranes of different average thicknesses (260, 350, 480 and 510 μm), measured using a Mitutoyo 293-340-30 digital micrometer, were prepared using the same method by varying the amount of the SILICONE1200 paste. Note that membranes of thickness less than 260 μm was not technically easy to obtain by this method due to the excessive brittleness and elasticity of the polymer in addition to the effect of the electrostatic exerted on the two surfaces of the film. Table 3 summarizes the preparation conditions.

2.3. Feed Preparation

After fixing the SILICONE1200 membrane in the pervaporation cell, 50 mL of distilled water was introduced carefully into the upstream side of the cell. Subsequently, an equivalent amount of organic mixture containing 20 wt.% of each organic component (chloroform, toluene, heptanes, thiophene, and butanone) was added under continuous stirring at 20 °C. As shown in Figure 1, three phases are observed in the upstream of the cell. The top phase essentially contains butanone, toluene and heptanes due to their lowest density (≤0.865 g·mL−1) and their affinities very close to each other, the second in the middle rich in water and thiophene (densities close to 1.0 g/mL) and the third rich in chloroform (1.48 g·mL−1) occupies the bottom of the feed. The characteristics of each components used in this mixture are shown in Table 4.

2.4. Mass Transfer

Swelling measurements of the membranes in the mixture and the pure solvents were taken at 20 °C. Seven dried pieces of membrane, 4 × 4 cm with a 1.2 ± 0.4 mm thickness, were weighed and immersed separately in chloroform, toluene, n-heptane, thiophene, n-butanone, water, and their mixture with continuous stirring until saturation (at constant mass). During the swelling process, each film was removed from the vessel at different interval times; the films’ surfaces were dried with tissue paper to absorb the remaining liquid, and the resulting films were weighed. This experimentation was repeated twice, and the results obtained were taken from the arithmetic average. The degree of swelling (DS) was determined using Equation (1):
D S %   =   w t w o w o × 100
where wt and wo are the weight of the swollen membrane at time t and the weight of the membrane before the swelling process, respectively.

2.4.1. Sorption

For a solvent–polymer system, sorption equilibrium occurs more rapidly than diffusion does. The activity coefficient of a solvent in a polymeric solution, γ 1 , is related to its solubility parameter using the following equation:
R T L o g γ 1 = V 1 φ 1 2   δ 1 δ p 2
where δ 1 and φ 1 are the Hansen solubility parameter and the volume fraction of the solvent absorbed, respectively; T is the temperature of the experiment, and R is the gas constant.
Hildebrand and Scott [49] proposed that the enthalpy of mixing for regular polymer solutions could be approximated by the following equation:
Δ H M =   V   δ 1 δ 2 2   φ 1 φ 2
where δ 1 and δ 2 are the Hansen solubility parameters of the solvent and the polymer, respectively. φ 1 and φ 2 are the volume fractions of the solvent and the polymer, respectively, and V is the total volume of the mixture. For higher solubility, ∆HM must be lower, resulting in a ∆δ value that tends toward zero. By contrast, according to the theory of Flory–Huggins modified by Blanks and Prausnitz [50], ∆δ is related to the interaction parameter, χ 1 , p , by the following equation:
χ 1 , p =   β   +   V 1 R T   δ 1   δ p 2
where β is the entropic factor that is most often equal to 0.34 [50]. R and T are the gas constant and temperature of the experiment, respectively. According to Flory and Huggins theory, the solubility of a polymer in a solvent increases when this parameter approaches zero. When χ 1 , p = 0.5, the polymer is poorly soluble in the solvent. In other words, this polymer becomes soluble in a solvent only at a specific temperature called the theta-temperature. In this case, this solvent is also called the theta-solvent. At χ 1 , p > 0.5, the polymer becomes insoluble, or it precipitates. This theory is also extended to a cross-linked polymer, in which high swelling means high solubility.

2.4.2. Diffusion

Comyn [51] reported that the kinetics for the swelling dynamics in a material, such as a polymer, can be expressed as
w t w o w w o   = 1   n   =   0 8 ( 2 n 1 ) 2 π 2 e x p D ( 2 n 1 ) 2 π 2 l 2 · t
where w and l are the mass of the sorbed molecules at maximum absorption and the polymer film thickness, respectively. D is the diffusion coefficient, and n is the diffusion exponent (also called the kinetic order), indicating the solvent transport mechanism in the membrane. For the short times of the initial stages of diffusion and when the term on the left of this equation is less than 0.6, Equation (5) takes the following form:
w t w o w w o   = 2 × D × t π × l 2 0.5
This equation can be linearized as follows:
L n w t w o w w o   = L n k + 0.5 L n   t
where the exponent 0.5 is the type of diffusion mechanism, and k is a constant relating the swelling rate of the membrane, which in turn depends on the diffusion coefficient and film thickness. By the analogy of Equation (6), k can be expressed as
k = 2 l D π 0.5
The close values observed for D and k indicate that the swelling behavior is not affected significantly by the various components of the organic mixture.
The diffusion coefficient, D, can be obtained from the slope of the linear portion of the curve corresponding to the variation of L n w t w o w w o versus Ln (t).

2.4.3. Desorption

The desorption of mixtures from the membrane was performed using the apparatus described elsewhere [51]. The membrane that swelled in the mixture until saturation was placed into a bottom flask connected to a cooled trap. The vapor of the mixture, which was formed by the dramatic decrease in pressure caused by liquid nitrogen, was then driven to the cold trap. The compositions of the absorbed mixture collected in the cold trap were analyzed by gas chromatography (Agilent 6850, Wilmington, DE, USA). To minimize the errors caused by the different experimental processes that could affect swelling, sorption, and desorption, such as evaporation, weighing, and drying, as in the case of the swelling measurements, the values were taken from the arithmetic average of two measurements, and the error bar was considered.
The concentration of each component in the desorbed mixture after swelling at equilibrium was determined, and the selective absorption of the membrane factor, β i / m i x a b s , was calculated using Equation (9) [52,53]:
β i / m i x a b s   =   X i / X m i x Y i / Y m i x
where X i and X m i x are the weight fraction of i and that of the other organic mixture in the cold trap. Y i and Y m i x are the weight fractions of i and the other organic mixture in the feed mixture.

2.5. Pervaporation Process

2.5.1. Pervaporation Setup

Scheme 2 presents the pervaporation system working in the static and dynamic modes used in this study. The cell was made from stainless steel and had a capacity of 120 mL. In the static mode, the temperature of the feed was kept constant during the process by circulating a thermostatic fluid passing between the walls of the cell containing the feed (1). In the dynamic mode, the temperature of the feed in the reservoir (2) was kept constant using a thermostatic coil immersed in the mixture. In all cases, homogenization of the feed was ensured by stirring using a magnetic bar hung from the cell ceiling.

2.5.2. Feed Preparation

A determined volume of distilled water was introduced carefully into the upstream side of the cell. Subsequently, an equivalent volume of organic mixture containing 20 wt.% of each organic component (chloroform, toluene, heptane, thiophene, and butanone) was then added under continuous stirring at 20 °C. Table 5 shows the initial composition of the feed.

2.5.3. Pervaporative Parameter Calculation

The total flux, J, was determined from the mass measurements of the permeate at the interval time using Equation (10).
J =   m A   ×   t
where m, t, and A are the mass of the permeate collected (kg), the time of the separation process (h), and the effective area of the membrane (2.84 × 10⁻³ m2), respectively.
The separation factor, β p e r v , was evaluated at the same periods of the extraction process from the concentration of organic components in the permeate and the retentate using Equation (11).
β p e r v =   P o P w F o F w
where Po and Pw are the mass of organic compounds and water in the permeate, respectively. Fo and Fw are the mass of organics and water in the feed, respectively. The membrane efficiency was estimated using the pervaporation separation index (PSI) calculated using Equation (12) [54]:
PSI = J (βperv − 1)

2.6. Characterization

The concentration of each component in the permeate was determined by gas chromatography (GC), Shimadzu 600 chromatograph, (Kyoto, Japan) equipped with a flame ionization detector, thermal conductivity (TC) detector, and TR-5 capillary column (55 m length and 0.25 mm internal diameter). The carrier gas was helium, and the flow rate was 2.7 mL·min−1. A calibration curve indicating the variation of the mixture composition versus the volume of elution was plotted, and the concentrations of each component in the permeate and retentate were determined.

3. Results and Discussion

3.1. Mass Transfer

Figure 2 illustrates variation of the swelling degree as a function of time for the mixture and its pure components. Table 6 lists the swelling performance of the SILICONE1200 membrane in the water-organic mixture, along with those of the pure components determined from their maximum absorptions. The maximum swelling of this membrane was achieved with chloroform, in which approximately 552% by weight was absorbed in 2 h. Heptanes had an approximate 250 wt.% increase in weight during in same period. By contrast, butanone and thiophene were the least absorbed among the organic mixture components with similar levels of 90% and 100% by weight of the membrane, respectively. No swelling of the SILICONE1200 membrane was noted when it was immersed in water. By contrast, the water–organic mixture indicated a 300 wt.% degree of swelling, which was intermediate between those of chloroform and heptanes. These results were expected from the difference in the Hansen solubility parameters, ∆δ, between that of PDMS and each pure component, as presented in Table 6. Table 6 lists the interaction parameters determined from the data of Table 4 and Equation (2).
As indicated by the χ 1 , p results in Table 6, the ∆δ, ∆HM, and χ 1 , p values for each SILICONE1200–solvent system generally reflect the swelling performance, except for chloroform, which had higher values. Heptanes and toluene, however, had smaller values of ∆δ and χ 1 , p than those of the other components. Lee et al. [55] observed a similar anomaly when comparing the swelling of PDMS that occurred separately in acetone and methylene chloride. They reported that despite these two solvents having the same δ values (9.9 cal1/2 cm−3/2) [56], the swelling rate was different. They attributed this to the polarity of the solvent. Indeed, the Hansen solubility parameter is a result of three contributions [57]: (i) dispersal forces ( δ d ), (ii) polar forces ( δ p ) and (iii) hydrogen bonding forces ( δ h ), in which δ 2 = δ d 2 + δ p 2 + δ h 2 . Hence, two solvents can have the same solubility parameter, but the contributions that compose this value can be different.
The classification in descending order of the swelling performance expected from ∆δ and χ 1 , p for the SILICONE1200 membrane with respect to each solvent is as follows:
Heptanes > Toluene > Chloroform > Butanone > Thiophene >>> Water
The classification obtained experimentally from swelling to saturation had the following order:
Chloroform > Heptanes > Toluene > Thiophene > Butanone >>> Water

3.1.1. Diffusion

Considering the criterion cited in Section 2.4.2, only a swelling degree less than 60 wt.% was considered, for which Equation (6) was satisfied according to the Comyn approach [51]. Figure 3 illustrates the variation of L n w t w o w w o as a function of Ln (t) for the SILICONE1200 membrane in the mixture and its pure components. The curve profiles revealed straight lines for all organic compounds with slopes (n) close to 0.5, except for the thiophene and the mixture, which were 0.357 and 0.357, respectively. The k value for each component and the organic mixture was obtained from the intercept, as presented in Table 7.
The diffusion mechanism of all the components and the mixture through the SILICONE1200 membrane had a Fickian behavior. Under this condition, the diffusion rate (Rdiff) is much smaller than the rate of relaxation (Rrelax), i.e., Rdiff << Rrelax, suggesting that the system is governed by diffusion [57]. According to the literature, an n value greater than or equal to 1.0 indicates that the diffusion process is much faster than the relaxation process, in which Rdiff >> Rrelax, and the system is governed by a relaxation phenomenon [58]. This resulting straight line also indicated no change in the membrane structure and morphology during the swelling process. Therefore, SILICONE1200 can be suitable as a reproducible membrane used to extract VOCs from water.

3.1.2. Desorption

Table 8 lists the composition of the mixture absorbed by the membrane and the selective absorption of the membrane factor ( β i / m i x a b s ). In general, a slight change in the selectivity of the SILICONE1200 membrane is observed for all components. The order of the composition of each component absorbed followed the same trend as that of its PDMS-solvent interaction parameter and that of its ∆δ values listed in Table 6.
A preliminary study of the mass transfer properties of the SILICONE1200 membrane revealed its good performance for the extraction of volatile liquid organic mixtures containing ketones, alkanes, organohalides, organosulfides, and aromatics from polluted water using a pervaporation technique. The pervaporation parameters, in terms of the total flux rate and the selectivity factor, were examined as a function of time, membrane thickness, the stirring rate, and temperature. The results are presented in Section 3.2.1 (A, B and C, respectively).

3.2. Pervaporation

The optimal conditions leading to the selective extraction of VOCs from contaminated water with the best total flux and selectivity were determined by carrying out the pervaporation technique in a static process. Various parameters influencing the pervaporation performance were investigated, such as the membrane thickness, stirring speed, and temperature. The optimal conditions obtained were then applied to examine in the continuous mode the extraction of these contaminants from a reservoir of a larger capacity to minimize depletion and approach the situation of actual contamination.

3.2.1. Pervaporation Using the Static Process

(A)
Effect of the Membrane Thickness on the Extraction Performance
Regarding the diffusion of a solution through a dense and non-porous material, according to Fick’s model, the total flux was inversely proportional to the membrane thickness [59]. Hasanoglu et al. [60] examined the extraction of ethyl acetate from its esterification media using PDMS as a membrane with different thicknesses. The total flux obtained using PDMS-250 µm was higher than that obtained using PDMS-300 µm. Hyder et al. [61] investigated the thickness of a selective membrane fabricated from poly (vinyl alcohol)/polysulfone cross-linked in the dehydration of alcohol. They reported that the total flux increased by 193% with a decrease in thickness from 52 to 4 μm. Similarly, Raisi et al. [62] reported the effect of the membrane thickness on the permeation rate (flux) using two types of membrane, PDMS and poly (octylmethylsiloxane) (POMS), and a mixture of pomegranate aroma as the feed for separation. They concluded that the pervaporation flux was inversely proportional to the membrane thickness and explained this simply by a decrease in membrane resistance toward the transit of the molecules with decreasing thickness. By contrast, according to the same authors, the selectivity increased with increasing membrane thickness.
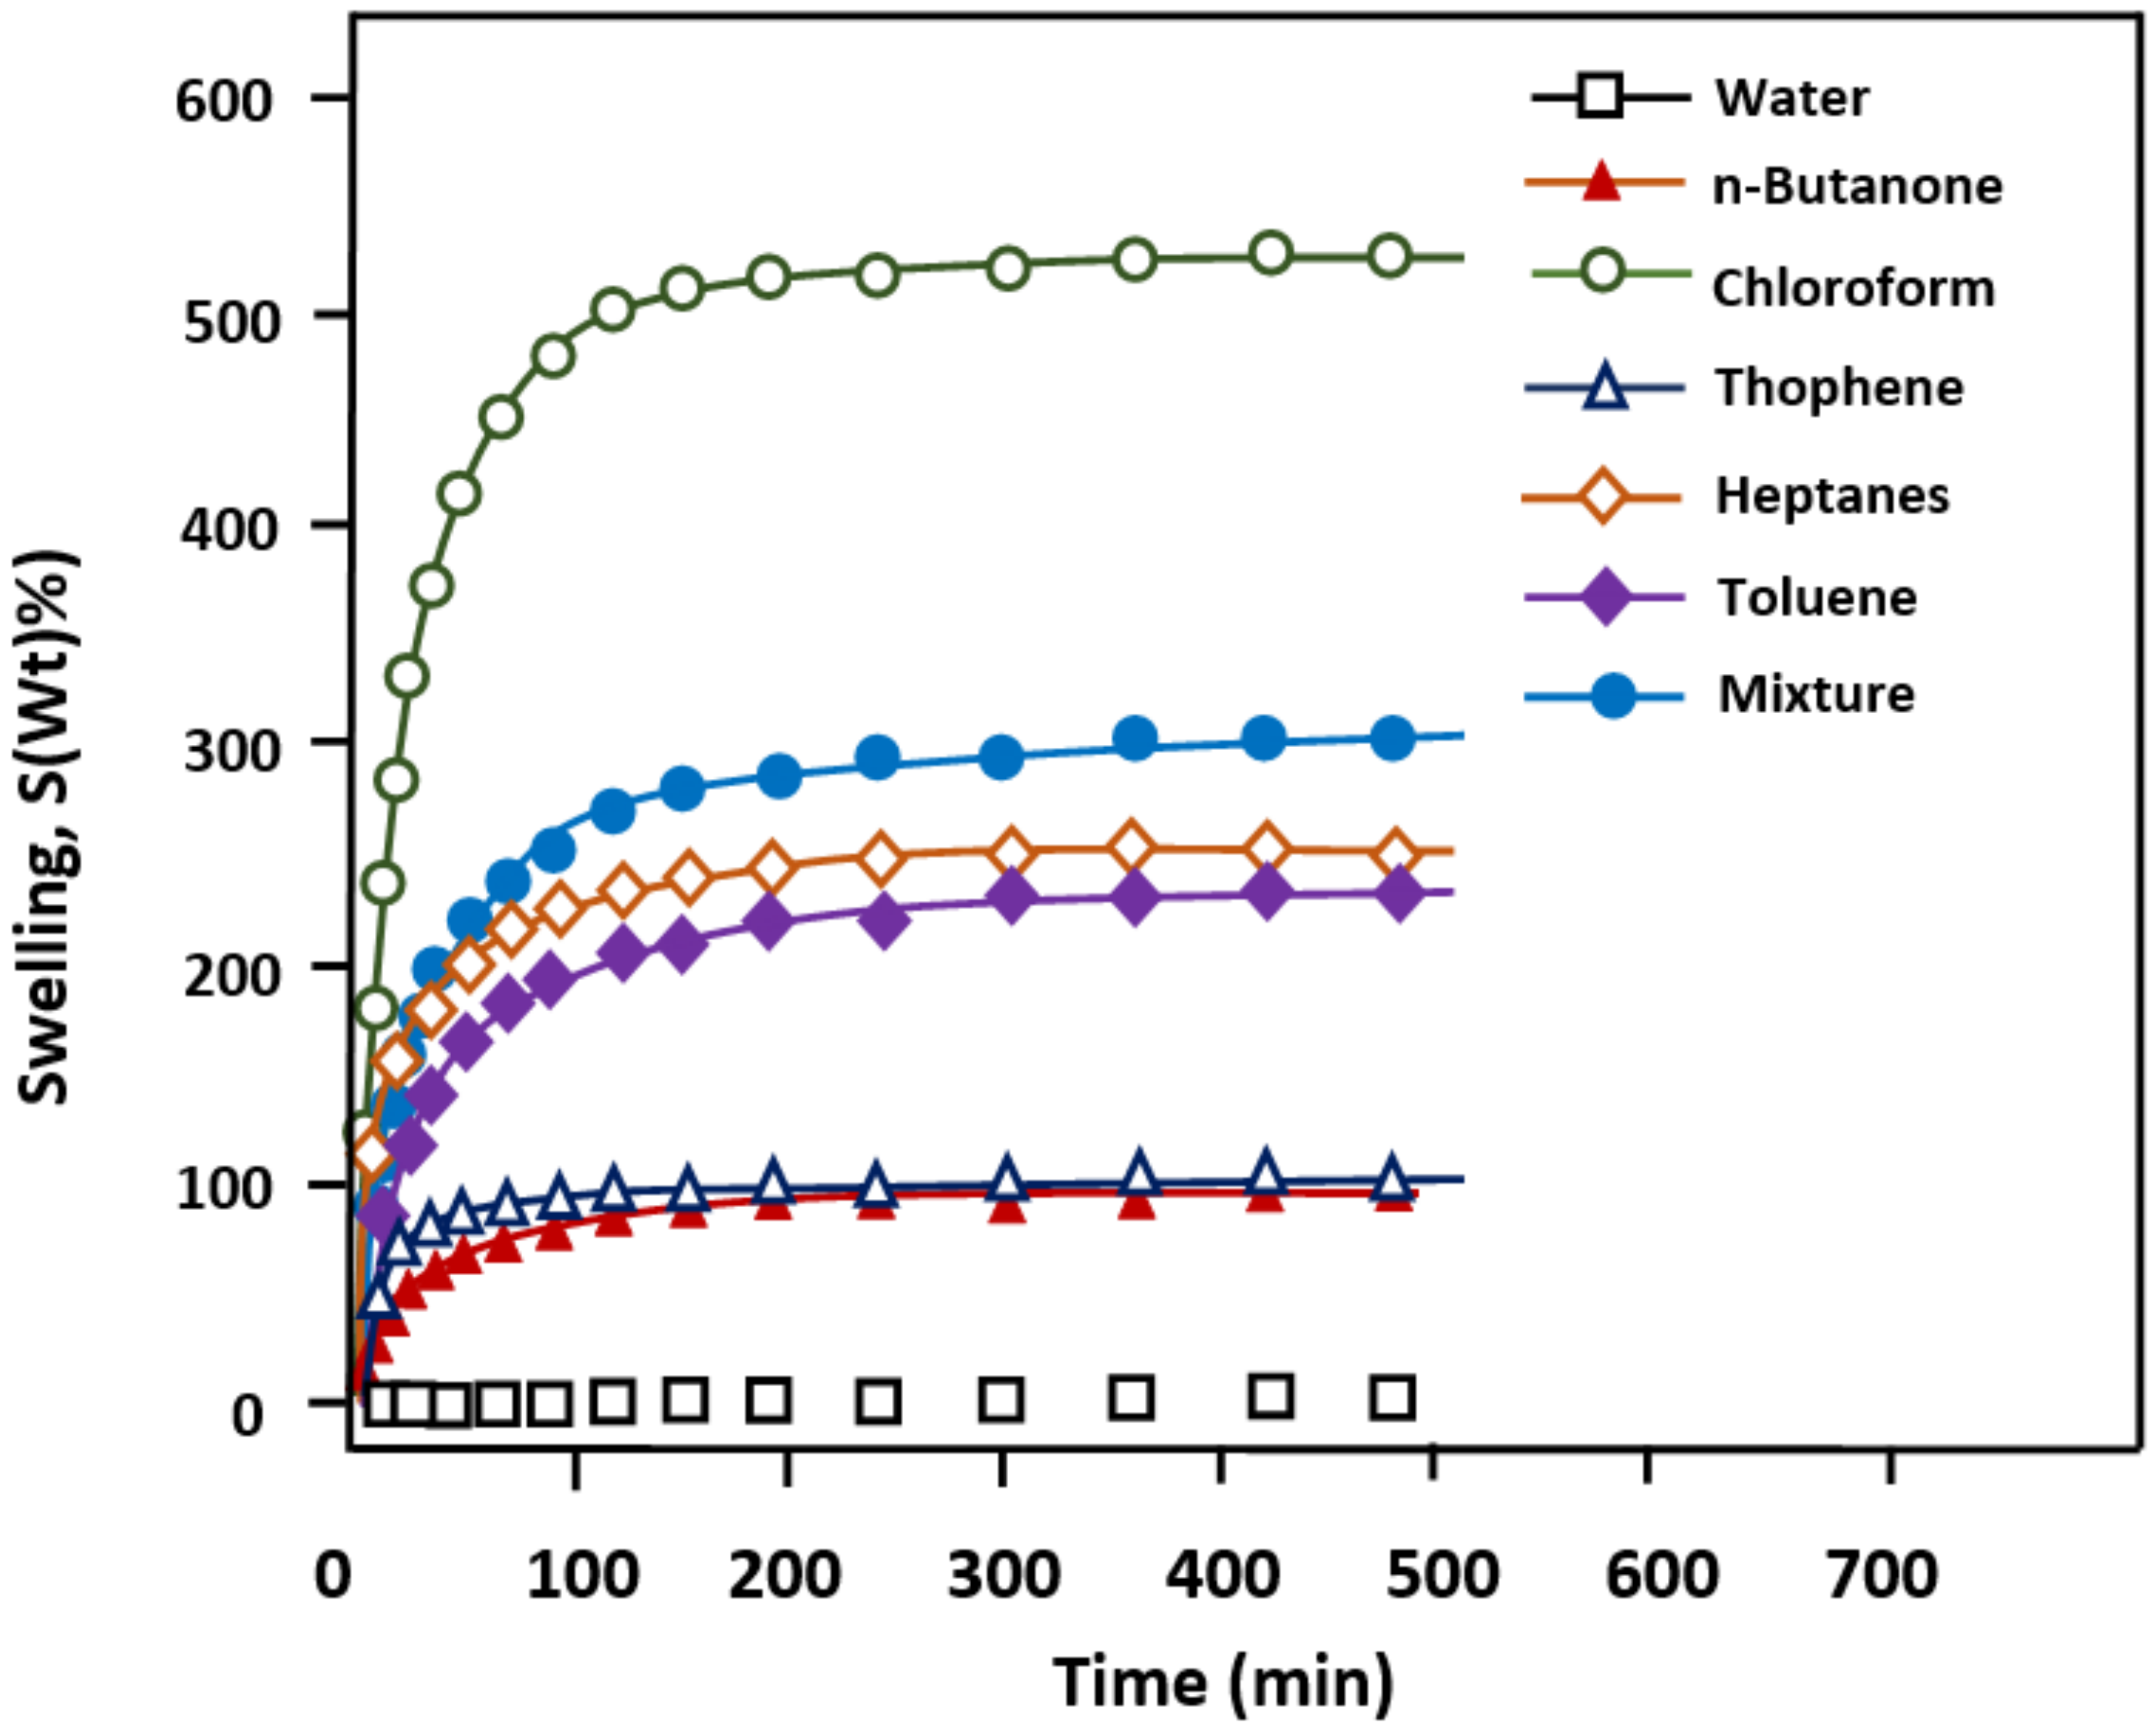
The present study examined effects of the SILICONE1200 membrane thickness on the extraction performance at a constant temperature and a stirring rate of 20 °C and 500 rpm, respectively.
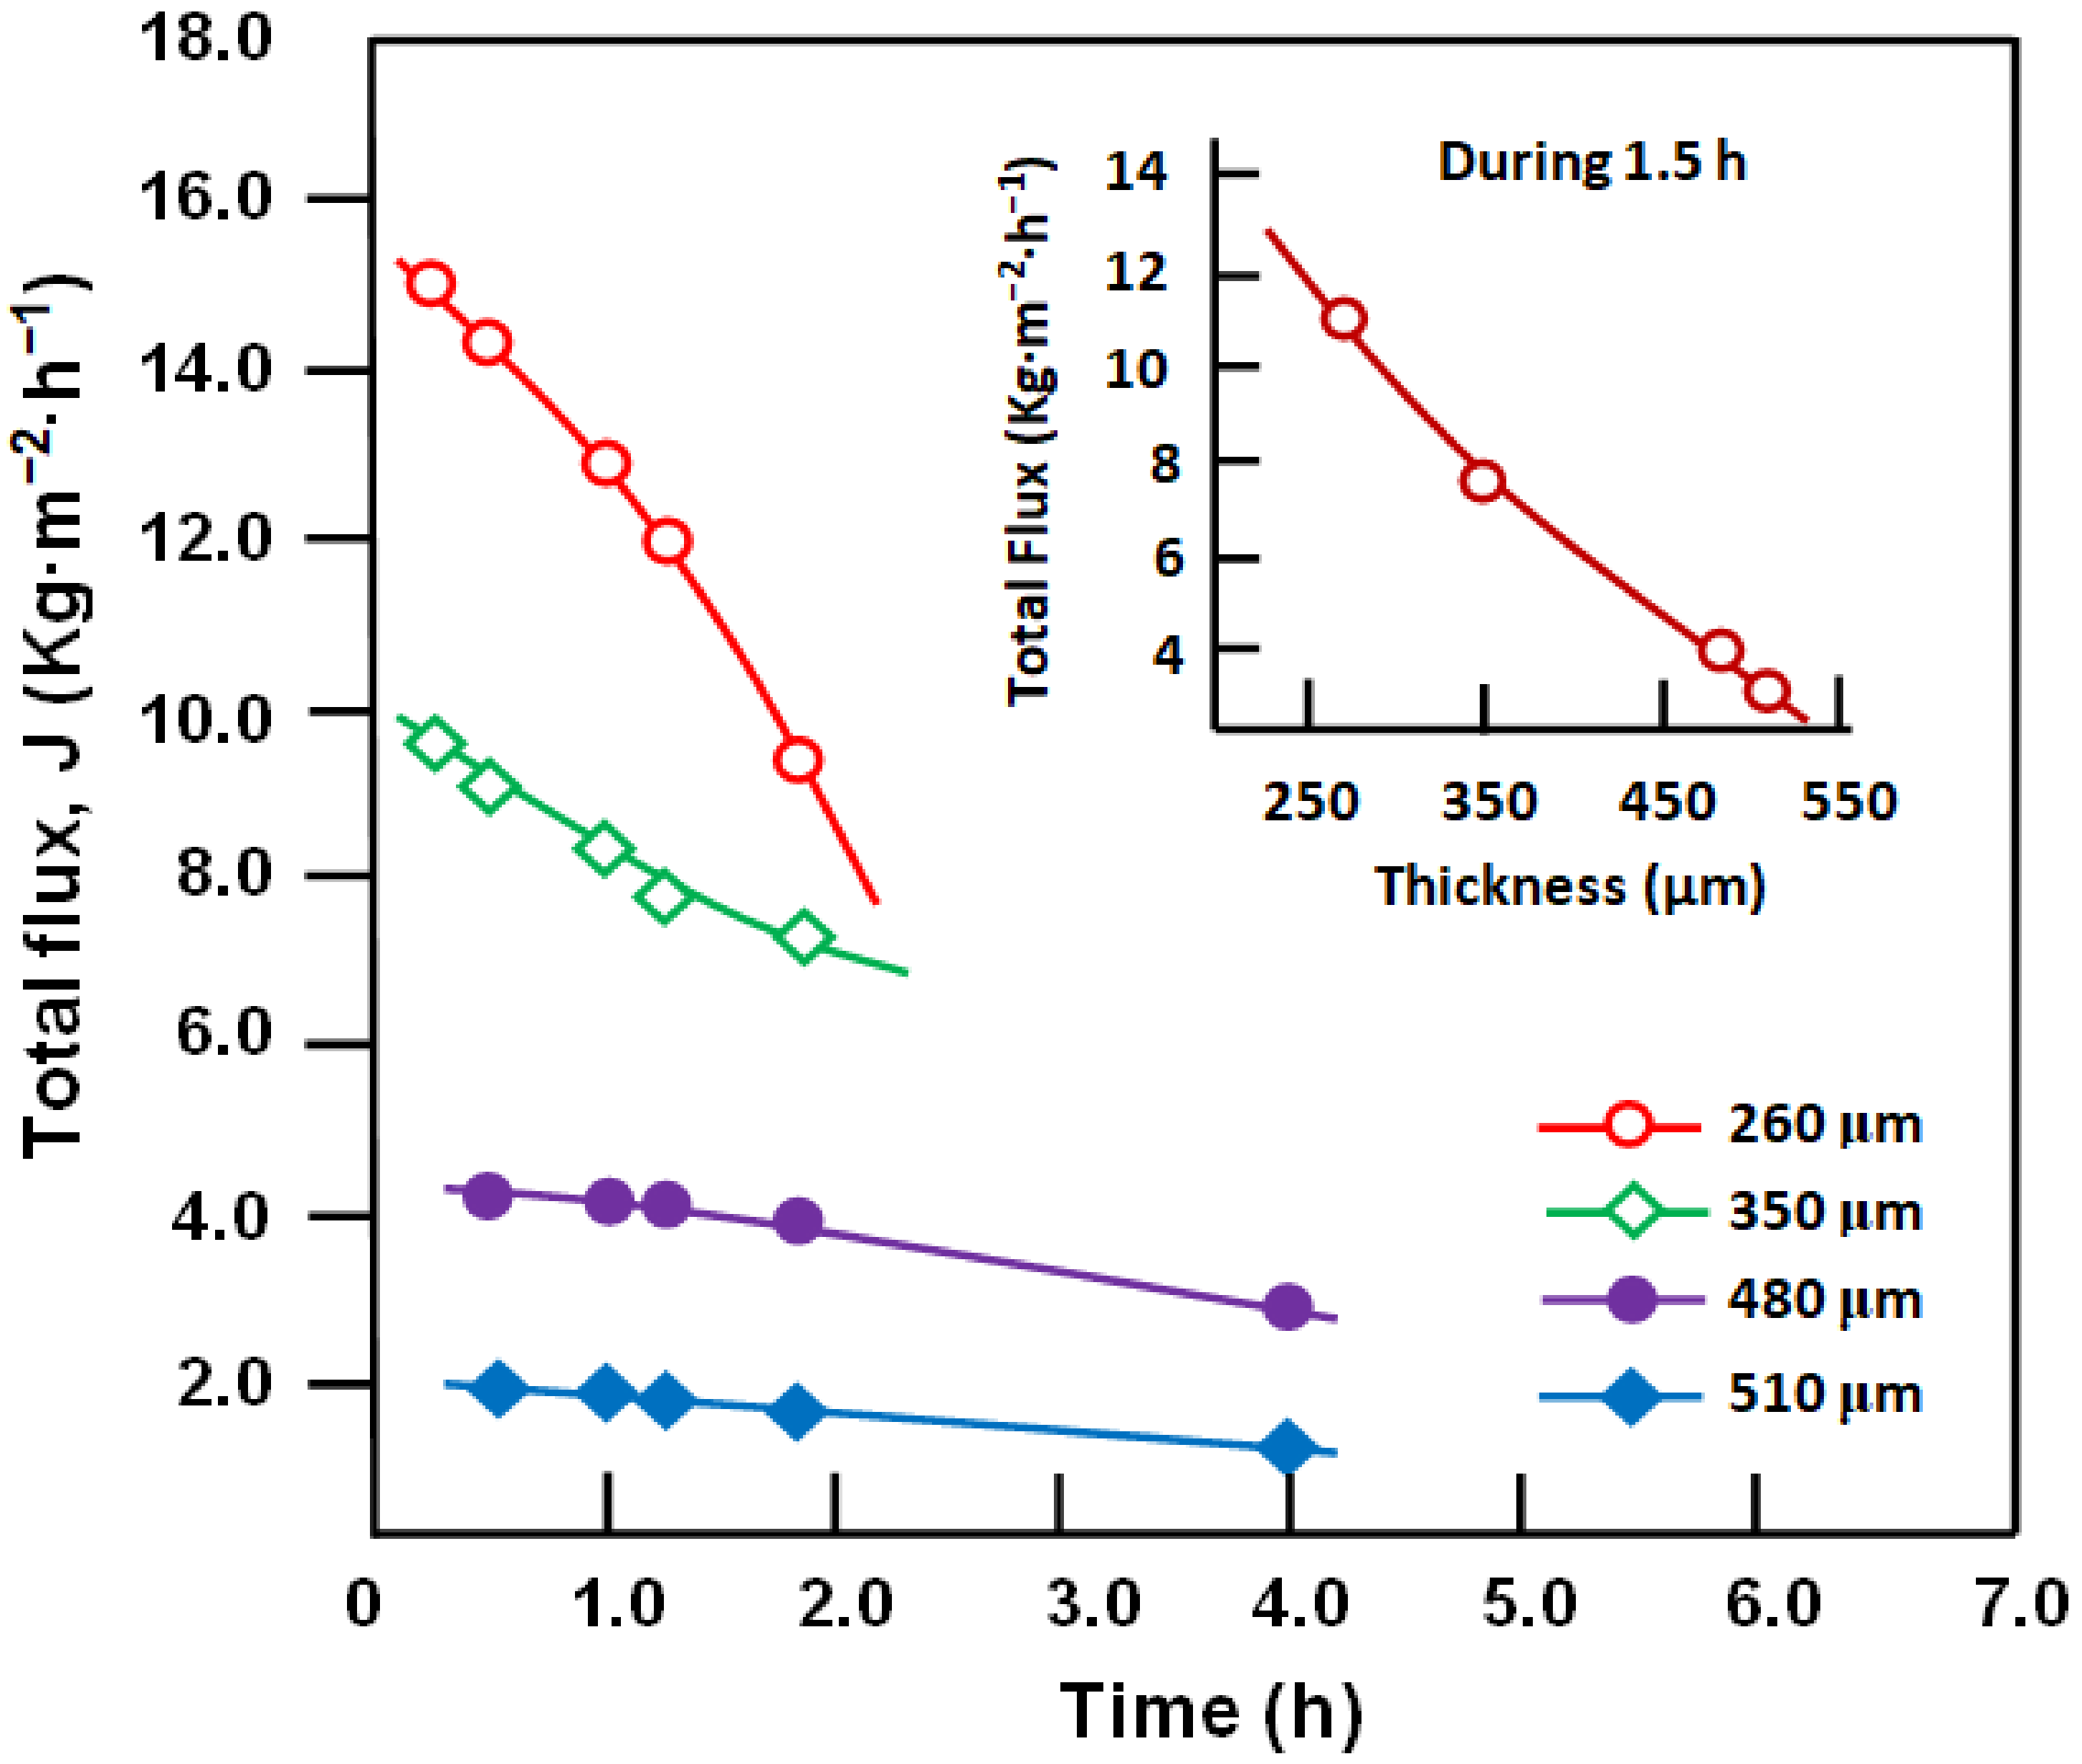
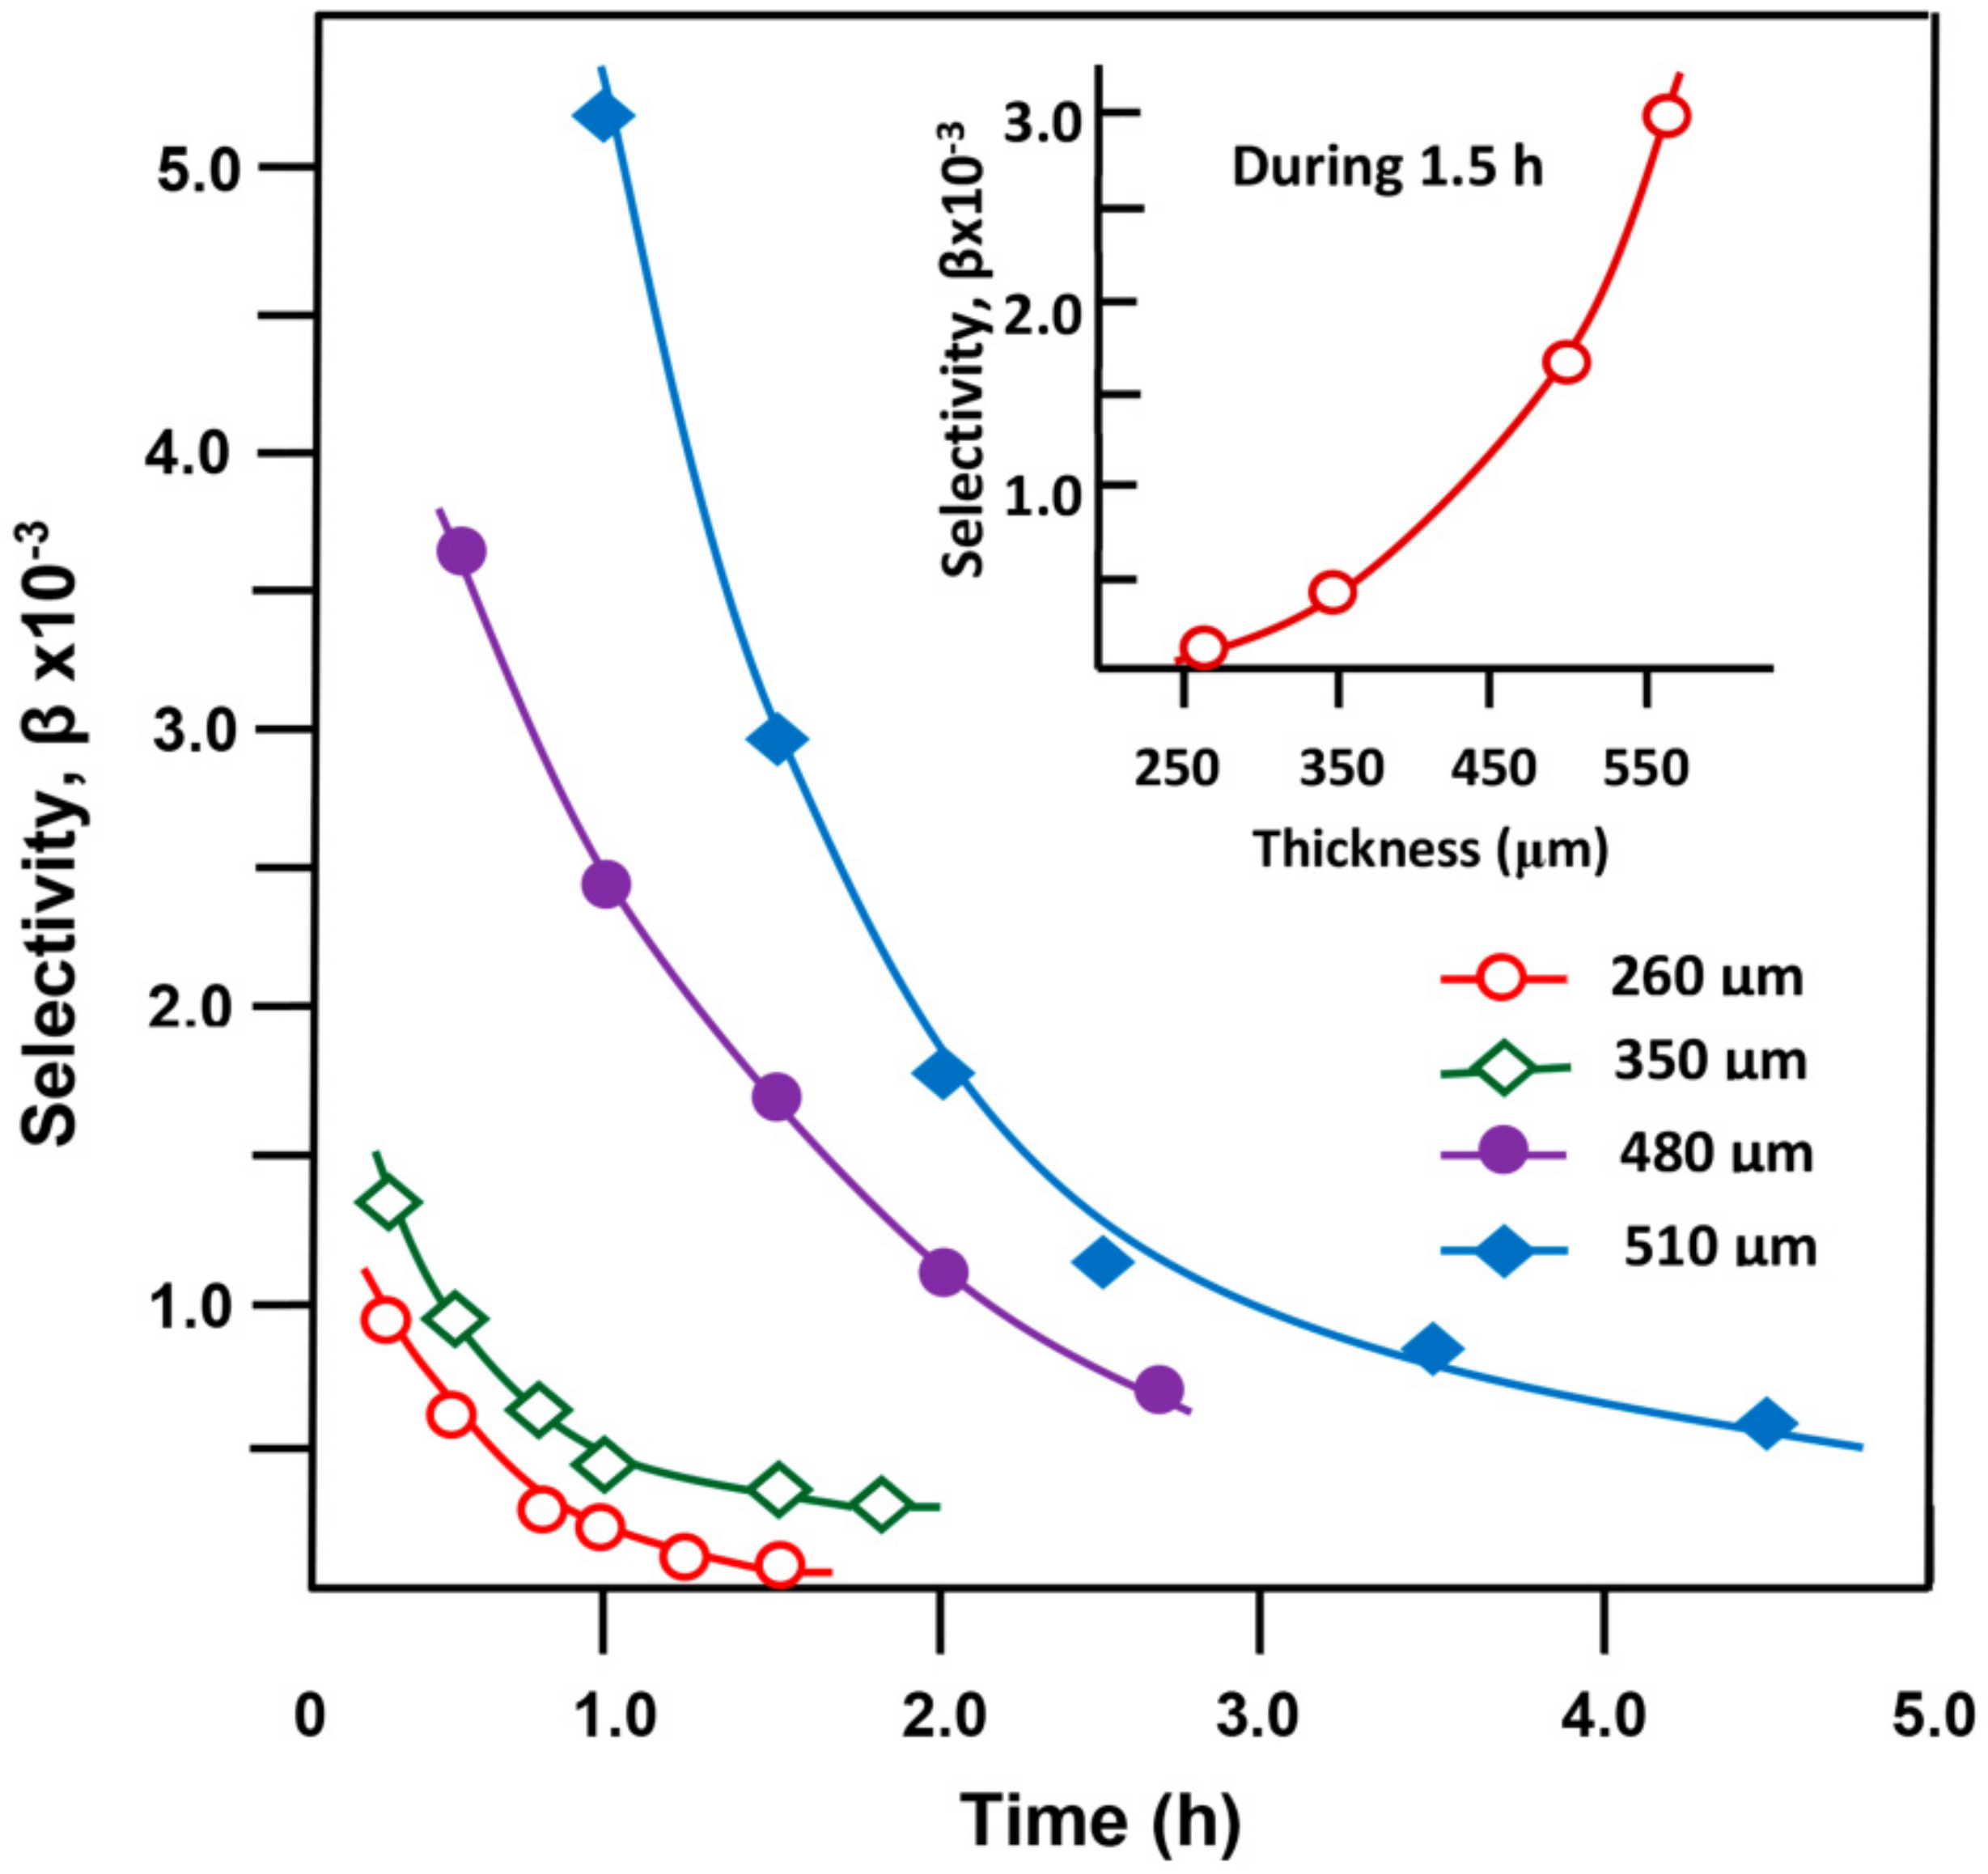
 Figure 4 and Figure 5 illustrate the variations of the total flux and the selectivity, respectively. For all thicknesses, the total flux decreased continually with time and more significantly when the membrane thickness was 260 and 350 μm, respectively (Figure 4). The thinner membranes had the highest total fluxes; 11.03 and 7.62 kg·m−2·h−1 were obtained after 1.5 h of separation using 260 and 350 μm membranes, respectively. This is expected in the separation of organic compounds using a membrane, agrees with Hasanoglu et al. [60] and Hyder et al. [62], and is mainly due to the residence time (transit duration) of molecules through the membrane. A thinner membrane has a shorter residence time, and vice versa, promoting the passage of a larger number of molecules. The continued decrease in total flux with time was due to the depletion of organic compounds in the feed.
At first sight, the total flux decreased with time and membrane thickness, achieving a minimum of 1.95 kg·m−2·h−1 and 11.03 kg·m−2·h−1 with the thickest (510 μm) and thinnest (260 μm) membranes, respectively, over the 1.5 h duration (
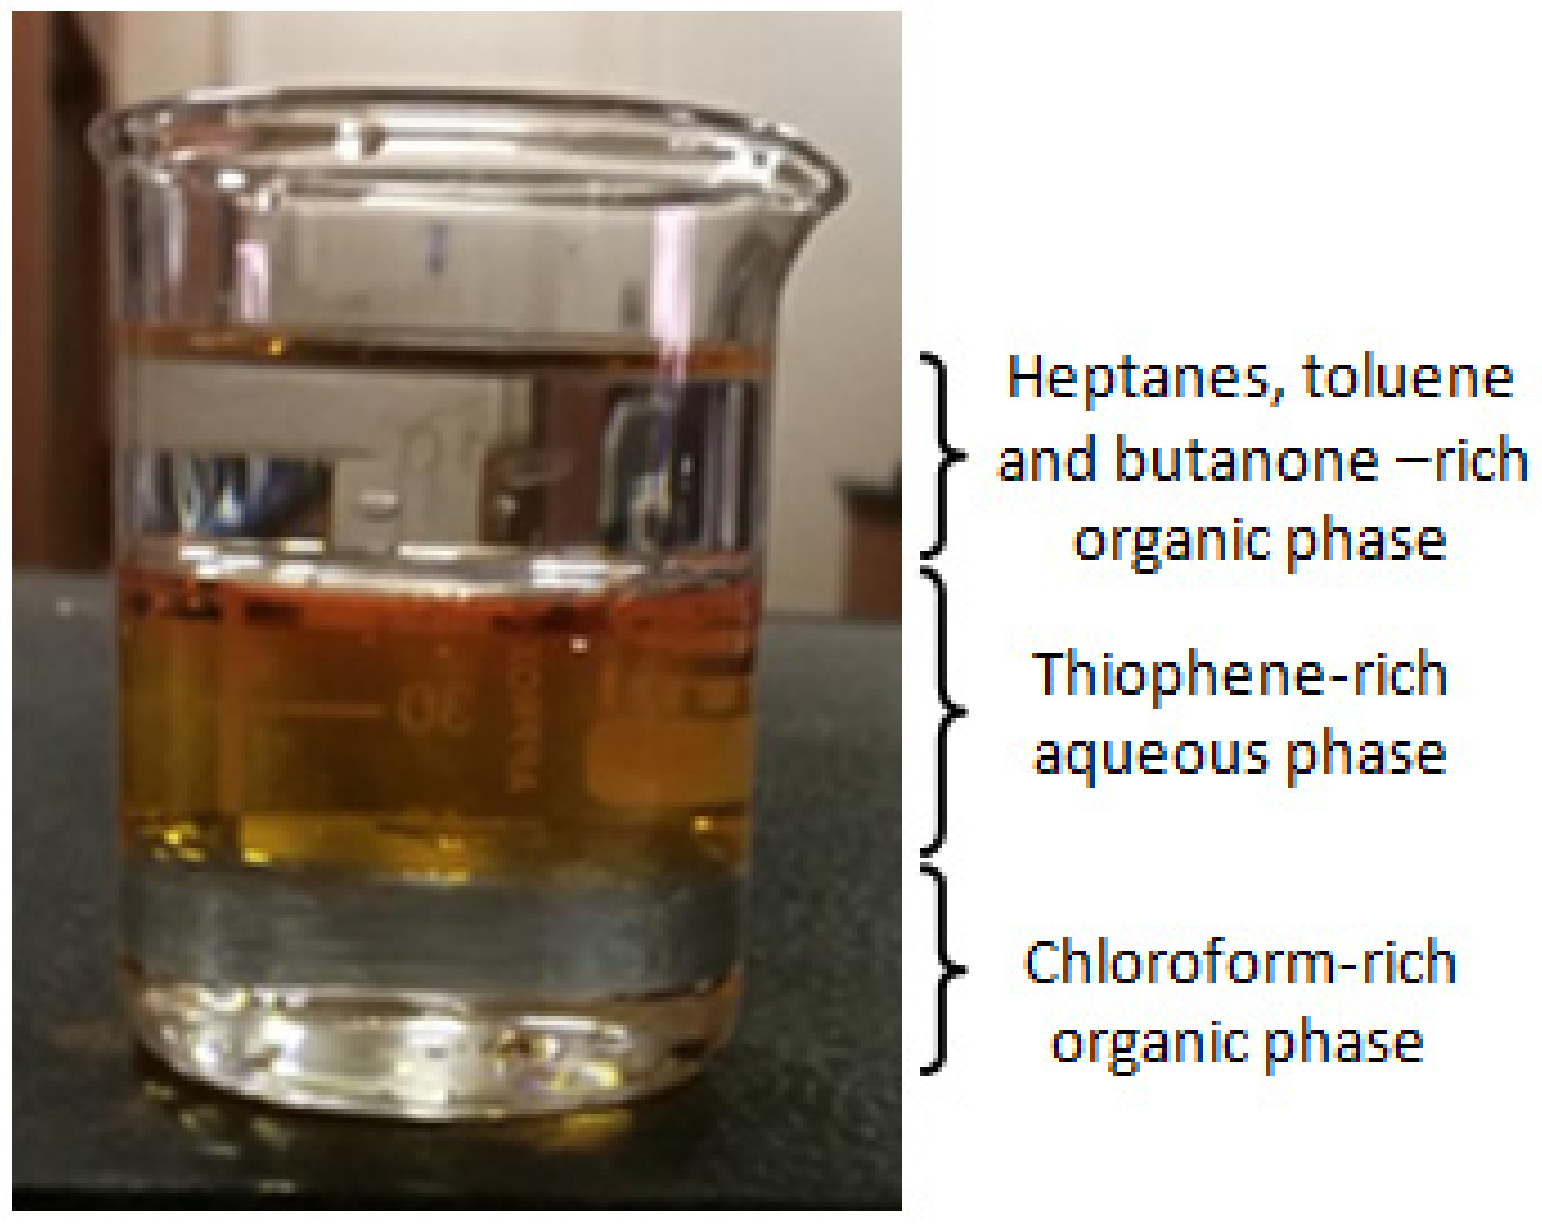
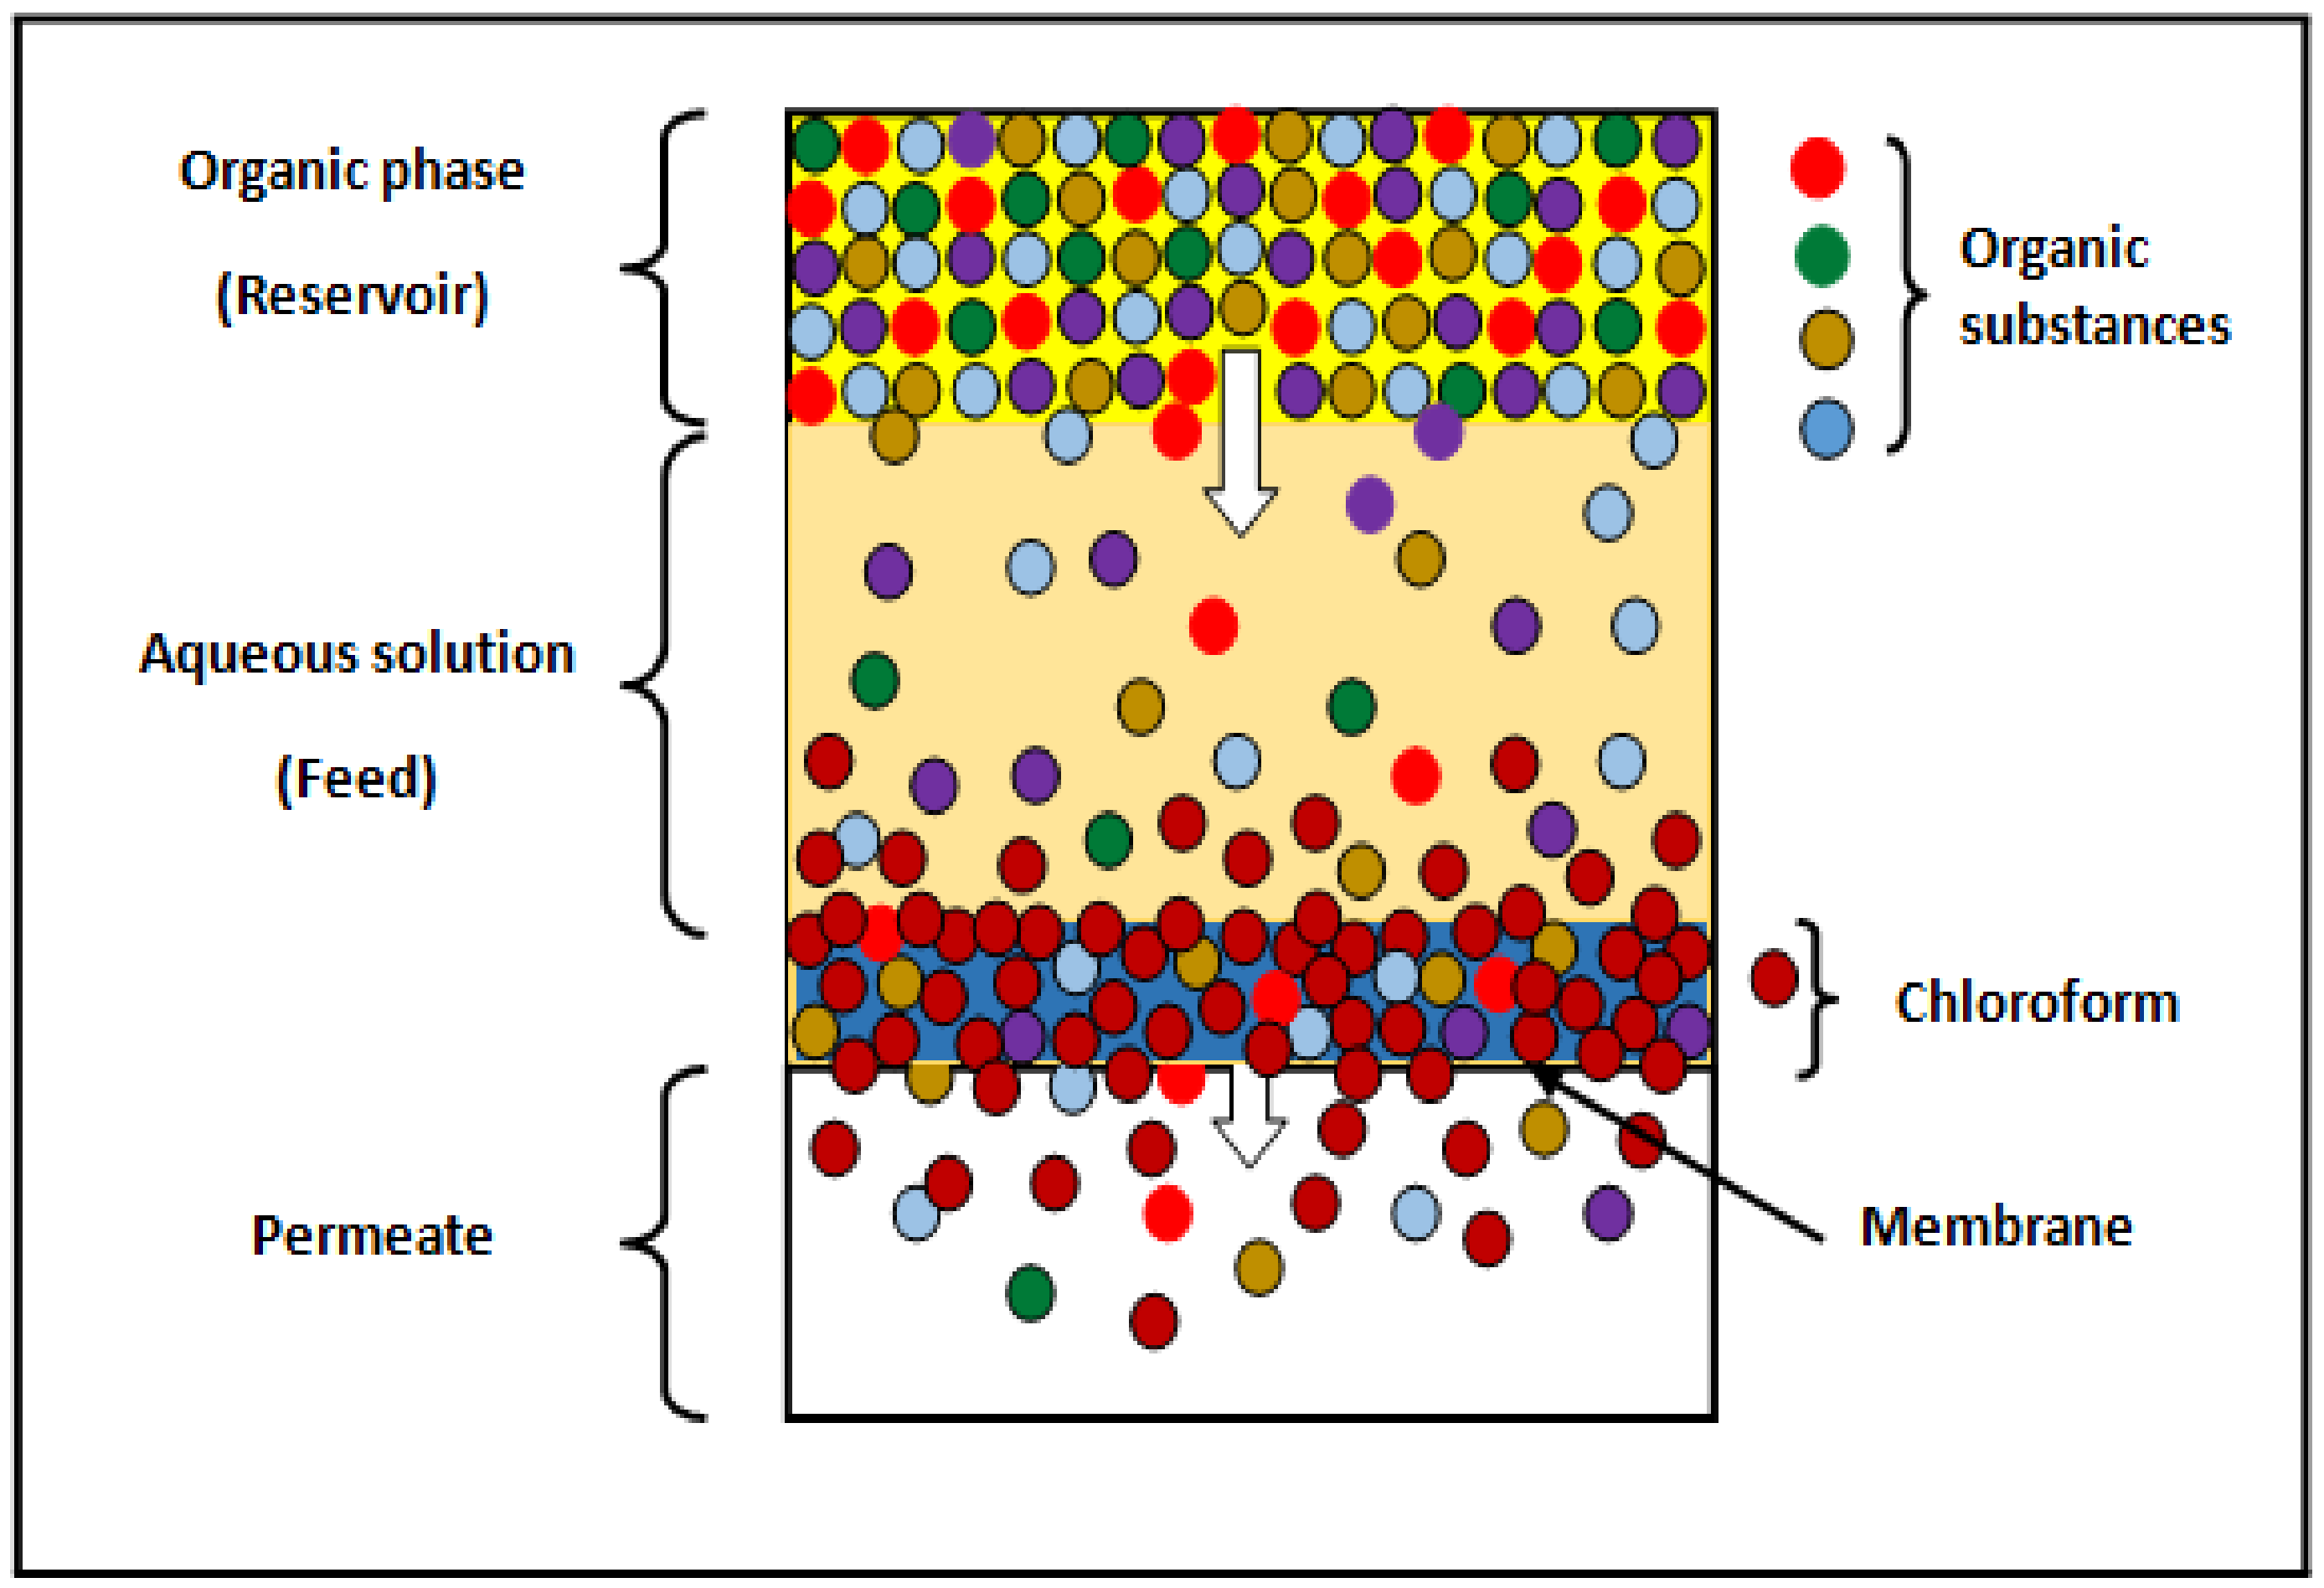
Figure 4). As the thickness of the membrane was increased, the total flux became increasingly stable with time. This is because the flux is relatively high when a thinner membrane is used, leading to rapid depletion of the organic mixture, in which the heavy phase in contact with the membrane contains mainly chloroform (Scheme 3). Therefore, the flux also decreases rapidly with time of the separation process. By contrast, a thicker membrane results in a lower total flux and slower depletion of the feed in the organic components. This leads to pseudo-stability of the concentration of organic compounds in the feed at its minimum. The higher total flux observed immediately after starting the separation process was mainly due to the large amount of organic solvents absorbed by the membrane before the pervaporation process was run (−20 min).
Figure 5 reveal for all membranes used a decrease in the selectivity versus time which is more marked when the thickness was 480 and 510 μm. The drop in selectivity is mainly due to the depletion of the organic compounds in the feed. This was confirmed by observation at the end of the separation process, because after 2 h there were practically no organic components were found in the feed when the membrane thickness was 260 μm and 6 h with the thickest membrane (510 μm). At the start of the separation, the heavy phase rich in chloroform (density = 1.48 g·cm−3), which is immediately in contact with the membrane, favored by its relatively high affinity and relatively lower stirring rate (260 rpm), mainly passes into the permeate then comes thiophene (density = 1.05 g·cm−3) and finally the rest of the organic compounds.
Regarding the variation of the selectivity with the membrane thickness (inset in Figure 5), the curve profile indicates a significant increase in which a maximum selectivity of 2988 is reached for the 510-μm-thick membrane during a period of 1.5 h of the separation process. The increase of the selectivity with the increase of the membrane thickness agrees with comparable results reported in the literature [62,63,64,65].
With membrane thicknesses of 480 μm or more, the transit path of chloroform and other organic components through the membrane is long, this reduces the rate of exhaustion and therefore the separation period is slower. Hence, the selectivity of the membrane is governed only by molecules in the membrane and not by other factors, such as the rapid depletion of one component of the feed. In this case, the selectivity depends only on the membrane thickness, as it increased with increasing thickness. 
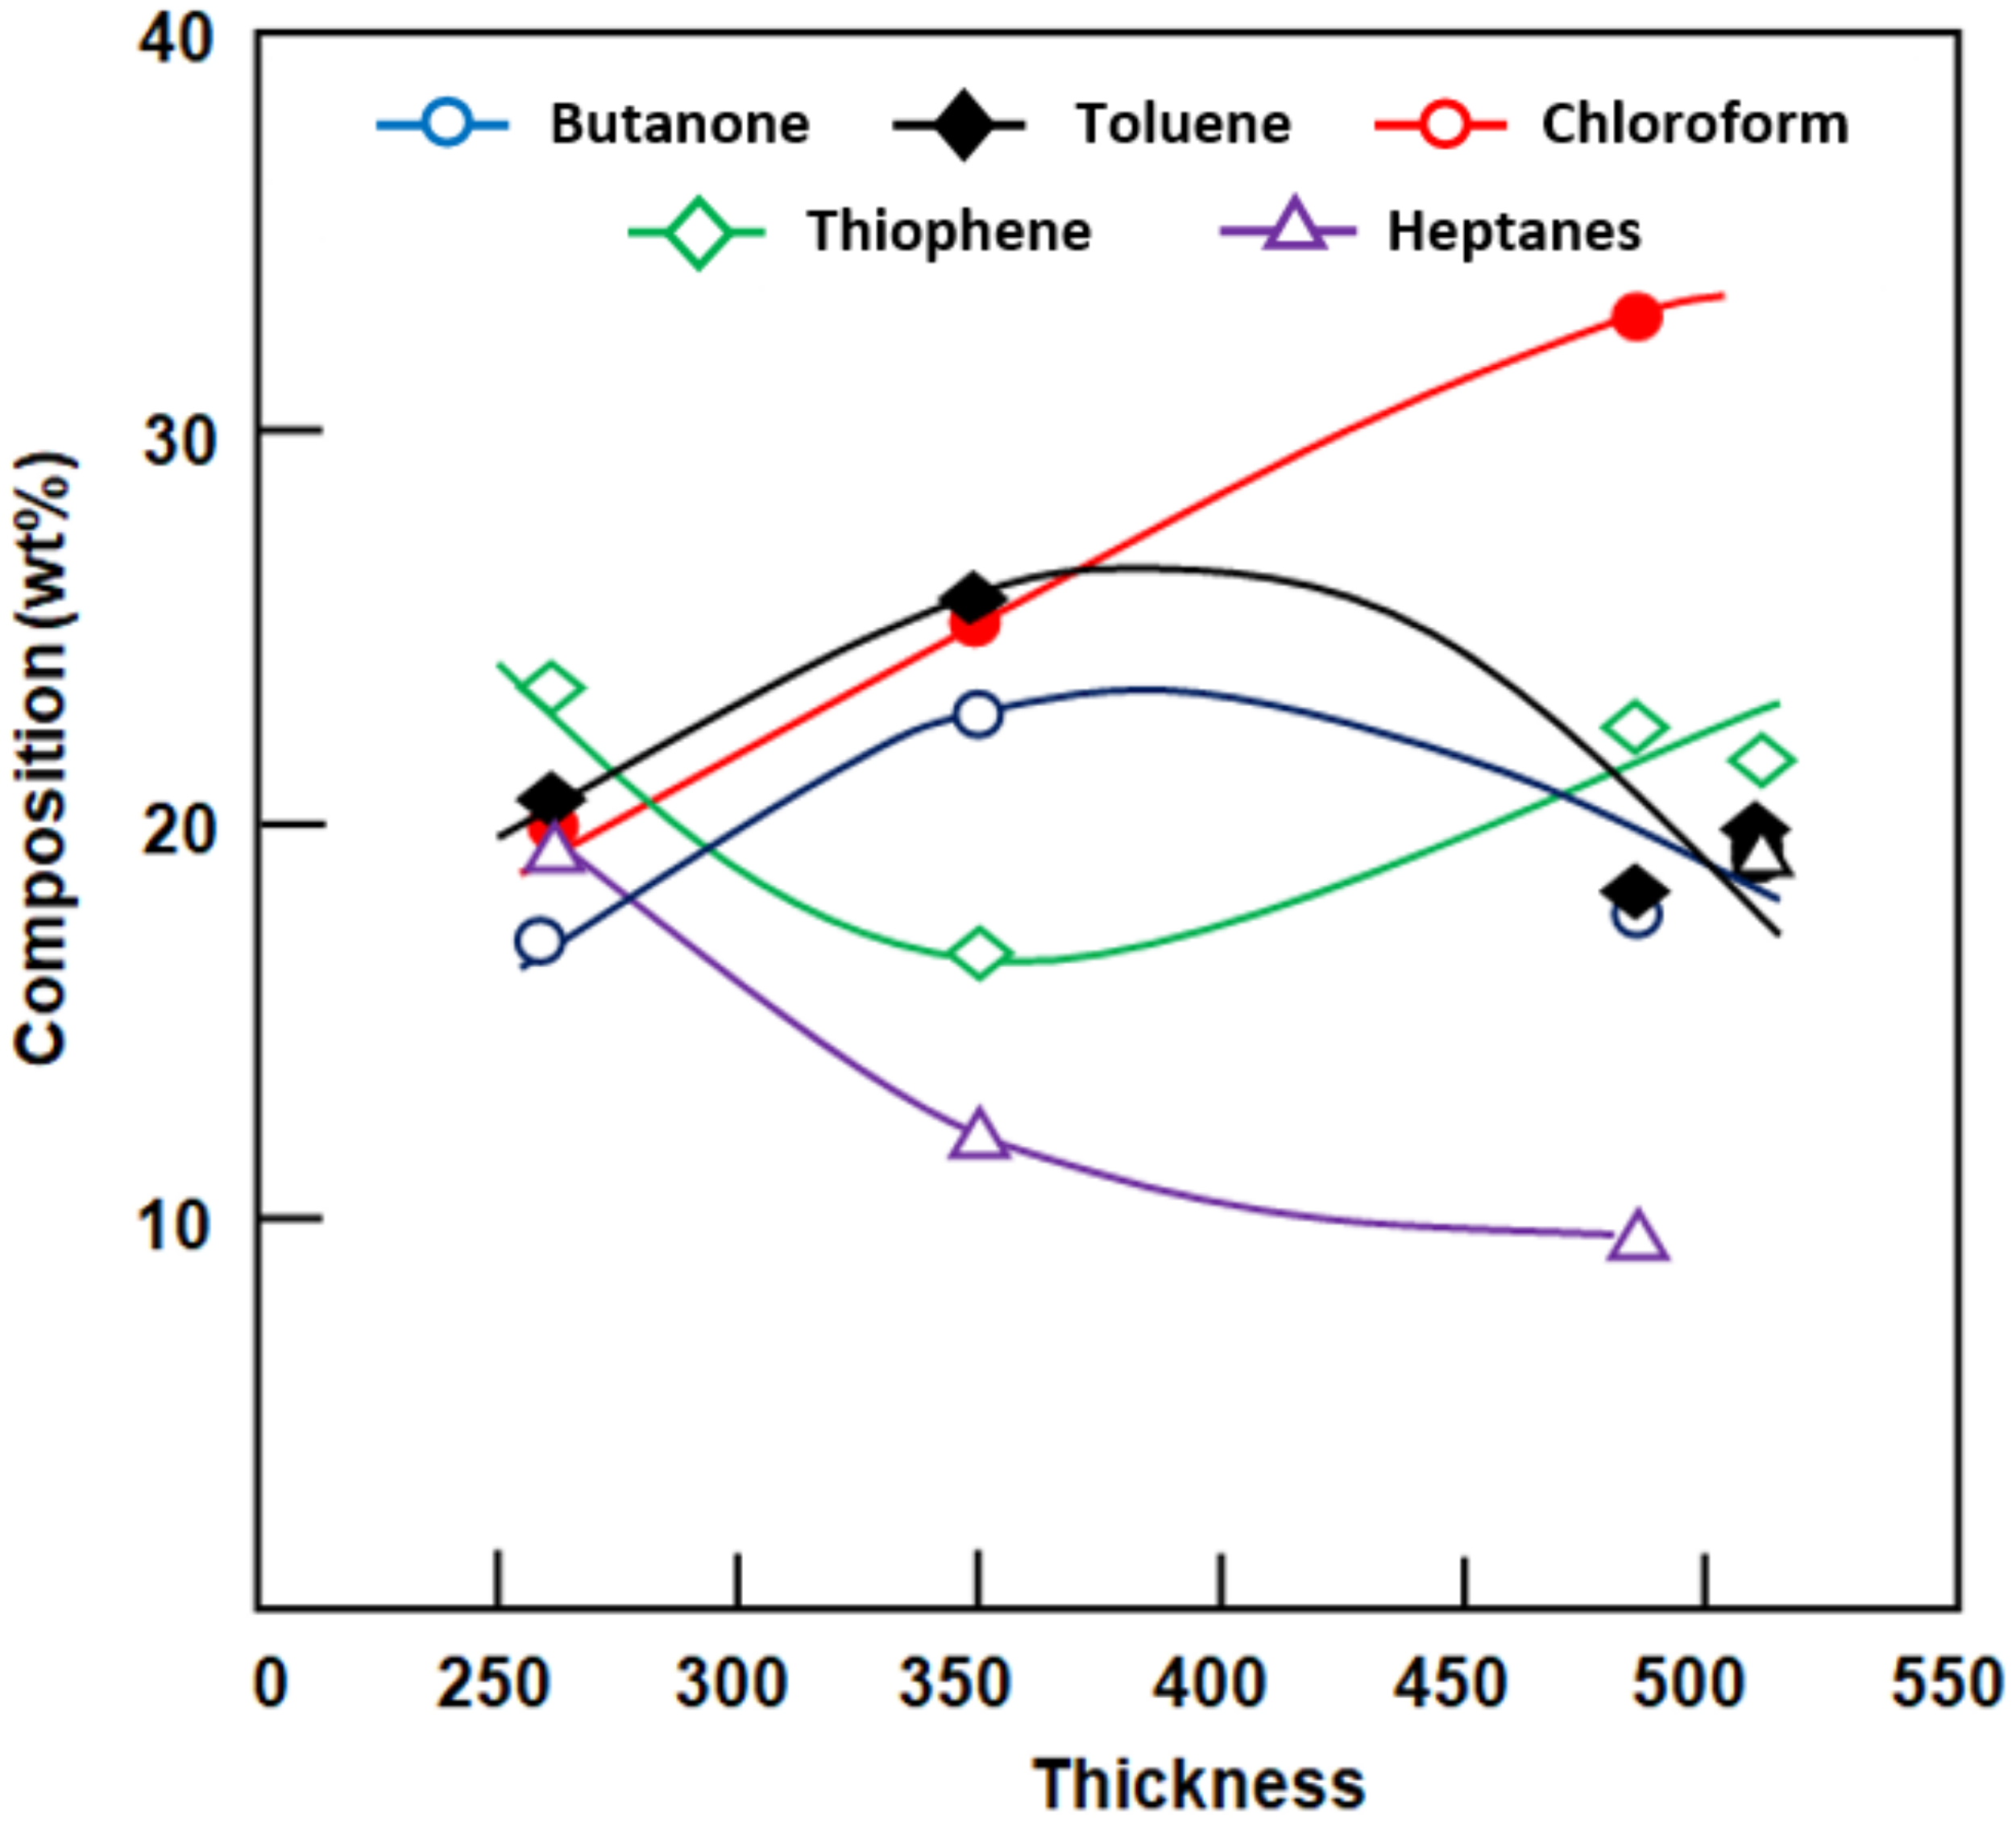
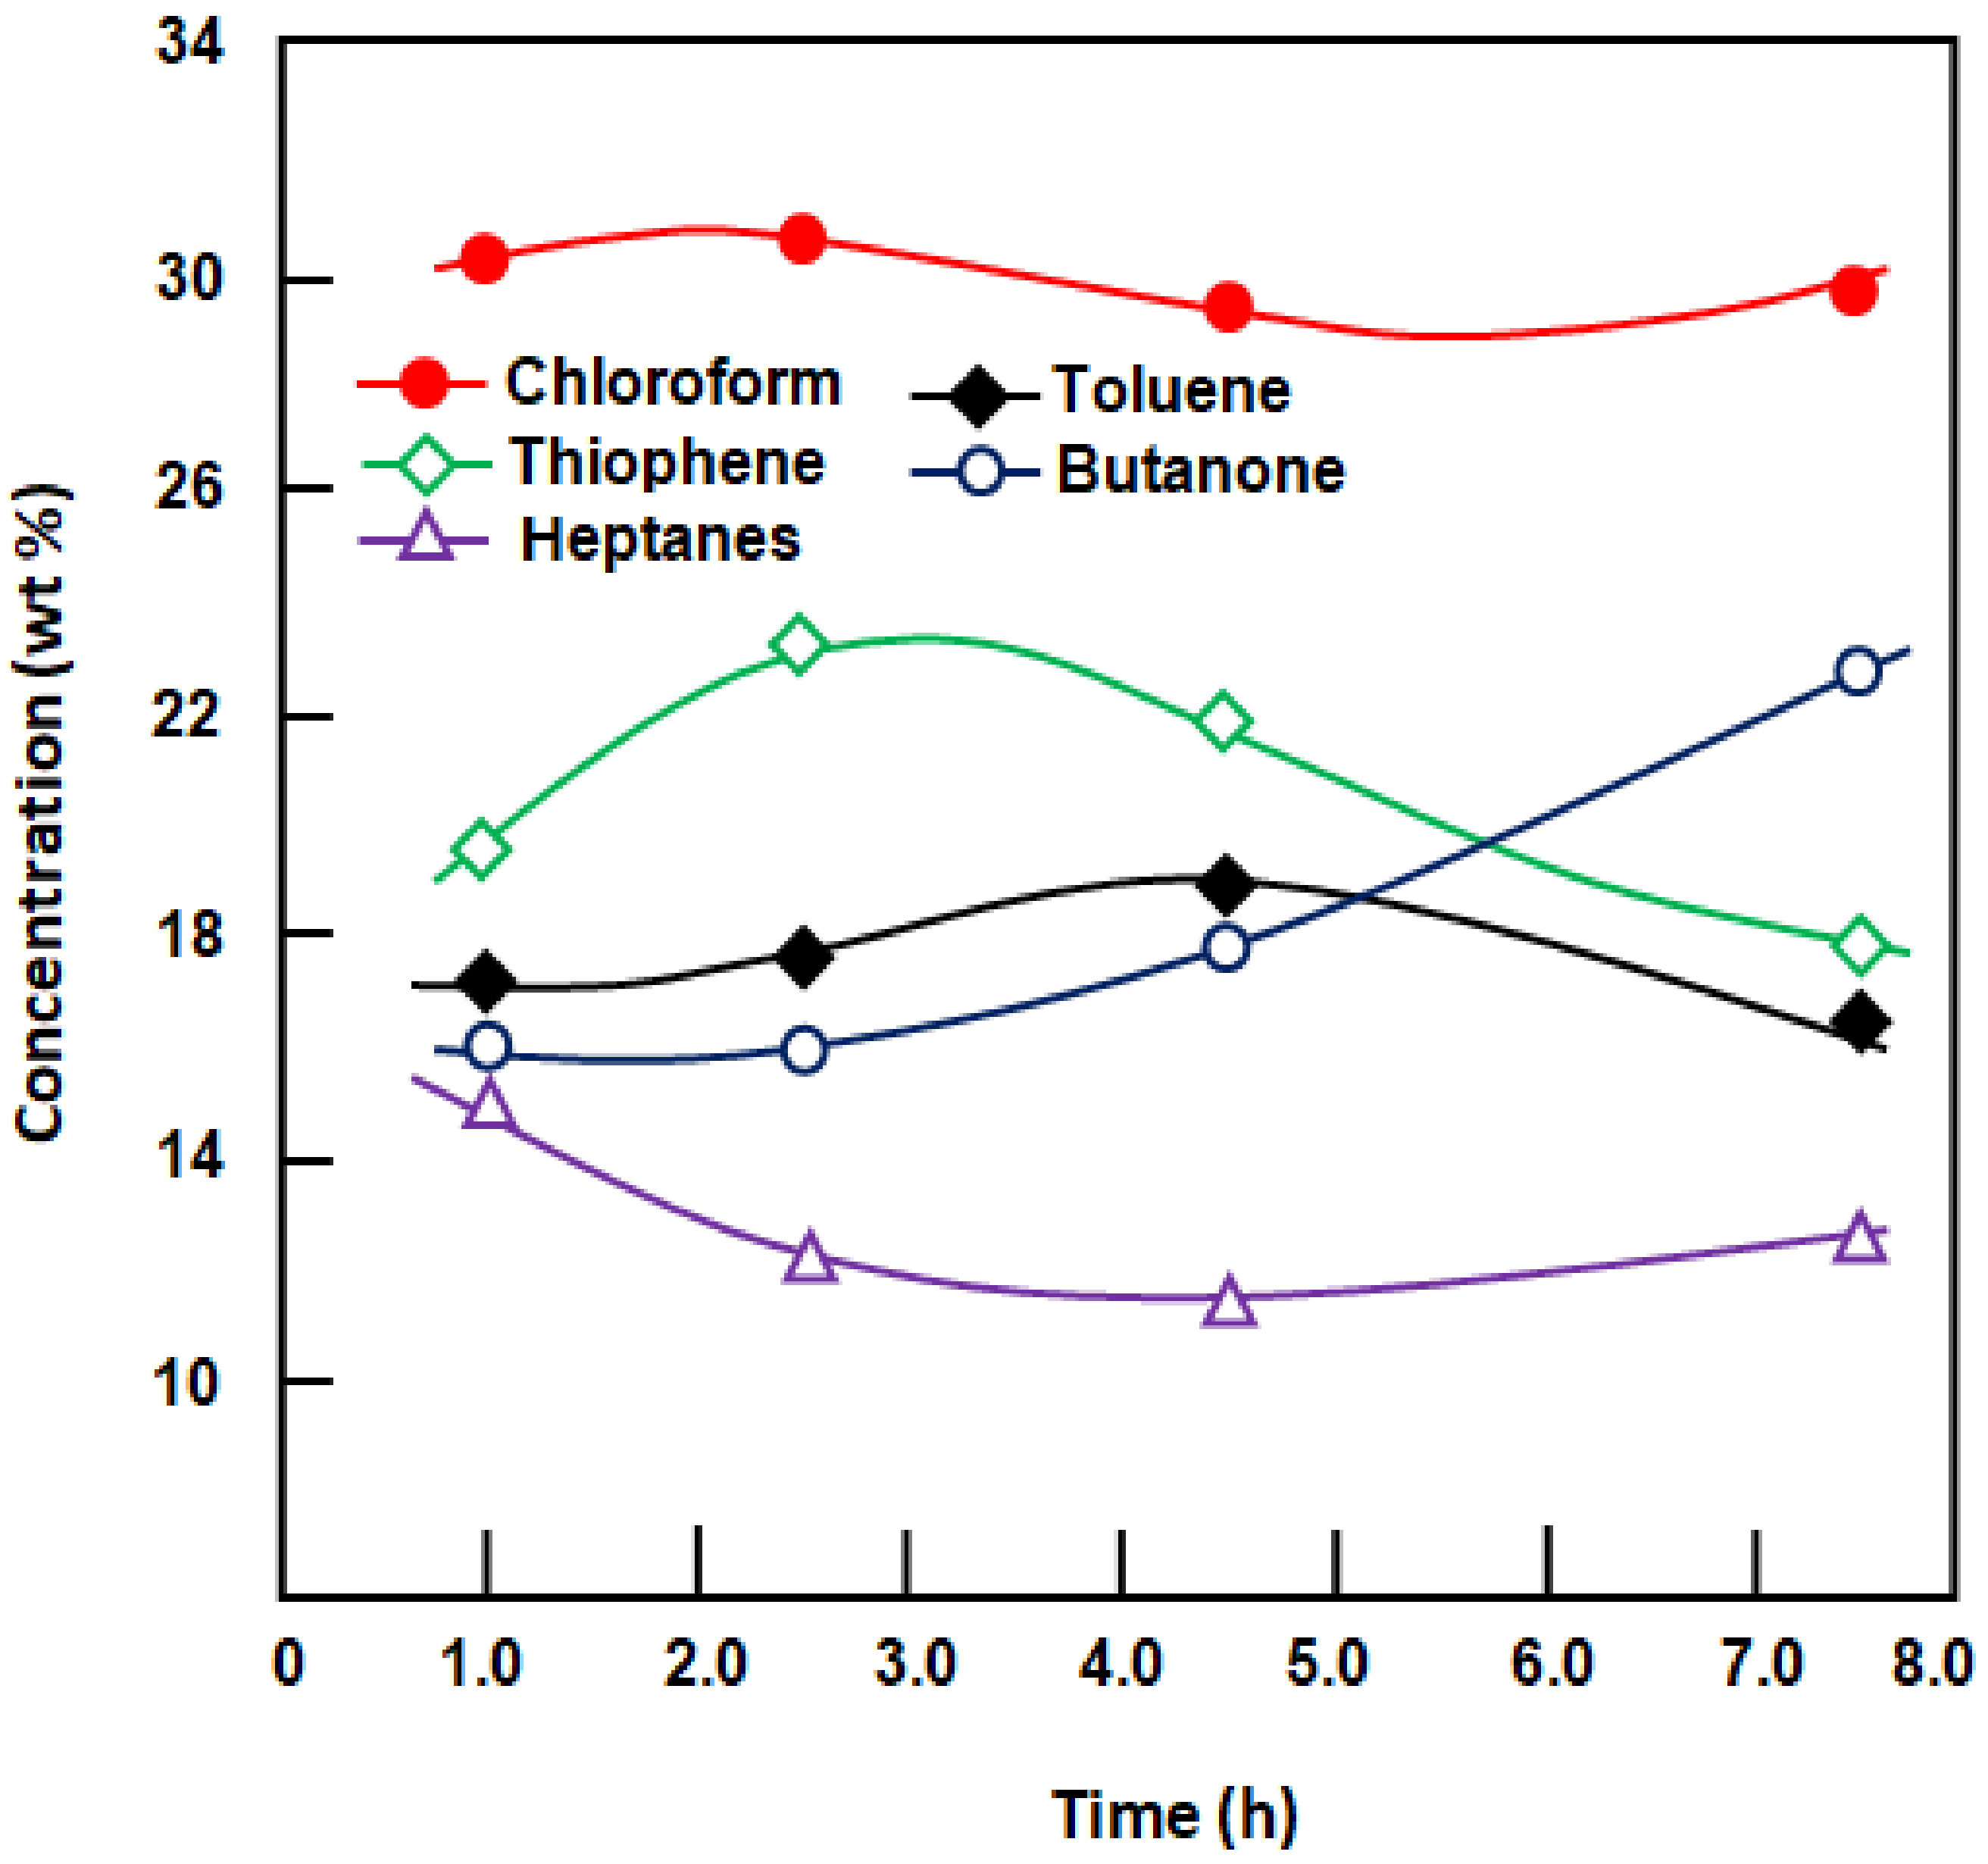
Figure 6 shows results of the quantitative analysis of the permeate using gas chromatography during the 1.5 h separation process using membranes of different thicknesses.
Over this period, the fraction of each component in the permeate did not follow a general rule when the membrane thickness was varied. For example, the toluene and butanone concentrations followed a similar trend, reaching the maximum when the membrane thickness was approximately 400 μm. By contrast, the concentration of chloroform increased linearly, reaching the highest concentration of 33 wt.%, thus confirming the high total flux and high selectivity of the organic mixture obtained. During this time, the concentration of heptanes decreased slowly, reaching the lowest value of 9.85 wt.% with the thickest membrane. A slight change in the concentration of the other components in the permeate was observed when the membrane thickness was the minimum and maximum.
(B)
Effect of the Stirring Rate on the Extraction Performance
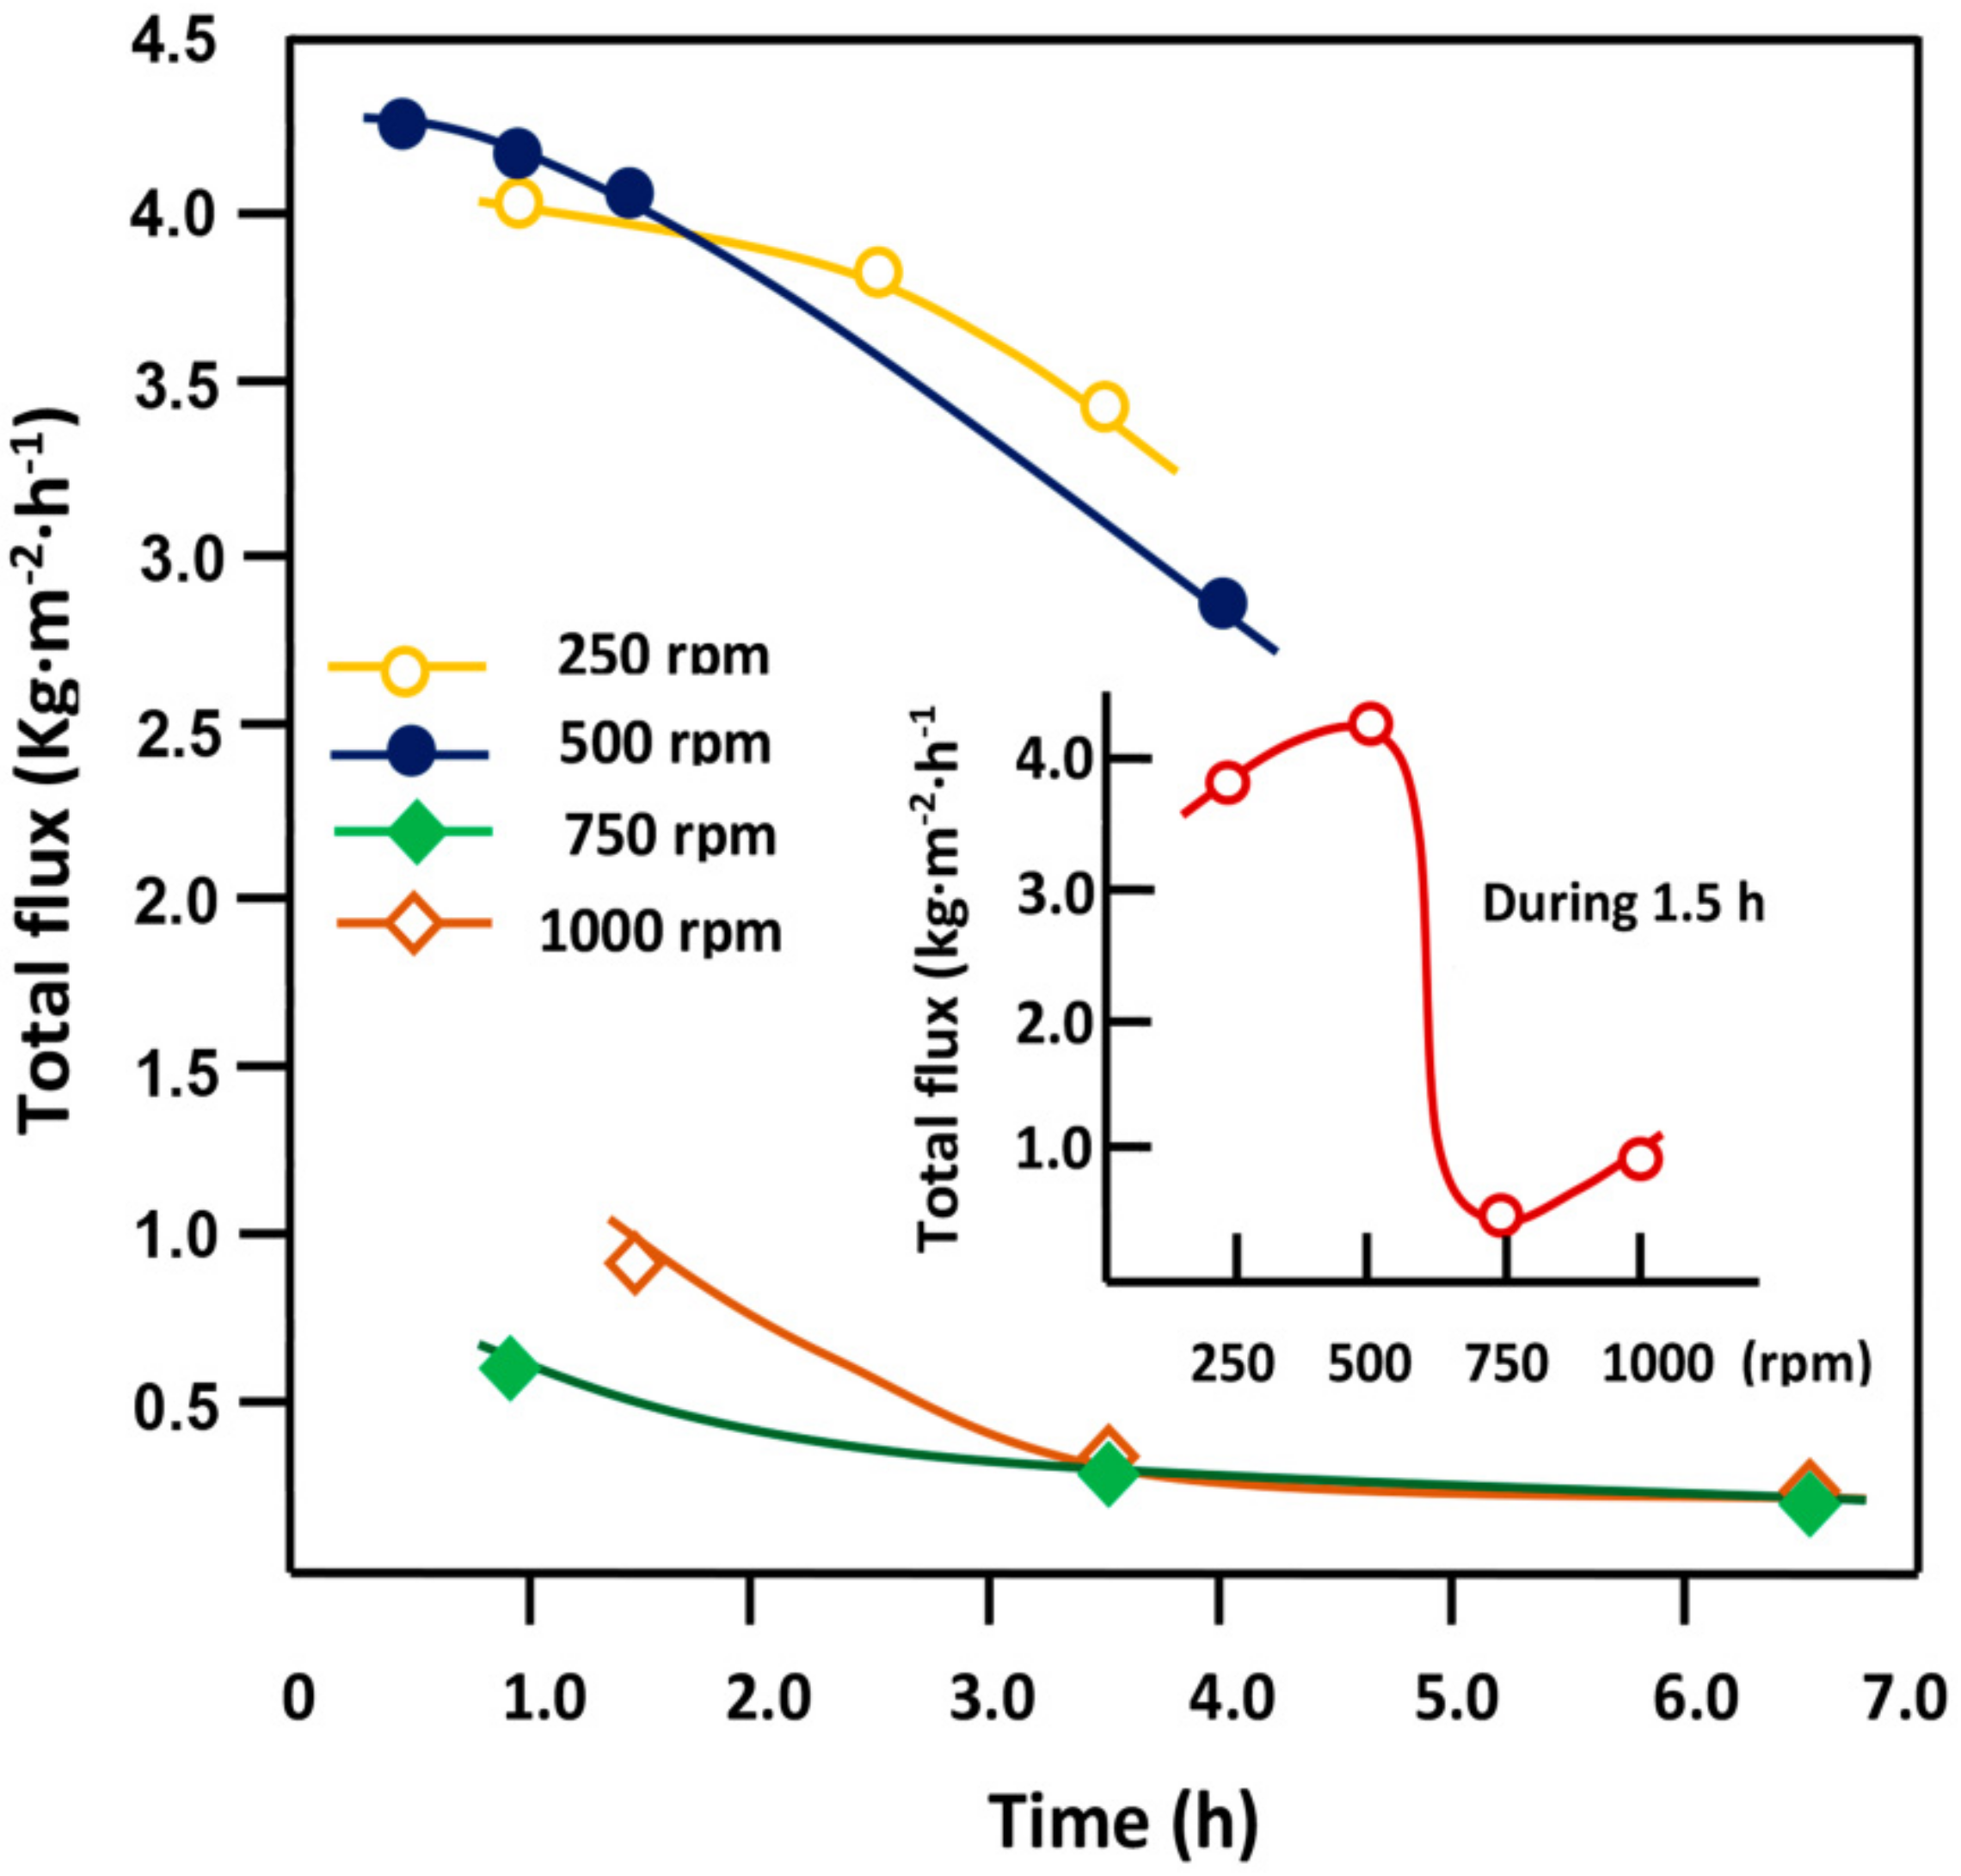
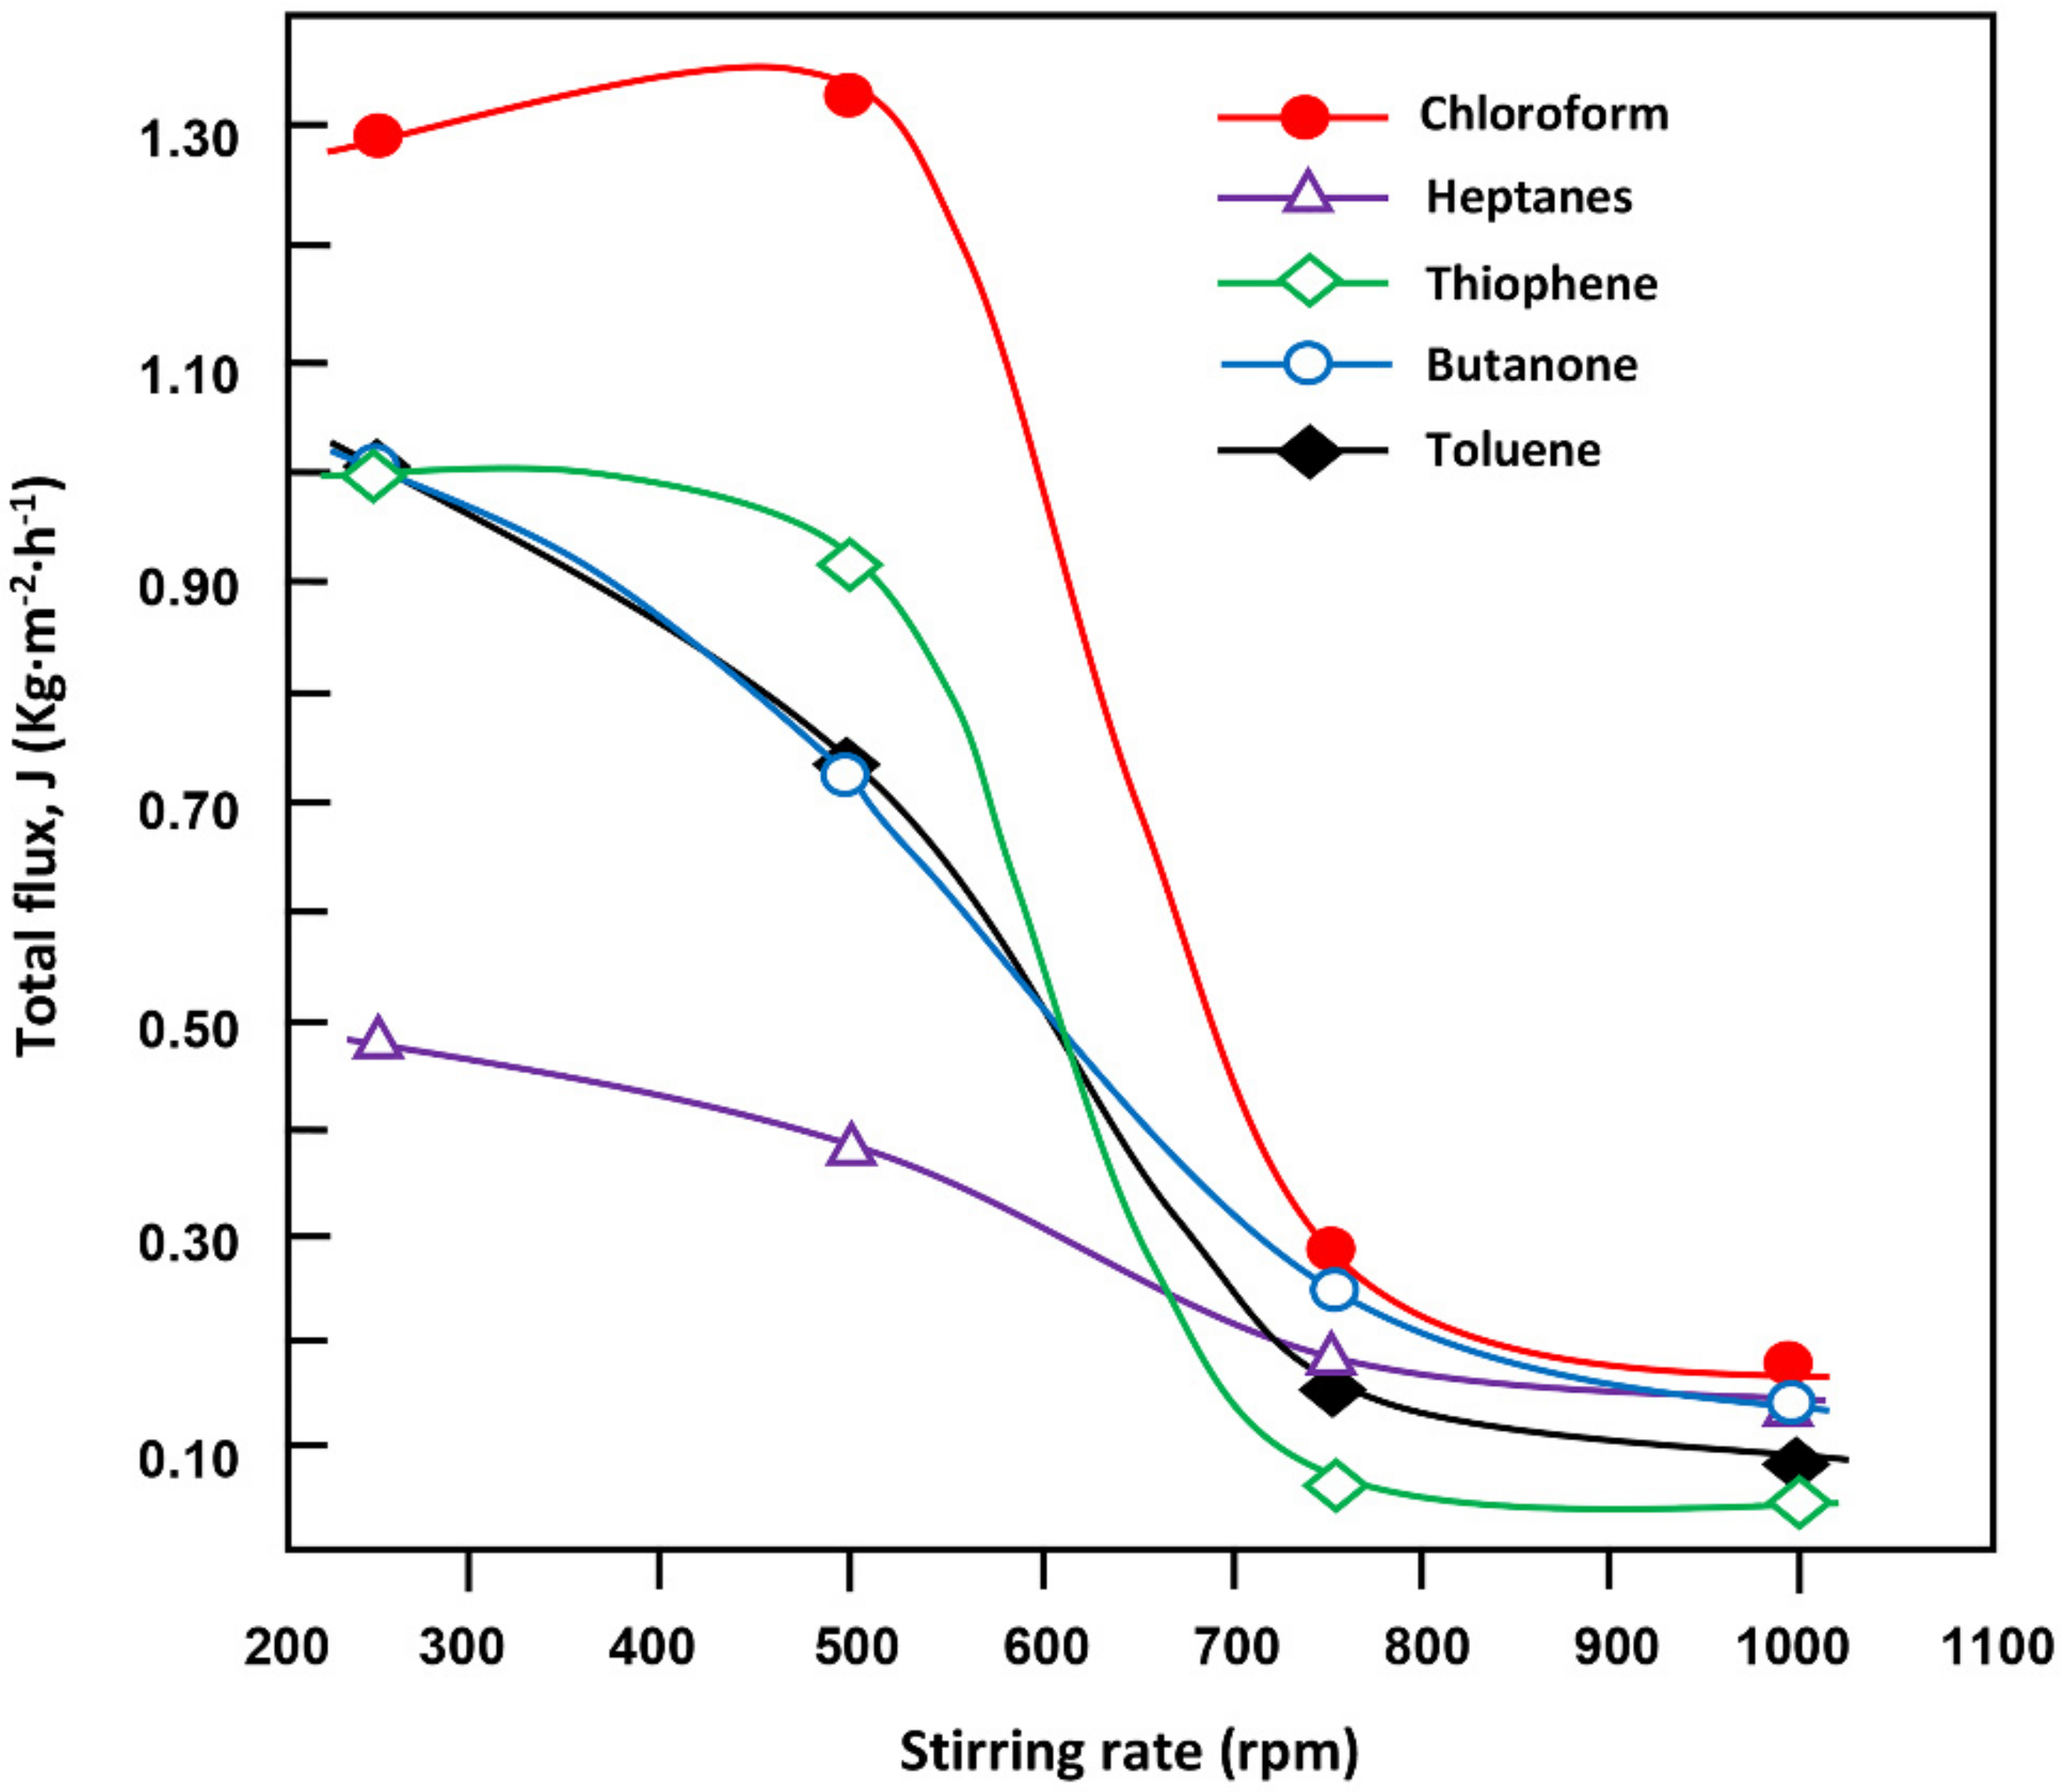
When the mixture to be separated contains three heterogeneous phases, the effect of stirring (mixing) should be considered. Therefore, it is essential to study the influence of the stirring rate on the pervaporation parameters. Accordingly, this study examined the effect of stirring at stirring rates of 250, 500, 750, and 1000 rpm with the temperature and membrane thickness maintained at 20 °C and 260 µm, respectively. Figure 7 and Figure 8 present the total flux and selectivity obtained, respectively. The total flux decreased with time and stabilized to a minimum of 0.30 kg·m−2·h−1 at 3.5 h when the stirring rate was greater than or equal to 750 rpm (Figure 7). The best performance was obtained at a low stirring rate (250 and 500 rpm), in which the total flux reached 3.9–4.0 kg·m−2·h−1 during 1.5 h. This is because a stirring speed less than or equal to 500 rpm is insufficient to make a more homogeneous ternary mixture from a heavy organic phase rich in chloroform, an intermediate aqueous phase rich in water, and a light organic phase (heptanes/toluene/butanone). Under these conditions, the superior affinity of chloroform with respect to the membrane and its direct contact with the membrane promotes an increase in total flux. At a higher stirring rate, however, water in its majority and thiophene, which have practically the same density (1 and 1.05 g.mL−1), in the middle phase at a slow stirring rate, come into contact with the membrane to produce a hydrophilic barrier that reduces the total flux significantly.
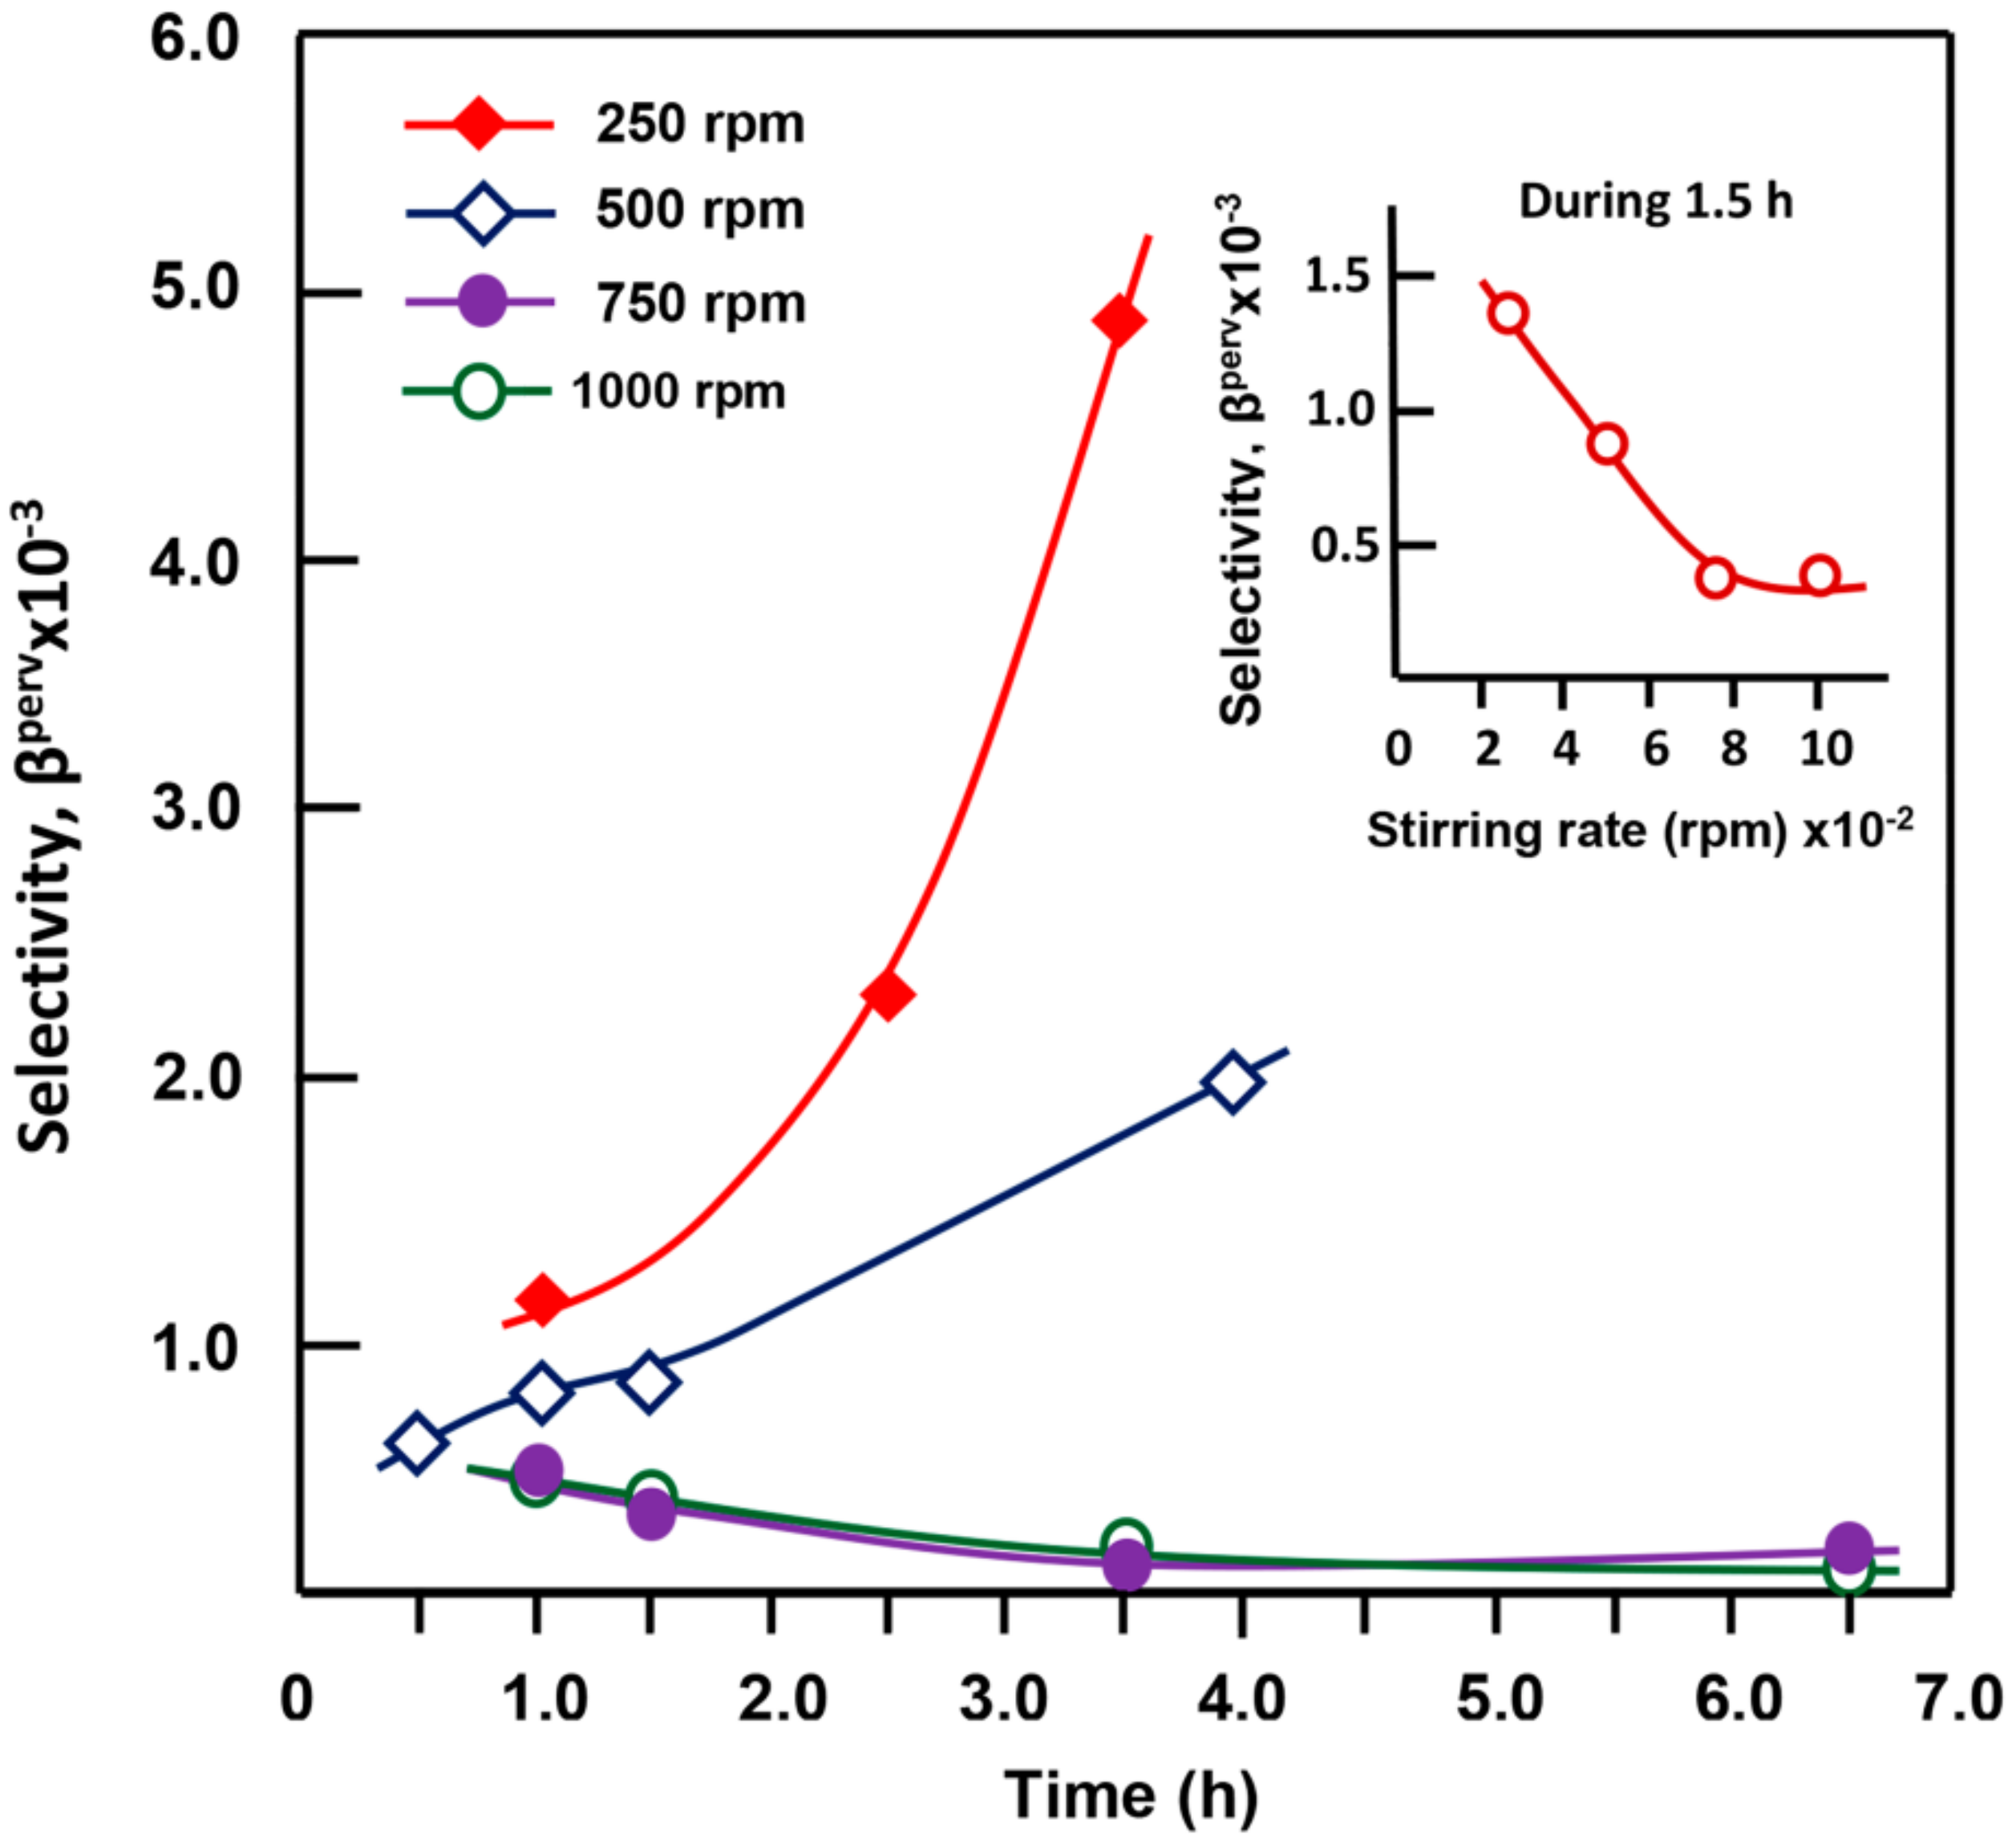
Figure 8 illustrates the effects of the stirring rate on the selectivity toward the organic mixture with respect to water. The selectivity as a function of time at different stirring rates diverged practically from the same region characterized by the selectivity varying between 450 and 995, depending on the stirring rate, reaching 4900, 2000, 200, and 200 after 3.5 h at stirring rates of 250 rpm, 500, 750, and 1000 rpm, respectively. At a stirring rate less than or equal to 500 rpm, the selectivity increased, with a significant increase observed at 250 rpm. By contrast, for stirring rates of 750 and 1000 rpm, the selectivity was minimal and followed a similar trend: a slow decrease with time to 100 to 3 h and relatively constant thereafter. These results can be explained in a similar manner to that of the total flux observed in the previous section. The selectivity increased at lower stirring rates because of the chloroform-rich phase that remained at the bottom of the feed and could be absorbed readily by the membrane. Figure 9 illustrates the variation of the cumulative flux of each organic component in the permeate versus the stirring rate during 1.5 h. All the curves have practically the same profiles describing sigmoids of degree of curvature varying according to the nature of the organic component when the agitation reached 500 rpm. Indeed, the cumulative flux of each organic component decreased irregularly with the stirring rate of the feed. This was expected because the presence of three distinct phases affects the separation process as previously showed in Figure 1. For example, chloroform, which was at the bottom in direct contact with the membrane was the most enriched component in the permeate at any stirring rate, the cumulative flux of this component in the organic mixture reached a pseudo stability at its maximum of 1.29–1.31 kg·m−2·h−1 at lower stirring rate (≤500 rpm) then dramatically decreased to reach a minimum of 0.17 kg·m−2·h−1 at 1000 rpm. Thiophene (density, 1.05 g·cm−3) in the middle, butanone (density, 0.80 g·mL−1) and toluene (density, 0.867 g·mL−1) being above in the feeds have substantially similar values of cumulative flux at minimum stirring rate then decrease together, diverging to finally achieve comparable pseudo-stabilities at stirring rate equal or greater than 750 rpm. Heptanes (density, 0.684 g·mL−1) which is poorly soluble in water (solubility, 0.003 g·mL−1), although it shows the best affinity with the PDMS membrane (Δδ = 0.6 cal0.5·cm−1.5) shows the lowest flux values at any stirring rate. This indicates that the density of the compound to be separated played a primary role in separating these components from water notably at low stirring rates.
Increasing the stirring rate from 250 to 500 rpm did not appear to destroy this phase equilibrium. Under these conditions, most of the chloroform which is placed at the bottom of the feed coming into direct contact with the membrane and is absorbed immediately. A relatively slow decrease in toluene flux followed by stability was similar to that of butanone observed in the permeate when the stirring rate was increased. For these two components initially found mainly in the upper phase because of their low densities, the increased agitation at 750 and 1000 rpm was not enough to place the components in contact with the membrane. For thiophene, which has a similar density to that of water, a fraction of this component remains in the middle of the charge forming a pseudo-emulsion with water, and another fraction dissolves in chloroform because of the smaller difference in the solubility parameters between them [∆δ = 0.6 (cal·cm−3) 0.5]. Under these conditions, a stirring rate of 250 rpm was sufficient to increase the contact between the thiophene molecules and the membrane, causing a 7% by weight increase in thiophene concentration in the permeate compared to its initial concentration in the feed (20 wt.%). At a higher stirring rate, the concentration of thiophene in the permeate decreased significantly to a minimum of 7.8% by weight at 1000 rpm in favor of the concentration of heptanes, which increased symmetrically with increasing thiophene concentration, indicating a close link between these two components.
At a higher stirring rate, pseudo-homogenization of the five components occurs, leading to a large fraction of heptanes down the feed, which are absorbed immediately by the membrane because of their excellent affinity with the membrane [∆δ = 0.6 (cal·cm−3) 0.5]. However, a significant fraction of thiophene rises to the top of the feed.
(C)
Effect of Temperature on the Total Flux and Selectivity
Effects of temperature on the membrane performance in separating organic compounds from water have been investigated [37,66,67]. In general, the total flux increased with temperature, but the selectivity of the membrane decreased. For example, Byrne [68] used PDMS membranes to extract ethyl acetate, methyl isobutylketone, methylethylketone, and aniline at temperatures ranging from 50 to 80 °C. They reported that the most successful separations, in terms of selectivity and flux, were obtained for methyl isobutyl ketone–water at 80 °C, in which 774 and 0.40 kg·m−2·h−1, respectively, were reached.
In this study, temperature had a significant effect on the pervaporation parameters for this ternary system. This is because an increase in temperature for an organic/water-immiscible system leads to an increase in the solubility of organic components in water, resulting in the enrichment of water in the organic component. This helps facilitate the transfer of a fraction of the organic components concentrated in the upper phase (toluene, heptanes, and butanone) to the lower phase rich in chloroform, which will then be absorbed easily by the membrane.
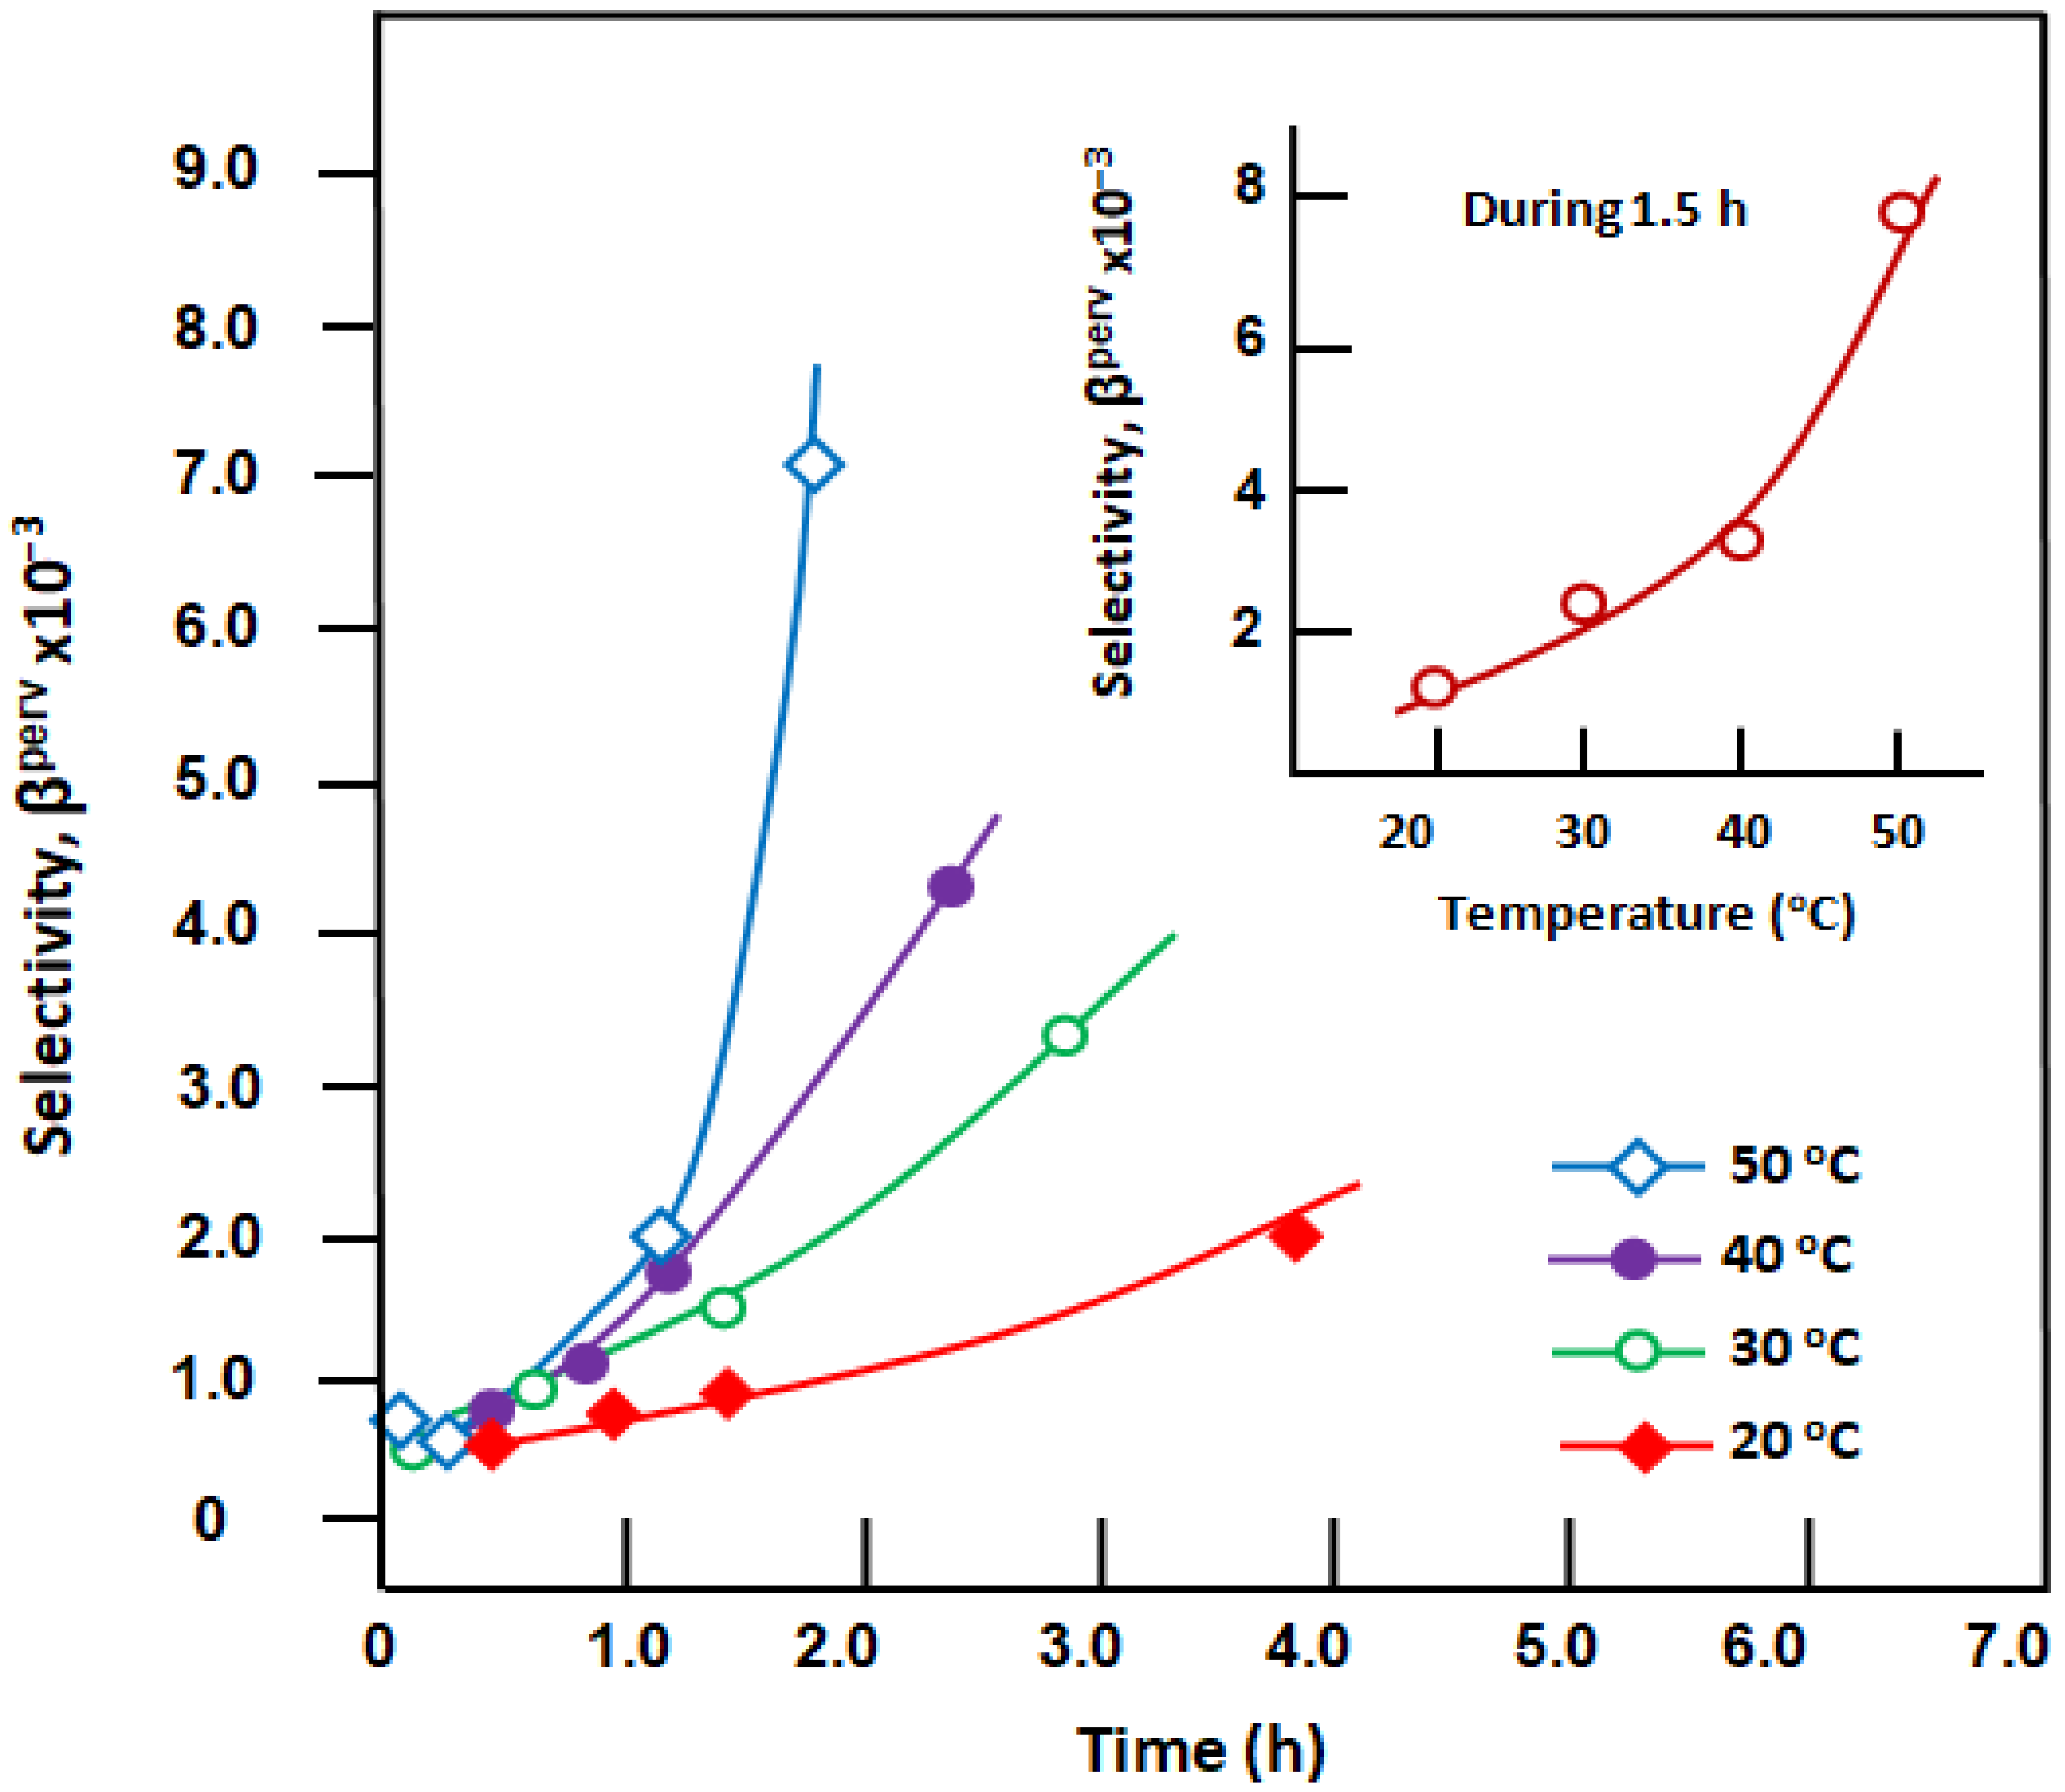
This section reports the selective separation of an organic mixture from water using the optimal conditions, which are a membrane thickness of 260 μm and a stirring rate of 250 rpm, by varying the temperature between 20 and 50 °C covering seasonal temperatures in KSA. Figure 10 and Figure 11 present the total flux and selectivity of the membrane with time of the separation presses at different temperatures, respectively. At all temperatures investigated, the total pervaporation flux decreased with time after pseudo-stabilization at 2.73–3.30 kg·m−2·h−1 between 0.5 and 2 h (Figure 10), except for the processes carried out at 20 °C, in which the total flux decreased continually with time. The pseudo-stability of the total flux during this period was attributed to pseudo-stabilization of the concentration of organic compounds dissolved in water. Indeed, the concentration of organics in water was at a steady state due to the continuous dissolution of organic components from the organic phase at the top of the feed. After approximately 2 h of separation, the decrease in total flow was probably due to the exhaustion of organic substances in the feed, in which their concentration continued to decrease, leading to a decrease in the organic content in the permeate. During 1.5 h of the separation process, J decreased significantly with temperature, reaching a minimum of 2.96 kg·m−2·h−1 at 30 °C followed by a slight increase, reaching a total flux of 3.10 kg·m−2·h−1 at 50 °C (inset in Figure 10). Overall, the best performance of the total flow was obtained at a temperature close to ambient temperature (20 °C).
The complexity of the system and its behavior during the separation process, i.e., the irregularity of the variations of the total flux with temperature, did not allow a determination of the activation energy through the flux according to the Arrhenius equation.
The selectivity of the membrane toward the organic mixture with regard to water increased gradually with time (Figure 11), diverging from the same point characterized by a selectivity of −600 regardless of the temperature to reach a significant value of 7200 when the temperature was increased from 30 to 50 °C. During the first 1.5 h of the process, the selectivity increased from 1130 to 7810 when the temperature of the mixture was increased from 20 to 50 °C. This phenomenon was attributed to an increase in the solubility of the organic components with increasing temperature, particularly the slightly polar components. Although the selectivity decreased with increasing temperature, this remark was only valid in the case of miscible mixtures, which was not part of this case.
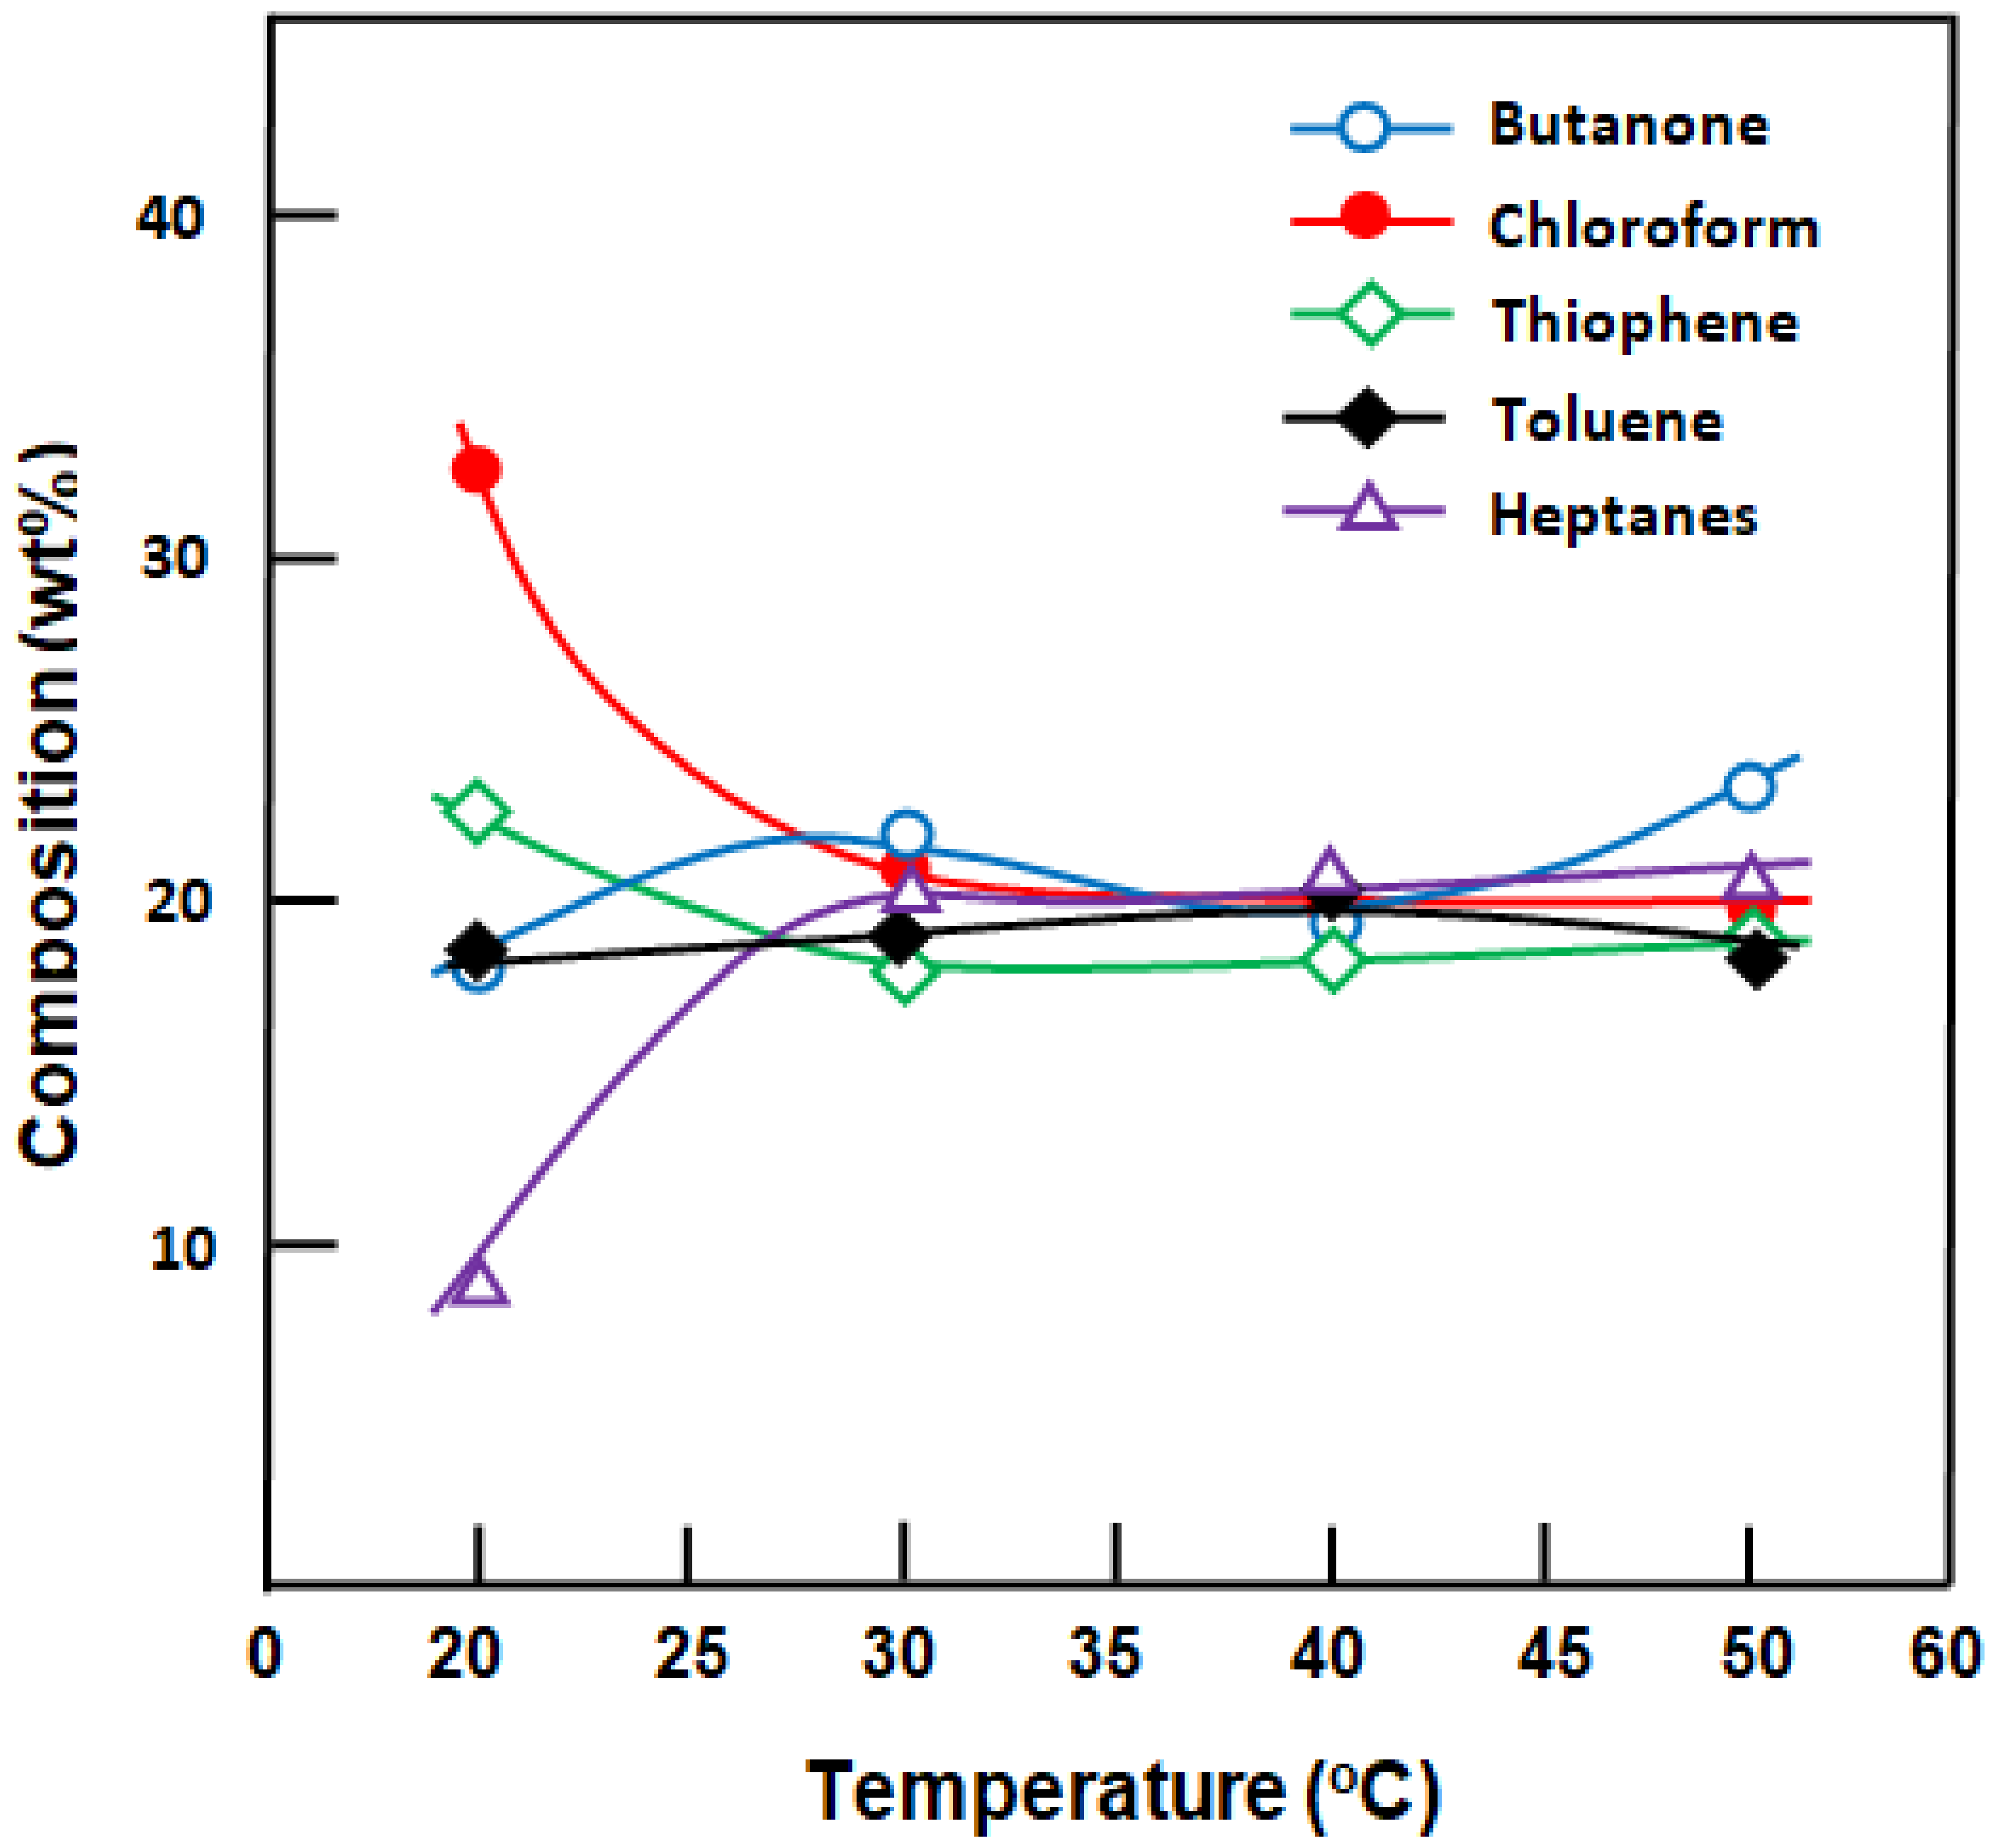
The composition of the organic mixture in the permeate during 1.5 h of separation was analyzed quantitatively (Figure 12). The profiles of these curves clearly indicate the best enrichment of the organic mixture in chloroform when the separation process was carried out at 20 °C. Indeed, the concentration of this component increased initially from 20 wt.% in the feed to 32.5 wt.% in the permeate, resulting in a significant decrease in the mass percentage of heptanes from 20% to 9.5% by weight. In this case, a stirring rate of 250 rpm was insufficient to homogenize the dispersion of the organic mixture in the feed. Therefore, as reported in previous sections, most of the chloroform remained at the bottom of the feed in direct contact with the membrane. At higher temperatures, the composition of the mixture converged toward that at the start, from 30 to 50 °C, which oscillated between 19 and 24 wt.% depending on the nature of the component. The following two essential factors can explain the pseudo-stability of the composition of each organic component in the permeate extracted at higher temperatures: (i) an increase in free volume between the PDMS chains constituting the membrane and (ii) an increase in the solubility of the organic mixture in the aqueous phase when the temperature increases, thereby promoting the transfer of all organic molecules non-selectively.
(D)
Organics/Water–SILICONE1200 Membrane Performance
Identification of the necessary conditions is crucial for achieving the best performance in the pervaporation parameters using the SILICONE1200 membrane to extract VOCs from wastewater. Indeed, the best performance of this membrane during the 1.5 h period was obtained when the membrane thickness, stirring rate of mixing, and temperature of the feed were 260 μm (higher total flux) (Table 9), 500 rpm (higher selectivity) (Table 10), and 50 °C (higher selectivity) (Table 11), respectively.

3.2.2. Pervaporation Using the Dynamic Process

The optimal performance in terms of pervaporation parameters was obtained using a membrane thickness of 260 μm, a stirring rate of 250 rpm, and a temperature of 50 °C. These conditions were also applied to remove organic compounds from wastewater through a dynamic process (Scheme 1). To achieve this goal, the composition of the organic mixture and water in the feed was constant during the separation process. This was possible because of the continuous circulation of 3 L of the organic-water mixture from the reservoir to the pervaporation cell, and vice versa. Figure 13 presents the total flux and selectivity of the SILICONE1200-260 μm membrane as a function of time during 12 h of separation. The total flux and the selectivity of the membrane toward the organic mixture with regard to water were relatively constant during the separation process. This was expected because in the dynamic mode, the concentration of each component, including that of water in the feed, remains relatively constant throughout the separation process. Moreover, the extracted part is considered to be minimal compared to that remaining in the reservoir. Indeed, the fraction of the mixture extracted from the feed is renewed continually by another from the reservoir. This way, the flux and selectivity decreased slowly until the organic components in the reservoir were depleted or when the water in the reservoir was cleaned entirely from the organic pollutants.
Selectivity of the SILICONE1200 membrane toward each component in the organic mixture.
Figure 14 presents the results of the quantitative analysis by gas chromatography of the permeate to understand the membrane selectivity better with respect to each component of the organic mixture.
The concentration of these components in the permeate followed a similar order to that carried out during 1.5 h in the static mode under the same conditions (temperature of 20 °C and stirring rate of 250 rpm) (Figure 12). As explained previously, this order is governed mainly by two factors: the density of each component and the chemical affinity between the membrane and each component. Indeed, the chloroform concentration was relatively stable at approximately 30 wt.% throughout the separation period, indicating approximately 50% enrichment, from 20 wt.% in the feed to 30 wt.% in the permeate. At this same time, the concentration of heptanes decreased by 30%, from 20 wt.% to 13.20 wt.%. Table 12 lists the concentration of each organic component in the permeate and the selective absorption factor of the membrane ( β i / m i x a b s ) obtained during 1.5 h of separation through the dynamic process along with its starting composition in the feed for comparison. The concentrations of organic components in the permeate and the concentrations of those absorbed from the mixture during the membrane swelling experiments (Section 3.1.2, Table 8) did not follow the same order.
The more selective separation of these organic compounds requires a succession of passages of the permeate on other typically selective membranes for each component. By contrast, the very high selectivity of the organic mixture with respect to water suggests its inexpensive recycling as a solvent mixture used in industry.

4. Conclusions

The economical domestic SILICONE1200 sealer can be used as a pervaporation membrane to extract VOCs selectively from contaminated water with high flux. The optimal conditions of the pervaporation process for achieving the best separation from an organic-water mixture in the static mode in terms of the total flux and selectivity were as follows: membrane thickness of 260 μm, stirring rate of 250 rpm, and temperature of 50 °C. The application of these conditions to the separation of a mixture using the dynamic process led to a constant flux, selectivity, and pervaporation separation index of 8.42 ± 06 kg·m−2·h−1, 122,000 ± 250, and 1.03 × 10⁵ kg·m−2·h−1, respectively. Quantitative analysis of the permeate indicated that the extraction of an organic mixture from organic wastewater using domestic SILLICONE1200 was satisfactory and economical. However, the separation of the components from the organic mixture was far from selective.
These results highlight the potential of the economic recycling of the extracted compounds for use as a solvent in the chemical industry.

Author Contributions

Data curation, W.N.A., W.S.S., A.A.A., A.Y.B.-H.-A. and T.A.; Formal analysis, W.N.A., W.S.S. and A.Y.B.-H.-A.; Funding acquisition, T.A.; Investigation, A.A.A., A.Y.B.-H.-A. and T.A.; Methodology, W.N.A. and T.A.; Project administration, T.A.; Resources, W.N.A. and W.S.S.; Software, W.S.S. and A.Y.B.-H.-A.; Supervision, A.A.A.; Visualization, W.N.A. and A.A.A.; Writing—original draft, T.A.; Writing—review & editing, T.A. All authors have read and agreed to the published version of the manuscript.

Funding

The authors extend their appreciation to the Deanship of Scientific Research at King Saud University for funding this work through Research Group No. RGP-VPP-025.

Institutional Review Board Statement

Not applicable.

Informed Consent Statement

Not applicable.

Data Availability Statement

All the data supporting the findings of this study are available within the article.

Conflicts of Interest

The authors declare no conflict of interest.

Abbreviations

DSSwelling degreeHMEnthalpy of the mixture
woWeight of the membrane before swellingVTotal volume
wtWeight of the membrane swollen during t time χ 1 , p Polymer-solvent Flory Huggins interaction parameter
w Weight of the membrane swollen at equilibriumDThe coefficient of diffusion
γ 1 Activity coefficient of the solventlThe membrane thickness
V1Molar volume of the solventnThe diffusion exponent also called kinetic order
φ 1 Volume fraction of the solvent β p e r v The separation factor
φ 2 Volume fraction of the polymermThe total mass of the permeate
δ p Solubility parameter of the polymerAThe surface area of the membrane
δ 1 Solubility parameter of the solventPoThe total mass of the organic compounds in the permeate
RGas constantPwThe mass of water in the permeate
YiThe weight fraction of the component I in the feedYmixtureThe weight fraction of the total other components in the feed
β i / m i x t u r e a b s The selective absorption of the membrane factor FoThe total mass of the organic compounds in the feed
PSIThe pervaporation separation factorFwThe mass of water in the feed
βThe entropic factorXiThe weight fraction of the component I in the permeate
kThe constant relating the swelling rateXmixtureThe weight fraction of the total other components in the permeate

References

  1. Wang, H.; Liu, S.; Du, S. The Investigation and Assessment on Groundwater Organic Pollution. Org. Pollut. Monit. Risk Treat. 2013, 87. [Google Scholar] [CrossRef] [Green Version]
  2. Berenjian, A.; Chan, N.; Malmiri, H.J. Volatile Organic Compounds Removal Methods: A Review. Am. J. Biochem. Biotechnol. 2012, 8, 220–229. [Google Scholar] [CrossRef]
  3. Wijmans, J.G.; Kamaruddin, H.D.; Segelke, S.V.; Wessling, M.; Baker, R.W. Removal of Dissolved VOCs from Water with an Air Stripper/Membrane Vapor Separation System. Sep. Sci. Technol. 1997, 32, 2267–2287. [Google Scholar] [CrossRef]
  4. Chaalal, O.; Dowaidar, A. A simple process for removing chloroform from water. Chem. Innov. 2000, 30, 45–46. [Google Scholar]
  5. Kujawski, W. Application of pervaporation and vapor permeation in environmental protection. Pol. J. Environ. Stud. 2000, 9, 13–26. [Google Scholar]
  6. Wang, L.K.; Chen, J.P.; Hung, Y.-T.; Shammas, N.K. Handbook of Environmental Engineering: Membrane and Desalination Technologies; Springer: Berlin/Heidelberg, Germany, 2011; Volume 13. [Google Scholar]
  7. Mulder, M.; Mulder, J. Basic Principles of Membrane Technology; Springer Science & Business Media: Berlin/Heidelberg, Germany, 1996. [Google Scholar]
  8. Hasanoğlu, A.; Salt, Y.; Keleşer, S.; Özkan, S.; Dinçer, S. Pervaporation separation of ethyl acetate–ethanol binary mixtures using polydimethylsiloxane membranes. Chem. Eng. Process. 2005, 44, 375–381. [Google Scholar] [CrossRef]
  9. Huang, R.Y. Pervaporation Membrane Sepration Processes. In Membrane Science and Technology; Series 1; Elsevier: New York, NY, USA, 1991; Volume 111. [Google Scholar]
  10. Baker, R.W. Membrane Technology and Applications; John Wiley & Sons: Hoboken, NJ, USA, 2012. [Google Scholar]
  11. Jonquières, A.; Clément, R.; Lochon, P.; Néel, J.; Dresch, M.; Chrétien, B. Industrial state-of-the-art of pervapora-tion and vapour permeation in the western countries. J. Membr. Sci. 2002, 206, 87–117. [Google Scholar] [CrossRef]
  12. Aptel, P.; Challard, N.; Cuny, J.; Neel, J. Application of the pervaporation process to separate azeotropic mixtures. J. Membr. Sci. 1976, 1, 271–287. [Google Scholar] [CrossRef]
  13. Udriot, H.; Araque, A.; von Stockar, U. Azeotropic mixtures may be broken by membrane distillation. Chem. Eng. J. Biochem. Eng. J. 1994, 54, 87–93. [Google Scholar] [CrossRef]
  14. Alarifi, A.S.; Alothman, Z.A.; Ouladsmane, M.; Aouak, T. The breaking down of the 2-butanone/water/n-butanol/sodium dodecylsulfate microemulsion system by pervaporation technique: Effect of the stirrer rate. Desalination 2010, 257, 87–92. [Google Scholar] [CrossRef]
  15. Saeed, W.S.; Aouak, T.; Al-Lohedan, H.A.; Al-Odayni, A.-B.M.; Ali Alghamdi, A.; Abdulaziz Al-Owais, A. Sepa-ration of organohalides from their microemulsions by the pervaporation technique: Application to the n-butyl bromide/SDS/n-butanol/water system. J. Dispers. Sci. Technol. 2019, 40, 128–139. [Google Scholar] [CrossRef]
  16. Aouak, T.E.; Moulay, S.; Hadj-Ziane, A. Microemulsion breakdown by pervaporation technique: The cyclohex-ane/water/n-butanol/sodium dodecylsulfate system. J. Membr. Sci. 2000, 173, 149–157. [Google Scholar] [CrossRef]
  17. Moulay, S.; Hadj-Ziane, A.Z.; Canselier, J.-P. Microemulsion breakdown by pervaporation technique: Effect of the alkyl chain length of n-alkanol, a cosurfactant of the microemulsion. J. Colloid Interface Sci. 2007, 311, 556–561. [Google Scholar] [CrossRef] [PubMed] [Green Version]
  18. Hsueh, C.; Kuo, J.; Huang, Y.; Wang, C.; Chen, C.-Y. Separation of ethanol–water solution by poly (acryloni-trile-co-acrylic acid) membranes. Sep. Purif. Technol. 2005, 41, 39–47. [Google Scholar] [CrossRef]
  19. Koczka, K.; Manczinger, J.; Mizsey, P.; Fonyo, Z. Novel hybrid separation processes based on pervaporation for THF recovery. Chem. Eng. Process. Process. Intensif. 2007, 46, 239–246. [Google Scholar] [CrossRef]
  20. Dutta, B.K.; Sikdar, S.K. Separation of volatile organic compounds from aqueous solutions by pervaporation us-ing S−B−S block copolymer membranes. Environ. Sci. Technol. 1999, 33, 1709–1716. [Google Scholar] [CrossRef]
  21. Uragami, T. Removal of Dissolved VOCs from Aqueous Solutions (Pervaporation Application). In Encyclopedia of Membranes; Drioli, E., Giorno, L., Eds.; Springer: Berlin/Heidelberg, Germany, 2015; pp. 1–4. [Google Scholar] [CrossRef]
  22. Chen, J.H.; Su, Z.B.; Xu, J.P.; Lin, L.J.; Dong, X.F.; Peng, Q.; He, Y.S.; Nie, Y.J. Fabrication of PEBA/Cu2O mixed-matrix membranes and their application in pyridine recovery from aqueous solution. RSC Adv. 2017, 7, 22936–22945. [Google Scholar] [CrossRef] [Green Version]
  23. Smitha, B.; Suhanya, D.; Sridhar, S.; Ramakrishna, M. Separation of organic–organic mixtures by pervapora-tion—A review. J. Membr. Sci. 2004, 241, 1–21. [Google Scholar] [CrossRef]
  24. Marx, S.; Everson, R.; Neomagus, H. Organic-Organic Separation by Pervaporation. II. Separation of Methanol from Tame by an α-Alumina Supported Nay-Zeolite Membrane. Sep. Sci. Technol. 2005, 40, 1047–1065. [Google Scholar] [CrossRef]
  25. Polotskaya, G.; Pulyalina, A.; Goikhman, M.; Podeshvo, I.; Rostovtseva, V.; Shugurov, S.; Gofman, I.; Saprykina, N.; Gulii, N.; Loretsyan, N.; et al. Novel Polyheteroarylene Membranes for Separation of Methanol‒Hexane Mixture by Pervaporation. Sci. Rep. 2018, 8, 17849. [Google Scholar] [CrossRef] [Green Version]
  26. Vane, L.M. A review of pervaporation for product recovery from biomass fermentation processes. J. Chem. Technol. Biotechnol. 2005, 80, 603–629. [Google Scholar] [CrossRef]
  27. Liu, M.; Sun, J.; Sun, Y.; Bock, C.; Chen, Q. Thickness-dependent mechanical properties of polydimethylsiloxane membranes. J. Micromech. Microeng. 2009, 19, 035028. [Google Scholar] [CrossRef]
  28. Kaur, B.; Kumar, S.; Mondal, T.; Phukan, M.; Saxena, A.; Dalavoy, T.; Bhowmick, A.K.; Bhat, S. Controlled Meth-odology for Development of a Polydimethylsiloxane–Polytetrafluoroethylene-Based Composite for Enhanced Chemical Resistance: A Structure–Property Relationship Study. ACS Omega 2020, 5, 22482–22493. [Google Scholar] [CrossRef] [PubMed]
  29. Zhimin, H.; Zhigang, T.; Ataeivarjovi, E.; Dong, G.; Zhijun, Z.; Hongwei, L. Study on Polydimethylsiloxane De-sorption Membrane of CO2-Dimethyl carbonate System. Energy Procedia 2017, 118, 210–215. [Google Scholar] [CrossRef]
  30. Dong, Z.; Zhu, H.; Hang, Y.; Liu, G.; Jin, W. Polydimethylsiloxane (PDMS) Composite Membrane Fabricated on the Inner Surface of a Ceramic Hollow Fiber: From Single-Channel to Multi-Channel. Engineering 2020, 6, 89–99. [Google Scholar] [CrossRef]
  31. Tanardi, C.R.; Pinheiro, A.F.; Nijmeijer, A.; Winnubst, L. PDMS grafting of mesoporous γ-alumina membranes for nanofiltration of organic solvents. J. Membr. Sci. 2014, 469, 471–477. [Google Scholar] [CrossRef]
  32. Hollein, M.E.; Hammond, M.; Slater, C.S. Concentration of Dilute Acetone-Water Solutions Using Pervaporation. Sep. Sci. Technol. 1993, 28, 1043–1061. [Google Scholar] [CrossRef]
  33. Ji, W.; Sikdar, S.K.; Hwang, S.-T. Modeling of multicomponent pervaporation for removal of volatile organic compounds from water. J. Membr. Sci. 1994, 93, 1–19. [Google Scholar] [CrossRef]
  34. Kondo, M.; Sato, H. Treatment of wastewater from phenolic resin process by pervaporation. Desalination 1994, 98, 147–154. [Google Scholar] [CrossRef]
  35. Hoshi, M.; Ieshige, M.; Saitoh, T.; Nakagawa, T. Separation of aqueous phenol through polyurethane mem-branes by pervaporation. III. Effect of the methylene group length in poly (alkylene glycols). J. Appl. Polym. Sci. 2000, 76, 654–664. [Google Scholar] [CrossRef]
  36. Jian, K.; Pintauro, P.N.; Ponangi, R. Separation of dilute organic/water mixtures with asymmetric poly (vinyli-dene fluoride) membranes. J. Membr. Sci. 1996, 117, 117–133. [Google Scholar] [CrossRef]
  37. Nijhuis, H.; Mulder, M.; Smolders, C. Removal of trace organics from aqueous solutions. Effect of membrane thickness. J. Membr. Sci. 1991, 61, 99–111. [Google Scholar] [CrossRef] [Green Version]
  38. Peterson, E.S.; Stone, M.L.; Cummings, D.G.; McCaffrey, R.R. Separations of Hazardous Organics from Gas and Liquid Feedstreams Using Phosphazene Polymer Membranes. Sep. Sci. Technol. 1993, 28, 271–281. [Google Scholar] [CrossRef]
  39. Lee, G.; Krovvidi, K.; Greenberg, D. Pervaporation of trace chlorinated organics from water through irradiated polyethylene membrane. J. Membr. Sci. 1989, 47, 183–202. [Google Scholar] [CrossRef]
  40. Yamaguchi, T.; Yamahara, S.; Nakao, S.-I.; Kimura, S. Preparation of pervaporation membranes for removal of dissolved organics from water by plasma-graft filling polymerization. J. Membr. Sci. 1994, 95, 39–49. [Google Scholar] [CrossRef]
  41. Nguyen, T.Q.; Nobe, K. Extraction of organic contaminants in aqueous solutions by pervaporation. J. Membr. Sci. 1987, 30, 11–22. [Google Scholar] [CrossRef]
  42. Schnabel, S.; Moulin, P.; Nguyen, Q.; Roizard, D.; Aptel, P. Removal of volatile organic components (VOCs) from water by pervaporation: Separation improvement by Dean vortices. J. Membr. Sci. 1998, 142, 129–141. [Google Scholar] [CrossRef]
  43. Peng, M.; Vane, L.M.; Liu, S.X. Recent advances in VOCs removal from water by pervaporation. J. Hazard. Mater. 2003, 98, 69–90. [Google Scholar] [CrossRef]
  44. Mencarini, J., Jr.; Coppola, R.; Slater, C.S. Separation of tetrahydrofuran from aqueous mixtures by pervaporation. Sep. Sci. Technol. 1994, 29, 465–481. [Google Scholar] [CrossRef]
  45. García, V.; Pongrácz, E.; Muurinen, E.; Keiski, R.L. Recovery of n-butanol from salt containing solutions by per-vaporation. Desalination 2009, 241, 201–211. [Google Scholar] [CrossRef]
  46. Wijmans, J.G.; Kaschemekat, J.; Davidson, J.E.; Baker, R.W. Treatment of organic-contaminated wastewater streams by pervaporation. Environ. Prog. 1990, 9, 262–268. [Google Scholar] [CrossRef]
  47. Baker, R. Separation of Volatile Organic Compounds from Water by Pervaporation. MRS Bull. 1999, 24, 50–53. [Google Scholar] [CrossRef]
  48. Wu, X.M.; Zhang, Q.G.; Soyekwo, F.; Liu, Q.L.; Zhu, A.M. Pervaporation removal of volatile organic compounds from aqueous solutions using the highly permeable PIM-1 membrane. AIChE J. 2015, 62, 842–851. [Google Scholar] [CrossRef]
  49. Zeng, W.; Du, Y.; Xue, Y.; Frisch, H.L. Solubility Parameters. In Physical Properties of Polymers Handbook; Springer: Berlin/Heidelberg, Germany, 2007; pp. 289–303. [Google Scholar]
  50. Huggins, M.L. The Solubility of Nonelectrolytes. By Joel H. Hildebrand and Robert S. Scott. J. Phys. Chem. 1951, 55, 619–620. [Google Scholar] [CrossRef]
  51. Comyn, J. Introduction to Polymer Permeability and the Mathematics of Diffusion. In Polymer Permeability; Springer: Berlin/Heidelberg, Germany, 1985; pp. 1–10. [Google Scholar]
  52. Zahlan, H.; Saeed, W.S.; Alqahtani, S.; Aouak, T. Separation of Benzene/Cyclohexane Mixtures by Pervaporation Using Poly (Ethylene-Co-Vinylalcohol) and Carbon Nanotube-Filled Poly (Vinyl Alcohol-Co-Ethylene) Mem-branes. Separations 2020, 7, 68. [Google Scholar] [CrossRef]
  53. Dong, Y.; Guo, H.; Su, Z.; Wei, W.; Wu, X. Pervaporation separation of benzene/cyclohexane through AA-OM-ionic liquids/polyurethane membranes. Chem. Eng. Process. 2015, 89, 62–69. [Google Scholar] [CrossRef]
  54. Xi, T.; Tang, L.; Hao, W.; Yao, L.; Cui, P. Morphology and pervaporation performance of ionic liquid and water-borne polyurethane composite membranes. RSC Adv. 2018, 8, 7792–7799. [Google Scholar] [CrossRef] [Green Version]
  55. Lee, J.N.; Park, A.C.; Whitesides, G.M. Solvent Compatibility of Poly(dimethylsiloxane)-Based Microfluidic Devices. Anal. Chem. 2003, 75, 6544–6554. [Google Scholar] [CrossRef]
  56. Mark, J. Physical Properties of Polymers, Handbook AIP; Woodbury: New York, NY, USA, 1996. [Google Scholar]
  57. Barton, A.F.M. CRC Handbook of Solubility Parameters and Other Cohesion Parameters; Routledge: London, UK, 2017. [Google Scholar]
  58. Grinsted, R.A.; Clark, L.; Koenig, J.L. Study of cyclic sorption-desorption into poly(methyl methacrylate) rods using NMR imaging. Macromolecules 1992, 25, 1235–1241. [Google Scholar] [CrossRef]
  59. Yeom, C.K.; Lee, K.-H. A study on desorption resistance in pervaporation of single component through dense membranes. J. Appl. Polym. Sci. 1997, 63, 221–232. [Google Scholar] [CrossRef]
  60. Hasanoğlu, A.; Salt, Y.; Keleşer, S.; Özkan, S.; Dinçer, S. Pervaporation separation of organics from multicompo-nent aqueous mixtures. Chem. Eng. Process. 2007, 46, 300–306. [Google Scholar] [CrossRef]
  61. Hyder, M.; Huang, R.; Chen, P. Effect of selective layer thickness on pervaporation of composite poly (vinyl al-cohol)–poly (sulfone) membranes. J. Membr. Sci. 2008, 318, 387–396. [Google Scholar] [CrossRef]
  62. Raisi, A.; Aroujalian, A. Aroma compound recovery by hydrophobic pervaporation: The effect of membrane thickness and coupling phenomena. Sep. Purif. Technol. 2011, 82, 53–62. [Google Scholar] [CrossRef]
  63. Koops, G.H.; Nolten, J.A.M.; Mulder, M.H.V.; Smolders, C.A. Selectivity as a function of membrane thickness: Gas separation and pervaporation. J. Appl. Polym. Sci. 1994, 53, 1639–1651. [Google Scholar] [CrossRef] [Green Version]
  64. Meuleman, E.E.B.; Bosch, B.; Mulder, M.H.V.; Strathmann, H. Modeling of liquid/liquid separation by pervaporation: Toluene from water. AIChE J. 1999, 45, 2153–2160. [Google Scholar] [CrossRef]
  65. Dmitrenko, M.; Zolotarev, A.; Plisko, T.; Burts, K.; Liamin, V.; Bildyukevich, A.; Ermakov, S.; Penkova, A. Effect of the Formation of Ultrathin Selective Layers on the Structure and Performance of Thin-Film Composite Chitosan/PAN Membranes for Pervaporation Dehydration. Membranes 2020, 10, 153. [Google Scholar] [CrossRef] [PubMed]
  66. Yeom, C.-K.; Dickson, J.M.; Brook, M.A. A characterization of pdms pervaporation membranes for the removal of trace organic from water. Korean J. Chem. Eng. 1996, 13, 482–488. [Google Scholar] [CrossRef]
  67. Greer, D.R.; Ozcam, A.E.; Balsara, N.P. Pervaporation of organic compounds from aqueous mixtures using pol-ydimethylsiloxane-containing block copolymer membranes. AIChE J. 2015, 61, 2789–2794. [Google Scholar] [CrossRef] [Green Version]
  68. Ji, L.; Shi, B.; Wang, L. Pervaporation separation of ethanol/water mixture using modified zeolite filled PDMS membranes. J. Appl. Polym. Sci. 2015, 132, 132. [Google Scholar] [CrossRef]
Scheme 1. Preparation of the SILICONE1200 membrane. (1) SILICONE1200 tube, (2) sheet of transparent polypropylene paper, (3) metal plate, (4) adhesive tape, (5) rolling pin, and (6) SILICONE1200 membrane.
Water 13 01049 sch001
Figure 1. Behavior of the components of the mixture in the feed.
Water 13 01049 g001
Scheme 2. Pervaporation apparatus used in this investigation. 1—Tank (Reservoir); 2—Peristaltic pump; 3—Thermostatic coil; 4—Mechanical stirrer; 5—Pervaporation cell; 6—Hanged magnetic bar; 7—Magnetic stirrer; 8—Three-way Rotaflow valve; 9—Opening to the air; 10—Pirani Gauge; 11—Cold trap; 12—Vacuum pump.
Water 13 01049 sch002
Figure 2. Comparative swelling curves of the SILICONE1200 membrane in the water- organic mixture and in each component as a function of time.
Water 13 01049 g002
Figure 3. Curve profiles of the variation of L n w t w o w w o   vs. Ln (t) for the swelling of the SILICONE1200 membrane in the various solvents and their mixture.
Water 13 01049 g003
Figure 4. Variation of the total flux versus time obtained with different membrane thicknesses. Conditions: temperature, 20 °C and stirring rate, 500 rpm.
Water 13 01049 g004
Figure 5. Variation of the membrane selectivity versus time obtained at different thicknesses. Conditions: temperature, 20 °C and stirring rate, 500 rpm.
Water 13 01049 g005
Scheme 3. Mechanism of the stabilization of the concentration of organic substances in the feed.
Water 13 01049 sch003
Figure 6. Variation of the concentration of various components in the organic mixture in the permeate as a function of the membrane thickness during the 1.5 h extraction process.
Water 13 01049 g006
Figure 7. Variation of the total flux of the permeate versus time using a SILICONE1200-260 µm membrane at different stirring rates.
Water 13 01049 g007
Figure 8. Variation of the selectivity of the SILICONE1200-480 μm membrane with respect of the organic mixuture versus time at different stirring rates.
Water 13 01049 g008
Figure 9. Variation of the cumulative flux of various components in the organic mixture as a function of the stirring rate during a 1.5 h extraction process.
Water 13 01049 g009
Figure 10. Variation of the total flux of organic compounds extracted by the SILICONE1200-260 µm membrane as a function of time at different temperatures.
Water 13 01049 g010
Figure 11. Variation of the selectivity of the SILICONE1200-260 µm membrane with respect to the organic mixture as a function of time at different temperatures.
Water 13 01049 g011
Figure 12. Variation of the concentration of various components in the organic mixture as a function of temperature during the 1.5 h separation process.
Water 13 01049 g012
Figure 13. Variation of the cumulative total flux and the selectivity of the organic mixture extracted by the SILICONE1200-260 µm membrane as a function of time at 20 °C.
Water 13 01049 g013
Figure 14. Variation of the concentration of various organic components in the permeate as a function of time obtained during separation by pervaporation (dynamic process).
Water 13 01049 g014
Table 1. Some membrane/VOC pervaporation binary/water systems and results of the total flux and selectivity obtained.
MembraneVOCs/Water SystemFlux (kg·m−2·h−1)SelectivityRef.
PDMSAcetone75055[29]
PDMSToluene444500[30]
PDMSMethylene Chloride151450[30]
PDMSTrichloroethane132040[30]
PDMSChloroform201670[30]
PEBAToluene12700[30]
PEBATrichloroethane11450[30]
PEBAPhenol80130[32]
PEBAAcetone2005[27]
BA-co-AATrichloroethane46610[33]
PVDFBenzene321180[34]
PVDFToluene421700[34]
PVDFXylene2840[34]
EPDMTrichlomethylene738,800[35]
PPOPDichloromethane6510,000[36]
PEChloroform0.391000[37]
PEChlorobenzene0.35960[37]
HDPE-g-BA1,1,2 Trichloroethylene1391100[38]
SBSChloroform73000[39]
SBSTrichloroethylene135600[39]
SBSToluene95000[39]
PVDFBenzene14540[40]
PVDF Styrene3.81050[20]
Silicalite/Silicone compositeTetrahydrofuran980205[41]
BA-co-AA, n-Butyl acrylate-co-acrylic acid; SBS, Styrene and butadiene copolymer; NBR, Nitrile-butadiene copolymer; SBR, Styrene-butadiene rubber; PVDF, Poly (vinylidene fluoride); PPOP, Poly [bis (phenoxy) phosphazene]; EPDM, Ethylene propylene diene monomer rubber; PE, Polyethylene; PEBA, Poly (ether-block-polyamide).
Table 2. Some VOC multicomponent/water systems separated from water by a pervaporation technique using different membranes.
MembraneVOCsRef.
PERVAP 4060Acetone-butanol-ethanol[42]
Multilayers composite MembranesAcetone/ethanol/Chloroform/ethylacetate/1,1,2-trichloroethane[43]
PPOPDichloromethane/Chloroform[34]
Silicone-rubberBenzene, ethyl benzene, toluene, xylenes,
trichloroethylene, Chloroform, vinyl Chloride,
ethylene dichloride, methylene Chloride,
perfluorocarbons, hexane
[44]
Silicone-rubberEthyl acetate, ethyl butyrate, hexanol, methylacetate, methyl ethyl ketone
Propanols, butanols, acetone, amyl alcohol, acetaldehyde
[44]
Silicone-rubberMethanol, ethanol, phenol, acetic acid, ethylene glycol, dimethylformamide, dimethy acetamide[44]
PIM-1 membraneEthyl acetate, Dimethyl ether, and Acetonitrile[45]
Table 3. Preparation conditions of the PDMS membranes.
MembraneThickness (μm)PDMS (g)
SILICONE1200-2602603.02
SILICONE1200-3503505.38
SILICONE1200-4804807.38
SILICONE1200-5105107.85
Table 4. Characteristics of the various components in the feed taken from the literature at 20 °C.
Organic ComponentChloroformTolueneHeptanesThiopheneButanoneRef.
Density (g·mL−1)1.4800.8670.6841.0510.800[46]
Solubility in water (g·L−1)8.090.520.0031.22275.00[47]
Hansen solubility parameter (cal·cm−3)0.59.28.97.49.89.3[48]
Molar volume, V1 (mL·mol−1)80.2106.3157.480.189.6[48]
Table 5. Initial composition of each component in the feed.
ComponentWaterOrganics
ButanoneCHCl3ThiopheneHeptanesToluene
Mass (g)40.08.08.08.08.08.0
Composition (wt. %)501010101010
Table 6. Swelling performance, Flory interaction parameters and enthalpy of absorption of the different couples SILICONE1200/solvent calculated from Equations (3) and (4).
SILICONE1200/Solvent SystemDS Performance (wt.%)δ1δ2
(cal·cm−3)1/2
HM (cal·mol−1) χ 1 , p
SILICONE1200/Chloroform5251.240.780.38
SILICONE1200/Heptanes2550.617.960.36
SILICONE1200/Toluene2400.935.260.37
SILICONE1200/Butanone901.395.860.40
SILICONE1200/Thiophene1001.8173.160.44
SILICONE1200/Water015.4-2.03
SILICONE1200/Mixture300---
Table 7. k and n values of the different SILICONE1200 membrane–solvent systems obtained from the curves in Figure 3.
SILICONE1200/Solvent SystemknR2
SILICONE1200/Chloroform0.2250.4680.983
SILICONE1200/Heptanes0.2100.5470.995
SILICONE1200/Toluene0.1790.5100.992
SILICONE1200/Butanone0.3260.4030.997
SILICONE1200/Thiophene0.3180.3570.993
SILICONE1200/Mixture0.4110.3000.997
Table 8. Composition of the mixture before, after swelling, and the selective absorption of the membrane factor of the SILICONE1200 membrane.
ComponentInitial Composition (wt.%)Composition of the Absorbate (wt.%) β i / m i x a b s
Chloroform1017.220.83
Toluene1020.371.02
Heptanes1024.281.28
Thiophene1019.760.99
Butanone1018.370.90
Water5000
Table 9. Pervaporative parameters of a SILICONE1200 membrane obtained during 1.5 h of separation at 20 °C with a stirring rate of 250 rpm using different membrane thicknesses.
Thickness (μm)J (Kg·m−2·h−1) β p e r v PSI (Kg·m−2·h−1)
26011.031461599.35
3507.624773627.12
4804.1017127015.10
5101.9529885824.65
Table 10. Pervaporative parameters of a SILICONE1200 membrane obtained during 1.5 h of separation at 20 °C at different stirring rates and a membrane thickness of 260 μm.
Stirring Rate (rpm)J (Kg·m−2·h−1) β p e r v PSI (Kg·m−2·h−1)
25011.031461599.35
5004.329203970.08
7500.50400199.50
10000.98400199.50
Table 11. Pervaporative parameters of a SILICONE1200 membrane obtained during 1.5 h of separation at different temperatures with a stirring rate of 250 rpm and a membrane thickness of 260 μm.
Temperature (°C)J (Kg·m−2·h−1) β p e r v PSI (Kg·m−2·h−1)
2011.031461599.35
302.9825207506.62
402.9933009864.01
503.10781024,207.90
Table 12. Starting composition of the organic mixture in the feed, that in the permeate and the selective absorption of the membrane factor during the 1.5 h extraction process.
ChloroformHeptanesTolueneThiopheneButanone
ICOF (wt.%) *2020202020
COP (wt.%) **30.7914.9417.2921.3415.64
β i / m i x a b s 1.770.700.831.080.74
* ICOF: Initial composition of organic compounds in the feed; ** COP: composition of organic compounds in the permeate.
Publisher’s Note: MDPI stays neutral with regard to jurisdictional claims in published maps and institutional affiliations.

