Article

Responses of Hydrological Processes under Different Shared Socioeconomic Pathway Scenarios in the Huaihe River Basin, China

1
State Key Laboratory of Simulation and Regulation of Water Cycle in River Basin, China Institute of Water Resources and Hydropower Research, Beijing 100038, China
2
China Institute of Water Resource and Hydropower Research, Beijing 100038, China
3
Research Center on Flood & Drought Disaster Reduction of the Ministry of Water Resources, Beijing 100038, China
4
State Key Laboratory of Hydrology-Water Resources and Hydraulic Engineering, Hohai University, Nanjing 210098, China
*
Author to whom correspondence should be addressed.
Water 2021, 13(8), 1053; https://doi.org/10.3390/w13081053
Submission received: 21 December 2020 / Revised: 9 April 2021 / Accepted: 9 April 2021 / Published: 12 April 2021
(This article belongs to the Section Hydrology)

Abstract

:
The Coupled Model Intercomparison Project Phase 6 (CMIP6) provides more scenarios and reliable climate change results for improving the accuracy of future hydrological parameter change analysis. This study uses five CMIP6 global climate models (GCMs) to drive the variable infiltration capacity (VIC) model, and then simulates the hydrological response of the upper and middle Huaihe River Basin (UMHRB) under future shared socioeconomic pathway scenarios (SSPs). The results show that the five-GCM ensemble improves the simulation accuracy compared to a single model. The climate over the UMHRB likely becomes warmer. The general trend of future precipitation is projected to increase, and the increased rates are higher in spring and winter than in summer and autumn. Changes in annual evapotranspiration are basically consistent with precipitation, but seasonal evapotranspiration shows different changes (0–18%). The average annual runoff will increase in a wavelike manner, and the change patterns of runoff follow that of seasonal precipitation. Changes in soil moisture are not obvious, and the annual soil moisture increases slightly. In the intrayear process, soil moisture decreases slightly in autumn. The research results will enhance a more realistic understanding of the future hydrological response of the UMHRB and assist decision-makers in developing watershed flood risk-management measures and water and soil conservation plans.

1. Introduction

Global climate and environment have undergone significant changes due to greenhouse gas emissions since the end of the 20th century. The major cause of these changes is global warming. The Intergovernmental Panel on Climate Change Fifth Assessment Report indicates that the global average surface temperature data show a warming of approximately 0.85 °C from 1880 to 2012 and that the global average surface temperature will continue to increase by 0.3–0.7° from 2016 to 2035 [1]. Due to the rising temperature, the content of water vapor in the atmosphere has been increasing, and precipitation has also changed significantly. The original regional and natural water cycle processes of watersheds have been disrupted by climate change, resulting in a fundamental change in the precipitation–runoff response [2,3,4,5]. With global warming, the frequency and intensity of extreme floods and droughts disasters will increase in the future [6]. Therefore, predicting climate change and the impact of climate change on hydrologic cycles and water resource systems have become important issues of worldwide concern.
Climate change alters the hydrological cycle to varying degrees, affects the spatiotemporal distribution of hydrological elements, such as precipitation, evaporation, runoff, and soil moisture, and then redistributes water resources in time and space [7,8]. Currently, research on the impact of climate change on hydrological systems mainly focuses on water balance [9], analysis of floods and droughts under climate change [10], and water supply and demand in basins under a changing environment [11]. Among these studies, future climate models derived from hydrological models have been recognized as a reliable method for predicting climate change and assessing hydrological effects [12]. Since 1995, a series of global climate models have been provided by the Coupled Model Intercomparison Project (CMIP) of the World Climate Research Programme (WCRP). The data are widely used to support climate change research. Nauman et al. quantified the impacts on the water resources of the Haro River in Pakistan by using the Soil and Water Assessment Tool [13]. A single model, MIROC-ESM, was selected for climate change impact assessment, and the linear scaling method was shown to remove bias in the precipitation and temperature time series. The source regions of the Yellow River and Yangtze River were investigated for the mid-future by coupling the RegCM4 and variable infiltration capacity (VIC) models under three representative concentration pathways (RCPs). The results revealed that due to an increase of precipitation, surface runoff and baseflow in two source regions will largely increase [14]. Venkataraman et al. identified the impact of climate change from a CMIP5 ensemble on 21st century drought characteristics under RCP2.6, RCP4.5, and RCP8.5 in Texas, U.S. [15]. The results demonstrated that some earlier studies overestimated the 21st century drought intensification in parts of Texas. Wang et al. analyzed the future hydropower potential of the Nanliujiang River Basin in China by coupling the VIC model with five climate models, in order to have a more realistic understanding of future hydropower planning [16]. Nandi and Manne employed a series of global climate models to drive the VIC model and predicted the spatiotemporal dynamics of the water balance components for the near-future period (2019–2040) under two emission scenarios, RCP4.5 and RCP8.5, in the Sina River Basin, a drought-prone region in India [17]. The sixth version of CMIP has been developed, and it is a great improvement over the previous version. The CMIP6 multimodel ensemble (MME) outperforms the CMIP5 MME in terms of precipitation in East China [18]. The temperature predicted by CMIP6 models is generally more accurate in Asia. The warm bias of CMIP5 in summer is improved in CMIP6 [19]. Furthermore, a new concept called the shared socioeconomic pathway is proposed in scenario simulation, which is an upgrade of the representative concentration pathway in CMIP5. At present, CMIP5 is widely used in the hydrological prediction of the Huaihe River Basin (HRB) [20,21,22,23]. CMIP6 is mostly used at the global and regional scales [24,25,26] but rarely at the catchment scale. Jin et al. showed that water resources and extreme hydrological events will slightly increase during 2021–2050 under RCP 2.6, RCP4.5, and RCP8.5 in the HRB [27]. Yang et al. predicted the change of runoff in middle of the 21st century. The result shows that runoff increases over 10% under RCPs in the main stream of the upper reaches of the Huaihe River [28]. These studies have selected some future scenarios and periods to study the HRB. Jiang et al. predicted climate change in the HRB. The annual temperature and precipitation increase during 2021–2100 under all SSP–RCP scenarios and the basin will be more vulnerable to flooding. However, they did not combine this with a hydrological model to further analyze the hydrological response of the basin [29]. The purpose of this study is to systematically discuss the responses of hydrological processes to future climate change in the upper and middle Huaihe River Basin (UMHRB) using the VIC model and scenario simulations of CMIP6. The future climate simulations of CMIP6 are derived from five global climate models (GCMs) under four shared socioeconomic pathway scenarios (SSP1-2.6, SSP2-4.5, SSP3-7.0, and SSP5-8.5) in three future periods (2017–2040, 2041–2070, and 2071–2100). The results of this study will improve our understanding of the hydrological impacts of the UMHRB in different climate change scenarios and provide a reference for formulating watershed water resource-management measures in the future.

2. Materials and Methods

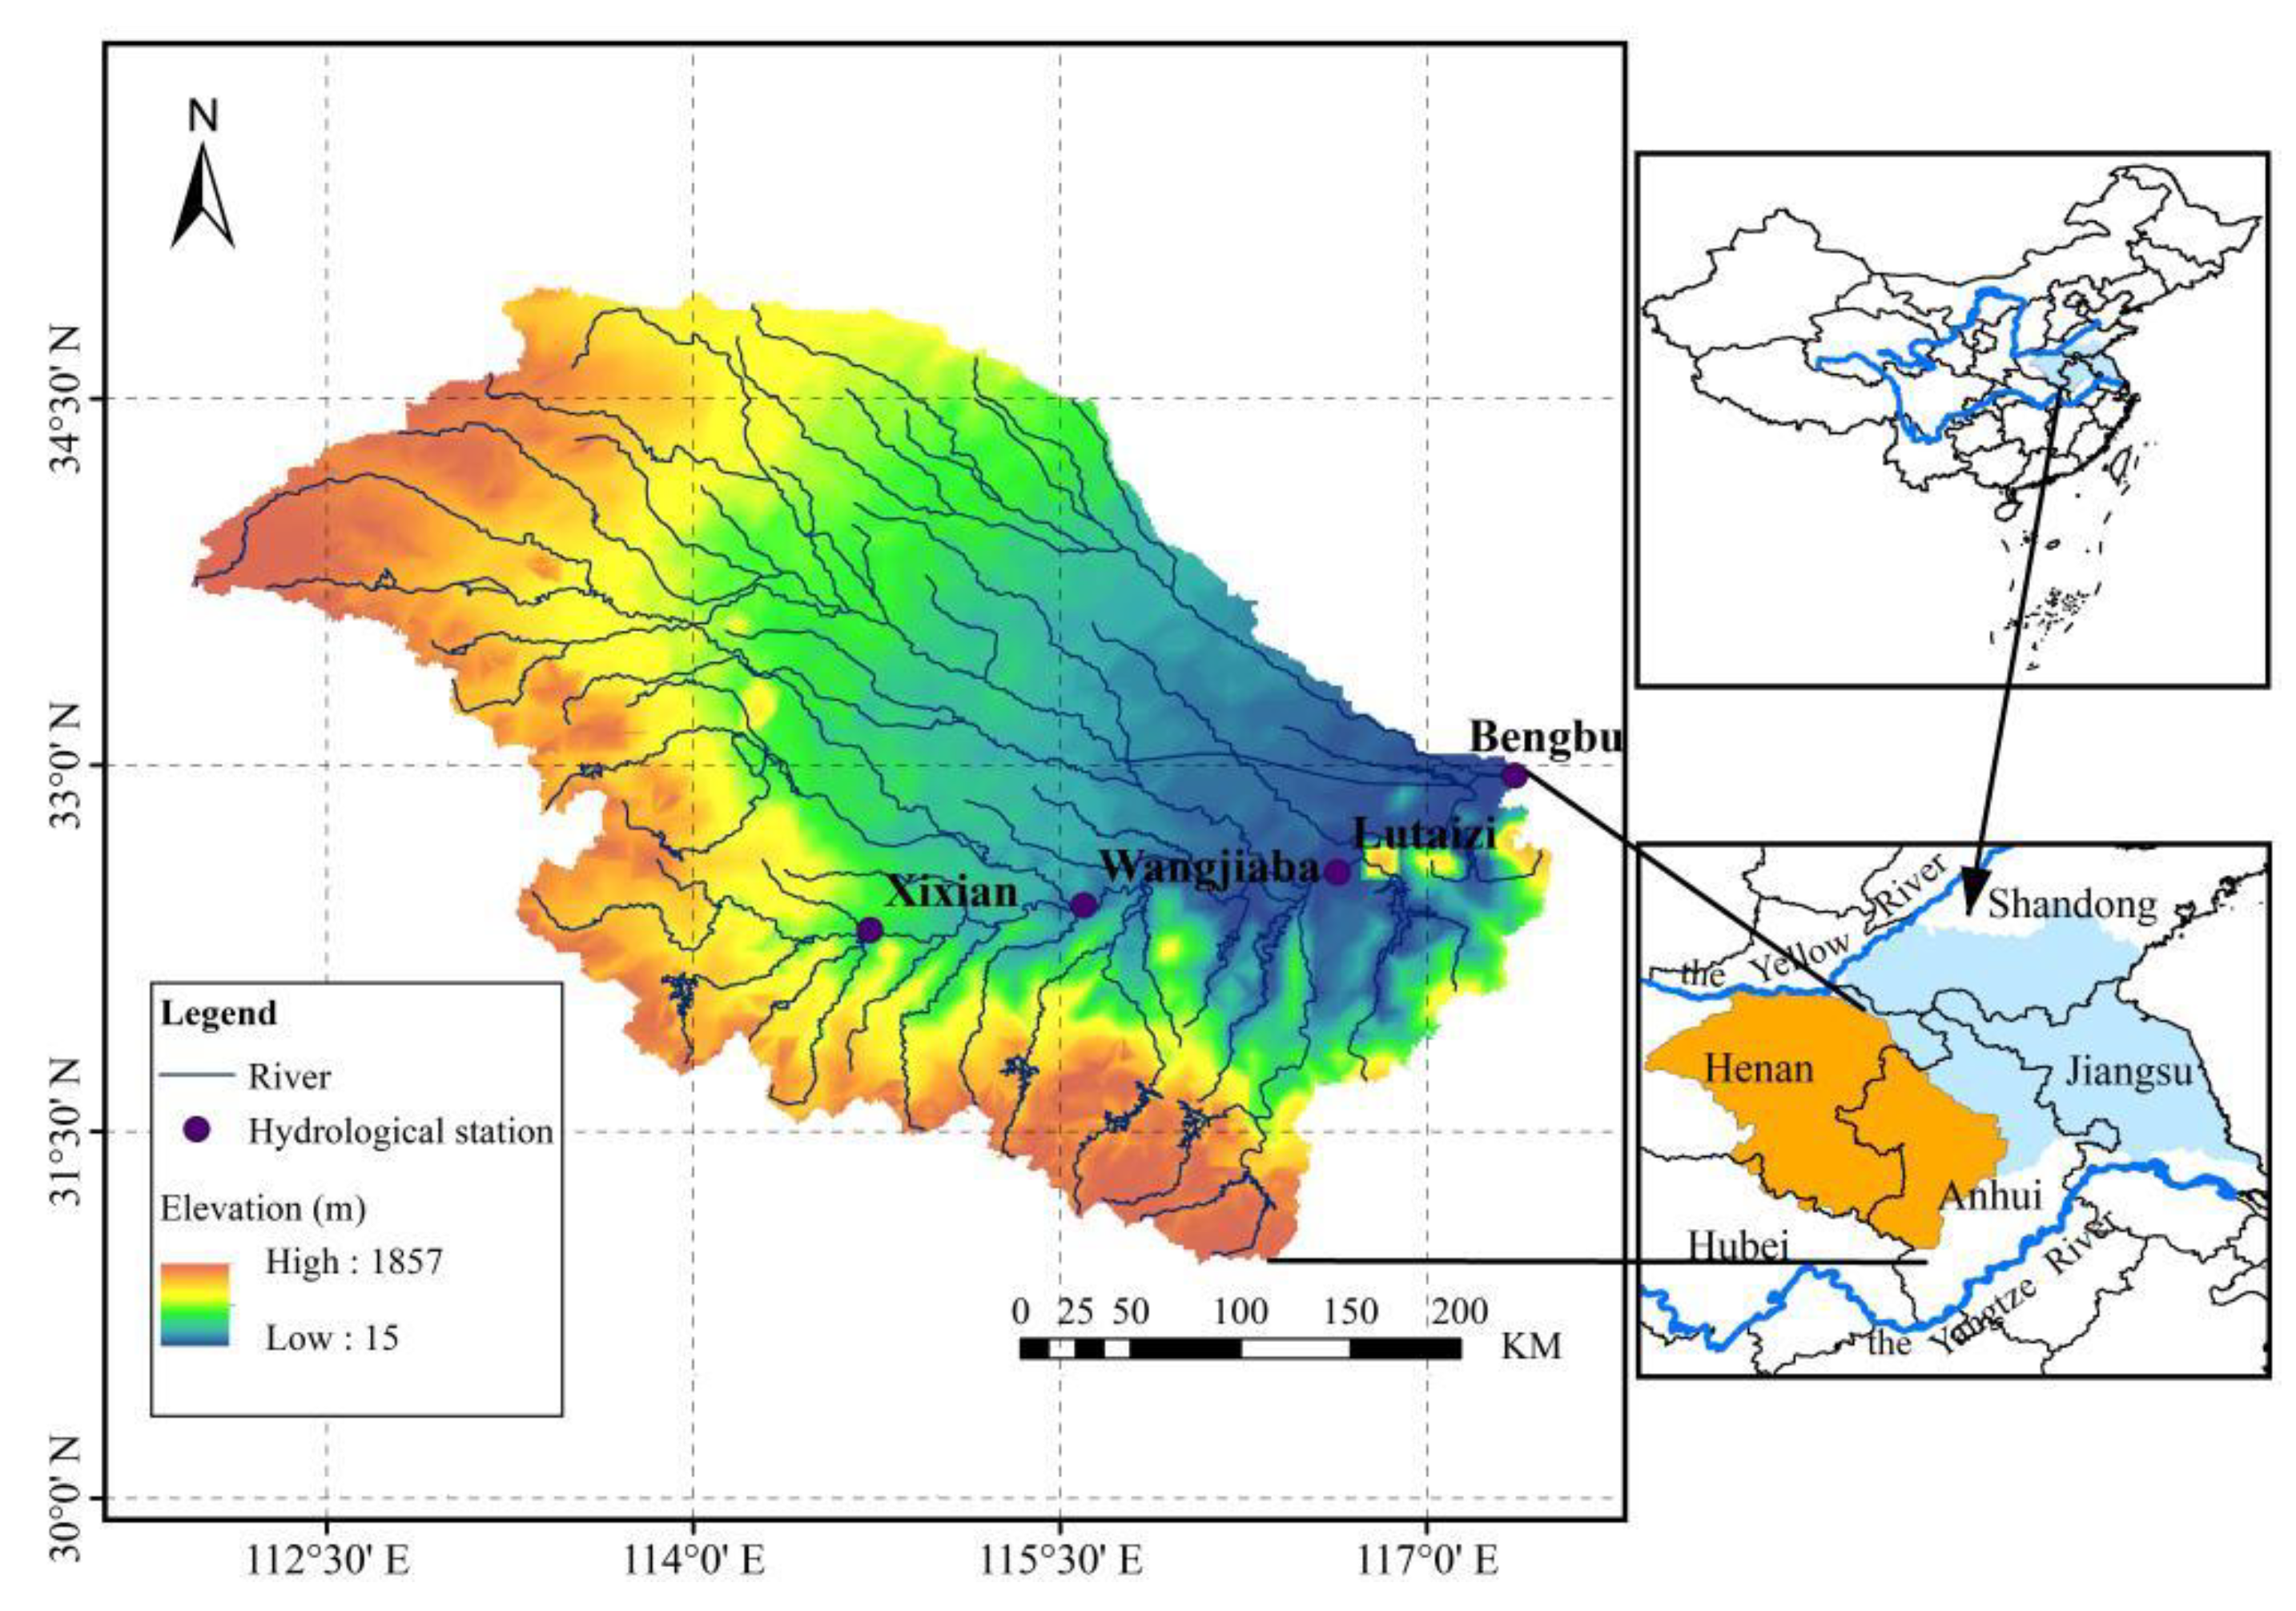
2.1. Study Area and Datasets

The upper and middle reaches of the Huaihe River Basin (above the Bengbu) (30°57’−34°57’ N, 111°56’−117°31’ E) are located in eastern China between the Yangtze and Yellow River Basins (Figure 1). It spans Henan, Hubei, and Anhui Provinces, with an area of approximately 121,300 km2. The basin is concentrated in population and contains extensive cultivated land. The UMHRB is situated in the climate transition zone between northern and southern China. Taking the main stream of the Huaihe River as the dividing line, north of the line belongs to the warm temperate semihumid zone, while the south belongs to the northern subtropical humid zone. The annual average temperature of the study basin is 11–16 °C, increasing from north to south and from the coast to inland. Cultivated land in the basin accounts for nearly 70% and is mainly planted with wheat, corn, and rice. Sandy loam and clay soil are the main soil types in the basin. The annual average precipitation of the study basin is approximately 920 mm, with large interannual variation and uneven temporal and spatial distributions. The western and southern regions of the basin are mountainous, with a minimum altitude of 800 m, and prone to extreme precipitation [30]. The eastern part of this basin is dominated by plains, with a maximum altitude of 200 m. The large drop makes the extreme precipitation in the mountainous regions rapidly converge to the plains, causing flood disasters.
In this study, the datasets included meteorological data, observed discharge data, future prediction data, and other data. The meteorological data adopted the China meteorological forcing dataset (CMFD) released by the Institute of Tibetan Plateau Research [31] and include precipitation, temperature, and wind-speed data. The CMFD covers the period 1979–2018, with a spatial resolution of 0.1° and a temporal resolution of three hours. The observed discharge data collected from 1981 to 2018 and provided by the local hydrology bureau are monthly discharge observation data of Xixian, Wangjiaba, Lutaizi, and Bengbu hydrological stations (Figure 1). Future predictions data are derived from the outputs of five GCMs. More details about these data are provided in Section 2.3.
In addition, vegetation parameters were obtained from the 1 km global vegetation dataset developed by the University of Maryland [32]. The Harmonized World Soil Database (HWSD) was used to create soil parameters. The HWSD is a 30 arc-second raster database developed by Food and Agriculture–United Nations Educational, Scientific, and Cultural Organization (FAO–UNESCO). The missing data were filled by the Soil–Plant–Air–Water (SPAW) system, a calculation tool used for hydrological models. To drive the VIC model, all datasets were interpolated to 0.1° × 0.1° spatial resolution by bilinear regression.

2.2. VIC Model

The VIC macroscale hydrologic model was originally developed by Xu Liang at the University of Washington [33]. The VIC model simulates various processes of the water cycle by following the principles of energy balance and water balance, and calculates the energy and moisture fluxes for each grid independently [34]. There is no communication between grids [35]. The runoff on each grid is routed to the outlet of the basin by coupling a routing model [36]. In this study, the study basin was divided into 1284 uniform grids of 0.1° × 0.1° to construct an assessment model of the hydrological process in the UMHRB under climate change based on the VIC model.
Before application of the model to the UMHRB, parameter calibration needed to be performed to obtain appropriate model parameters. The sensitive parameters of the VIC model that needed to be calibrated were three soil-layer thicknesses (d1, d2, and d3), the variable infiltration curve parameter (infilt), the maximum velocity of baseflow (Dsmax), the fraction of Dsmax where nonlinear baseflow begins (Ds), and the fraction of maximum soil moisture where nonlinear baseflow occurs (Ws) [37]. The details of these calibrated parameters are listed in Table 1.
The VIC model was driven by precipitation, temperature, and wind-speed data based on the CMFD in the UMHRB at a 0.1° × 0.1° spatial resolution. The discharge data were observed monthly for the Xixian, Wangjiaba, Lutaizi, and Bengbu hydrologic stations (Figure 1) during the period 1981–2018, which were used to calibrate and validate the model. We used two years to initiate the model. The period 1981–2000 was used as the calibration period. The validation period was set as 2001–2018. Indices including the relative error (Er) and Nash–Sutcliffe efficiency (NSE) [38] were employed to evaluate model performance. Er and NSE describe the deviation and fitting degree between the simulation and observation, respectively:
E r = Q m ¯ Q o ¯ Q o ¯
N S E = 1 t = 1 T ( Q o t Q m t ) 2 t = 1 T ( Q o t Q o ¯ ) 2
where Q o t and Q m t are the observed and simulated streamflows at time t, respectively. Q o ¯ and Q m ¯ refer to the monthly averages of the observed and simulated data, respectively.

2.3. Climate Change Scenarios

2.3.1. The Scenario Model Intercomparison Project (ScenarioMIP) for CMIP6

The climate simulation and prediction results of the CMIP organized by the WCRP provide an important reference for understanding future climate change as well as the impact of climate on society and ecology. In the latest phase, CMIP6, nearly 50 models from 14 countries participate in the ScenarioMIP [39]. ScenarioMIP is a new set of land use and emission scenarios [40] produced with updated integrated assessment models (IAMs) and driven by the different SSPs and the latest emission trend. It emphasizes the consistency between the shared socioeconomic scenarios and radiative forcing scenarios in the future and plays a fundamental role in studying the response of hydrological processes under climate change.
The four different shared socioeconomic pathways were applied to quantitatively describe the relationship between climate and socioeconomic change in the future [41]. SSP1-2.6 updates the RCP2.6 pathway and represents the combined effects of low vulnerability and low radiative forcing. The rise in the multimodel mean temperature will be less than 2 °C, and the radiative forcing will reach 2.6 W/m2 in 2100. SSP2-4.5 updates the RCP4.5 pathway and represents the medium future forcing pathway. The radiative forcing will stabilize at 4.5 W/m2 in 2100. SSP3-7.0 is a new forcing pathway to fill a gap in CMIP5. It represents a combination of relatively high societal vulnerability and relatively high radiative forcing. The radiative forcing will reach 7.0 W/m2 in 2100. The SSP5-8.5 scenario updates the RCP8.5 pathway and represents the highest future pathway in ScenarioMIP. It is the only SSP scenario to produce a radiative forcing of 8.5 W/m2 in 2100 [42].
Many studies have shown that the predictive effect of a multimodel ensemble is better than that of a single model [25,43,44]. Based on the performance of GCMs in East Asia (China) [18,19,45,46], this paper selected five GCMs: BCC-CSM2-MR, GFDL-ESM4, IPSL-CM6A-LR, MIROC6, and NorESM2-MM, as shown in Table 2. The five GCMs were combined to predict the climate in the UMHRB.

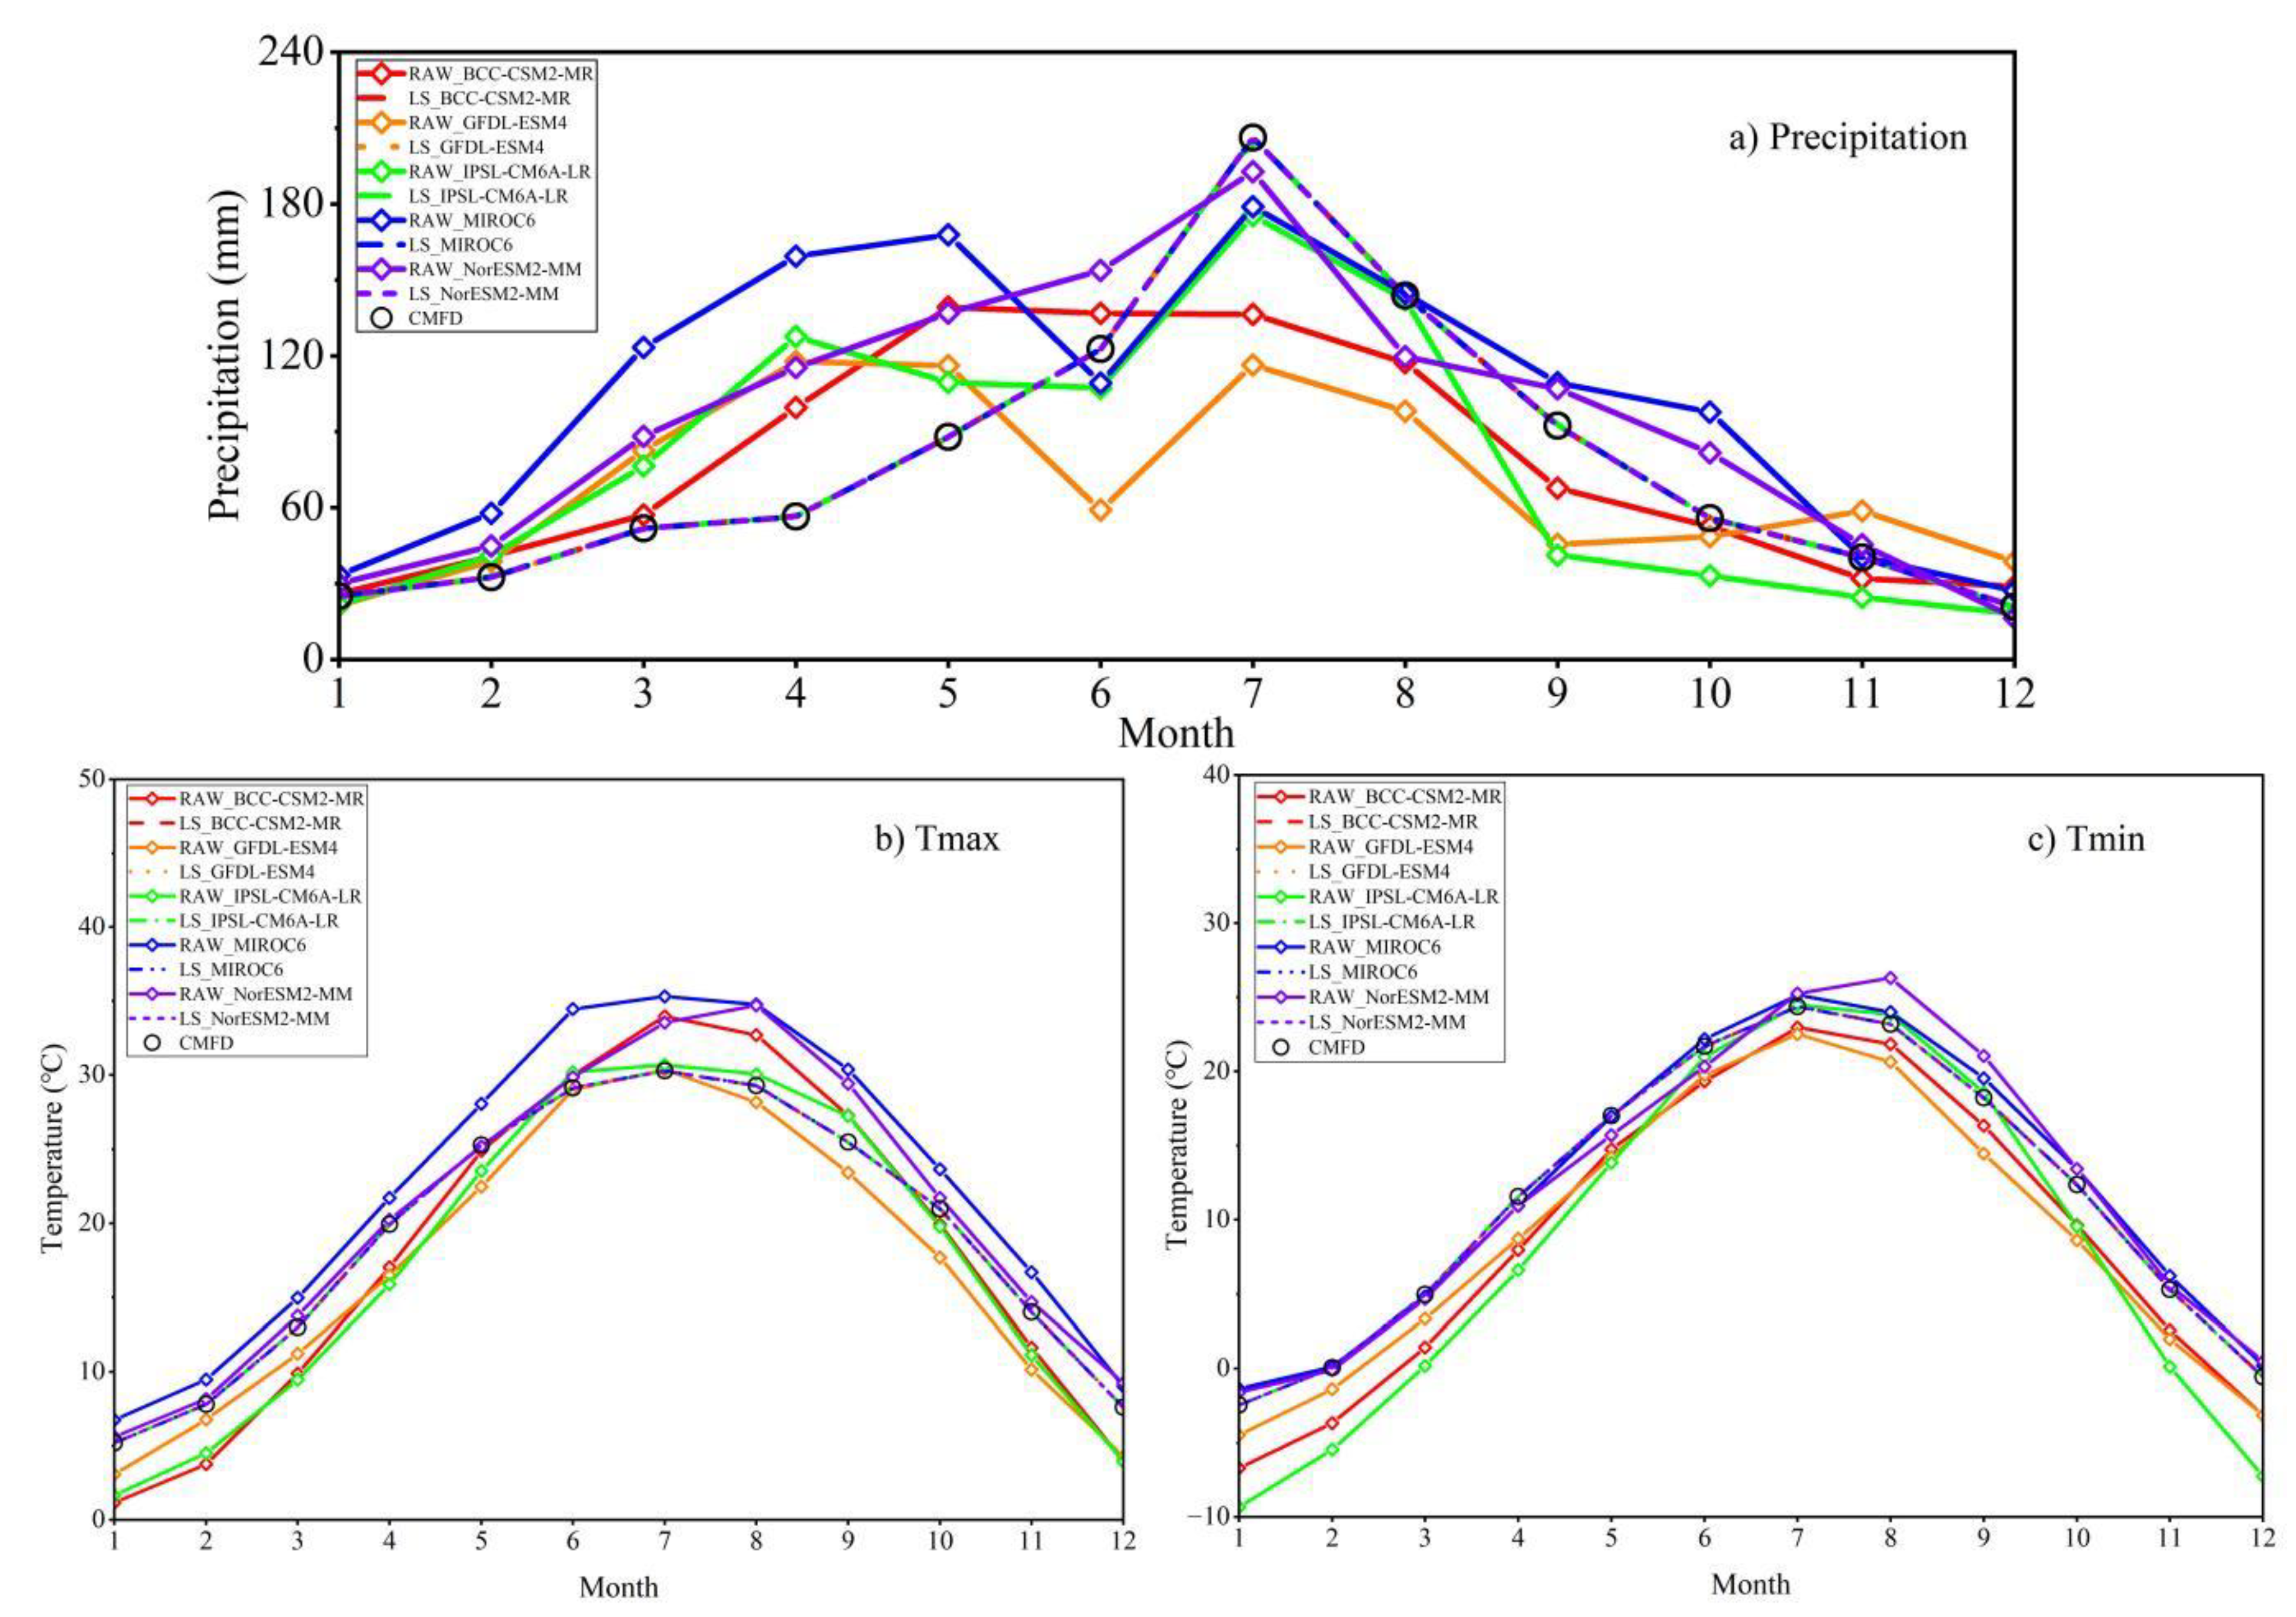
2.3.2. Bias-Correction Methods

The CMIP6 global climate models are an improvement of the earlier CMIP5 model. They have reliable abilities to simulate the geographical distribution of temperature and precipitation in China, but deviations in temperature and precipitation are still inevitable.
The linear scaling method is commonly used to effectively correct GCM data [47,48]. This method corrects the systematical error and reduces the uncertainty of GCM. In this paper, outputs of GCMs are bias-corrected to the 0.1° × 0.1° grid by using the linear scaling method and the CMFD over the UMHRB.
P con , c o r ( d ) = P c o n ( d ) × ( P ¯ c m f d ( m ) P ¯ c o n ( m ) )
P scen , c o r ( d ) = P s cen ( d ) × ( P ¯ c m f d ( m ) P ¯ c o n ( m ) )
T c o n , c o r ( d ) = T c o n ( d ) + ( T ¯ c m f d ( m ) T ¯ c o n ( m ) )
T scen , c o r ( d ) = T s c e n ( d ) + ( T ¯ c m f d ( m ) T ¯ c o n ( m ) )
Here, P c o n ( d ) and P con , c o r ( d ) are the original and corrected series of simulated precipitation in the historical period, respectively. P ¯ c o n ( m ) and P ¯ c m f d ( m ) are the average monthly precipitation of simulated and CMFD in the historical period, respectively. P s cen ( d ) and P scen , c o r ( d ) are the original and corrected series of simulated precipitation in the future period, respectively.
T c o n , c o r ( d ) = T c o n ( d ) + ( T ¯ c m f d ( m ) T ¯ c o n ( m ) )
T scen , c o r ( d ) = T s c e n ( d ) + ( T ¯ c m f d ( m ) T ¯ c o n ( m ) )
Here, T c o n ( d ) and T c o n , c o r ( d ) are the original and corrected series of simulated temperature in the historical period, respectively. T ¯ c o n ( m ) and T ¯ c m f d ( m ) are the average monthly temperature of simulated and CMFD in the historical period, respectively. T s c e n ( d ) and T scen , c o r ( d ) are the original and corrected series of simulated temperature in the future period, respectively.
The calibrated VIC model is driven by the bias-corrected outputs of five GCMs combined with the average. The changes of evapotranspiration, soil moisture, and runoff are predicted from 2015 to 2100. For the simulation of future scenarios, we also used two years to initiate the model. Additionally, 2017–2100 was further divided into three periods: near-term (2017–2040), mid-term (2041–2070) and late-term (2071–2100) future, to compare the hydrological response characteristics of climate change in different periods.

3. Results

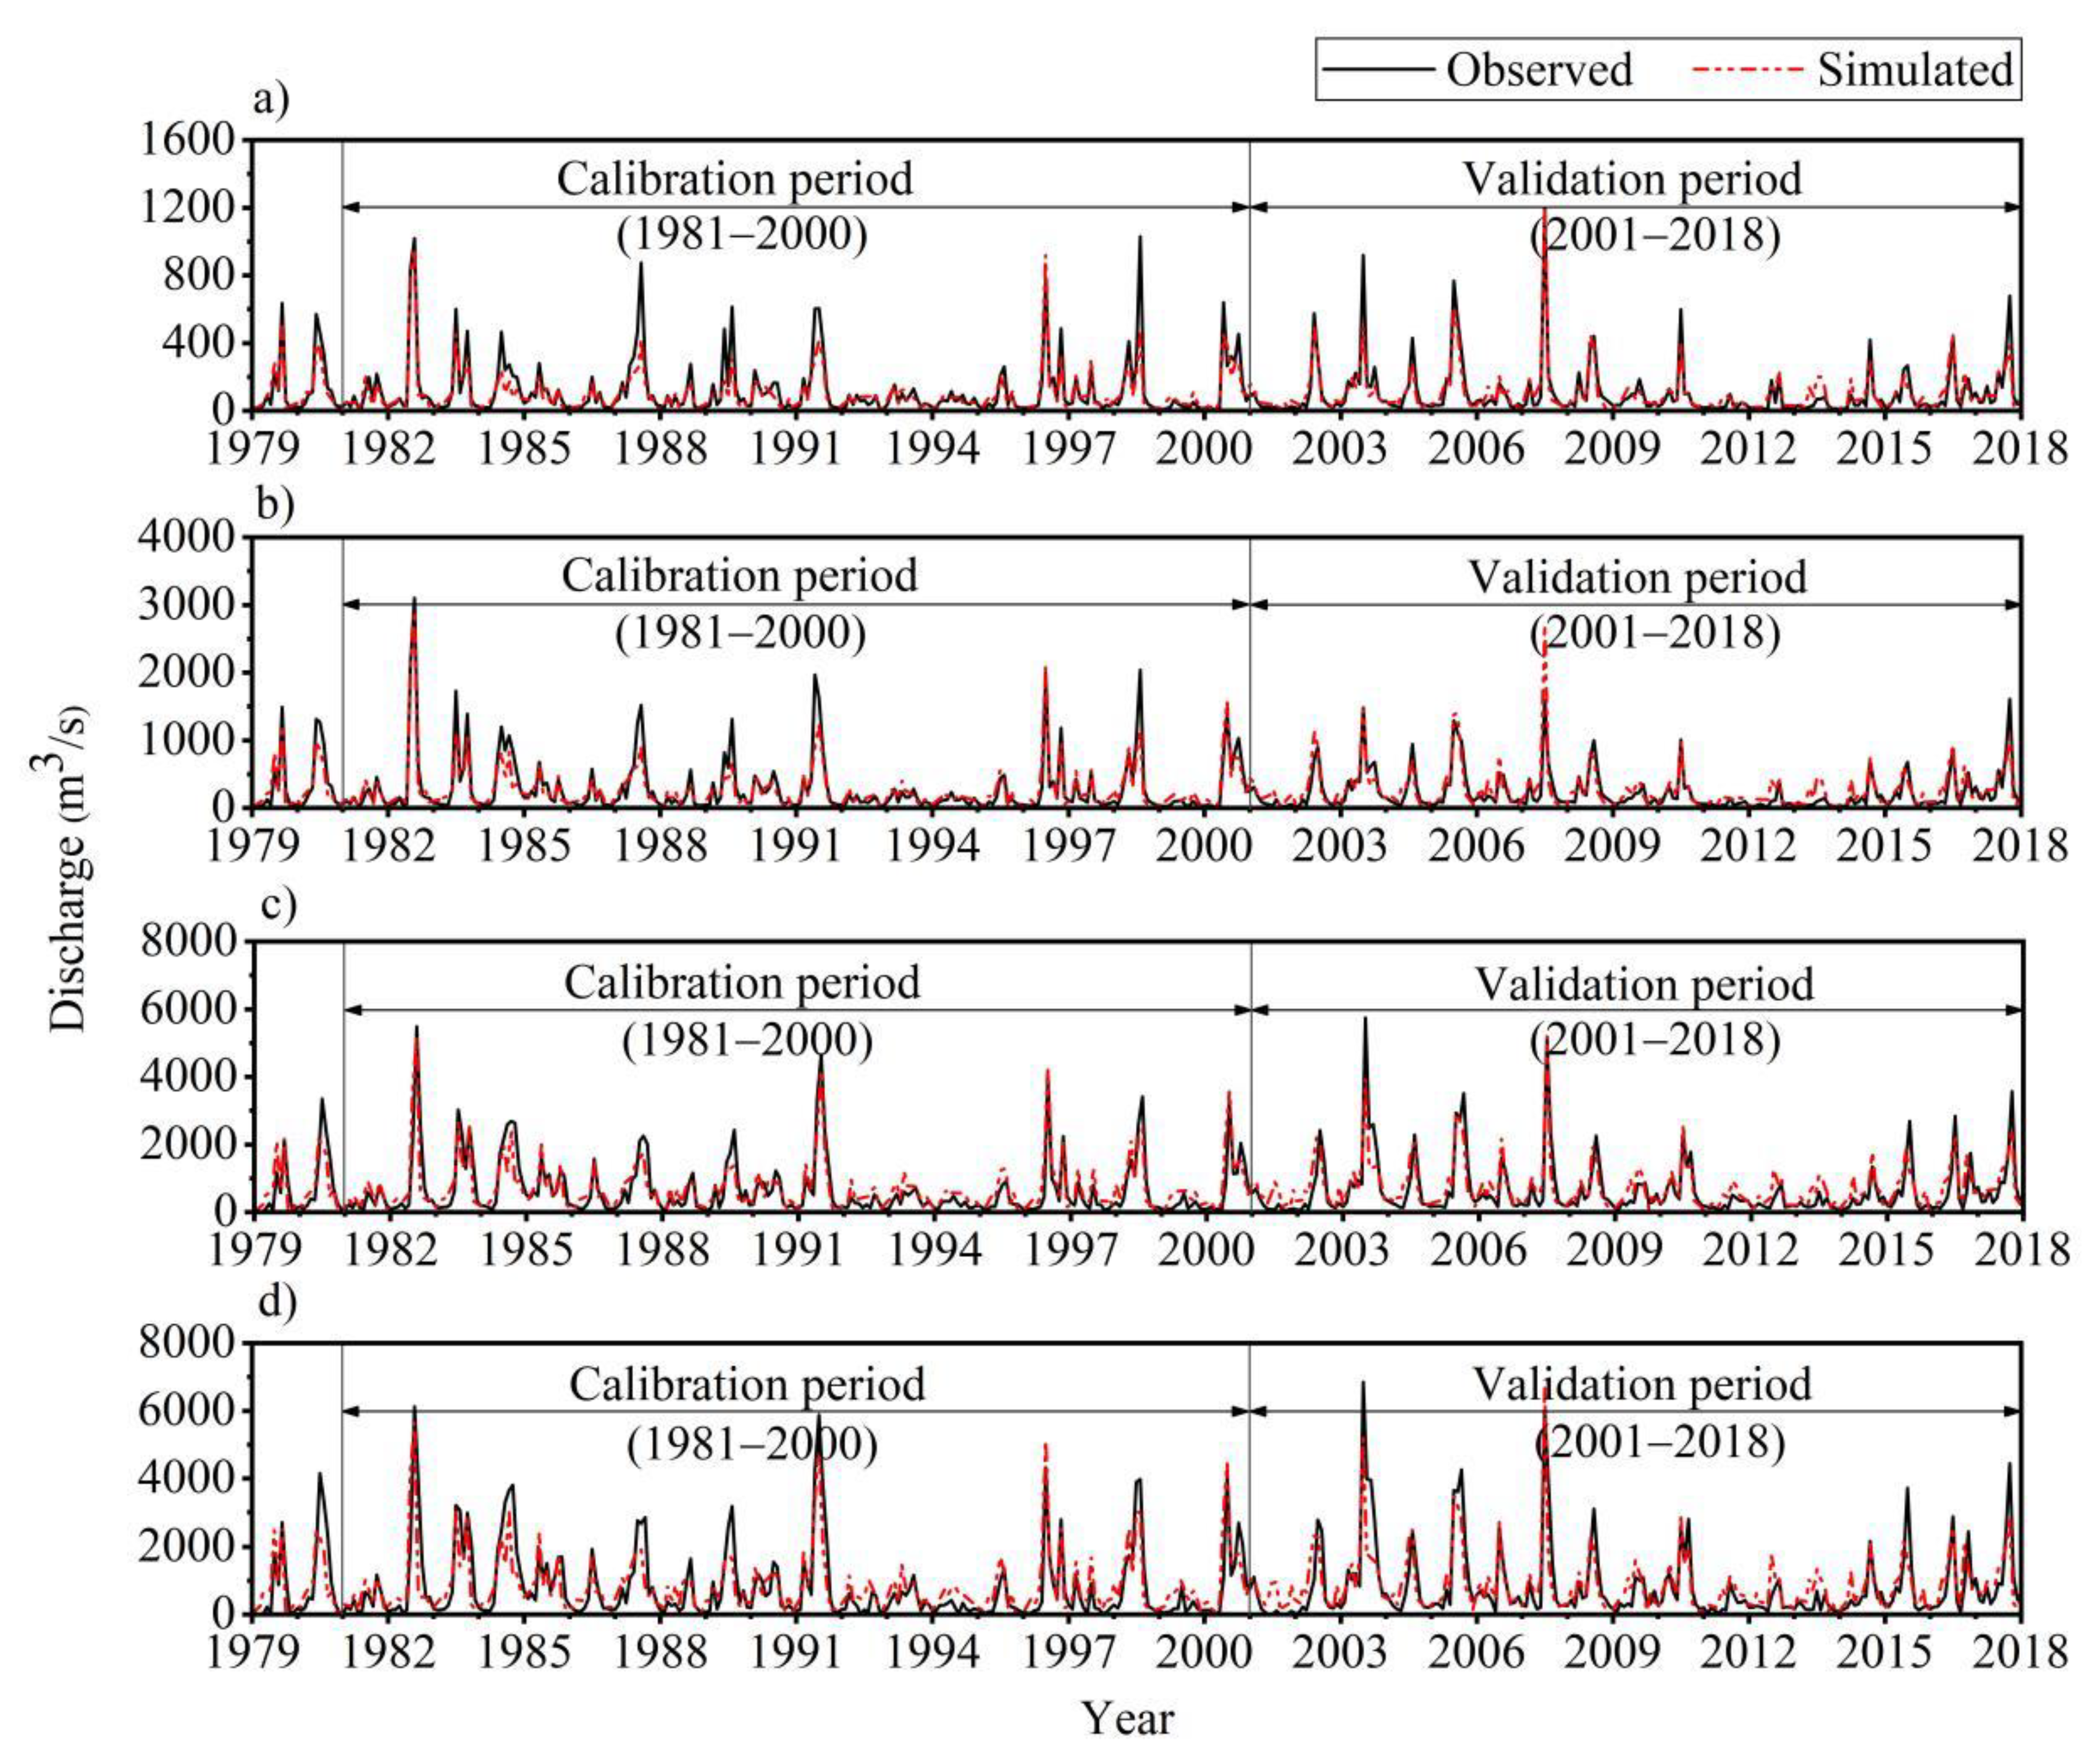
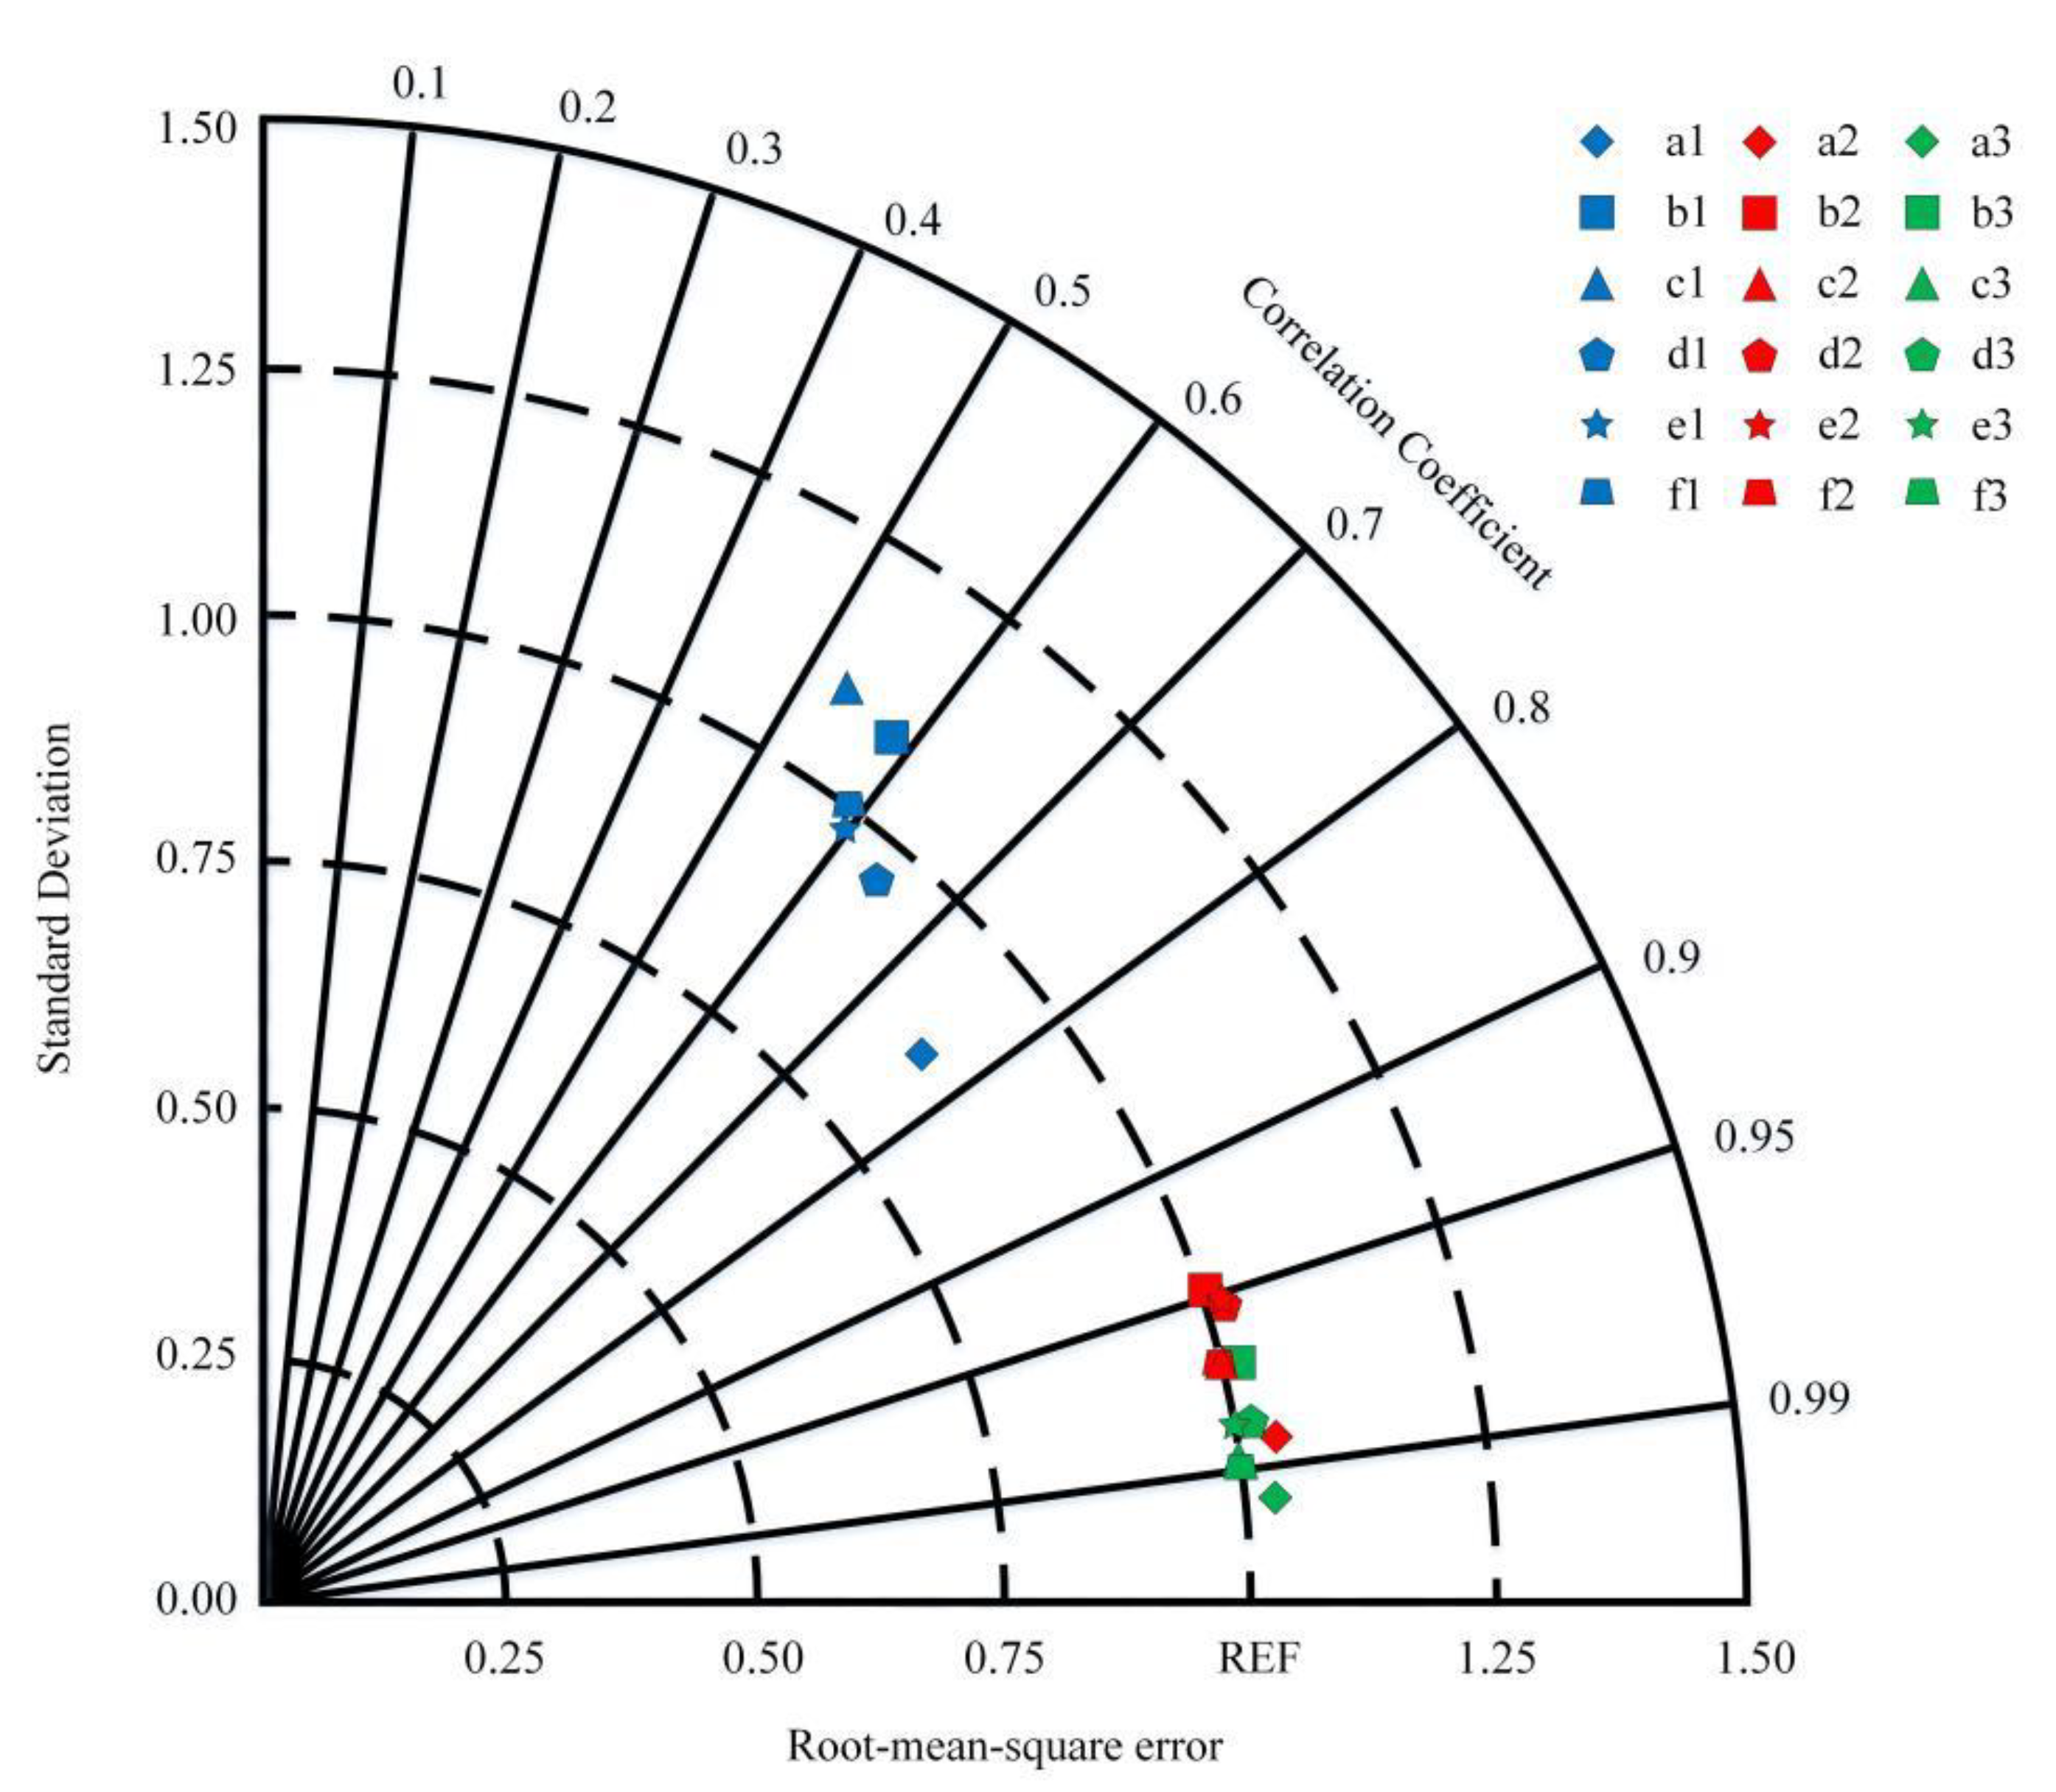
3.1. Model Evaluation

Figure 2 presents a comparison of the observed and simulated monthly discharge for the calibration and validation periods at four hydrologic stations (Xixian, Wangjiaba, Lutaizi, and Bengbu) after iteratively adjusting the seven sensitive parameters. The results demonstrate that the simulated series provide a good match to the observed series. The simulated results reasonably captured the change characteristics of the observed data. Past studies noted that the modeling performance is satisfactory when Er ± 0.25 and NSE > 0.50 [49,50]. Here, as shown in Table 3, the average values of R, Er, and NSE at the three hydrological stations are 0.89, −0.03, and 0.78 during the calibration periods, and 0.88, 0.09, and 0.76 during the validation periods, respectively. Except for the Xixian station, the VIC model performed better in calibration periods than in validation periods. The reasons for this phenomenon arise from two aspects. First, the data of the underlying surface and the vegetation are from earlier times, so the data had a certain deviation from the actual situation in the calibration period. Second, due to the high intensity of human activities in the UMHRB, the fitting effect is affected by water storage and transfer by human intervention. In general, the performance indices obtained from the model simulation show that the model performs well in simulating the hydrological process of the UMHRB and thus is used for further analysis.
The period 1979–2014 shared by the CMFD and five GCMs was selected as the historical period of bias-corrected meteorological data. Figure 3 compares the average monthly precipitation and maximum and minimum temperatures among the CMFD and raw GCMs and bias-corrected GCMs. The results show that five GCMs overestimated the monthly mean precipitation in spring. The IPSL-CM6A-LR and MIROC6 predicted better in summer precipitation. The prediction effect of temperature was generally better than that of precipitation (Figure 3). The CMIP6 models improved the performance of precipitation prediction, but the uncertainty of monsoon precipitation still exists [51]. Figure 4 shows the correlation coefficient (R), root-mean-square error (RMSE), and the standard deviation (SD) between the predicted values and the CMFD values of precipitation, maximum temperature (Tmax), and minimum temperature (Tmin). The five-GCM ensemble simulation is better than any single model. The R was 0.73, 0.98, and 0.99 in precipitation, Tmax, and Tmin, respectively. The RMSEs were 0.70, 0.20, and 0.13, respectively, and the SD was 0.84, 0.99, and 1.00, respectively. Therefore, the five-GCM ensemble can drive the VIC model to study the hydrological response of the UMHRB under climate change.

3.2. Annual Change Analysis in Climate Parameters

Table 4 shows that the annual averaged precipitation is 936.7 mm in the historical period (1981–2014). In the future, precipitation increases to different amounts in three periods under the four scenarios. Under the SSP1-2.6 scenario, the annual averaged precipitation values are 982.2, 1014.0, and 1044.7 mm in the near-term (2017–2040), mid-term (2041–2070), and late-term (2071–2100) future, respectively. Precipitation increases continuously in the future, and the average relative increasing rates are 4.9%, 3.2%, and 3.0% in three future periods. In the near-term, the precipitation changes gradually increased from south to north (Figure 5). In the mid-term, the precipitation decreases in the grids at the northeastern edge of the basin and increases in other places. In the late-term, precipitation in the western and southeastern parts of the basin increases slightly (2%) compared to the mid-term, and the average increases in other areas (4%). Under the SSP2-4.5 scenario, the annual averaged precipitation values are 938.6, 986.6, and 1026.9 mm in the near-term (2017–2040), mid-term (2041–2070), and late-term (2071–2100) future, respectively. The annual precipitation changes very little in the near-term, but spatially there is a decreasing trend at the center of the basin, while a slight increase occurs in other places. The average annual precipitation in the basin increases by approximately 5.1% in the mid-term with respect to that in the near-term; the increase in annual precipitation from northwest to southeast is a trend of low–high–low. The average relative increasing rate is 4.1% in the late-term. The precipitation changes gradually increase from south to north. The annual averaged precipitation values are 963.1, 970.3, and 1023.9 mm in three periods under the SSP3-7.0 scenario. In the near-term, the precipitation in the southern marginal zones decreases slightly, while in other areas precipitation increases (2.8%). The changes of precipitation in the mid-term are not obvious compared with the near-term. The average relative increasing rate is 0.7%. The increase in annual precipitation projected in the late-term is higher than that projected in the near-term and mid-term, with an average increase of 5.5%. In the SSP5-8.5 scenario, the average relative increasing rate of precipitation is the same as the SSP1-2.6 scenario (4.9%) in the near-term. The relative increasing rate drops to 1.6% in the mid-term. However, the precipitation increases significantly (7.7%) in the late-term compared with the mid-term. The annual averaged precipitation value is 1076.3 mm, which is the largest precipitation value among the four scenarios at the end of the 21st century.
The annual averaged maximum temperature is 19.0 °C in the historical period (Table 4). The maximum temperature will increase in the future. Except for the near-term, the future annual maximum temperature is the lowest and highest under SSP1-2.6 and SSP5-8.5, respectively. However, the distribution of the maximum temperature in the four scenarios remains consistent, which is higher in the southeast than in the northwest. In the SSP1-2.6 scenario, the maximum temperature average increases by 1.2 °C in the near-term compared with that in 1981–2014. The relative increases of maximum temperature in the mid-term and late-term drop successively, the maximum temperature average increases by 0.8 °C in the mid-term, while the value is 0.1 °C in the late-term (Table 4). In the SSP2-4.5 scenario, the changes in maximum temperature are the same as those under the SSP1-2.6 scenario in the near-term and mid-term (Figure 6). In the late-term, the maximum temperature average increases by 0.7 °C. The increase in maximum temperature is basically the same as that in the mid-term. The maximum temperature shows a significantly increasing trend under the SSP3-7.0 and SSP5-8.5 scenarios in the future. The difference is that the increase is larger under the SSP5-8.5 scenario.
The annual averaged minimum temperature is 11.4 °C in the historical period (Table 4). Similar to the annual average maximum temperature, except for the near-term, the minimum temperature is lowest in the SSP1-2.6 scenario and highest in the SSP5-8.5 scenario. The overall distribution is also consistent with the maximum temperature. In the near-term, there is an increase of 1.1 °C in annual minimum temperature in the SSP1-2.6 and SSP2-4.5 scenarios. Under the SSP1-2.6 scenario, the minimum temperature average increases by 0.3 °C in the mid-term, the temperature is lower in the western part of the basin (Figure 7). In the late-term, the minimum temperature average decreases by 0.3 ℃ compared to the mid-term. This was the only period in which the minimum temperature decreases, and the mean value is flat compared to that of the near-term. Under the SSP2-4.5 scenario, the minimum temperature shows an increasing trend (0.7 °C) in the mid-term, and the increase in the eastern corner of the basin is relatively small (Figure 7). Under the SSP3-7.0 scenario, the minimum temperature increases continuously in the future, and the average increasing rates are similar (0.9 °C in the near-term and 0.8 °C in the mid-term). In the late-term, the temperature significantly increases by 1.3 °C. Under the SSP5-8.5 scenario, the changes in minimum temperature are the same in the near-term and mid-term (1.2 °C). The minimum temperature average increases by 1.8 °C in the late-term, which is the largest increase in the three periods under the four scenarios.

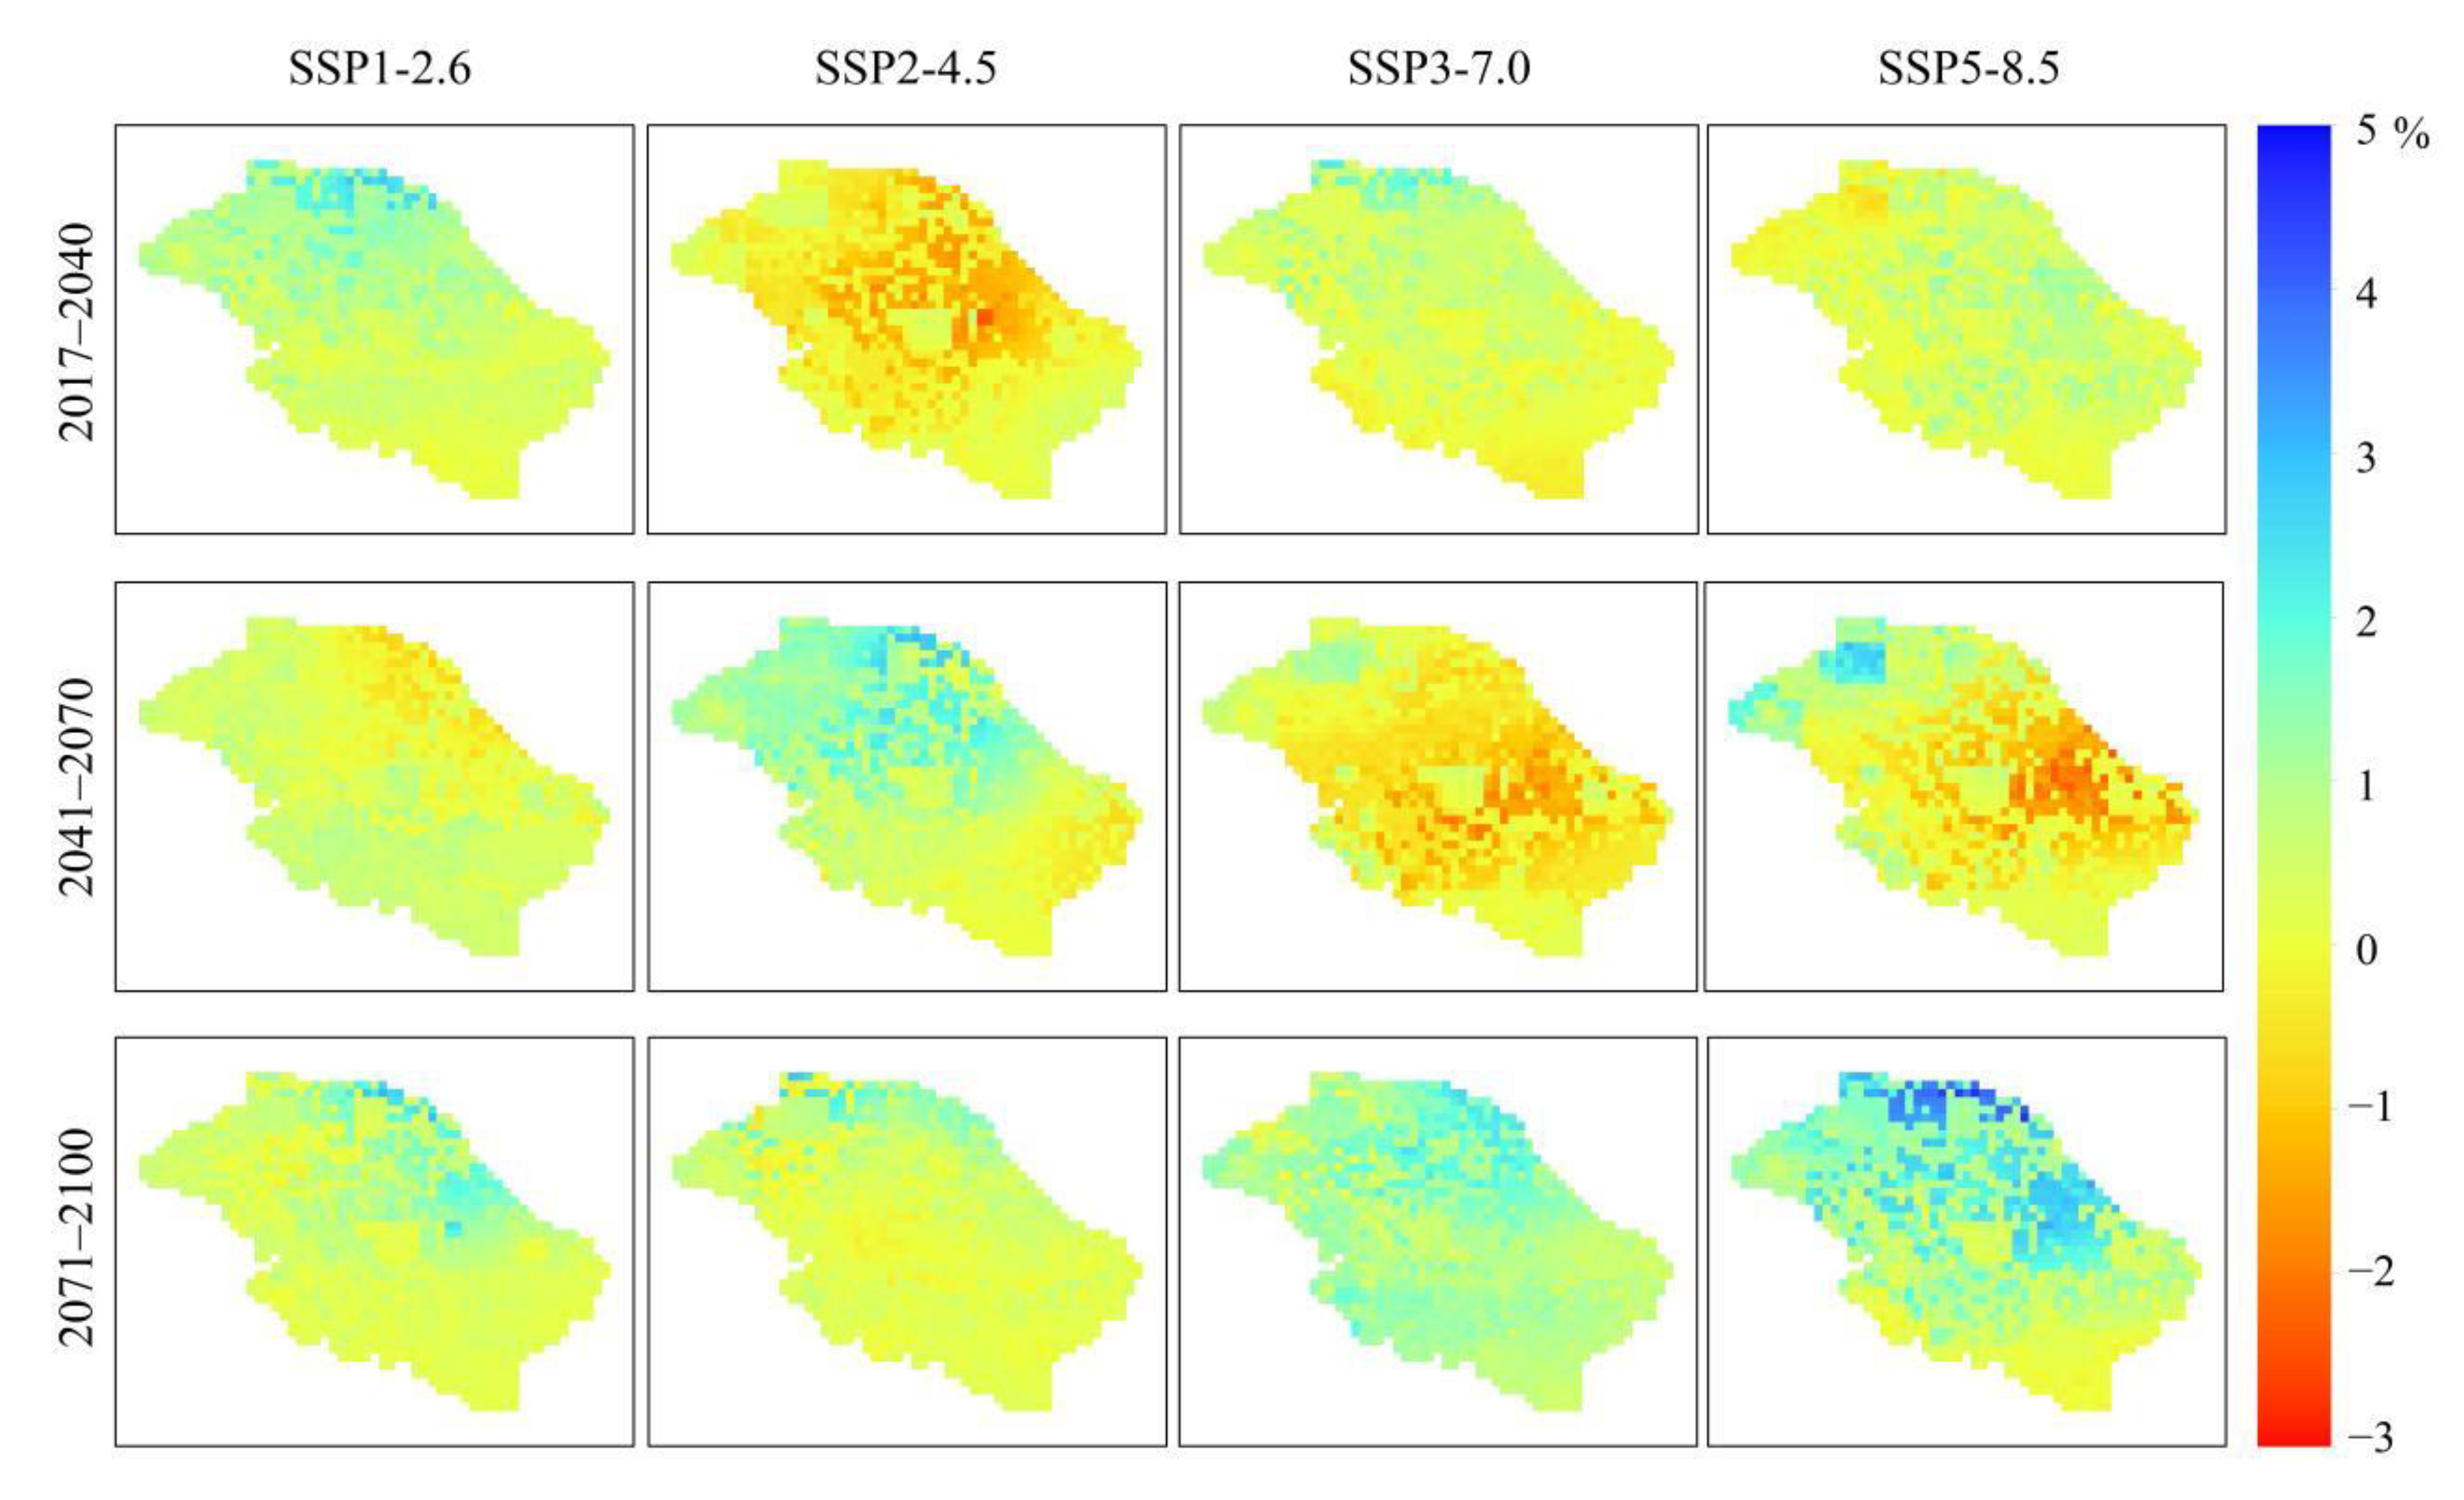
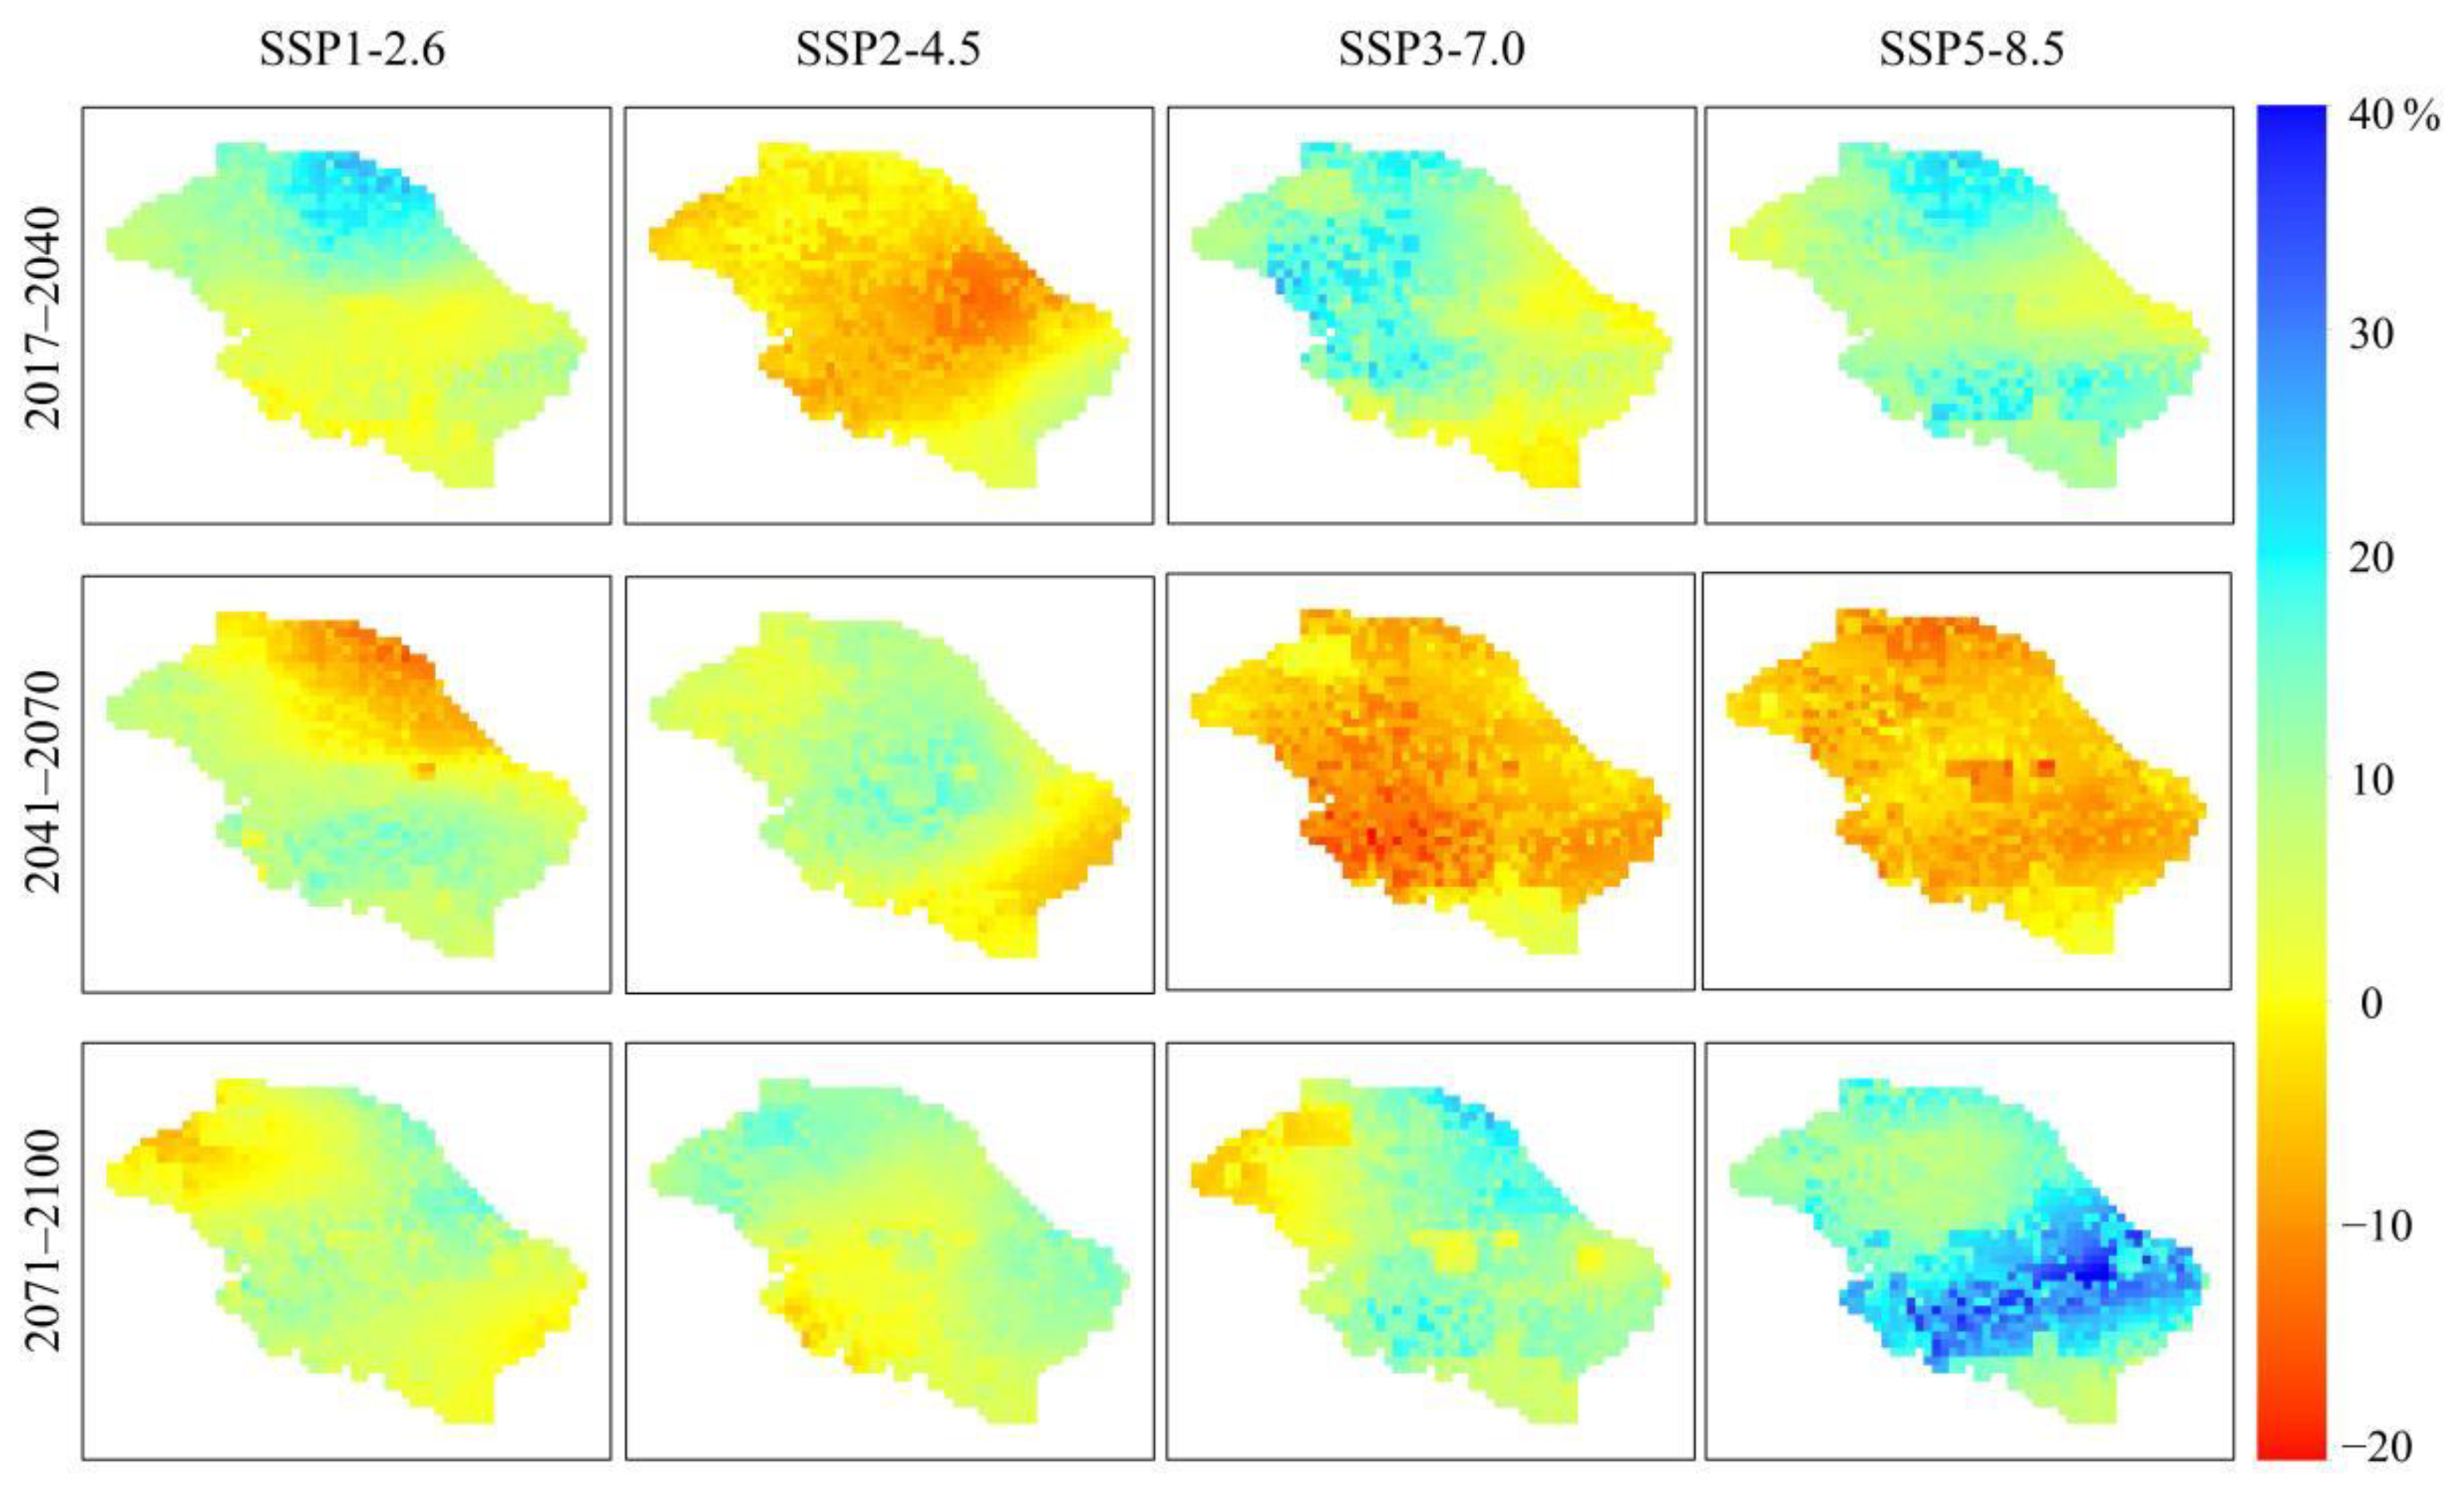
3.3. Annual Change Analysis in Hydrological Responses to Climate Changes

Table 5 shows that the annual evapotranspiration is 826.4 mm in the historical period. Evapotranspiration increases continuously in the future. Specifically, under the SSP1-2.6 scenario, the annual averaged evapotranspiration values are 862.0, 890.9, and 913.9 mm in the near-term, mid-term, and late-term, respectively. The average increasing rate is 4.3% in the near-term. The increase is larger in the north part of the basin (Figure 8). In the mid-term, the evapotranspiration gradually increases from the northeast to the southwest with a 3.4% average increase. In the late-term, the evapotranspiration average increases by 2.6% compared to that in the mid-term. Under the SSP2-4.5 scenario, it does not show an obvious change in the near-term (0.7%), whereas the evapotranspiration in the basin increases significantly, with an average increase of 5.1% in the mid-term. The increase is concentrated in the north-central part of the basin (Figure 8). Evapotranspiration increases from south to north, with an average growth rate of 3.8% in the late-term. Under the SSP3-7.0 scenario, the average increasing rates are similar in the near-term (2.0%) and the mid-term (1.9%). The difference is that the increase of the southern region is smaller in the near-term, whereas the increase of the central region is smaller in the mid-term. The annual evapotranspiration in the late-term varies from 2.8% to 8.0%, with a more obvious increase in the southern part of the basin. Under the SSP5-8.5 scenario, the average relative increasing rates are 3.8% and 3.2% in the near-term and mid-term, respectively. In the late-term, except for the southeast and northwest edge, the evapotranspiration increases significantly, and the average relative increasing rate is 6.2%. Several grids in the middle of basin are lagging in the mid- and late-term.
The annual soil moisture is 31.7 mm in the historical period (Table 5). The percentage changes in soil moisture at the annual scale are shown in Figure 9. Under the SSP1-2.6 scenario, the soil moisture increases slightly by 0.7% in the near-term. In the mid-term, the soil moisture of some grids in the northeastern part of the basin decreases slightly, while that of others increases slightly (Figure 9). The soil moisture increase ranges from –0.2% to 3% in the late-term. Under the SSP2-4.5 scenario, the soil moisture is projected to decrease at first and then increase in the future. The soil moisture decreases by approximately 0.3% in the near-term, but increases by 0.8% and 0.4% in the mid- and late-term, respectively. Under the SSP3-7.0 scenario, soil moisture increases by 0.4% in the near-term. There is a decrease of 0.3% in the mid-term, and the mean value of soil moisture is basically the same as that in the historical period. In the late-term, the soil moisture increases to 32.0 mm. Under SSP5-8.5 scenario, the annual averaged soil moisture values are 31.8, 31.8, and 32.2 mm in the near-term, mid-term, and late-term, respectively. The average relative increasing rate is 0.4% in the near-term. In the mid-term, soil moisture decreases slightly in the central region, but the average value of the basin is consistent with the near-term. The soil moisture generally increases in the late-term, with an average increase of 1.2%. In general, the average soil moisture predicted by the four scenarios shows an increasing trend in the future, but the change rates are not obvious.
The annual runoff is 101.3 mm in 1981–2014 (Table 5). Under the SSP1-2.6 scenario, the runoff will continue to increase in the future. In the near-term, the runoff increases from south to north, with an average increase of 6.9%. In the mid-term, the value of runoff decreases in the northeast, while for other areas it increases (Figure 10). The runoff average increases by 5.7% in the basin. Except for a small decrease in the northwestern part, the increase of runoff is dominant in the late-term. Under the SSP2-4.5 scenario, the runoff decreases by 2.3% in the near-term. The runoff decreases in the southeast and increases in other areas, ranging from −6% to 17% in the mid-term. In the late-term, the average value of runoff increases to 111.1 mm. Under the SSP3-7.0 and SSP5-8.5 scenarios, the future runoff will increase first, then decrease and increase again. The runoff decreases in the south and increases in other areas (Figure 10), ranging from −2% to 27% in the near-term under the SSP3-7.0. In the mid-term, the runoff increases in the grids at the south and northwestern edge of the basin, and decreases in other places (Figure 10). In the late-term, the average value of runoff increases to 112.6 mm. The variation range of runoff in the near-term is 1% to 25%, and the average increase is 11.5%. The runoff average decreases by 5.1% in the mid-term. In the late-term, the average value of runoff increases to 125.9 mm. The runoff in the mainstream area of the Huaihe River increases significantly, reaching more than 30%.

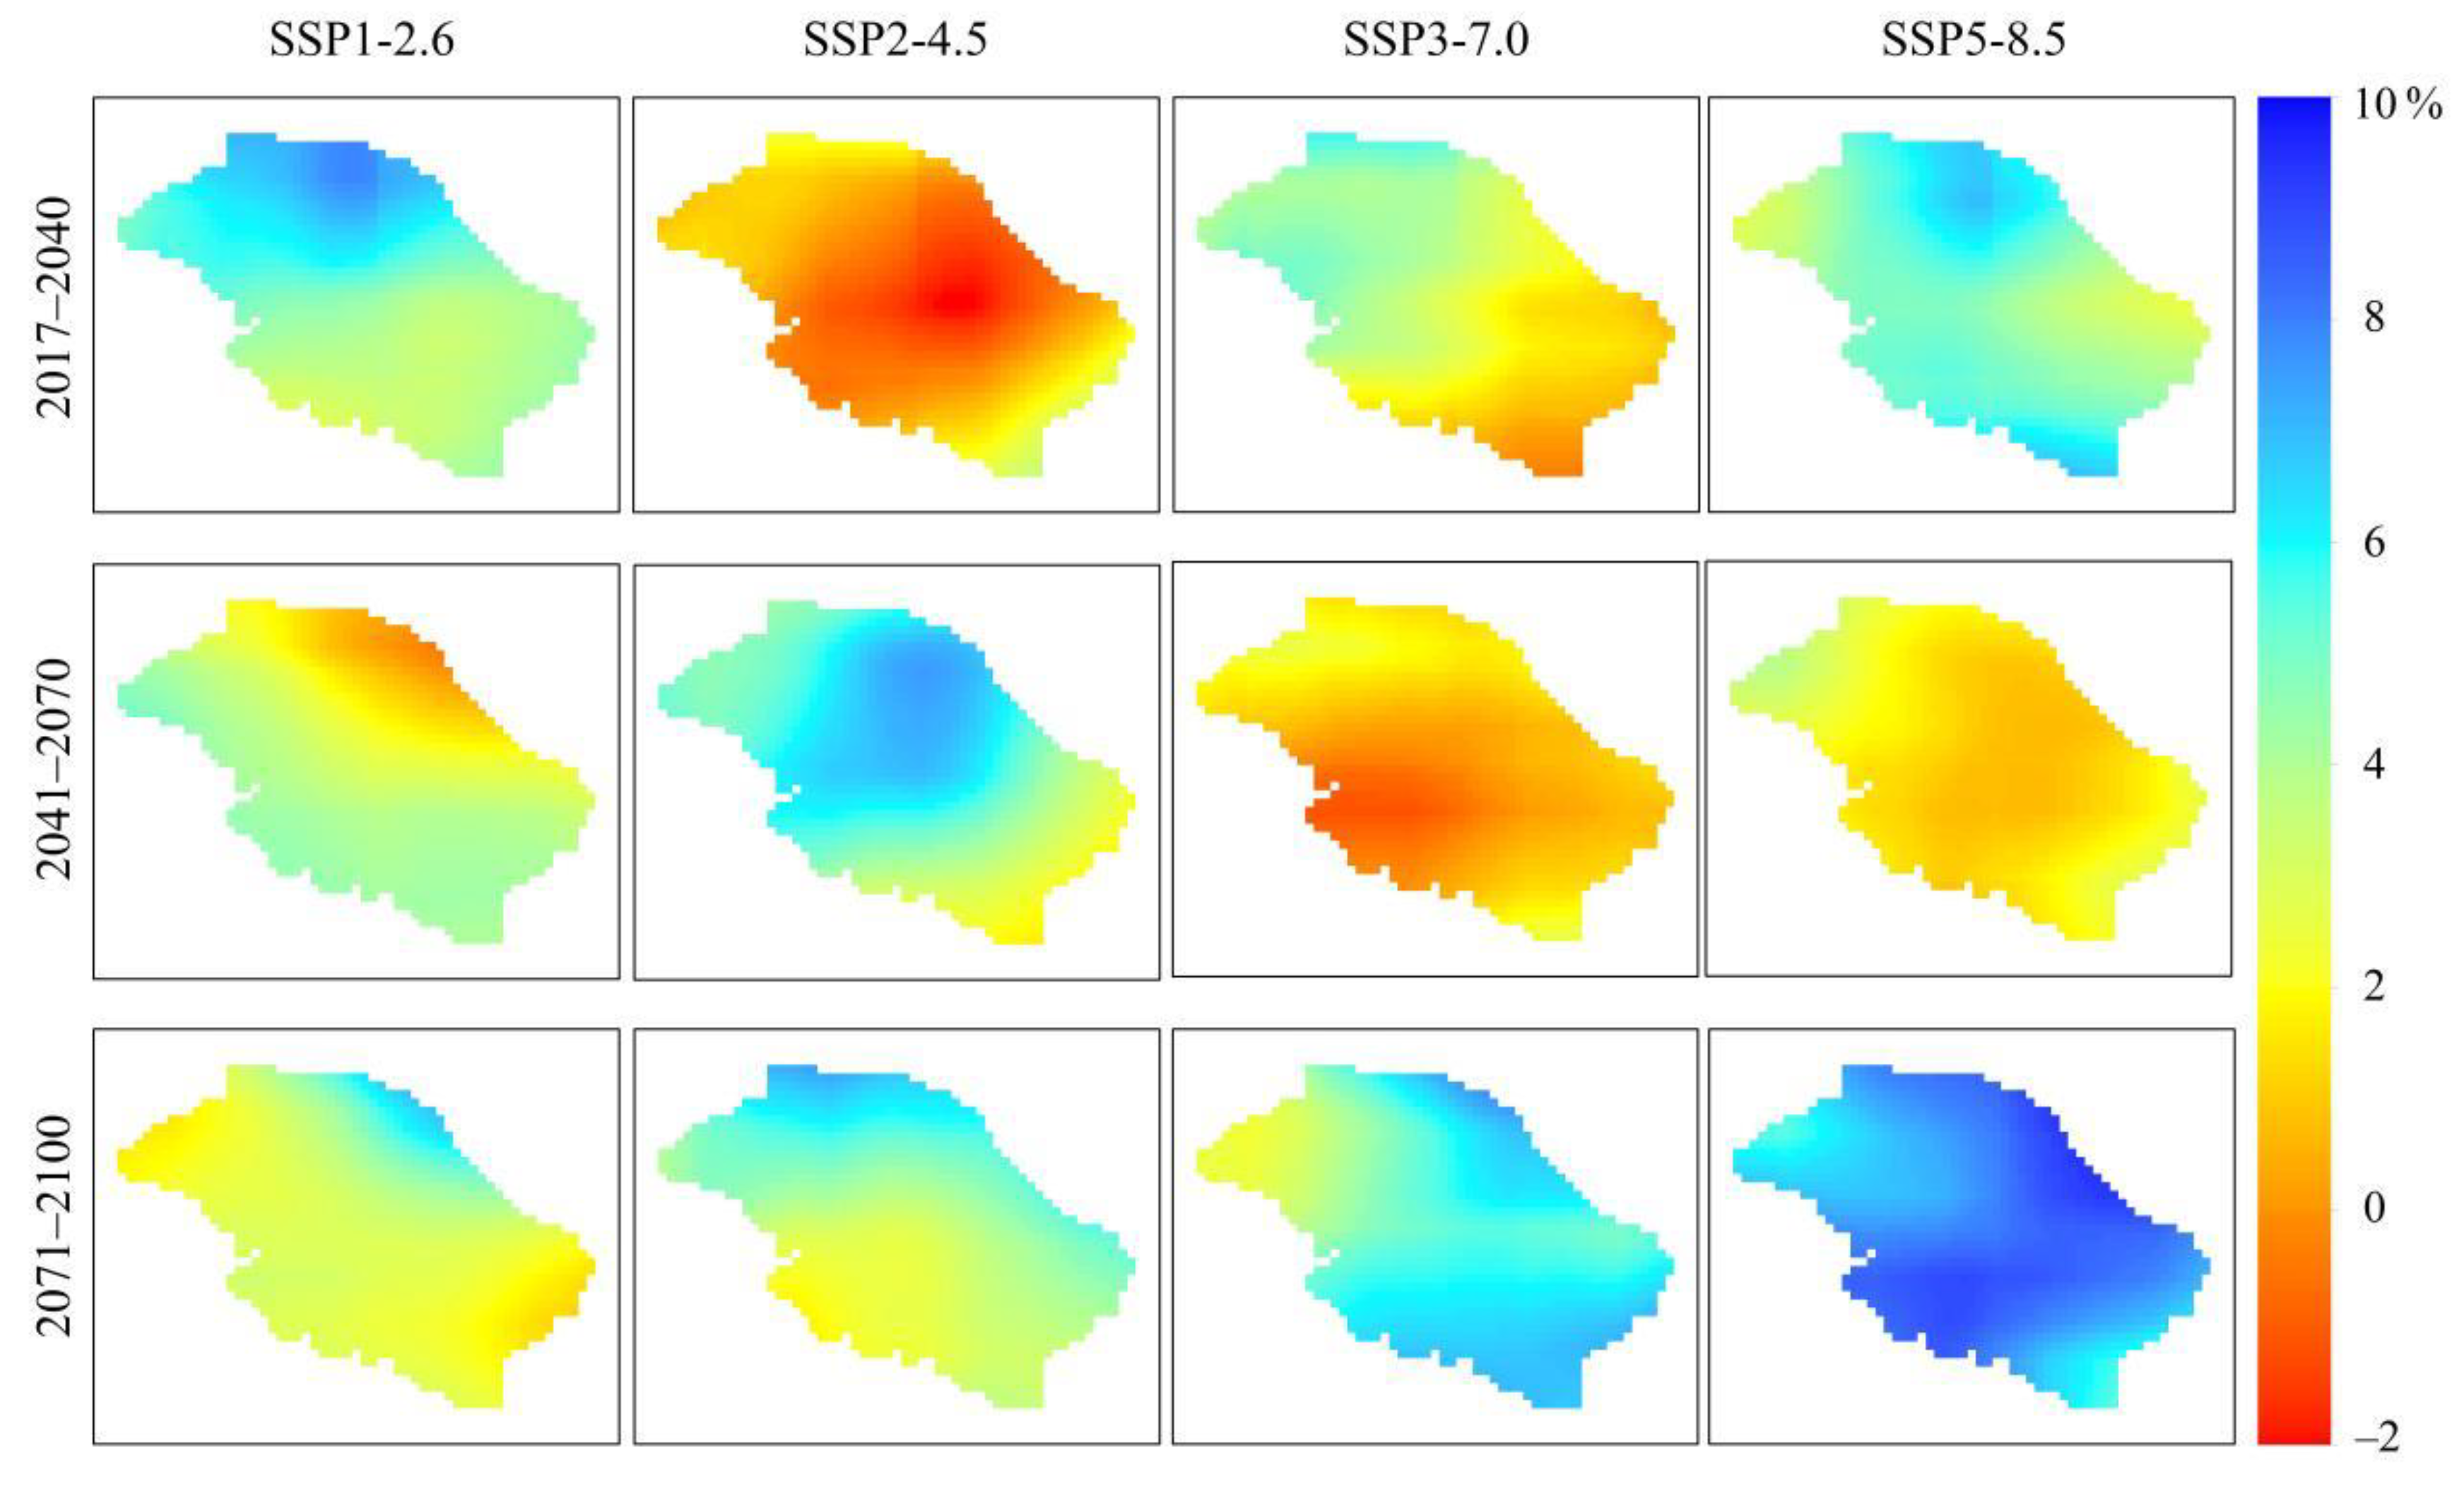
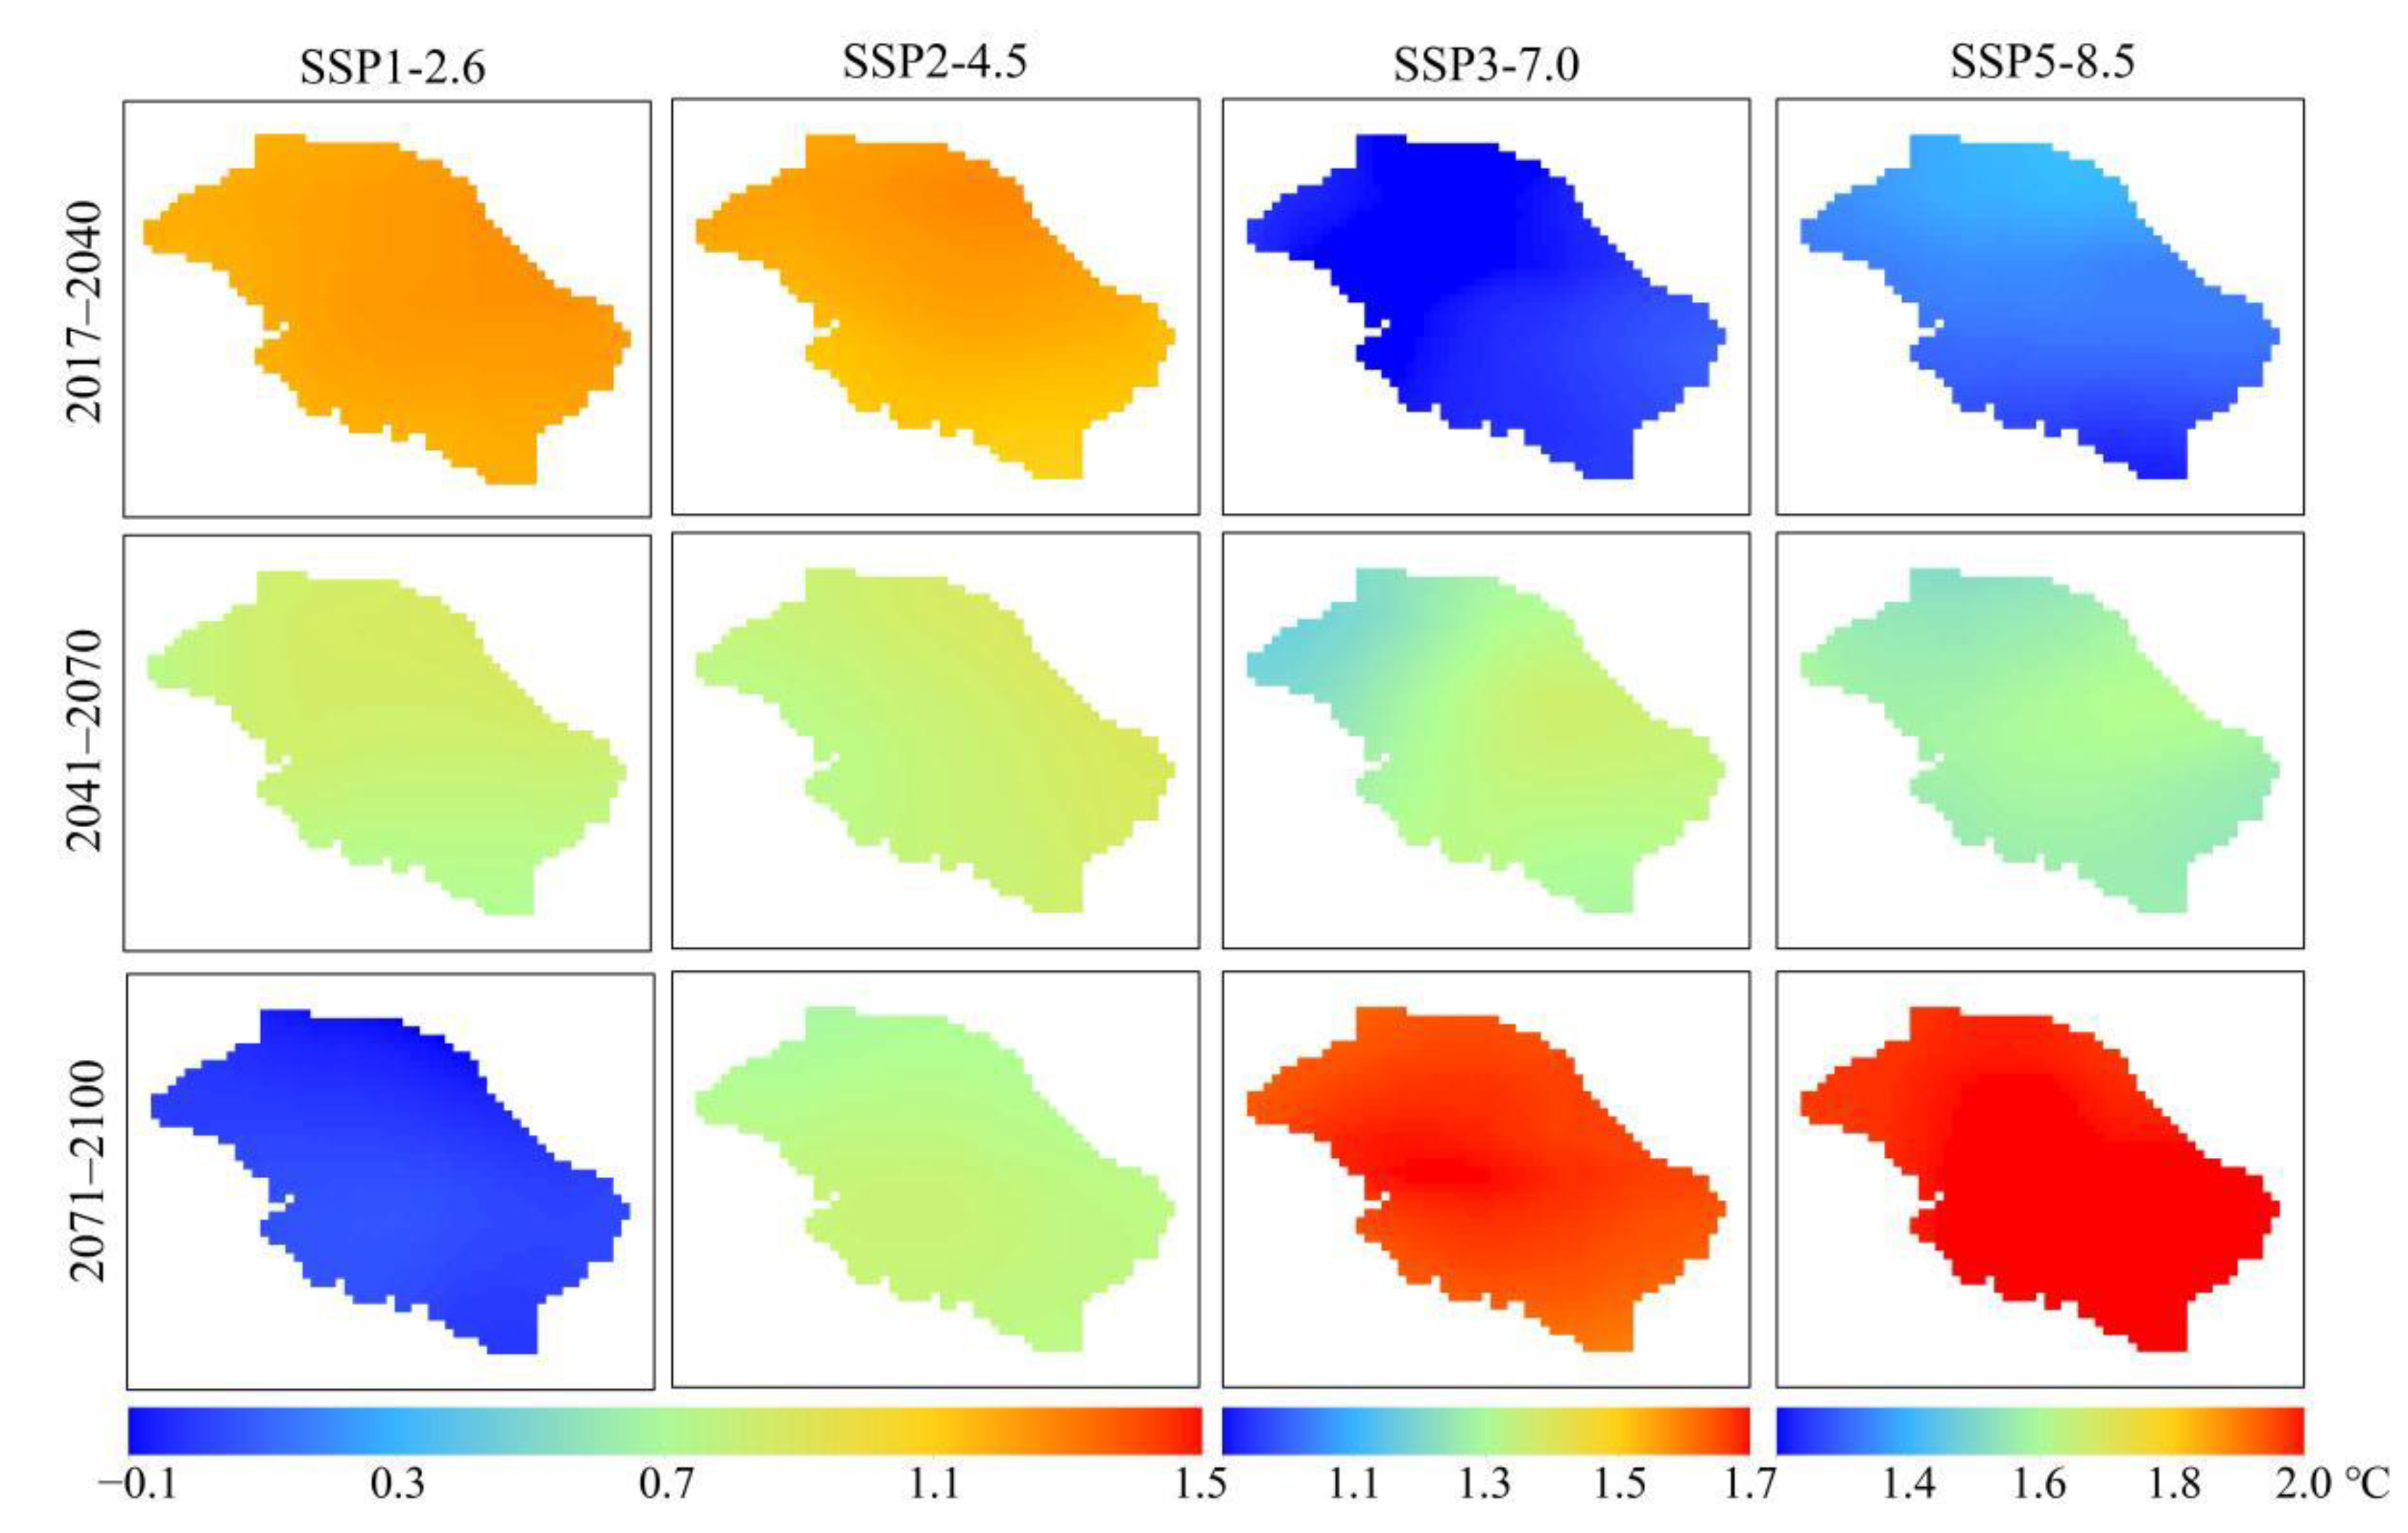
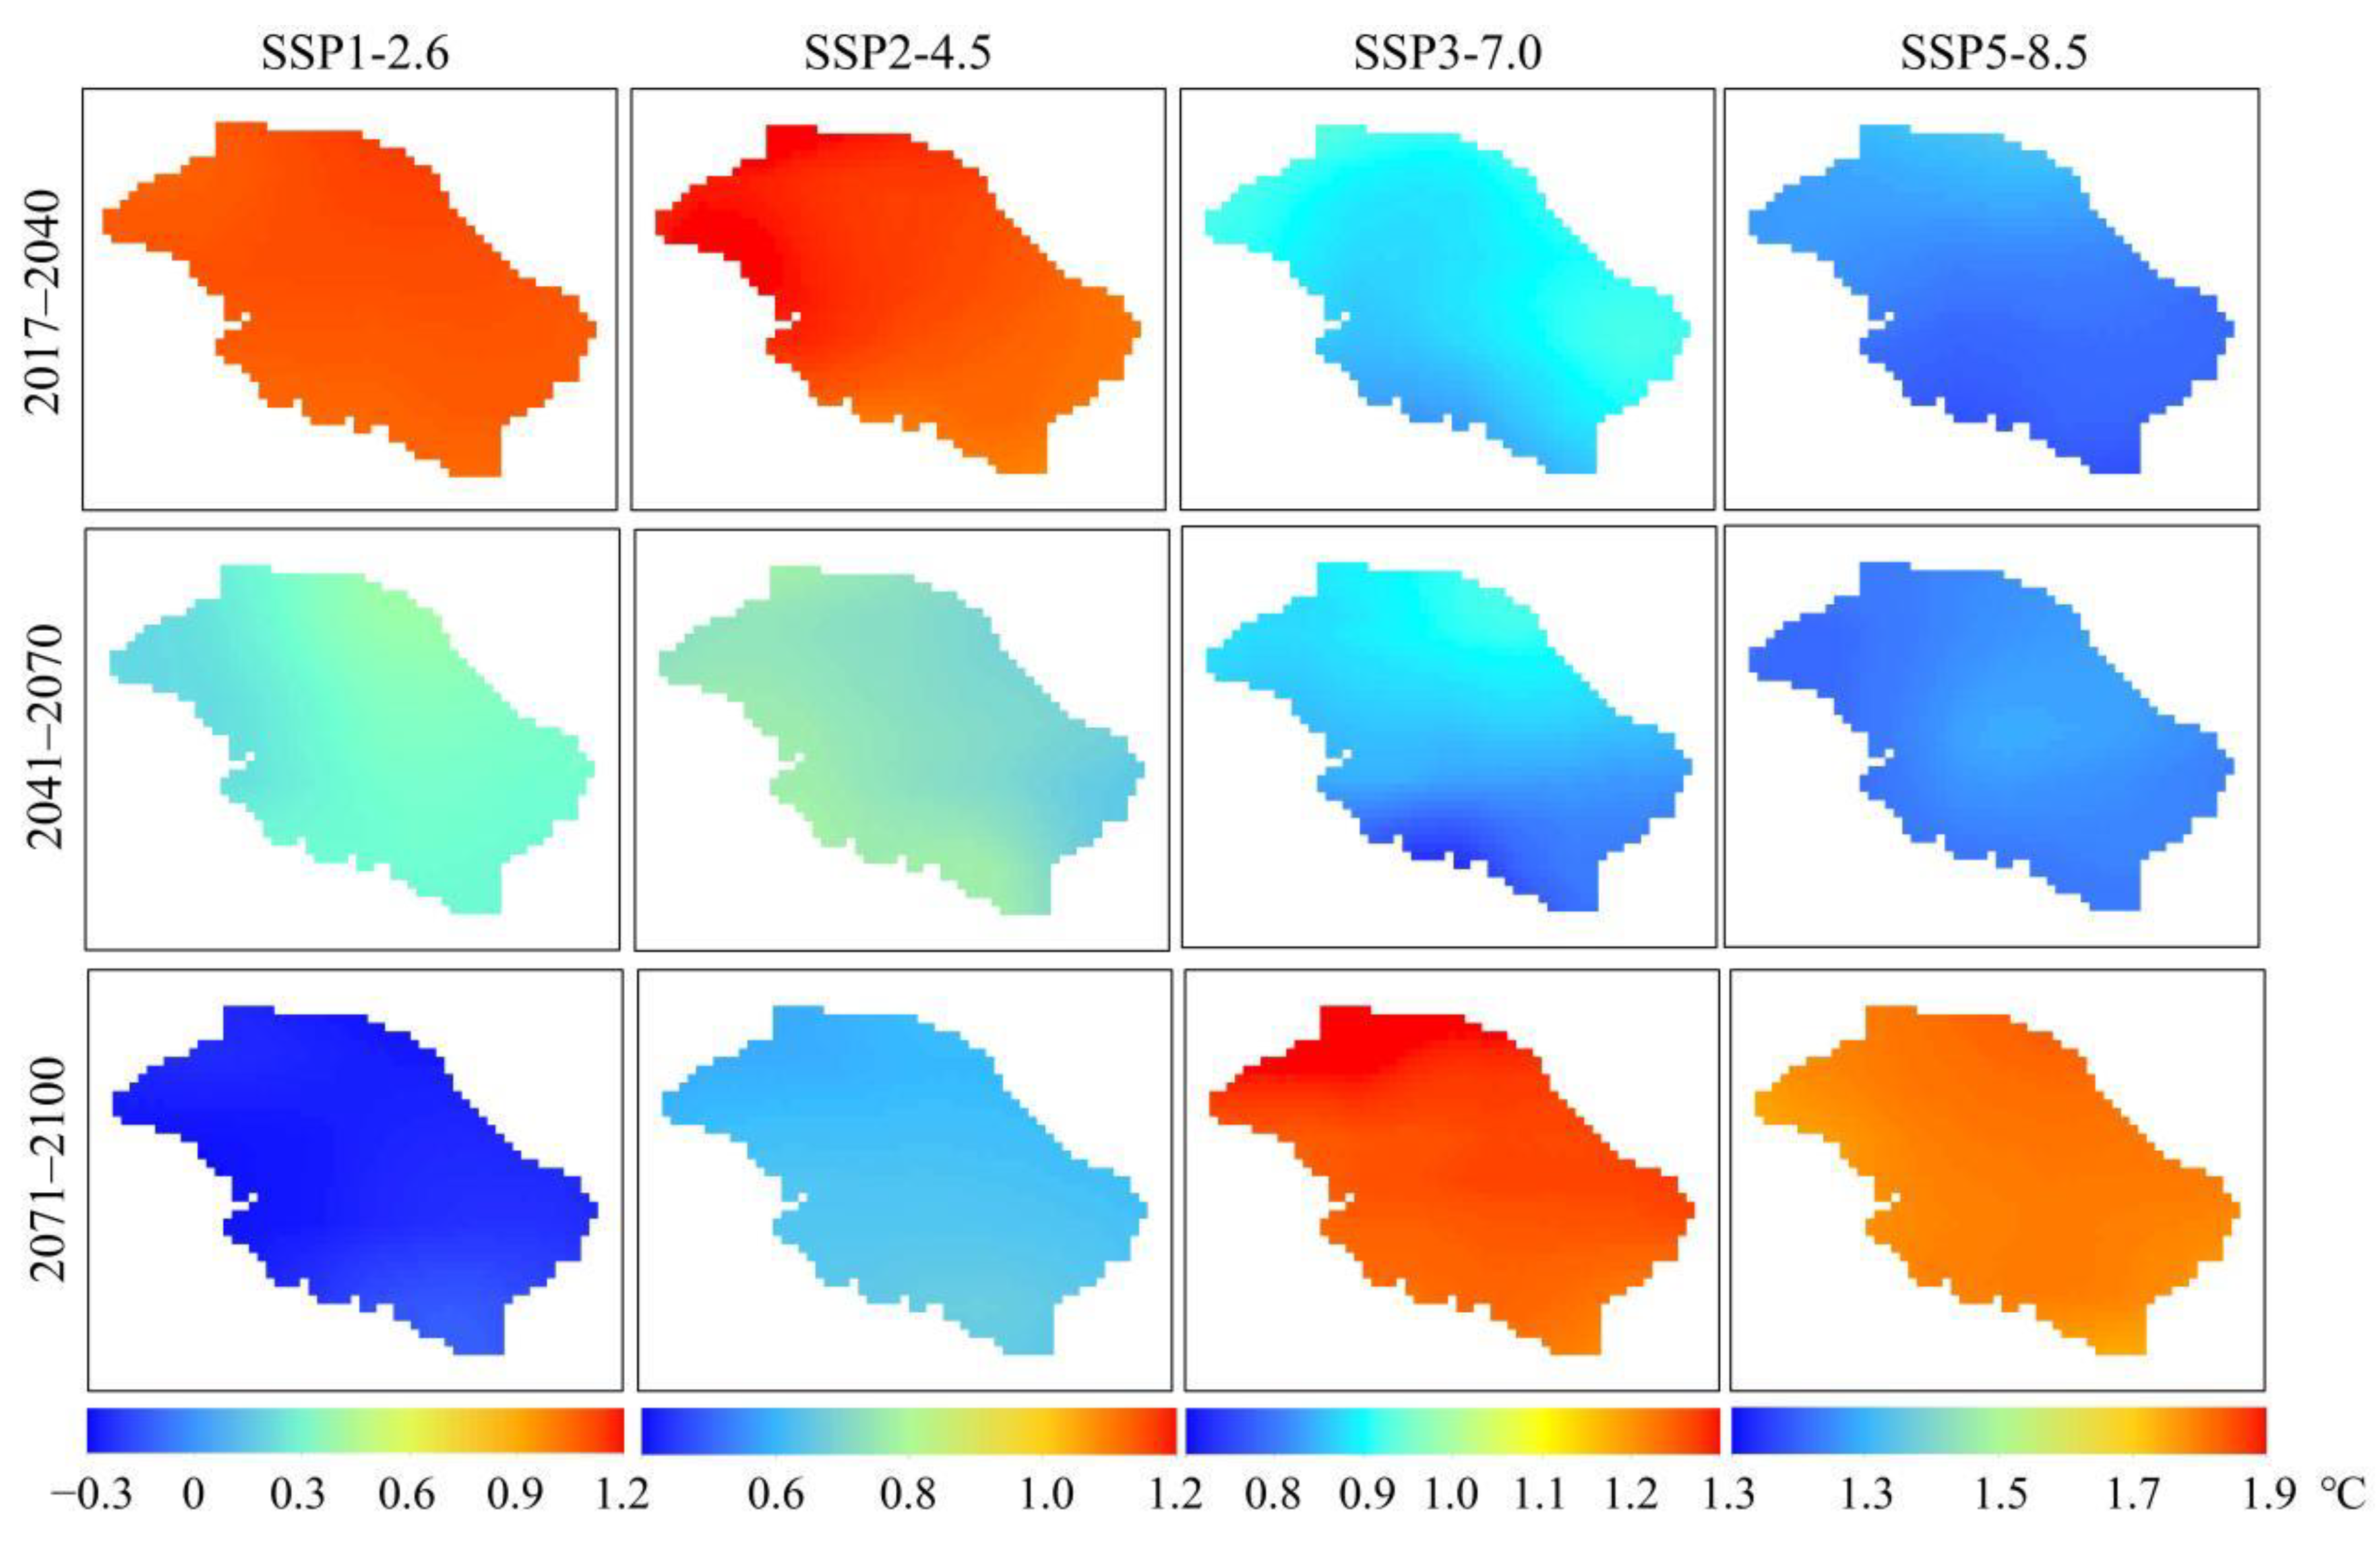
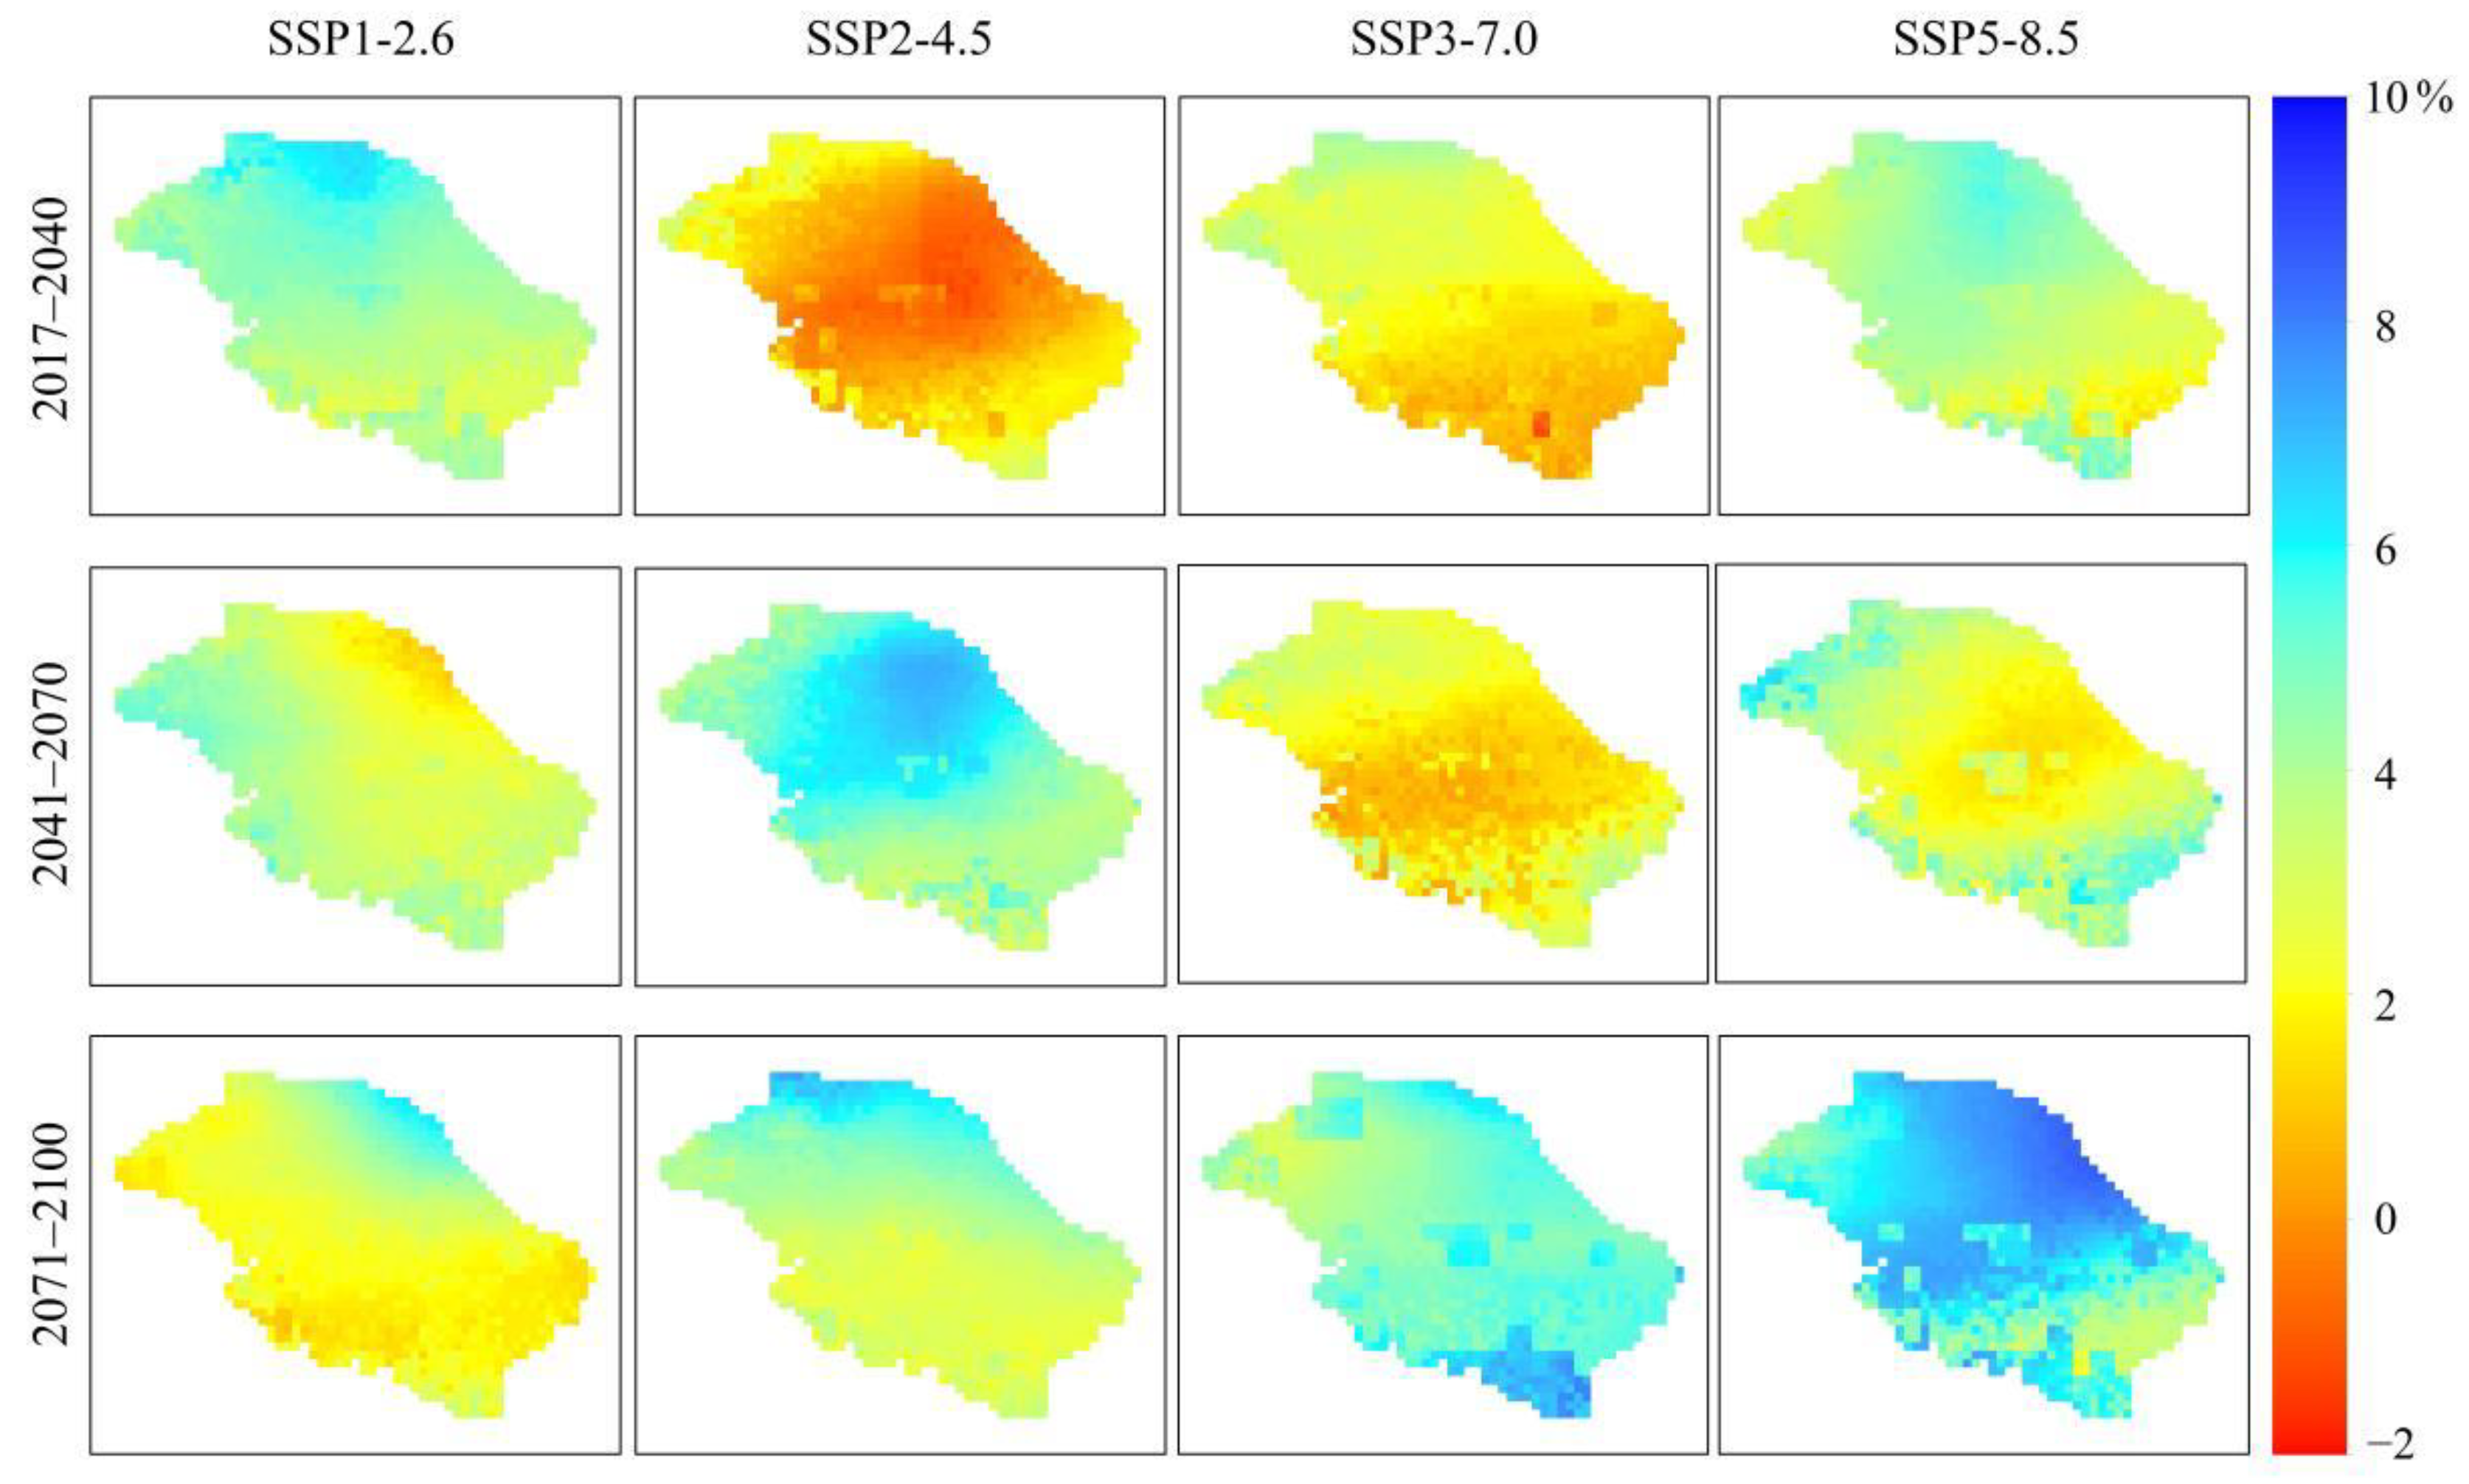
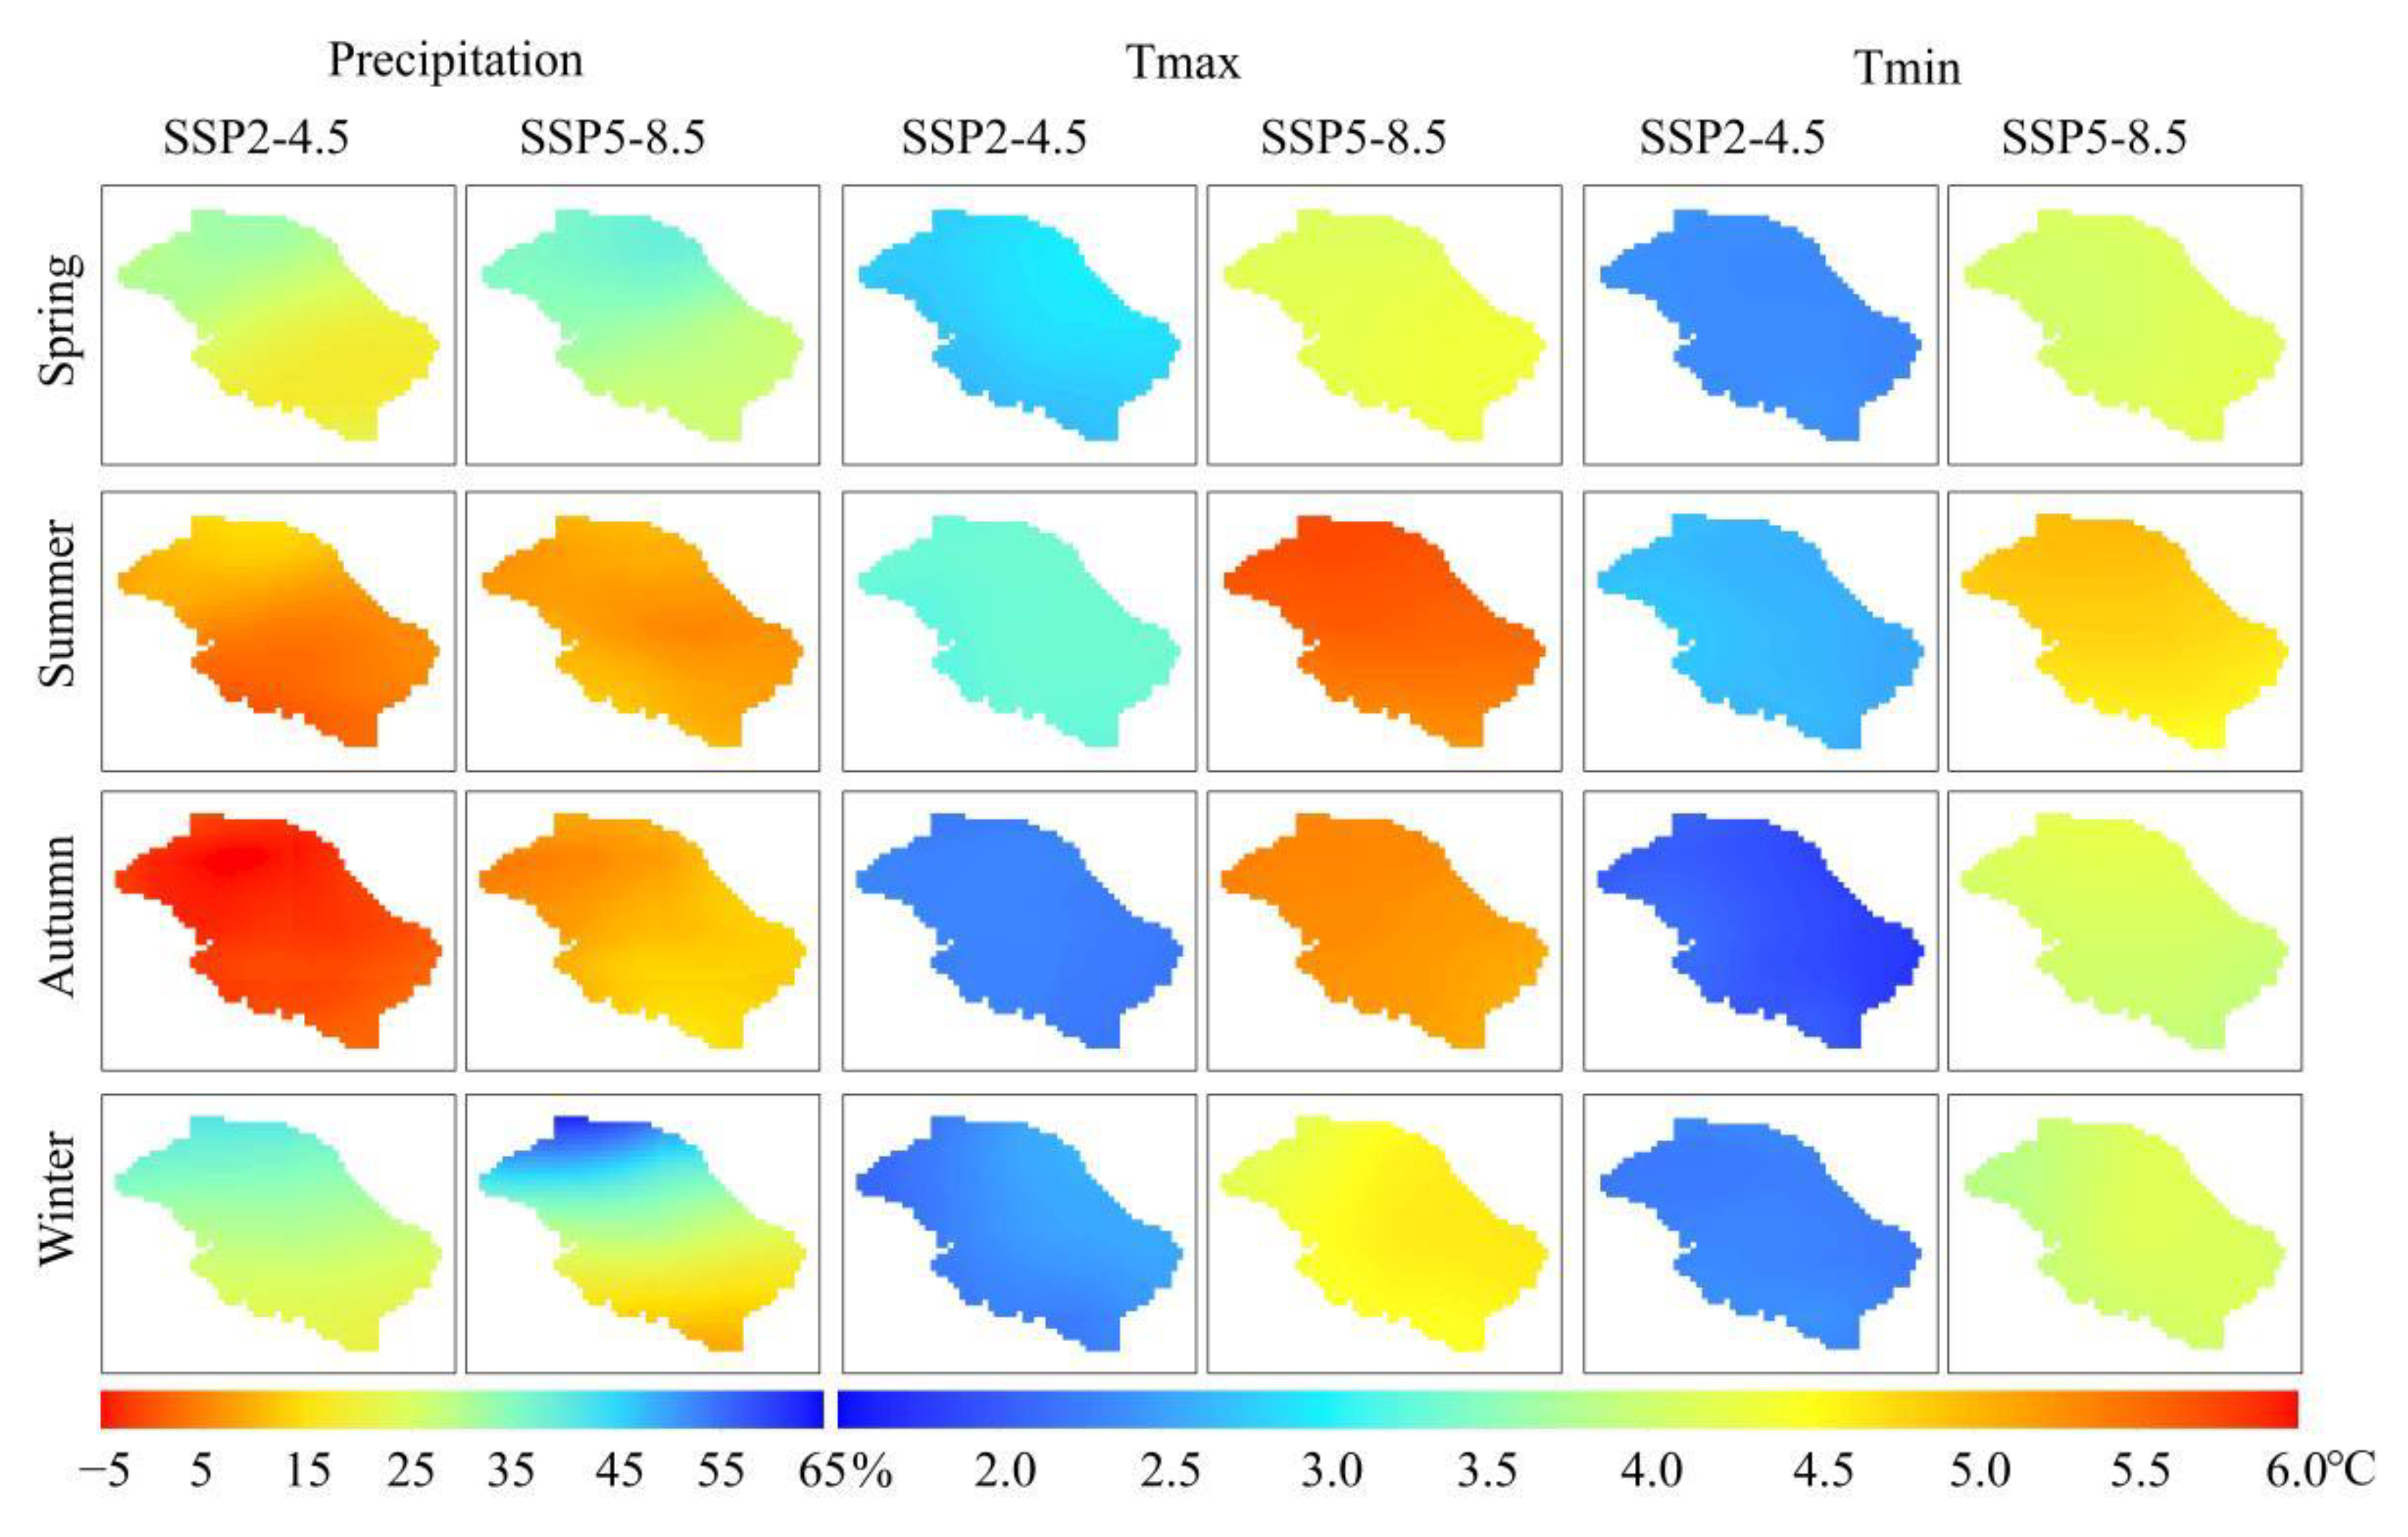
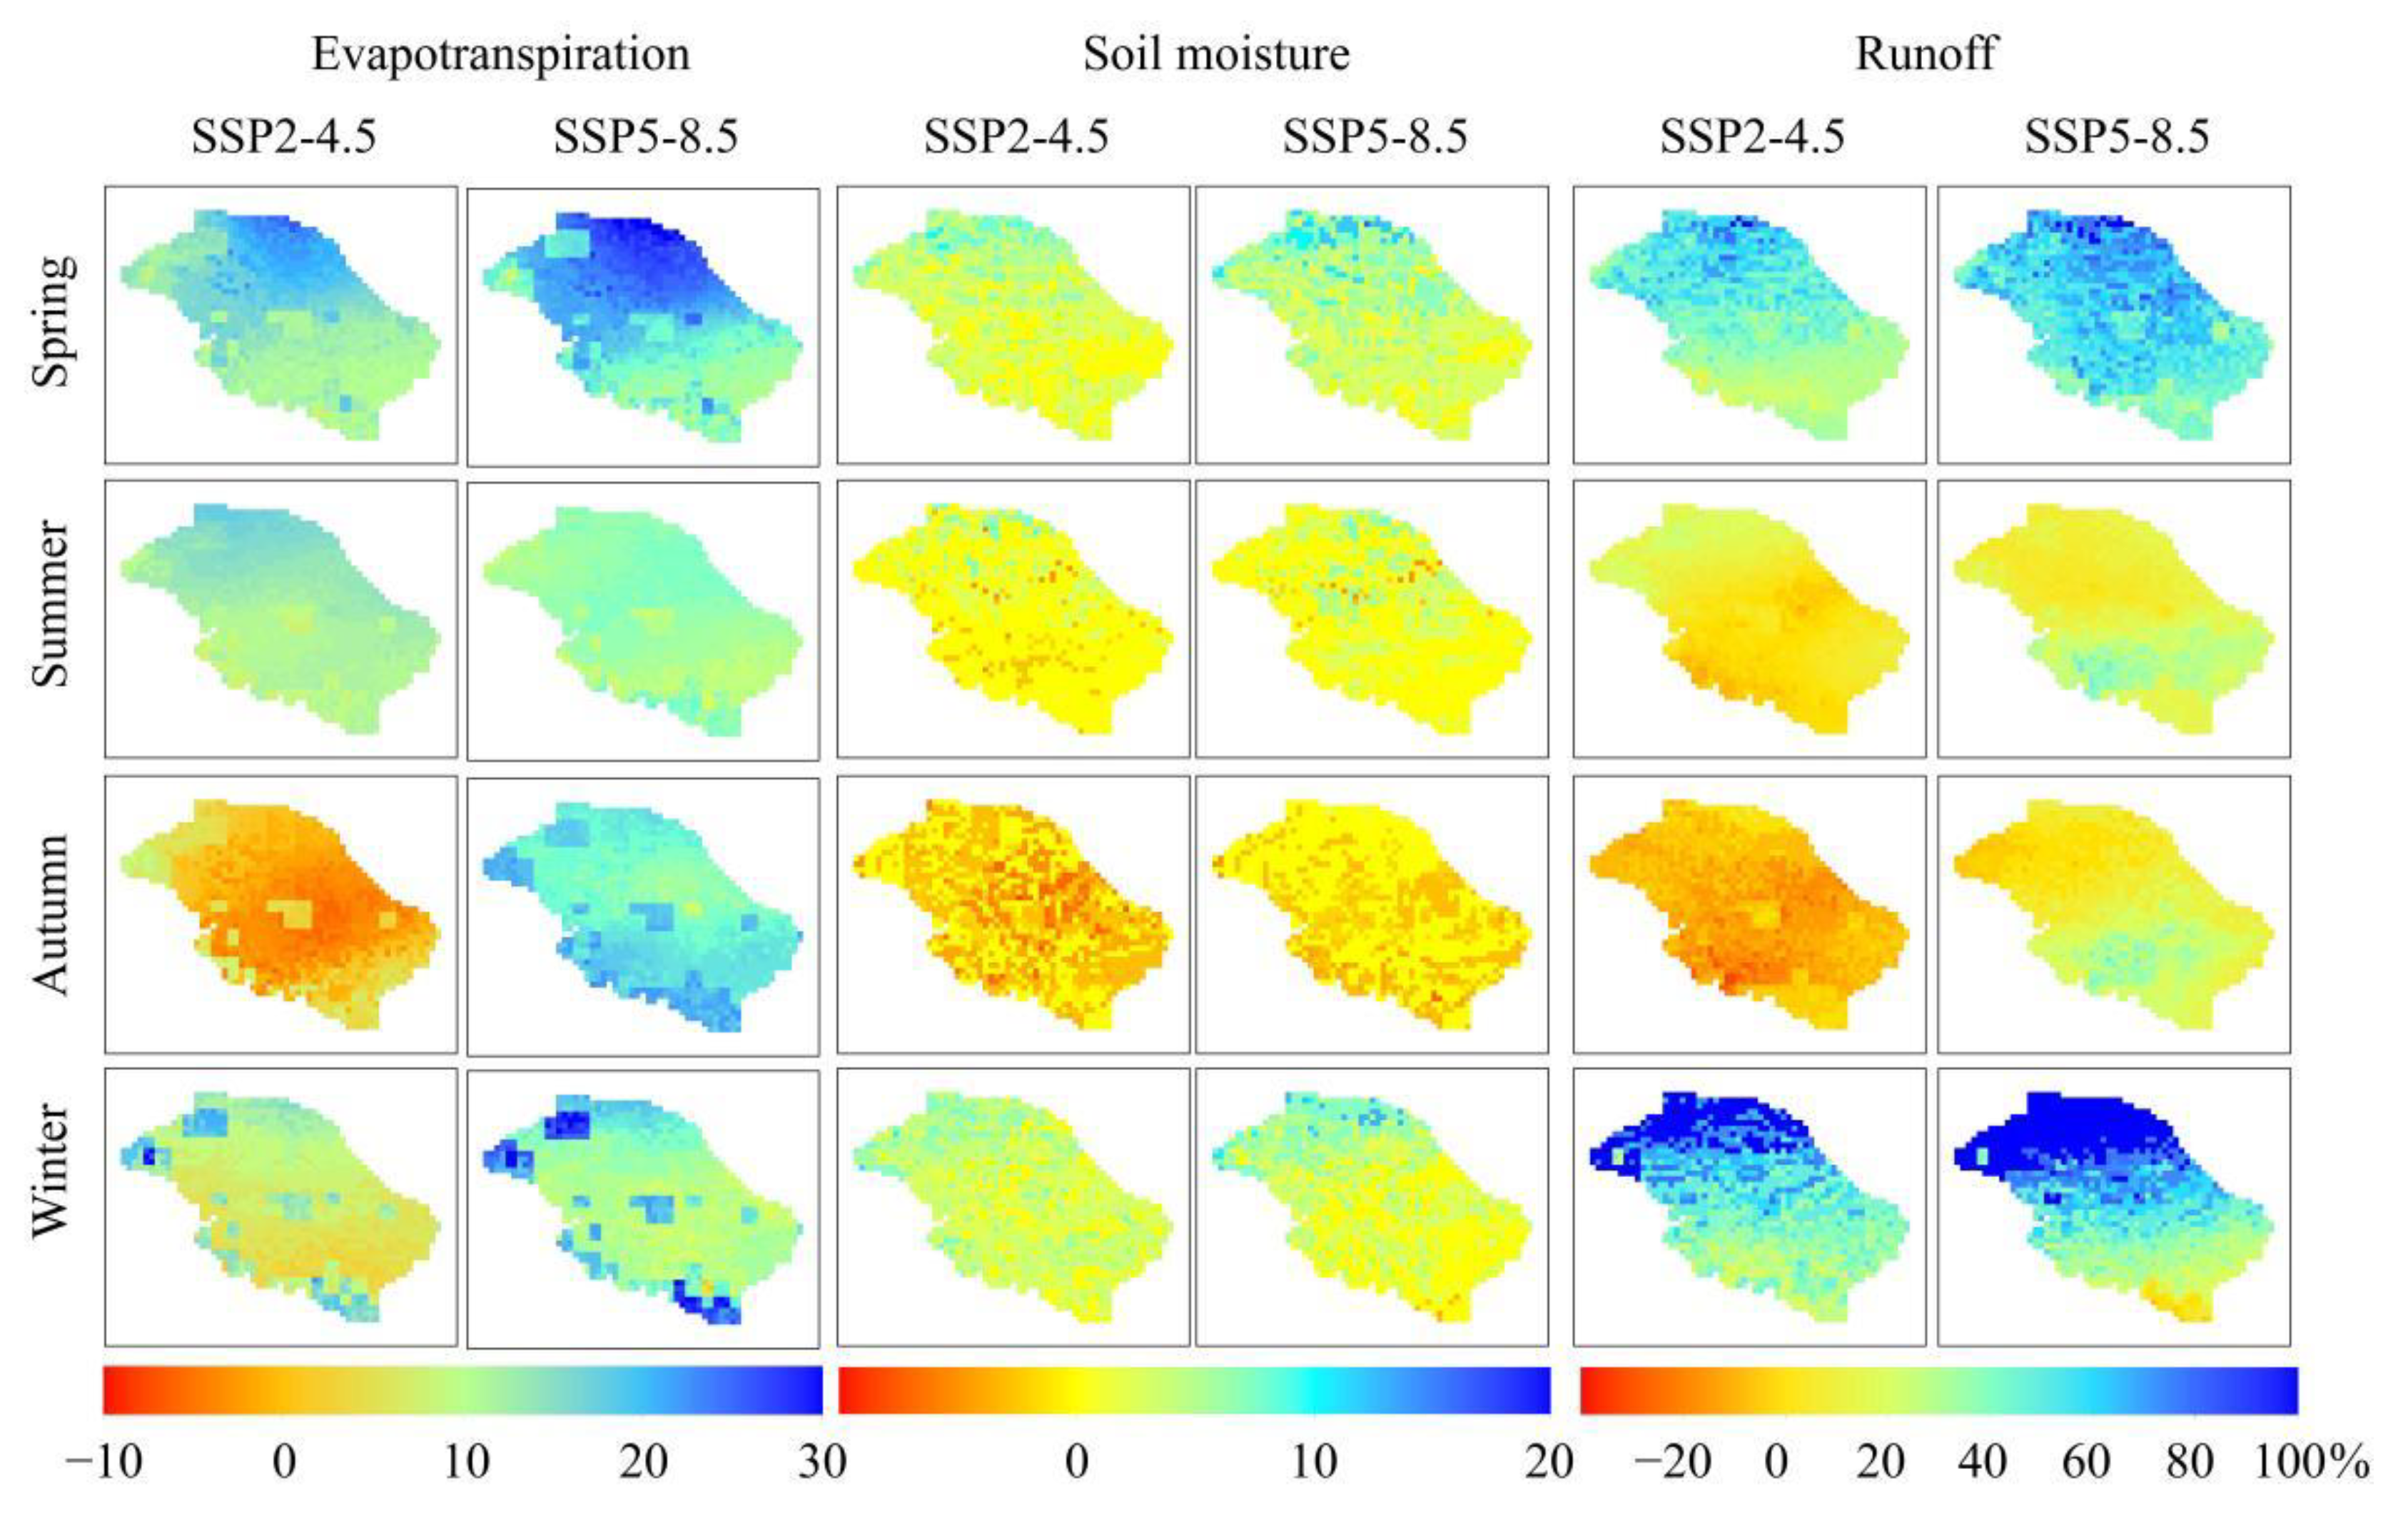
3.4. Seasonal Analysis of Hydroclimatic Parameters

This paper analyzes the seasonal changes of future hydroclimatic parameters under two typical scenarios (SSP2-4.5 and SSP5-8.5). Figure 11 shows changes of the climate parameters in the basin between 1981–2014 and 2071–2100. Under the SSP2-4.5 scenario, the precipitation increases by 24.3%, 6.4%, −2.0%, and 30.0% in spring, summer, autumn, and winter, respectively. Spatially, the precipitation changes gradually increase from southeast to northwest (ranging from 17.9% to 32.9%) in spring. The least increase is in summer (ranging from 0% to 15.0%). Autumn is the only season in which there is a decrease in precipitation (ranging from −5.1% to 0%), and the precipitation in winter has the largest increase rate. Compared to 1981–2014, the maximum temperature of 2071–2100 increases by 2.9, 3.3, 2.3, 2.4 °C in spring, summer, autumn, and winter, respectively. The minimum temperature increases by 2.4, 2.7, 2.0, and 2.3 °C in spring, summer, autumn, and winter, respectively. The maximum and minimum temperature increase is highest in summer and lowest in autumn. Under the SSP5-8.5, the precipitation increases by 32.0%, 8.3%, 10.5%, and 30.4% in spring, summer, autumn, and winter, respectively. The precipitation changes in spring and winter gradually increase from southeast to northwest, with increasing rates of 26.5–36.4% and 8.6–62.5%, respectively. Less of an increase in precipitation is projected in the other two seasons. The rates of increase are 5.5–12.4% and 4.1–16.1% in summer and autumn, respectively. The maximum temperature increase is the largest in summer (5.6 °C) and the least in spring (4.3 °C). The minimum temperature increase is largest in summer (4.78 °C), while the other three seasons have similar increases. Overall, under the SSP5-8.5, variation trends of the climate parameters are basically the same as SSP2-4.5, but the increment is larger than SSP2-4.5. During 2071–2100, the precipitation increase rates are lower in summer and autumn, and the increase rates are higher in spring and winter, and the temperature rises most in summer.
Figure 12 shows the changes of hydrological parameters in the basin, with a comparison between 1981–2014 and 2071–2100. Under the SSP2-4.5 scenario, the evapotranspiration increases by 14.5% and 12.6% in spring and summer, respectively. The distribution of evapotranspiration changes in these two seasons is consistent with the annual value, which gradually increases from south to north. In autumn, evapotranspiration increases in the northwest and southeast edges and several grids in the middle of the basin, but decreases in other regions, and the mean value of the basin remains unchanged compared to that in 1981–2014. In winter, the evapotranspiration begins to increase again by 8.9%. The average change rates of soil moisture are within ±4% in the four seasons. The autumn is the only season when soil moisture decreases (−2.2%). The average soil moisture increases slightly by 0.5–3.3% in other seasons. The runoff increases significantly in spring and winter by 42.5% and 56.6%, respectively. The increase of runoff in summer is small, with an average of 5%, and the runoff has a downward trend in autumn, with an average decrease of 9.9%. Under the SSP5-8.5, the evapotranspiration increases by 18.1%, 11.3%, 15.4%, and 13.0% in spring, summer, autumn, and winter, respectively. Except for summer, the average increase amplitude is larger than that under the SSP2-4.5 scenario. In terms of soil moisture, the distribution of the change is similar to that under the SSP2-4.5 scenario. In autumn, the average soil moisture still decreases by 1.1%. The runoff increases in the four seasons under the SSP5-8.5 scenario, and the order of average increase amplitude of each season is winter > spring > summer > autumn.

4. Discussion

The characteristics of climate change predicted by GCMs show that the general trend of future precipitation is projected to increase, but the spatial distribution is uneven. The increase amplitudes are larger in spring and winter than those in summer and autumn. These findings are consistent with the simulation prediction of CMIP5 [52]. In particular, the summer precipitation increases and the autumn precipitation decreases in SSP2-4.5. The seasonal contrast of precipitation is more prominent, and abrupt alternation between drought and flood needs to be monitored. The maximum and minimum temperature changes become steady in the SSP1-2.6 scenario [29]. This indicates that the sustainable development model can effectively mitigate global warming [19]. The increase rate of the maximum temperature is higher than that of the minimum temperature, and the summer temperature changes most obvious. Global warming will cause the growth season of vegetation to come earlier in the year. Increased precipitation will also promote the enhancement of vegetation coverage [53,54]. The changing patterns of evapotranspiration follow that of annual precipitation, but seasonal evapotranspiration shows different changes. The autumn precipitation changes by −2% in SSP2-4.5, but the mean value of evapotranspiration remains unchanged compared to that during 1981–2014. The change of summer precipitation is larger in SSP5-8.5 (8.3%) than that in SSP2-4.5 (6.4%), but the change of evapotranspiration is smaller in SSP5-8.5 (11.3%) than that in SSP2-4.5 (12.6%). These are likely attributed to the intra-annual evapotranspiration, which is closely related to the growth cycle of plants and crops [55]. The average annual runoff increases in a wavelike manner. At the end of the 21st century, the runoff is largest in SSP5-8.5 and smallest in SSP2-4.5. Precipitation is the main source of runoff replenishment in the UMHRB, so the runoff is affected by the difference in seasonal precipitation distribution. The seasonal change patterns of runoff follow that of precipitation. The autumn runoff changes by −9.9% in SSP2-4.5. The change rates of soil moisture are within ±5% in three periods under the four scenarios, and the mean value tends to increase, but the autumn soil moisture changes by −2.2% and −1.1% in SSP2-4.5 and SSP5-8.5, respectively. The drier soil in autumn will have a negative impact on crop growth.
Some problems remain, such as the abnormal changes of evapotranspiration in the northwest region and several grids in the middle of the basin, especially in autumn and winter, where evapotranspiration increases more than the nearby area. This needs to be further analyzed in combination with multiple factors such as temperature, wind speed, land-use/land-cover (LULC), and slope. In addition, it should be noted that in the calibrated VIC model used to simulate the four scenarios, the vegetation parameters were assumed to be constant. Future work should focus on the interactive effect of LULC and climate change on hydrological processes. As a driving factor, CMIP6 GCMs data are still applied less at the catchment scale. This study selected five GCMs for preliminary exploration, but the CMIP6 GCMs also need to be further evaluated for their ability to simulate climate elements.

5. Conclusions

This study constructed a well-established VIC model of 0.1° × 0.1° resolution in the UMHRB and detected the future variability in precipitation and maximum and minimum temperatures. The five-GCM ensemble simulation is better than any single model, and the simulation effect of temperature is generally better than that of precipitation. The responses of hydrological processes to climate change under different future scenarios were assessed. The results are summarized as follows:
Under different SSP scenarios, the temperature in the UMHRB will increase in the future, with annual and seasonal temperatures showing a warming trend. The annual precipitation increases to different degrees (0–7%) in the future. The increase rates are higher in spring and winter than in summer and autumn. The change patterns of evapotranspiration follow that of annual precipitation. Affected by the growth cycle of vegetation and crops, evapotranspiration shows different seasonal changes (0–18%). The annual runoff exhibits a wavelike rising trend in the future. Seasonal runoff is affected by precipitation and follows its change. Comparatively, change of annual soil moisture is relatively small in the future, and its average value increases slightly. Seasonal soil moisture decreases in autumn, and increases in the other three seasons.
These results illustrate that the amount of water resources has increased in the UMHRB, but it also faces a risk of flooding from the increased precipitation and runoff. These findings will assist decision-makers in developing watershed flood risk-management measures and water and soil conservation plans.

Author Contributions

Y.Y. wrote the manuscript text and contributed to the graphics; Y.Y. and H.C. contributed to data collection and processing; W.Q., J.L., Z.P., T.L., and Y.T. contributed to the revision of the methods, results, analysis, and discussion of the manuscript. All authors have read and agreed to the published version of the manuscript.

Funding

This research was funded by the National Keypoint Research and Invention Program of the Thirteenth Five-Plan (2017YFB0504105) and National Natural Science Foundation of China (51779269).

Institutional Review Board Statement

Not applicable.

Informed Consent Statement

Not applicable.

Data Availability Statement

Not applicable.

Acknowledgments

We acknowledge the CMIP6 modeling groups for providing the simulation data. We thank the anonymous reviewers for their constructive comments that helped to improve the manuscript.

Conflicts of Interest

The authors declare no conflict of interest.

References

  1. Stocker, T.F.; Qin, D.; Plattner, G.K.; Tignor, M.M.B.; Allen, S.K.; Boschung, J.; Nauels, A.; Xia, Y.; Bex, V.; Midgley, P.M. (Eds.) Climate change 2013: The physical science basis. working group I contribution to the fifth assessment report of the intergovernmental panel on climate change. In Technical Summary; Cambridge University Press: Cambridge, UK; New York, NY, USA, 2013; pp. 15–33. ISBN 978-1-107-66182-0. [Google Scholar]
  2. Deb, P.; Babel, M.S.; Denis, A.F. Multi-GCMs approach for assessing climate change impact on water resources in Thailand. J. Adv. Model Earth Syst. 2018, 4, 825–839. [Google Scholar] [CrossRef]
  3. Deb, P.; Kiem, A.S.; WIllgoose, G. Mechanisms influencing non-stationarity in rainfall-runoff relationships in southeast Australia. J. Hydrol. 2019, 571, 749–764. [Google Scholar] [CrossRef]
  4. Zhao, Y.; Weng, Z.; Chen, H.; Yang, J. Analysis of the evolution of drought, flood, and drought-flood abrupt alternation events under climate change using the daily SWAP index. Water 2020, 12, 1969. [Google Scholar] [CrossRef]
  5. Hirabayashi, Y.; Kanae, S.; Emori, S.; Oki, T.; Kimoto, M. Global projections of changing risks of floods and droughts in a changing climate. Hydrol. Sci. J. 2008, 53, 754–772. [Google Scholar] [CrossRef]
  6. UNESCO. The United Nations World Water Development Report 2020: Water and Climate Change; United Nations Educational, Scientific and Cultural Organization: Paris, France, 2020. [Google Scholar]
  7. Kabo-Bah, A.T.; Anornu, G.; Ofosu, E.; Andoh, R.; Lis, K.J. Spatial-temporal estimation of evapotranspiration over Black Volta of West Africa. Int. J. Water Resour. Environ. Eng. 2014, 6, 295–302. [Google Scholar] [CrossRef]
  8. Huang, J.C.; Lee, T.Y.; Lee, J.Y. Observed magnified runoff response to rainfall intensification under global warming. Environ. Res. Lett. 2014, 9, 034008. [Google Scholar] [CrossRef] [Green Version]
  9. Bennett, K.E.; Urrego Blanco, J.R.; Jonko, A.; Bohn, T.J.; Atchley, A.L.; Urban, N.M.; Middleton, R.S. Global sensitivity of simulated water balance indicators under future climate change in the Colorado Basin. Water Resour. Res. 2018, 54, 132–149. [Google Scholar] [CrossRef]
  10. Chen, H.; Sun, J. Anthropogenic warming has caused hot droughts more frequently in China. J. Hydrol. 2017, 544, 306–318. [Google Scholar] [CrossRef]
  11. Amarasinghe, P.; Liu, A.; Egodawatta, P.; Barnes, P.; McGree, J.; Goonetilleke, A. Modelling resilience of a water supply system under climate change and population growth impacts. Water Resour. Manag. 2017, 31, 2885–2898. [Google Scholar] [CrossRef]
  12. Schnorbus, M.A.; Cannon, A.J. Statistical emulation of streamflow projections from a distributed hydrological model: Application to CMIP3 and CMIP5 climate projections for British Columbia, Canada. Water Resour. Res. 2014, 50, 8907–8926. [Google Scholar] [CrossRef]
  13. Nauman, S.; Zulkafli, Z.; Bin Ghazali, A.H.; Yusuf, B. Impact assessment of future climate change on streamflows upstream of Khanpur Dam, Pakistan using soil and water assessment tool. Water 2019, 11, 1090. [Google Scholar] [CrossRef] [Green Version]
  14. Lu, W.; Wang, W.; Shao, Q.; Yu, Z.; Hao, Z.; Xing, W.; Yong, B.; Li, J. Hydrological projections of future climate change over the source region of Yellow River and Yangtze River in the Tibetan Plateau: A comprehensive assessment by coupling RegCM4 and VIC model. Hydrol. Process. 2018, 32, 2096–2117. [Google Scholar] [CrossRef]
  15. Venkataraman, K.; Tummuri, S.; Medina, A.; Perry, J. 21st century drought outlook for major climate divisions of Texas based on CMIP5 multimodel ensemble: Implications for water resource management. J. Hydrol. 2016, 534, 300–316. [Google Scholar] [CrossRef] [Green Version]
  16. Wang, H.; Xiao, W.; Wang, Y.; Zhao, Y.; Lu, F.; Yang, M.; Hou, B.; Yang, H. Assessment of the impact of climate change on hydropower potential in the Nanliujiang river basin of China. Energy 2019, 167, 950–959. [Google Scholar] [CrossRef]
  17. Nandi, S.; Manne, J.R. Spatiotemporal analysis of water balance components and their projected changes in near-future under climate change over Sina Basin, India. Water Resour. Manag. 2020, 34, 2657–2675. [Google Scholar] [CrossRef]
  18. Xin, X.; Wu, T.; Zhang, J.; Yao, J.; Fang, Y. Comparison of CMIP6 and CMIP5 simulations of precipitation in China and the East Asian summer monsoon. Int. J. Climatol. 2020, 40, 6423–6440. [Google Scholar] [CrossRef] [Green Version]
  19. Fan, X.; Duan, Q.; Shen, C.; Wu, Y.; Xing, C. Global surface air temperatures in CMIP6: Historical performance and future changes. Environ. Res. Lett. 2020, 15, 104056. [Google Scholar] [CrossRef]
  20. Wu, D.; Jiang, Z.; Ma, T. Projection of summer precipitation over the Yangtze–Huaihe River basin using multimodel statistical downscaling based on canonical correlation analysis. J. Meteorol. Res. 2016, 30, 867–880. [Google Scholar] [CrossRef]
  21. Lin, H.; Wang, J.; Huang, J.; Jiang, C. Climate Drought in Huai River Basin Under Climate Change. China Rural Water Hydropower 2020, 6, 21–26. (In Chinese) [Google Scholar]
  22. Lin, H.; Wang, J.; Jiang, C. Simulation Assessment and Future Scenario Prediction of Climate Elements in Huai River Basin by CMIP5 Model. Pearl River 2019, 12, 43–50. (In Chinese) [Google Scholar] [CrossRef]
  23. Gao, C.; Ruan, T. The influence of climate change and human activities on runoff in the middle reaches of the Huaihe River Basin, China. J. Geogr. Sci. 2018, 28, 79–92. [Google Scholar] [CrossRef] [Green Version]
  24. Zhai, J.; Mondal, S.K.; Fischer, T.; Wang, Y.; Su, B.; Huang, J.; Tao, H.; Wang, G.; Ullah, W.; Uddin, M.J. Future drought characteristics through a multi-model ensemble from CMIP6 over South Asia. Atmos. Res. 2020, 246, 105111. [Google Scholar] [CrossRef]
  25. Akinsanola, A.; Kooperman, G.; Reed, K.; Pendergrass, A.; Hannah, W. Projected changes in seasonal precipitation extremes over the United States in CMIP6 simulations. Environ. Res. Lett. 2020, 15, 104078. [Google Scholar] [CrossRef]
  26. Aadhar, S.; Mishra, V. On the projected decline in droughts over South Asia in CMIP6 multimodel ensemble. J. Geophys. Res. Atmos. 2020, 125, e2020JD033587. [Google Scholar] [CrossRef]
  27. Jin, J.; He, J.; He, R.; Liu, C.; Zhang, J.; Wang, G.; Bao, Z. Impacts of Climate Change to Water Resources and Extreme Hydrological Event in the Huaihe River Basin. Sci. Geogr. Sin. 2017, 8, 1226–1233. (In Chinese) [Google Scholar] [CrossRef]
  28. Yang, Q.; Gao, G.; Cha, Q.; Zhang, P. Changes of Climate and Runoff under the Representative Concentration Pathways Scenarios in the Upper Reaches of the Huaihe. J. Anhui Agric. Sci. 2020, 3, 209–214. (In Chinese) [Google Scholar]
  29. Jiang, T.; Lu, Y.; Huang, J.; Wang, Y.; Su, B.; Tao, H. New Scenarios of CMIP6 Model (SSP-RCP) and Its Application in the Huaihe River Basin. Adv. Meteorol. Sci. Technol. 2020, 10, 104–111. (In Chinese) [Google Scholar] [CrossRef]
  30. Lu, M.; Gao, C.; Su, B.; Yao, M.; Xu, G. Spatial distribution and probabilistic characteristics of extreme precipitation in the Huaihe River basin. J. Nat. Disasters 2015, 5, 160–168. (In Chinese) [Google Scholar] [CrossRef]
  31. He, J.; Yang, K.; Tang, W.; Lu, H.; Qin, J.; Chen, Y.; Li, X. The first high-resolution meteorological forcing dataset for land process studies over China. Sci. Data 2020, 7, 25. [Google Scholar] [CrossRef] [Green Version]
  32. Hansen, M.C.; Defries, R.S.; Townshend, J.R.G.; Sohlberg, R. Global land cover classification at 1 km spatial resolution using a classification tree approach. Int. J. Remote Sens. 2010, 21, 1331–1364. [Google Scholar] [CrossRef]
  33. Liang, X.; Lettenmaier, D.P.; Wood, E.F.; Burges, S.J. A simple hydrologically based model of land surface water and energy fluxes for general circulation models. J. Geophys. Res. Atmos. 1994, 99, 14415–14428. [Google Scholar] [CrossRef]
  34. Xie, Z.; Su, F.; Xu, L.; Zeng, Q.; Hao, Z.; Guo, Y. Applications of a surface runoff model with horton and dunne runoff for VIC. Adv. Atmos. Sci. 2003, 20, 165–172. [Google Scholar] [CrossRef]
  35. Nijssen, B.; O’Donnell, G.M.; Hamlet, A.F.; Lettenmaier, D.P. Hydrologic sensitivity of global rivers to climate change. Clim. Chang. 2001, 50, 143–175. [Google Scholar] [CrossRef]
  36. Lohmann, D.; Nolte-Holube, R.; Raschke, E. A large-scale horizontal routing model to be coupled to land surface parametrization schemes. Tellus A 1996, 48, 708–721. [Google Scholar] [CrossRef]
  37. Liang, X.; Guo, J.; Leung, L.R. Assessment of the effects of spatial resolutions on daily water flux simulations. J. Hydrol. 2004, 298, 287–310. [Google Scholar] [CrossRef]
  38. Nash, J.E.; Sutcliffe, J.V. River flow forecasting through conceptual models part I—A discussion of principles. J. Hydrol. 1970, 10, 282–290. [Google Scholar] [CrossRef]
  39. CMIP6_CVs. Available online: https://rawgit.com/WCRP-CMIP/CMIP6_CVs (accessed on 15 October 2020).
  40. Riahi, K.; Van Vuuren, D.P.; Kriegler, E.; Edmonds, J.; O’Neill, B.C.; Fujimori, S.; Bauer, N.; Calvin, K.; Dellink, R.; Fricko, O.; et al. The shared socioeconomic pathways and their energy, land use, and greenhouse gas emissions implications: An overview. Glob. Environ. Chang. 2016, 42, 153–168. [Google Scholar] [CrossRef] [Green Version]
  41. Xin, X.G.; Wu, T.W.; Zhang, J.; Zhang, F.; Li, W.P.; Zhang, Y.W.; Lu, Y.X.; Fang, Y.J.; Jie, W.H.; Zhang, L.; et al. Introduction of BCC models and its participation in CMIP6. Adv. Clim. Chang. Res. 2019, 15, 533–539. [Google Scholar] [CrossRef]
  42. O’Neill, B.C.; Tebaldi, C.; Van Vuuren, D.P.; Eyring, V.; Friedlingstein, P.; Hurtt, G.; Knutti, R.; Kriegler, E.; Lamarque, J.F.; Lowe, J. The scenario model intercomparison project (ScenarioMIP) for CMIP6. Geosci. Model Dev. 2016, 9, 3461–3482. [Google Scholar] [CrossRef] [Green Version]
  43. Zhao, Q.; Zhu, Z.; Zeng, H.; Zhao, W.; Myneni, R.B. Future greening of the Earth may not be as large as previously predicted. Agric. For. Meteorol. 2020, 292, 108111. [Google Scholar] [CrossRef]
  44. Pierce, D.W.; Barnett, T.P.; Hidalgo, H.G.; Tapash, D.; Céline, B.; Benjamin, D.S.; Govindasamy, B.; Michael, D.D.; Daniel, R.C.; Art, M.; et al. Attribution of declining western U.S. snowpack to human effects. J. Clim. 2008, 21, 6425. [Google Scholar] [CrossRef] [Green Version]
  45. Zhu, Y.Y.; Yang, S. Evaluation of CMIP6 for historical temperature and precipitation over the Tibetan Plateau and its comparison with CMIP5. Adv. Clim. Chang. Res. 2020, 11, 239–251. [Google Scholar] [CrossRef]
  46. Zhu, Y.; Yang, S. Interdecadal and interannual evolution characteristics of the global surface precipitation anomaly shown by CMIP5 and CMIP6 models. Int. J. Climatol. 2020. [Google Scholar] [CrossRef]
  47. Shiru, M.S.; Park, I. Comparison of Ensembles Projections of Rainfall from Four Bias Correction Methods over Nigeria. Water 2020, 12, 3044. [Google Scholar] [CrossRef]
  48. Lenderink, G.; Buishand, A.; Van Deursen, W. Estimates of future discharges of the River Rhine using two scenario methodologies: Direct versus delta approach. Hydrol. Earth Syst. Sci. 2007, 11, 1145–1159. [Google Scholar] [CrossRef]
  49. Moriasi, D.N.; Arnold, J.G.; Van Liew, M.W.; Bingner, R.L.; Harmel, R.D.; Veith, T.L. Model evaluation guidelines for systematic quantification of accuracy in watershed simulations. Trans. ASABE 2007, 50, 885–900. [Google Scholar] [CrossRef]
  50. Deb, P.; Kiem, A.S. Evaluation of rainfall-runoff model performance under non-stationary hydroclimatic conditions. Hydrol. Sci. J. 2020, 65, 1667–1684. [Google Scholar] [CrossRef]
  51. Chen, Z.; Zhou, T.; Zhang, L.; Chen, L.; Zhang, W.; Jiang, J. Global land monsoon precipitation changes in CMIP6 projections. Geophys. Res. Lett. 2020, 47, e2019GL086902. [Google Scholar] [CrossRef]
  52. Wu, Y.; Zhong, P.; Xu, B.; Zhu, F.; Fu, J. Evaluation of global climate model on performances of precipitation simulation and prediction in the Huaihe River basin. Theor. Appl. Climatol. 2018, 133, 191–204. [Google Scholar] [CrossRef]
  53. Ji, S.; Ren, S.; Li, Y.; Dong, J.; Wang, L.; Quan, Q.; Liu, J. Diverse responses of spring phenology to preseason drought and warming under different biomes in the North China Plain. Sci. Total Environ. 2020, 766, 144437. [Google Scholar] [CrossRef]
  54. Piao, S.; Tan, J.; Chen, A.; Fu, Y.H.; Ciais, P.; Liu, Q.; Janssens, I.A.; Vicca, S.; Zeng, Z.; Jeong, S.; et al. Leaf onset in the northern hemisphere triggered by daytime temperature. Nat. Commun. 2015, 6, 6911. [Google Scholar] [CrossRef] [PubMed] [Green Version]
  55. Yang, X.; Wang, L.; Wang, K. Spatio-temporal distribution of terrestrial evapotranspiration in Huaihe River basin based on MOD16 ET data. J. Glaciol. Geocryol. 2015, 5, 1343–1352. (In Chinese) [Google Scholar]
Figure 1. Location of the study basin and distribution of hydrological stations.
Water 13 01053 g001
Figure 2. Comparison of observed and simulated monthly discharge at the Xixian (a), Wangjiaba (b), Lutaizi (c), and Bengbu (d) stations for the calibration period (1981–2000) and validation period (2001–2018).
Water 13 01053 g002
Figure 3. Comparison of average monthly precipitation, maximum temperature (Tmax), and minimum temperature (Tmin) among the China meteorological forcing dataset (CMFD) and raw GCMs and bias-corrected GCMs (LS_GCMs) datasets from 1979 to 2014.
Water 13 01053 g003
Figure 4. Taylor diagram for the precipitation (1), maximum temperature (2), and minimum temperature (3) of bias-corrected GCMs (a), BCC-CSM2-MR (b), GFDL-ESM4 (c), IPSL-CM6A-LR (d), MIROC6 (e), and NorESM2-MM (f).
Water 13 01053 g004
Figure 5. Future percentage differences in precipitation (2017–2040 vs. 1981–2014, 2041–2070 vs. 2017–2040, and 2071–2100 vs. 2041–2070) in the upper and middle Huaihe River Basin (UMHRB).
Water 13 01053 g005
Figure 6. Future maximum temperature changes (1981–2014 vs. 2017–2040, 2017–2040 vs. 2041–2070, and 2041–2070 vs. 2071–2100) in the UMHRB.
Water 13 01053 g006
Figure 7. Future minimum temperature changes (1981–2014 vs. 2017–2040, 2017–2040 vs. 2041–2070, and 2041–2070 vs. 2071–2100) in the UMHRB.
Water 13 01053 g007
Figure 8. Future percentage differences of evapotranspiration (2017–2040 vs. 1981–2014, 2041–2070 vs. 2017–2040, and 2071–2100 vs. 2041–2070) in the UMHRB.
Water 13 01053 g008
Figure 9. Future percentage differences of soil moisture (2017–2040 vs. 1981–2014, 2041–2070 vs. 2017–2040, and 2071–2100 vs. 2041–2070) in the UMHRB.
Water 13 01053 g009
Figure 10. Future percentage differences of runoff (2017–2040 vs. 1981–2014, 2041–2070 vs. 2017–2040, and 2071–2100 vs. 2041–2070) in the UMHRB.
Water 13 01053 g010
Figure 11. Change of climate parameters between 1981–2014 and 2071–2100 in the UMHRB.
Water 13 01053 g011
Figure 12. Change of hydrological parameters between 1981–2014 and 2071–2100 in the UMHRB.
Water 13 01053 g012
Table 1. Calibrated parameters in the variable infiltration capacity (VIC) model.
ParameterDescriptionRangeUnit
d1Thickness of the first soil moisture layer0–0.5m
d2Thickness of the second soil moisture layer0–2m
d3Thickness of the third soil moisture layer0–2m
InfiltVariable infiltration curve parameter0–10N/A
DsFraction of Dsmax where nonlinear baseflow occurs0–1fraction
DsmaxMaximum velocity of baseflow0–30mm/day
WsFraction of maximum soil moisture where nonlinear baseflow occurs0–1fraction
Table 2. List of global climate models (GCMs) used in this paper.
ModelCountryInstitutionResolution
BCC-CSM2-MRChinaBeijing Climate Center 160 × 320
GFDL-ESM4USANOAA Geophysical Fluid Dynamics Laboratory180 × 288
IPSL-CM6A-LRFranceInstitute Pierre Simon Laplace143 × 144
MIROC6JapanJapan Agency for Marine-Earth Science and Technology and others 128 × 256
NorESM2-MMNorwayNorwegian Climate Centre 192 × 288
Table 3. Evaluation results of modeling performances.
StationsCalibration Period (1981–2000)Validation Period (2001–2018)
ErNSEErNSE
Xixian−0.160.790.000.85
Wangjiaba−0.070.850.150.72
Lutaizi0.080.780.140.75
Bengbu0.040.710.080.72
Table 4. Projected changes in annual averaged precipitation and maximum and minimum temperatures under four climate scenarios.
ParametersHistoryClimate
Scenario
Period
1981–20142017–20402041–20702071–2100
Precipitation
(mm)
936.7SSP1-2.6982.2 (4.9%)1014.0 (3.2%)1044.7 (3.0%)
SSP2-4.5938.6 (0.2%)986.6 (5.1%)1026.9 (4.1%)
SSP3-7.0963. (2.8%)970.3 (0.7%)1023.9 (5.5%)
SSP5-8.5982.8 (4.9%)998.9 (1.6%)1076.3 (7.7%)
Tmax
(℃)
19.0SSP1-2.620.2 (1.2)21.0 (0.8)21.1 (0.1)
SSP2-4.520.2 (1.2)21.0 (0.8)21.7 (0.7)
SSP3-7.020.0 (1.0)21.3 (1.3)23.0 (1.7)
SSP5-8.520.4 (1.4)21.9 (1.5)23.9 (2.0)
Tmin
(℃)
11.4SSP1-2.612.5 (1.1)12.8 (0.3)12.5 (-0.3)
SSP2-4.512.5 (1.1)13.2 (0.7)13.7 (0.5)
SSP3-7.012.3 (0.9)13.1 (0.8)14.4 (1.3)
SSP5-8.512.6 (1.2)13.8 (1.2)15.6 (1.8)
Table 5. Projected changes in annual evapotranspiration, soil moisture, and runoff under the four climate scenarios.
ParametersHistoryClimate
Scenario
Period
1981–20142017–20402041–20702071–2100
Evapotranspiration
(mm)
826.4SSP1-2.6862.0 (4.3%)890.9 (3.4%)913.9 (2.6%)
SSP2-4.5832.1 (0.7%)874.4 (5.1%)907.6 (3.8%)
SSP3-7.0842.9 (2.0%)859.2 (1.9%)902.8 (5.1%)
SSP5-8.5858.0 (3.8%)885.3 (3.2%)940.0 (6.2%)
Soil moisture
(mm)
31.7SSP1-2.631.9 (0.7%)32.1 (0.3%)32.3 (0.6%)
SSP2-4.531.6 (−0.3%)31.9 (0.8%)32.0 (0.4%)
SSP3-7.031.8 (0.4%)31.7 (−0.3%)32.0 (1.1%)
SSP5-8.531.8 (0.4%)31.8 (0.0%)32.2 (1.2%)
Runoff
(mm)
101.3SSP1-2.6108.3 (6.9%)114.5 (5.7%)120.0 (4.8%)
SSP2-4.599.0 (−2.3%)103.7 (4.7%)111.1 (7.1%)
SSP3-7.0109.8 (8.4%)103.5 (−5.7%)112.6 (8.8%)
SSP5-8.5112.9 (11.5%)107.1 (−5.1%)125.9 (17.6%)
Publisher’s Note: MDPI stays neutral with regard to jurisdictional claims in published maps and institutional affiliations.

