
Comparative Anaerobic Decolorization of Azo Dyes by Carbon-Based Membrane Bioreactor
by
 , , ,
, , ,
Mohammad Shaiful Alam Amin
1,2 ,
,
Frank Stüber
1,
Jaume Giralt
1,
Agustin Fortuny
3,
Azael Fabregat
1 and
José Font
1,* 1
Departament d’Enginyeria Química, Universitat Rovira i Virgili, Av. Països Catalans 26, 43007 Tarragona, Spain
2
Department of Chemical Engineering and Polymer Science, Shahjalal University of Science and Technology, Sylhet 3114, Bangladesh
3
Departament d’Enginyeria Química, Universitat Politècnica de Catalunya, EUPVG, Av. Víctor Balaguer s/n, 08800 Vilanova i la Geltrú, Spain
*
Author to whom correspondence should be addressed.
Water 2021, 13(8), 1060; https://doi.org/10.3390/w13081060
Submission received: 5 March 2021
/
Revised: 8 April 2021
/
Accepted: 9 April 2021
/
Published: 12 April 2021
(This article belongs to the Section Wastewater Treatment and Reuse)
Abstract
:This study used a novel integrated technology of ceramic supported carbon membrane (CSCM) to degrade azo dyes through an anaerobic mixed culture. The CSCM worked simultaneously as biofilm support, redox mediator, and nano-filter to enhance the dye decolorization efficiency. The decolorization of Acid Orange 7 (AO7) was initially investigated with and without microorganisms in both ceramic support (CS) and CSCM reactors. The CSCM bioreactor (B-CSCM), operated with microorganisms, gave a maximum decolorization of 98% using a CSCM evolved from 10% weight (wt.) of Matrimid 5218 solution. To know the influence of permeate flow, feed concentration, and dye structure on the decolorization process, different B-CSCMs for dye removal experiments were studied over monoazo AO7, diazo Reactive Black 5 (RB5), and triazo Direct Blue 71 (DB71). The highest color removal, operated with 50 mg·L−1 feed solution and 0.05 L·m−2·h−1 of permeate flux, was 98%, 82%, and 72%, respectively, for AO7, RB5, and DB71. By increasing these parameters to 100 mg·L−1 and 0.1 L·m−2·h−1, the decolorization rate of dye solution still achieved 37% for AO7, 30% for RB5, and 26% for DB71. In addition, the system was run for weeks without apparent loss of activity. These findings make evident that the combined phenomena taking place in CSCM bioreactor result in an efficient, cost-effective, and ecofriendly azo dye decolorization method.
1. Introduction
Azo dyes represent the largest class of dyestuffs used in textile, paint, food, pharmaceuticals, and cosmetics industries in different stages. Every year, approximately a half-million tons of dyes are used worldwide, of which about 15% are later found in the effluent streams. This fact poses an enormous threat to the environment, especially due to water pollution [1]. The degraded product or byproduct of the dyes generated from this undesirable discharge poses an adverse effect on the water quality by increasing the color, toxicity, biochemical oxygen demand (BOD), and chemical oxygen demand (COD) [2]. This contaminated water obstructs sunlight transmission, which causes a severe problem for photosynthetic organisms [3]. In addition, wastewater also does significant genotoxic and carcinogenic damage to human health [4] in addition to aquatic life [5]. With the limited supply and rising demand for water for the agricultural and industrial sectors, the situation is getting out of hand [6]. Therefore, wastewater treatments need to be implemented for a safe and healthy aquatic environment by keeping contaminants within permissible limits [7,8].
Generally, azo dyes in the aquatic environment behave as xenobiotic and recalcitrant compounds creating a massive barrier to potential treatment [9]. Several removal or decolorization methods based on physical, chemical, physico-chemical, and biological processes were previously examined independently or in combination to resolve this problem and decolorize the azo dyes [10,11,12,13]. Photocatalytic degradation [14], Ozonation [15], Advanced Oxidation Processes [16], and a combined photocatalytic and electrochemical oxidation process [17] are among the most widely applied chemical methods used in recent years. For instance, Montanaro et al. [18] reported the efficient coumarin degradation using UV-assisted electrochemical oxidation on boron doped diamond anodes. Yet the acceptable cost and the ineptness of a large-scale operation still make it incompatible for practical application. The ozonation process was shown to be an improved process to amend the biodegradability by reducing the color and COD [19,20]. Although this process reduced the overall volume and sludge, it is quite expensive due to the high operating cost associated with the generation of ozone [21]. Electrochemical oxidation [22] and Fenton peroxidation [23] are the most used advanced oxidation processes, all of them efficiently able to decrease COD, color, and toxicity [24]. However, excess sludge formation later requires its disposal or secondary treatment. The same difficulty was also experienced with the coagulation-flocculation system [25,26]. Conventional methods like activated carbon adsorption and filtration techniques were also extensively applied in the textile industry [27,28]. The nature and solubility of the azo dyes in this treatment process increase the filtration resistance and cake filter that raise the operating cost [29,30]. In comparison, a quite quick and convenient approach is membrane separation [31,32]. This process is still confined due to membrane fouling and a high operating cost, in addition to its inherent non-destructive nature. Microorganism-assisted biological methods in aerobic or anaerobic environments are often appealing and effective systems to decolorize the azo dyes in wastewater [33].
Recently, more attention has been paid to the anaerobic decolorization of azo dyes for treating industrial wastewater [34]. Compared to the pure culture, the use of mixed microbial consortium in the anaerobic reactor shows efficient decolorization, as it is more capable of handling the heterogeneity of micropollutants in industrial effluents [24,35]. Though the bioreduction of dye and subsequent color removal was quite significant, the process is relatively slow. Using redox mediators, which improves the transfer of the electron from electron sources to dye molecules, considerable dye removal is achieved at a shorter residence time [36]. For example, flavin enzyme cofactors and quinone compounds as redox mediators have widely demonstrated a positive impact on the anaerobic dye decolorization system [37,38]. Apart from these, carbonaceous materials act as a redox mediator and essential physical support for the microorganism to form a biofilm. Granular or powdered activated carbon was effectively examined in a variety of anaerobic decolorization methods such as MBR [39], packed-bed [40], upflow anaerobic packed bed [41], continuous flow stirred-tank [42], upflow anaerobic sludge blanket [43], and membrane bioreactors [44]. Some significant problems were noted due to over biomass production, pore blocking, and drag of microorganisms through the effluent stream. Further secondary treatment is needed to get rid of this, which again raises the treatment expenses.
The current work is aimed to establish a novel anaerobic azo dye decolorization method, taking into consideration all the above drawbacks and the benefit of activated carbon. The proposed methodology integrates membrane separation and bio-reduction processes by the inoculation or formation of anaerobic biofilm on top of ceramic-supported carbon membranes. This compact single unit reactor concept is able to generate highly treated effluents without needing additional purification steps. As a result, it presents a relatively low-cost treatment process with enhanced disposal performance. To accomplished this, the azo dye removal method was performed by coupling CSCM and an anaerobic bioreactor. The carbon-based membrane in the anaerobic bioreactor helps to form biofilm by retaining microorganisms on its surface. At the same time, the carbon layer acts as a redox mediator to increase the decolorization rate [9,45]. Moreover, it works as an additional filter medium for retaining dyes and degradation products by a molecular sieve mechanism. Overall, it is an applied example of process intensification principles by enhancing the dye removal through the promotion of a stable biofilm; the increase of the biodegradation rate and the retention of products allows deep biodegradation. This study examines these triple roles of carbon membrane on the anaerobic biodegradation of monoazo Acid Orange 7 (AO7), diazo Reactive Black 5 (RB5), and triazo Direct Blue 71 (DB71) dyes from synthetic wastewater under mixed microbial culture at constant flux. Additionally, the influence of some critical parameters, such as precursor concentration for carbon membrane synthesis dye structure, feed flow rate, and inlet concentration in the B-CSCM, were assessed to enhance and optimize the decolorization process.
2. Materials and Methods
2.1. Materials
Matrimid 5218 (3,3′,4,4′-benzophenonetetracarboxylic dianhydride and diamino-phenylindane, Huntsman Advanced Materials, The Woodlands, TX, USA), a commercial thermoplastic polyimide, was used as a carbon precursor, and NMP (1-methyl-2-pyrrolidone, Sigma Aldrich, ref. 328634, Madrid, Spain) as precursor solvent for the synthesis of the carbon-based membrane.
AO7 (dye content ≥ 85%, ACROS Organics (Waltham, MA, USA), ref. 416561000, Spain), RB5 (dye content ≥ 50%, Sigma Aldrich, ref. 306452, Spain), and DB71 (dye content ≥ 50%, Sigma Aldrich, ref. 212407, Spain) colorants were used for preparing synthetic wastewater. The type and complexity of the dye structures and their main properties are collected in Table 1. Sodium Acetate (Sigma Aldrich, ref. 110191, Spain), a readily biodegradable co-substrate, was employed as a secondary carbon source for the microorganisms.
The basal media [46] for growth of microorganisms was composed of the following compounds (mg·L−1): MnSO4·H2O (0.155), CuSO4·5H2O (0.285), ZnSO4·7H2O (0.46), CoCl2·6H2O (0.26), (NH4)6Mo7O24 (0.285), K2HPO4 (21.75), Na2HPO4·2H2O (33.40), KH2PO4 (8.50), FeCl3·6H2O (29.06), CaCl2 (13.48) MgSO4·7H2O (15.2), NH4Cl (190.90). Each of the chemicals for preparing the nutrient solution was purchased from Sigma Aldrich (Spain) and used as received. Ultrapure water (Millipore Milli-Q system, Molsheim, France) was employed in the entire research work. Nitrogen gas (Linde, Barcelona, Spain) served to pressurize the feed tank and give the constant flux to operate the biodegradation process, and purge any oxygen to maintain anaerobic conditions.
Soil DNA Isolation Plus Kit (Norgen Biotek Corporation, ref. 64000, Thorold, ON, Canada), λ DNA/HindIII Markers (New England Biolab Inc. ref. N3012S, Ipswich, MA, USA), Agarose (Sigma Aldrich, ref. 1.16801, Spain), TBE buffer (Sigma Aldrich, ref. 574796, Spain), and DNA Ladder (New England Biolab Inc. ref. N0552S, Massachusetts, USA) were used to detect microorganisms from biofilm samples.
2.2. Preparation of Ceramic Supported Carbon Membrane
The polymeric precursor solution was prepared by dispersing the desired amount of dry Matrimid (2, 5, and 10% wt.) in NMP under mild mechanical stirring for 12 h. The mixture was placed in ultrasonic baths to remove the tiny air bubbles from the polymeric solution. Finally, the carbon membrane was obtained by forming a homogeneous layer of Matrimid precursor on the surface of the ceramic support (diameter: 47 mm, thickness: 2.5 mm of thickness and molecular weight cut-off: 50 kg·mol−1; TAMI Industries, Nyons, France). This thin polymer film was attained by a two-step spin coating method adopted from previous works [47,48]. The initial ramp was run for 10 s at 500 rpm, followed by a final spin at 3000 rpm for 30 s. Ceramic support was then dried at 110 °C for 24 h to settle the coated film, and was subsequently washed with methanol and cured at 80–100 °C for 3 h to remove the traces of solvent impurities that may produce defected membranes. Afterward, the membrane was set into a horizontal tube furnace (Thermolyne F79440, Barnstead Thermolyne Corporation, Dubuque, IA, USA) for the pyrolysis process. The membrane was then subjected to stabilization and final carbonization steps at 300 °C and 800 °C, respectively. The carbonization environment was preserved strictly within an inert atmosphere, at a nitrogen flow rate of 500 mL·min−1, to avoid the undesired burning off and chemical disruption on the membrane surface [49]. During this process, the heating ramp rate was set at 1 °C·min−1 above 200 °C to prevent cracking. In the end, the carbon membranes were allowed to cool under room temperature.
2.3. Membrane Characterization
The morphology of CSCM and its chemical composition were recorded by Environmental Scanning Electron Microscopy (ESEM, FEI Quanta 600, Richmond, VA, USA), coupled with energy dispersive X-ray Spectrometry (EDX, Oxford Instrument, Abingdon upon Thames, UK). Topography and conductivity of the membrane surface were observed using Atomic Force Microscopy (AFM, Molecular Imaging Pico SPM II (Pico Plus), Bid Service, Freehold, NJ, USA). The images were recorded at room temperature in tapping mode with a resonance frequency of 1 Hz in air and then processed by WSxM 5.0 software [50]. Pure water permeability of both ceramic support and ceramic supported carbon membranes was examined by using a lab-scale filtration cell (TAMI disc holder with 0.00131 m2 of filtration area, TAMI Industries, France).
2.4. Microbial Analysis
Anaerobic biofilm created in CSCM bioreduction operation was examined separately by Transmission Electron Microscopy (TEM JEOL, JEM-1011, Boston, MA, USA) and by DNA isolation kits. Before testing, the carbon membrane was taken out from the reactor, washed with ultrapure water, and scratched a little bit hard to extract the microorganism from the membrane surface. In order to perform the DNA extraction, 1.5 mL of the wet sludge sample was transferred to a 1.7 mL microcentrifuge tube. Then, samples went under a process to extract its DNA [51]. After extraction, the sample was run through Denaturing gradient gel electrophoresis (DGGE) gel electron and then to a Gel Documentation System (Bio-Rad Laboratories SA, Spain) to detect the presence of DNA. The final bacterial diversity studies were performed under variable regions (V3 and V4) of the prokaryotic 16S ribosomal RNA gene (16S rRNA). To obtain the results, the 16S rRNA gene was amplified using the primary pairs 341F-532R and 515F-806R. The Agilent 2100 Bioanalyzer (Agilent Technologies, Santa Clara, CA, USA) and its associated DNA 7500 Reagent kit (Agilent Technologies, CA, USA) were used to assess the library quality, length, and concentration.
2.5. Experimental Set-Up for Anaerobic Biodegradation
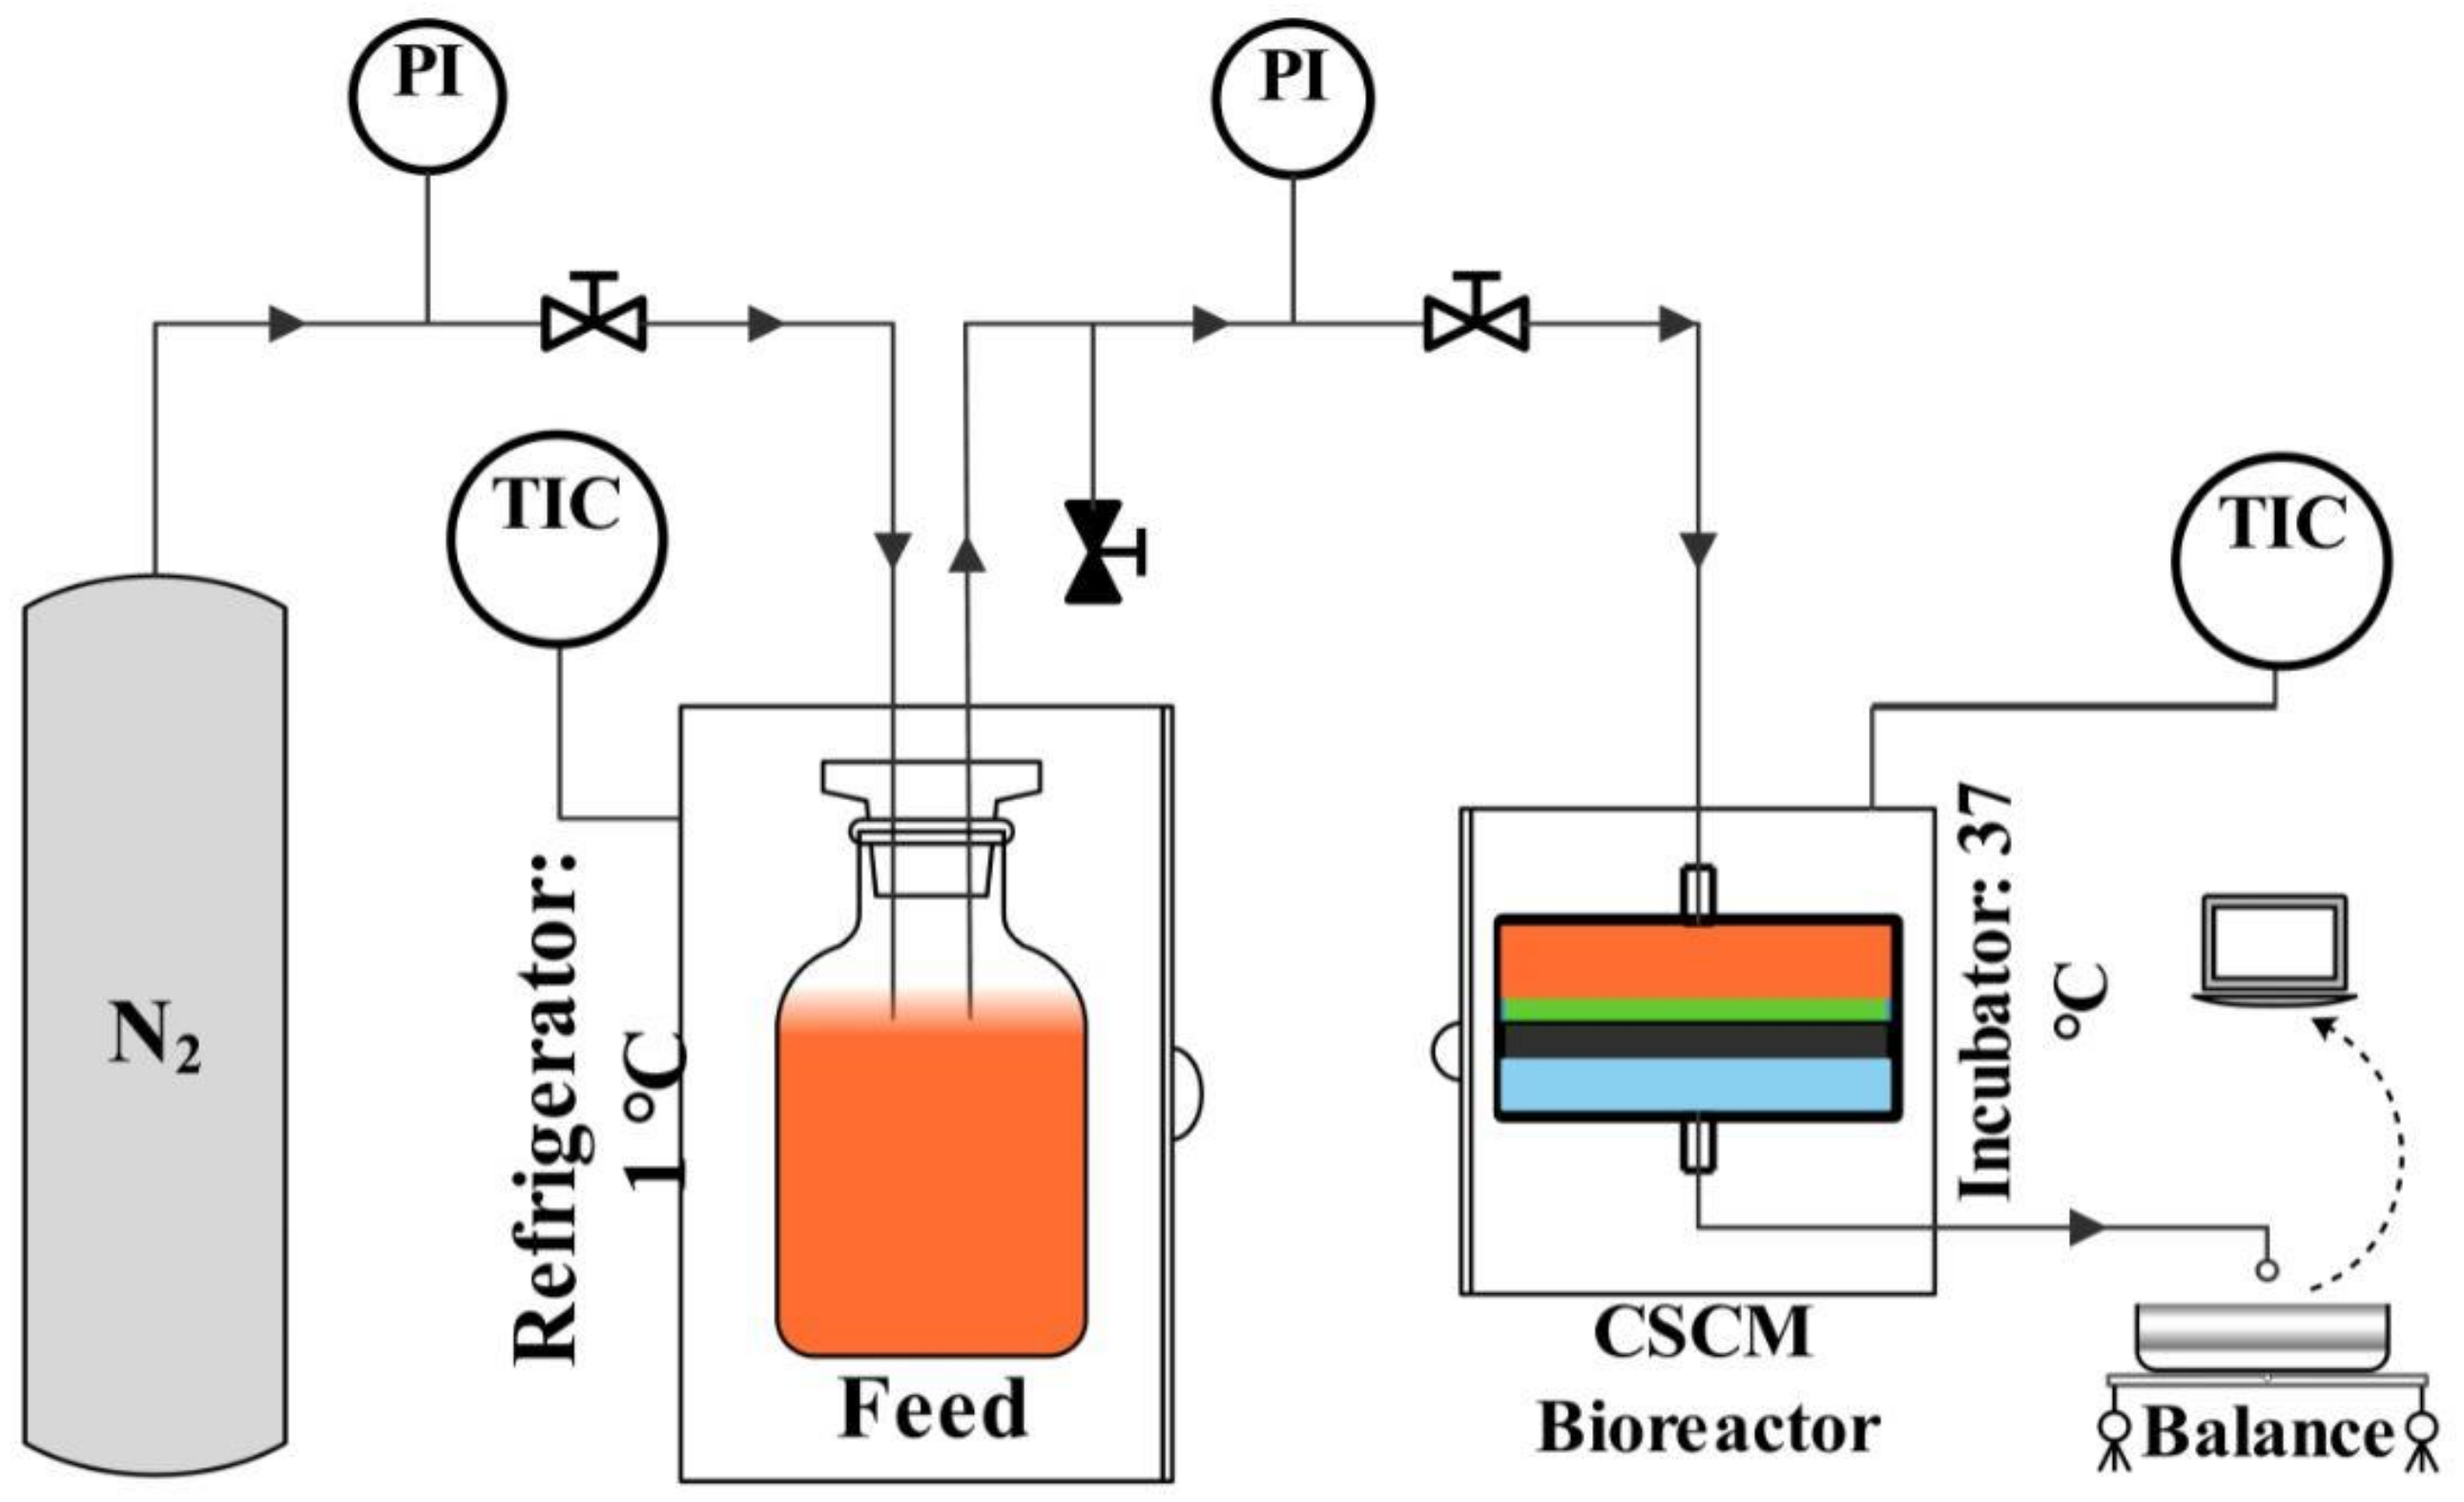
A scheme of the lab-scale CSCM bioreactor system is shown in Figure 1. The compact bioreactor consisted of a filtration cell holding the 47 mm diameter CSCM with a retentate chamber of 5 mL. The 200 mL feed solution was comprised of a 1:3 ratio of azo dye and sodium acetate and basal media with microelements described previously. The feed bottle was kept in a refrigerator (Selecta Group SA, Madrid, Spain) at 1 ± 1 °C to prevent the uncontrolled growth of microorganisms and thus to avoid the consumption of sodium acetate outside the bioreactor. Nitrogen gas was flowing into the feed tank to pressurize the system and control the flux through the membrane by manually setting the transmembrane pressure (TMP). Besides, sparging of nitrogen gas in the liquid phase at the feed tank served to maintain the negative redox potential as a measure of the anaerobic condition throughout the process needed to conduct the dye biodecolorization [52].
The CSCM bioreactor was started by placing anaerobic sludge on the top of the membrane surface as a microbial seed. The anaerobic sludge source was the untreated aerobic secondary sludge from recirculation obtained from a municipal wastewater treatment plant (Reus, Spain). Initially, it was allowed for partial digestion under anaerobic conditions for a week. After that, the sludge was filtered through glass wool and then flowed into filter paper to get the single-cell or single-spore. The compact CSCM bioreactor was operated in anaerobic dead-end filtration mode at a temperature of 37 ± 1 °C to enhance the efficiency of microbial strains capable of decolorizing azo dyes [24,53]. At the beginning of each experiment, CSCM bioreactor flux was kept constant at 0.05 L·m−2·h−1 and later changed to 0.075 and 0.10 L·m−2·h−1 for further investigations.
2.6. Analytical Methods
The permeate flux was computed from the quotient of the permeate flow rate and active surface area of the membrane: Equation (1)
where J is the permeate flux (L·m−2·h−1), V the volume of permeate (L), t the filtration time (h), and A the membrane area (m2).
The resistance of CS and CSCM can be calculated by using Equation (2):
where R is the resistance (m−1), ΔP is the transmembrane pressure applied (Pa), and μ is the viscosity of the permeate corrected to experimental temperature (Pa·s).
The decolorization achieved was measured spectrophotometrically, using UV/VIS4000n Spectrophotometers (DINKO Instruments, Barcelona, Spain), whereas the maximum absorption wavelength was fixed at 484 nm for AO7, 597 nm for RB5, and 585 nm for DB71. The decolorization percentage (D) was calculated using Equation (3):
Ao and A are the absorbance of feed and treated samples during the biodegradation process, respectively.
3. Results and Discussions
3.1. Morphological Structure Analysis
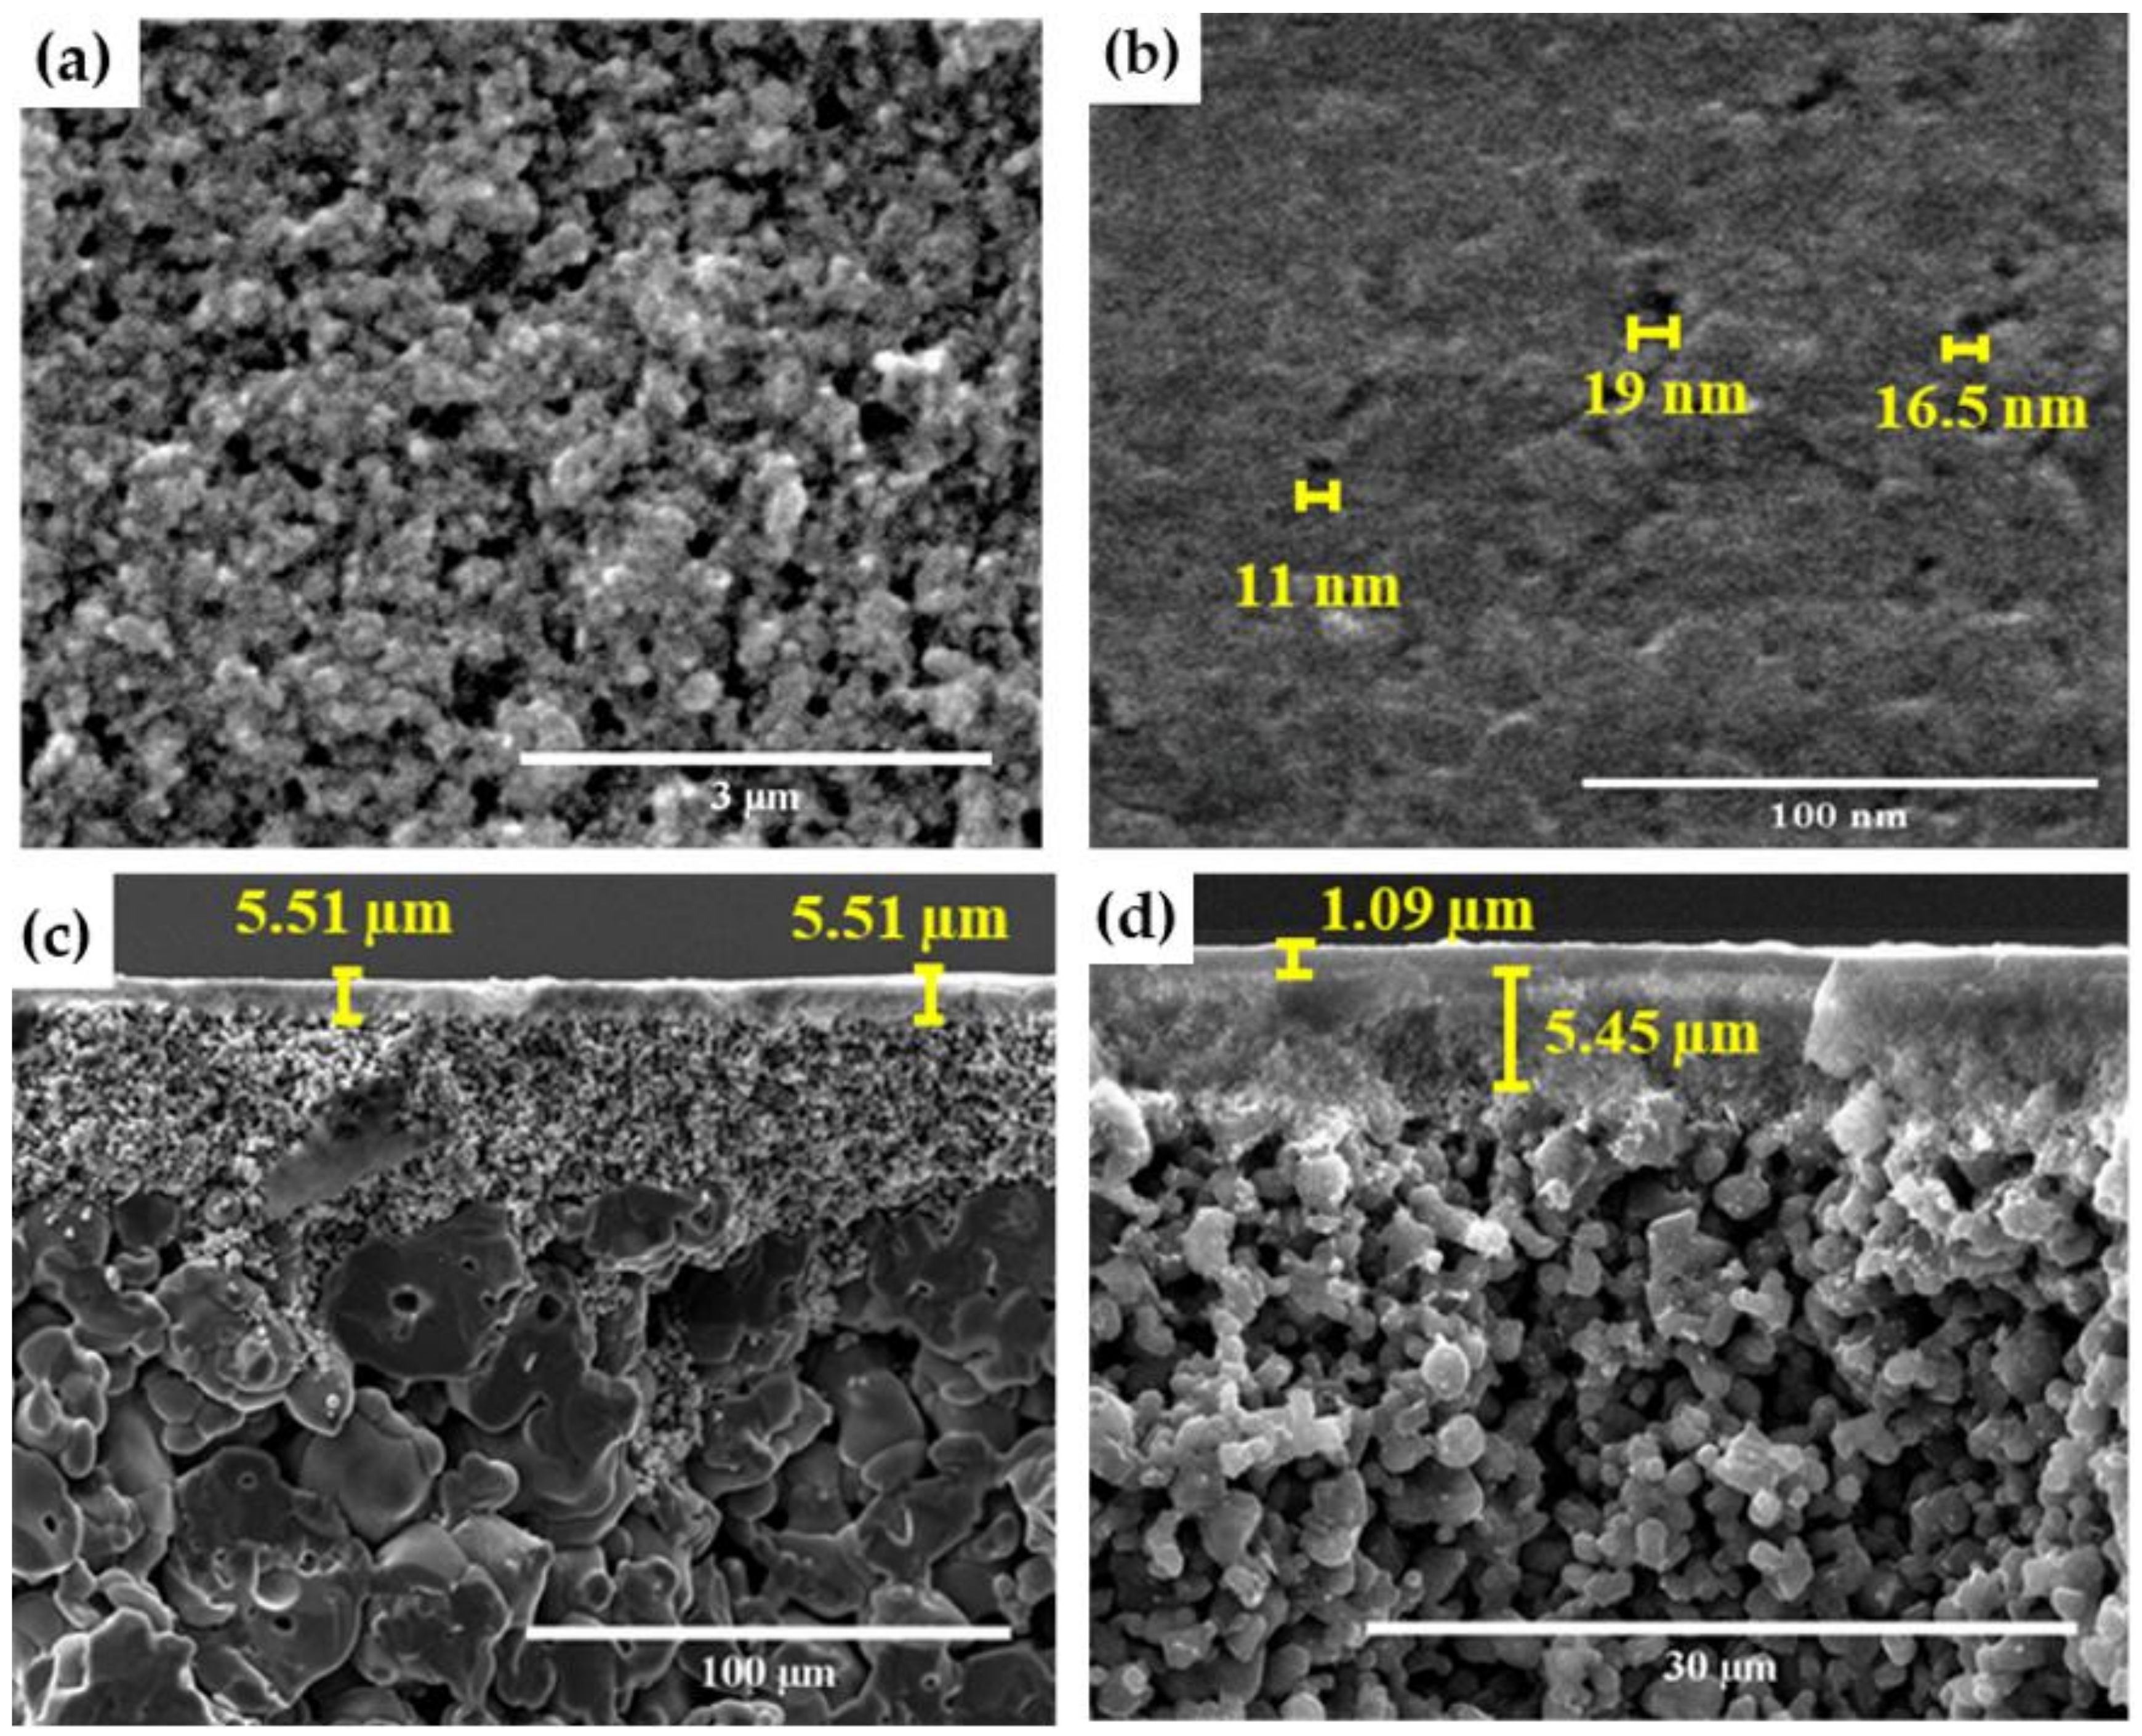
The ESEM images represent the morphology of the CS, and CSCM resulted from carbonization of 10% wt. polymeric precursor. The surface view and cross section of the CS and CSCM are shown in Figure 2a–d. The CS was found to have three layers, with the smallest active porous layer at the top, an intermediate layer in the middle, and a porous supporting layer at the bottom. In CSCM, an extra 1.09 µm porous carbon layer was observed besides these three layers (as shown in Figure 2d). Each carbon and supported layer, however, was not uniform and represented uneven thickness and level.
The surface view of CSCM shows that the coating was homogeneous and defect-free, as the comparison of Figure 2a,b evidences. It is obtained by maintaining the optimum coating processes and carbonization conditions [47,54,55]. The statistical distribution of pore size revealed that the pore size of CSCM was in several textures and grains. A rough analysis of the average pore sizes, based on SEM and AFM imaging, showed more than 80% of the total pores were found in the range 10–25 nm. Desired information from the SEM and AFM images was extracted by ImageJ and SPIP software. These results revealed that the formation of the carbon membrane modified the support pore size from 40 nm to less than 20 nm, which may nearly be classified into the nanoporous membrane family.
The elemental chemical composition of CS and CSCM was studied with ESEM-EDX inspection (Table 2). It confirmed that the CS was composed of TiO2 and ZrO2 layers. Whereas for CSCM, the analysis suggests a typical composite membrane that contains a carbon-rich layer on the top (9.8 to 65.6 wt.% of carbon, depending on precursor concentration), as carbon percentage increased with increasing precursor concentration.
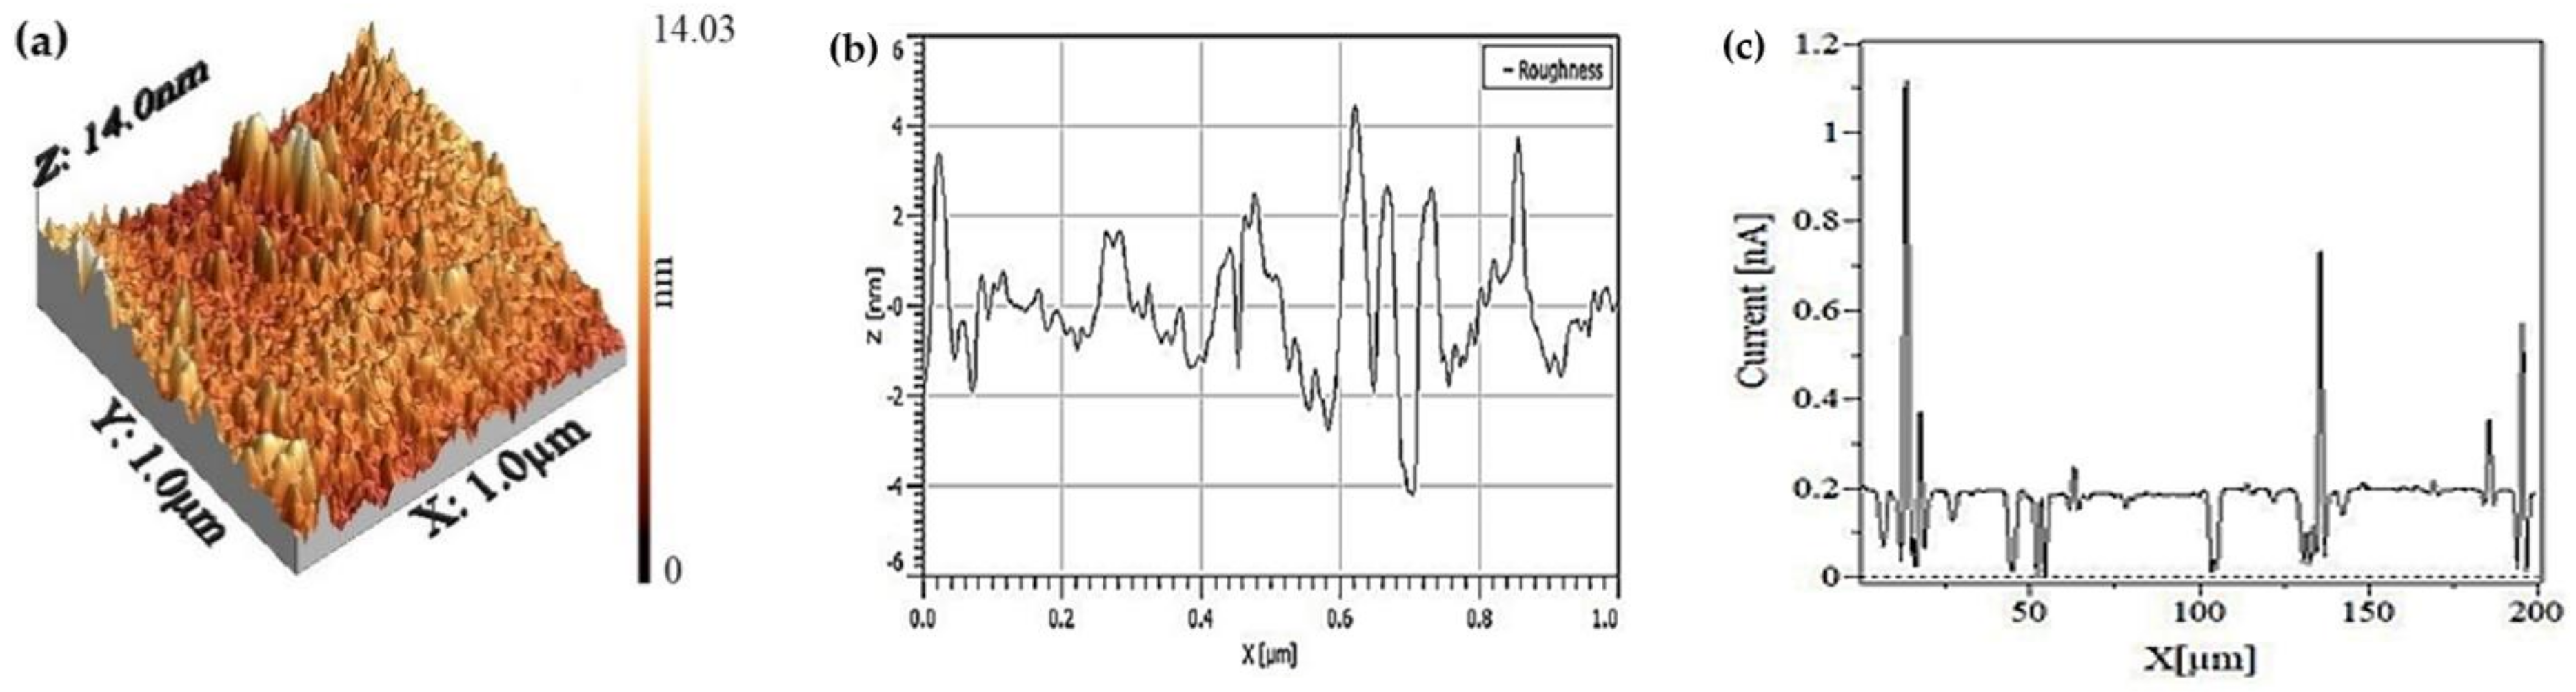
Topographic and current sensing images of the carbon membranes were obtained with AFM (at a random area of 1 × 1 µm2) and current sensing atomic force microscopy (CSAFM), as shown in Figure 3a–c. Tapping mode AFM, which avoids the drag of tips across the sample surface [56], was employed in this experiment to achieve the high-resolution topographic images of the CSCM surface. AFM section images of Figure 3a showed that the CSCM surface was slightly rough and comparatively thin.
The surface roughness deviation of the carbon membrane was measured, resulting in 1.10 nm and 1.48 nm in which the deviation was smaller. Despite that, the rough surfaces could have a beneficial impact on the bioreduction application due to the more vigorous attachment of the biofilm to the surface [57]. CSAFM images (Figure 3c) provide a distribution that reflects the local conductance on the carbon-based membrane surfaces. It appeared that the CSCM surface was conductive, which could improve the biodegradation rate by the electron shuttle mechanism [36]. Though there is no clear correlation between the structures observed in the current image and topographical characteristics, it may be anticipated, as the topography corresponds to the morphological structures that rely on the membrane synthesis process.
3.2. Impact of the Carbon Layer on Flux and Resistance
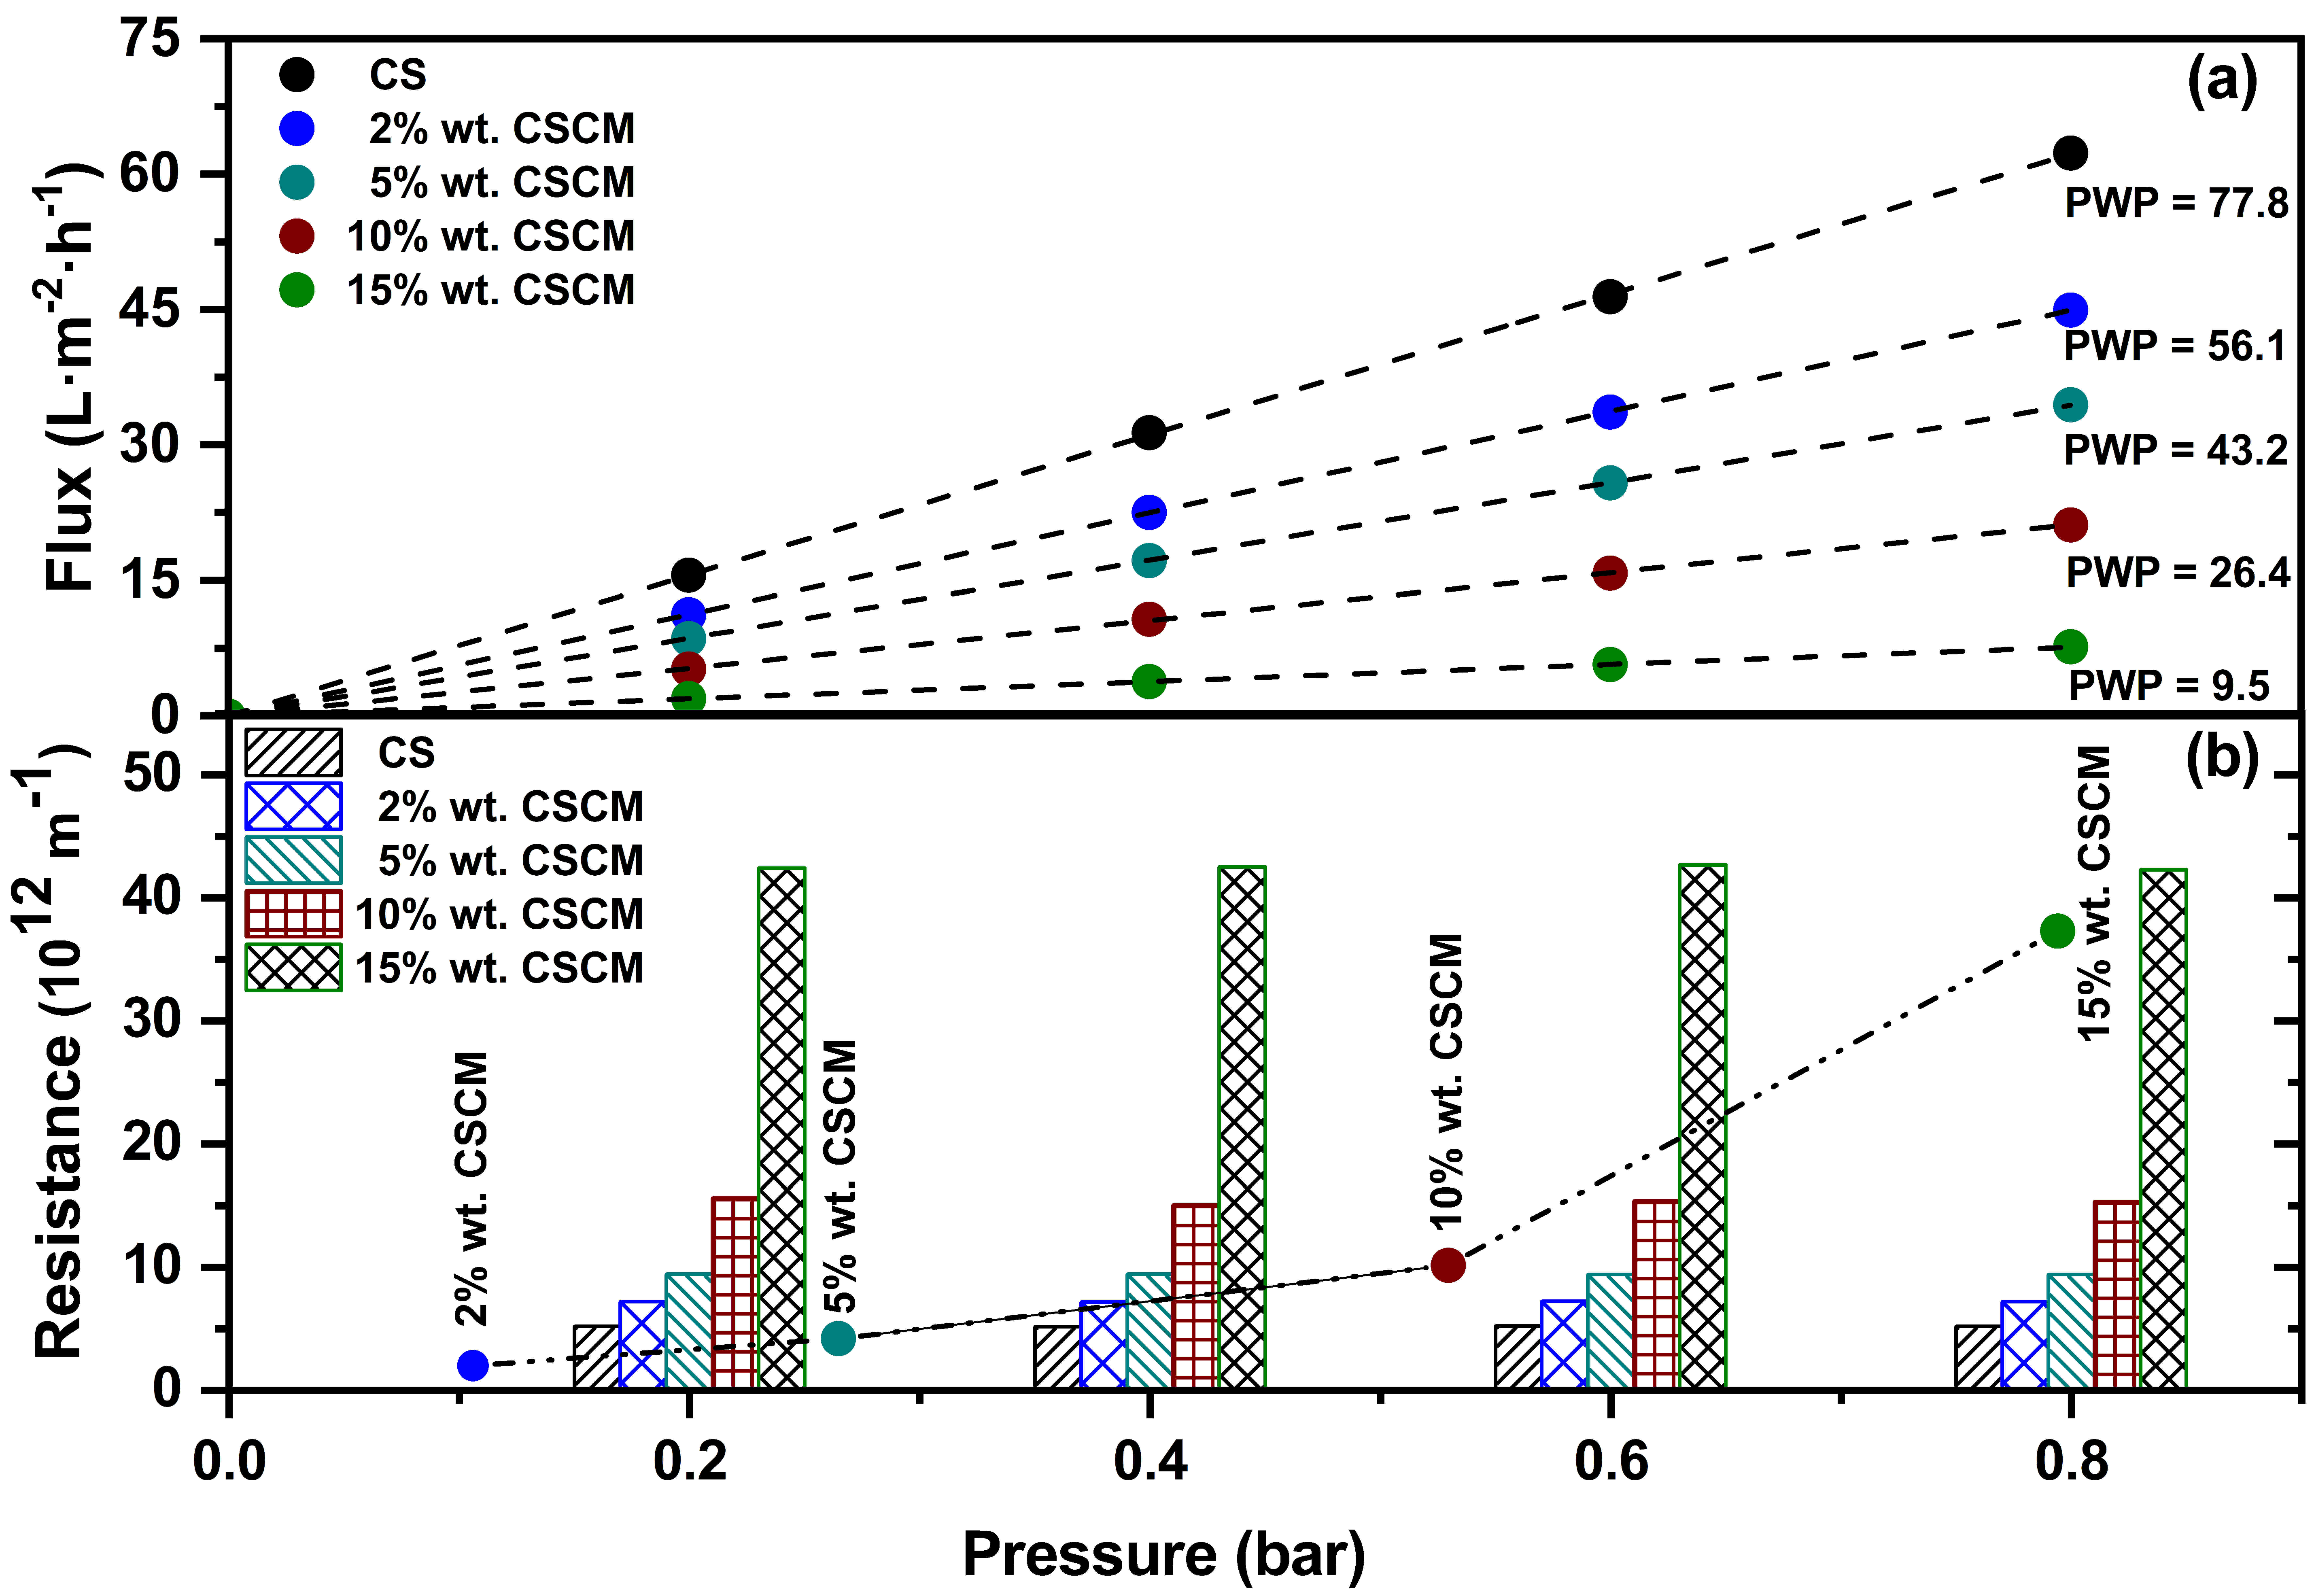
The permeate flux and hydraulic resistance mostly govern the membrane filtration process. A comparative experiment was performed between the CS and CSCMs to assess these characteristics. Variation of the flux and resistance of CS and CSCMs (prepared by 2, 5, 10, and 15% wt. of Matrimid solution) are presented in Figure 4a,b. Not surprisingly, CS exhibits higher flux, 62.3 L·m−2·h−1. In the case of CSCM, it gradually decreases with increasing precursor concentration, and the lowest flux (7.5 L·m−2·h−1) was obtained for the CSCM made of 15% wt. of Matrimid polyimide solution. In comparison to the ceramic support, it is observed that the pure water flux for 2% wt., 5% wt., 10% wt., and 15% wt. CSCM dropped 27%, 44%, 66%, and 88%, respectively. The pure water permeability (PWP) obtained from the slope of Figure 4a) also showed a similar pattern where the highest permeance (77.8 L·m−2·h−1·bar−1) was obtained for CS, and thereafter, the PWP of the 15% wt. CSCM decreased up to 9.5 L·m−2·h−1·bar−1.
As the permeate flux and hydraulic resistance depend on each other, an analogous hydraulic resistance feature was seen between the CS and CSCMs. The overall resistance of the support and carbon membranes are seen in the bar chart of Figure 4b, whereas the resistance of CS was assumed to be constant in CSCMs. In addition, the line graph represents the resistance due to the coated carbon layer on different CSCMs. It is observed that the ceramic support shows 5.16 ± 0.04 × 10¹² m−1 of hydraulic resistance at different TMPs. In CSCM, the deposited carbon layer on the top of the ceramic support added more resistance than CS, which mainly depends on the polymer concentration used to prepare the carbon membrane. Nermen et al. [58] identified that the increase in precursor concentration increased the thickness of the membrane and decreased porosity, resulting in a decline in the permeability rate. Therefore, a higher initial concentration of polymer will facilitate lower hydraulic permeability and maximize the resistance of the resulting carbon membrane. Accordingly, the highest resistance was observed in flowed order: 15% wt. >10% wt. >5% wt. >2% wt. CSCM. Moreover, the CSCM made of 20% wt. Matrimid solution was essentially non-porous, as no flux was obtained even at the highest TMP tested.
3.3. Role of the Carbon Layer on Anaerobic Biodegradation of Azo Dye
The continuous experimental treatment was carried out under anaerobic conditions to promote the reduction of the model azo dye, AO7. The comparative decolorization of azo dye was studied between the ceramic support and ceramic supported carbon membrane. In these experiments (as shown in Figure 5), reactors that use a mixed microbial consortium are referred to as B-CS and B-CSCM, while reactors that do not use it are referred to as R-CS and R-CSCM. The carbon-based membrane reactors were composed of 2% wt. Matrimid polyimide solution. Four compact reactors were operated at once over 50 mg·L−1 AO7 feed solutions. During the ten consecutive days of operation, it is evident that the presence of a carbon layer was found to have a significant influence on the decolorization of AO7, as shown in Figure 5. Overall, it was observed that CSCM bioreactors (B-CSCM) performed a maximum decolorization rate.
For all reactors, above 85% decolorization was achieved within the first 12 h. The dye removal was initially driven by the preferential adsorption of dye molecules over the surface of materials showing this apparent high removal. Over time, dye saturates all the solid materials, resulting in a sudden drop in dye removal performance. Following three days on stream, for R-CS, permeate and feed solution showed the same concentration, meaning that the membrane became saturated, so adsorption no longer occurred, and there was not bioreduction of the dye at all. Meanwhile, decolorization of R-CSCM reactors dropped from 80% to 10% in six days, and then the reduction was stable at 7%. This behavior is attributed to the nano-sized membrane pores developed in the carbon layer, in which this residual decolorization was controlled mainly by a sieving mechanism [59].
The most efficient and improved conversion, nearly 51%, was attained by the B-CSCM reactor. In B-CSCM, filtration and biodegradation simultaneously occur. The compact reactor took a minimum of two days to stabilize the system, which was faster than other studies in different systems [42,60]. This fact clearly demonstrated that the deposited carbon layer plays a critical role as biofilm support, redox mediator [61], and filtration unit. The size of CSCM pores was much smaller than that of the microorganism so that they could not get into the pores to block them. As a result, biofilm and the degradation products were retained on the membrane surface, and microorganisms metabolized the substrate better [46]. In the absence of the carbon layer, it appears that B-CS was unsuccessful to perform efficiently. In this case, the microorganisms were probably unable to create a stable dense biofilm on the membrane surface, because the bacteria were washed out by the permeate flow due to their smaller size compared to the support pores. Thus, the novel one-step compact unit (B-CSCM) was able to combine dye and microorganism retention properly, and promote both biofilm growth and electron transferability to furnish an effective dye removal process through anaerobic bioreduction.
At the end of the B-CSCM experiment, backflushing cleaning was used to check the recoverability of the membrane. Thus, the initial permeate flux was obtained without any apparent structural modification or loss due to bioreduction activity. Therefore, the system can be reused for weeks without mechanical or chemical damage.
3.4. Effect of Precursor Concentration on Azo Dye Decolorization
The anaerobic bioreduction of the model azo dye compound was investigated in three different B-CSCMs, which contained the carbon membrane made from 2% wt., 5% wt., and 10% wt. of Matrimid solution, respectively. For these B-CSCMs (as shown in Figure 6), the highest decolorization (98%) was observed for the CSCM prepared with a concentration of 10% wt. CSCM, whereas the lowest (51%) color removal was observed for 2% wt. CSCM.
The results revealed that this 98% of decolorization was attained at a removal rate of 49 g·m−3·d−1. The various conventional, batch, continuous, and discontinuous biosystems, such as PBRs or sequential anaerobic-aerobic processes, operated with different initial dye concentrations and showed that high AO7 conversion (>90%) required a longer contact time (10–15 days) than B-CSCM [9,46,60,62]. Using the mixed culture under batch condition, Brás et al. [63] reported AO7 decolorization of up to 90% after four days of operation. Similarly, Evangelista-Barreto et al. [64] (achieved 96–98% of color removal) and Bragger et al. (decolorized up to 95%) [65] also published identical decolorization results for pure culture.
Antonio et al. [66] investigated catalyst loading and discovered that increasing the catalyst load improves azo dye decolorization efficiency. Similarly, the above results proved that the decolorization efficiency was boosted by the amount of carbonaceous material deposited on the ceramic supported membrane. The ESEM-EDX analysis (Table 2) confirms that the increasing precursor concentration raises the carbon content in the CSCM superficial layer. The high concentration of polymeric precursor mostly creates a membrane with a smaller pore size due to the slow evaporation of solvent [67]. This smaller pore-sized carbon-rich layer makes the CSCM easier to serve as an effective organic adsorbent and immobilization support. Besides, an increase in carbon content in the CSCMs enhanced their redox mediator capacity and, thus, their biodegradation activity.
The same evidence is illustrated in Figure 6, which raised the decolorization of AO7 as the precursor concentration of CSCM increased. For example, polymer content changes from 2% to 10% wt. had doubled decolorization effectiveness. Conversely, the extreme rise in precursor concentration decreased the pore size and permeability of the CSCM, which was not favorable for lack of flux in this compact treatment unit at reasonable TMP pressure. Considering this fact, the CSCM that consisted of 15% and 20% wt. of Matrimid solution was not used in the process of bioreduction. Thereafter, 10% wt. of Matrimid precursor was chosen for all subsequent tests.
3.5. Effect of Flux and Feed Concentration on Azo Dye Decolorization
A series of B-CSCMs were simultaneously operated to assess the impact of initial AO7 dye concentration and permeate flux on decolorization efficiency. Consequently, three B-CSCMs were run at feed concentrations of 50, 75, and 100 mg·L−1, respectively. Each reactor was started from the lowest flux (0.05 L·m−2·h−1), and when the steady operation was achieved, step by step, flux was first increased to 0.075 L·m−2·h−1 and finally to 0.1 L·m−2·h−1. The permeate flux was set by varying the operating pressure. A small fluctuation was observed in the operating flux, and it was controlled by modifying the TMP; nonetheless, the decolorization rate was very stable. The decolorization efficiency depicted in Figure 7 illustrates that the maximum color removal was obtained at a low flux (0.05 L·m−2·h−1) and initial concentration (50 mg·L−1); as expected, it declined with higher permeate flux and feed concentration. In that low flux-region, the color removal was essentially complete, and no differences can be observed for the different feed concentrations. After that, for B-CSCMs operating with 100 mg·L−1 of dye solutions, it was observed that the gradual reduction of decolorization was due to the rise of feed concentration and permeate flow. Results showed that efficiency of decolorization decreased to 60% at a flux of 0.075 L·m−2·h−1, and 36% for 0.10 L·m−2·h−1.
As stated in Figure 7, at a flux of 0.05 L·m−2·h−1, dye biodegradation efficiency was almost identical for all concentrations of AO7 feed solutions within the first ten days of the experiments. In this interval, there was an average of 98% decolorization for all concentrated AO7 dye solutions (Figure 7). This result indicates that the amount of biomass was high enough to guarantee the total biodegradation of the dye. Even though the concentration was doubled from its initial point (50 to 100 mg·L−1), due to the large contact time at low flux [68], the increased dye concentration had no adverse impact on individual bacteria microbial population. At a flux of 0.075 L·m−2·h−1, the decolorization efficiency of B-CSCMs of 50, 75, and 100 mg·L−1 dye solution was decreased at 80%, 69%, and 60%, respectively, as shown in Figure 7. Subsequently, their performance reduced to 58%, 45%, and 36%, respectively, when the permeate flux was increased up to 0.10 L·m−2·h−1. The obtained results were in line with previous findings reported by Meitiniarti et al. [69] and Ding et al. [70], where it was observed that the color removal rate declined from 98% to 58%, while the AO7 dye concentration increased to 140 mg·L−1.
It should be noted that higher permeate flux or higher feed concentration at the reactor means higher dye load rate, which reduces the microorganism’s tolerance [71]. Therefore, the decolorization ability was probably reduced because of the shortage of biomass in the biodegradation process [72]. Such a significant adverse pattern was observed in other systems for the decolorization of AO7 [73,74]. One reason could be the presence of sulfonic acid (-SO3H) group in the azo dye structure, which significantly suppressed the microbial growth at higher dye concentrations [75]. Nonhydrolyzed organic matter and heavy metals may also inhibit bacterial growth and might be another cause for toxicity at higher concentrations.
3.6. Comparative Decolorization of Azo Dyes
A set of B-CSCMs was prepared to check the anaerobic bioreduction of structurally different azo dyes; in this case, azo dyes containing one azo bond, monoazo AO7; two azo bonds, diazo RB5 or three azo bonds, triazo DB71. Again, the effect of feed concentration and flux was explored. As shown in Figure 8a–c, the results of these experiments indicate that the decolorization rate of all azo dye solutions decreased with increasing dye concentration and permeate flux. The mono azo dye solution at a low flux (0.05 L·m−2·h−1) showed the maximum color removal, 98%, in all operations.
Overall, the azo dye solutions exhibited different decolorization levels, mainly depending on the number of azo bonds. The structural differences, such as the functional groups, number of azo bonds, morphology, and position of the benzene ring, have been reported to cause variations in decolorization rate [76,77]. The decolorization is typically higher for simple low molecular weight azo dyes; on the contrary, the color removal becomes smaller for the complex large weight dye molecules. Therefore, irrespective of the initial dye concentration and permeate flux, monoazo dye decolorization was significantly higher than for diazo and triazo dyes. For instance, under different dye concentrations and fluxes, decolorization of AO7 ranged between 98% and 32%; additionally, RB5 and DB71 varied from 82% to 30% and from 70% to 26%, respectively. Thus, it was proved that the present method also successfully deals with complex azo dyes, and the decolorization trends were consistent with other previous research [78,79,80].
As for previous results, the color removal of such dyes for various concentrations tested decreased with increasing permeate flux and feed dye concentration. It was observed that with the gradual raise in permeate flux (0.05, 075, and 0.10 L·m−2·h−1) and feed dye concentrations (50, 75, and 100 mg·L−1), the rate of decolorization of RB5 and DB71 was consistently less than for AO7. At higher flux (0.10 L·m−2·h−1), the percentage of decolorization was lowered to 59%, 41%, and 32% for a 50 mg·L−1 solution of AO7, RB5, and DB71, respectively. When the feed dye concentration increased up to 100 mg·L−1, the decolorization of dye solution was additionally reduced to 37% for AO7, 30% for RB5, and 26% for DB71. The reason for the reduction in removal rate was probably that the high concentration of dyes hindered biofilm growth, and later this adverse environment was responsible for some microbial death.
In any case, all B-CSCMs showed stable performance. The short contact time, i.e., high flux inhibits prolonged toxicity and dye deposition on biomass, makes the environment more favorable for microorganisms to outlive. This finding reflects those of Franciscon et al. [79], where the dyes with mono azo bonds were more likely to decolorize quicker than those with diazo or triazo groups. However, at a lower flux (0.05 L·m−2·h−1), the decolorization effect by the initial dye concentration was not observed very much. For instance, Figure 8a–c showed that, at this stage, around 98%, 80%, and 68% of decolorization was achieved for the various concentrations of AO7, RB5, and DB71, respectively. It is assumed that the dye decolorization response with higher contact time favors the well-built microbial growth and efficient biodegradation operation. Hence, there was a significant correlation between feed dye concentration and permeate flux, and an optimum value should be required to operate the decolorization process efficiently.
3.7. Microbial Community Analysis
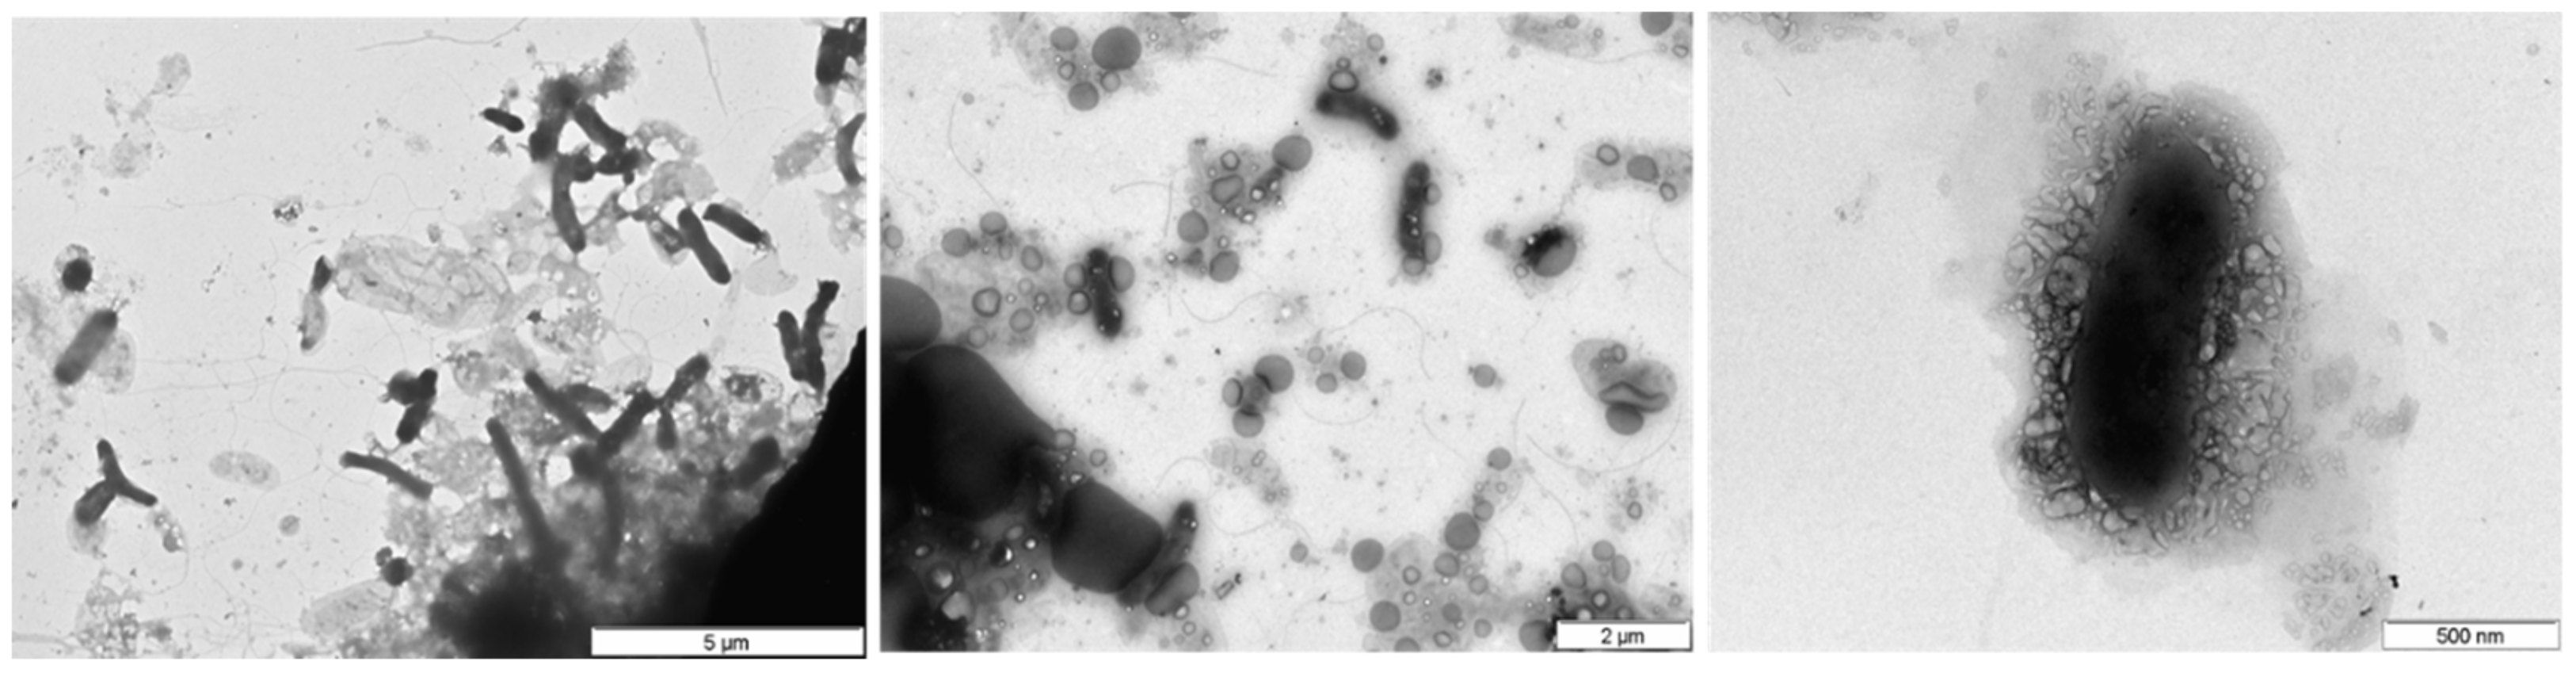
After biodegradation of the AO7 dye, the bacterial cell morphology of biofilm that formed over the B-CSCM was evaluated by TEM analysis. At different magnifications, Figure 9 shows the presence of microorganisms on the biofilm sample. The microscopy images showed that most of the microorganisms could belong to the community of bacillus and vibrio bacteria. Some fungi may also be present as the inoculum was prepared from a mixed anaerobic microbial consortium obtained from a conventional wastewater treatment plant, where typically numerous groups of microorganisms exist.
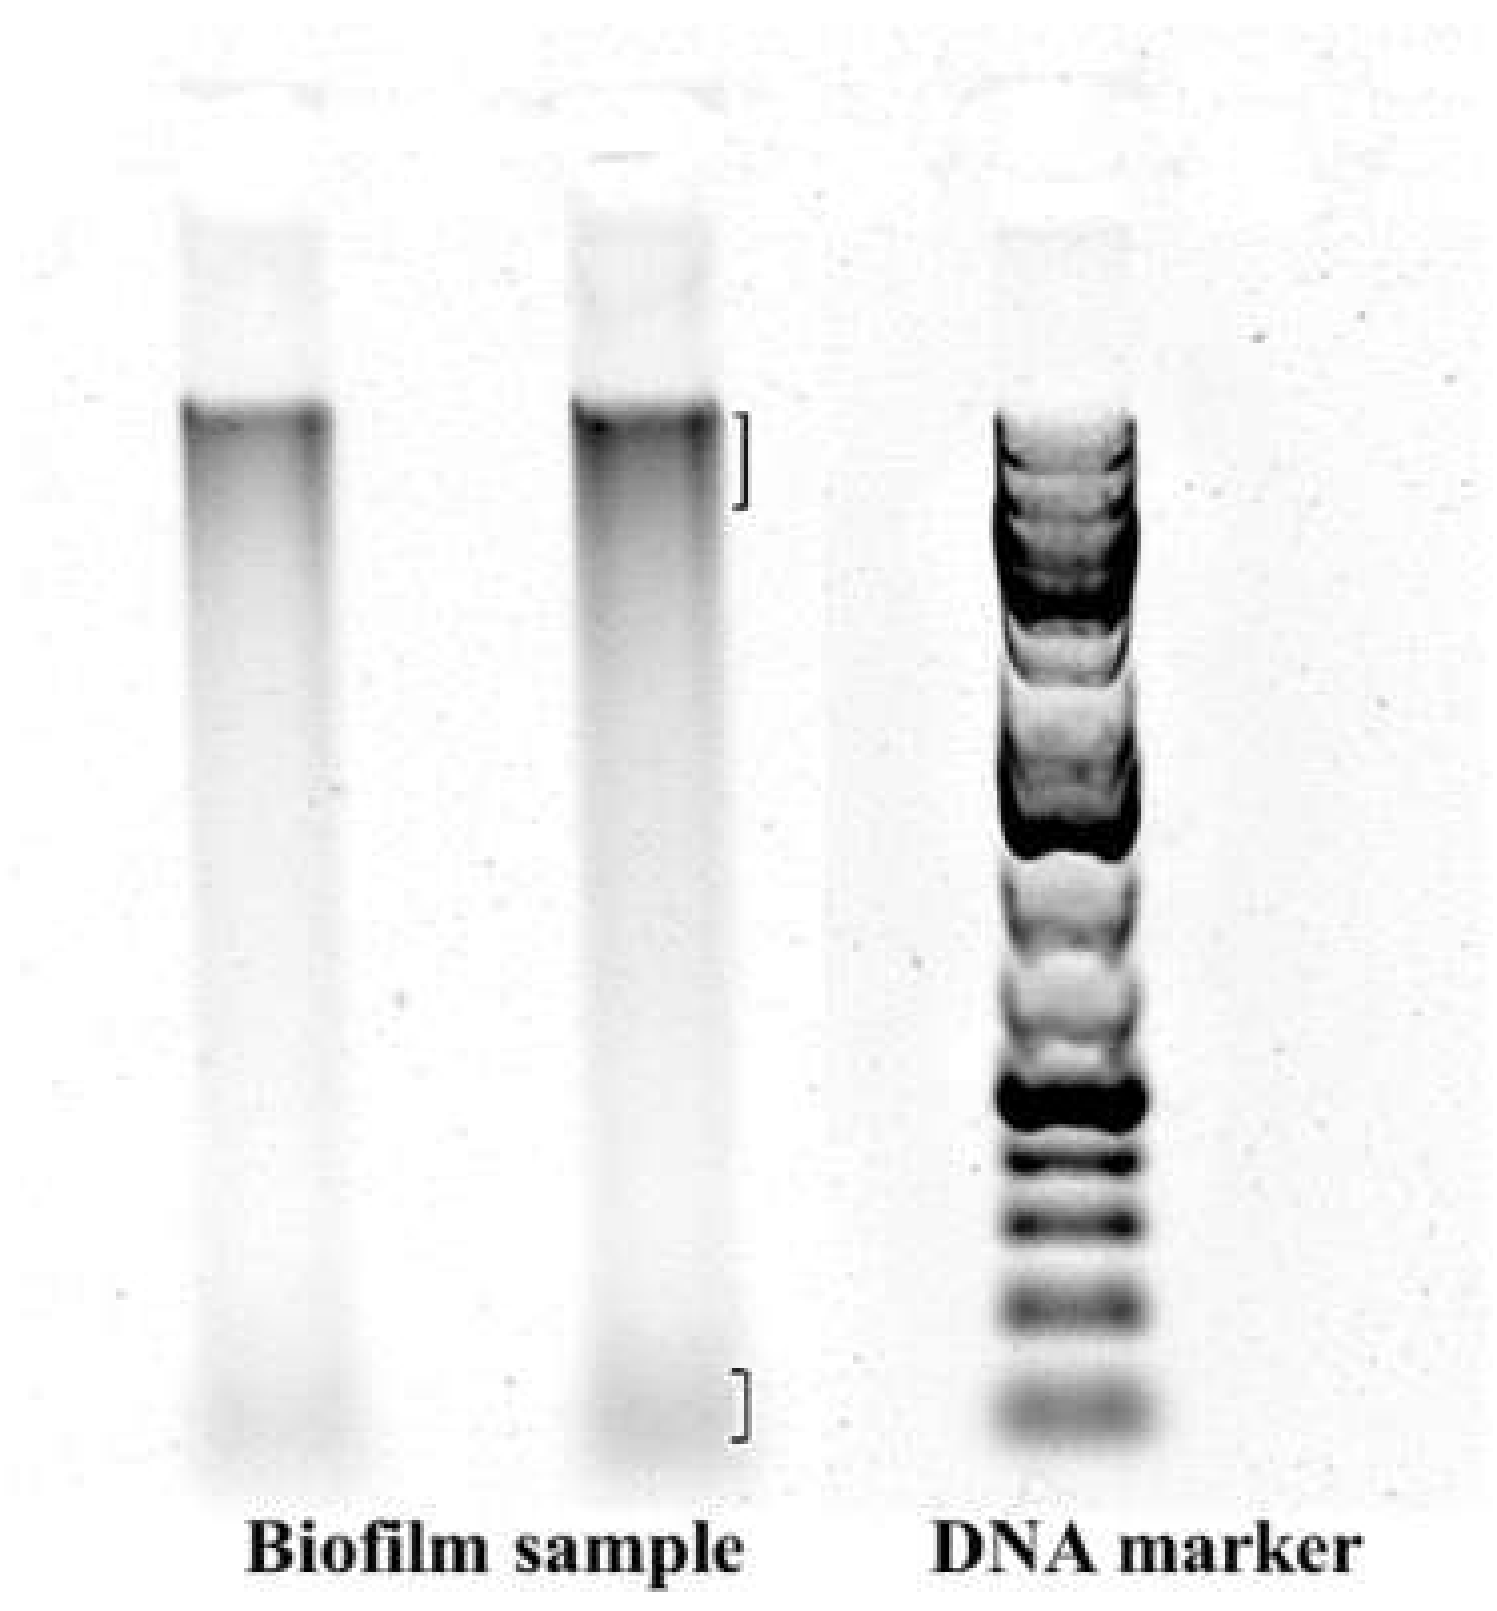
Afterward, the DNA of the biofilm sample was collected to confirm the existence of microorganisms. DGGE fingerprint patterns (Figure 10) indicate that active microbial colonies existed in the biofilm sample. This analysis, however, was insufficient to give more detailed information on microbial diversity.
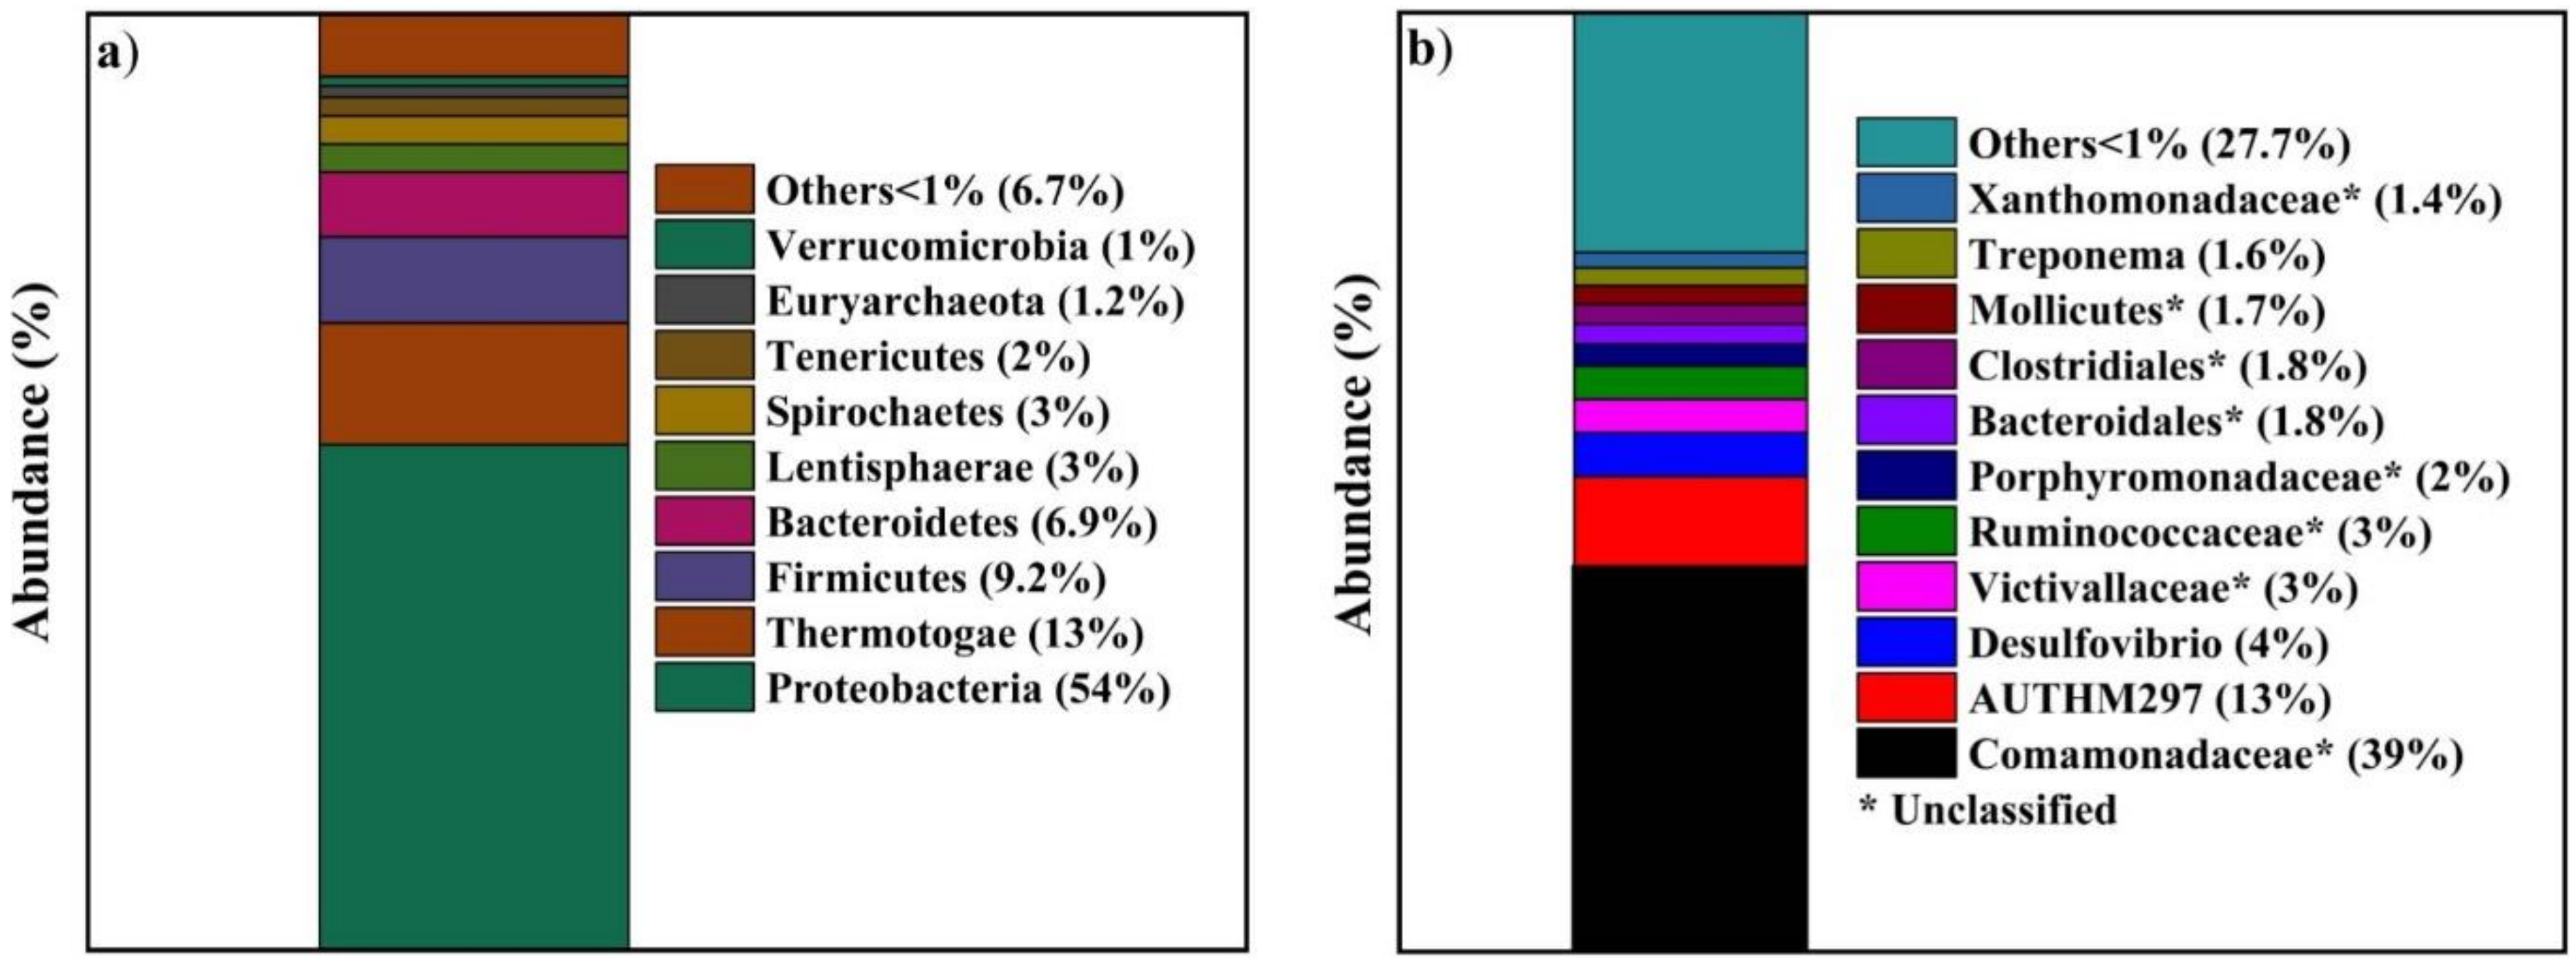
The taxonomical studies were performed by PCR amplifying to determine the microbial species and genus distribution of biofilm samples. In total, 357 bacterial operational taxonomic units (OTUs) and 43 fungal OTUs were detected in the samples studied. The mixed anaerobic microbial culture used in this biodecolorization experiment was responsible for the existence of numerous bacterial and fungal species. Alpha diversity analysis assessed by the QIIME (V1.9.1) showed that the microbial richness (Chao1 Index: 1989.93 for bacterial and 41.19 for fungal species) and the diversity (Shannon Indices: 6.69 for bacterial and 1.91 for fungal species and Simpson indices: 0.925 for bacterial and 0.471 for fungal species) of bacteria were more dominant than the fungi.
As illustrated in Figure 11a–b, bacterial analysis showed that the Comamonadaceae (39%) was the most prevalent bacterial community, followed by AUTHM297 (13%), Desulfovibrio (4%), Victivallaceae (3%), Ruminococcaceae (3%), Porphyromonadaceae (2%), Bacteroidales (1.8%), Clostridiales (1.8%), Mollicutes (1.7%), Treponema (1.6%), and Xanthomonadaceae (1.4%). The largest phylum consisted of Proteobacteria (54%), followed by Thermotogae (13%), Firmicutes (9.2%), and Bacteroidetes (6.9%). Fungi phyla distribution revealed that 90% of OTUs were not matched with any fungal taxonomic category. The rest of the OTUs was prevalent by Ascomycota (9.3%), composed by the genus Candida (0.5%) and the genus Pseudallescheria (8.5%).
The role of Proteobacteria and Firmicutes during the degradation of dye solution by microbial communities was proven in several studies [81,82]. Cui et al. [83] revealed that the bacterial community (rich in Proteobacteria and Firmicutes) present in anaerobic sludge efficiently decolorized the azo, anthraquinone, and triphenylmethane dyes. Under anaerobic or microaerobic conditions, firmicutes bacteria promoted the ability of Proteobacteria to decolorate azo dyes [84]. What is more, other bacterial species such as Bacteriodates [85], Desulfovibrio [86], and Clostridia [87] were capable of decolorization of dye solutions. Separately, some of the fungal species were also known to be capable of decolorizing the textile azo dyes [88].
4. Conclusions
The concept of a compact one-step B-CSCM was implemented for the anaerobic decolorization of structurally different dyes, AO7, RB5, and DB71, without the need for subsequent purification steps.
Stable carbon-layers were synthesized with designed thickness, using Matrimid polymer precursor, over a commercial ceramic flat element. Long-term operation demonstrated a robust operation without apparent loss of chemical and mechanical properties.
The triple role of CSCM, such as attachment of microorganisms to grow biofilms, redox mediator for better electron transfer, and nano-filter to retain the dyes, demonstrated better efficiency and removal rate in B-CSCMs.
Stable performance of anaerobic biodegradation was achieved for all types of azo dyes and operation conditions. Comparatively, for any feed concentration and permeate flux, AO7 azo dye shows a higher decolorization rate. Diazo and triazo dyes seem to be more reluctant to biodecolorization.
For the maximum decolorization extent (98% for AO7, 80% for RB5 and 69% for DB71), it seems that an increase in dye concentration at low permeate flux (0.05 L·m−2·h−1) causes no limitation to the biodegradation process. In contrast, high permeate flux, that is, lower contact time, reduced the removal rate of any concentrated dye solution.
The metagenomics results and microbial activity tests indicate that the proteobacteria and firmicutes were mainly responsible for dye decolorization.
Author Contributions
Conceptualization, J.F. and M.S.A.A.; investigation, M.S.A.A.; writing—original draft preparation, J.F. and M.S.A.A.; writing—review and editing, J.F., M.S.A.A.; resources, F.S., J.G., A.F. (Azael Fabregat), A.F. (Agustin Fortuny) and J.F.; validation, F.S., J.G., A.F. (Azael Fabregat) and A.F. (Agustin Fortuny); supervision, J.F. All authors have read and agreed to the published version of the manuscript.
Funding
This project has been supported by the European Union’s Horizon 2020 research and innovation programme under the Marie Skłodowska-Curie grant agreement No. 713679 and by the Universitat Rovira i Virgili (URV), contract 2017MFP-COFUND-18. Funding for this research was provided by Ministerio de Ciencia, Innovación y Universidades, the Agencia Estatal de Investigación (AEI) and the European Regional Development Fund (ERDF), project RTI2018-096467-B-I00. The authors research group is recognized by the Comissionat per a Universitats i Recerca, DIUE de la Generalitat de Catalunya (2017 SGR 396), and supported by the Universitat Rovira i Virgili (2019PFR-URV-33). We would like thank Constantí for her contribution to the bacterial community characterization.
Institutional Review Board Statement
Not applicable.
Informed Consent Statement
Not applicable.
Data Availability Statement
The data presented in this study are available on request from the corresponding author.
Conflicts of Interest
The authors declare no conflict of interest.
References
- Shanker, U.; Rani, M.; Jassal, V. Degradation of hazardous organic dyes in water by nanomaterials. Environ. Chem. Lett. 2017, 15, 623–642. [Google Scholar] [CrossRef]
- Puvaneswari, N.; Jayarama, M.; Gunasekaran, P. Toxicity assessment and microbial degradation of azo dyes. Indian J. Exp. Biol. 2006, 44, 618–626. [Google Scholar] [PubMed]
- Dos Santos, A.B.; Cervantes, F.J.; van Lier, J.B. Review paper on current technologies for decolourisation of textile wastewaters: Perspectives for anaerobic biotechnology. Bioresour. Technol. 2007, 98, 2369–2385. [Google Scholar] [CrossRef] [PubMed]
- Alves de Lima, R.O.; Bazo, A.P.; Salvadori, D.M.F.; Rech, C.M.; de Palma Oliveira, D.; de Aragão Umbuzeiro, G. Mutagenic and carcinogenic potential of a textile azo dye processing plant effluent that impacts a drinking water source. Mutat. Res. Genet. Toxicol. Environ. Mutagenesis 2007, 626, 53–60. [Google Scholar] [CrossRef]
- Lellis, B.; Fávaro-Polonio, C.Z.; Pamphile, J.A.; Polonio, J.C. Effects of textile dyes on health and the environment and bioremediation potential of living organisms. Biotechnol. Res. Innov. 2019, 3, 275–290. [Google Scholar] [CrossRef]
- Nawaz, M.S.; Gadelha, G.; Khan, S.J.; Hankins, N. Microbial toxicity effects of reverse transported draw solute in the forward osmosis membrane bioreactor (FO-MBR). J. Membr. Sci. 2013, 429, 323–329. [Google Scholar] [CrossRef]
- Poots, V.J.P.; McKay, G.; Healy, J.J. Removal of Basic Dye from Effluent Using Wood as an Adsorbent. J. Water Pollut. Control Fed. 1978, 50, 926–935. [Google Scholar]
- Rani, D.; Dahiya, R.P. COD and BOD removal from domestic wastewater generated in decentralised sectors. Bioresour. Technol. 2008, 99, 344–349. [Google Scholar] [CrossRef]
- Mezohegyi, G.; Kolodkin, A.; Castro, U.I.; Bengoa, C.; Stuber, F.; Font, J.; Fabregat, A.; Fortuny, A. Effective Anaerobic Decolorization of Azo Dye Acid Orange 7 in Continuous Upflow Packed-Bed Reactor Using Biological Activated Carbon System. Ind. Eng. Chem. Res. 2007, 46, 6788–6792. [Google Scholar] [CrossRef]
- Beydilli, M.I.; Pavlostathis, S.G.; Tincher, W.C. Biological Decolorization of the Azo Dye Reactive Red 2 under Various Oxidation-Reduction Conditions. Water Environ. Res. 2000, 72, 698–705. [Google Scholar] [CrossRef]
- Manu, B. Physico-chemical treatment of indigo dye wastewater. Coloration Technol. 2007, 123, 197–202. [Google Scholar] [CrossRef]
- Karcher, S.; Kornmüller, A.; Jekel, M. Anion exchange resins for removal of reactive dyes from textile wastewaters. Water Res. 2002, 36, 4717–4724. [Google Scholar] [CrossRef]
- Papić, S.; Koprivanac, N.; Božić, A.L. Removal of reactive dyes from wastewater using Fe(III) coagulant. Coloration Technol. 2000, 116, 352–358. [Google Scholar] [CrossRef]
- Uddin, M.J.; Islam, M.A.; Haque, S.A.; Hasan, S.; Amin, M.S.A.; Rahman, M.M. Preparation of nanostructured TiO2-based photocatalyst by controlling the calcining temperature and pH. Int. Nano Lett. 2012, 2, 1–10. [Google Scholar] [CrossRef] [Green Version]
- Koyuncu, İ.; Afşar, H. Decomposition of dyes in the textile wastewater with ozone. J. Environ. Sci. Health Part A Environ. Sci. Eng. Toxicol. 1996, 31, 1035–1041. [Google Scholar] [CrossRef]
- Papić, S.; Koprivanac, N.; Božić, A.L.; Vujević, D.; Dragičević, S.K.; Kušić, H.; Peternel, I. Advanced Oxidation Processes in Azo Dye Wastewater Treatment. Water Environ. Res. 2006, 78, 572–579. [Google Scholar] [CrossRef] [PubMed]
- Ennouri, R.; Lavecchia, R.; Zuorro, A.; Elaoud, S.C.; Petrucci, E. Degradation of chloramphenicol in water by oxidation on a boron-doped diamond electrode under UV irradiation. J. Water Process Eng. 2021, 41, 1–9. [Google Scholar] [CrossRef]
- Montanaro, D.; Lavecchia, R.; Petrucci, E.; Zuorro, A. UV-assisted electrochemical degradation of coumarin on boron-doped diamond electrodes. Chem. Eng. J. 2017, 323, 512–519. [Google Scholar] [CrossRef]
- Liakou, S.; Kornaros, M.; Lyberatos, G. Pretreatment of azo dyes using ozone. Water Sci. Technol. 1997, 36, 155–163. [Google Scholar] [CrossRef]
- Tzitzi, M.; Vayenas, D.V.; Lyberatos, G. Pretreatment of Textile Industry Wastewaters with Ozone. Water Sci. Technol. 1994, 29, 151–160. [Google Scholar] [CrossRef]
- Xu, Y.; Lebrun, R.E.; Gallo, P.-J.; Blond, P. Treatment of Textile Dye Plant Effluent by Nanofiltration Membrane. Sep. Sci. Technol. 1999, 34, 2501–2519. [Google Scholar] [CrossRef]
- Ghanbarlou, H.; Pedersen, N.L.; Simonsen, M.E.; Muff, J. Nitrogen-Doped Graphene Iron-Based Particle Electrode Outperforms Activated Carbon in Three-Dimensional Electrochemical Water Treatment Systems. Water 2020, 12, 3121. [Google Scholar] [CrossRef]
- Hansson, H.; Kaczala, F.; Marques, M.; Hogland, W. Photo-Fenton and Fenton Oxidation of Recalcitrant Industrial Wastewater Using Nanoscale Zero-Valent Iron. Int. J. Photoenergy 2012, 2012, 531076. [Google Scholar] [CrossRef] [Green Version]
- Khehra, M.S.; Saini, H.S.; Sharma, D.K.; Chadha, B.S.; Chimni, S.S. Decolorization of various azo dyes by bacterial consortium. Dye. Pigment. 2005, 67, 55–61. [Google Scholar] [CrossRef]
- Lau, Y.-Y.; Wong, Y.-S.; Teng, T.-T.; Morad, N.; Rafatullah, M.; Ong, S.-A. Coagulation-flocculation of azo dye Acid Orange 7 with green refined laterite soil. Chem. Eng. J. 2014, 246, 383–390. [Google Scholar] [CrossRef]
- Islam, M.A.; Amin, M.S.A.; Hoinkis, J. Optimal design of an activated sludge plant: Theoretical analysis. Appl. Water Sci. 2013, 3, 375–386. [Google Scholar] [CrossRef] [Green Version]
- Robinson, T.; McMullan, G.; Marchant, R.; Nigam, P. Remediation of dyes in textile effluent: A critical review on current treatment technologies with a proposed alternative. Bioresour. Technol. 2001, 77, 247–255. [Google Scholar] [CrossRef]
- Galán, J.; Rodríguez, A.; Gómez, J.M.; Allen, S.J.; Walker, G.M. Reactive dye adsorption onto a novel mesoporous carbon. Chem. Eng. J. 2013, 219, 62–68. [Google Scholar] [CrossRef]
- Zhang, J.; Wang, L.; Zhang, G.; Wang, Z.; Xu, L.; Fan, Z. Influence of azo dye-TiO2 interactions on the filtration performance in a hybrid photocatalysis/ultrafiltration process. J. Colloid Interface Sci. 2013, 389, 273–283. [Google Scholar] [CrossRef]
- Wanyonyi, W.C.; Onyari, J.M.; Shiundu, P.M.; Mulaa, F.J. Effective biotransformation of Reactive Black 5 Dye Using Crude Protease from Bacillus Cereus Strain KM201428. Energy Procedia 2019, 157, 815–824. [Google Scholar] [CrossRef]
- Buckley, C.A. Membrane Technology for the Treatment of Dyehouse Effluents. Water Sci. Technol. 1992, 25, 203–209. [Google Scholar] [CrossRef]
- Żyłła, R.; Ledakowicz, S.; Boruta, T.; Olak-Kucharczyk, M.; Foszpańczyk, M.; Mrozińska, Z.; Balcerzak, J. Removal of Tetracycline Oxidation Products in the Nanofiltration Process. Water 2021, 13, 555. [Google Scholar] [CrossRef]
- Gupta, V.K.; Khamparia, S.; Tyagi, I.; Jaspal, D.; Malviya, A. Decolorization of Mixture of Dyes: A Critical Review. Glob. J. Environ. Sci. Manag. 2015, 1, 71–94. [Google Scholar]
- Mubashar, M.; Naveed, M.; Mustafa, A.; Ashraf, S.; Shehzad Baig, K.; Alamri, S.; Siddiqui, M.H.; Zabochnicka-Świątek, M.; Szota, M.; Kalaji, H.M. Experimental Investigation of Chlorella vulgaris and Enterobacter sp. MN17 for Decolorization and Removal of Heavy Metals from Textile Wastewater. Water 2020, 12, 3034. [Google Scholar] [CrossRef]
- Yu, L.; Zhang, X.-Y.; Wang, S.; Tang, Q.-W.; Xie, T.; Lei, N.-Y.; Chen, Y.-L.; Qiao, W.-C.; Li, W.-W.; Lam, M.H.-W. Microbial community structure associated with treatment of azo dye in a start-up anaerobic sequenced batch reactor. J. Taiwan Inst. Chem. Eng. 2015, 54, 118–124. [Google Scholar] [CrossRef]
- Keck, A.; Klein, J.; Kudlich, M.; Stolz, A.; Knackmuss, H.J.; Mattes, R. Reduction of azo dyes by redox mediators originating in the naphthalenesulfonic acid degradation pathway of Sphingomonas sp. strain BN6. Appl. Environ. Microbiol. 1997, 63, 3684–3690. [Google Scholar] [CrossRef] [Green Version]
- Saratale, R.G.; Saratale, G.D.; Chang, J.S.; Govindwar, S.P. Bacterial decolorization and degradation of azo dyes: A review. J. Taiwan Inst. Chem. Eng. 2011, 42, 138–157. [Google Scholar] [CrossRef]
- Cervantes, F.; van der Zee, F.; Lettinga, G.; Field, J. Enhanced decolorisation of Acid Orange 7 in a continuous UASB reactor with quinones as redox mediators. Water Sci. Technol. A J. Int. Assoc. Water Pollut. Res. 2001, 44, 123–128. [Google Scholar] [CrossRef]
- Asif, M.B.; Ren, B.; Li, C.; Maqbool, T.; Zhang, X.; Zhang, Z. Powdered activated carbon—Membrane bioreactor (PAC-MBR): Impacts of high PAC concentration on micropollutant removal and microbial communities. Sci. Total Environ. 2020, 745, 1–9. [Google Scholar] [CrossRef]
- Mielgo, I.; Moreira, M.T.; Feijoo, G.; Lema, J.M. A packed-bed fungal bioreactor for the continuous decolourisation of azo-dyes (Orange II). J. Biotechnol. 2001, 89, 99–106. [Google Scholar] [CrossRef]
- Mezohegyi, G.; Bengoa, C.; Stuber, F.; Font, J.; Fabregat, A.; Fortuny, A. Novel bioreactor design for decolourisation of azo dye effluents. Chem. Eng. J. 2008, 143, 293–298. [Google Scholar] [CrossRef]
- Ong, S.-A.; Toorisaka, E.; Hirata, M.; Hano, T. Treatment of azo dye Orange II in aerobic and anaerobic-SBR systems. Process Biochem. 2005, 40, 2907–2914. [Google Scholar] [CrossRef]
- Brás, R.; Gomes, A.; Ferra, M.I.A.; Pinheiro, H.M.; Gonçalves, I.C. Monoazo and diazo dye decolourisation studies in a methanogenic UASB reactor. J. Biotechnol. 2005, 115, 57–66. [Google Scholar] [CrossRef] [Green Version]
- Spagni, A.; Casu, S.; Grilli, S. Decolourisation of textile wastewater in a submerged anaerobic membrane bioreactor. Bioresour. Technol. 2012, 117, 180–185. [Google Scholar] [CrossRef] [PubMed]
- Chang, S.; Waite, T.D.; Ong, P.E.A.; Schaefer, A. Assessment of Trace Estrogenic Contaminants Removal by Coagulant Addition, Powdered Activated Carbon Adsorption and Powdered Activated Carbon/Microfiltration Processes. J. Environ. Eng. 2004, 130, 736–742. [Google Scholar] [CrossRef] [Green Version]
- García-Martínez, Y.; Bengoa, C.; Stüber, F.; Fortuny, A.; Font, J.; Fabregat, A. Biodegradation of acid orange 7 in an anaerobic–aerobic sequential treatment system. Chem. Eng. Process. Process Intensif. 2015, 94, 99–104. [Google Scholar] [CrossRef]
- Sazali, N.; Salleh, W.N.W.; Nordin, N.A.H.M.; Ismail, A.F. Matrimid-based carbon tubular membrane: Effect of carbonization environment. J. Ind. Eng. Chem. 2015, 32, 167–171. [Google Scholar] [CrossRef]
- Fuertes, A.B.; Nevskaia, D.M.; Centeno, T.A. Carbon composite membranes from Matrimid® and Kapton® polyimides for gas separation. Microporous Mesoporous Mater. 1999, 33, 115–125. [Google Scholar] [CrossRef]
- Kiyono, M.; Williams, P.J.; Koros, W.J. Effect of pyrolysis atmosphere on separation performance of carbon molecular sieve membranes. J. Membr. Sci. 2010, 359, 2–10. [Google Scholar] [CrossRef]
- Horcas, I.; Fernández, R.; Gómez-Rodríguez, J.M.; Colchero, J.; Gómez-Herrero, J.; Baro, A.M. WSXM: A software for scanning probe microscopy and a tool for nanotechnology. Rev. Sci. Instrum. 2007, 78, 1–9. [Google Scholar] [CrossRef]
- NorgenBiotek. Soil DNA Isolation Kit. Available online: https://norgenbiotek.com/sites/default/files/resources/Soil-DNA-Isolation-Plus-Kit-Insert-PI64000-1.pdf (accessed on 25 February 2021).
- Lourenço, N.D.; Novais, J.M.; Pinheiro, H.M. Effect of some operational parameters on textile dye biodegradation in a sequential batch reactor. J. Biotechnol. 2001, 89, 163–174. [Google Scholar] [CrossRef]
- El Bouraie, M.; El Din, W.S. Biodegradation of Reactive Black 5 by Aeromonas hydrophila strain isolated from dye-contaminated textile wastewater. Sustain. Environ. Res. 2016, 26, 209–216. [Google Scholar] [CrossRef] [Green Version]
- Ismail, N.H.; Salleh, W.N.W.; Sazali, N.; Ismail, A.F. Effect of intermediate layer on gas separation performance of disk supported carbon membrane. Sep. Sci. Technol. 2017, 52, 2137–2149. [Google Scholar] [CrossRef]
- Barsema, J.N.; Klijnstra, S.D.; Balster, J.H.; van der Vegt, N.F.A.; Koops, G.H.; Wessling, M. Intermediate polymer to carbon gas separation membranes based on Matrimid PI. J. Membr. Sci. 2004, 238, 93–102. [Google Scholar] [CrossRef]
- Boussu, K.; Van der Bruggen, B.; Volodin, A.; Snauwaert, J.; Van Haesendonck, C.; Vandecasteele, C. Roughness and hydrophobicity studies of nanofiltration membranes using different modes of AFM. J. Colloid Interface Sci. 2005, 286, 632–638. [Google Scholar] [CrossRef]
- Shimp, R.J.; Pfaender, F.K. Effects of surface area and flow rate on marine bacterial growth in activated carbon columns. Appl. Environ. Microbiol. 1982, 44, 471–477. [Google Scholar] [CrossRef] [Green Version]
- Maximous, N.; Nakhla, G.; Wan, W.; Wong, K. Preparation, characterization and performance of Al2O3/PES membrane for wastewater filtration. J. Membr. Sci. 2009, 341, 67–75. [Google Scholar] [CrossRef]
- Abid, M.F.; Zablouk, M.A.; Abid-Alameer, A.M. Experimental study of dye removal from industrial wastewater by membrane technologies of reverse osmosis and nanofiltration. Iran. J. Environ. Health Sci. Eng. 2012, 9, 1–9. [Google Scholar] [CrossRef] [PubMed] [Green Version]
- Méndez-Paz, D.; Omil, F.; Lema, J.M. Anaerobic treatment of azo dye Acid Orange 7 under batch conditions. Enzym. Microb. Technol. 2005, 36, 264–272. [Google Scholar] [CrossRef]
- Mezohegyi, G.; van der Zee, F.P.; Font, J.; Fortuny, A.; Fabregat, A. Towards advanced aqueous dye removal processes: A short review on the versatile role of activated carbon. J. Environ. Manag. 2012, 102, 148–164. [Google Scholar] [CrossRef] [PubMed]
- Manu, B.; Chaudhari, S. Anaerobic decolorisation of simulated textile wastewater containing azo dyes. Bioresour. Technol. 2002, 82, 225–231. [Google Scholar] [CrossRef]
- Brás, R.; Isabel, A.; Ferra, M.; Pinheiro, H.M.; Gonçalves, I.C. Batch tests for assessing decolourisation of azo dyes by methanogenic and mixed cultures. J. Biotechnol. 2001, 89, 155–162. [Google Scholar] [CrossRef]
- Evangelista-Barreto, N.S.; Albuquerque, C.D.; Vieira, R.H.S.F.; Campos-Takaki, G.M. Cometabolic Decolorization of the Reactive Azo Dye Orange II by Geobacillus stearothermophilus UCP 986. Text. Res. J. 2009, 79, 1266–1273. [Google Scholar] [CrossRef]
- Bragger, J.L.; Lloyd, A.W.; Soozandehfar, S.H.; Bloomfield, S.F.; Marriott, C.; Martin, G.P. Investigations into the azo reducing activity of a common colonic microorganism. Int. J. Pharm. 1997, 157, 61–71. [Google Scholar] [CrossRef]
- Zuorro, A.; Lavecchia, R.; Monaco, M.M.; Iervolino, G.; Vaiano, V. Photocatalytic Degradation of Azo Dye Reactive Violet 5 on Fe-Doped Titania Catalysts under Visible Light Irradiation. Catalysts 2019, 9, 645. [Google Scholar] [CrossRef] [Green Version]
- Tan, X.; Rodrigue, D. A Review on Porous Polymeric Membrane Preparation. Part II: Production Techniques with Polyethylene, Polydimethylsiloxane, Polypropylene, Polyimide, and Polytetrafluoroethylene. Polymers 2019, 11, 1310. [Google Scholar] [CrossRef] [PubMed] [Green Version]
- Rahimi, M.; Aghel, B.; Sadeghi, M.; Ahmadi, M. Using Y-shaped microreactor for continuous decolorization of an Azo dye. Desalination Water Treat. 2014, 52, 5513–5519. [Google Scholar] [CrossRef]
- Meitiniarti, I.; Soetarto, E.S.; Sugiharto, E.; Timotius, K. Optimum concentration of glucose and Orange II for growth and decolorization of Orange II by Enterococcus faecalis ID6017 under static culture. Microb. Indones. 2008, 2, 73–78. [Google Scholar]
- Ding, J.; Zhang, Y.; Quan, X.; Chen, S. Anaerobic biodecolorization of AO7 by a newly isolated Fe(III)-reducing bacterium Sphingomonas strain DJ. J. Chem. Technol. Biotechnol. 2015, 90, 158–165. [Google Scholar] [CrossRef]
- Chen, B.-Y.; Chen, S.-Y.; Chang, J.-S. Immobilized cell fixed-bed bioreactor for wastewater decolorization. Process Biochem. 2005, 40, 3434–3440. [Google Scholar] [CrossRef]
- Popli, S.; Patel, U.D. Destruction of azo dyes by anaerobic–aerobic sequential biological treatment: A review. Int. J. Environ. Sci. Technol. 2015, 12, 405–420. [Google Scholar] [CrossRef] [Green Version]
- Mutambanengwe, C.C.Z.; Togo, C.A.; Whiteley, C.G. Decolorization and Degradation of Textile Dyes with Biosulfidogenic Hydrogenases. Biotechnol. Prog. 2007, 23, 1095–1100. [Google Scholar] [CrossRef]
- Kiriakidou, F.; Kondarides, D.I.; Verykios, X.E. The effect of operational parameters and TiO2-doping on the photocatalytic degradation of azo-dyes. Catal. Today 1999, 54, 119–130. [Google Scholar] [CrossRef]
- Chen, B.-Y. Understanding decolorization characteristics of reactive azo dyes by Pseudomonas luteola: Toxicity and kinetics. Process Biochem. 2002, 38, 437–446. [Google Scholar] [CrossRef]
- Khan, R.; Bhawana, P.; Fulekar, M.H. Microbial decolorization and degradation of synthetic dyes: A review. Rev. Environ. Sci. Bio Technol. 2013, 12, 75–97. [Google Scholar] [CrossRef]
- Solís, M.; Solís, A.; Pérez, H.I.; Manjarrez, N.; Flores, M. Microbial decolouration of azo dyes: A review. Process Biochem. 2012, 47, 1723–1748. [Google Scholar] [CrossRef]
- Chen, K.-C.; Wu, J.-Y.; Liou, D.-J.; Hwang, S.-C.J. Decolorization of the textile dyes by newly isolated bacterial strains. J. Biotechnol. 2003, 101, 57–68. [Google Scholar] [CrossRef]
- Franciscon, E.; Zille, A.; Fantinatti-Garboggini, F.; Silva, I.S.; Cavaco-Paulo, A.; Durrant, L.R. Microaerophilic–aerobic sequential decolourization/biodegradation of textile azo dyes by a facultative Klebsiella sp. strain VN-31. Process Biochem. 2009, 44, 446–452. [Google Scholar] [CrossRef] [Green Version]
- Garcia-Segura, S.; Centellas, F.; Arias, C.; Garrido, J.A.; Rodríguez, R.M.; Cabot, P.L.; Brillas, E. Comparative decolorization of monoazo, diazo and triazo dyes by electro-Fenton process. Electrochim. Acta 2011, 58, 303–311. [Google Scholar] [CrossRef]
- Chen, Y.; Zhang, L.; Feng, L.; Chen, G.; Wang, Y.; Zhai, Z.; Zhang, Q. Exploration of the key functional strains from an azo dye degradation microbial community by DGGE and high-throughput sequencing technology. Environ. Sci. Pollut. Res. 2019, 26, 24658–24671. [Google Scholar] [CrossRef]
- Köchling, T.; Ferraz, A.D.N.; Florencio, L.; Kato, M.T.; Gavazza, S. 454-Pyrosequencing analysis of highly adapted azo dye-degrading microbial communities in a two-stage anaerobic–aerobic bioreactor treating textile effluent. Environ. Technol. 2017, 38, 687–693. [Google Scholar] [CrossRef]
- Cui, D.; Zhang, H.; He, R.; Zhao, M. The Comparative Study on the Rapid Decolorization of Azo, Anthraquinone and Triphenylmethane Dyes by Anaerobic Sludge. Int. J. Environ. Res. Public Health 2016, 13, 1053. [Google Scholar] [CrossRef] [PubMed]
- Balapure, K.H.; Jain, K.; Chattaraj, S.; Bhatt, N.S.; Madamwar, D. Co-metabolic degradation of diazo dye—Reactive blue 160 by enriched mixed cultures BDN. J. Hazard. Mater. 2014, 279, 85–95. [Google Scholar] [CrossRef] [PubMed]
- Zhang, L.; Sun, Y.; Guo, D.; Wu, Z.; Jiang, D. Molecular diversity of bacterial community of dye wastewater in an anaerobic sequencing batch reactor. Afr. J. Microbiol. Res. 2012, 6, 6444–6453. [Google Scholar] [CrossRef]
- Yoo, E.; Libra, J.; Adrian, L. Mechanism of Dye Reduction of Azo Dyes in Anaerobic Mixed Culture. J. Environ. Eng. 2001, 127, 844–849. [Google Scholar] [CrossRef]
- Fernando, E.; Keshavarz, T.; Kyazze, G. Simultaneous co-metabolic decolourisation of azo dye mixtures and bio-electricity generation under thermophillic (50 °C) and saline conditions by an adapted anaerobic mixed culture in microbial fuel cells. Bioresour. Technol. 2013, 127, 1–8. [Google Scholar] [CrossRef] [PubMed]
- Prigione, V.; Grosso, I.; Tigini, V.; Anastasi, A.; Varese, G.C. Fungal Waste-Biomasses as Potential Low-Cost Biosorbents for Decolorization of Textile Wastewaters. Water 2012, 4, 770–784. [Google Scholar] [CrossRef] [Green Version]
Figure 1.
Ceramic supported carbon membrane bioreactor experimental set-up.

Figure 2.
Scanning electron micrographs on the surface of (a,b) Ceramic support(CS) and 10% wt. CSCM, and (c,d) the cross section of CS and 10% wt. CSCM.
Figure 2.
Scanning electron micrographs on the surface of (a,b) Ceramic support(CS) and 10% wt. CSCM, and (c,d) the cross section of CS and 10% wt. CSCM.

Figure 3.
Atomic force microscopy images of CSCM (a) 3D topography, (b) roughness profile, and (c) current distribution.
Figure 3.
Atomic force microscopy images of CSCM (a) 3D topography, (b) roughness profile, and (c) current distribution.

Figure 4.
Variation of (a) pure water flux and (b) resistance of CS and CSCM at 25 °C. Overall resistance is displayed as a bar chart, and the line graph illustrates the resistance of the coated carbon layer. PWP in L·m−2·h−1·bar−1.
Figure 4.
Variation of (a) pure water flux and (b) resistance of CS and CSCM at 25 °C. Overall resistance is displayed as a bar chart, and the line graph illustrates the resistance of the coated carbon layer. PWP in L·m−2·h−1·bar−1.

Figure 5.
AO7 disappearance in CS and CSCM reactors; CS and CSCM bioreactor; Flux = 0.05 L·m−2·h−1, [AO7] = 50 mg·L−1 and T = 37 °C. CSCM: 2% precursor.
Figure 5.
AO7 disappearance in CS and CSCM reactors; CS and CSCM bioreactor; Flux = 0.05 L·m−2·h−1, [AO7] = 50 mg·L−1 and T = 37 °C. CSCM: 2% precursor.

Figure 6.
Influence of precursor concentration on anaerobic bioreduction of AO7; Flux = 0.05 L·m−2·h−1, [AO7] = 50 mg·L−1 and T = 37 °C.
Figure 6.
Influence of precursor concentration on anaerobic bioreduction of AO7; Flux = 0.05 L·m−2·h−1, [AO7] = 50 mg·L−1 and T = 37 °C.

Figure 7.
Decolorization of AO7 at different permeate flux and feed concentrations. CSCM: 10% precursor.
Figure 7.
Decolorization of AO7 at different permeate flux and feed concentrations. CSCM: 10% precursor.

Figure 8.
Decolorization of AO7, RB5, and DB71 dyes at different concentrations and fluxes; (a) 50 mg·L−1, (b) 75 mg·L−1, and (c) 100 mg·L−1 dye solution at 37 °C. CSCM: 10% precursor.
Figure 8.
Decolorization of AO7, RB5, and DB71 dyes at different concentrations and fluxes; (a) 50 mg·L−1, (b) 75 mg·L−1, and (c) 100 mg·L−1 dye solution at 37 °C. CSCM: 10% precursor.

Figure 9.
Transmission electron microscopy images of biofilm sample after biodegradation.

Figure 10.
Denaturing gradient gel electrophoresis fingerprints of microbial communities of biofilm.
Figure 10.
Denaturing gradient gel electrophoresis fingerprints of microbial communities of biofilm.

Figure 11.
Microbial community in the mixed bacterial culture: (a) bacterial phyla and (b) bacterial genus distribution.
Figure 11.
Microbial community in the mixed bacterial culture: (a) bacterial phyla and (b) bacterial genus distribution.


Table 1.
Structure, composition, and properties of selected azo dyes.
| Azo Dyes | Structure | Type | Solubility in Water |
|---|---|---|---|
| Acid Orange 7 (C16H11N2NaO4S) MW: 350.3 g/L λ max: 484 nm |  | Monoazo CI: 15510 | 116 g·L−1 (35 °C) |
| Reactive Black 5 (C26H21N5Na4O19S6) MW: 991.8 g/L λ max: 587 nm |  | Diazo CI: 20505 | 100 g·L−1 (30 °C) |
| Direct Blue 71 (C40H23N7Na4O13S4) MW: 1029.9 g/L λ max: 585 nm |  | Triazo CI: 34140 | 10 g·L−1 (60 °C) |
Table 2.
Environmental scanning electron microscopy-Energy dispersive X-ray spectrometry analysis; composition (wt.%) of the CS and CSCM.
Table 2.
Environmental scanning electron microscopy-Energy dispersive X-ray spectrometry analysis; composition (wt.%) of the CS and CSCM.
| C | O | Ti | Zr | |
|---|---|---|---|---|
| CS | n.d. | 44.0 | 52.2 | 3.8 |
| CSCM (2% wt. of Matrimid) | 9.8 | 25.9 | 2.6 | 61.7 |
| CSCM (5% wt. of Matrimid) | 34.5 | 19.1 | 1.2 | 45.2 |
| CSCM (10% wt. of Matrimid) | 65.6 | 3.1 | 0.6 | 30.7 |
Publisher’s Note: MDPI stays neutral with regard to jurisdictional claims in published maps and institutional affiliations. |
© 2021 by the authors. Licensee MDPI, Basel, Switzerland. This article is an open access article distributed under the terms and conditions of the Creative Commons Attribution (CC BY) license (https://creativecommons.org/licenses/by/4.0/).
Share and Cite
MDPI and ACS Style
Amin, M.S.A.; Stüber, F.; Giralt, J.; Fortuny, A.; Fabregat, A.; Font, J. Comparative Anaerobic Decolorization of Azo Dyes by Carbon-Based Membrane Bioreactor. Water 2021, 13, 1060. https://doi.org/10.3390/w13081060
AMA Style
Amin MSA, Stüber F, Giralt J, Fortuny A, Fabregat A, Font J. Comparative Anaerobic Decolorization of Azo Dyes by Carbon-Based Membrane Bioreactor. Water. 2021; 13(8):1060. https://doi.org/10.3390/w13081060
Chicago/Turabian StyleAmin, Mohammad Shaiful Alam, Frank Stüber, Jaume Giralt, Agustin Fortuny, Azael Fabregat, and José Font. 2021. "Comparative Anaerobic Decolorization of Azo Dyes by Carbon-Based Membrane Bioreactor" Water 13, no. 8: 1060. https://doi.org/10.3390/w13081060
Note that from the first issue of 2016, this journal uses article numbers instead of page numbers. See further details here.