
Rainfall Threshold for Flash Flood Warning Based on Model Output of Soil Moisture: Case Study Wernersbach, Germany


Department of Hydro Sciences, Institute of Hydrology and Meteorology, Technische Universität Dresden, 01069 Dresden, Germany
*
Author to whom correspondence should be addressed.
Water 2021, 13(8), 1061; https://doi.org/10.3390/w13081061
Submission received: 4 March 2021
/
Revised: 6 April 2021
/
Accepted: 9 April 2021
/
Published: 12 April 2021
(This article belongs to the Section Hydrology)
Abstract
:Convective rainfall can cause dangerous flash floods within less than six hours. Thus, simple approaches are required for issuing quick warnings. The flash flood guidance (FFG) approach pre-calculates rainfall levels (thresholds) potentially causing critical water levels for a specific catchment. Afterwards, only rainfall and soil moisture information are required to issue warnings. This study applied the principle of FFG to the Wernersbach Catchment (Germany) with excellent data coverage using the BROOK90 water budget model. The rainfall thresholds were determined for durations of 1 to 24 h, by running BROOK90 in “inverse” mode, identifying rainfall values for each duration that led to exceedance of critical discharge (fixed value). After calibrating the model based on its runoff, we ran it in hourly mode with four precipitation types and various levels of initial soil moisture for the period 1996–2010. The rainfall threshold curves showed a very high probability of detection (POD) of 91% for the 40 extracted flash flood events in the study period, however, the false alarm rate (FAR) of 56% and the critical success index (CSI) of 42% should be improved in further studies. The proposed adjusted FFG approach has the potential to provide reliable support in flash flood forecasting.
1. Introduction
Flash floods (FF) are considered one of the most dangerous flood types due to their sudden occurrence and potentially severe impacts. The term “flash” reflects the rapid reaction of a drainage network with water levels reaching a critical stage within only minutes to a few (usually less than six) hours after the onset of a heavy rainfall event [1,2,3]. This leaves an extremely short flood warning time which can cause tremendous socio-economic damage [4,5]. Typical consequences of such events include local flooding, soil erosion, debris and destruction of buildings and infrastructure, which are potentially dangerous for human life [6,7]. The majority of flash floods take place in small to medium-sized and often ungauged catchments. In the near future, these events are likely to increase in frequency and intensity with the impact of climate change [8].
Flash flood conditions are usually difficult to model, monitor and forecast [3,9]. Due to the fast rise in discharge and water level, a flood warning based on the evaluation of measured precipitation or stream gauges would be often too late to prevent a serious impact. Instead, the flood or hazard potential must be estimated from meteorological or hydrological forecasts. One commonly used approach for flash flood warning is so-called flash flood guidance (FFG), where flood warnings are issued solely based on pre-event soil moisture conditions and rainfall forecast information. The method uses a simple comparison of accumulated (forecasted) rainfall with critical values of rainfall [1,2]. These rainfall thresholds are estimated once based on catchment characteristics and flood warnings are issued when they are exceeded for the specific rain forecast. The method was originally designed and implemented by the US National Weather Service in the 1970s and has been operated in several countries [2,4,10]. However, a method for deriving rainfall thresholds for early warning of precipitation-related flooding may differ depending on the hypothesis adopted, such as probabilistic or deterministic [11]. De Luca and Versace (2017) discussed in detail various schemes that can be used for rainfall thresholds and suggested careful consideration for selecting a scheme for rainfall threshold estimation to avoid confusion in its use in early warning.
This study used a relatively simple and flexible model that can be later applied to gauged as well as ungauged catchments. BROOK90 delivers soil moisture based on the water balance, indicating the pre-event catchment state in the case of FF. Most recent studies on flash flood warnings based on the FFG approach used only rainfall-runoff models for single events, as flash floods often happen under extremely heavy rainfall events with short durations; hence, only a limited number of events are available [12,13]. Pre-event soil moisture was taken into account in the calibration and validation processes [14,15]. However, the boundary conditions of a catchment for different durations and seasons were neglected. Rainfall thresholds derived from a single-event approach might be unrepresentative and have limitations in statistical analysis. Given that antecedent soil moisture differs, it plays an important role in the runoff generation in a catchment. A storm event is considered irrelevant in a dry period; however, it can cause flooding in a wet period when the soil is already saturated [16,17]. This is why rainfall thresholds need to be determined under several soil moisture conditions.
When long historical records are available, statistical means of precipitation data before the event can be applied for warning thresholds. However, such long-term records are rare, especially in flash flood-prone catchments. An approach based on synthesis hyetographs with different shapes and durations as values of rainfall producing a critical discharge was proposed to overcome the limitation of historical records [12]. This approach requires assumptions regarding both the temporal evolution of the designed rainfall and pre-event catchment conditions. However, the main drawback of these approaches is the use of an event-based model.
Here, we propose an adjusted method of FFG that takes the limitations of previous studies into account and overcomes the associated drawbacks. Instead of considering the pre-wet condition of individual events for flood development, we examine a wide range of soil moisture from dry to wet as an input to run a rainfall-runoff model. The use of synthetic precipitation with different intensities and durations also allows us to evaluate FF cases more holistically and overcome the statistical problem due to the rare occurrence of such an event.The FFG approach was applied to the Wernersbach catchment within the Tharandt Forest as a test case to i) take advantage of the reliable and multifold long-term data available for the catchment, and ii) investigate the potential use of the BROOK90 model as a tool for FFG.
2. Materials and Methods
2.1. Catchment Characteristics
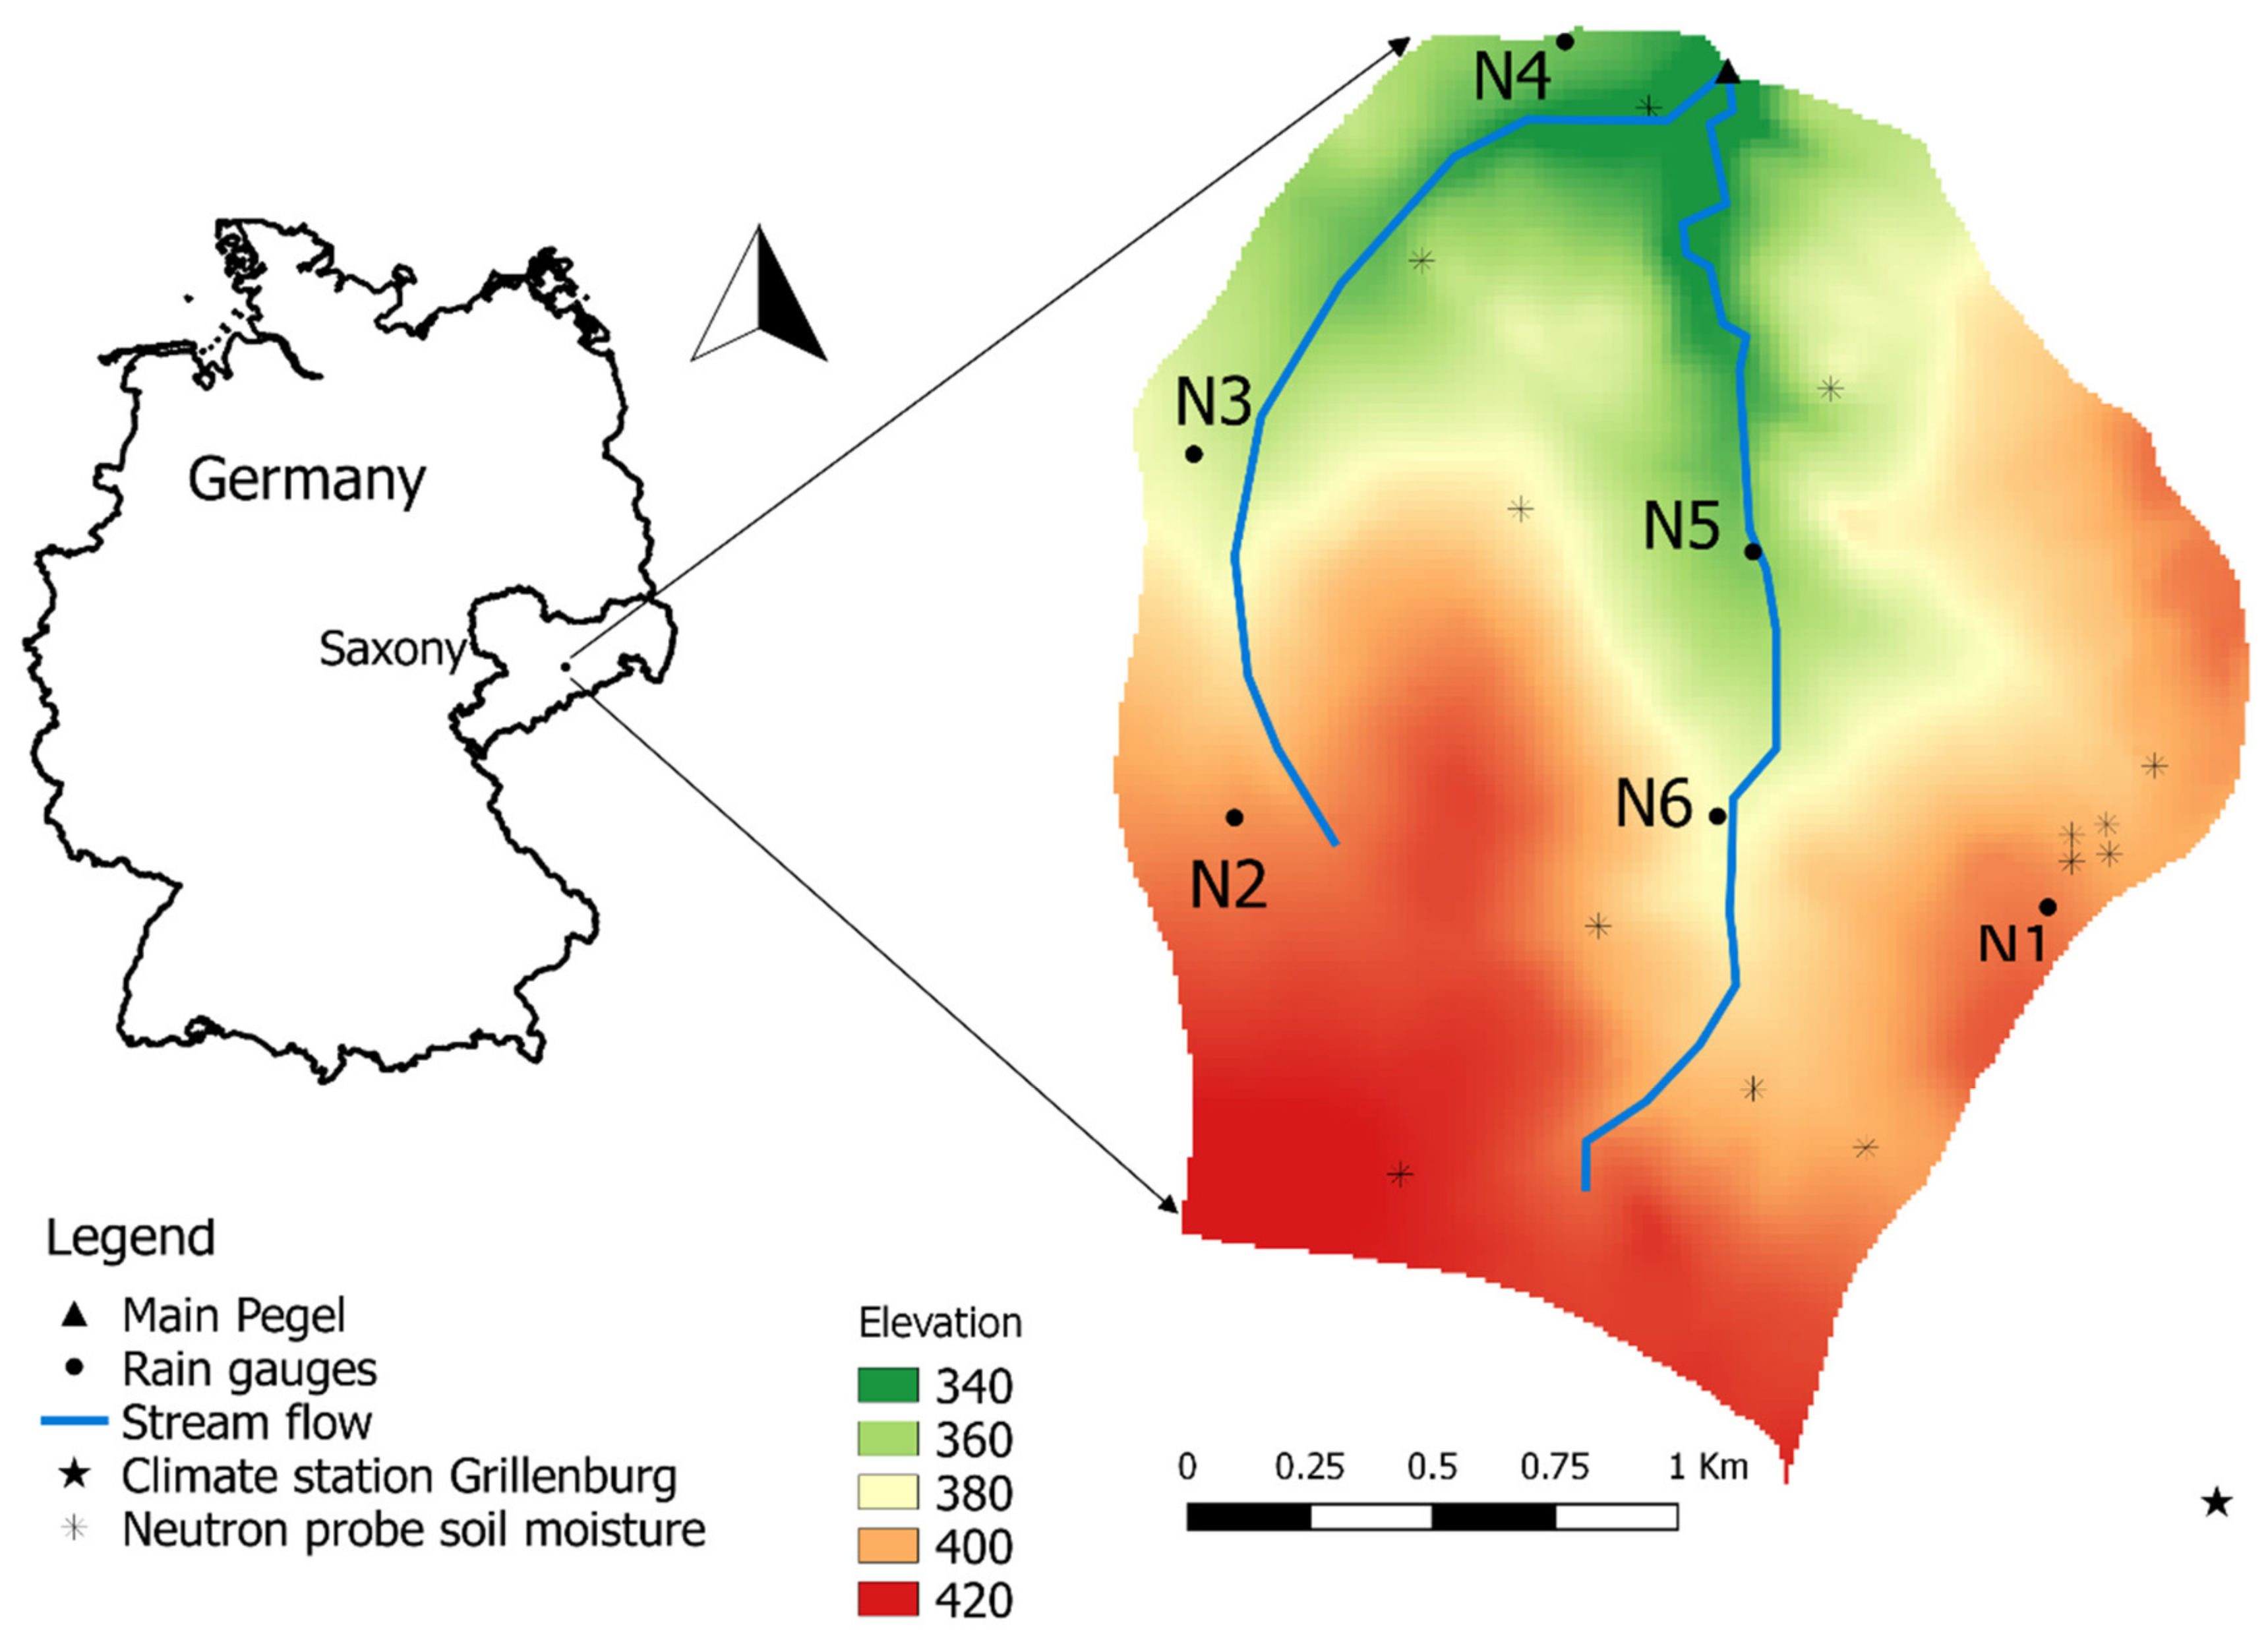
The study area is a small forested catchment of 4.6 km2 in Tharandt Forest south of Dresden in eastern Germany (Figure 1), which has been part of many studies [18,19]. The slope is relatively flat with an average grade of 3% and an elevation ranging from 322 to 424 m.a.s.l. The catchment is dominantly covered with coniferous (spruce) trees (>80%) and contains soil dominated by loamy silt, Dystric Cambisols, Podsols and Stagosols [20]. A more detailed presentation of the geologic and land use characteristics is provided in [21]. This catchment was selected due to (a) well-monitored experimental catchment with long term hydrological and meteorological data records (more than 50 years), (b) reference measurements to derive vegetation parameters, and (c) numerous studies and expert knowledge are available.
Floods occur mostly in summer partly caused by very intense rainfall. For instance, the extreme flood event in 2002 with a total daily sum of 312 mm between August 12th and 13th measured at Zinnwald-Georgenfeld set a new record in Germany [22]. The maximum discharge during this event was 10 m3/s, 280 times greater than the mean runoff. Soils in the catchment are able to store a large amount of rain water before surface flow starts occurring [23,24].
2.2. Data Sets and Model
2.2.1. Data Sets
Long-term measurements are used in this study, based on the monitoring of this research and education catchment of TU Dresden (Chair of Meteorology). Meteorological variables with daily resolution (precipitation, Tmin, Tmax, solar radiation, vapor pressure and wind speed) are available since end of 1967. Soil, land use and site parameters are adapted from the literature [21,23,25] to run BROOK90. For deriving soil moisture state, the above-mentioned climate variable data from 1970 to 2016 are used. Rainfall data are averaged over six rain gauges spatially distributed within the catchment from 350 m a.s.l. (N4) to 420 m a.s.l. (N2) as shown in Figure 1. The average annual rainfall amount varies from 605 mm (2003) to 1287 mm (2010) with an average of 930 mm. Most of the precipitation occurs during the summer months especially in July (101 mm) and August (103 mm).
The discharge records used in this study are for discharge at the catchment outlet. Discharge is calculated by empirical equations for two stage-discharge relationships, one for low base flow with water stages lower than 331 mm and one for high base flow with water stages higher than 331 mm. The parameters of the empirical curves are validated twice a year with flow measurement devices. During the extreme flood events in 1980 and 2002, discharge data are derived from interpolated data from surrounding states since the gauge weir was overtopped.
2.2.2. Short Model Description
The BROOK90 model is a lumped-parameter water budget model designed for small, uniform catchments. It produces a good representation of evapotranspiration (ET) and soil moisture by applying the well-known Penman–Monteith equation twice: once for the canopy and once for the soil surface [26]. To describe soil movement, the model applies Richard’s equation and near-saturation interpolation of the scheme of Clapp and Hornberger, (1978) [27]. The model requires daily data for precipitation, Tmin, Tmax, solar radiation, vapor pressure and wind speed. However, it can also be operated with reduced daily inputs of precipitation and min/max temperature, while other input values are generated by the model. Thus, it is widely applied to estimate water fluxes at the soil plant atmosphere interface on a daily basis [21,23,28]. Nevertheless, the input of precipitation at higher temporal resolutions, such as hourly resolution, is possible, potentially improving the representation of fast components of the water budget, such as interception or interflow. A detailed chart can be found in [26].
Discharge is generated with different flow paths, such as vertical bypass, seepage, surface flow and lateral subsurface flow. Most of the flow parameters are empirical and are set according to the general understanding of the modeler. However, the model cannot accommodate lateral transfer of water downstream. The lack of a routing mode limits the application to catchments, in which flow is generated locally. To address some heterogeneity in larger catchments (up to 100 km2), we allow the model to run for various combinations of land use and soil characteristics. The catchment response is then derived from the superpositioning of individual runs weighted according to their spatial contribution to the catchment area. This allows the introduction of a kind of hydrological response unit (HRU) but contributes additional uncertainty.
While the BROOK90 model is not recommended for direct flood modelling, we apply it for the partitioning of precipitation into ET, storage change and discharge. The simulated discharge is merely used as an indicator to evaluate the critical flooding stage as outlined below.
2.3. Flash Flood Guidance Setup
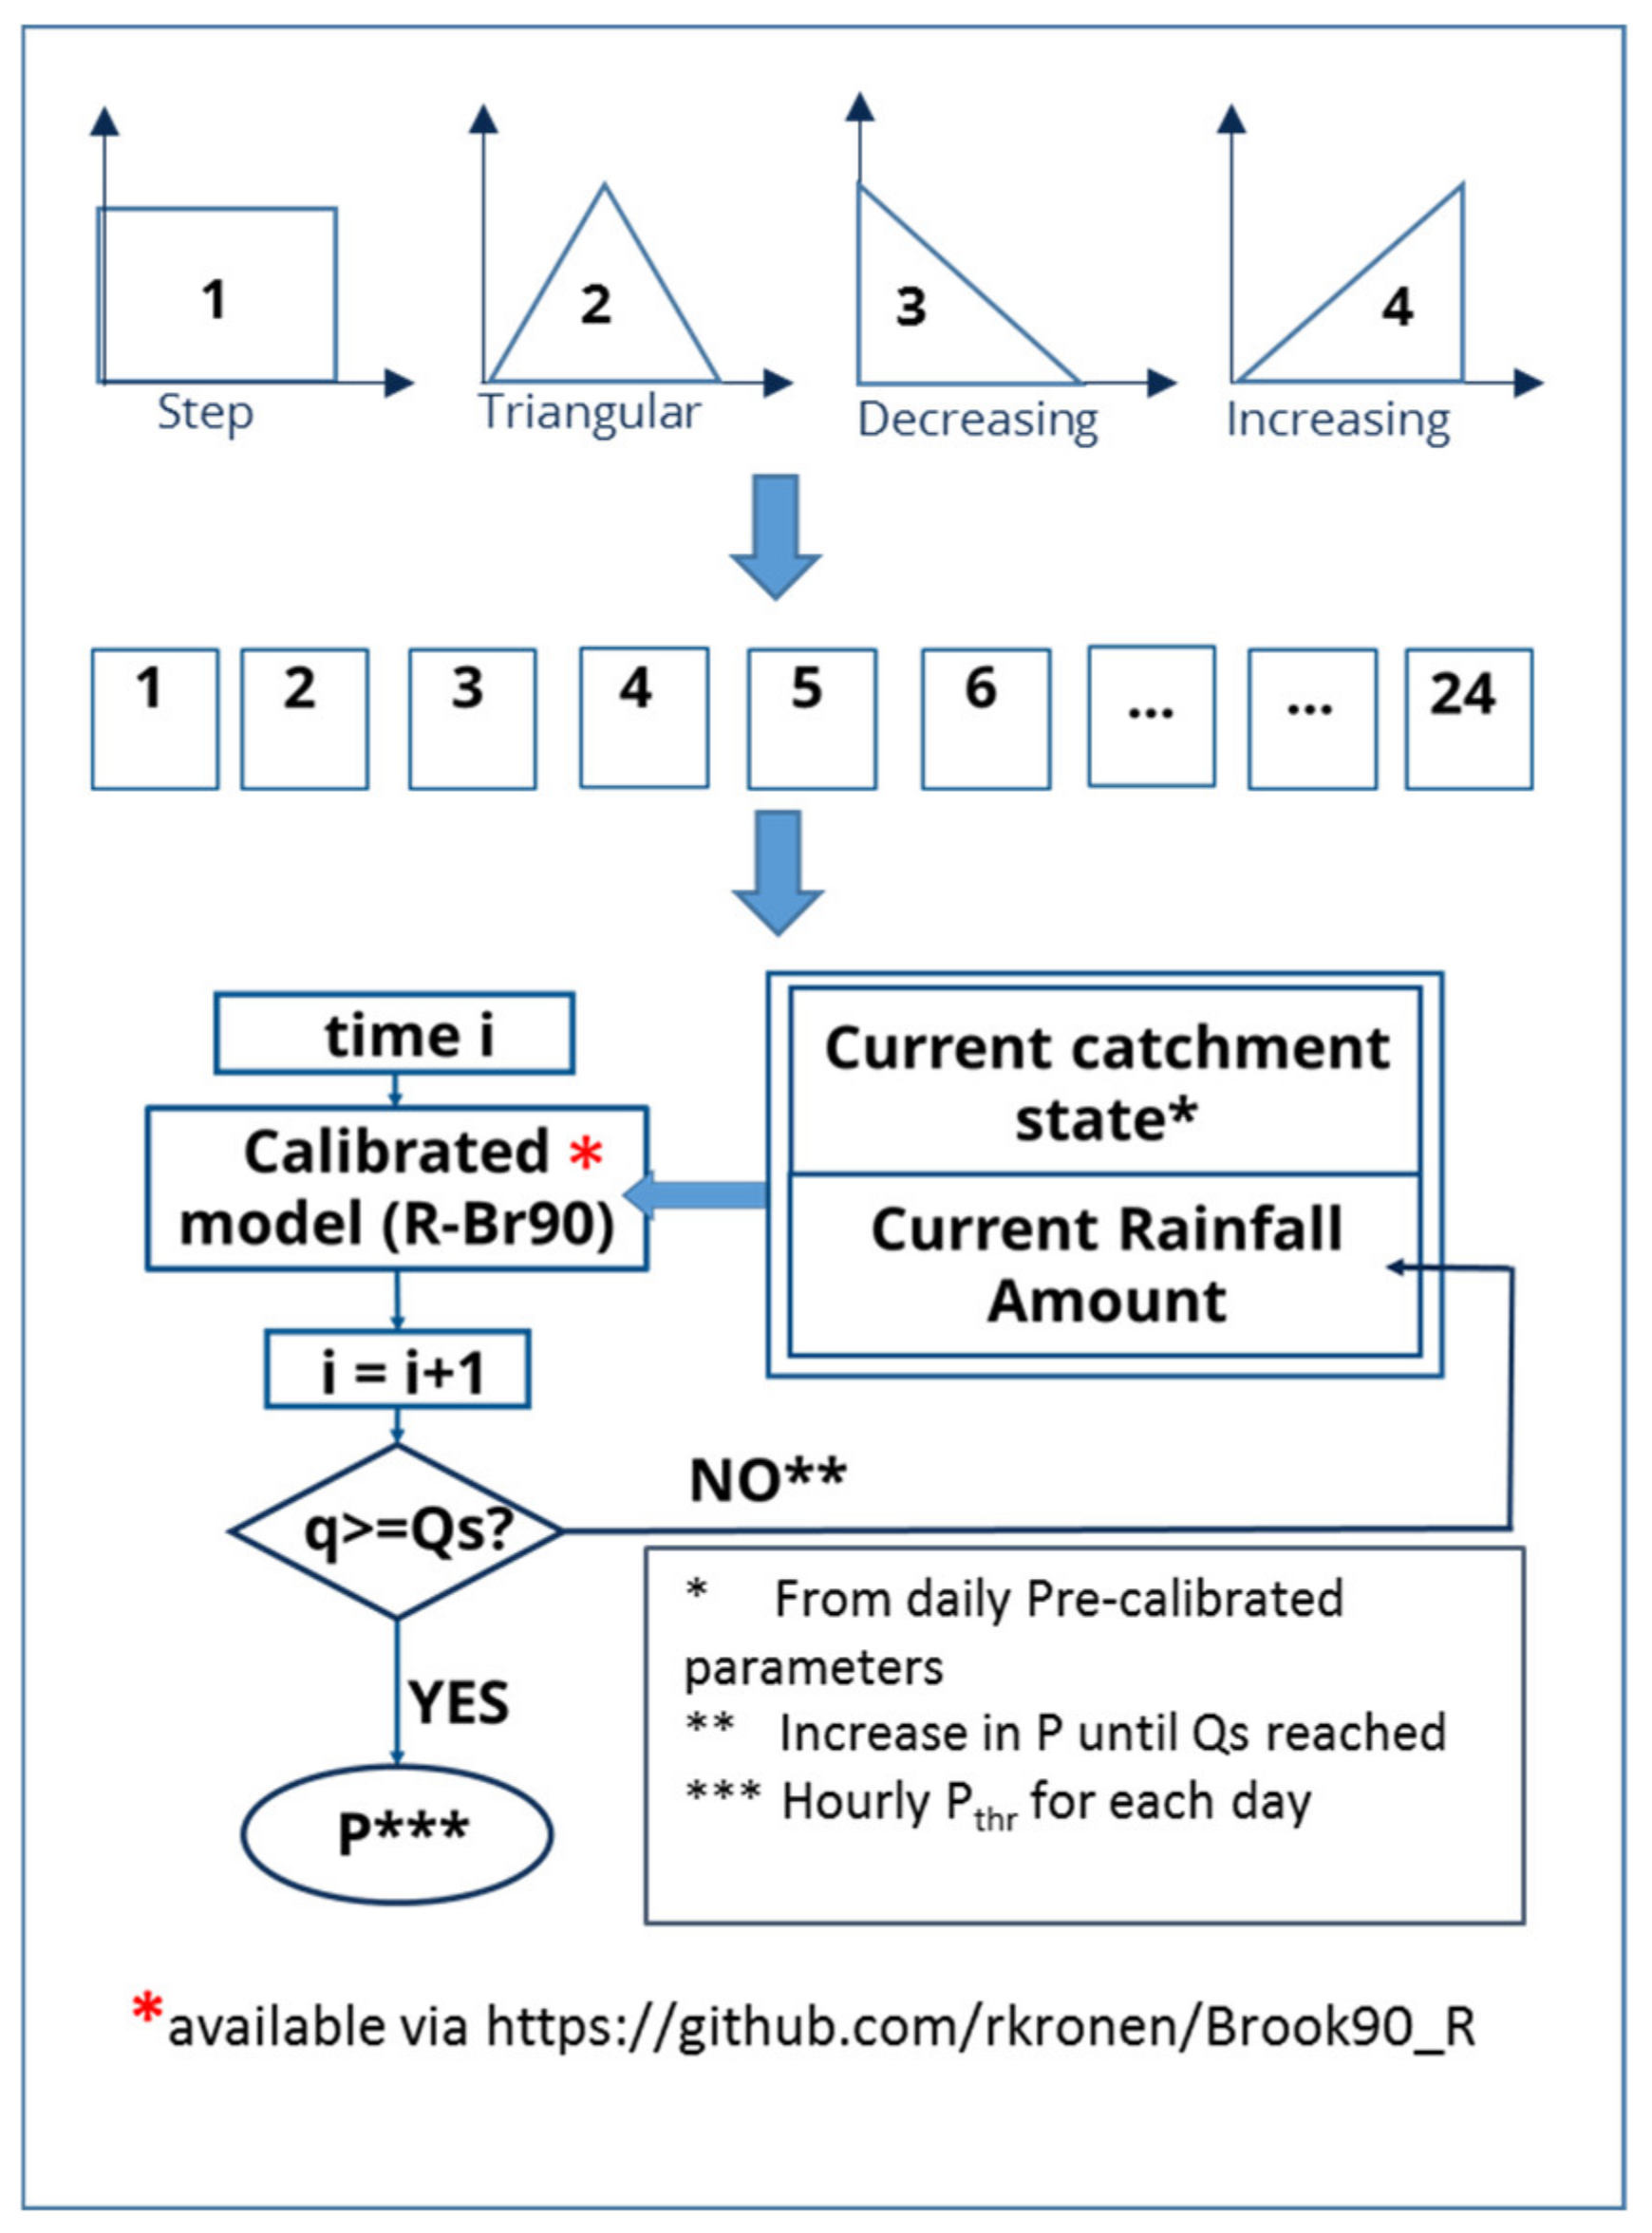
FFG is an effective flood warning system for small or medium-sized mountainous catchments with the potential danger of intense and destructive flooding with a short warning time. It does not intend to predict the timing of flooding, but tries to identify potential flood occurrence. The method compares rainfall forecasts with so-called rainfall thresholds for different antecedent soil moisture conditions (AMCs). Rainfall thresholds are rainfall intensities that lead to critical discharge in the catchment. A flood warning is issued if the corresponding thresholds are exceeded. Rainfall thresholds are derived with the following three steps as described in Figure 2.
Step 1: Estimation and classification of antecedent soil moisture
Following [16,29,30], the soil moisture in the catchment is grouped into values corresponding to “wet”, “moderately saturated”, or “dry” conditions to account for different AMCs. For this process, the BROOK90 hydrological model was used to simulate the catchment’s water balance from 1970 to 2016, identifying the daily moisture conditions. The model performs well under different data input conditions, and detailed model setup and performance validation are described in [24].
The 0.33 and 0.66 percentiles are derived from the historical soil moisture value distribution to categorize the three aforementioned classes. Each class, namely, AMC I (dry soil), AMC II (moderately saturated soil), and AMC III (wet soil), is defined as the wetness condition at the beginning of a rain event. This step is referred to as the current catchment state in Figure 2.
Step 2: Runoff threshold identification
Runoff is considered critical when flooding starts, exceeding the so-called bank-full flow. A method commonly used to identify this value uses a 2-year discharge return interval [10]; other methods derive it from available historical data and hydraulic geometry using, for example, stage-discharge curves of the considered riverbed. In the case of the Wernersbach catchment, statistical values give very small and implausible discharge values, explainable by the small catchment size. Values based on hydraulic geometry are larger, leading to a very small sample size. The critical water stage (Qs) was therefore defined as 50 cm, equivalent to the average high discharge, which is considered representative of flood events in this specific catchment. This value (Qs, in Figure 2) was compared with the simulated discharge (q, in Figure 2) after a model run to identify the rainfall threshold.
Step 3: Rainfall threshold estimation
Identifying critical rainfall values that can potentially cause a flood requires a large sample of different rainfall events and their corresponding runoff to test the physical boundary when the river is full of water under different initial catchment conditions. We increased the sample size by running the BROOK90 model for the summer months from April to September for the study period 1996–2010 with synthetic rainfall inputs and different rainfall intensity distributions, namely, step, triangle, decreasing and increasing (Figure 2). These designed rainfalls are also called hyetotypes [12]. Only summer months were included in the analysis since flash flood events are mainly caused by convective rainfall, which mostly takes place during the summer, particularly in Germany [7]. The study site was parameterized by deriving from available measurements and literature. As mentioned above, the BROOK90 model is primarily based on physical laws. Thus, soil properties (density, grain size distribution, humus content of soil horizons) are combined with site properties (slope, exposure) and meteorological measurements (air temperature, humidity, radiation, wind speed, precipitation) to form explicitly site-specific conditions. The model’s flow parameters, which have no physical meaning, were estimated empirically by the daily discharge measurements using the Parameter ESTimation program [31]. The Nash–Sutcliffe efficiency (NSE) for the calibration period (1970–1990) and the validation period (1991–2016) are 0.61 and 0.82, respectively. For each day with its corresponding original catchment conditions (taken from the water balance calculations in Step 1), rainfall of different durations from 1 to 24 h and different configurations (step, triangular, decreasing and increasing) was fed into the model (Figure 2), taking temporal variations in rain events into account. A maximum of 24 h was chosen since critical discharge in flash flood situations is usually reached sooner than six hours after the rain begins. For each rain configuration and duration, the amount of rainfall was increased until the model output reached or exceeded the critical discharge value within the corresponding duration (when q > Qs). The sample was divided into three pre-event soil moisture conditions (AMCs), and three final curves for each AMC category were established. The R version of the BROOK90 model (freely available at https://github.com/rkronen/Brook90_R (accessed on 25 January 2018) was used for the derivation since it is much more flexible than the original version concerning data input and adaptation of the model to the user’s needs.
2.4. Validation of the Flash Flood Guidance Approach
2.4.1. Flash Flood Events in the Catchment
To validate the FFG approach, rainfall-runoff events with flash flood characteristics must be identified from rain and runoff data, and the FFG approach must be applied to them. Rain is considered one relevant event when rain sequences are separated by a minimum of 3 h of no rain and when the precipitation sum exceeds 20 mm (Psum ≥ 20 mm). We adapted the methodology of Marchi et al., 2010; Tarolli et al., 2012 and Amponsah et al., 2018 [32,33,34,35], considering the hydro-climatic settings and catchment size of our study area. Discharge data were considered to reflect a potential flood event when the critical value was exceeded within the first 48 h after the relevant rain event started. This methodology is similar to that used by [34], where the storm duration was defined for an integrated high-resolution dataset of high-intensity European and Mediterranean flash floods. The identified relevant rainfall-runoff events are then classified into AMC categories according to the soil conditions at the beginning of the rain event (just before the rain started).
A total of 40 summertime events between 1996 and 2010 were extracted from the discharge and precipitation series (Table 1). The total event precipitation ranged between 21 mm and 272.3 mm. The maximum hourly precipitation values (Pmax) ranged from 3 mm to 41 mm.
2.4.2. Application of Flash Flood Guidance
After estimating rainfall thresholds for the individual catchment and soil moisture states, the FFG approach can be applied to rainfall events. Once it starts raining or once rain is forecasted, all rain is accumulated until the rain event is over. Soil moisture at hour “0” (just before the rain starts) is classified as AMC I–III to choose the correct threshold curve. The rain information is updated from the rain forecast.
Examples of selected events from Table 1 are illustrated in Figure 3 to demonstrate how rainfall thresholds and different pre-event soil moisture conditions and rainfall intensities are linked. Depending on the characteristics of an event, the consequences can be very different. In the example of Figure 3a, the rainfall (red curve) does not exceed the rainfall threshold curve (i.e., there were not “enough” rain during this event); hence, no warning would be issued. In Figure 3b the accumulated rainfall exceeds the corresponding AMC III curve, and a warning is issued. Note that in this example, the rain would also exceed the curves if the initial wetness state were different. However, even though accumulated rainfall exceeds the rainfall thresholds in the case of wet and moderate soil moisture states (Figure 3c), no warning is issued as the catchment is dry and can hold more water. The situation shown in Figure 3d would lead to a warning because the accumulated rainfall exceeds the AMC III curve. For a drier catchment (AMC I), no warning would be issued for the same accumulated rainfall.
2.4.3. Validation of FFG
The discharge for both events in Figure 3a–c, in fact, exceeds the critical discharge value in both cases; hence, a warning should have also been issued for the left examples. This shows that the operational mode of the FFG approach requires careful validation. For this validation, the method is tested on the historical events that were previously defined in Table 1. The rainfall information is cumulative, as shown in Figure 3, as if it were forecast information. If a flood warning is issued (the rainfall threshold is exceeded), we count it as a correct alarm (CA, see Table 2). If the rainfall threshold is not exceeded, it is a so-called missing alarm (MA) since the discharge exceeds the critical value. For a complete evaluation, we also evaluated all other rainfall events from the period 1997–2010. A rain event was defined as previously described, and the cumulative value was compared with the rainfall thresholds. If the critical rainfall level was not reached as expected, the event was counted as a correct missing alarm (CMA). The cases in which a warning is issued based on rainfall but without precedent high discharge were classified as false alarms (FAs). Obviously, MAs are potentially dangerous and should be avoided if possible.
However, if we reduce the MA frequency to 0 (which is theoretically possible by setting the rainfall thresholds very low), the FAs will naturally increase to a very high level since a warning will be issued almost every time it rains. This modification would decrease the quality of FFG and would make the approach obsolete and unnecessary. Hence, the quality of prediction can be evaluated by using the hit alarm rate or the probability of detection (POD) and the false alarm rate (FAR) and the critical success index (CSI). The POD is determined by comparing the correctly predicted events with the events actually observed. The FAR establishes a comparison between incorrectly forecast events and all observed events. Adapting the concept of Schaeffer, (1990) [36], CSI presents the ratio of correctly predicted events to the total number of predicted events. The three statistics are defined as follows:
FFG performs well if the forecast system has a POD of 1 and a FAR of 0. Consequently, CSI will obtain a value of 1 as the derivation of POD and FAR. This evaluation method is a comprehensive approach that can cover all potential cases and improves the estimation accuracy of the FFG approach for our study catchment.
3. Results
3.1. Rainfall Thresholds
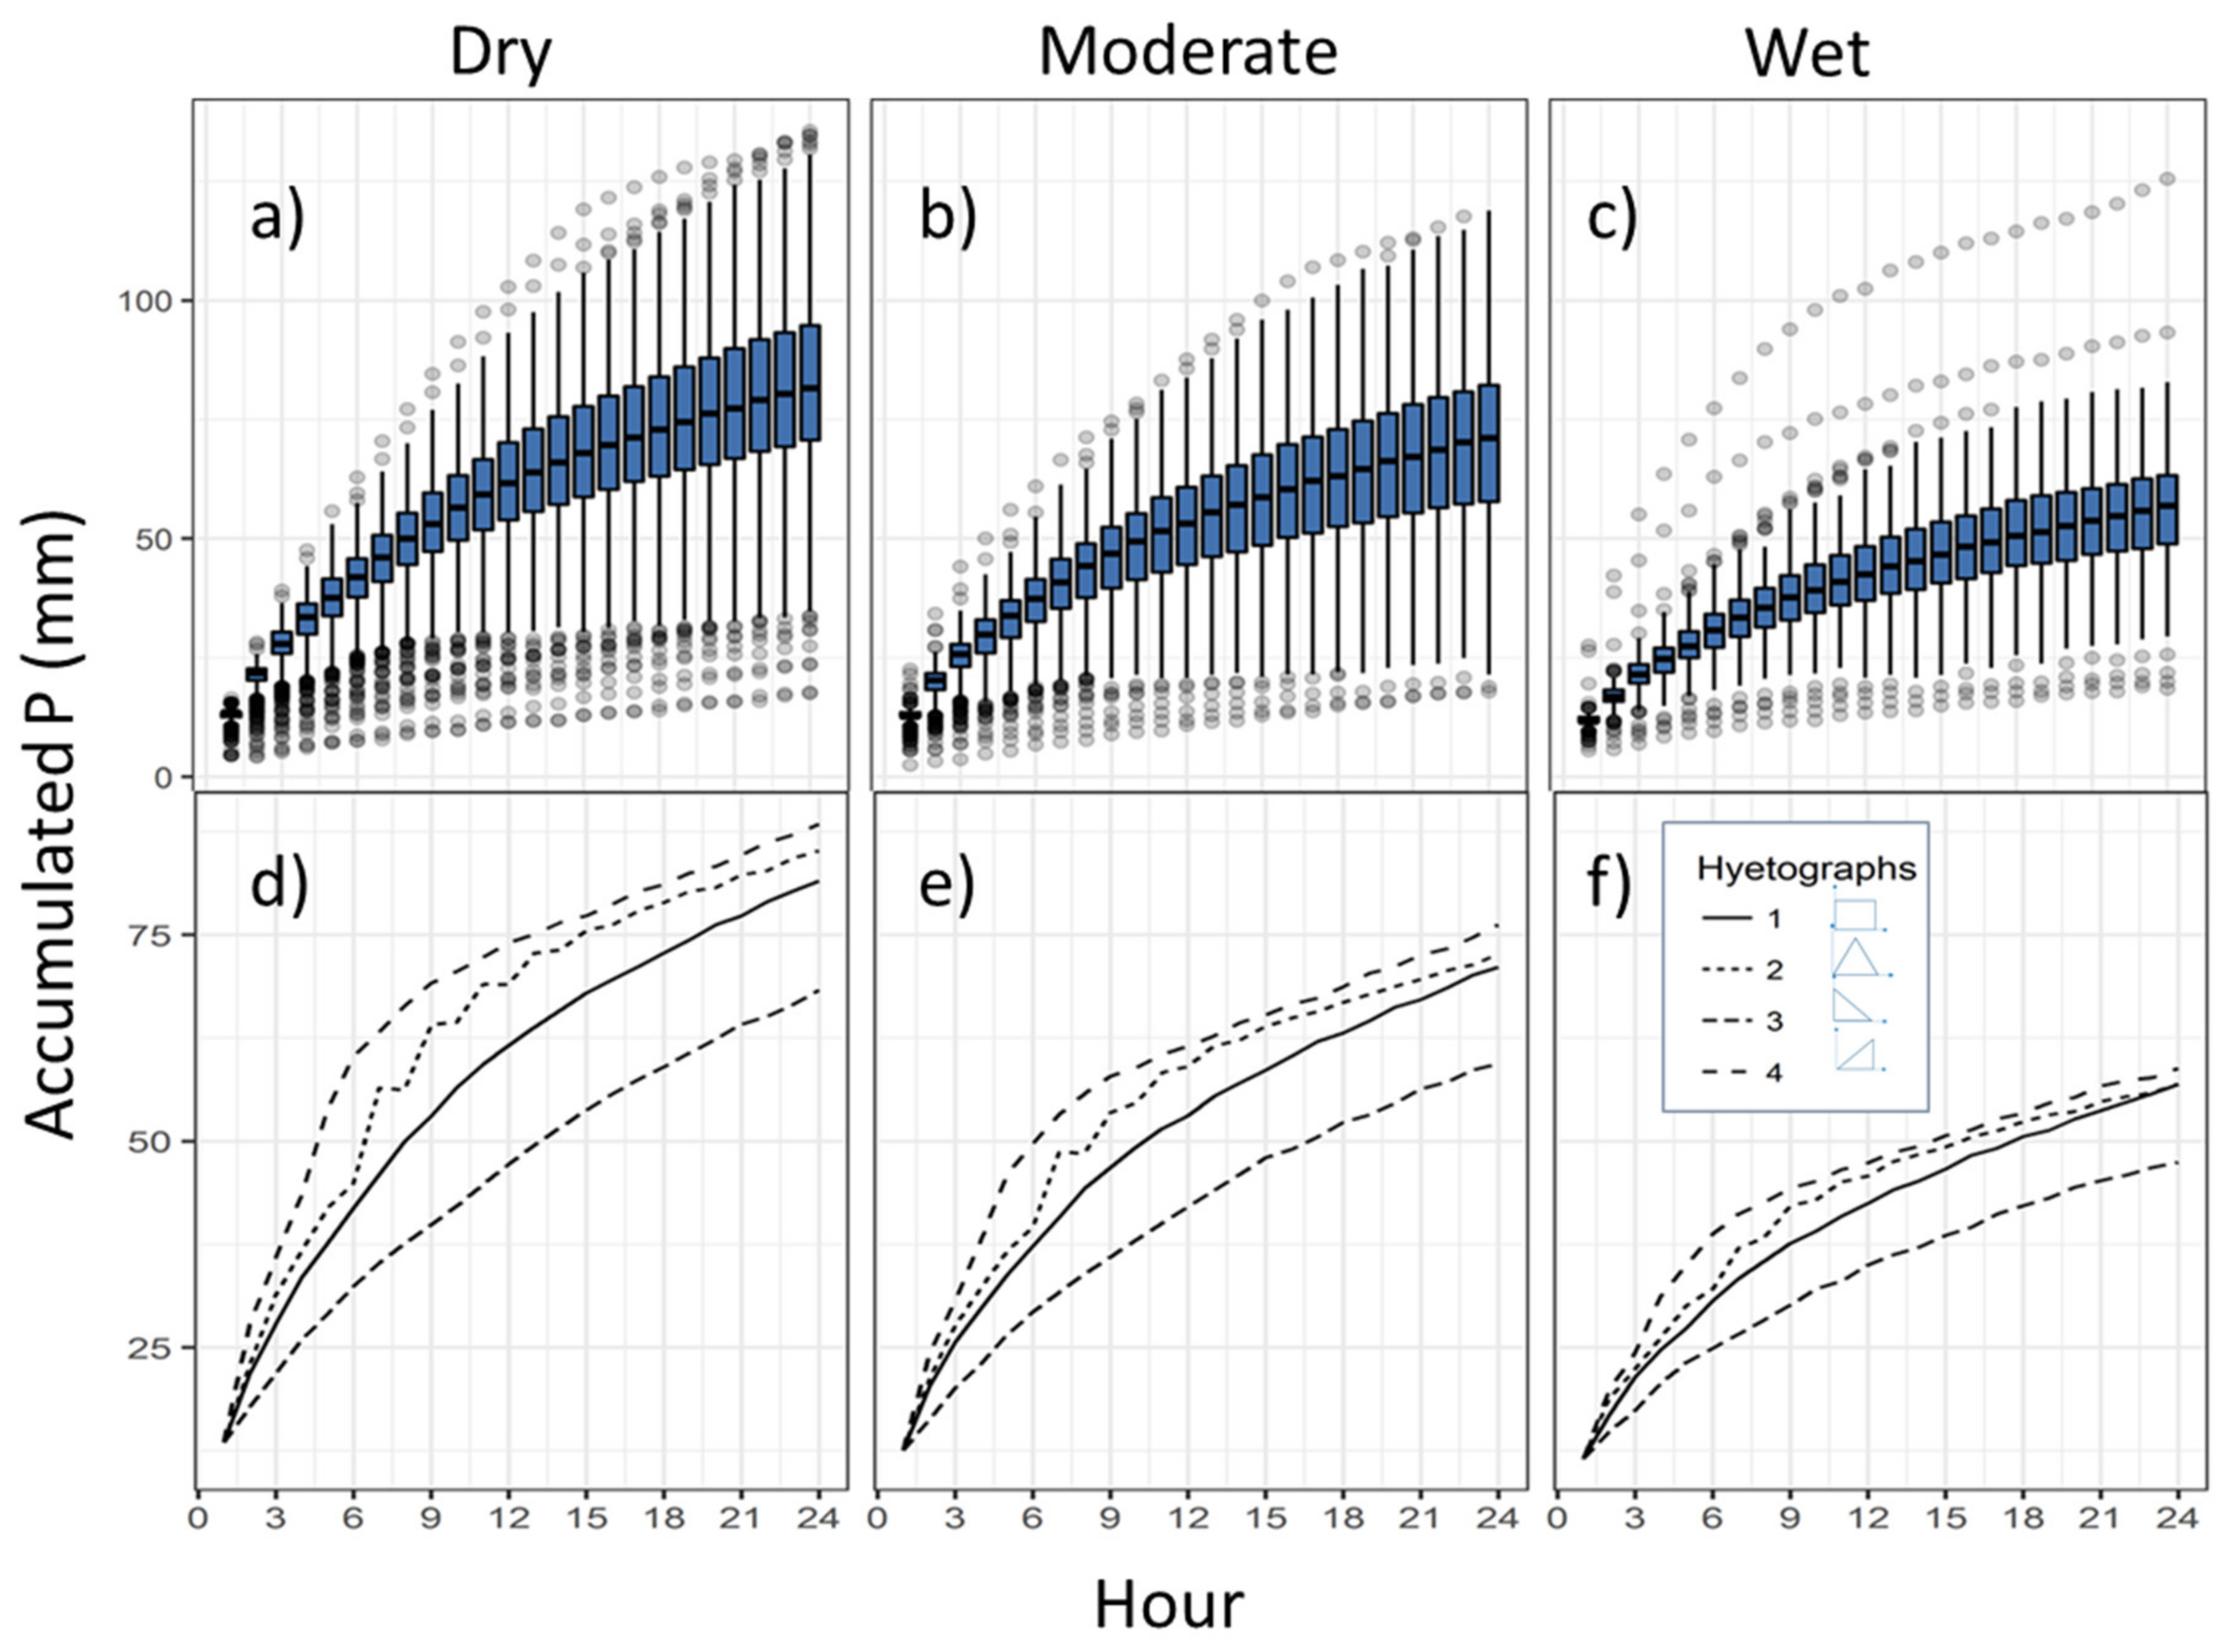
This approach results in more than 241,000 model runs, covering the wide range of pre-event condition states in the catchment, including almost drought to almost saturated conditions, as shown in Figure 4. The high number of the simulations resulted from the combination of 2340 days in the study period with 24 durations and four different rainfall shapes. This process requires a tremendous computation effort as each simulation is involved by “a reverse mode” to detect a rainfall threshold. Each point in Figure 4 displays a rainfall threshold value that caused simulated discharge within its duration to exceed the discharge threshold as defined in step 2 in the guidelines. Figure 4a–c shows a range of rainfall thresholds for durations from 1 to 24 h. At first glance, the amount of rainfall increases exponentially as the event duration increases. For instance, critical rainfall increased for 1 to 24 h of step rainfall in the range of 5–130 mm in the case of dry soil condition. Classifying these values according to AMCs reveals an interesting distribution. Specifically, the higher the pre-event soil moisture is, the smaller the potential rainfall intensity causing potential flooding is. It is also observed that wetter soil has a smaller range between the upper boundary and lower boundary of the rainfall thresholds (Figure 4c).
Under wet conditions, the Wernersbach catchment required only 11.5 to 13.5 mm of precipitation in one hour to reach the flooding stage. On average, dry soil requires more rainfall input to cause critical discharge, regardless of the type of designed rainfall. Furthermore, the rainfall threshold values are also variable and depend on the hyetotypes and antecedent soil moisture. The median values of critical rainfall were extracted as representatives for further evaluation (Figure 4d–f). We see that almost 50 mm is estimated for the difference in rainfall amount in 24 h depending on the hyetotype. Comparing critical rainfall among the hyetotypes, the threshold decreased in the following order: decreasing-triangular-step-increasing. This result is due to the increasing rainfall intensity of the hyetotypes in the same order.
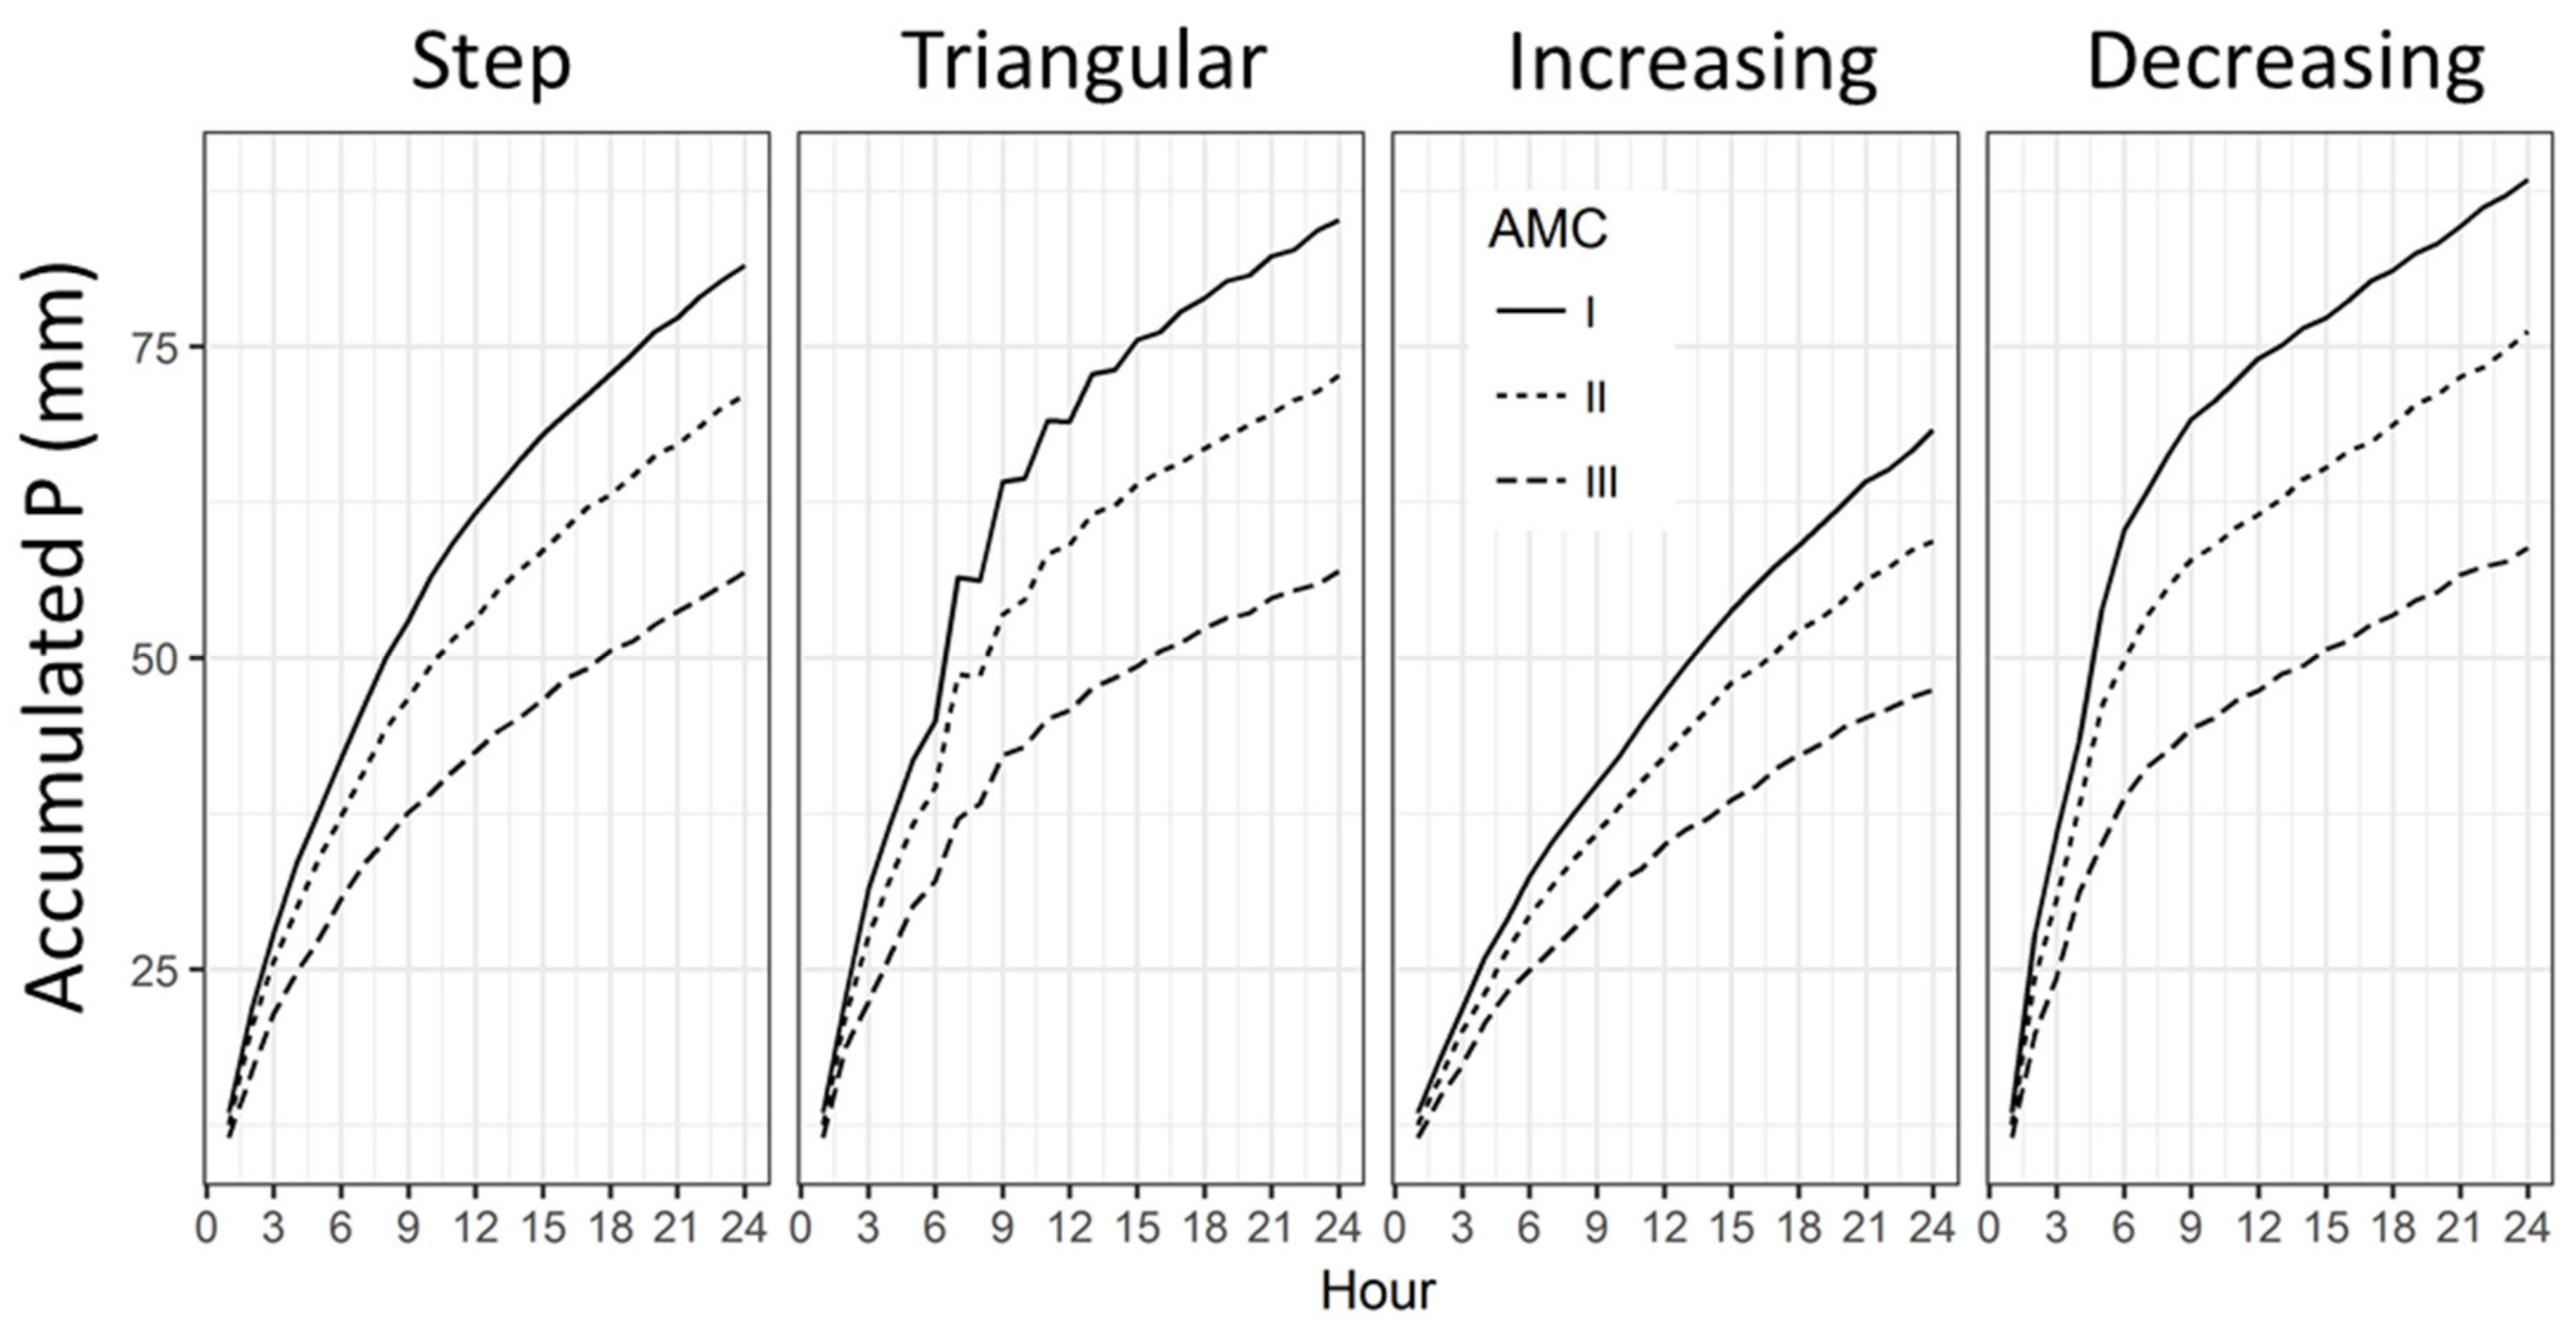
By grouping critical rainfall events (median values of rainfall thresholds) according to soil moisture classes for the hyetotypes (Figure 5), we can clearly see the impact of antecedent soil moisture. In all hyetographs, the pattern remained consistent, as the drier soil required more precipitation than the wetter soil. However, the differences among rainfall thresholds in soil classes varied in the hyetographs. For instance, for a duration of 24 h, the ranges of rainfall thresholds between wet soil and dry soil were 25, 29, 21, and 30 mm for the increasing, step, triangular and decreasing hyetotypes, respectively. In operational application of the proposed framework, Figure 5 can be used as a practical tool for decision-making. When the temporal distributions of storm moisture and pre-event soil moisture are estimated, corresponding curves can be chosen for comparison with the accumulated rainfall.
3.2. Performance Evaluation
Table 3 shows the results of validation and summarizes the categories of CA, MA and FA for different pre-event soil moisture and rainfall configurations. Since we noticed that most rain events decreased in intensity, we focused on the results for the corresponding hyetotype H3, as highlighted. We can see that 11 events were correctly forecast, 1 event was forecasted as an MA, 14 events were forecasted as FAs, and 11 events had CA. These results led to the evaluation criteria of a POD of 91.7% and an FAR of 56% and an CSI of 42.3%, which is comparable with similar studies [37,38]. Based on this result, for the rain gauge data, the threshold-based forecasting system seems to have reliable performance. On the other hand, the FAR is not as low as desired. The main cause of the high FAR is the number of long low-intensity events in the validation. Montesarchio, Lombardo and Napolitano, 2009 also obtained an FAR of 75% in their study and found the same reason in a catchment in North Italy. This study also pointed out an interesting result that FA events took place only under dry to moderate AMCs. This result can be explained by the fact that most rainfall infiltrated the soil due to low intensity and did not generate surface runoff. However, the model was not able to describe this process, which is shown in Figure 6 and discussed in the next section.
The correctly forecasted events were those with high discharge values and those with generally large rainfall amounts. An important characteristic was that most of the events had preceding rain that started with peak rain.
3.3. Role of Discharge Simulation
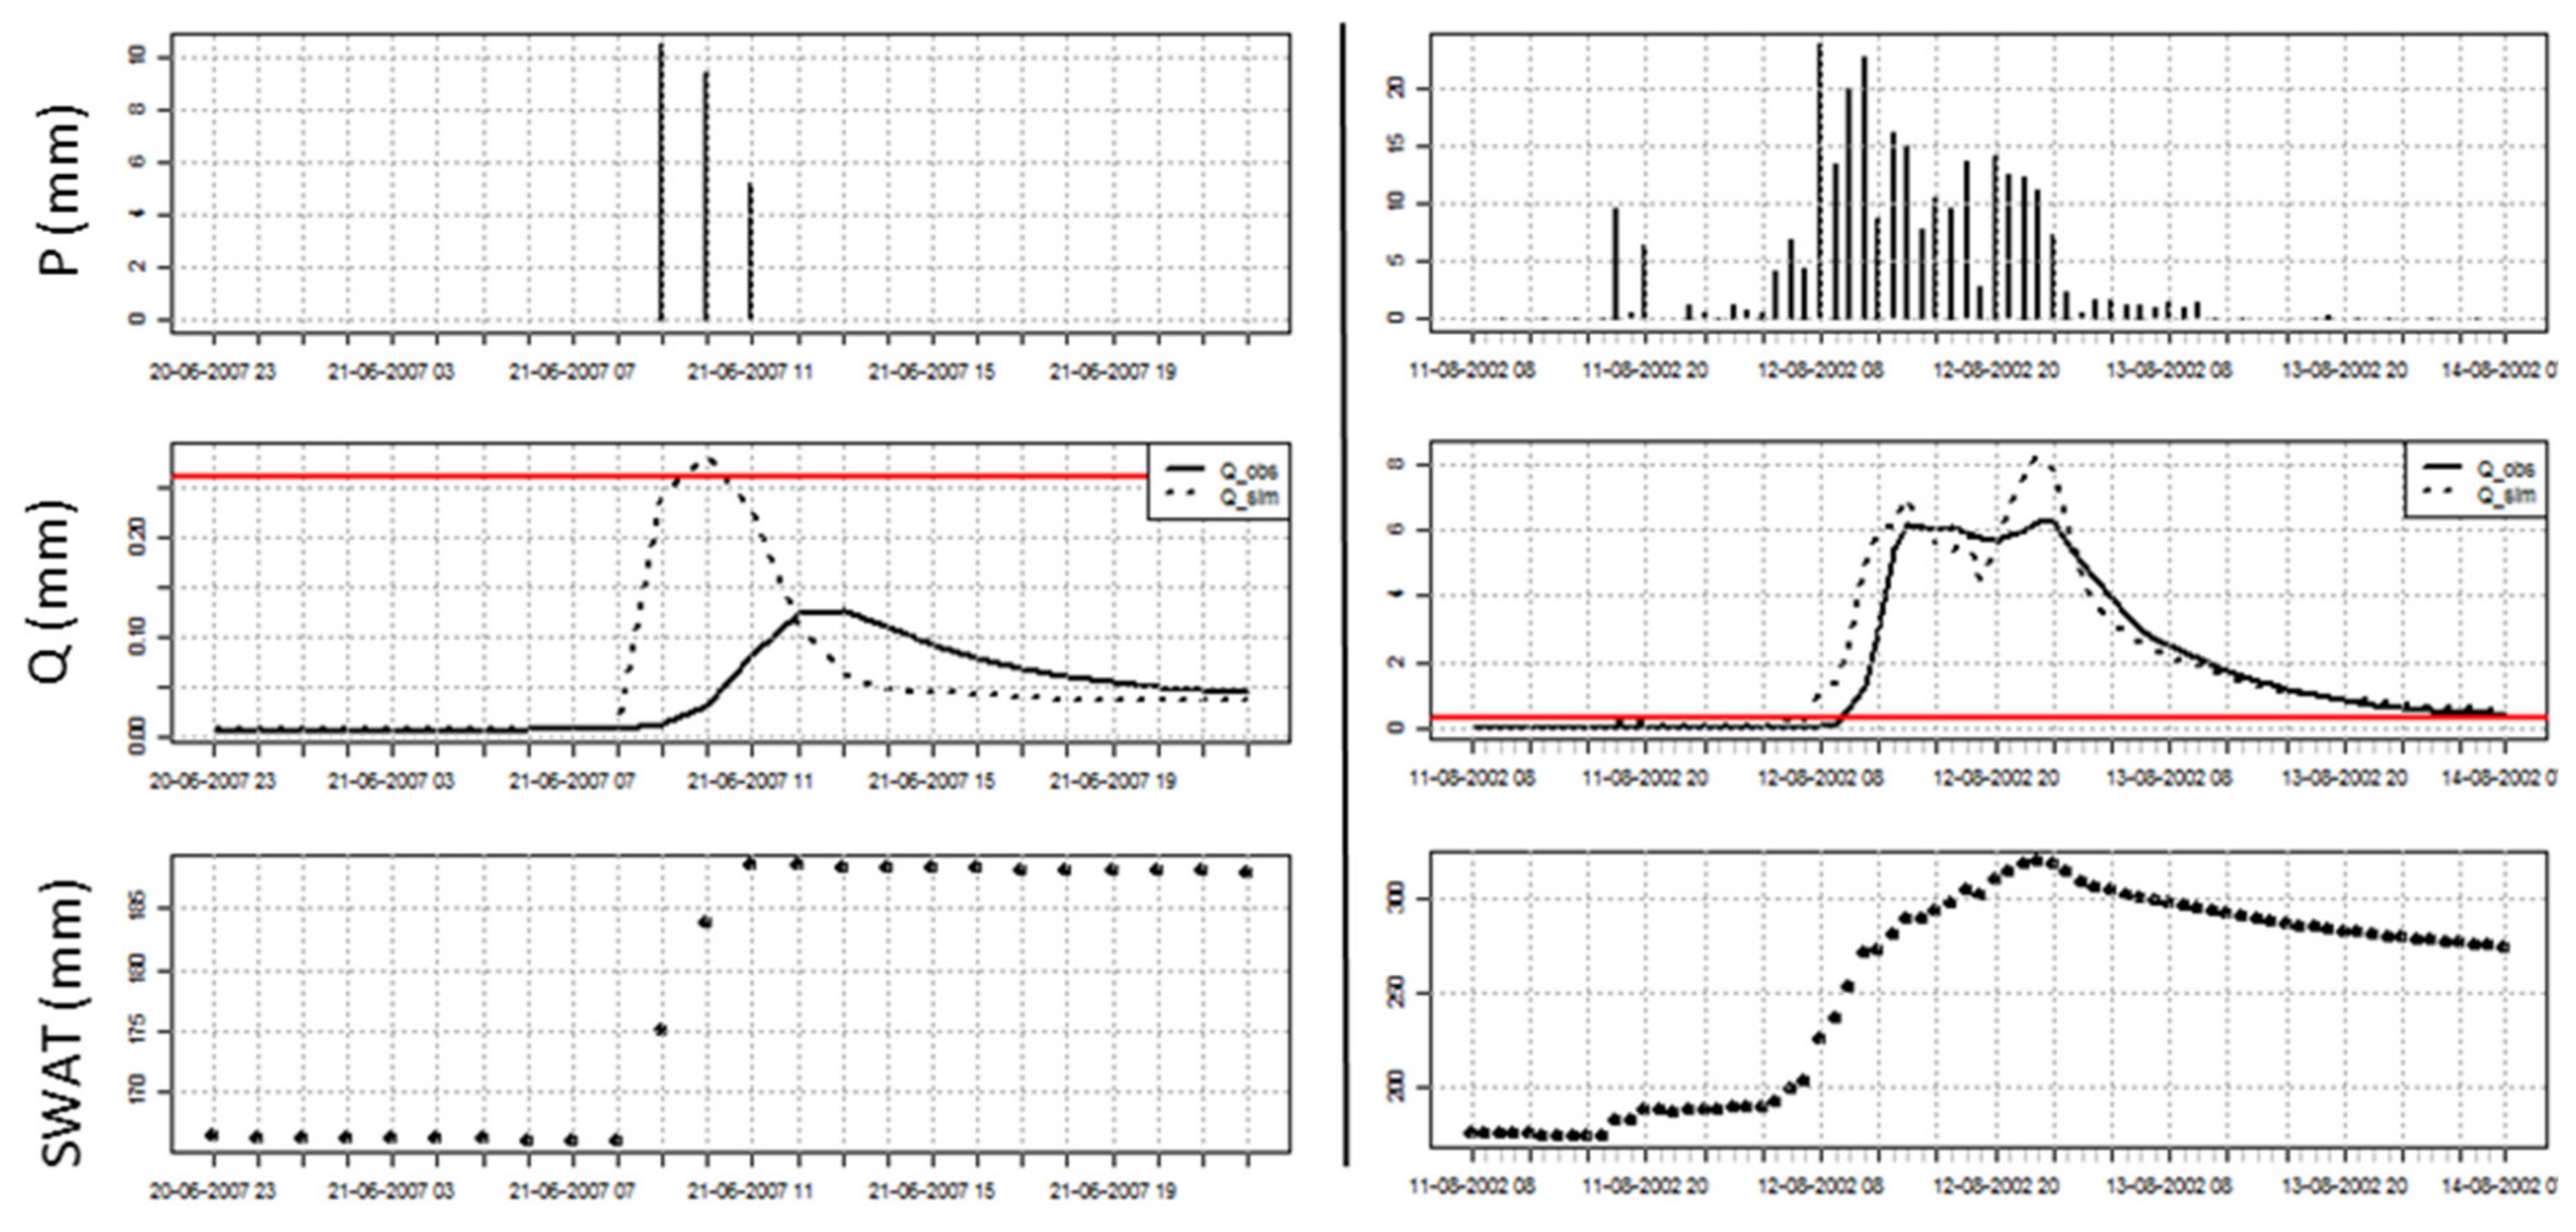
As briefly mentioned above, the routing process in the BROOK90 model has been omitted to focus on the details of the factors controlling evaporation [26]. An apparently weak point of the model is a missing delay in discharge, which should be expected for the concentration time for simulated discharge. Therefore, the model responded quickly, which resulted in peak discharge immediately after rainfall, which is not the case in reality. The peak discharge in the catchment often occurs much later after sub-surface flow processes occur. This causes the peak discharge to be not well captured temporally; thus, even if the cumulative rainfall exceeds the reference threshold, the observed discharge is still under, even if the cumulative rainfall critical value. This discrepancy can be clearly seen in Figure 6 (left side), as the peak discharge in the simulation appeared 3 h earlier than the observed peak discharge. The concentration time was longer, which led to the discharge curve being rather flat during the rainfall event. Hence, the threshold discharge was already exceeded by the simulated discharge, while the observed discharge was still under the threshold. In addition, the discrepancies were particularly significant under dry soil conditions, where infiltration mainly dominated the hydrological process. The results in Table 3 illustrate that among 14 FAs, 9 were found in AMC I (dry soil class). The results clearly demonstrate the role of soil moisture conditions in the prediction skill for flash flood events.
Figure 6 (right side) shows an interesting result for the extreme event in 2002. A large rainfall amount seems to overcome the problem of simulating discharge. This finding indicates that this approach will work considerably well for extreme events. Moreover, in ungauged catchments, neither hydraulic geometry nor hydraulic data are available, which makes it more difficult to estimate the critical discharge. Thus, output from the BROOK90 model can be used a reference source of discharge information. When the data input is sufficiently long, a critical discharge value can be estimated using the return period method. Thus, this method enables more robust application in poorly gauged catchments.
4. Conclusions and Outlook
This case study has tested the definition of a rainfall threshold methodology. The thresholds were estimated by running a physically based model with synthetic rainfall under various pre-event moisture conditions of the catchment. Thus, it resulted in a whole range of rainfall threshold curves categorized according to the hyetotype of rain input and antecedent soil moisture. Under dry conditions, critical discharge is caused by higher rainfall than under wet soil conditions. Thus, in addition to the high precipitation intensities, antecedent soil moisture also plays an important role in the estimation of rainfall thresholds for flash floods. This finding was consistent with that of Penna et al. (2011), who investigated the influence of soil moisture on threshold runoff generation processes in an alpine headwater catchment. Depending on soil type, soil depth, and pre-event soil moisture, soils in the catchment can store a large amount of rainwater before surface flow occurs.
Using rain gauge data, validation with 40 selected events in the study period led to a correct rate greater than 91% for identifying the critical wetness state in the considered catchment. The relatively high FAR can be explained by the limitation of the rainfall runoff model as well as the selection of critical discharge. The proposed adjusted FFG approach has the potential to provide reliable support in flash flood forecasting. It is a one-time action used to derive the thresholds and requires little information for operational use, being based solely based on rainfall forecasting and daily soil moisture information as well as available information on study site characteristics. The R-Br90 version is a good and handy tool for this application. This version allows to run the model in batch mode to investigate the catchment under various pre-event conditions and data inputs. However, a more detailed rainfall-runoff model is needed to improve warning accuracy.
Nevertheless, the actual framework was tested only for a ‘perfect’ prediction without uncertainties in meteorological variables, especially in rainfall. Determining the quality of different meteorological forecasts (predictability) of heavy precipitation events will be a task in future investigations.
Further investigations will focus on precipitation input derived from numerical weather prediction and radar data sets. Several improvements to the model and method should lead to improved prediction skill. For instance, the choice of critical discharge is crucial for model verification with observed events; thus, a sensitivity analysis is needed to define a critical value for method performance. Additionally, the computed runoff could be improved by a spatially distributed model and better temporal resolution. Then, a critical antecedent soil moisture level derived from the BROOK90 model could serve as the starting condition for running a more complex hydrological model that in turn checks for the alarm level. This combination would allow the monitoring of soil moisture status with very good coverage of critical head catchments with little computational effort, while more complex modelling could be performed only in selected situations. However, to implement the proposed method operationally, we recommend additional reductions in computational time via an integrated modelling framework.
Author Contributions
Conceptualization, all authors; methodology, T.T.L., C.B. and J.P.; BROOK90 model in R, R.K.; calibration and validation, T.T.L. and J.P.; inverse model structure, T.T.L. and R.K.; event detection, J.P.; writing—original draft preparation, T.T.L.; writing—review and editing, all authors. All authors made a significant contribution to the final version of the publication. All authors have read and agreed to the published version of the manuscript.
Funding
The research was supported in the framework of the EXTRUSO project funded by the European Social Fund (ESF) under the award number 100270097.
Informed Consent Statement
Informed consent was obtained from all subjects involved in the study.
Data Availability Statement
MDPI Research Data Policies.
Acknowledgments
We thank all colleagues at the Chair of Meteorology, especially Uwe Eichelmann and Heiko Prasse, for their support of the Wernersbach measurements since more than 30 years. Open Access Funding by the Publication Fund of the TU Dresden.
Conflicts of Interest
The authors declare no conflict of interest.
References
- Borga, M.; Creutin, J.D.; Gaume, E.; Martina, M.; Todini, E.; Thielen, J. Flash flood risk management: Advances in hydrological forecasting and warning. In Flood Risk Management: Research and Practice; CRC Press: Boca Raton, FL, USA, 2009; pp. 1305–1314. [Google Scholar]
- Martina, M.L.V.; Todini, E. Bayesian rainfall thresholds for flash flood guidance. Flood Risk Management: Research and Practice; CRC Press: Boca Raton, FL, USA, 2009; pp. 1399–1408. [Google Scholar]
- Norbiato, D.; Borga, M.; Sangati, M.; Zanon, F. Regional frequency analysis of extreme precipitation in the eastern Italian Alps and the August 29, 2003 flash flood. J. Hydrol. 2007, 345, 149–166. [Google Scholar] [CrossRef]
- Georgakakos, K.P. Analytical results for operational flash flood guidance. J. Hydrol. 2006, 317, 81–103. [Google Scholar] [CrossRef]
- Modrick, T.M.; Georgakakos, K.P. Regional bankfull geometry relationships for southern California mountain streams and hydrologic applications. Geomorphology 2014, 221, 242–260. [Google Scholar] [CrossRef]
- Rusjan, S.; Kobold, M.; Mikoš, M. Characteristics of the extreme rainfall event and consequent flash floods in W Slovenia in September 2007. Nat. Hazards Earth Syst. Sci. 2009, 9, 947–956. [Google Scholar] [CrossRef]
- Gaume, E.; Bain, V.; Bernardara, P.; Newinger, O.; Barbuc, M.; Bateman, A.; Blaškovičová, L.; Blöschl, G.; Borga, M.; Dumitrescu, A.; et al. A compilation of data on European flash floods. J. Hydrol. 2009, 367, 70–78. [Google Scholar] [CrossRef] [Green Version]
- Alpert, P.; Ben-Gai, T.; Baharad, A.; Benjamini, Y.; Yekutieli, D.; Colacino, M.; Diodato, L.; Ramis, C.; Homar, V.; Romero, R.; et al. The paradoxical increase of Mediterranean extreme daily rainfall in spite of decrease in total values. Geophys. Res. Lett. 2002, 29, 29–32. [Google Scholar] [CrossRef] [Green Version]
- Philipp, A.; Kerl, F.; Büttner, U.; Metzkes, C.; Singer, T.; Wagner, M.; Schütze, N. Small-scale (flash) flood early warning in the light of operational requirements: Opportunities and limits with regard to user demands, driving data, and hydrologic modeling techniques. Proc. Int. Assoc. Hydrol. Sci. 2016, 373, 201–208. [Google Scholar] [CrossRef] [Green Version]
- Carpenter, T.M.; Sperfslage, J.A.; Georgakakos, K.P.; Sweeney, T.; Fread, D.L. National threshold runoff estimation utilizing GIS in support of operational flash flood warning systems. J. Hydrol. 1999, 224, 21–44. [Google Scholar] [CrossRef]
- De Luca, D.L.; Versace, P. Diversity of Rainfall Thresholds for early warning of hydro-geological disasters. Adv. Geosci. 2017, 44, 53–60. [Google Scholar] [CrossRef] [Green Version]
- Montesarchio, V.; Napolitano, F.; Rianna, M.; Ridolfi, E.; Russo, F.; Sebastianelli, S. Comparison of methodologies for flood rainfall thresholds estimation. Nat. Hazards 2015, 75, 909–934. [Google Scholar] [CrossRef]
- Rozalis, S.; Morin, E.; Yair, Y.; Price, C. Flash flood prediction using an uncalibrated hydrological model and radar rainfall data in a Mediterranean watershed under changing hydrological conditions. J. Hydrol. 2010, 394, 245–255. [Google Scholar] [CrossRef]
- Tramblay, Y.; Bouvier, C.; Martin, C.; Didon-Lescot, J.F.; Todorovik, D.; Domergue, J.M. Assessment of initial soil moisture conditions for event-based rainfall-runoff modelling. J. Hydrol. 2010, 387, 176–187. [Google Scholar] [CrossRef]
- Borga, M.; Boscolo, P.; Zanon, F.; Sangati, M. Hydrometeorological analysis of the 29 august 2003 flash flood in the Eastern Italian Alps. J. Hydrometeorol. 2007, 8, 1049–1067. [Google Scholar] [CrossRef]
- Norbiato, D.; Borga, M.; Esposti, S.D.; Gaume, E.; Anquetin, S. Flash flood warning based on rainfall thresholds and soil moisture conditions: An assessment for gauged and ungauged basins. J. Hydrol. 2008, 362, 274–290. [Google Scholar] [CrossRef]
- Penna, D.; Tromp-Van Meerveld, H.J.; Gobbi, A.; Borga, M.; Fontana, G.D. The influence of soil moisture on threshold runoff generation processes in an alpine headwater catchment. Hydrol. Earth Syst. Sci. 2011, 15, 689–702. [Google Scholar] [CrossRef] [Green Version]
- Blöschl, G. Rainfall-Runoff Modeling of Ungauged Catchments. Encycl. Hydrol. Sci. 2005. [Google Scholar] [CrossRef]
- Schwärzel, K.; Menzer, A.; Clausnitzer, F.; Spank, U.; Häntzschel, J.; Grünwald, T.; Köstner, B.; Bernhofer, C.; Feger, K.H. Soil water content measurements deliver reliable estimates of water fluxes: A comparative study in a beech and a spruce stand in the Tharandt forest (Saxony, Germany). Agric. For. Meteorol. 2009, 149, 1994–2006. [Google Scholar] [CrossRef]
- IUSS Working Group WRB. World Reference Base for Soil Resources 2006; FAO: Rome, Italy, 2007; ISBN 9251055114. [Google Scholar]
- Spank, U.; Schwärzel, K.; Renner, M.; Moderow, U.; Bernhofer, C. Effects of measurement uncertainties of meteorological data on estimates of site water balance components. J. Hydrol. 2013, 492, 176–189. [Google Scholar] [CrossRef]
- Goldberg, V.; Eichelmann, U.; Prasse, H.; Bernhofer, C. The flash flood event in the catchment of the river Weißeritz (eastern Erzgebirge, Saxony) from 12–14. August 2002 meteorological and hydrological reasons, damage assessment and disaster management. In Proceedings of the EGS-AGU-EUG Joint Assembly, Nice, France, 6–11 April 2003. [Google Scholar]
- Schwärzel, K.; Feger, K.-H.; Häntzschel, J.; Menzer, A.; Spank, U.; Clausnitzer, F.; Köstner, B.; Bernhofer, C. A novel approach in model-based mapping of soil water conditions at forest sites. For. Ecol. Manag. 2009, 258, 2163–2174. [Google Scholar] [CrossRef]
- Luong, T.T.; Kronenberg, R.; Bernhofer, C.; Al Janabi, F.; Schütze, N. Comparative estimation and assessment of initial soil moisture conditions for Flash Flood warning in Saxony. Geophys. Res. Abstr. 2017, 19, 3728. [Google Scholar]
- Grünwald, T.; Bernhofer, C. A decade of carbon, water and energy flux measurements of an old spruce forest at the Anchor Station Tharandt. Tellus Ser. B Chem. Phys. Meteorol. 2007, 59, 387–396. [Google Scholar] [CrossRef] [Green Version]
- Federer, C.A.; Vörösmarty, C.; Fekete, B. Sensitivity of annual evaporation to soil and root properties in two models of contrasting complexity. J. Hydrometeorol. 2003, 4, 1276–1290. [Google Scholar] [CrossRef]
- Clapp, R.B.; Hornberger, G.M. Empirical equations for some soil hydraulic properties. Water Resour. Res. 1978, 14, 601–604. [Google Scholar] [CrossRef] [Green Version]
- Gebrechorkos, S.H.; Bernhofer, C.; Hülsmann, S. Impacts of projected change in climate on water balance in basins of East Africa. Sci. Total Environ. 2019, 682, 160–170. [Google Scholar] [CrossRef] [PubMed]
- Martina, M.L.V.; Todini, E.; Libralon, A. Rainfall thresholds for flood warning systems: A bayesian decision approach. In Hydrological Modelling and the Water Cycle; Springer: Berlin/Heidelberg, Germany, 2009; pp. 203–227. [Google Scholar]
- Montesarchio, V.; Lombardo, F.; Napolitano, F. Rainfall thresholds and flood warning: An operative case study. Nat. Hazards Earth Syst. Sci. 2009, 9, 135–144. [Google Scholar] [CrossRef]
- Doherty, J.; Johnston, J.M. Methodologies for calibration and predictive analysis of a watershed model. J. Am. Water Resour. Assoc. 2003, 39, 251–265. [Google Scholar] [CrossRef]
- Marchi, L.; Borga, M.; Preciso, E.; Gaume, E. Characterisation of selected extreme flash floods in Europe and implications for flood risk management. J. Hydrol. 2010, 394, 118–133. [Google Scholar] [CrossRef]
- Tarolli, P.; Borga, M.; Morin, E.; Delrieu, G. Analysis of flash flood regimes in the North-Western and South-Eastern Mediterranean regions. Nat. Hazards Earth Syst. Sci. 2012, 12, 1255–1265. [Google Scholar] [CrossRef] [Green Version]
- Amponsah, W.; Ayral, P.A.; Boudevillain, B.; Bouvier, C.; Braud, I.; Brunet, P.; Delrieu, G.; DIdon-Lescot, J.F.; Gaume, E.; Lebouc, L.; et al. Integrated high-resolution dataset of high-intensity European and Mediterranean flash floods. Earth Syst. Sci. Data 2018, 10, 1783–1794. [Google Scholar] [CrossRef] [Green Version]
- Amponsah, W.; Marchi, L.; Zoccatelli, D.; Boni, G.; Cavalli, M.; Comiti, F.; Crema, S.; Lucía, A.; Marra, F.; Borga, M. Hydrometeorological characterization of a flash flood associated with major geomorphic effects: Assessment of peak discharge uncertainties and analysis of the runoff response. J. Hydrometeorol. 2016, 17, 3063–3077. [Google Scholar] [CrossRef]
- Schaeffer, J.T. The critical success index as an indicator of warning skill. Weather Forecast. 1990, 5, 570–574. [Google Scholar] [CrossRef] [Green Version]
- Norbiato, D.; Borga, M.; Dinale, R. Flash flood warning in ungauged basins by use of the flash flood guidance and model-based runoff thresholds. Meteorol. Appl. 2009, 16, 65–75. [Google Scholar] [CrossRef]
- Javelle, P.; Fouchier, C.; Arnaud, P.; Lavabre, J. Flash flood warning at ungauged locations using radar rainfall and antecedent soil moisture estimations. J. Hydrol. 2010, 394, 267–274. [Google Scholar] [CrossRef]
Figure 1.
Overview of the study sites in Tharandt Forest, Saxony (Germany). The unit of elevation is m.a.s.l.
Figure 1.
Overview of the study sites in Tharandt Forest, Saxony (Germany). The unit of elevation is m.a.s.l.

Figure 2.
Different rainfall designs used as model input (hyetotypes and durations) and flow chart of inverse hydrological modelling for rainfall threshold estimation.
Figure 2.
Different rainfall designs used as model input (hyetotypes and durations) and flow chart of inverse hydrological modelling for rainfall threshold estimation.

Figure 3.
Application and validation of rainfall thresholds, with examples shown for four selected events with different pre-event soil moisture conditions (indicated in each sub-figure) and rain and discharge characteristics. The red lines are accumulated forecasted rainfall of the events. (a) Missing alarm; (b) correct alarm; (c) correct missing alarm and (d) correct alarm due to information on antecedent soil moisture. The categories are summarized in Table 2. The characteristics of the four selected events are listed in Table 1. The events were selected on purpose to illustrate the differences in issuing an alarm. The false alarm is not illustrated here.

Figure 4.
Rainfall threshold for different AMCs and hyetotypes: (a–c) Threshold ranges of the study period for different AMC types exemplary of hyetotype 1; (d–f) rainfall threshold (median values) for different AMCs because of the different P configurations (1–4).
Figure 4.
Rainfall threshold for different AMCs and hyetotypes: (a–c) Threshold ranges of the study period for different AMC types exemplary of hyetotype 1; (d–f) rainfall threshold (median values) for different AMCs because of the different P configurations (1–4).

Figure 5.
Rainfall thresholds sorted according to different hyetographs for all soil moisture classes.
Figure 5.
Rainfall thresholds sorted according to different hyetographs for all soil moisture classes.

Figure 6.
Examples of a false alarm (left side) and a correct alarm (right side). P = precipitation (mm), Qobs = observed discharge (mm), Qsim = simulated discharge (mm) and SWAT = estimated soil moisture (mm). The red line in the second row indicates the discharge threshold.
Figure 6.
Examples of a false alarm (left side) and a correct alarm (right side). P = precipitation (mm), Qobs = observed discharge (mm), Qsim = simulated discharge (mm) and SWAT = estimated soil moisture (mm). The red line in the second row indicates the discharge threshold.


Table 1.
Selected rainfall event characteristics with Psum ≥ 20 mm (AMC = antecedent soil moisture condition categorized into three classes, with I indicating wet and III indicating dry; Pduration = rainfall event duration; Pmax = precipitation peak; AS = antecedent soil moisture as an absolute value in mm).
| Date | AMC | Pduration [h] | Psum [mm] | Pmax [mm] | AS [mm] | Intensity [mm/h] |
|---|---|---|---|---|---|---|
| 1997-06-14 | I | 6 | 22 | 11.5 | 163 | 3.7 |
| 1998-06-12 | I | 7 | 24.5 | 10.3 | 148.2 | 3.5 |
| 1998-06-21 | I | 4 | 22.6 | 6.5 | 172.5 | 5.7 |
| 1998-07-27 | II | 3 | 27 | 19.6 | 190.6 | 9 |
| 1998-08-02 | II | 12 | 39.8 | 29.1 | 187.5 | 3.3 |
| 1999-06-18 | I | 32 | 60 | 6.1 | 173.8 | 1.9 |
| 1999-07-06 | III | 19 | 35.6 | 19.8 | 233.4 | 1.9 |
| 1999-07-20 | II | 6 | 21.7 | 12.4 | 217 | 3.6 |
| 1999-09-18 | I | 7 | 21.7 | 21.5 | 153.2 | 3.1 |
| 2001-07-07 | II | 6 | 44.3 | 34.1 | 199.3 | 7.4 |
| 2002-07-16 | I | 5 | 23 | 12.5 | 153.7 | 4.6 |
| 2002-08-08 | II | 2 | 34.7 | 34.5 | 181.6 | 17.4 |
| 2002-08-11 | II | 51 | 272.3 | 23.7 | 181.2 | 5.3 |
| 2002-08-31 | II | 11 | 66 | 40.9 | 192.2 | 6 |
| 2002-09-26 | II | 14 | 22.2 | 5.9 | 214.2 | 1.6 |
| 2003-05-08 | I | 13 | 24 | 9.2 | 160.9 | 1.8 |
| 2004-05-06 | II | 5 | 25.3 | 12.7 | 201.1 | 5.1 |
| 2004-05-10 | II | 14 | 31.8 | 13.3 | 216 | 2.3 |
| 2004-07-22 | II | 8 | 44.4 | 21.7 | 209 | 5.5 |
| 2005-07-05 | I | 14 | 23.2 | 2.9 | 170.8 | 1.7 |
| 2006-06-27 | I | 2 | 46.6 | 38.6 | 150.3 | 23.3 |
| 2006-08-05 | I | 49 | 78.9 | 9 | 136.3 | 1.6 |
| 2007-05-07 | I | 11 | 25.3 | 13.8 | 134.1 | 2.3 |
| 2007-05-14 | I | 5 | 23.1 | 13.8 | 160.4 | 4.6 |
| 2007-05-27 | II | 2 | 20.8 | 20.5 | 182.6 | 10.4 |
| 2007-05-28 | II | 11 | 21.1 | 9.8 | 184.2 | 1.9 |
| 2007-06-15 | I | 1 | 21.7 | 21.7 | 171.5 | 21.7 |
| 2007-06-21 | I | 3 | 25.1 | 10.5 | 174.9 | 8.4 |
| 2007-08-20 | I | 15 | 40.5 | 14.6 | 177.3 | 2.7 |
| 2007-08-31 | II | 9 | 27.1 | 9.2 | 188.4 | 3 |
| 2008-07-03 | I | 1 | 23.6 | 23.6 | 155.8 | 23.6 |
| 2008-08-08 | I | 7 | 31.7 | 31 | 164.3 | 4.5 |
| 2008-08-11 | I | 6 | 20.9 | 10.2 | 170.1 | 3.5 |
| 2009-05-26 | I | 18 | 33.1 | 9.4 | 154.3 | 1.8 |
| 2009-08-02 | I | 16 | 52.6 | 31.1 | 173 | 3.3 |
| 2009-08-26 | I | 6 | 40.6 | 24.9 | 168.3 | 6.8 |
| 2010-06-02 | III | 19 | 49.2 | 16.6 | 242.3 | 2.6 |
| 2010-07-22 | I | 19 | 28.8 | 5.5 | 144.9 | 1.5 |
| 2010-08-03 | II | 16 | 38.8 | 10.6 | 183.3 | 2.4 |
| 2010-08-15 | II | 3 | 27.6 | 16.4 | 219.2 | 9.2 |
| Mean | 11.5 | 39.1 | 17.2 | 191 | 5.8 | |
| S.D. | 11.1 | 40.2 | 9.8 | 25.7 | 5.8 |
Table 2.
Two-by-two contingency table.
| Qobs > Qthreshold | |||
|---|---|---|---|
| Yes | No | ||
| Pobs > Pthreshold | Yes | CORRECT Alarm (CA) | FALSE Alarm (FA) |
| No | MISSING Alarm (MA) | CORRECT Missing Alarm (CMA) | |
Table 3.
Rain gauge events evaluation with rainfall thresholds derived from the flash flood guidance (FFG) method.
Table 3.
Rain gauge events evaluation with rainfall thresholds derived from the flash flood guidance (FFG) method.
| Correct Alarm | Missing Alarm | False Alarm | Correct Missing Alarm | |||||||||||||
|---|---|---|---|---|---|---|---|---|---|---|---|---|---|---|---|---|
| Hyetotype | H1 | H2 | H3 | H4 | H1 | H2 | H3 | H4 | H1 | H2 | H3 | H4 | H1 | H2 | H3 | H4 |
| AMCI | 1 | 1 | 2 | 1 | 1 | 1 | 0 | 1 | 7 | 7 | 9 | 7 | 13 | 13 | 11 | 13 |
| AMCII | 5 | 4 | 7 | 4 | 3 | 4 | 1 | 4 | 4 | 4 | 5 | 4 | 4 | 4 | 3 | 4 |
| AMCIII | 2 | 2 | 2 | 2 | 0 | 0 | 0 | 0 | 0 | 0 | 0 | 0 | 0 | 0 | 0 | 0 |
| ∑ | 8 | 7 | 11 | 7 | 4 | 5 | 1 | 5 | 11 | 11 | 14 | 11 | 17 | 17 | 14 | 17 |
| H1 | H2 | H3 | H4 | |||||||||||||
| POD (%) | 66.7 | 58.3 | 91.7 | 58.3 | ||||||||||||
| FAR (%) | 57.9 | 61.1 | 56 | 61.1 | ||||||||||||
| CSI (%) | 34.8 | 30.4 | 42.3 | 30.4 | ||||||||||||
Publisher’s Note: MDPI stays neutral with regard to jurisdictional claims in published maps and institutional affiliations. |
© 2021 by the authors. Licensee MDPI, Basel, Switzerland. This article is an open access article distributed under the terms and conditions of the Creative Commons Attribution (CC BY) license (https://creativecommons.org/licenses/by/4.0/).
Share and Cite
MDPI and ACS Style
Luong, T.T.; Pöschmann, J.; Kronenberg, R.; Bernhofer, C. Rainfall Threshold for Flash Flood Warning Based on Model Output of Soil Moisture: Case Study Wernersbach, Germany. Water 2021, 13, 1061. https://doi.org/10.3390/w13081061
AMA Style
Luong TT, Pöschmann J, Kronenberg R, Bernhofer C. Rainfall Threshold for Flash Flood Warning Based on Model Output of Soil Moisture: Case Study Wernersbach, Germany. Water. 2021; 13(8):1061. https://doi.org/10.3390/w13081061
Chicago/Turabian StyleLuong, Thanh Thi, Judith Pöschmann, Rico Kronenberg, and Christian Bernhofer. 2021. "Rainfall Threshold for Flash Flood Warning Based on Model Output of Soil Moisture: Case Study Wernersbach, Germany" Water 13, no. 8: 1061. https://doi.org/10.3390/w13081061
Note that from the first issue of 2016, this journal uses article numbers instead of page numbers. See further details here.