
Risk and Impact Assessment of Dams in the Contiguous United States Using the 2018 National Inventory of Dams Database


1
Department of Civil, Construction and Environmental Engineering, The University of Alabama, Tuscaloosa, AL 35487, USA
2
Division of Environmental Science and Engineering, Pohang University of Science and Technology, Pohang 37673, Korea
*
Author to whom correspondence should be addressed.
Water 2021, 13(8), 1066; https://doi.org/10.3390/w13081066
Submission received: 15 February 2021
/
Revised: 7 April 2021
/
Accepted: 8 April 2021
/
Published: 13 April 2021
(This article belongs to the Special Issue Analysis, Evaluation and Optimization of Infrastructures Serving Water Systems)
Abstract
:Aging water infrastructure in the United States (U.S.) is a growing concern. In the U.S., over 90,000 dams were registered in the 2018 National Inventory of Dams (NID) database, and their average age was 57 years old. Here, we aim to assess spatiotemporal patterns of the growth of artificial water storage of the existing dams and their hazard potential and potential economic benefit. In this study, we use more than 70,000 NID-registered dams to assess the cumulative hazard potential of dam failure in terms of the total number and the cumulative maximum storage of dams over the 12 National Weather Service River Forecast Center (RFC) regions. In addition, we also estimate potential economic benefits of the existing dams based on their cumulative storage capacity. Results show that the ratios of the cumulative storage capacity to the long-term averaged precipitation range from 8% (Mid-Atlantic) to 50% (Colorado), indicating the significant anthropogenic contribution to the land surface water budget. We also find that the cumulative storage capacity of the dams with high (probable loss of human life is if the dam fails) and significant (potential economic loss and environmental damage with no probable casualty) hazard potential ranges from 50% (North Central) to 98% (Missouri and Colorado) of the total storage capacity within the corresponding region. Surprisingly, 43% of the dams with either high or significant potential hazards have no Emergency Action Plan. Potential economic benefits from the existing dams range from $0.7 billion (Mid Atlantic) to $15.4 billion (West Gulf). Spatiotemporal patterns of hazard potential and economic benefits from the NID-registered dams indicate a need for the development of region-specific preparation, emergency, and recovery plans for dam failure. This study provides an insight about how big data, such as the NID database, can provide actionable information for community resilience toward a safer and more sustainable environment.
1. Introduction
A dam creates an artificial water impoundment and alters the flow regime. The main goal of a dam is to provide sustainable water resources throughout the year and to increase community resilience to natural hazards such as floods and droughts [1] The artificial water impoundment alters the surrounding flow regime, particularly downstream from the dam, by increasing low flows and decreasing high flows [2] while the hydrologic impact of a dam varies depending on the size and purpose [3]. Land-use and land-cover changes such as dams and irrigation have influenced the local climate by changing the atmospheric conditions such as humidity and surface temperature via land–atmospheric coupling [4].
The potential economic benefits of water from dams can be assessed in terms of the marginal costs of water for different uses [5]. In the contiguous United States (CONUS), freshwater values are diverse depending on the uses [6] and the regions [7]. In 2017, the American Society of Civil Engineering issued the infrastructure report card at the national and state levels. The report raises a concern about the impact of aging water infrastructure on public safety and resilience [8]. In the report, they estimate it will require nearly US$45 billion to repair aging, yet critical, high-hazard potential dams. Spatiotemporal patterns of the hydrologic impact, cumulative hazard potential, and economic values of multiple dams at large-scale basins, such as the 12 National Weather Service River Forecasting Center (RFC) regions, have never been assessed synthetically.
To secure and maintain the economic benefits from existing dams, a comprehensive dam safety program should consist of structural inspections and rehabilitation (proactive), emergency action (reactive) and recovery (post-active) plans. When assessing the potential hazard of dam failure, the economic benefits from the multiple uses of water stored in the reservoir should be counted as economic losses in the event of dam failure. An integrative assessment of potential hazard assessment and economic impact of dam failure can help address a need to improve the current dam safety program at the national and regional levels for policymakers and water resources managers. Also, the large-scale assessment of dam-related hazard risk and economic benefits helps develop a region-specific dam safety programs, which can account for spatial variation of the level of the preparation and recovery programs for dam failure.
Conventionally, the risk of dam failure has been estimated based heavily on stochastic models that are in turn based on the stationarity theory [9,10]. However, structural inspection and maintenance programs are also necessary to move toward greater resilience to unprecedented extreme weather and climate events. Changing climate makes the stationarity of our water engineered system redundant [11] and thus requires the development of an integrated approach to dam design, operations, and water management. Dams are a key component of the coupled human-natural systems for hydroclimatic extreme event adaptation and mitigation [12], which can compound the climate change impacts through the interactions of natural and human systems. In a changing climate, the hydrologic impact of dams and related risk and benefits should be assessed since the maintenance and upgrade of aging hydraulic missions can be influential in reducing hazard potential at not only the national but the international level as well [13,14].
The risk, benefits, and ecological impacts of the existing dams have been studied at the site level, in particular to better understand the impact of the construction/removal of a new dam [15,16]. However, human alteration of rivers due to dams and reservoirs are ubiquitous and various [17] and thus the accumulative impact assessment of multiple dams is still challenging. For example, dams have been built across the U.S. states to meet the water demand for various purposes and mitigate the adverse effect of extreme hydrometeorological events. Currently, the U.S. has over 90,000 dams with an average age of 57 years old, and has been often called a “Dam nation” [7]. A previous study [18] found that lakes with no potential for human hydro-alteration, such as dams and land use, have been decreased since 2007. To better understand the accumulative impact of multiple dams at the regional scale and their spatial variation, the detailed information of these 90,000 dams in the U.S. are necessary.
In 1975, the U.S. Army Corps of Engineers (USACE) inventoried dams in the United States under the National Dam Inspection Act (Public Law 92–367). The USACE first published the National Inventory of Dams (NID) database in 1975 [19]. In response to the Federal Dam Safety Act of 2006 (Public Law 109–460), the Federal Emergency Management Agency (FEMA) requires a biennial report to Congress on the status of the existing dams and progress achieved in dam safety during the previous two years. Using the NID database that was limitedly assessed, the potential large-scale hydrologic and environmental effects on the flow regime [7].
Recently, the NID has reauthorized as part of the Water Resources Reform and Development Act of 2014 (Public Law 113–121) and the Water Resources Development Act of 2018 (Public Law 115–270). The 2018 NID database was populated using the 116th Congressional District information. Two major changes of the 2018 NID database are that (1) the 2018 NID database is downloadable from the website (https://nid-test.sec.usace.army.mil accessed on 25 August 2020) and (2) the information about the hazard potential due to the failure or malfunction of dams is publicly available.
Understanding of spatiotemporal variations of the potential contribution of artificial surface water storage to the regional surface water budget remains limited. Understanding the accumulative hazard risk and potential benefits of the existing dams also remains limited, particularly, in the multiple dam setting. In this study, we strive to evaluate the hydrologic impact on the regional surface water budget and hazard assessment of dam failure over time in terms of the upstream catchment area of the corresponding dam per the number of the total dams and total storage per area, respectively. The cumulative hazard potential and potential economic assessment of dam failure enable identification of RFC regions that are more or less vulnerable to dam failure, by combining the risk of the hazard potential and potential economic losses of dam failure at the regional scale. This information can help increase the public’s perceived risk and garner support for the upgrade of the current dam safety program by justifying the hydraulic mission [20] and reconciling the sociopolitical conflicts of water security across the U.S. states [21]. Eventually, the findings of this study will advance the limited understanding of “anthropocene risk” [22].
2. Data and Methods
2.1. Data: National Inventory of Dam Database
The NID database includes the existing dams in the United States that meet at least one of the following four categories: (1) dams are classified as high hazard potential, (2) dams are classified as significant hazard potential, (3) dams exceed 2 m (6 feet) in height with equal or exceed 61,700 m3 (50 acre-ft) of storage, and (4) dams that are equal or exceed 8 m (25 feet) in height with exceeding 18,500 m3 (15 acre-ft) of storage. All dams registered in the NID database are categorized into five types of downstream hazard potential due to failure or malfunction of the dam or facilities: high (potential human life loss), significant (potential economic loss and environmental damage, but not human life loss), low (low economic and/or environmental loss limited to the owner’s property), undetermined, and missing. This potential hazard assessment does not account for the likelihood of failure occurrence of the corresponding dam. In other words, it only reflects the consequences of a dam failure, but not the condition of a dam failure [23].
The 2018 NID database includes the 91,191 dams over the CONUS. We found that 15,690 NID-registered dams (17%) have no information for geographic location (latitude and longitude), year of completion, or maximum storage capacity. In this study, we used 75,501 dams over the CONUS while a previous study [7] used 74,921 dams to study the artificial water storage growth due to dam constructions. In this study, the hazard potential assessment contains the error range of 3.5% of the total maximum storage of the total 75,501 dams because 7763 (5778) dams have no information for hazard potential over the CONUS (the West Gulf RFC region), which was not reported previously [7]. Despite the relatively small contribution, there are likely numerous dams in the United States that are smaller than the categories used in the NID database (height and storage capacity), indicating that this report represents the conservative assessment for hazard potential due to dam failure or malfunction.
2.2. Evaluations of Potential Hydrologic Impact
To evaluate the potential hydrologic impact of the NID-registered dams on the land surface water budget, the cumulative maximum reservoir storage created by the dams within each RFC area was calculated (Table 1). Over the long-term average (at least 10 years), the terrestrial storage tendency is often negligible so the long-term average land surface water balance is supposed to be closed. The cumulative maximum storage capacity of dams and reservoirs can significantly increase the terrestrial water storage tendency term in the water balance equation ( in Equation (1)), which requires some modification of other components such as precipitation (P), evaporation (E), and runoff (Q) for the water surface storage closure.
The ratio of the cumulative maximum storage capacity of dams and reservoirs to the long-term annual precipitation is a good indicator to measure the potential hydrologic impact of the dams on the regional land surface water balance. The long-term average (2002–2012) of total annual precipitation for each RFC area [24] is also reported in Table 1. The area per dam is a useful index to assess the hazard potential and preparedness of the existing dams because the location of the dams determines how many residents and properties would be adversely affected due to the adjacent dam failure. In this report, the area per dam is computed to measure the density of the NID-registered dams within the RFC area. The total storage per the upstream catchment area from the corresponding dam is also computed to quantify the relative size of the cumulative storage capacity of dams within an RFC region. These metrics are normalized by the corresponding RFC regional area so the potential hydrologic impact and hazard potential assessment of the dams and reservoirs can be directly compared across the 12 RFC regions.
2.3. Detection of the Dams within a River Forecast Center (RFC) Region
The original NID database includes detailed information about dams and reservoirs. In this report, a key challenge was to identify which of the 75,501 dams are located inside the boundaries of the 12 RFC areas. The shapefiles of the 12 RFC River basins and the geographical information (longitude and latitude) of 75,501 NID-registered dams were used to identify which dams are inside the RFC area boundaries; it took 906,012 iterations (12 RFC basins × 75,501 dams). The NCAR Common Language (NCL) function “gc_inout.ncl” was used to perform these iterations [25]. The NCL codes are available upon request to the corresponding author.
2.4. Economic Benefits in Each RFC Region
To assess the potential economic value of water stored in the existing dams within each RFC region, this study followed the methodologies that were used by [6]. Their study estimated the monetary value of freshwater, per acre-ft of volume, based on the purpose they served. This method was also used in a previous study [7] for the national-scale economic assessment. This study updated the economic and hazard assessment using the 2018 NID database, including 91,191 dams over the CONUS. In this study, we calculate the marginal cost of freshwater to the cumulative economic benefits of existing dams in each RFC region, using the accumulated storage capacity and purpose of dams and 12 RFC geographical information such as the total number of the dams in a region. The result for the value of freshwater by purpose was then adjusted for inflation using the Bureau of Labor’s Consumer Price Index (CPI) calculator (https://www.bls.gov/news.release/cpi.toc.htm for January 2019 accessed on 4 June 2019).
For the large-scale assessment, we simplified the economic impact assessment as a function of storage volume; however, it can depend strongly on their operations and authorized purposes along with the geographic and economic text of their own designed purpose. Furthermore, the implication that the cost of a dam failure is equal to the loss of these (average) benefits is also limited, failing to account for the damage and potential loss of life from the dam failure itself. However, more information about dam structures and operation policy and the size of exposed community to dam breach-related potential hazards are required to assess the detailed assessment of dam-related risk and impact. Some information for dams are not still publicly accessible due to the security issue and private ownership. In this study, our focus is the large-scale assessment for risk and impact assessment of the existing dams in the U.S. A further study of a site-specific assessment with detailed information about dam operation and water demand is critical at the local scale, which is, however, beyond this study.
3. Results
The 2018 NID database shows a slight increase in the total number of dams within the 12 RFC regions compared with the previous report [7] (Table 1). The numbers of dams within the 12 RFC areas range from 1700 dams within the California RFC area (2% of the total dams) to 20,345 dams for the Missouri RFC region (27%). The cumulative maximum storage capacities of the dams within the 12 RFC regions range from 19,400 million cubic meters (15.7 million acre-ft; Mid-Atlantic) to 418 billion cubic meters (338.4 million acre-ft; North Central). In the North Central RFC area, there are the Soo Locks, a set of parallel locks, which has a reported maximum storage of over 334 billion cubic meters (270 million acre-ft). In recent years, the locks serve 10,000 vessels per year including small passenger vessels and workboats to large ships [19]. Over the 12 RFC regions, the ratios of the cumulative storage capacity to the long-term averaged precipitation range from 8% (Mid-Atlantic) to 50% (Colorado), which indicates that the significant human disturbance, particularly due to dam construction.
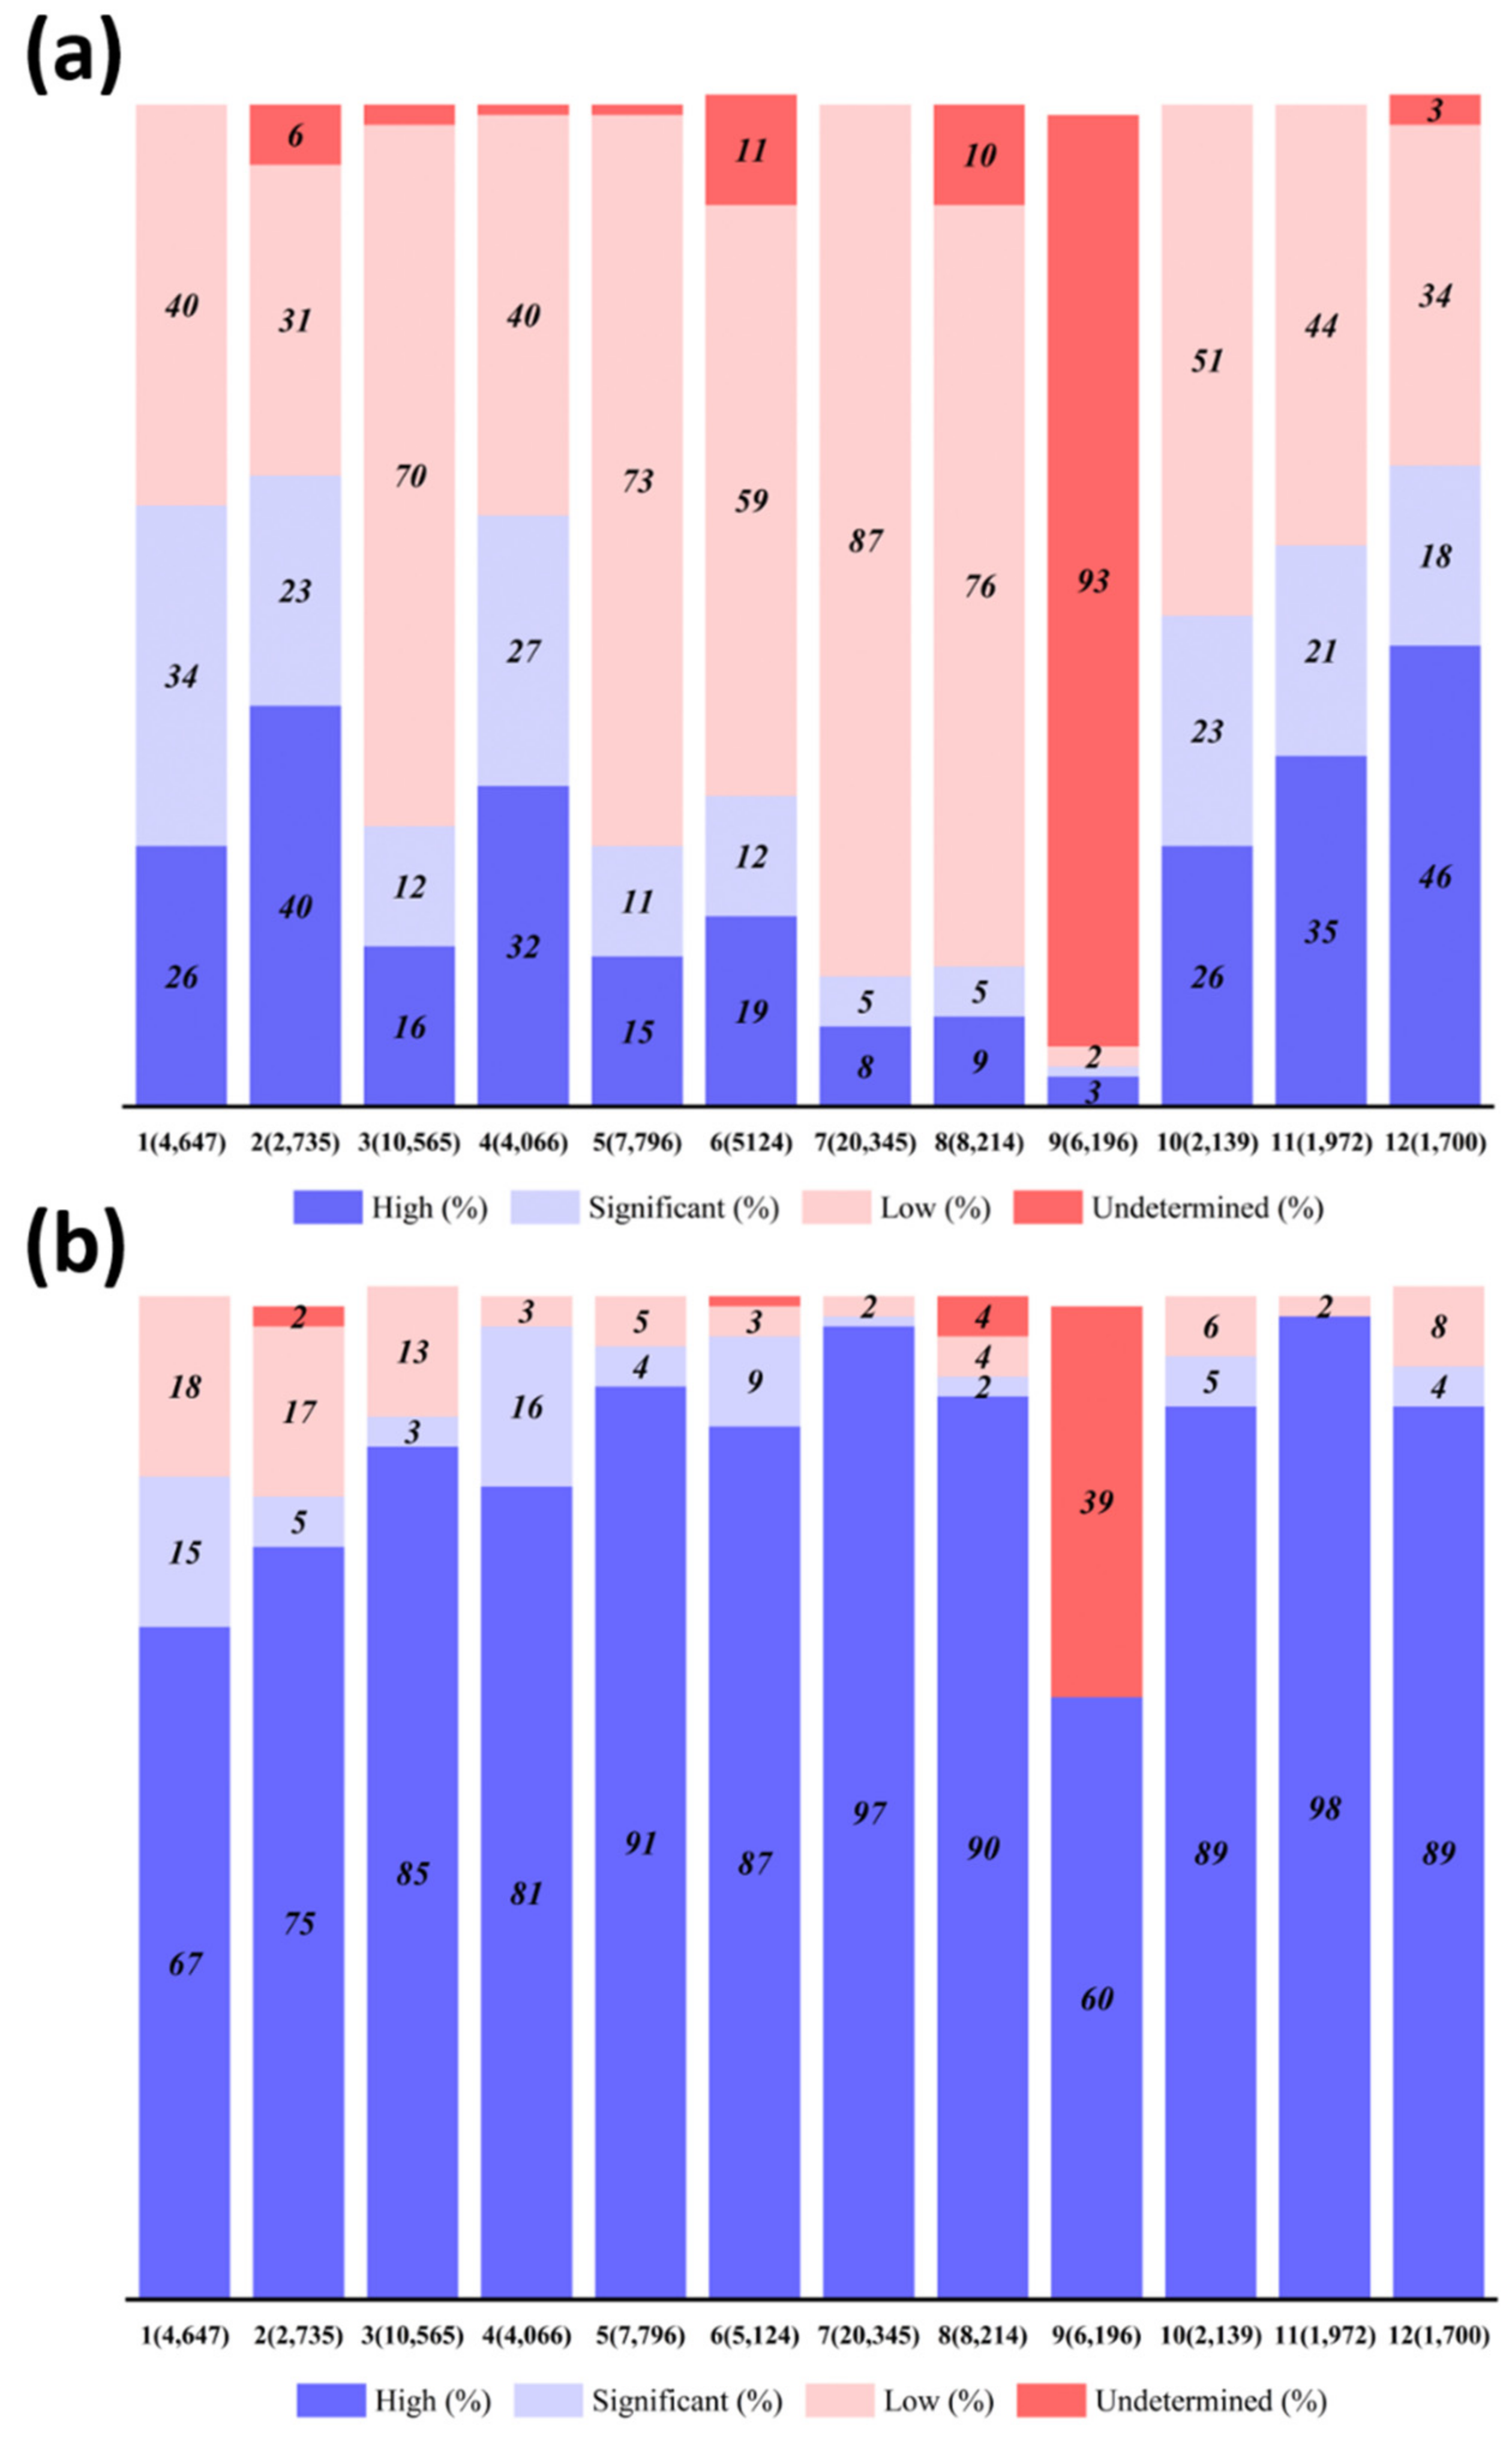
Figure 1 shows the percentages of the total dams by the four levels of hazard potential (High, Significant, Low, Undetermined, and Missing) in terms of both the area per dam and the cumulative storage per RFC region. From the area per dam indices, the percentage of dams with high hazard potential ranges from 3% (West Gulf) to 46% (California). However, 93% of the total dams (5776 out of the 6197 dams) have an undetermined level of hazard potential in the West Gulf RFC area. 93% of the total dams over the West Gulf RFC area are equivalent to 39% of the regional cumulative storage. The Missouri and Arkansas RFC areas have the second and third lowest percentages of dams with high hazard potential (8% and 9%, respectively). It is worth noting that most of the RFC regions except for the West Gulf and Northeast RFC areas show that 75% of the cumulative storage or more is under high hazard potential. The Missouri RFC basin shows a noticeable change such that the second-lowest percentage (8%) of the dams with high hazard potential becomes the highest percentage (97%) of the cumulative storage per dam. This result indicates that the dams with high hazard potential in the Missouri RFC area are the large dams.
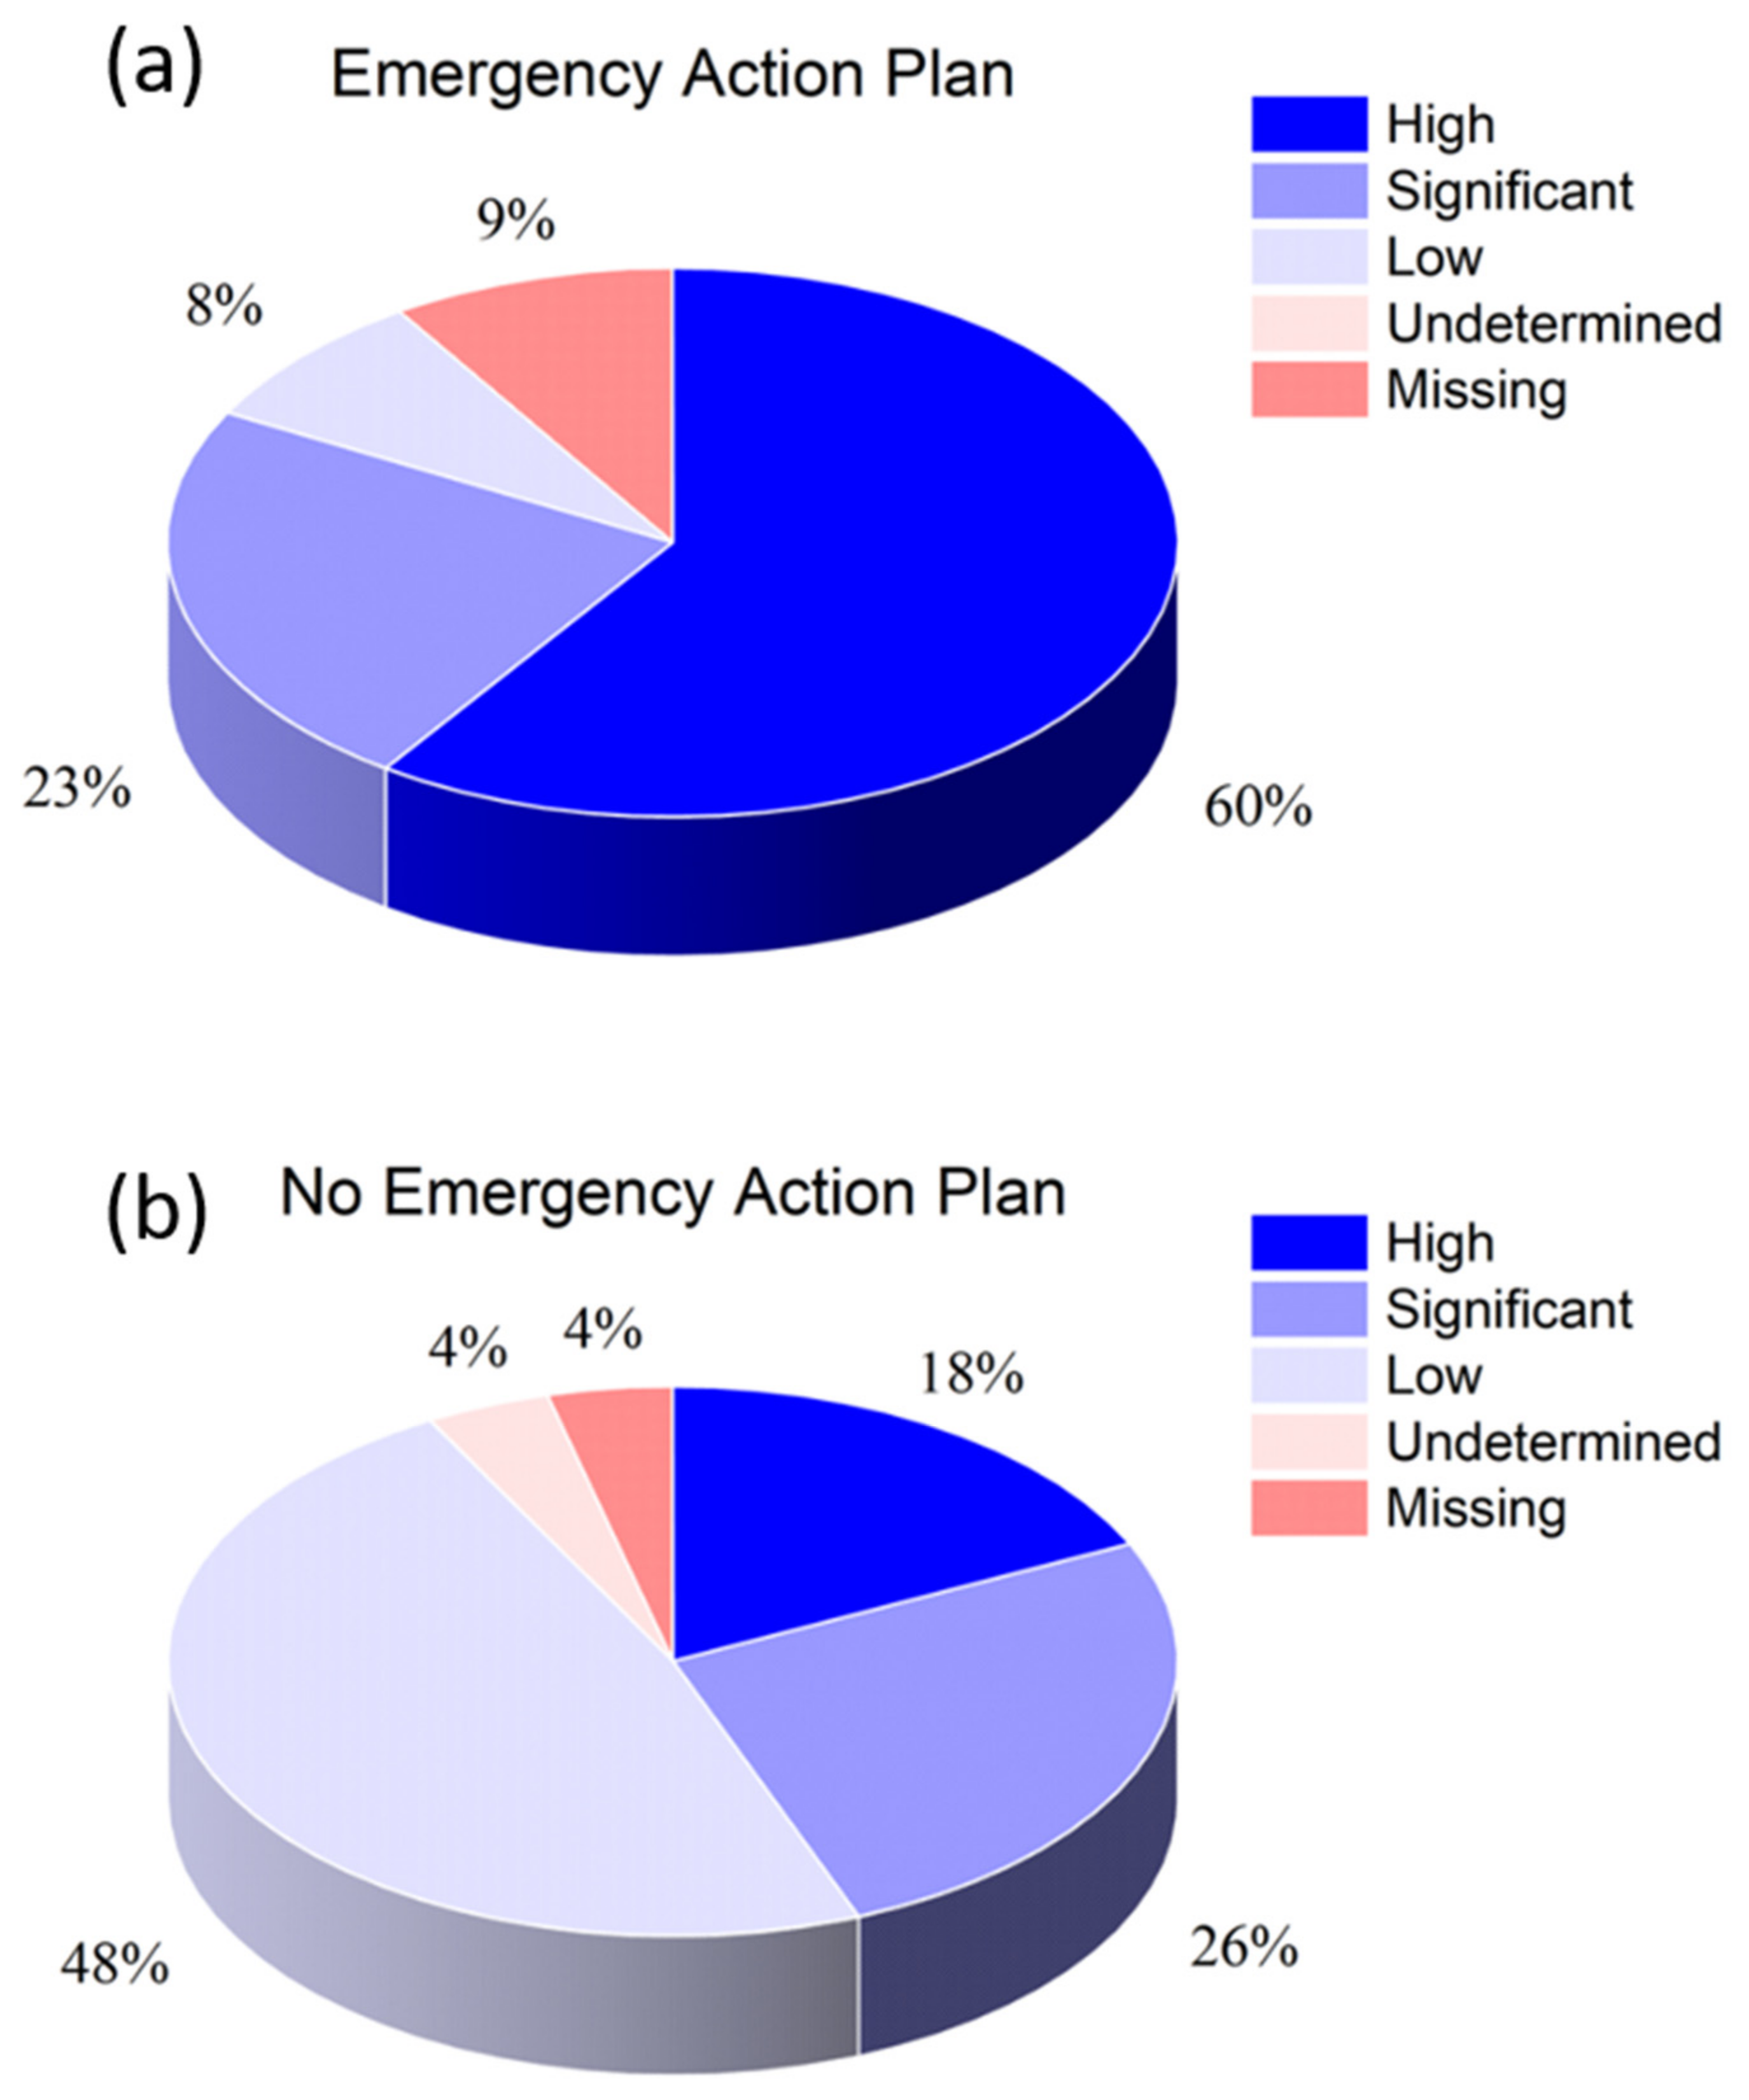
Over the CONUS, 30% of the dams (23,386 out of 75,501) are supposed to have an Emergency Action Plan (EAP) (Table 2); 67% of these dams have an EAP program while the rest of the dams have no EAP. The percentage of the EAP-required dams but with no EAP ranges from 10% (Colorado; well prepared) to 61% (Southeast; poorly prepared) across the RFC regions. It is worth noting that the Southeast RFC area includes the state of Alabama which has 2273 dams but does not have a state-level dam safety program, raising concern for public safety related to dam breaches in the Southeast RFC area, particularly in Alabama. Over the CONUS, 18% and 26% of the dams that have no EAP have a high and significant hazard, respectively, while 82% of the dams that have an EAP have high or significant hazard potential (Figure 2).
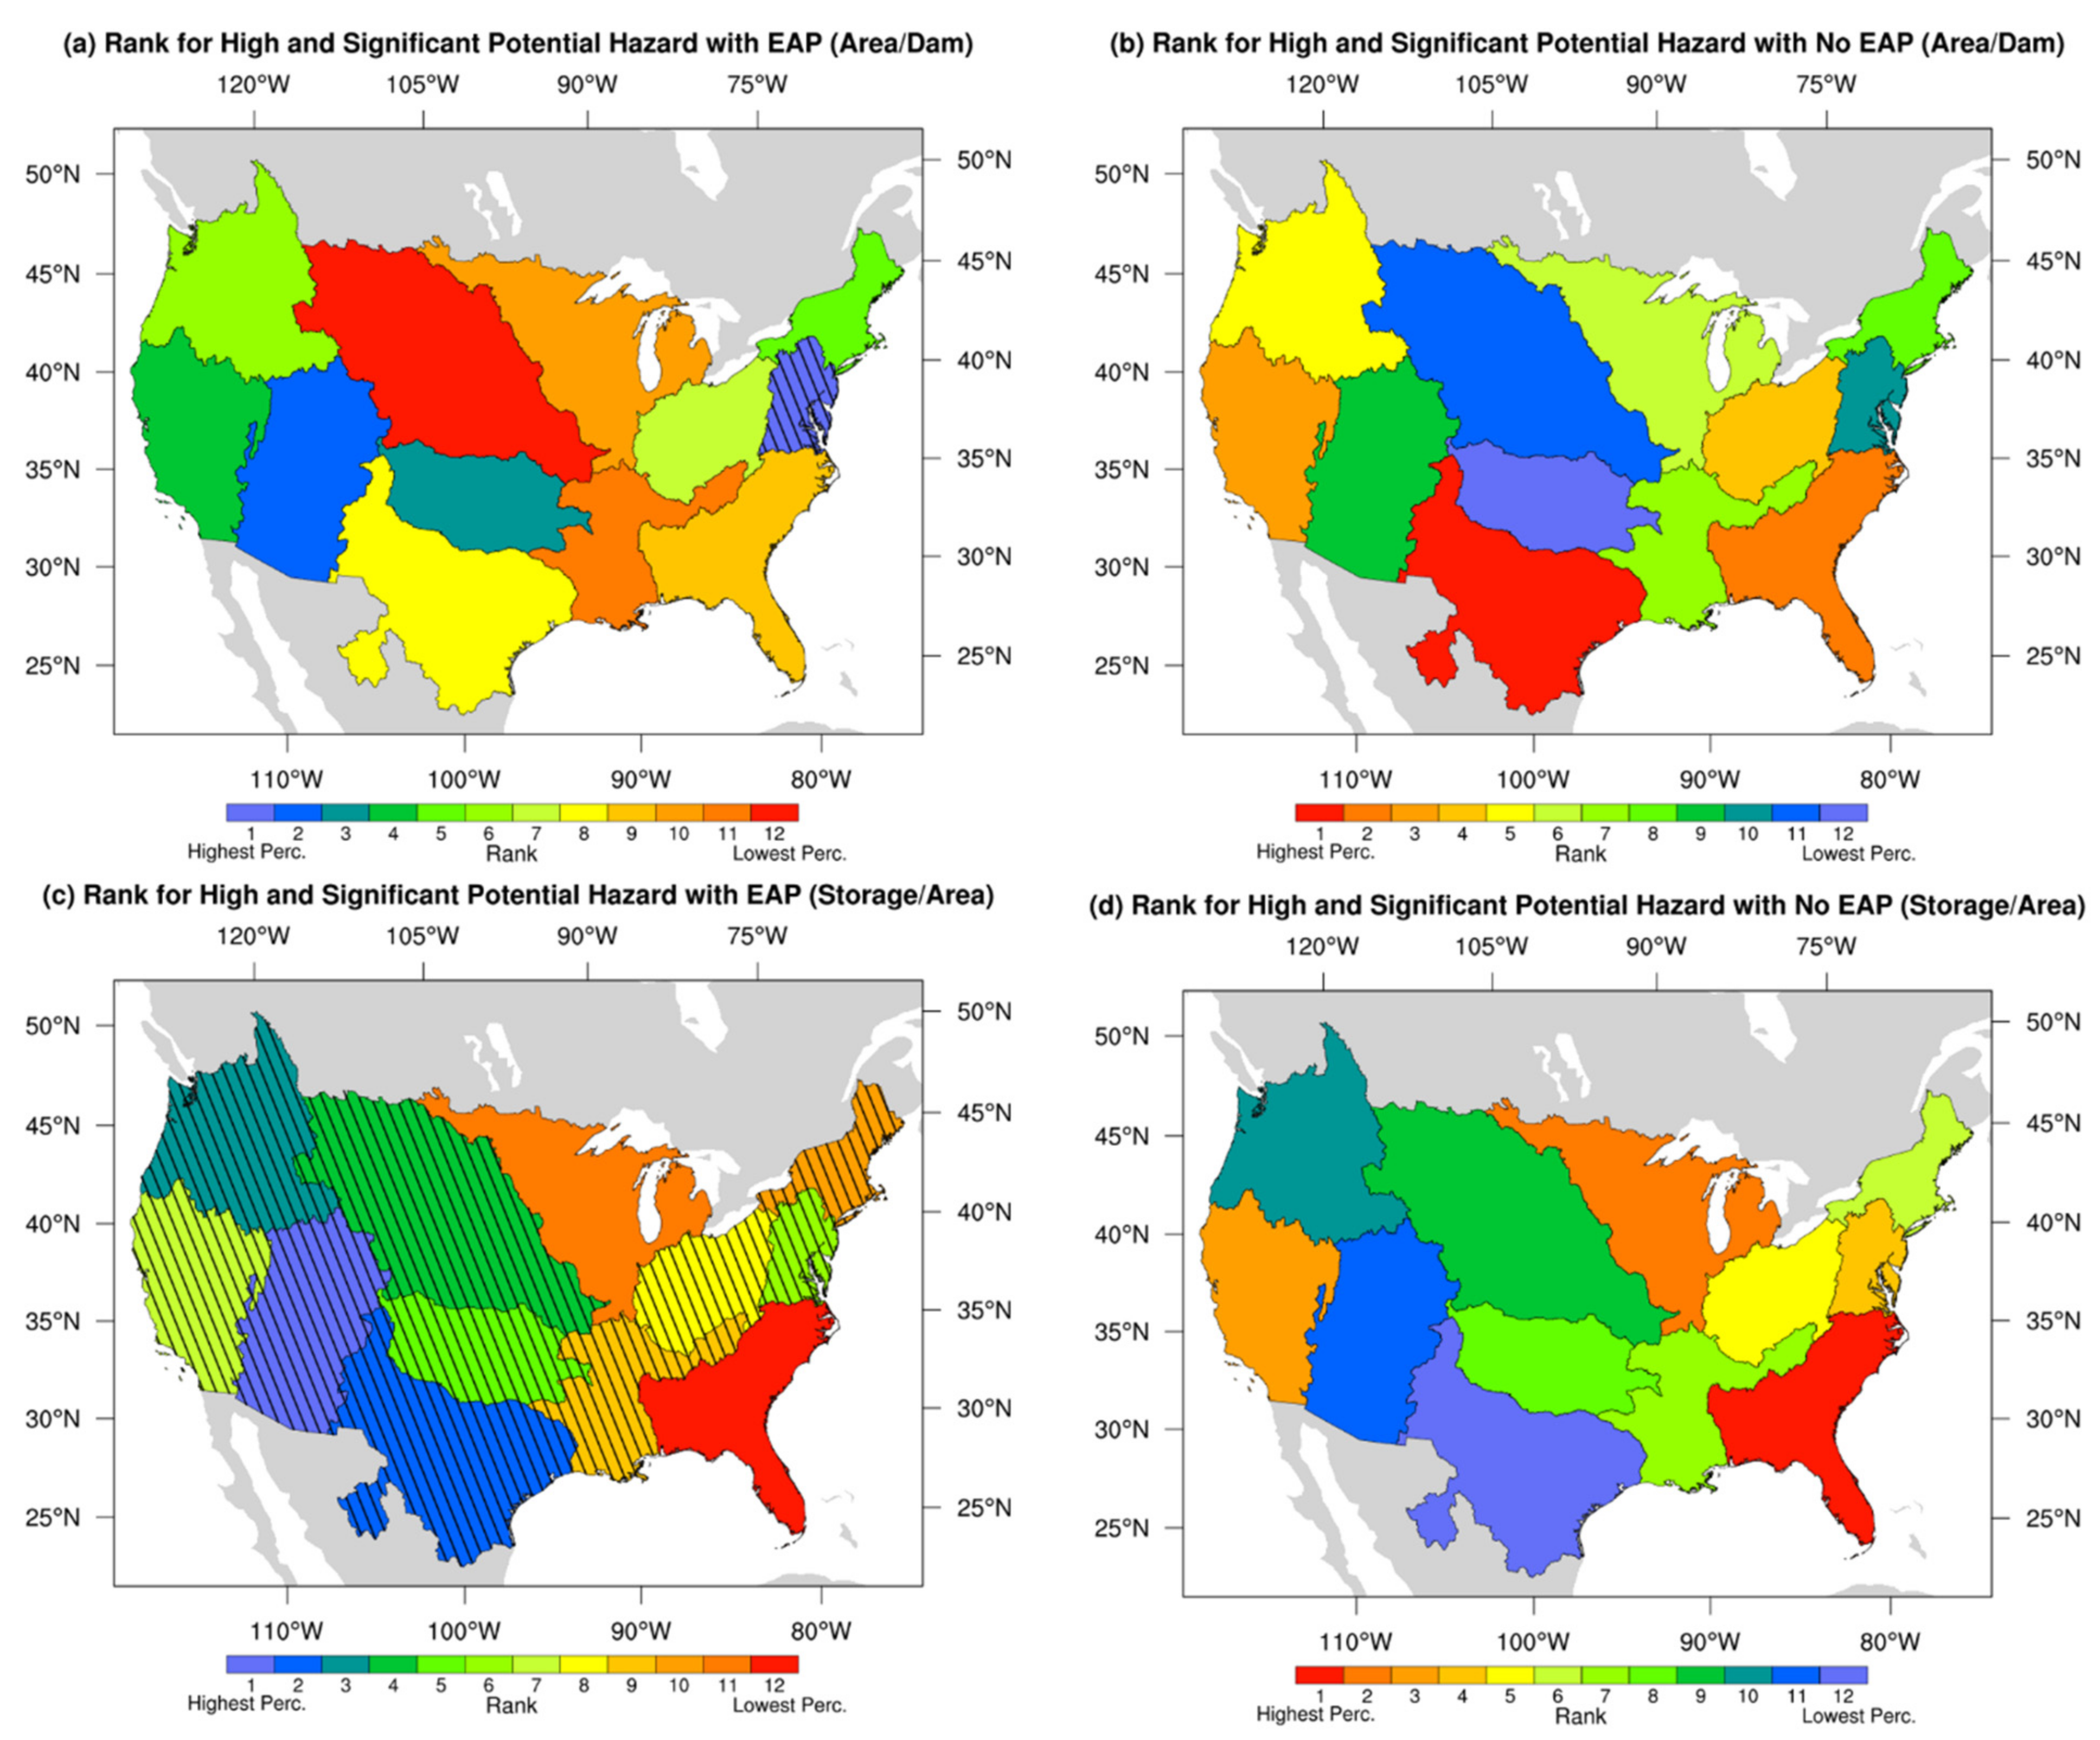
The ranks for the NID-registered dams that have an EAP and are designated high or significant hazard potential are shown in Figure 3. The ranks are based on the indices of the upstream area per dam and the cumulative storage per area. It is only the Mid-Atlantic RFC area that shows that 90% of the EAP-required dams have an EAP, in terms of both the upstream catchment area per dam and cumulative storage per area, indicating that this region is well prepared for dam failure. Over the North Central and Southeast RFC areas, less than 90% of the EAP-required dams have an EAP, based on the cumulative storage per area. The Southeast RFC area has the most cumulative storage per dam that has either high or significant hazard potential, regardless of the absence of an EAP (Figure 3c,d).
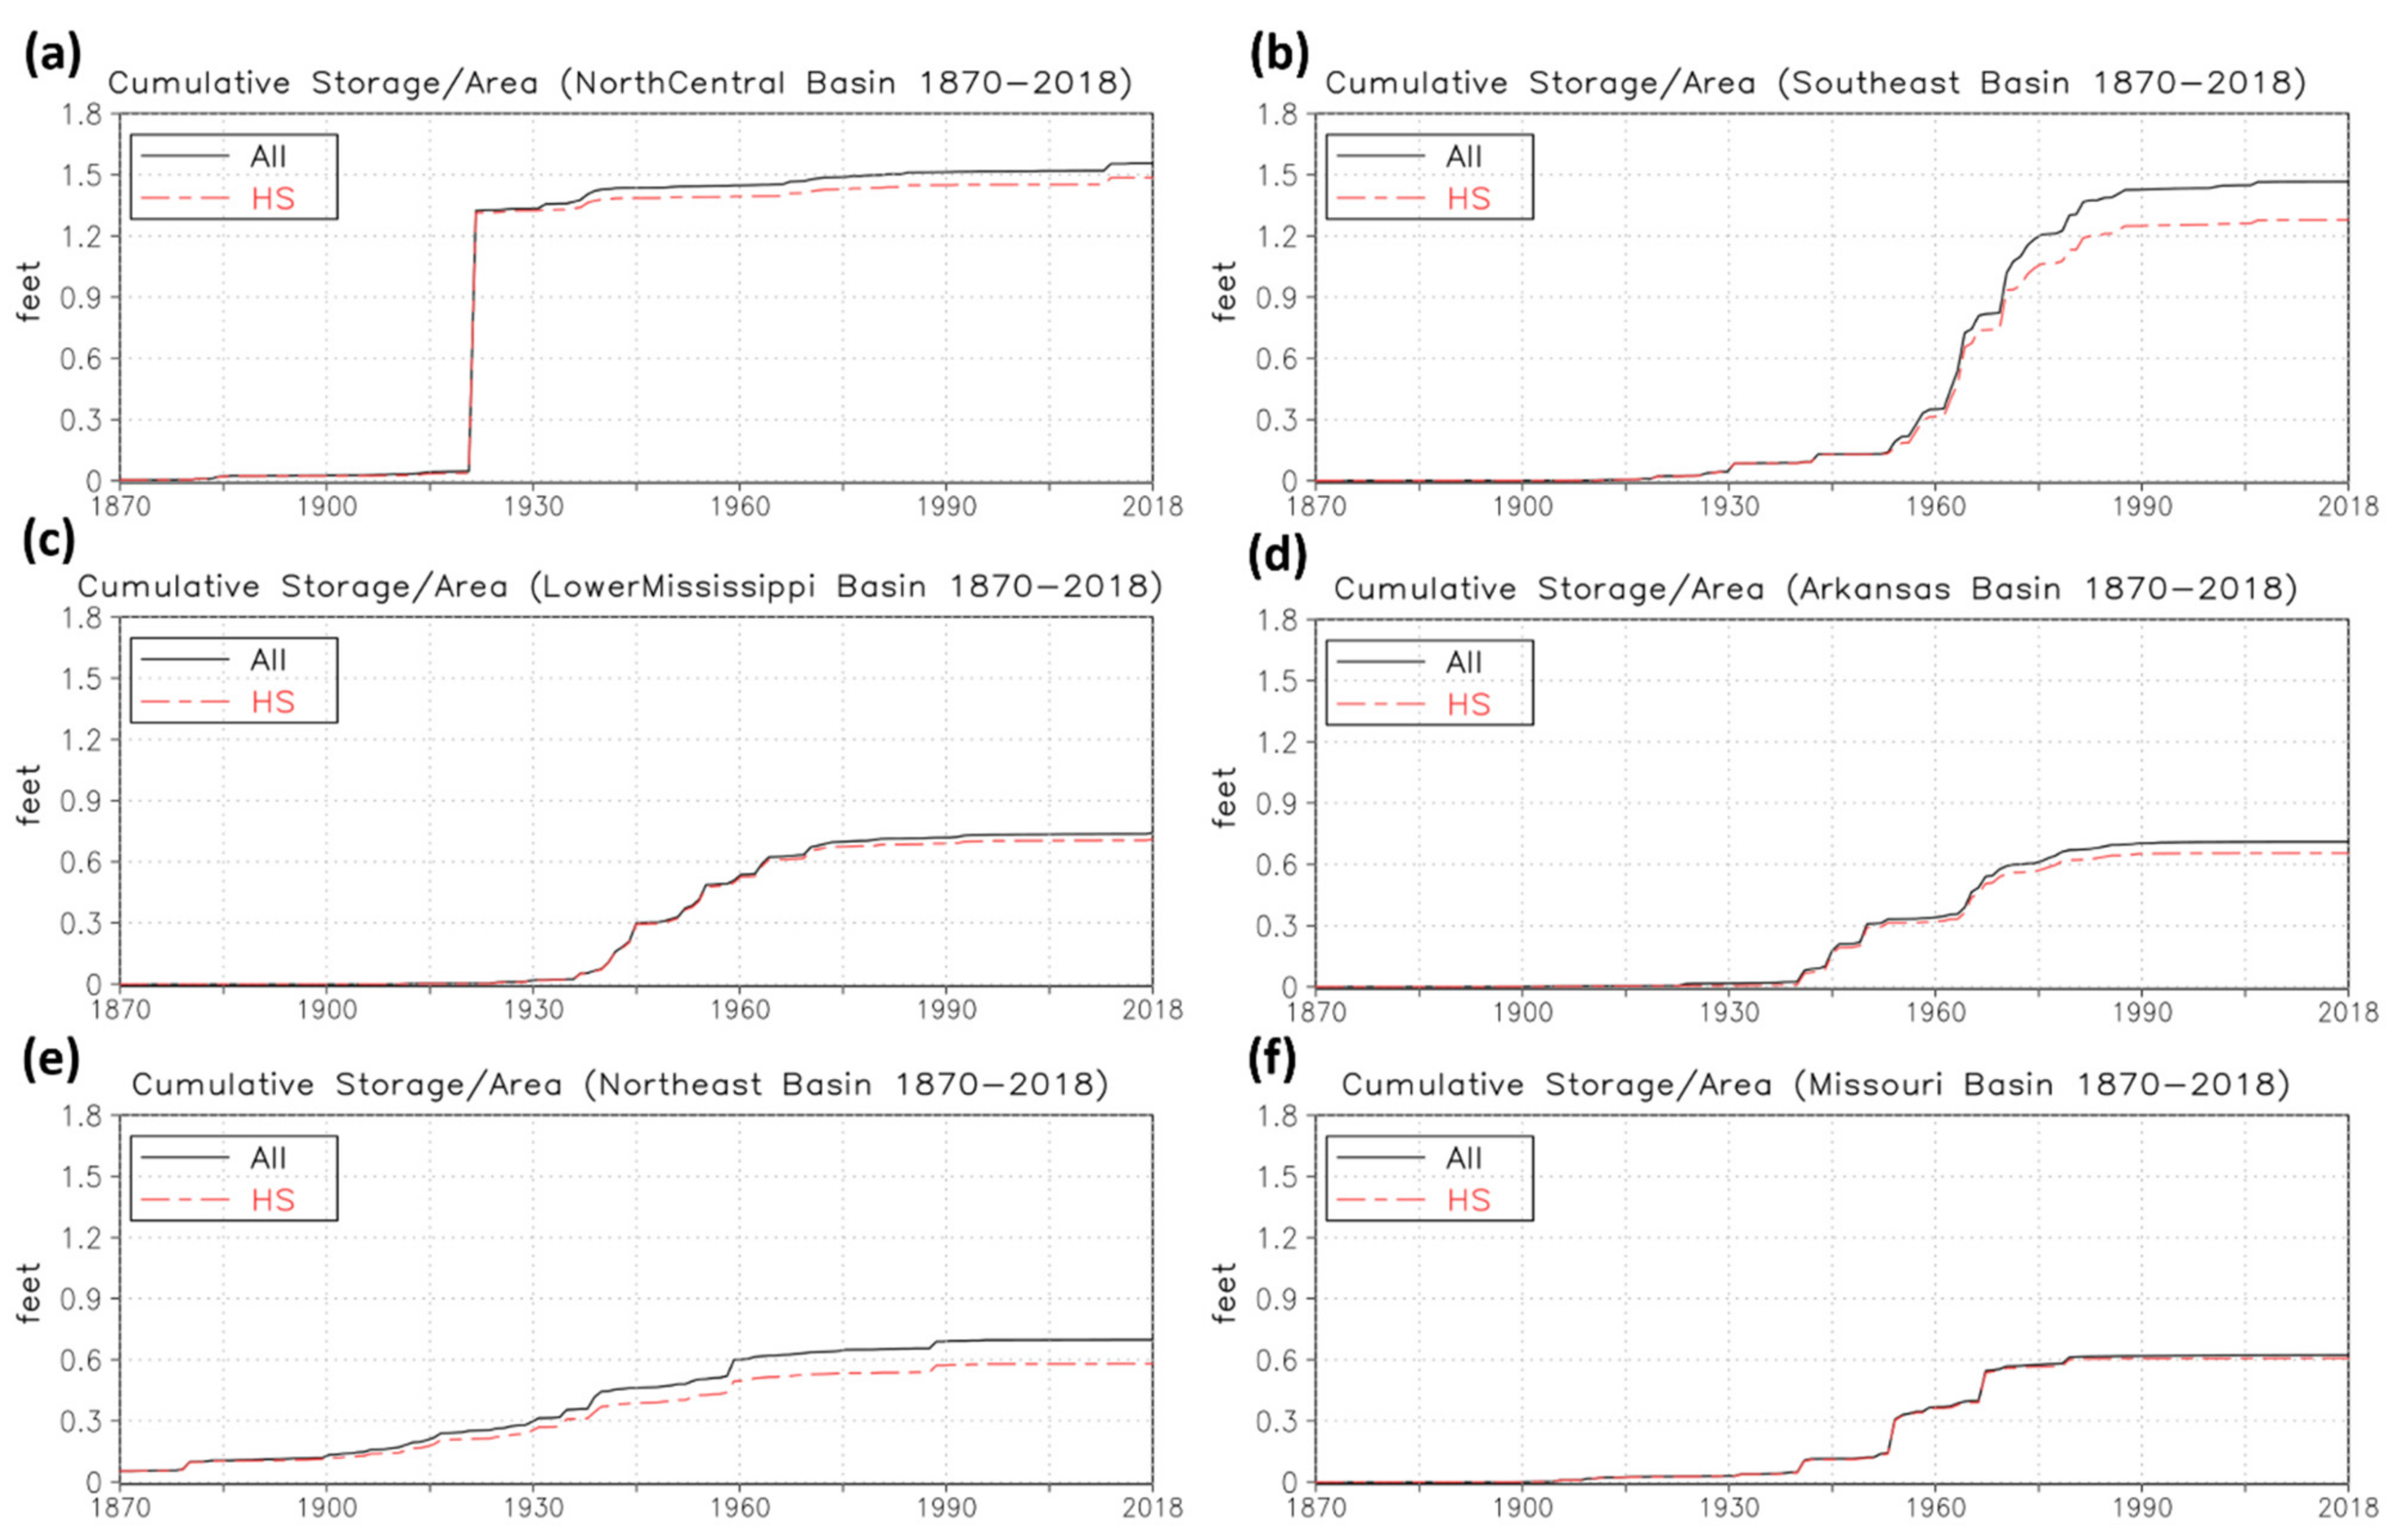
Classified hazard potentials in the 2018 NID database account only for the consequences of a dam failure, not the current condition of a dam failure. The conventional methods of the likelihood estimation of dam failure have been based on stationarity theory, which means that a record-breaking event is unlikely to happen year after year post-completion of dam construction [26]. However, structures are aging and are significantly damaged during the occurrence of extreme events such as floods, droughts, and heatwaves. As a dam gets older, the maintenance of the structure is crucial for public safety and community resilience. We computed the annual time series of cumulative storage per the upstream catchment area over the 12 RFC regions to understand the temporal patterns of dam construction over the 12 RFC areas and identify which regions are at the risk in terms of the age of dams (Figure 4 and Figure 5).
The total maximum reservoir storage capacity in the CONUS increased rapidly in the 1950s and 1960s, and additional dams have not been built since 2000 except in the North Central and Southeast RFC areas. However, the growth of dam construction shows a different trend across the 12 RFC regions over time. The eastern U.S., including Northeastern, Mid-Atlantic, and Southeast RFC regions, shows a rapid increase in the cumulative storage per the upstream catchment area during a relatively short period (1950–1970), while the dams in the northern part of the CONUS such as the North Central, Northeast, Northwest, and California regions were constructed consistently from the 1880s through the 1980s. The eastern U.S. regions are more likely to have a higher chance of structural failure or dam malfunction and are where more dam failure occurrences have been reported since 1991 (Association of State Dam Safety Officials, 2013). These gradual and rapid increases in the dam construction patterns are consistent with the growth trends of the dams with high and significant hazard potential. Our findings are in line with the findings of a previous study [7].
Table 3 shows the cumulative economic benefits from the existing dams across the 12 RFC regions. Over the CONUS, the average of the potential economic benefits per dam is 0.8 million dollars. The RFC regions with the top four highest economic benefits (greater than one million dollars) include Colorado (1st highest), Northwest (2nd), West Gulf (3rd), and California (4th) while the RFC regions with the bottom four lowest economic benefits (less than half-million dollars) include Southeast (9th), Mid-Atlantic (10th), Missouri (11th), and Northeast (12th). The RFC regions with high benefits from existing dams are more vulnerable to climate change-driven droughts [27,28,29,30], which suggests the economic value of fresh water is expected to increase in the future while the RFC regions with low benefits are water-ample due to diverse precipitation generating mechanisms (e.g., tropical cyclones, convective systems, frontal systems, etc.). The results imply that the value of the existing dams becomes more critical for water resource management over drought-prone regions.
4. Conclusions
In this study, we succeeded to harness the 2018 NID database in order to assess the spatiotemporal patterns of the potential hydrologic impact of the exiting dams in the U.S. We found that the cumulative maximum storage capacities of the 12 RFC river basins ranged between 8% in the Mid-Atlantic and 50% in Colorado of the long-term averages of annual precipitation, which is no longer negligible in the regional land surface water balance. According to our assessment of dam failure-related hazard potential, the Mid-Atlantic and Colorado RFC regions are well prepared for potential hazards (90% of the EAP-required dams with EAPs) while the Southeast RFC region is at the highest risk for potential hazards among the 12 RFC river basins, due to poor preparation in terms of the EAPs. Since the 1950s, cumulative storage capacity in the Southeast and Missouri regions has rapidly increased along with the number of dams with high or significant hazard potential, which raises a concern about community resilience to dam failure. In addition, recent extreme weather such as hurricanes and atmospheric river-driven floods over the U.S. have caused several dam crises, such as the Oroville Dam crisis in February 2017 and Hurricane Harvey in August 2017 [31]. Dam failure/crisis will exacerbate adverse effects of an unprecedented extreme event and cause a longer recovery time for the community. The findings of this study suggest a need to develop and improve a regional-specific dam safety program across the 12 RFC regions.
We found that the existing dams have been a vital resource of the nation’s river systems, not only for water supply but also other uses such as navigation and flood control. Due to the aging of dams and reservoirs, however, the development of a comprehensive dam safety program is crucial for preserving the benefits to our daily lives from existing dams. For the preparedness of potential dam failures, most of the 12 RFC regions are at a high level of hazard risk due to potential failure or malfunction of the existing dams. The results of the economic assessment of the existing dams found that the national average potential economic benefit per dam is 0.8 million dollars with a wide range between $0.2 and $6 million. The top four RFC regions with the highest economic benefits experience a higher risk of drought in the future, causing a higher level of vulnerability to water scarcity/crisis.
The dam safety program should consist of dam inspection and rehabilitation programs (proactive), emergency action plans (reactive), and recovery plans (post-active). For the first step of the improvement of the dam safety program in the U.S., the Emergency Action Plan program for all the NID-registered dams at high hazard potential is mandatory, and then secondary efforts should be transitioned toward proactive and post-active approaches to increase public safety and community resilience to dam-related hazard potential. The comprehensive dam safety program can secure the economic benefits from the existing dams and make our environment safer and more sustainable.
Author Contributions
J.S., conceptualization, data analysis, original draft preparation, review and editing; M.S., data analysis, original draft preparation, review and editing; J.K., conceptualization, review and editing, funding acquisition. All authors have read and agreed to the published version of the manuscript.
Funding
The APC was funded by the POSTECH Seed grant. J.S. was supported by the Alabama Transportation Institute at the University of Alabama.
Institutional Review Board Statement
Not applicable.
Informed Consent Statement
Not applicable.
Data Availability Statement
Some data, models, or code that support the findings of this study are available from the corresponding author upon reasonable request. Some or all data, models, or code used during the study were provided by a third party. Direct requests for these materials may be made to the provider as indicated in the Acknowledgements.
Acknowledgments
The authors thank the U.S. Army Corp of Engineers for providing the National Inventory of Dams. This study was made possible in part by a grant of high-performance computing resources and technical support from the Alabama Supercomputer Authority. This study was partially supported by the POSTECH Seed Grant. The lists and information of the NID-registered dams within the 12 RFC areas are available upon request.
Conflicts of Interest
The authors declare no conflict of interest.
References
- Hurst, H.E. Long-term storage capacity of reservoirs. Trans. Am. Soc. Civ. Eng. 1951, 116, 770–799. [Google Scholar] [CrossRef]
- Ward, J.V. Effects of flow patterns below large dams on stream benthos: A review. Instream Flow Needs Symp. 1976, 2, 235. Available online: https://scholarworks.umass.edu/fishpassage_conference_proceedings/247 (accessed on 25 August 2020).
- Vörösmarty, C.J.; Sahagian, D. Anthropogenic disturbance of the terrestrial water cycle. BioSci. Am. Inst. Biol. Sci. 2020, 50, 753–765. [Google Scholar] [CrossRef] [Green Version]
- Degu, A.M.; Hossain, F.; Niyogi, D.; Pielke, R.; Shepherd, J.M.; Voisin, N.; Chronis, T. The influence of large dams on surrounding climate and precipitation patterns. Geophys. Res. Lett. 2011, 38. [Google Scholar] [CrossRef]
- Turvey, R. Analyzing the marginal cost of water supply. Land Econ. 1976, 52, 158. [Google Scholar] [CrossRef]
- Frederick, K.; VandenBerg, T.P.; Hanson, J. Economic Values of Freshwater in the United States, Discussion Paper 97-03. 1996. Available online: https://ageconsearch.umn.edu/record/10736/ (accessed on 25 August 2020).
- Graf, W.L. Dam nation: A geographic census of American dams and their large-scale hydrologic impacts. Water Resour. Res. 1999, 35, 1305–1311. [Google Scholar] [CrossRef]
- American Society of Civil Engineers. 2017 Report Card for America’s Infrastructure. 2017. Available online: https://www.infrastructurereportcard.org/wp-content/uploads/2016/10/2017-Infrastructure-Report-Card.pdf (accessed on 25 August 2020).
- Baecher, G.B.; Paté, M.E.; De Neufville, R. Risk of dam failure in benefit-cost analysis. Water Resour. Res. 1980, 16, 449–456. [Google Scholar] [CrossRef]
- Lee, B.S.; You, G.J.Y. An assessment of long-term overtopping risk and optimal termination time of dam under climate change. J. Environ. Manag. 2013, 121, 57–71. [Google Scholar] [CrossRef]
- Milly, P.C.D.; Betancourt, J.; Falkenmark, M.; Hirsch, R.M.; Kundzewicz, Z.W.; Lettenmaier, D.P.; Stouffer, R.J. Stationarity Is Dead: Whither Water Management? Science 2008, 319, 573–574. [Google Scholar] [CrossRef]
- Hossain, F.; Degu, A.M.; Yigzaw, W.; Burian, S.; Niyogi, D.; Shepherd, J.M.; Pielke, R. Climate feedback–based provisions for dam design, operations, and water management in the 21st century. J. Hydrol. Eng. 2012, 17, 837–850. [Google Scholar] [CrossRef]
- Conker, A.; Hussein, H. Hydraulic mission at home, hydraulic mission abroad? Examining Turkey’s regional ‘pax-aquarum’and its limits. Sustainability 2019, 11, 228. [Google Scholar] [CrossRef] [Green Version]
- Conker, A.; Hussein, H. Hydropolitics and issue-linkage along the Orontes River Basin: An analysis of the Lebanon–Syria and Syria–Turkey hydropolitical relations. Int. Environ. Agreem. Polit. Law Econ. 2020, 20, 103–121. [Google Scholar] [CrossRef] [Green Version]
- He, T.; Deng, Y.; Tuo, Y.; Yang, Y.; Liang, N. Impact of the dam construction on the down-stream thermal conditions of the Yangtze River. Int. J. Environ. Res. Public Health 2020, 17, 2973. [Google Scholar] [CrossRef]
- Lin, X.; Huang, G.; Piwowar, J.M.; Zhou, X.; Zhai, Y. Risk of hydrological failure under the com-pound effects of instant flow and precipitation peaks under climate change: A case study of Mountain Island Dam, North Carolina. J. Clean. Prod. 2021, 284, 125305. [Google Scholar] [CrossRef]
- Wohl, E. Rivers in the Anthropocene: The US perspective. Geomorphology 2018, 106600. [Google Scholar] [CrossRef]
- Fergus, C.E.; Brooks, J.R.; Kaufmann, P.R.; Pollard, A.I.; Herlihy, A.T.; Paulsen, S.G.; Weber, M.H. National framework for ranking lakes by potential for anthropogenic hydro-alteration. Ecol. Indic. 2021, 122, 107241. [Google Scholar] [CrossRef]
- USACE—U.S Army Corps of Engineers. National Inventory of Dams. 2018. Available online: http://nid.usace.army.mil/cm_apex/f?p=838:12:9728040732909 (accessed on 15 January 2020).
- Hussein, H.; Conker, A.; Grandi, M. Small is beautiful but not trendy: Understanding the allure of big hydraulic works in the Euphrates-Tigris and Nile waterscapes. Mediterr. Politics 2020, 1–24. [Google Scholar] [CrossRef]
- Swyngedouw, E. Chronicle of a Death Foretold: The Failure of Early Twentieth-Century Hydraulic Modernization. In Liquid Power: Contested Hydro-Modernities in Twentieth-Century Spain; MIT Press: Cambridge, MA, USA; London, UK, 2015; pp. 67–98. [Google Scholar] [CrossRef]
- Keys, P.W.; Galaz, V.; Dyer, M.; Matthews, N.; Folke, C.; Nyström, M.; Cornell, S.E. Anthropocene risk. Nat. Sustain. 2019, 2, 667–673. [Google Scholar] [CrossRef]
- FEMA. Dam Safety in the United States: A Progress Report on the National Dam Safety Program FY2008-International Water Power and Dam Construction. 2013. Available online: http://www.csa.com/partners/viewrecord.php?requester=gs&collection=TRD&recid=200154001798MT (accessed on 25 August 2020).
- Prat, O.P.; Nelson, B.R. Evaluation of precipitation estimates over CONUS derived from satellite, radar, and rain gauge data sets at daily to annual scales (2002–2012). Hydrol. Earth Syst. Sci. 2015, 19, 2037–2056. [Google Scholar] [CrossRef] [Green Version]
- Mini-Language Reference. NCAR command language. Natl. Center Atmos. Res. 2013, 1–2. [Google Scholar] [CrossRef]
- Munger, D.F.; Bowles, D.S.; Boyer, D.D.; Davis, D.W.; Margo, D.A.; Moser, D.A.; Snorteland, N. Interim Tolerable Guidelines for US Army Corps of Engineers Dams. Proceedings of the 2009 USSD Annual Lecture. 2009. Available online: https://www.researchgate.net/publication/267953850 (accessed on 25 August 2020).
- Milly, P.C.; Dunne, K.A. Colorado River flow dwindles as warming-driven loss of reflective snow energizes evaporation. Science 2020, 367, 1252–1255. [Google Scholar] [CrossRef]
- Rogers, B.M.; Neilson, R.P.; Drapek, R.; Lenihan, J.M.; Wells, J.R.; Bachelet, D.; Law, B.E. Impacts of climate change on fire regimes and carbon stocks of the U.S. Pacific Northwest. J. Geophys. Res. Space Phys. 2011, 116. [Google Scholar] [CrossRef] [Green Version]
- Cook, B.I.; Ault, T.R.; Smerdon, J.E. Unprecedented 21st century drought risk in the American Southwest and Central Plains. Sci. Adv. 2015, 1, e1400082. [Google Scholar] [CrossRef] [Green Version]
- Swain, D.; Tsiang, M.; Haugen, M.; Singh, D.; Charland, A.; Rajaratnam, B.; Diffenbaugh, N. The extraordinary California drought of 2013/2014: Character, context, and the role of climate change. Bull. Am. Meteorol. Soc. 2014, 95, S3. [Google Scholar]
- Vano, J.A.; Miller, K.; Dettinger, M.D.; Cifelli, R.; Curtis, D.; Dufour, A.; Olsen, J.R.; Wilson, A.M. Hydroclimatic extremes as challenges for the water management community: Lessons from oroville dam and hurricane harvey. Bull. Am. Meteorol. Soc. 2019, 100, S9–S14. [Google Scholar] [CrossRef] [Green Version]
Figure 1.
Percentages of the area per dam (a) and the cumulative storage per area (b) over the 12 RFC areas for the four different levels of potential hazard: high, significant, low, and undetermined.
Figure 1.
Percentages of the area per dam (a) and the cumulative storage per area (b) over the 12 RFC areas for the four different levels of potential hazard: high, significant, low, and undetermined.

Figure 2.
Percentages of dams with and without Emergency Action Plans ((a,b), respectively) at the high, significant, and low hazard potential over the CONUS.
Figure 2.
Percentages of dams with and without Emergency Action Plans ((a,b), respectively) at the high, significant, and low hazard potential over the CONUS.

Figure 3.
Ranks for high and significant hazard potential with and without EAPs in terms of the area per dam (a,b) and cumulative storage per area (c,d). Hatched areas depict the RFC areas that have 90% or more of the area per dam or cumulative storage per area that are classified into high or significant hazard potential and have an EAP.

Figure 4.
Annual time series of the cumulative storage per area (1870–2018) of the dams with all the types of hazard potential (All; black solid lines) and only high and significant hazard potential (HS; red dashed lines) over the North Central (a), Southeast (b), Lower Mississippi (c), Arkansas (d), Northeast (e), and Missouri (f) RFC areas. For the SI unit conversion, one foot is 30.48 centimeters.

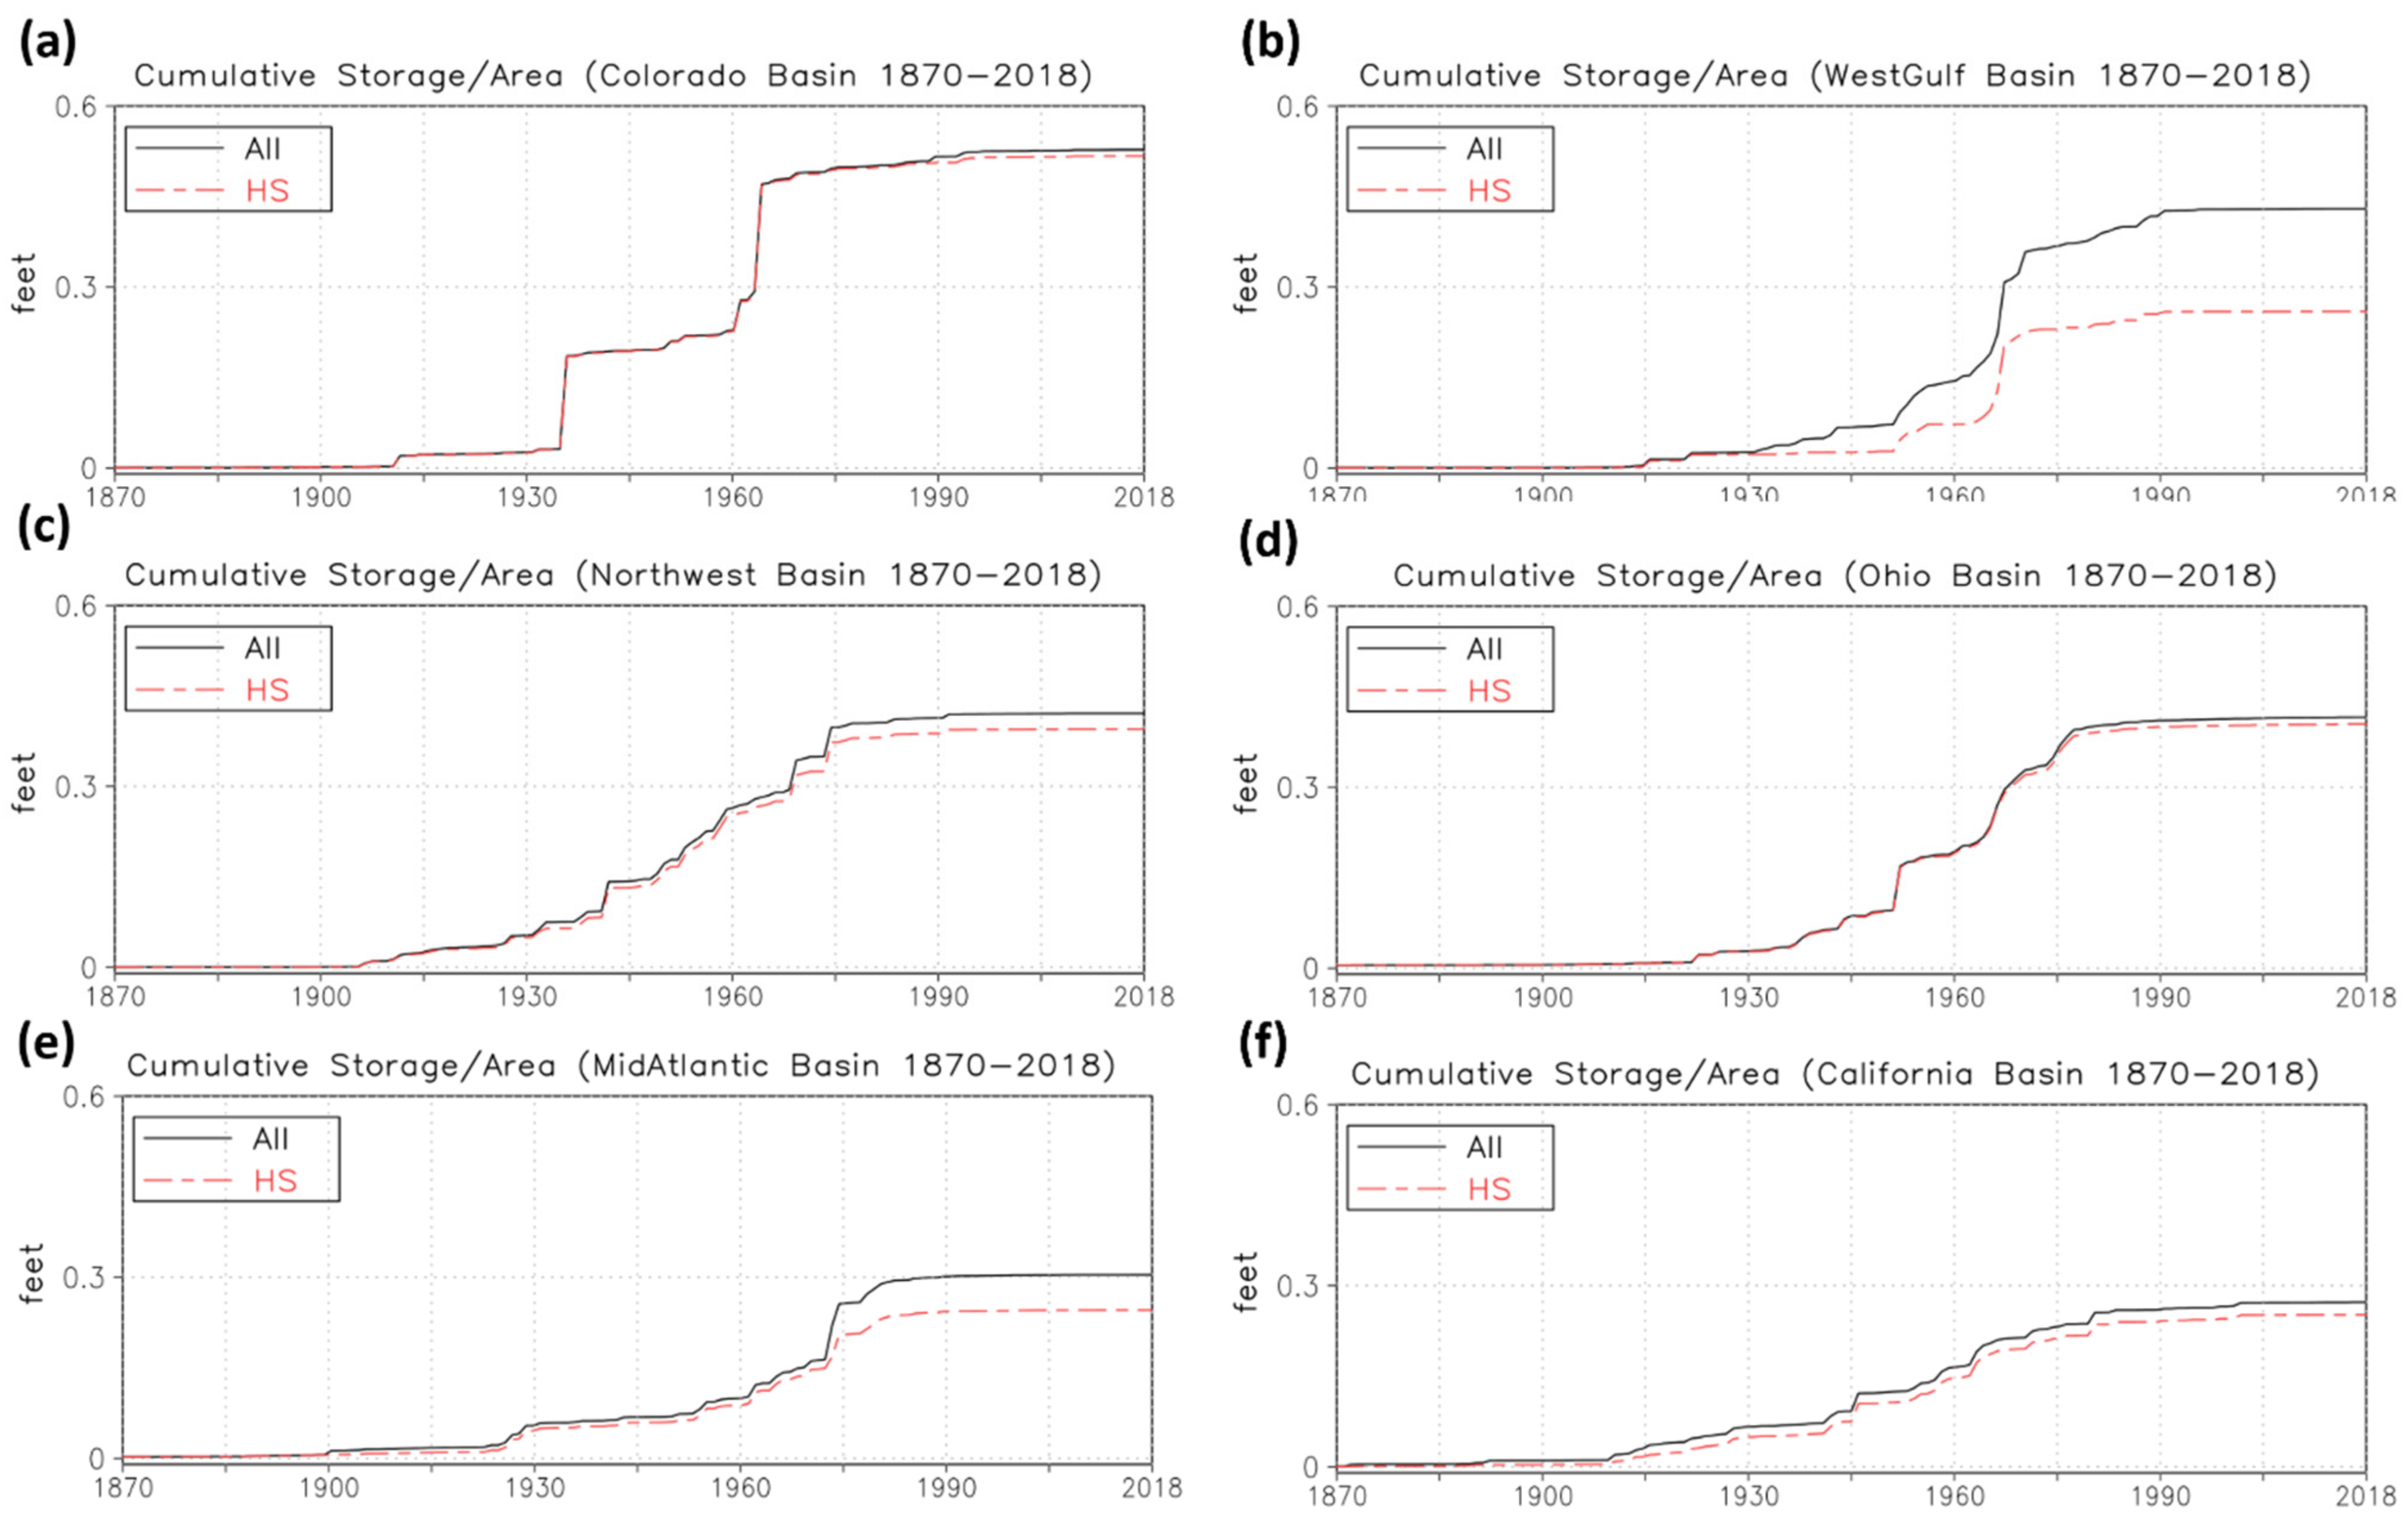
Figure 5.
Same as Figure 1 except for Colorado (a), West Gulf (b), Northwest (c), Ohio (d), Mid Atlantic (e), and California (f) RFC areas. The scale of the y-axis is one-third of the scale of the y-axis in Figure 4. For the SI unit conversion, one foot is 30.48 centimeters.


Table 1.
Summary for the National Inventory of Dams (NID)-registered dams across the 12 River Forecasting Center regions.
Table 1.
Summary for the National Inventory of Dams (NID)-registered dams across the 12 River Forecasting Center regions.
| ID | RFC Region | Number of Dams | Area | Cumulative Storage (a) | Annual Precipitation (b) | (a)/(b) | |||
|---|---|---|---|---|---|---|---|---|---|
| [106 acres] | [103 km2] | [106 acres-ft] | [km3] | [106 acres-ft] | [km3] | ||||
| 1 | Northeast | 4647 | 67 | 271.35 | 46.8 | 57.73 | 276.3 | 340.82 | 0.17 |
| 2 | Mid-Atlantic | 2735 | 53 | 214.65 | 15.7 | 19.37 | 207.7 | 256.20 | 0.08 |
| 3 | Southeast | 10,565 | 159 | 643.95 | 232.6 | 286.91 | 683.1 | 842.60 | 0.34 |
| 4 | Ohio | 4066 | 112 | 453.6 | 46.7 | 57.60 | 441.7 | 544.84 | 0.11 |
| 5 | North Central | 7796 | 217 | 878.85 | 338.4 | 417.42 | 629.3 | 776.24 | 0.54 |
| 6 | Lower Mississippi | 5124 | 131 | 530.55 | 95.4 | 117.68 | 586 | 722.83 | 0.16 |
| 7 | Missouri | 20,345 | 333 | 1348.65 | 207.6 | 256.07 | 634.6 | 782.78 | 0.33 |
| 8 | Arkansas | 8214 | 135 | 546.75 | 92.5 | 114.10 | 343.2 | 423.34 | 0.27 |
| 9 | West Gulf | 6198 | 257 | 1040.85 | 66.8 | 82.40 | 626.4 | 772.66 | 0.11 |
| 10 | Northwest | 2139 | 201 | 814.05 | 84 | 103.61 | 549 | 677.19 | 0.15 |
| 11 | Colorado | 1972 | 196 | 793.8 | 103.4 | 127.54 | 208.8 | 257.55 | 0.50 |
| 12 | California | 1700 | 160 | 648 | 43.2 | 53.29 | 279.4 | 344.64 | 0.15 |
| Total (Contiguous United States) | 75,501 | 2021 | 8185.05 | 1373.1 | 1693.71885 | 5465.5 | 6741.69 | 0.25 | |
Table 2.
Dams with and without hazard potential and Emergency Action Plans over the 12 RFC areas.
| ID | RFC Region | Number of Dams | Hazard Potential | Emergency Action Plan (EAP) | |||||||
|---|---|---|---|---|---|---|---|---|---|---|---|
| Required | Not Required | ||||||||||
| High | Significant | Low | Undetermined | Missing | Yes (a) | No (b) | (b)/((a)+(b)) | ||||
| 1 | Northeast | 4647 | 1191 | 1571 | 1868 | 17 | 0 | 1893 | 363 | 0.16 | 2391 |
| 2 | Mid-Atlantic | 2735 | 1107 | 618 | 835 | 175 | 0 | 1687 | 258 | 0.13 | 793 |
| 3 | Southeast | 10,565 | 1694 | 1235 | 7420 | 216 | 0 | 1750 | 2840 | 0.62 | 5975 |
| 4 | Ohio | 4066 | 1314 | 1095 | 1632 | 25 | 0 | 1646 | 773 | 0.32 | 1647 |
| 5 | North Central | 7796 | 1182 | 870 | 5693 | 51 | 0 | 1531 | 1282 | 0.46 | 4983 |
| 6 | Lower Mississippi | 5124 | 950 | 590 | 3026 | 240 | 318 | 837 | 283 | 0.25 | 4004 |
| 7 | Missouri | 20,345 | 1551 | 1027 | 17,711 | 56 | 0 | 1337 | 344 | 0.20 | 18,664 |
| 8 | Arkansas | 8214 | 708 | 420 | 6260 | 69 | 757 | 851 | 115 | 0.12 | 7248 |
| 9 | West Gulf | 6198 | 215 | 52 | 153 | 0 | 5778 | 1480 | 425 | 0.22 | 4293 |
| 10 | Northwest | 2139 | 561 | 486 | 1085 | 7 | 0 | 716 | 479 | 0.40 | 944 |
| 11 | Colorado | 1972 | 685 | 410 | 873 | 3 | 1 | 982 | 105 | 0.10 | 885 |
| 12 | California | 1700 | 776 | 302 | 572 | 50 | 0 | 715 | 697 | 0.49 | 288 |
| Total (CONUS) | 75,501 | 11,934 | 8676 | 47,128 | 909 | 6854 | 15,425 | 7964 | 0.34 | 52,115 | |
Table 3.
Freshwater costs of accumulated storage capacity in 12 RFC regions.
| ID | RFC Region | Number of Dams | Cumulative Storage | Cost Average | Potential Benefit | |||
|---|---|---|---|---|---|---|---|---|
| [-] | [106 acres-ft] | [km3] | $/Acre-ft | $/Million Liters | [Million US Dollars] | [Thousands US Dollars/dam] | ||
| 1 | Northeast | 4647 | 46.8 | 57.7278 | 20.9 | 16.94 | 978.12 | 210.48 |
| 2 | Mid-Atlantic | 2735 | 15.7 | 19.36595 | 40.8 | 33.08 | 640.56 | 234.21 |
| 3 | Southeast | 10,565 | 232.6 | 286.9121 | 19.6 | 15.89 | 4558.96 | 431.52 |
| 4 | Ohio | 4066 | 46.7 | 57.60445 | 37.8 | 30.65 | 1765.26 | 434.15 |
| 5 | North Central | 7796 | 338.4 | 417.4164 | 29.2 | 23.67 | 9881.28 | 1267.48 |
| 6 | Lower Mississippi | 5124 | 95.4 | 117.6759 | 34.4 | 27.89 | 3281.76 | 640.47 |
| 7 | Missouri | 20,345 | 207.6 | 256.0746 | 21.2 | 17.19 | 4401.12 | 216.32 |
| 8 | Arkansas | 8214 | 92.5 | 114.0988 | 50.5 | 40.94 | 4671.25 | 568.69 |
| 9 | West Gulf | 6198 | 66.8 | 82.3978 | 139.7 | 113.26 | 9331.96 | 1505.64 |
| 10 | Northwest | 2139 | 84 | 103.614 | 89.7 | 72.72 | 7534.80 | 3522.58 |
| 11 | Colorado | 1972 | 103.4 | 127.5439 | 122.4 | 99.23 | 12,656.16 | 6417.93 |
| 12 | California | 1700 | 43.2 | 53.2872 | 81.1 | 65.75 | 3503.52 | 2060.89 |
| Total/Average (CONUS) | 75,501 | 1373.1 | 1693.719 | 57.28 | 46.43 | 63,204.75 | 837.14 | |
Publisher’s Note: MDPI stays neutral with regard to jurisdictional claims in published maps and institutional affiliations. |
© 2021 by the authors. Licensee MDPI, Basel, Switzerland. This article is an open access article distributed under the terms and conditions of the Creative Commons Attribution (CC BY) license (https://creativecommons.org/licenses/by/4.0/).
Share and Cite
MDPI and ACS Style
Song, J.; Sciubba, M.; Kam, J. Risk and Impact Assessment of Dams in the Contiguous United States Using the 2018 National Inventory of Dams Database. Water 2021, 13, 1066. https://doi.org/10.3390/w13081066
AMA Style
Song J, Sciubba M, Kam J. Risk and Impact Assessment of Dams in the Contiguous United States Using the 2018 National Inventory of Dams Database. Water. 2021; 13(8):1066. https://doi.org/10.3390/w13081066
Chicago/Turabian StyleSong, Junho, Madden Sciubba, and Jonghun Kam. 2021. "Risk and Impact Assessment of Dams in the Contiguous United States Using the 2018 National Inventory of Dams Database" Water 13, no. 8: 1066. https://doi.org/10.3390/w13081066
Note that from the first issue of 2016, this journal uses article numbers instead of page numbers. See further details here.