
Floating Debris in the Low Segura River Basin (Spain): Avoiding Litter through the Irrigation Network

 , , , , and
Abstract
:1. Introduction
Case Study Description
2. Materials and Methods
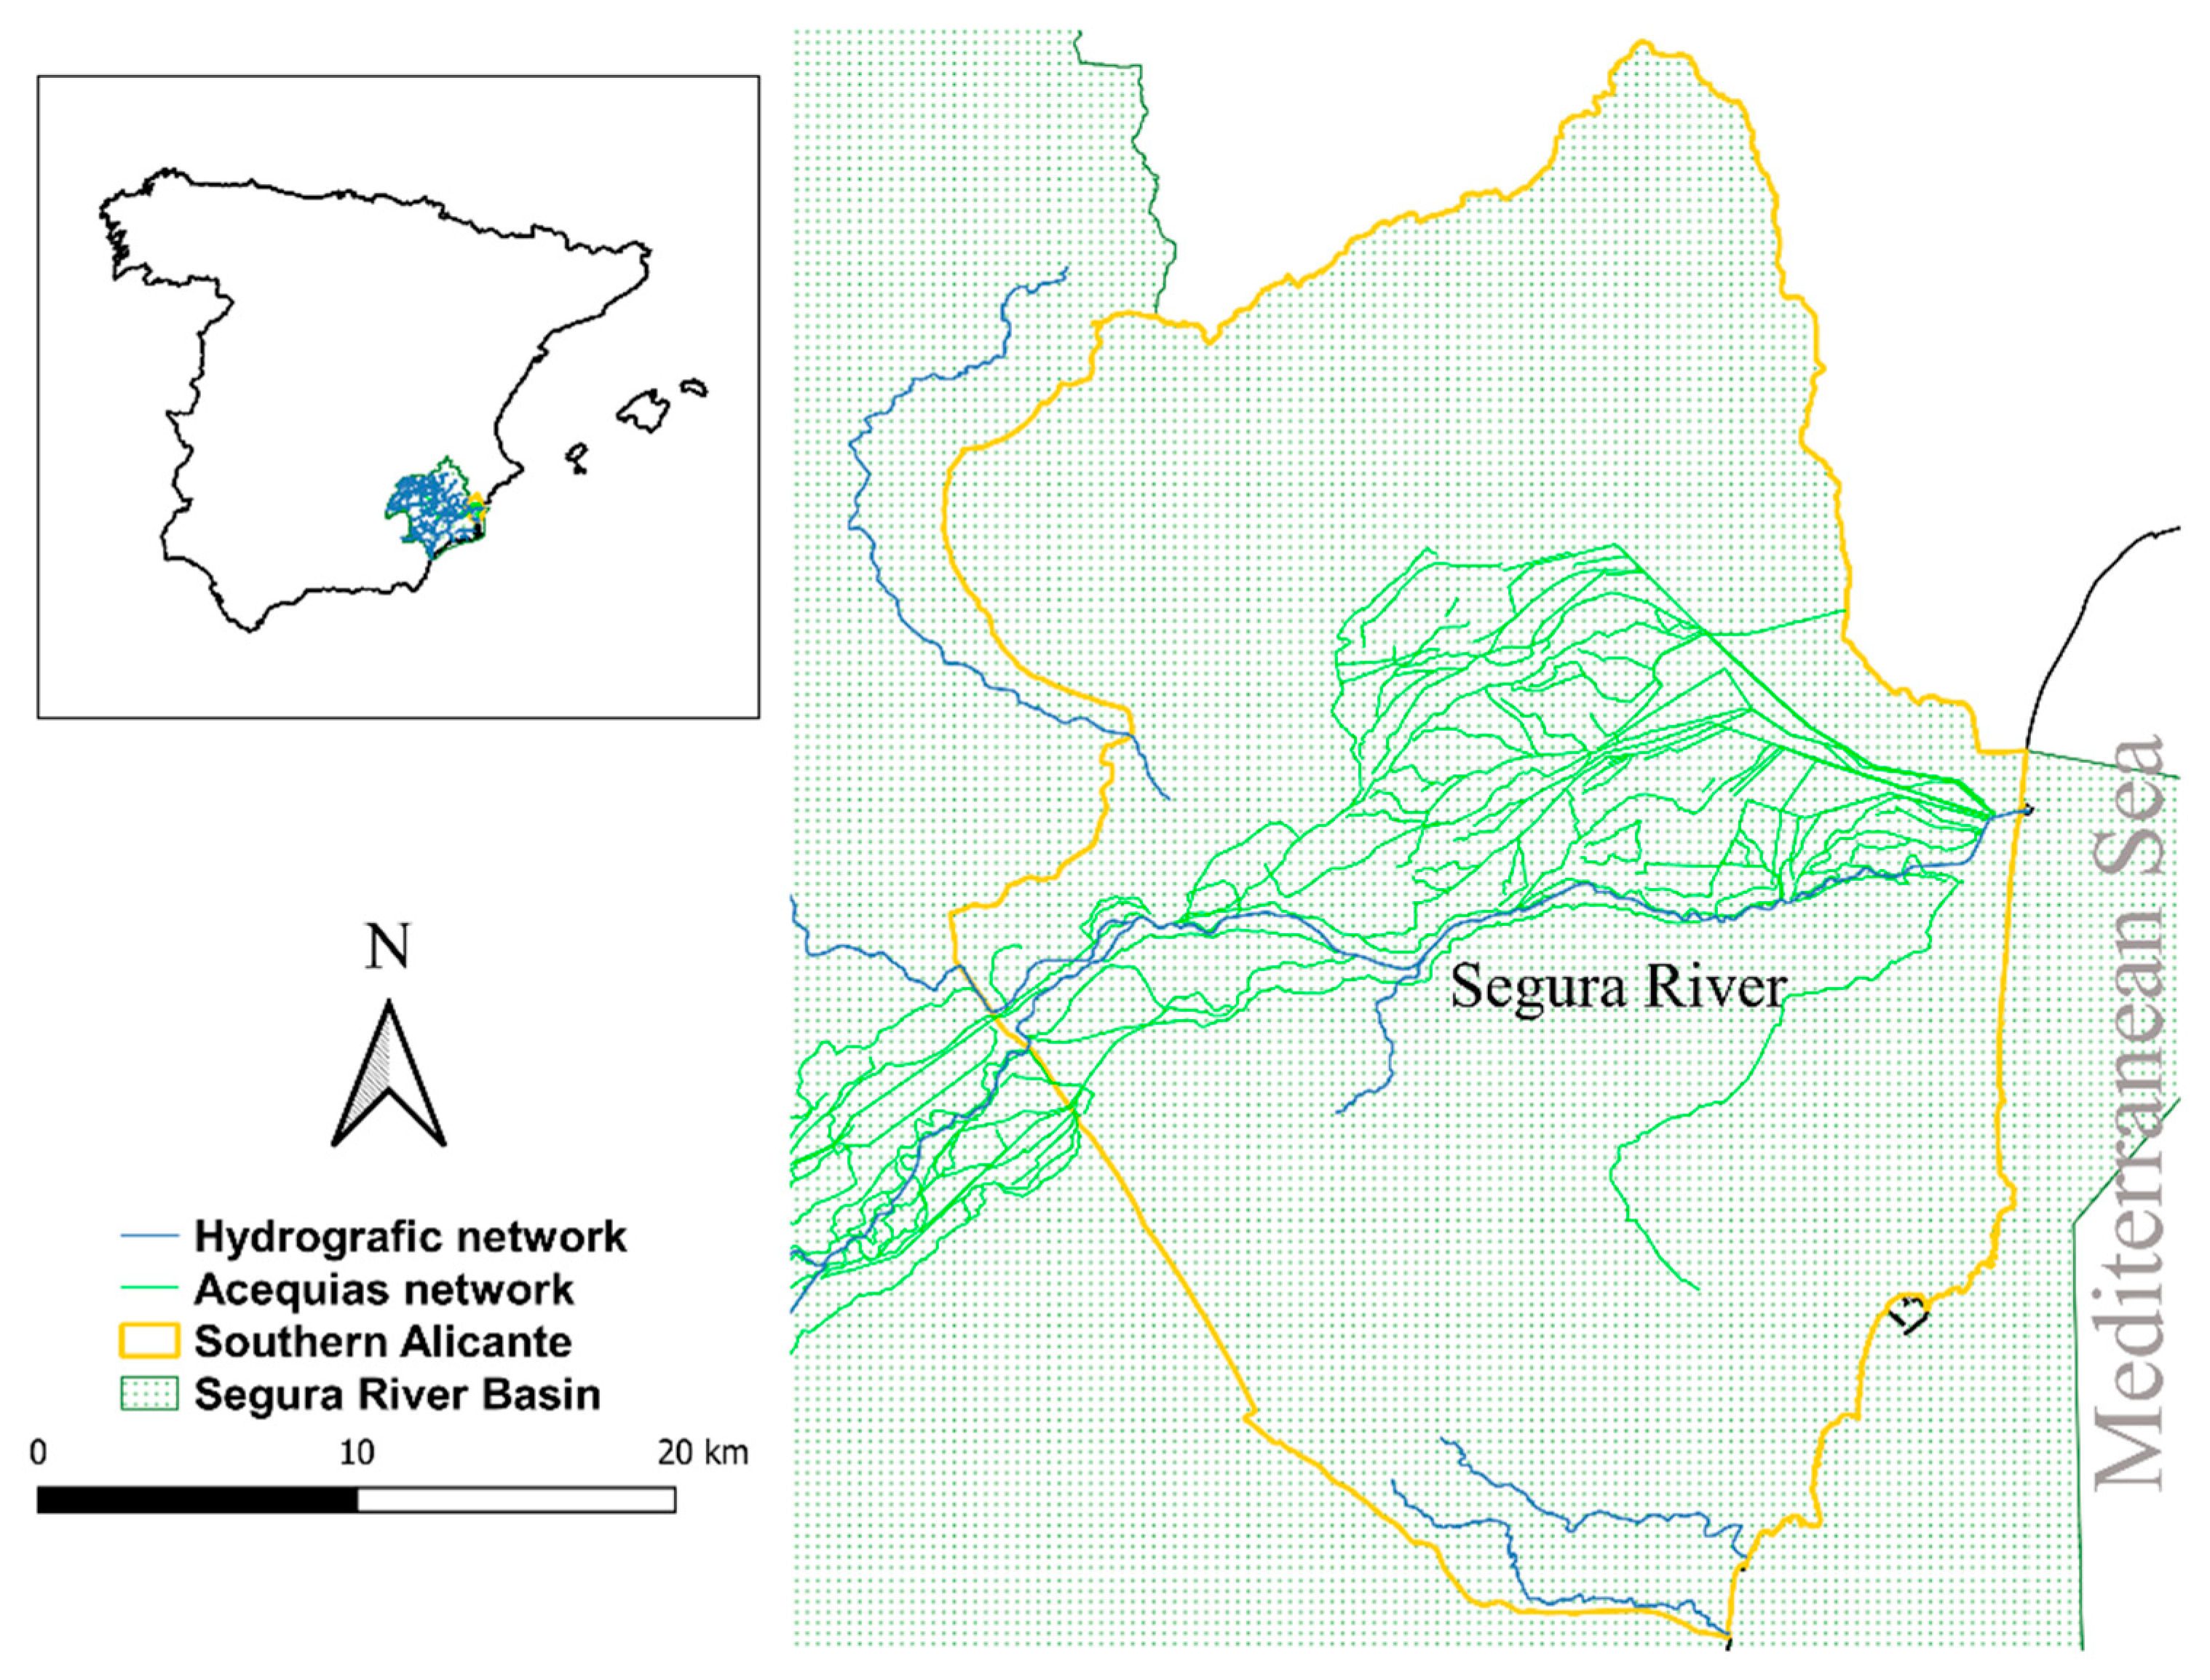
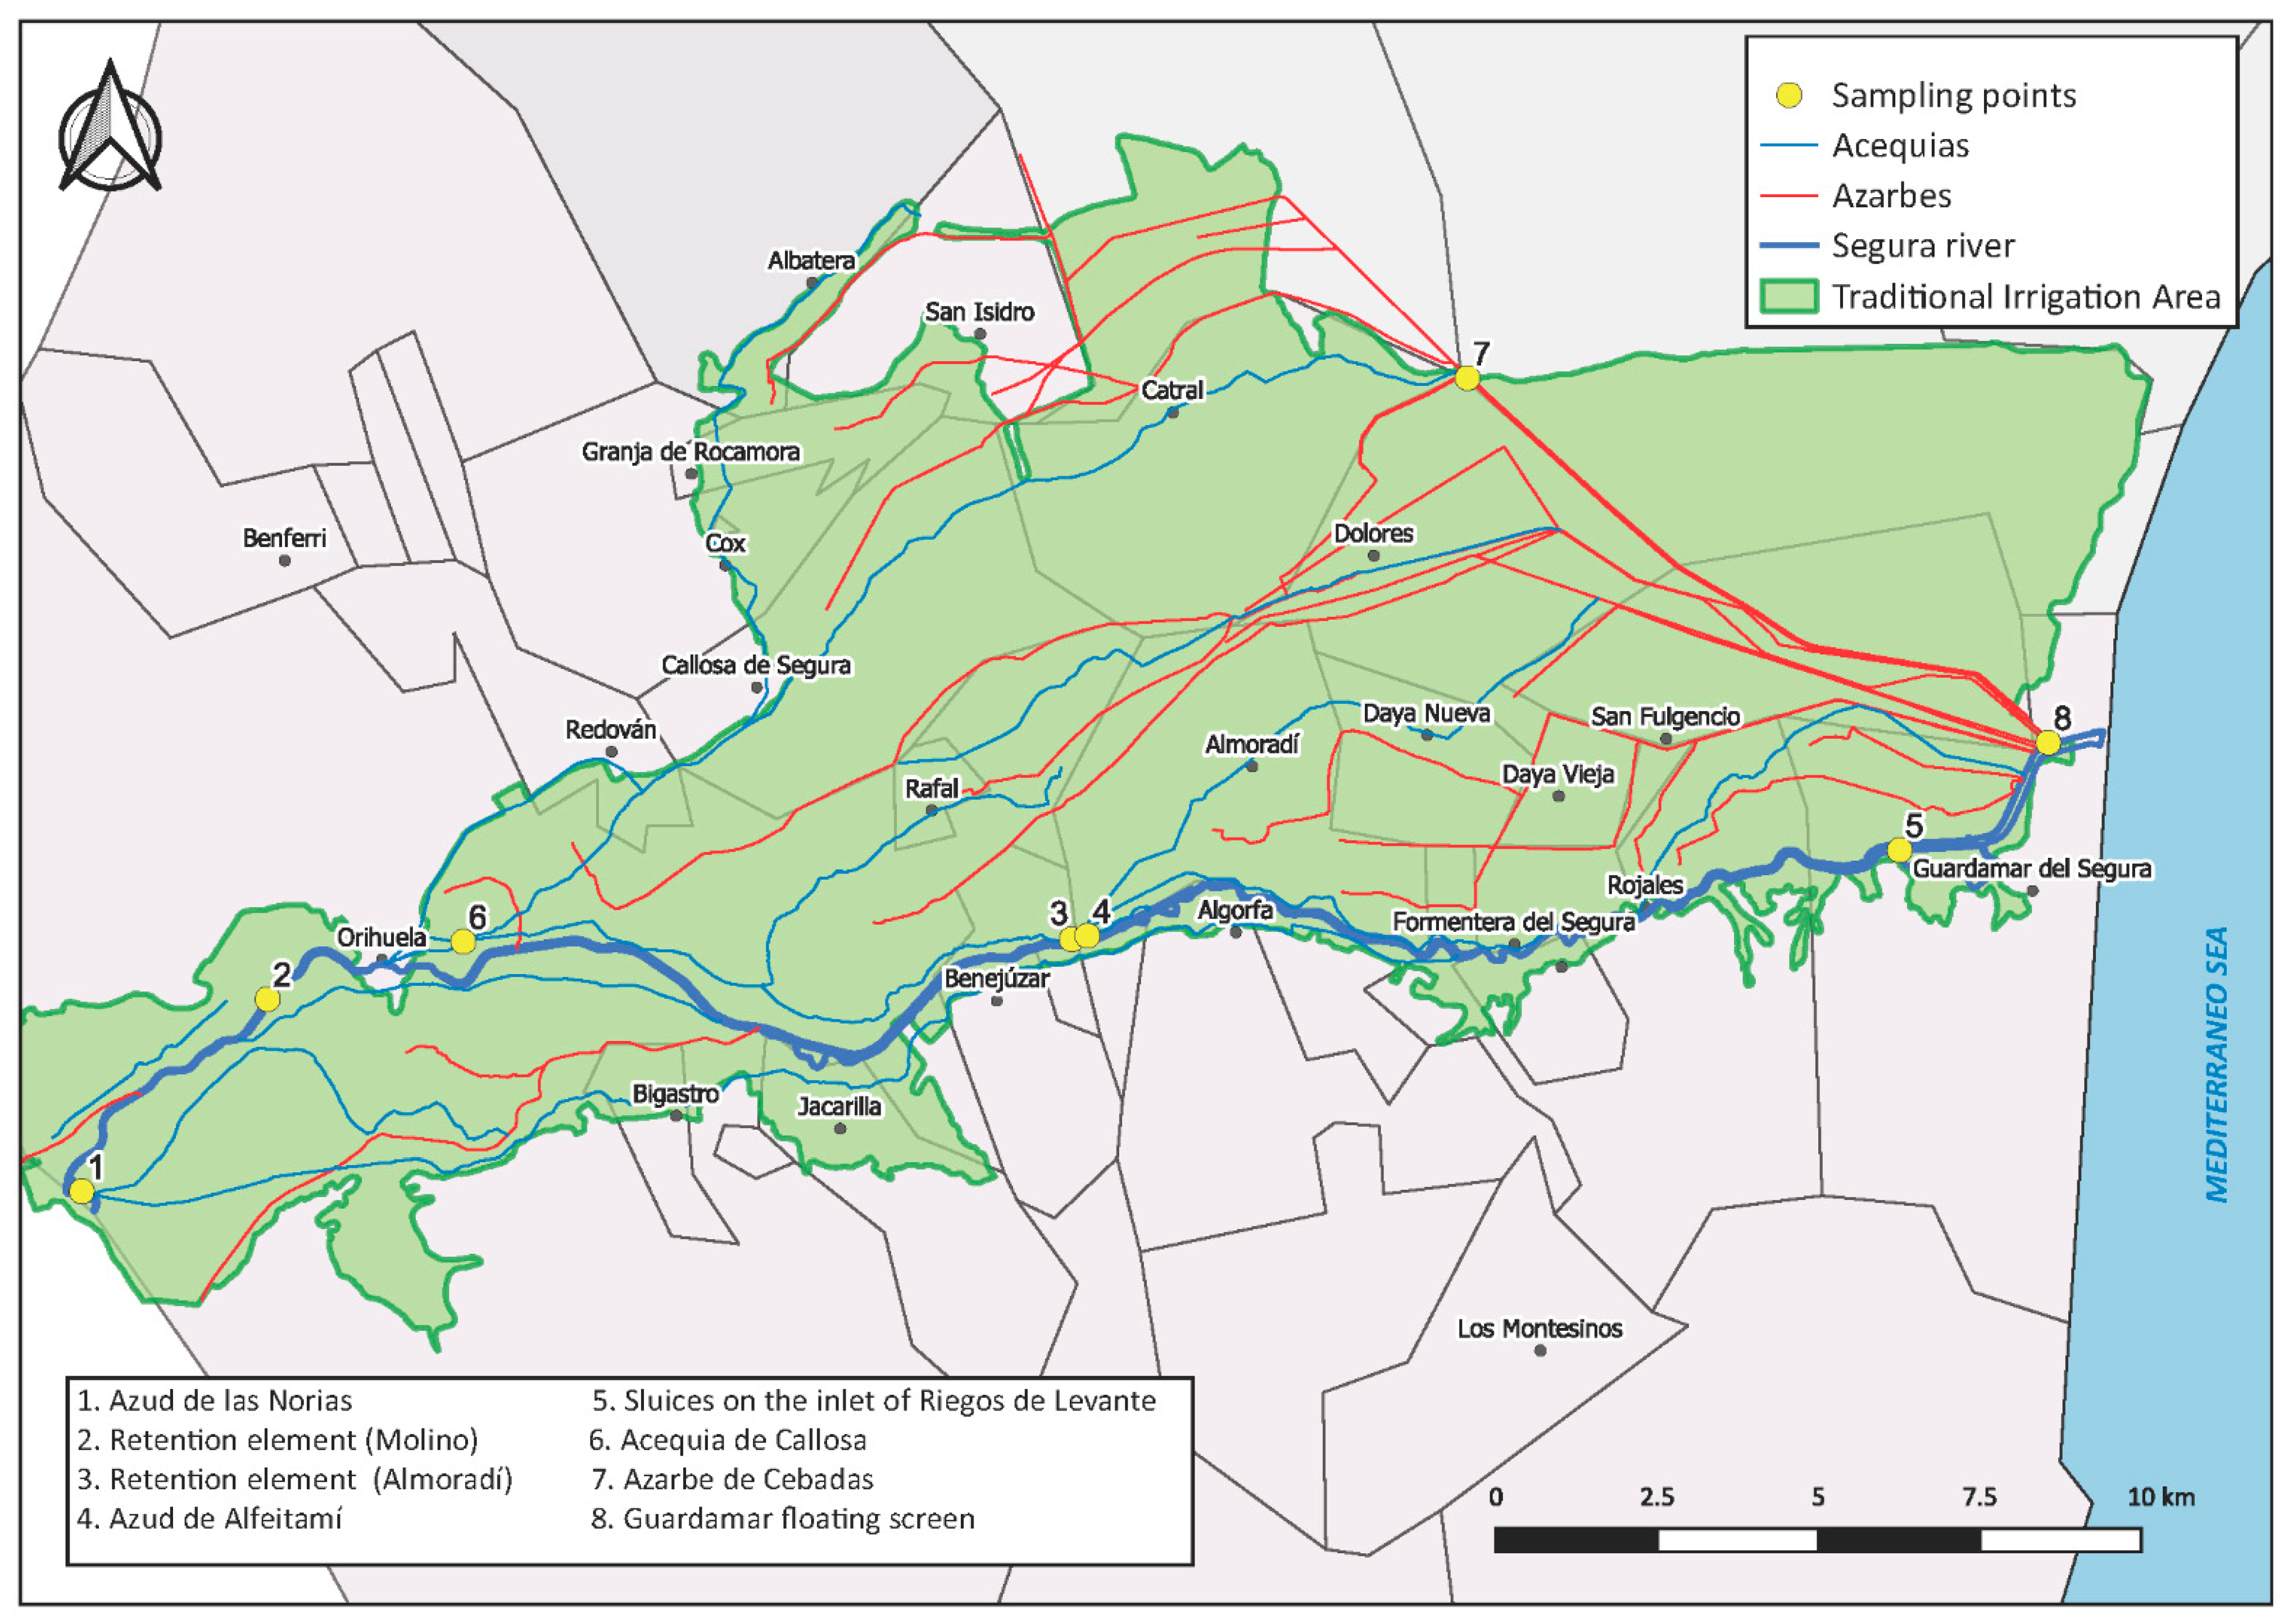
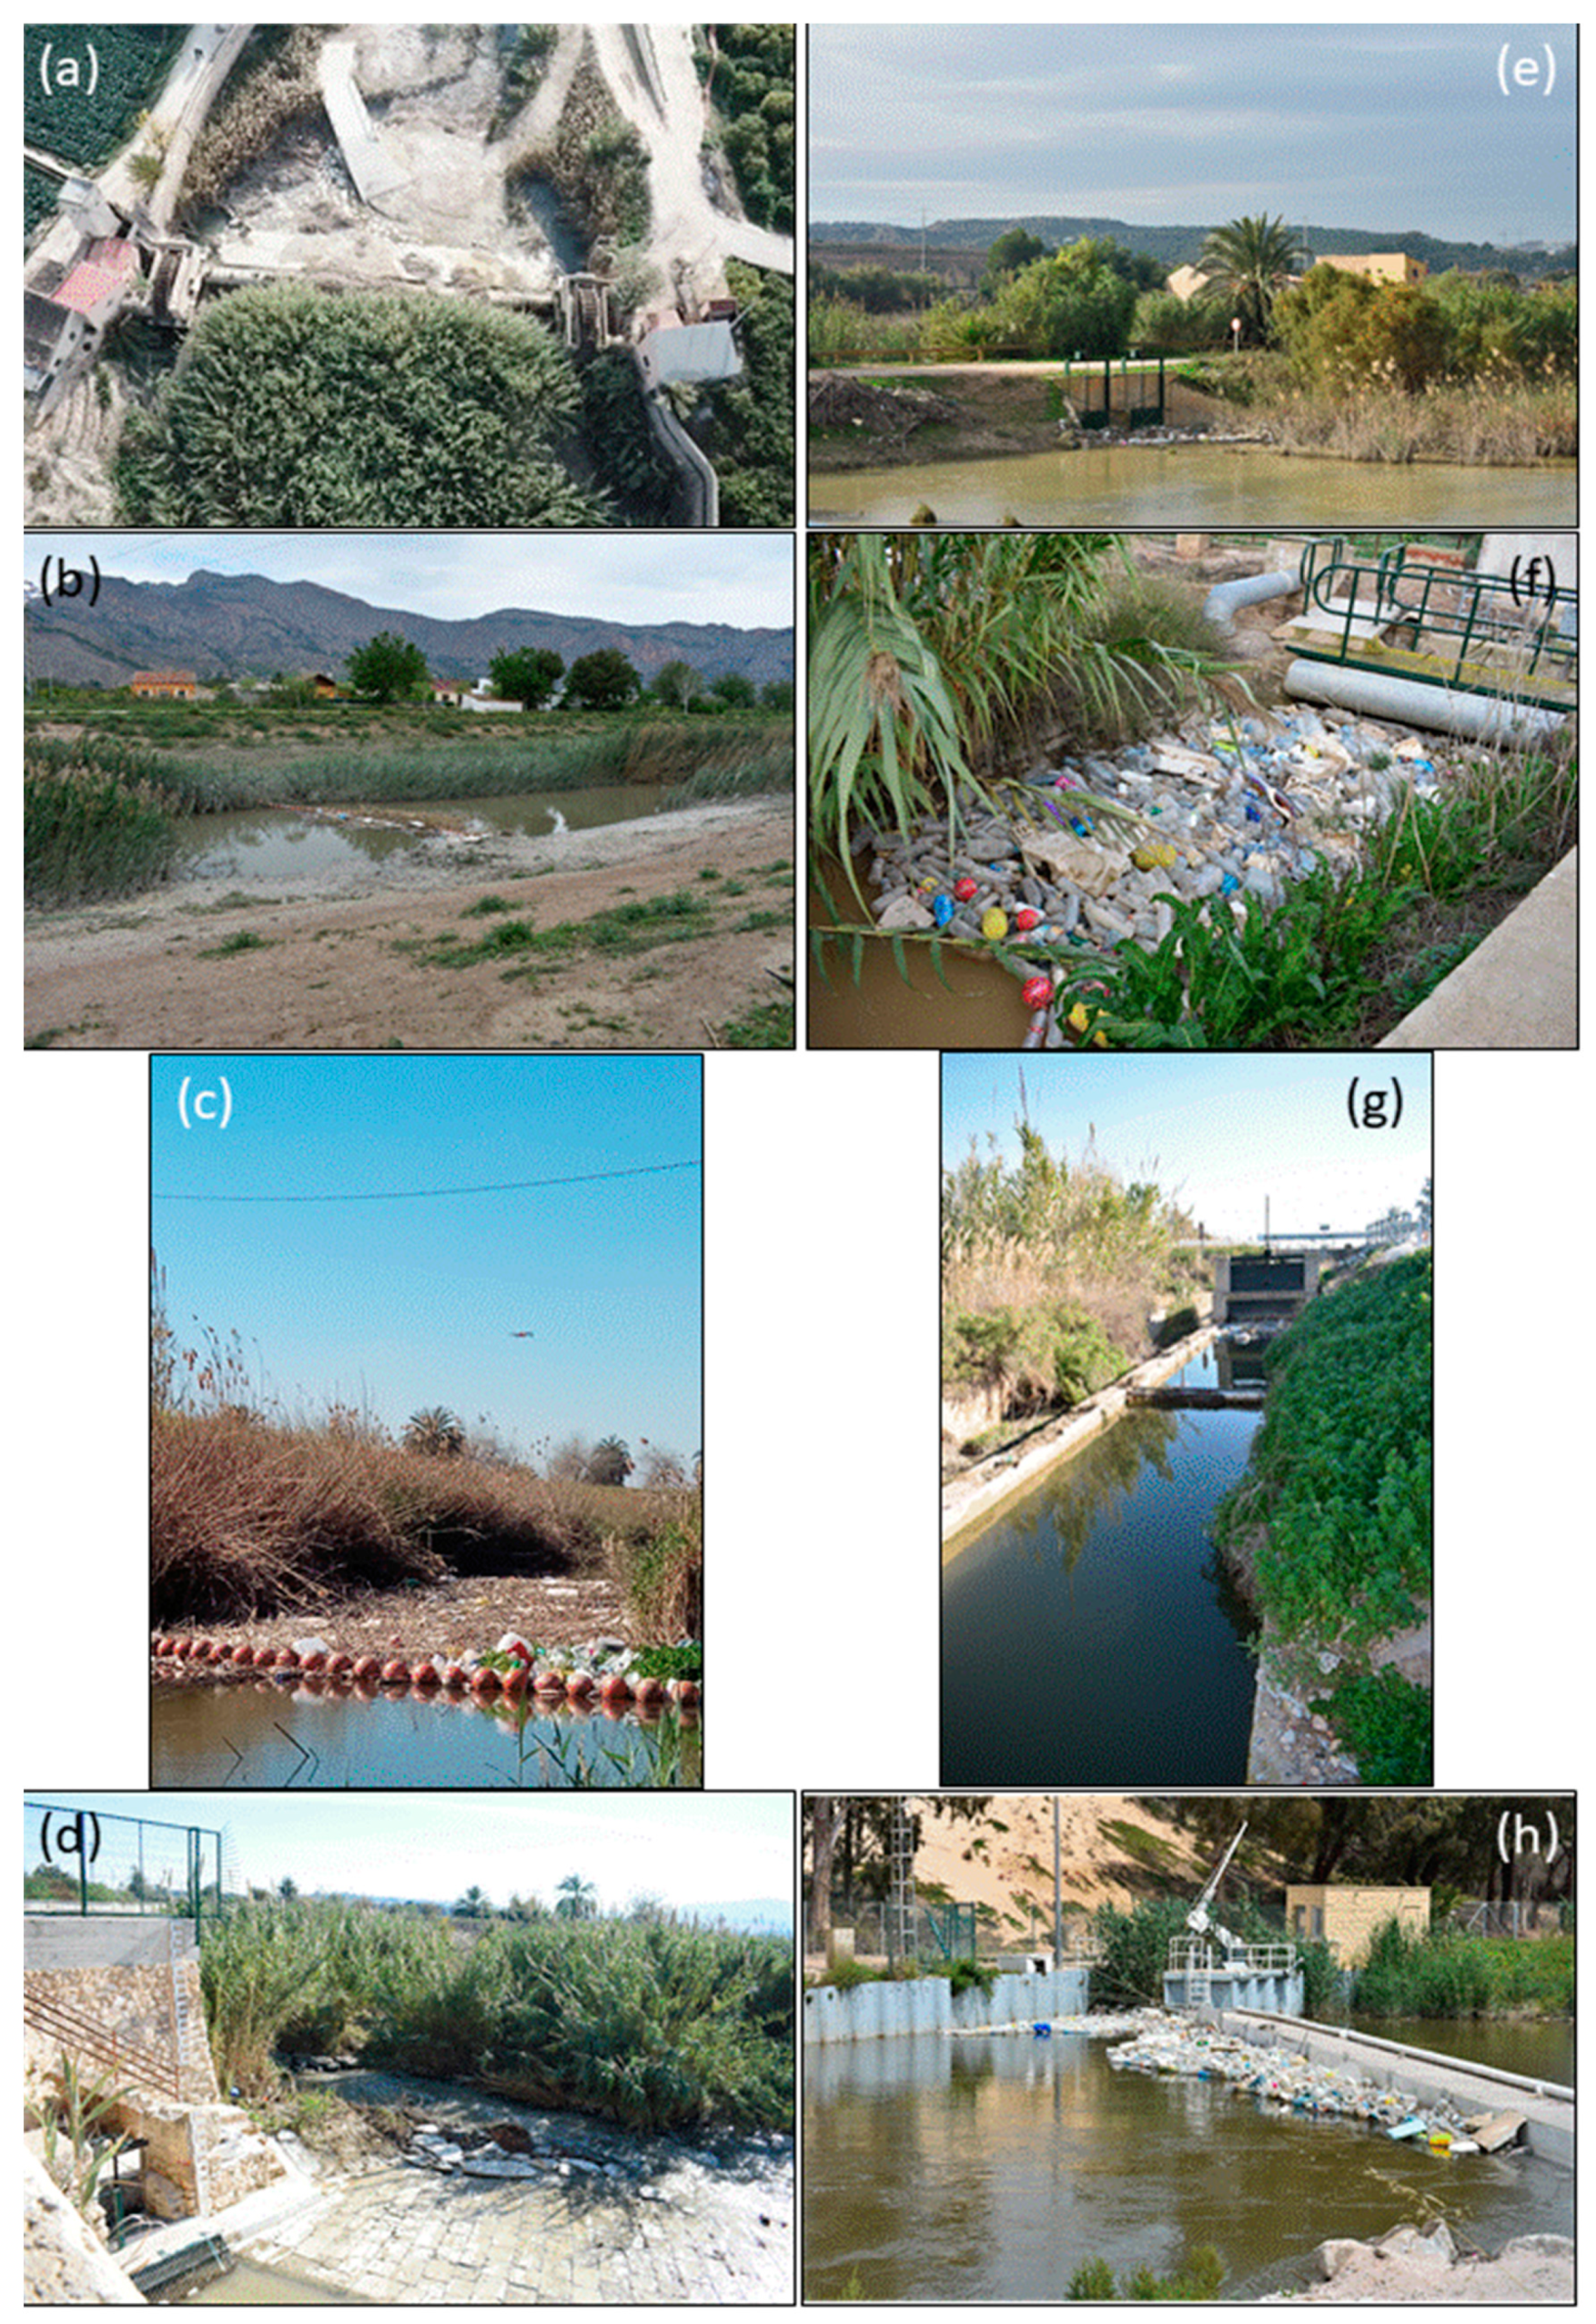
2.1. Description of the Studied Area and Location of Litter Accumulation Areas/Points/Stretches
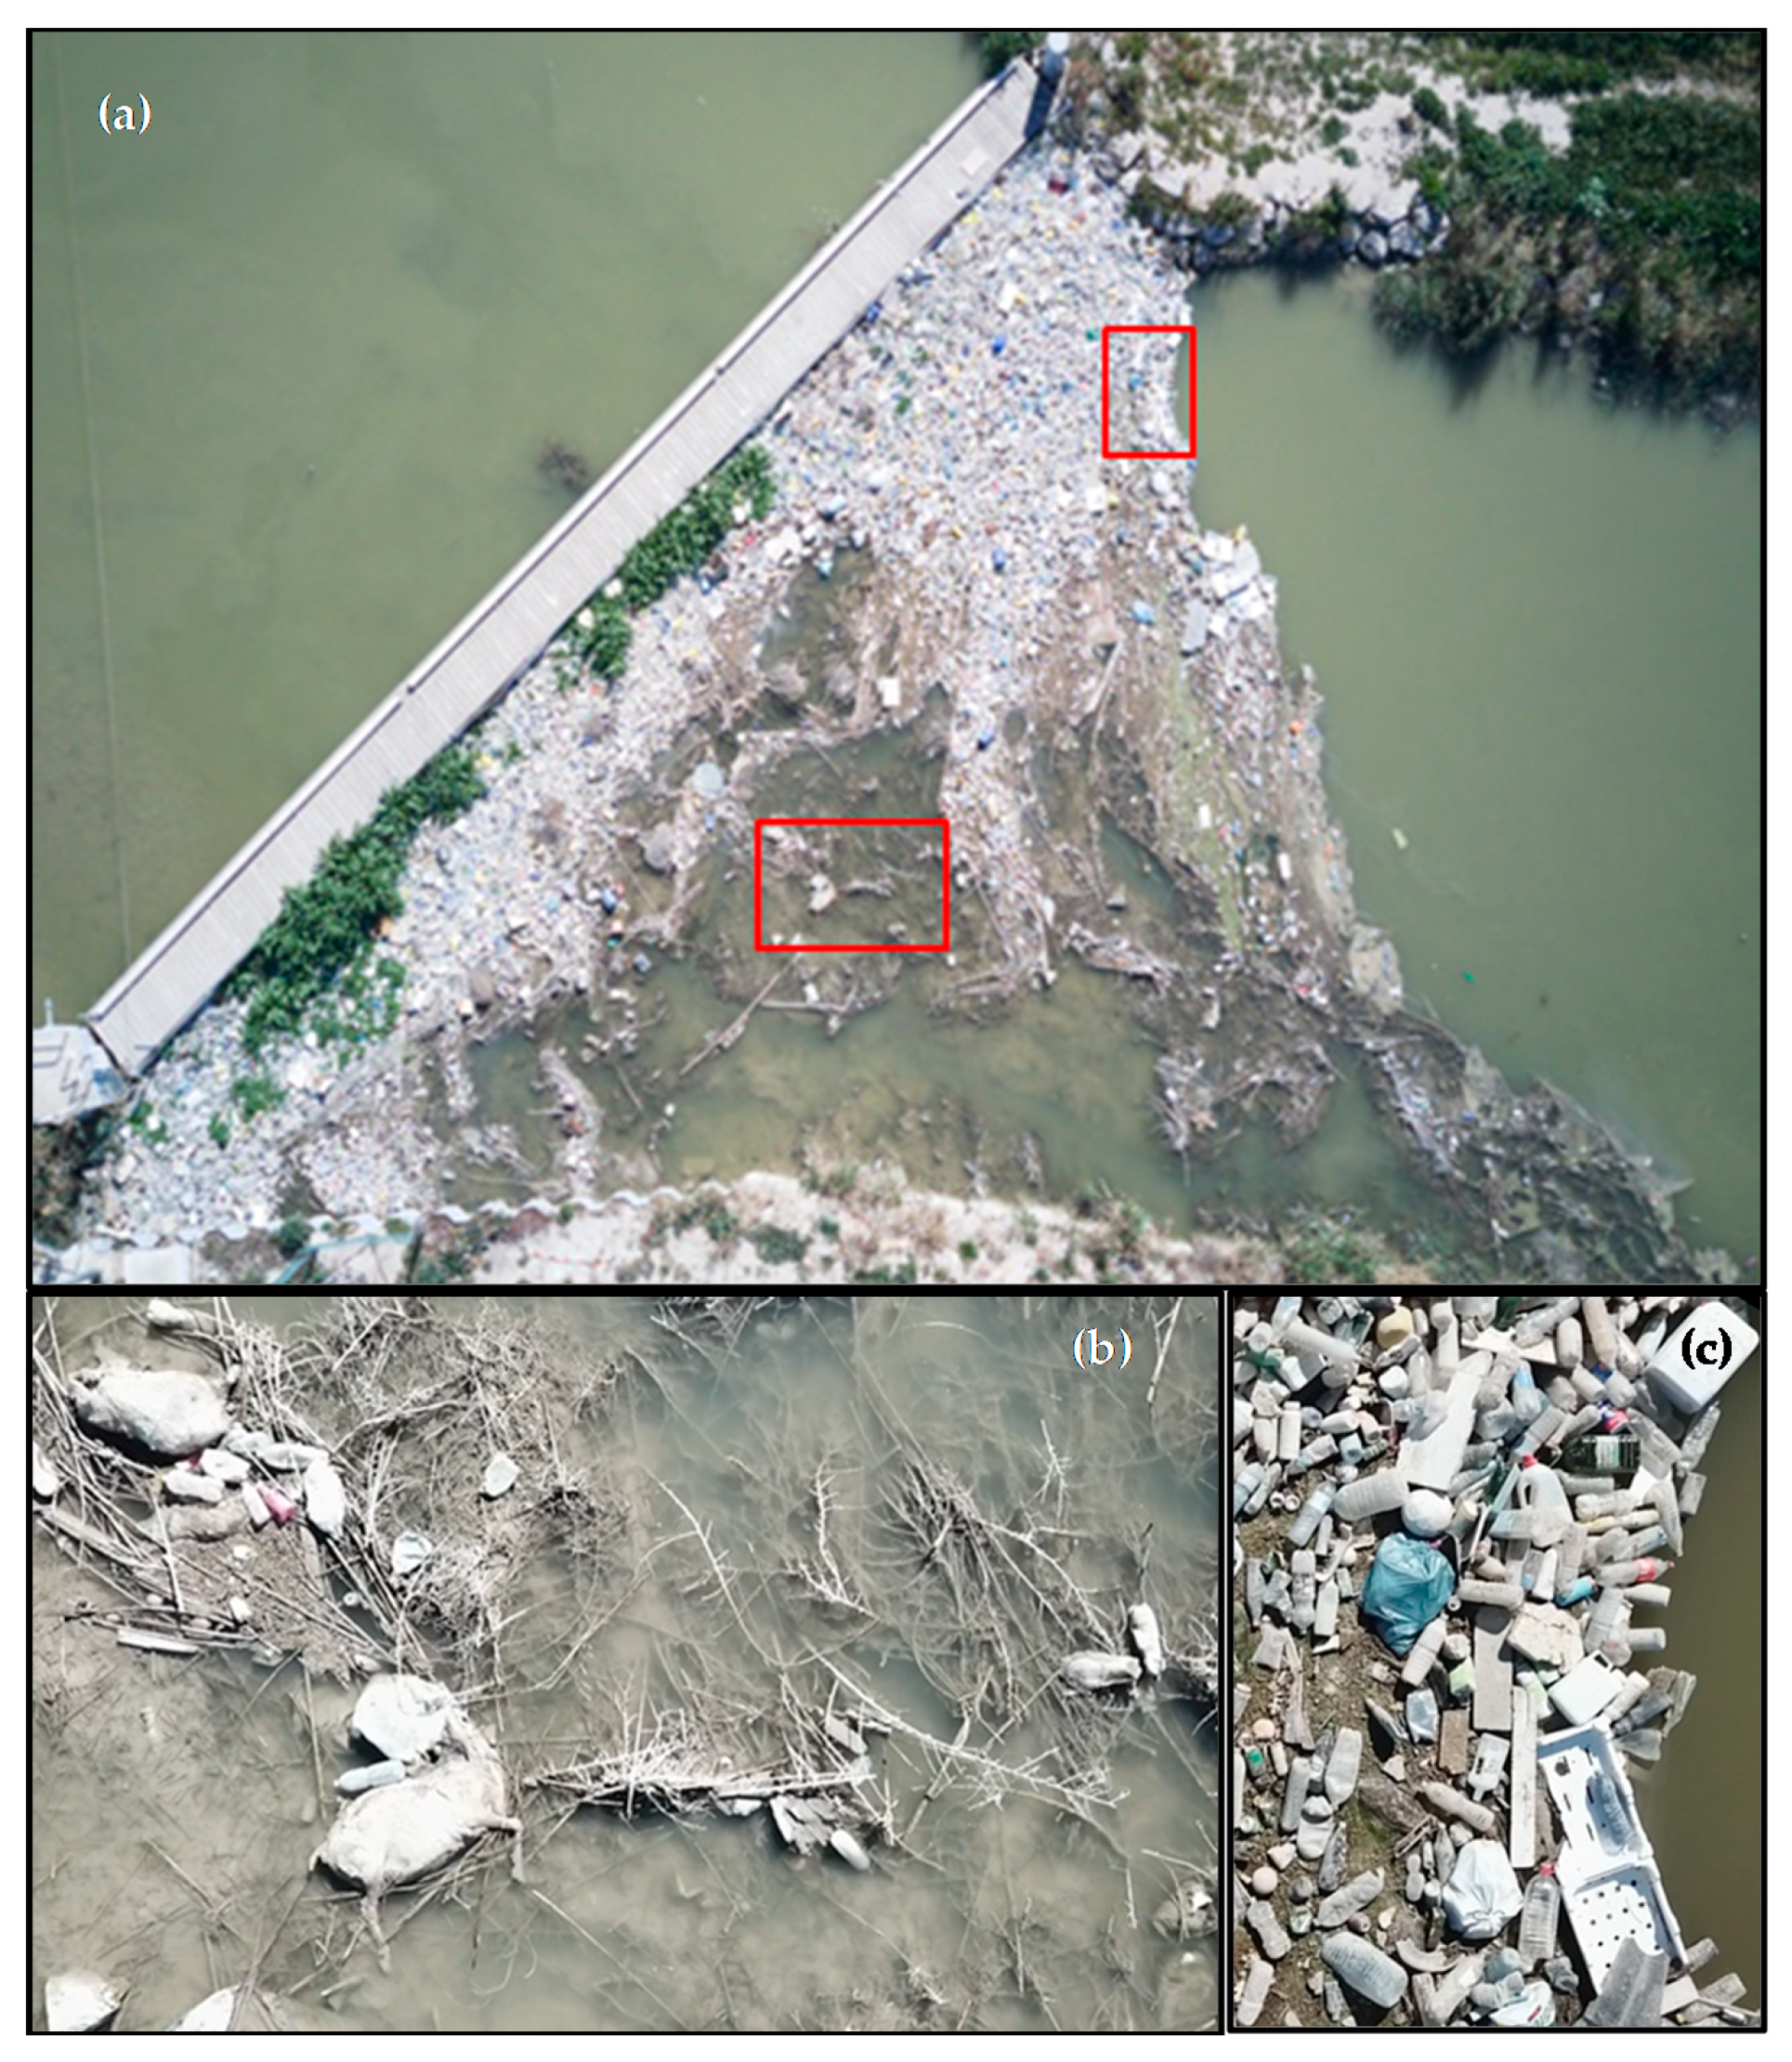
2.2. Sampling Methodology and Measurements by Image Analysis
2.3. Manual Counting of Litter
2.4. Classification of Litter
3. Results
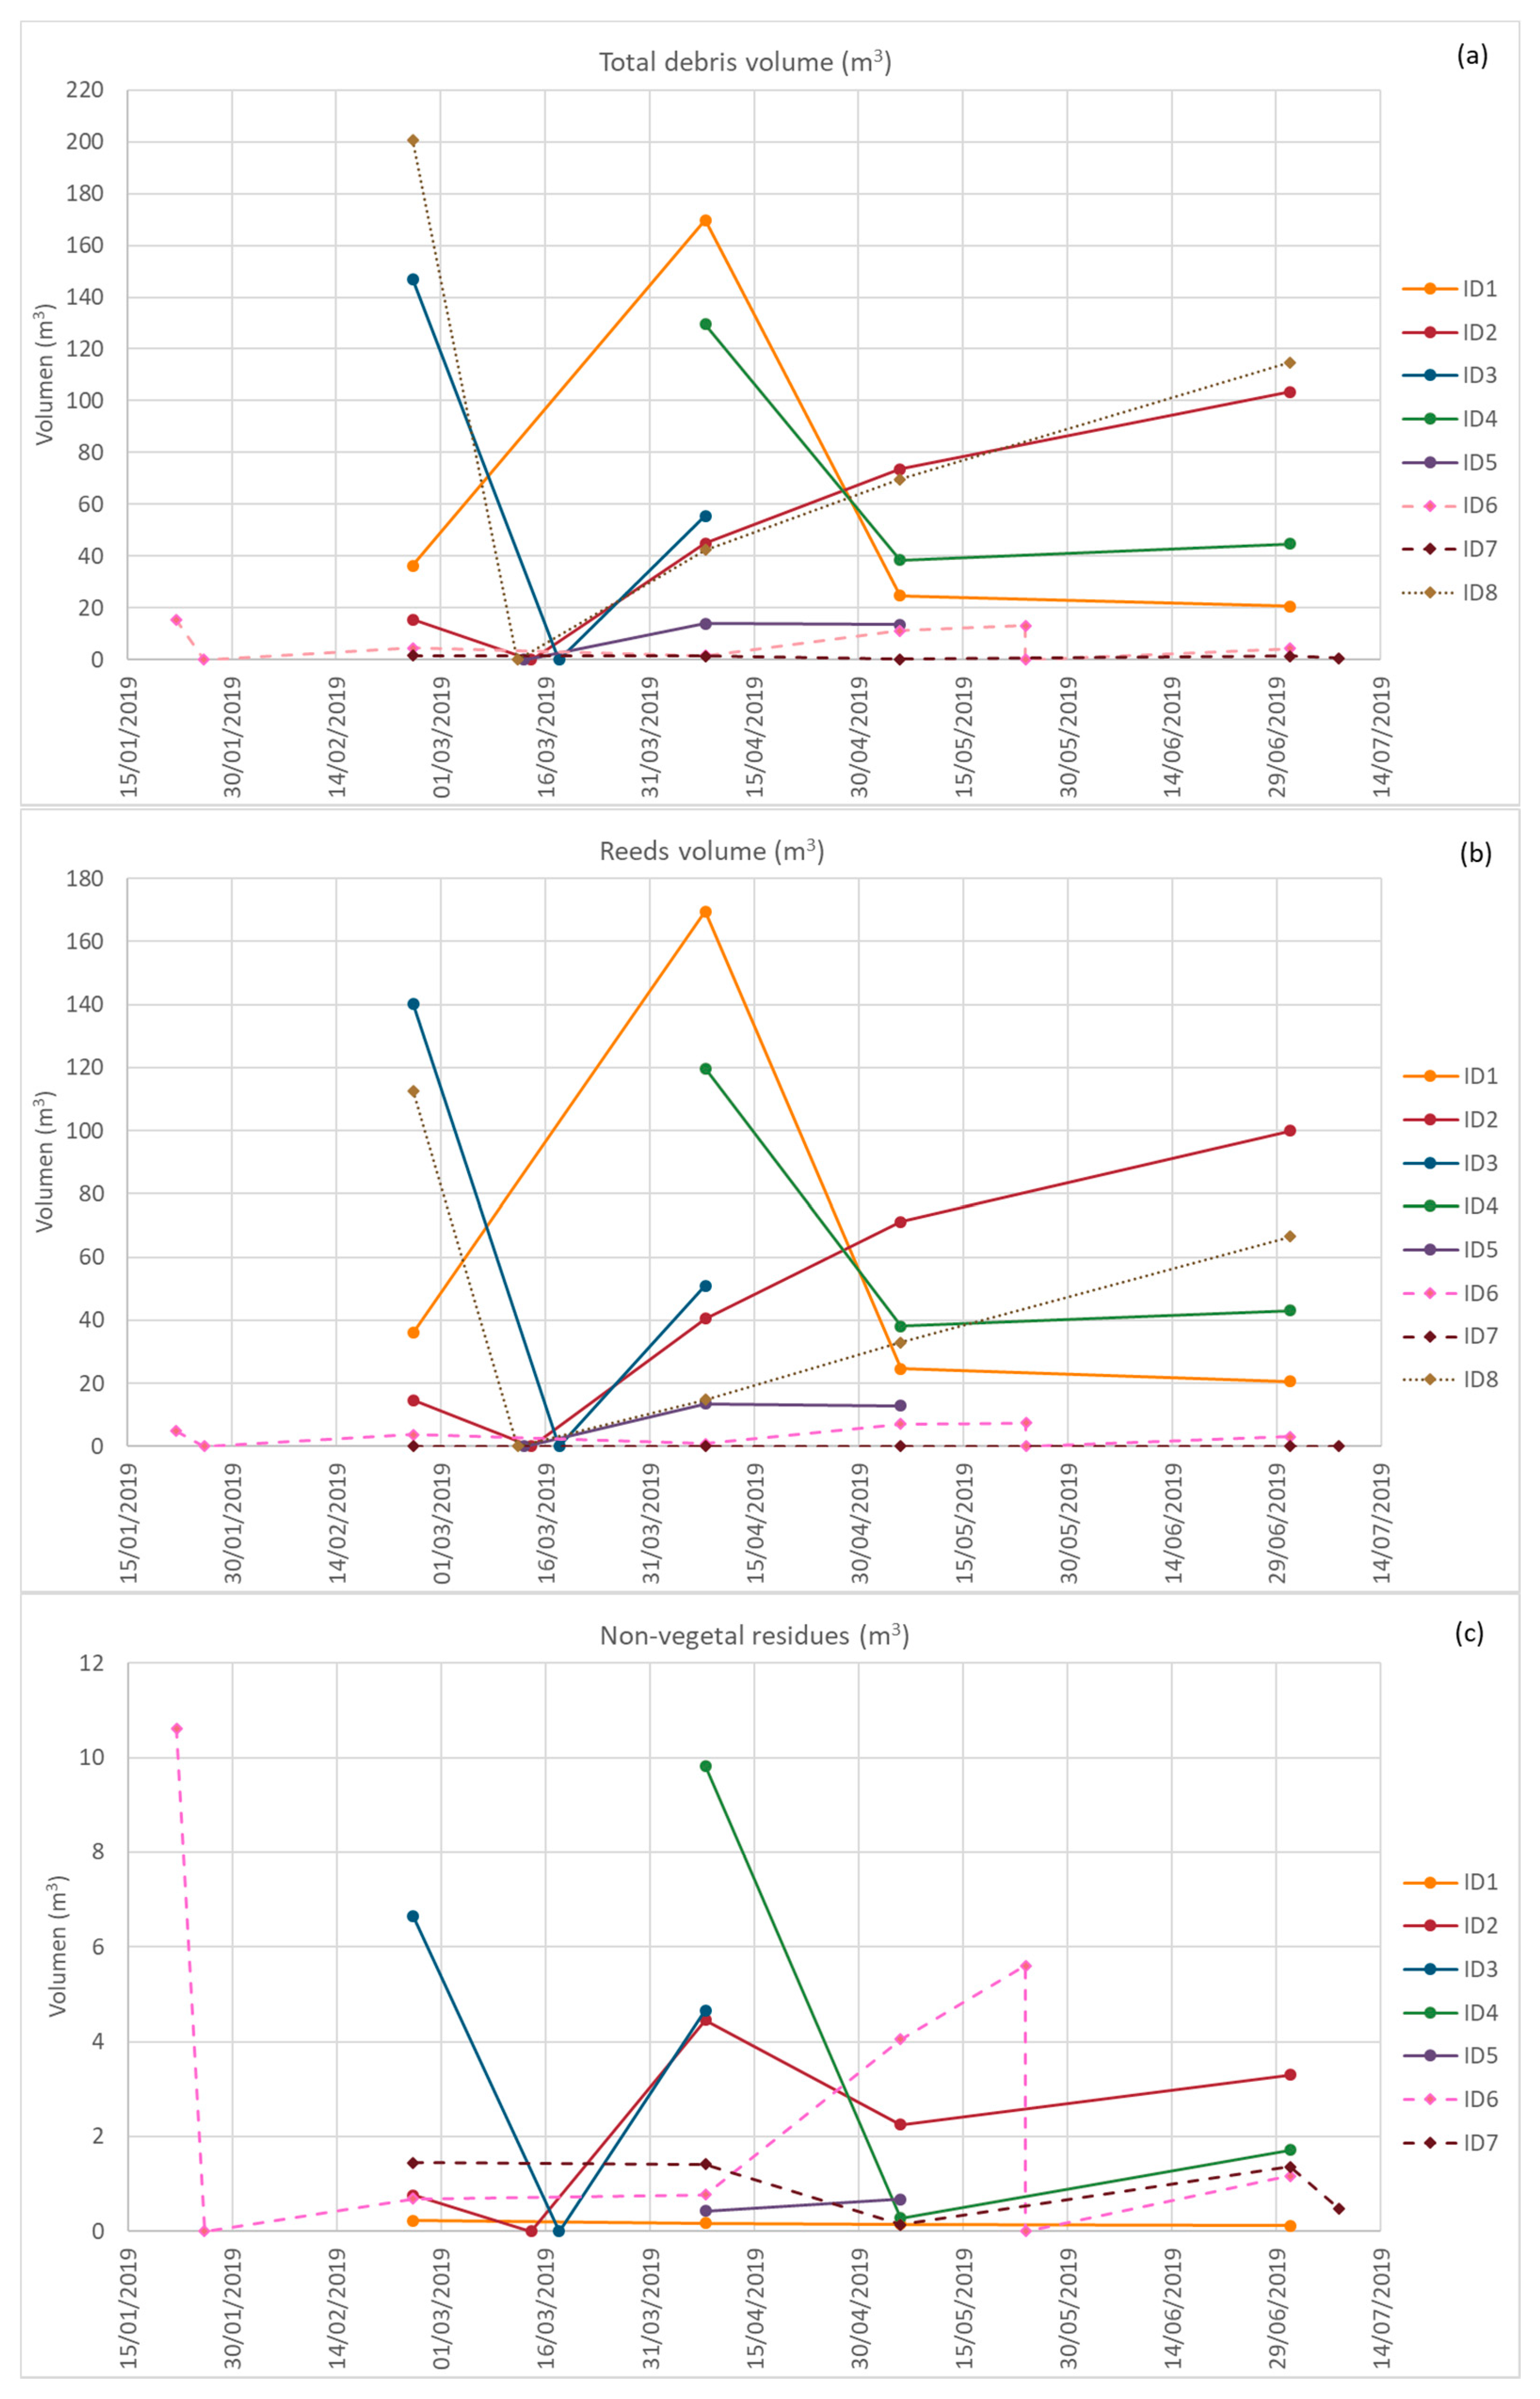
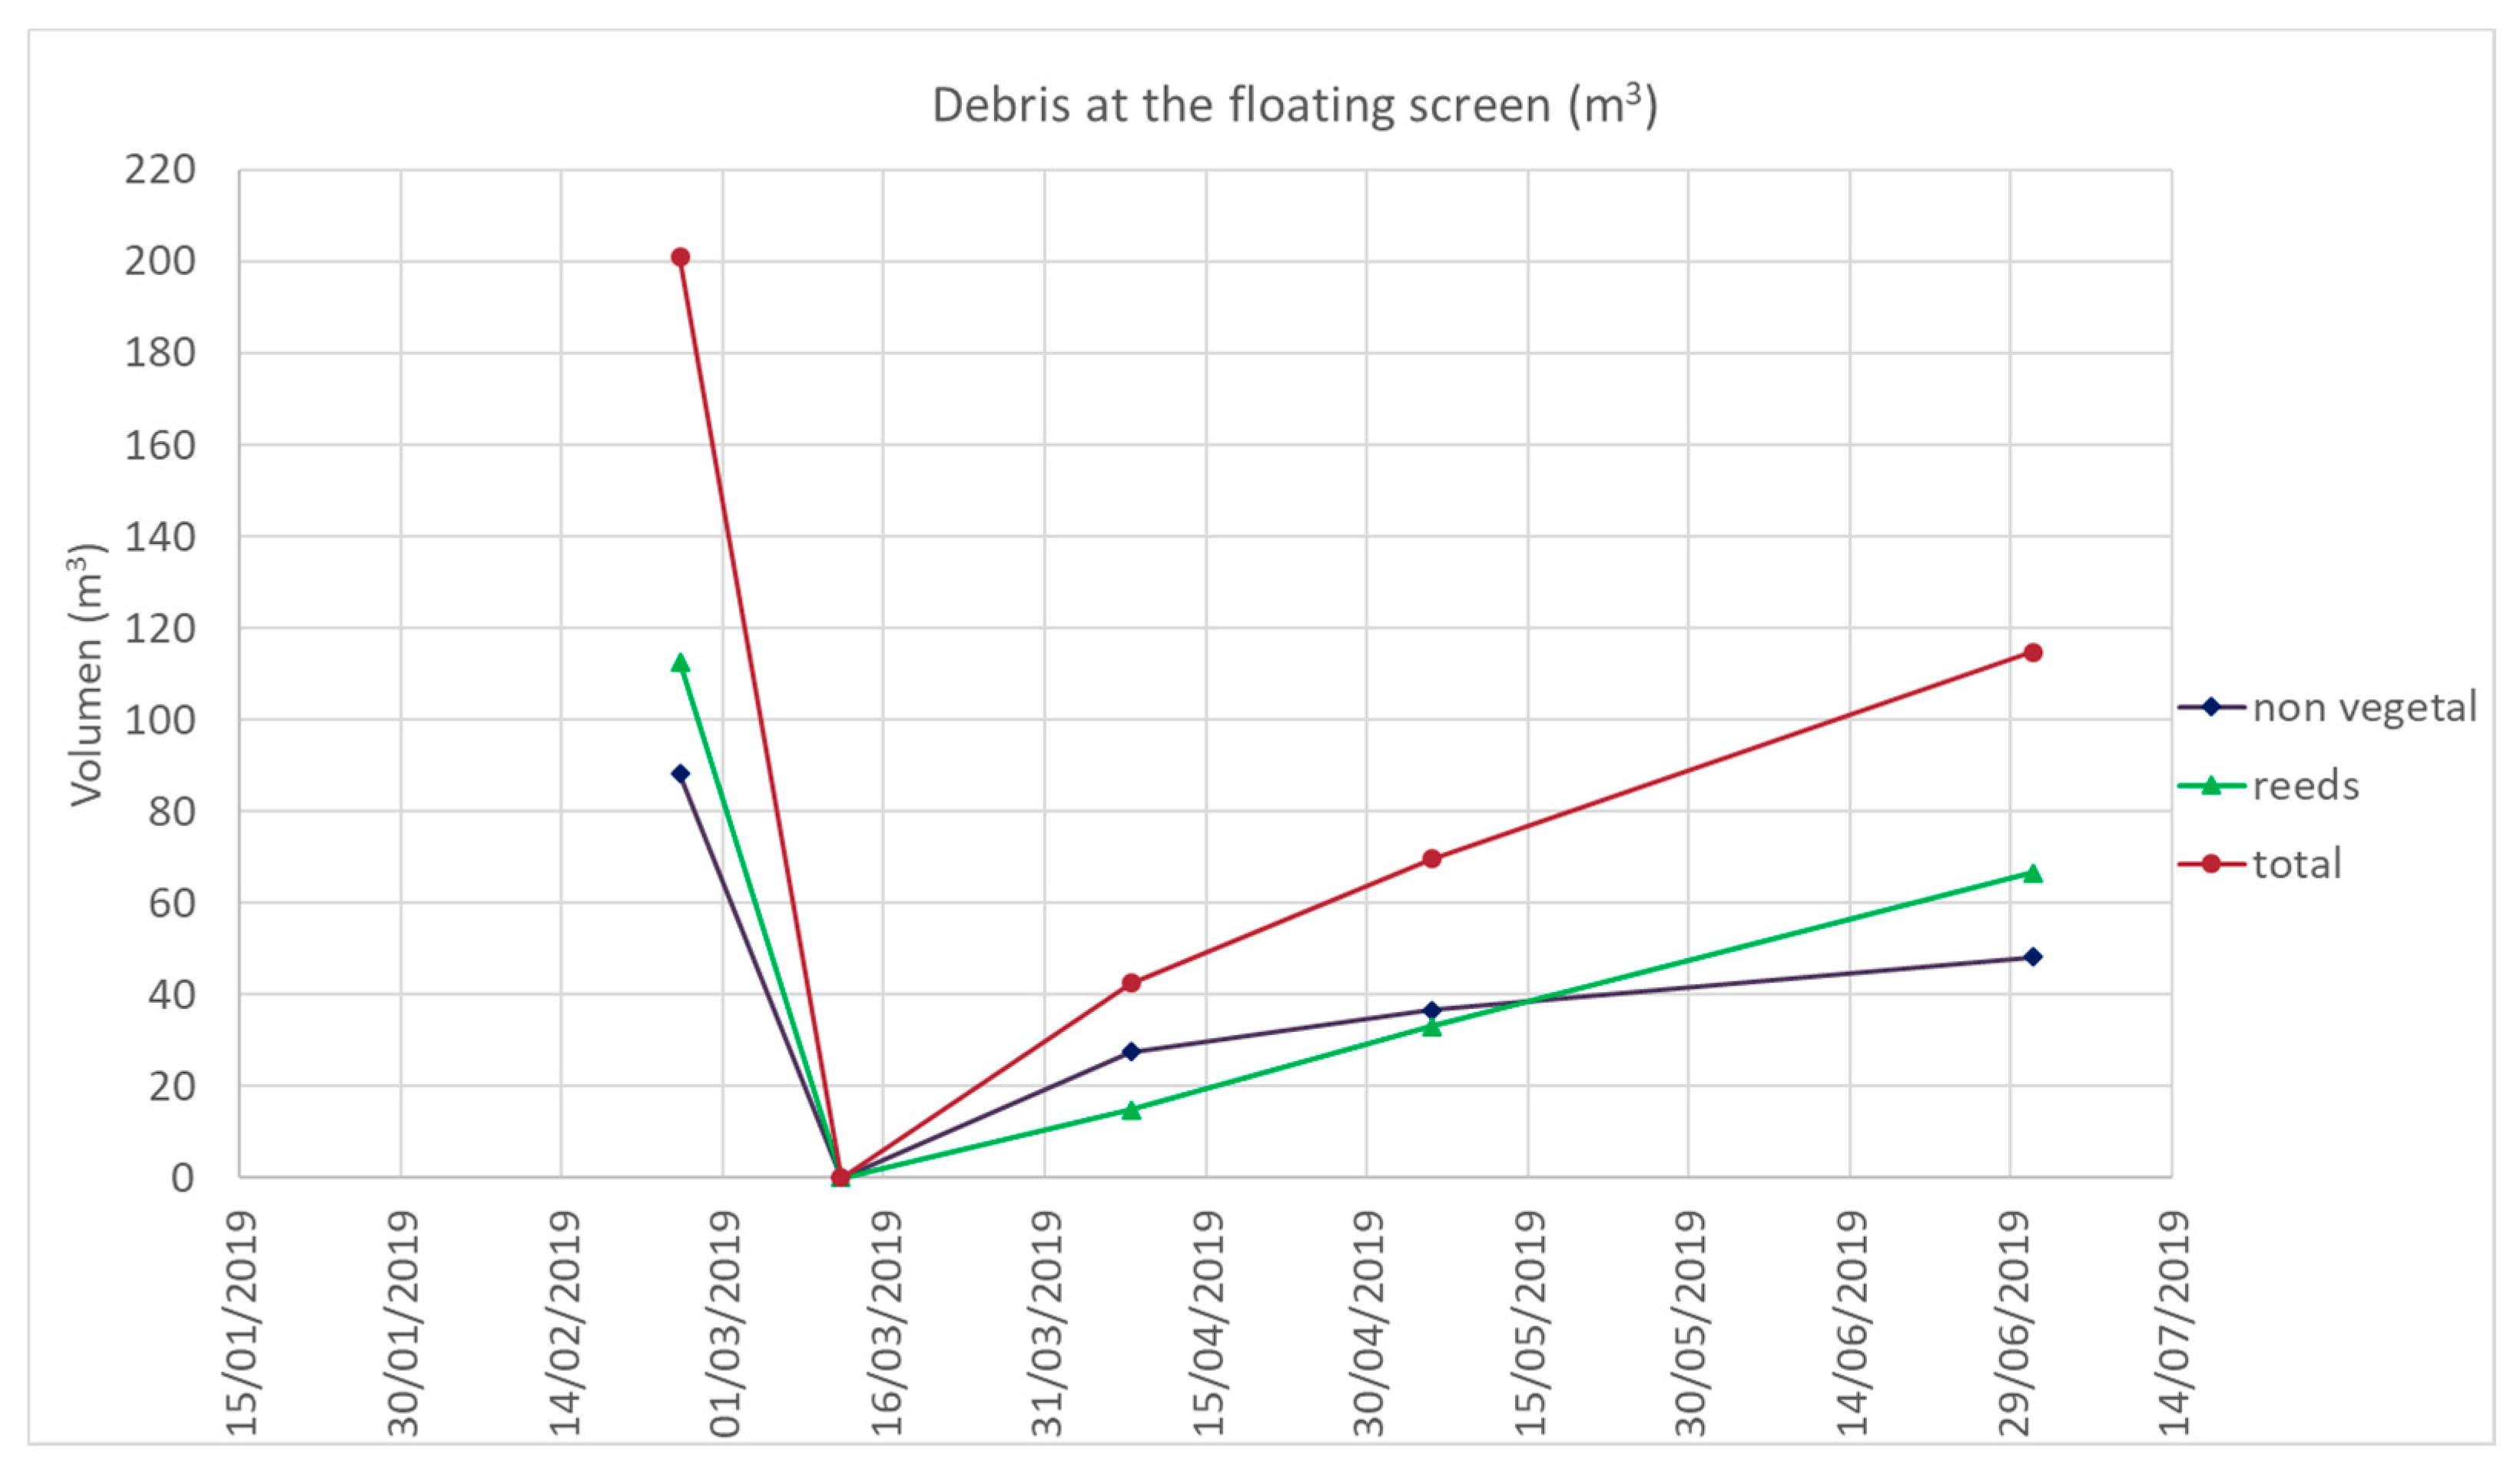
3.1. Debris Volume
3.2. Waste Characterization
3.3. Economic Appraisal of Yearly Waste Removal
4. Discussion
5. Conclusions
6. Recommendations
Author Contributions
Funding
Institutional Review Board Statement
Informed Consent Statement
Data Availability Statement
Acknowledgments
Conflicts of Interest
References
- Caulton, E.; Mocogni, M. Preliminary Studies of Man-Made Litter in the Firth of Forth, Scotland. Mar. Pollut. Bull. 1987, 18, 446–450. [Google Scholar] [CrossRef]
- Martinez-Ribes, L.; Basterretxea, G.; Palmer, M.; Tintoré, J. Origin and Abundance of Beach Debris in the Balearic Islands. Sci. Mar. 2007, 71, 305–314. [Google Scholar] [CrossRef]
- Sadri, S.S.; Thompson, R.C. On the Quantity and Composition of Floating Plastic Debris Entering and Leaving the Tamar Estuary, Southwest England. Mar. Pollut. Bull. 2014, 81, 55–60. [Google Scholar] [CrossRef]
- Ali, R.; Shams, Z.I. Quantities and Composition of Shore Debris along Clifton Beach, Karachi, Pakistan. J. Coast. Conserv. 2015, 19, 527–535. [Google Scholar] [CrossRef]
- Suaria, G.; Melinte-Dobrinescu, M.C.; Ion, G.; Aliani, S. First Observations on the Abundance and Composition of Floating Debris in the North-Western Black Sea. Mar. Environ. Res. 2015, 107, 45–49. [Google Scholar] [CrossRef] [PubMed]
- Munari, C.; Corbau, C.; Simeoni, U.; Mistri, M. Marine Litter on Mediterranean Shores: Analysis of Composition, Spatial Distribution and Sources in North-Western Adriatic Beaches. Waste Manag. 2016, 49, 483–490. [Google Scholar] [CrossRef] [PubMed]
- Giovacchini, A.; Merlino, S.; Locritani, M.; Stroobant, M. Spatial Distribution of Marine Litter along Italian Coastal Areas in the Pelagos Sanctuary (Ligurian Sea—NW Mediterranean Sea): A Focus on Natural and Urban Beaches. Mar. Pollut. Bull. 2018, 130, 140–152. [Google Scholar] [CrossRef] [PubMed]
- Ourmieres, Y.; Mansui, J.; Molcard, A.; Galgani, F.; Poitou, I. The Boundary Current Role on the Transport and Stranding of Floating Marine Litter: The French Riviera Case. Cont. Shelf Res. 2018, 155, 11–20. [Google Scholar] [CrossRef] [Green Version]
- Zeri, C.; Adamopoulou, A.; Bojanić Varezić, D.; Fortibuoni, T.; Kovač Viršek, M.; Kržan, A.; Mandic, M.; Mazziotti, C.; Palatinus, A.; Peterlin, M.; et al. Floating Plastics in Adriatic Waters (Mediterranean Sea): From the Macro- to the Micro-Scale. Mar. Pollut. Bull. 2018, 136, 341–350. [Google Scholar] [CrossRef] [PubMed]
- Faure, F.; Corbaz, M.; Baecher, H.; Felippe, L. Pollution Due to Plastics and Microplastics in Lake Geneva and in the Mediterranean Sea. Arch. Des. Sci. 2012, 7, 157–163. [Google Scholar]
- Baldwin, A.K.; Corsi, S.R.; Mason, S.A. Plastic Debris in 29 Great Lakes Tributaries: Relations to Watershed Attributes and Hydrology. Environ. Sci. Technol. 2016, 50, 10377–10385. [Google Scholar] [CrossRef]
- Šebo, J.; Gróf, M.; Šebová, M. A Contingent Valuation Study of a Polluted Urban Lake in Košice, Slovakia: The Case of the Positive Distance Effect. J. Environ. Manag. 2019, 243, 331–339. [Google Scholar] [CrossRef] [PubMed]
- Vlachogianni, T.; Fortibuoni, T.; Ronchi, F.; Zeri, C.; Mazziotti, C.; Tutman, P.; Varezić, D.B.; Palatinus, A.; Trdan, Š.; Peterlin, M.; et al. Marine Litter on the Beaches of the Adriatic and Ionian Seas: An Assessment of Their Abundance, Composition and Sources. Mar. Pollut. Bull. 2018, 131, 745–756. [Google Scholar] [CrossRef] [PubMed]
- Schwarz, A.E.; Ligthart, T.N.; Boukris, E.; van Harmelen, T. Sources, Transport, and Accumulation of Different Types of Plastic Litter in Aquatic Environments: A Review Study. Mar. Pollut. Bull. 2019, 143, 92–100. [Google Scholar] [CrossRef]
- Laist, D.W. Impacts of marine debris: Entanglement of marine life in marine debris including a comprehensive list of species with entanglement and ingestion records. In Marine Debris, Sources, Impacts, and Solutions; Coe, J.M., Rogers, D.B., Eds.; Springer: New York, NY, USA, 1997; pp. 99–139. [Google Scholar]
- Gall, S.C.; Thompson, R.C. The Impact of Debris on Marine Life. Mar. Pollut. Bull. 2015, 92, 170–179. [Google Scholar] [CrossRef]
- Kühn, S.; Rebolledo, E.L.B.; Franeker, J.A. van Deleterious Effects of Litter on Marine Life. Mar. Anthropog. Litter 2015, 75–116. [Google Scholar] [CrossRef] [Green Version]
- Law, K.L. Plastics in the Marine Environment. Annu. Rev. Mar. Sci. 2017, 9, 205–229. [Google Scholar] [CrossRef] [Green Version]
- Isangedighi, I.; David, G.; Obot, O. Plastic Waste in the Aquatic Environment: Impacts and Management. Environment 2018, 2, 1–31. [Google Scholar]
- Domènech, F.; Aznar, F.J.; Raga, J.A.; Tomás, J. Two Decades of Monitoring in Marine Debris Ingestion in Loggerhead Sea Turtle, Caretta Caretta, from the Western Mediterranean. Environ. Pollut. 2019, 244, 367–378. [Google Scholar] [CrossRef]
- McIlgorm, A.; Campbell, H.F.; Rule, M.J. The Economic Cost and Control of Marine Debris Damage in the Asia-Pacific Region. Ocean Coast. Manag. 2011, 54, 643–651. [Google Scholar] [CrossRef]
- Werner, S.; Budziak, A.; van Franeker, J.A.; Galgani, F.; Hanke, G.; Maes, T.; Matiddi, M.; Nilsson, P.; Oosterbaan, L.; Priestland, E.; et al. Harm Caused by Marine Litter; European Union: Brussels, Belgium, 2016; ISBN 978-92-79-64534-1. [Google Scholar]
- Williams, A.T.; Randerson, P.; Di Giacomo, C.; Anfuso, G.; Macias, A.; Perales, J.A. Distribution of Beach Litter along the Coastline of Cádiz, Spain. Mar. Pollut. Bull. 2016, 107, 77–87. [Google Scholar] [CrossRef] [PubMed]
- Jang, Y.C.; Lee, J.; Hong, S.; Lee, J.S.; Shim, W.J.; Song, Y.K. Sources of Plastic Marine Debris on Beaches of Korea: More from the Ocean than the Land. Ocean Sci. J. 2014, 49, 151–162. [Google Scholar] [CrossRef]
- Krelling, A.P.; Williams, A.T.; Turra, A. Differences in Perception and Reaction of Tourist Groups to Beach Marine Debris That Can Influence a Loss of Tourism Revenue in Coastal Areas. Mar. Policy 2017, 85, 87–99. [Google Scholar] [CrossRef]
- Qiang, M.; Shen, M.; Xie, H. Loss of Tourism Revenue Induced by Coastal Environmental Pollution: A Length-of-Stay Perspective. J. Sustain. Tour. 2020, 28, 550–567. [Google Scholar] [CrossRef]
- Andrady, A.L. Microplastics in the Marine Environment. Mar. Pollut. Bull. 2011, 62, 1596–1605. [Google Scholar] [CrossRef] [PubMed]
- Dris, R.; Gasperi, J.; Rocher, V.; Saad, M.; Renault, N.; Tassin, B. Microplastic Contamination in an Urban Area: A Case Study in Greater Paris. Environ. Chem. 2015, 12, 592–599. [Google Scholar] [CrossRef]
- Lechner, A.; Keckeis, H.; Lumesberger-Loisl, F.; Zens, B.; Krusch, R.; Tritthart, M.; Glas, M.; Schludermann, E. The Danube so Colourful: A Potpourri of Plastic Litter Outnumbers Fish Larvae in Europe’s Second Largest River. Environ. Pollut. 2014, 188, 177–181. [Google Scholar] [CrossRef] [Green Version]
- Gasperi, J.; Dris, R.; Bonin, T.; Rocher, V.; Tassin, B. Assessment of Floating Plastic Debris in Surface Water along the Seine River. Environ. Pollut. 2014, 195, 163–166. [Google Scholar] [CrossRef] [Green Version]
- Morritt, D.; Stefanoudis, P.V.; Pearce, D.; Crimmen, O.A.; Clark, P.F. Plastic in the Thames: A River Runs through It. Mar. Pollut. Bull. 2014, 78, 196–200. [Google Scholar] [CrossRef]
- Guerranti, C.; Cannas, S.; Scopetani, C.; Fastelli, P.; Cincinelli, A.; Renzi, M. Plastic Litter in Aquatic Environments of Maremma Regional Park (Tyrrhenian Sea, Italy): Contribution by the Ombrone River and Levels in Marine Sediments. Mar. Pollut. Bull. 2017, 117, 366–370. [Google Scholar] [CrossRef]
- Rech, S.; Macaya-Caquilpán, V.; Pantoja, J.F.; Rivadeneira, M.M.; Jofre Madariaga, D.; Thiel, M. Rivers as a Source of Marine Litter—A Study from the SE Pacific. Mar. Pollut. Bull. 2014, 82, 66–75. [Google Scholar] [CrossRef]
- Rech, S.; Macaya-Caquilpán, V.; Pantoja, J.F.; Rivadeneira, M.M.; Campodónico, C.K.; Thiel, M. Sampling of Riverine Litter with Citizen Scientists—Findings and Recommendations. Environ. Monit. Assess. 2015, 187, 335. [Google Scholar] [CrossRef]
- Moore, C.J.; Lattin, G.L.; Zellers, A.F. Quantity and Type of Plastic Debris Flowing from Two Urban Rivers to Coastal Waters and Beaches of Southern California. RGCI 2011, 11, 65–73. [Google Scholar] [CrossRef]
- Pinto, U.; Maheshwari, B.L. Community Perspectives on Managing Health of Peri-Urban River System: Evidence from the Hawkesbury-Nepean River Catchment, Australia. J. Environ. Plan. Manag. 2016, 59, 1257–1276. [Google Scholar] [CrossRef]
- Wan, J.; Wang, Y.; Cheng, M.; Engel, B.A.; Zhang, W.; Peng, H. Assessment of Debris Inputs from Land into the River in the Three Gorges Reservoir Area, China. Environ. Sci. Pollut. Res. 2018, 25, 5539–5549. [Google Scholar] [CrossRef]
- Jang, S.-W.; Kim, D.-H.; Chung, Y.-H.; Yoon, H.-J. A Study on Exploring Accumulation Zone and Composition Investigation of Floating Debris in Nakdong River Basin. J. Korean Assoc. Geogr. Inf. Stud. 2015, 18. [Google Scholar] [CrossRef]
- Hosseini, S.M.; Coonrod, J. Coupling Numerical and Physical Modeling for Analysis of Flow in a Diversion Structure with Coanda-Effect Screens. Water 2011, 3, 764–786. [Google Scholar] [CrossRef] [Green Version]
- Toniolo, H. The Effects of Surface Debris Diversion Devices on River Hydrodynamic Conditions and Implications for In-Stream Hydrokinetic Development. Water 2014, 6, 2164–2174. [Google Scholar] [CrossRef] [Green Version]
- Meister, J.; Fuchs, H.; Beck, C.; Albayrak, I.; Boes, R.M. Head Losses of Horizontal Bar Racks as Fish Guidance Structures. Water 2020, 12, 475. [Google Scholar] [CrossRef] [Green Version]
- European Environment Agency. Europe’s Environment—The Dobris Assessment; European Environment Agency: Copenhague, Denmark, 1995.
- Martí, P.; García-Mayor, C. The Huerta Agricultural Landscape in the Spanish Mediterranean Arc: One Landscape, Two Perspectives, Three Specific Huertas. Land 2020, 9, 460. [Google Scholar] [CrossRef]
- Aguiar, F.C.F.; Ferreira, M.T. Plant Invasions in the Rivers of the Iberian Peninsula, South-Western Europe: A Review. Plant Biosyst. Int. J. Deal. Asp. Plant Biol. 2013, 147, 1107–1119. [Google Scholar] [CrossRef]
- Sánchez, R.A.; Molina, H.P.; Osorio, M.C.R.; García, F.H.; Navarro, A.M.; Zapata, J.A.S.; Robles, F.B.; Casalduero, A.G.; de Revenga Martínez, E.D.; Blaya, E.P.; et al. Modernización de los regadíos tradicionales la Vega Baja del Segura. In Agroalimentación, Agua y Sostenibilidad; Joaquín, M.M., Ricardo, A.S., Eds.; Ayuntamiento de Orihuela, Universidad de Alicante: Alicante, Spain, 2018; pp. 141–168. ISBN 978-84-13-02014-3. [Google Scholar]
- Nakashima, E.; Isobe, A.; Magome, S.; Kako, S.; Deki, N. Using Aerial Photography and in Situ Measurements to Estimate the Quantity of Macro-Litter on Beaches. Mar. Pollut. Bull. 2011, 62, 762–769. [Google Scholar] [CrossRef] [PubMed]
- European Commission; Joint Research Centre; Institute for Environment and Sustainability; MSFD Technical Subgroup on Marine Litter. Guidance on Monitoring of Marine Litter in European Seas; Publications Office: Luxembourg, 2013; ISBN 978-92-79-32709-4. [Google Scholar]
- González-Fernández, D.; Hanke, G.; the RiLON Network. Floating Macro Litter in European Rivers—Top. Items; Publications Office of the European Union: Luxembourg, 2018. [Google Scholar]
- CYPE Ingenieros, S.A. CYPE. Available online: www.cype.es (accessed on 3 February 2021).
- La Verdad La Basura Flotante Reaparece En El Río Segura Horas Después de Limpiarlo|La Verdad. La Verdad. 2019. Available online: https://www.laverdad.es/murcia/basura-flotante-reaparece-20190315012226-ntvo.html (accessed on 14 July 2020).
- Pamies, D. La Confederación Vuelve a Culpar al Riego Tradicional de La Contaminación Del Segura—Informacion.Es. 2019. Available online: https://www.informacion.es/vega-baja/2019/03/14/confederacion-vuelve-culpar-riego-tradicional-5469160.html (accessed on 14 July 2020).
- Puerto Molina, H.M.; Melián Navarro, A.; Rocamora Osorio, M.C.; Ruiz Canales, A.; Cámara Zapata, J.M.; Abadía Sánchez, R. Social and Irrigation Water Management Issues in Some Water User’s Associations of the Low Segura River Valley (Alicante, Spain). Sustain. Irrig. Manag. Technol. Policies 2006, 1, 205–214. [Google Scholar]
- Abadía, R.; Brugarolas, M.; Rocamora, C.; Martínez-Carrasco, L.; Puerto, H.; Cordero, J. Causes, Consequences and Solutions to the Problem of Floating Solid Waste in the Segura River and Its Irrigation Channels, in the District of Vega Baja (Alicante, Spain). In Proceedings of the 5th International Congress Water, Waste, and Energy Management (WWEM-19), Paris, France, 22–24 July 2019; p. 178. [Google Scholar]


| ID1 | Azud de las Norias. At that point there is a dam to derive water. It is the first singular point of the river in the Vega Baja district and thus in the province of Alicante. |
| ID2 | Boom at the Molino de la Ciudad. Retention element installed by the Segura River Authority. |
| ID3 | Boom at Almoradí. Retention element installed by the Segura River Authority. |
| ID4 | Azud de Alfeitamí. It is a dam to derive water to the ditch of Almoradí. |
| ID5 | Sluices on the inlet of Riegos de Levante irrigators community. |
| ID6 | Acequia de Callosa, syphon at the crossing with Acequia Vieja de Almoradí. |
| ID7 | Azarbe de Cebadas, syphon at the crossing with Azarbe del Convenio. |
| ID8 | Guardamar floating screen. It is a retention system installed at the mouth of the old river to avoid the arrival at sea of floating debris that comes from the drainage ditches that discharge on the left bank into the last section of the river. |
| Category | Classes | |
|---|---|---|
| 1 | Vegetal material | Reeds, branches, algae, fruits, and vegetables |
| 2 | Dead animals | Wild animals, domestic animals, livestock |
| 3 | Beverage containers | Water bottles, soft drinks bottles, water cans, soda cans |
| 4 | Plastic household containers | Oil bottles, plastic cups and plates, food containers, empty bags, plastic sheeting, full garbage bags, personal hygiene products containers, cleaning products containers |
| 5 | Other household containers | Tetrabricks, canned cans, aerosols |
| 6 | Industrial waste | Packaging of motor oil and automobile products, rubber, manufactured wood |
| 7 | Other materials | Textiles, footwear, balls, toys, paper, and cardboard |
| 8 | Others | Medication boxes and blisters, lamps, gas bottles, etc. |
| 9 | Glass containers | Glass bottles of beer, wine, liquor or soft drinks, food jars, cosmetic jars |
| 10 | Agricultural containers | Cans and bottles of phytosanitary products, fertilizer bags and boxes |
| 11 | Other agricultural waste | Transplant trays, drip irrigation pipes |
| ID6 | ID7 | ||||
|---|---|---|---|---|---|
| Category | Volume (m3) | Weight (kg) | Volume (m3) | Weight (kg) | |
| 1 | Vegetal material | 7.5 | 3000 a | 0.02 | 0.05 |
| 2 | Dead animals | 0.2 b | 50 b | - | - |
| 3 | Beverage containers | 2.3 | 41.41 | 0.23 | 7.41 |
| 4–8 | Plastic household containers, other household containers, industrial waste, other materials, others | 1 | 79.76 | 0.06 | 7.2 |
| 9 | Glass containers | 0.6 | 89.8 | 0.04 | 15.5 |
| 10 | Agricultural containers | 0.5 | 17.21 | 0.05 | 4.54 |
| 11 | Other agricultural waste | 1 | 14.52 | 0.1 | 10.28 |
| ID6 | ID7 | ||||
|---|---|---|---|---|---|
| Category | Image Analysis | Extraction | Image Analysis | Extraction | |
| 1 | Vegetal material | a | a | a | a |
| 2 | Dead animals | 0 | 4 | 0 | 0 |
| 3 | Beverage containers | 238 | 646 | 67 | 112 |
| 4 | Plastic household containers | 53 | 326 | 18 | 31 |
| 5 | Other household containers | 6 | 37 | 5 | 15 |
| 6 | Industrial waste | 0 | 15 | 0 | 4 |
| 7 | Other materials | 8 | 107 | 0 | 4 |
| 8 | Others | 0 | 47 | 0 | 3 |
| 9 | Glass containers | 11 | 184 | 11 | 31 |
| 10 | Agricultural containers | 17 | 50 | 7 | 11 |
| 11 | Other agricultural waste | 27 | b | 25 | b |
| Date | Water Plastic Bottles (1.5 to 2 L) | Water Plastic Drums (5 to 8 L) | Personal Care and Cleaning Product Containers | Cans, Tetrabricks, and Other Household Containers | Full Garbage Bags | Other Materials (Balls, Shoes, Toys) | Glass Bottles | Cans and Bottles of Phytosanitary Poducts | Transplant Trays and Fragments | |
|---|---|---|---|---|---|---|---|---|---|---|
| ID1 | 25/02/19 | 14 | 2 | 8 | 3 | 0 | 5 | 2 | 0 | 0 |
| ID1 | 06/05/19 | 8 | 1 | 3 | 0 | 0 | 1 | 0 | 0 | 4 |
| ID1 | 01/07/19 | 7 | 1 | 2 | 0 | 0 | 1 | 1 | 1 | 0 |
| ID2 | 25/02/19 | 42 | 4 | 4 | 7 | 0 | 1 | 4 | 6 | 2 |
| ID2 | 06/05/19 | 51 | 4 | 2 | 0 | 2 | 0 | 0 | 1 | 5 |
| ID3 | 08/04/19 | 109 | 0 | 18 | 0 | 0 | 1 | 6 | 2 | 5 |
| ID4 | 08/04/19 | 35 | 2 | 9 | 15 | 4 | 2 | 6 | 5 | 10 |
| ID4 | 06/05/19 | 10 | 6 | 3 | 0 | 0 | 1 | 7 | 3 | 0 |
| ID5 | 06/05/19 | 63 | 7 | 4 | 3 | 0 | 1 | 1 | 6 | 9 |
| ID6 | 25/02/19 | 56 | 0 | 9 | 2 | 0 | 2 | 0 | 2 | 4 |
| ID6 | 06/05/19 | 214 | 7 | 10 | 3 | 1 | 8 | 12 | 8 | 22 |
| ID6 | 24/05/19 | 112 | 11 | 13 | 10 | 0 | 3 | 10 | 3 | 25 |
| ID6 | 01/07/19 | 36 | 0 | 3 | 10 | 0 | 6 | 3 | 0 | 0 |
| ID7 | 25/02/19 | 191 | 12 | 6 | 13 | 0 | 1 | 0 | 5 | 18 |
| ID7 | 08/04/19 | 39 | 2 | 9 | 15 | 4 | 2 | 6 | 6 | 17 |
| ID7 | 06/05/19 | 2 | 0 | 0 | 1 | 0 | 0 | 0 | 1 | 1 |
| ID7 | 01/07/19 | 65 | 7 | 10 | 9 | 2 | 0 | 10 | 6 | 16 |
| ID7 | 08/07/19 | 58 | 8 | 9 | 11 | 1 | 0 | 11 | 5 | 20 |
| Sum counted objects | 1112 | 74 | 122 | 102 | 14 | 35 | 79 | 60 | 158 | |
Publisher’s Note: MDPI stays neutral with regard to jurisdictional claims in published maps and institutional affiliations. |
© 2021 by the authors. Licensee MDPI, Basel, Switzerland. This article is an open access article distributed under the terms and conditions of the Creative Commons Attribution (CC BY) license (https://creativecommons.org/licenses/by/4.0/).
Share and Cite
Rocamora, C.; Puerto, H.; Abadía, R.; Brugarolas, M.; Martínez-Carrasco, L.; Cordero, J. Floating Debris in the Low Segura River Basin (Spain): Avoiding Litter through the Irrigation Network. Water 2021, 13, 1074. https://doi.org/10.3390/w13081074
Rocamora C, Puerto H, Abadía R, Brugarolas M, Martínez-Carrasco L, Cordero J. Floating Debris in the Low Segura River Basin (Spain): Avoiding Litter through the Irrigation Network. Water. 2021; 13(8):1074. https://doi.org/10.3390/w13081074
Chicago/Turabian StyleRocamora, Carmen, Herminia Puerto, Ricardo Abadía, Margarita Brugarolas, Laura Martínez-Carrasco, and José Cordero. 2021. "Floating Debris in the Low Segura River Basin (Spain): Avoiding Litter through the Irrigation Network" Water 13, no. 8: 1074. https://doi.org/10.3390/w13081074