
Characterizing Spatiotemporal Variations of Soil Salinization and Its Relationship with Eco-Hydrological Parameters at the Regional Scale in the Kashi Area of Xinjiang, China from 2000 to 2017


Abstract
:1. Introduction
2. Materials and Methods
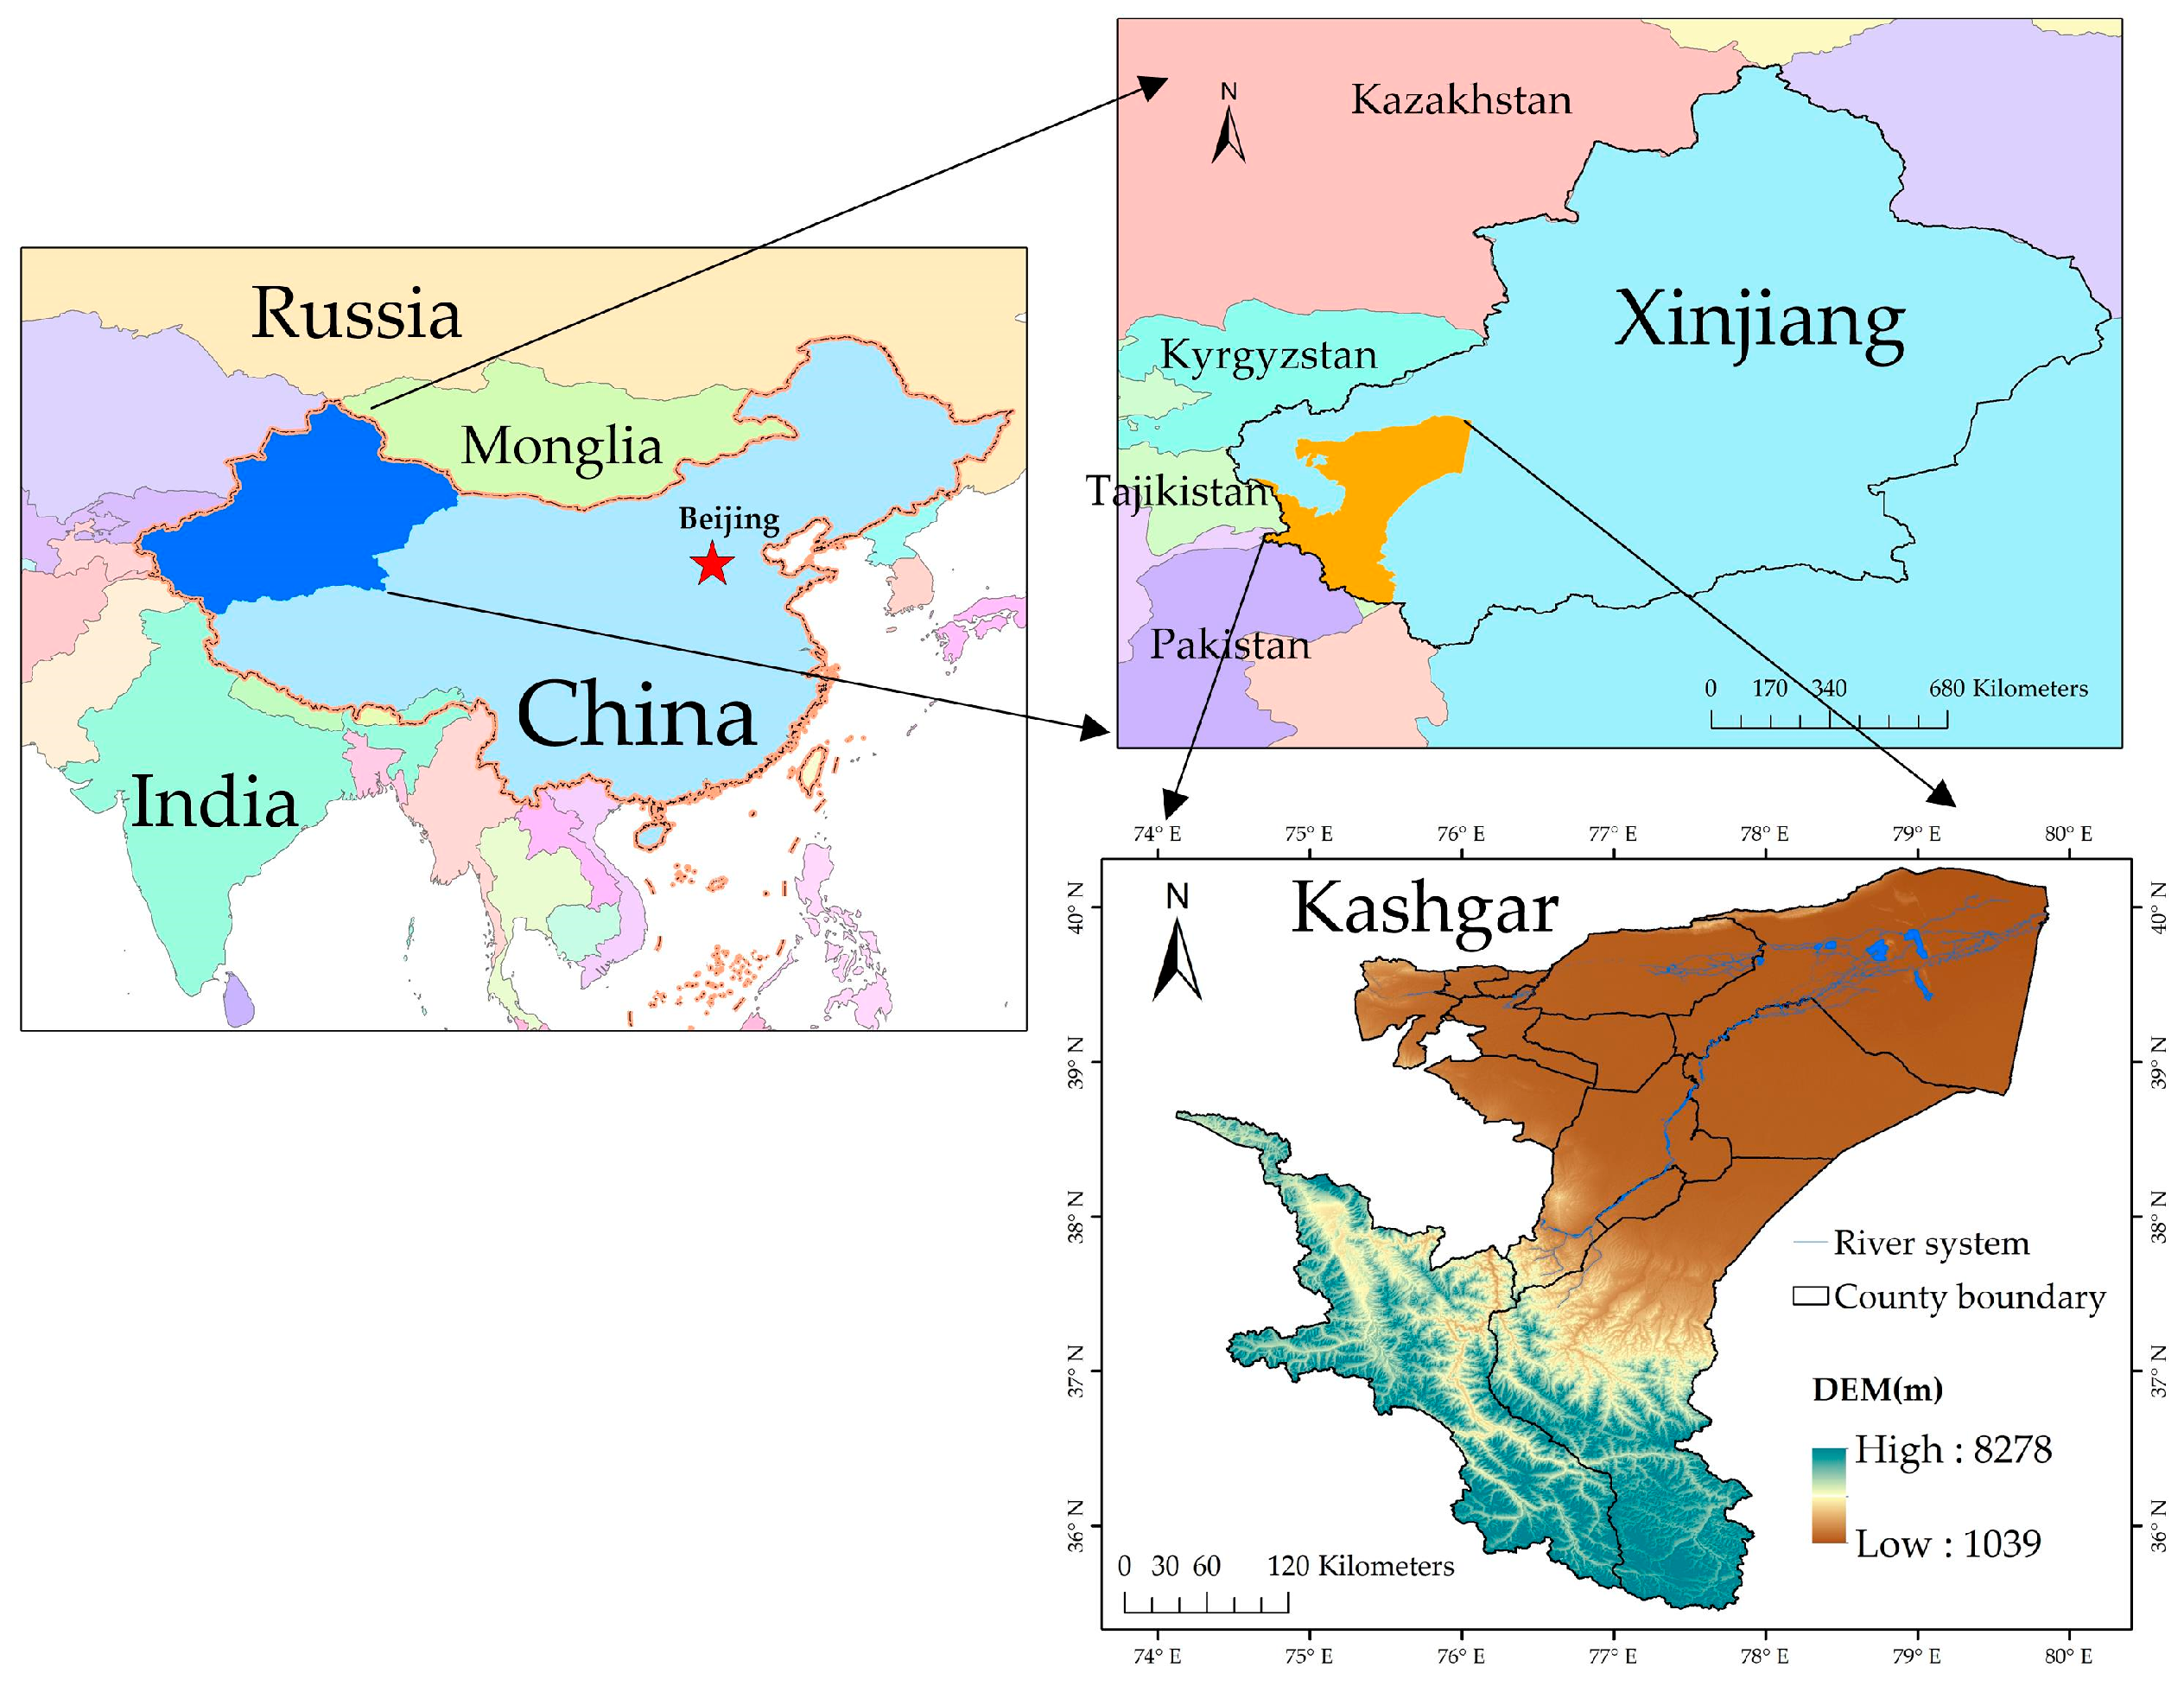
2.1. Study Area
2.2. Data and Preprocessing
2.3. Soil Salinization Severity Interpretation Based On Remote Sensing Data
2.4. Soil Salinization Dynamics Description Based on Transition Matrix
2.5. Mann–Kendall Nonparametric Test
2.6. Relationship between Soil Salinization to Eco-Hydrological Parameters
3. Results
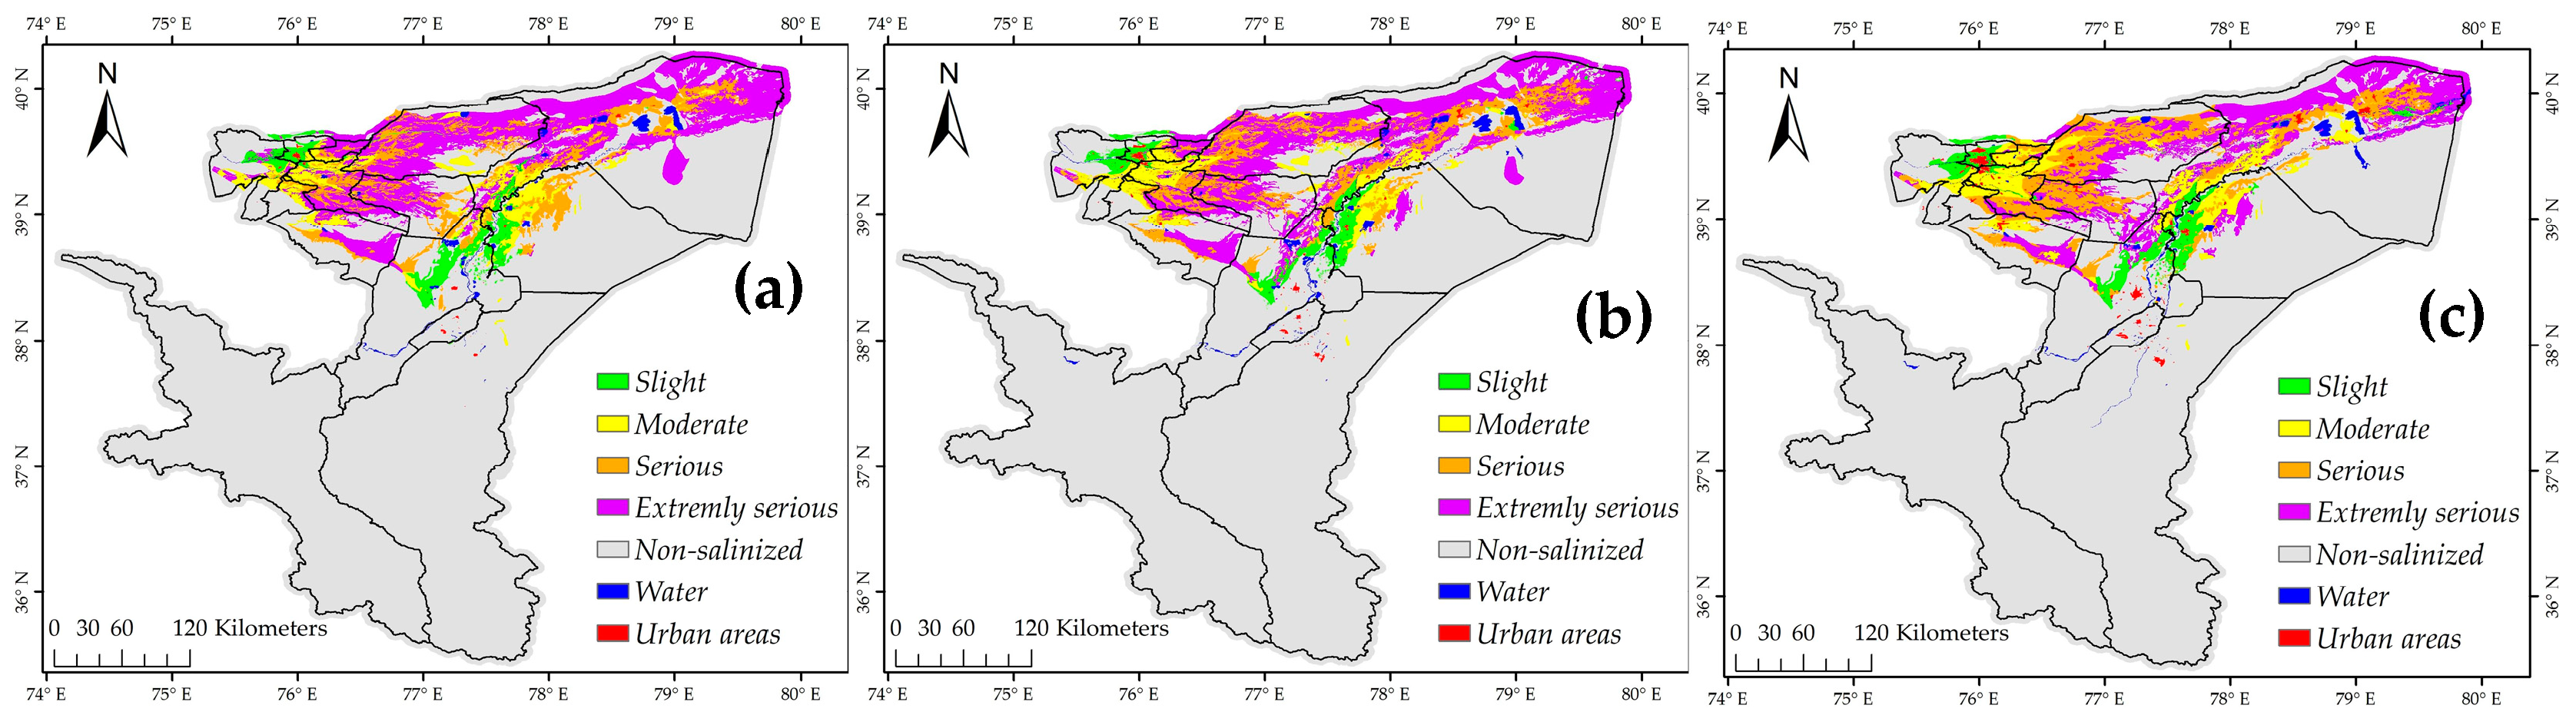
3.1. Spatial Patterns of Soil Salinization in Kashgar Region
3.2. Spatiotemporal Variations of Soil Salinization in the Kashgar Region
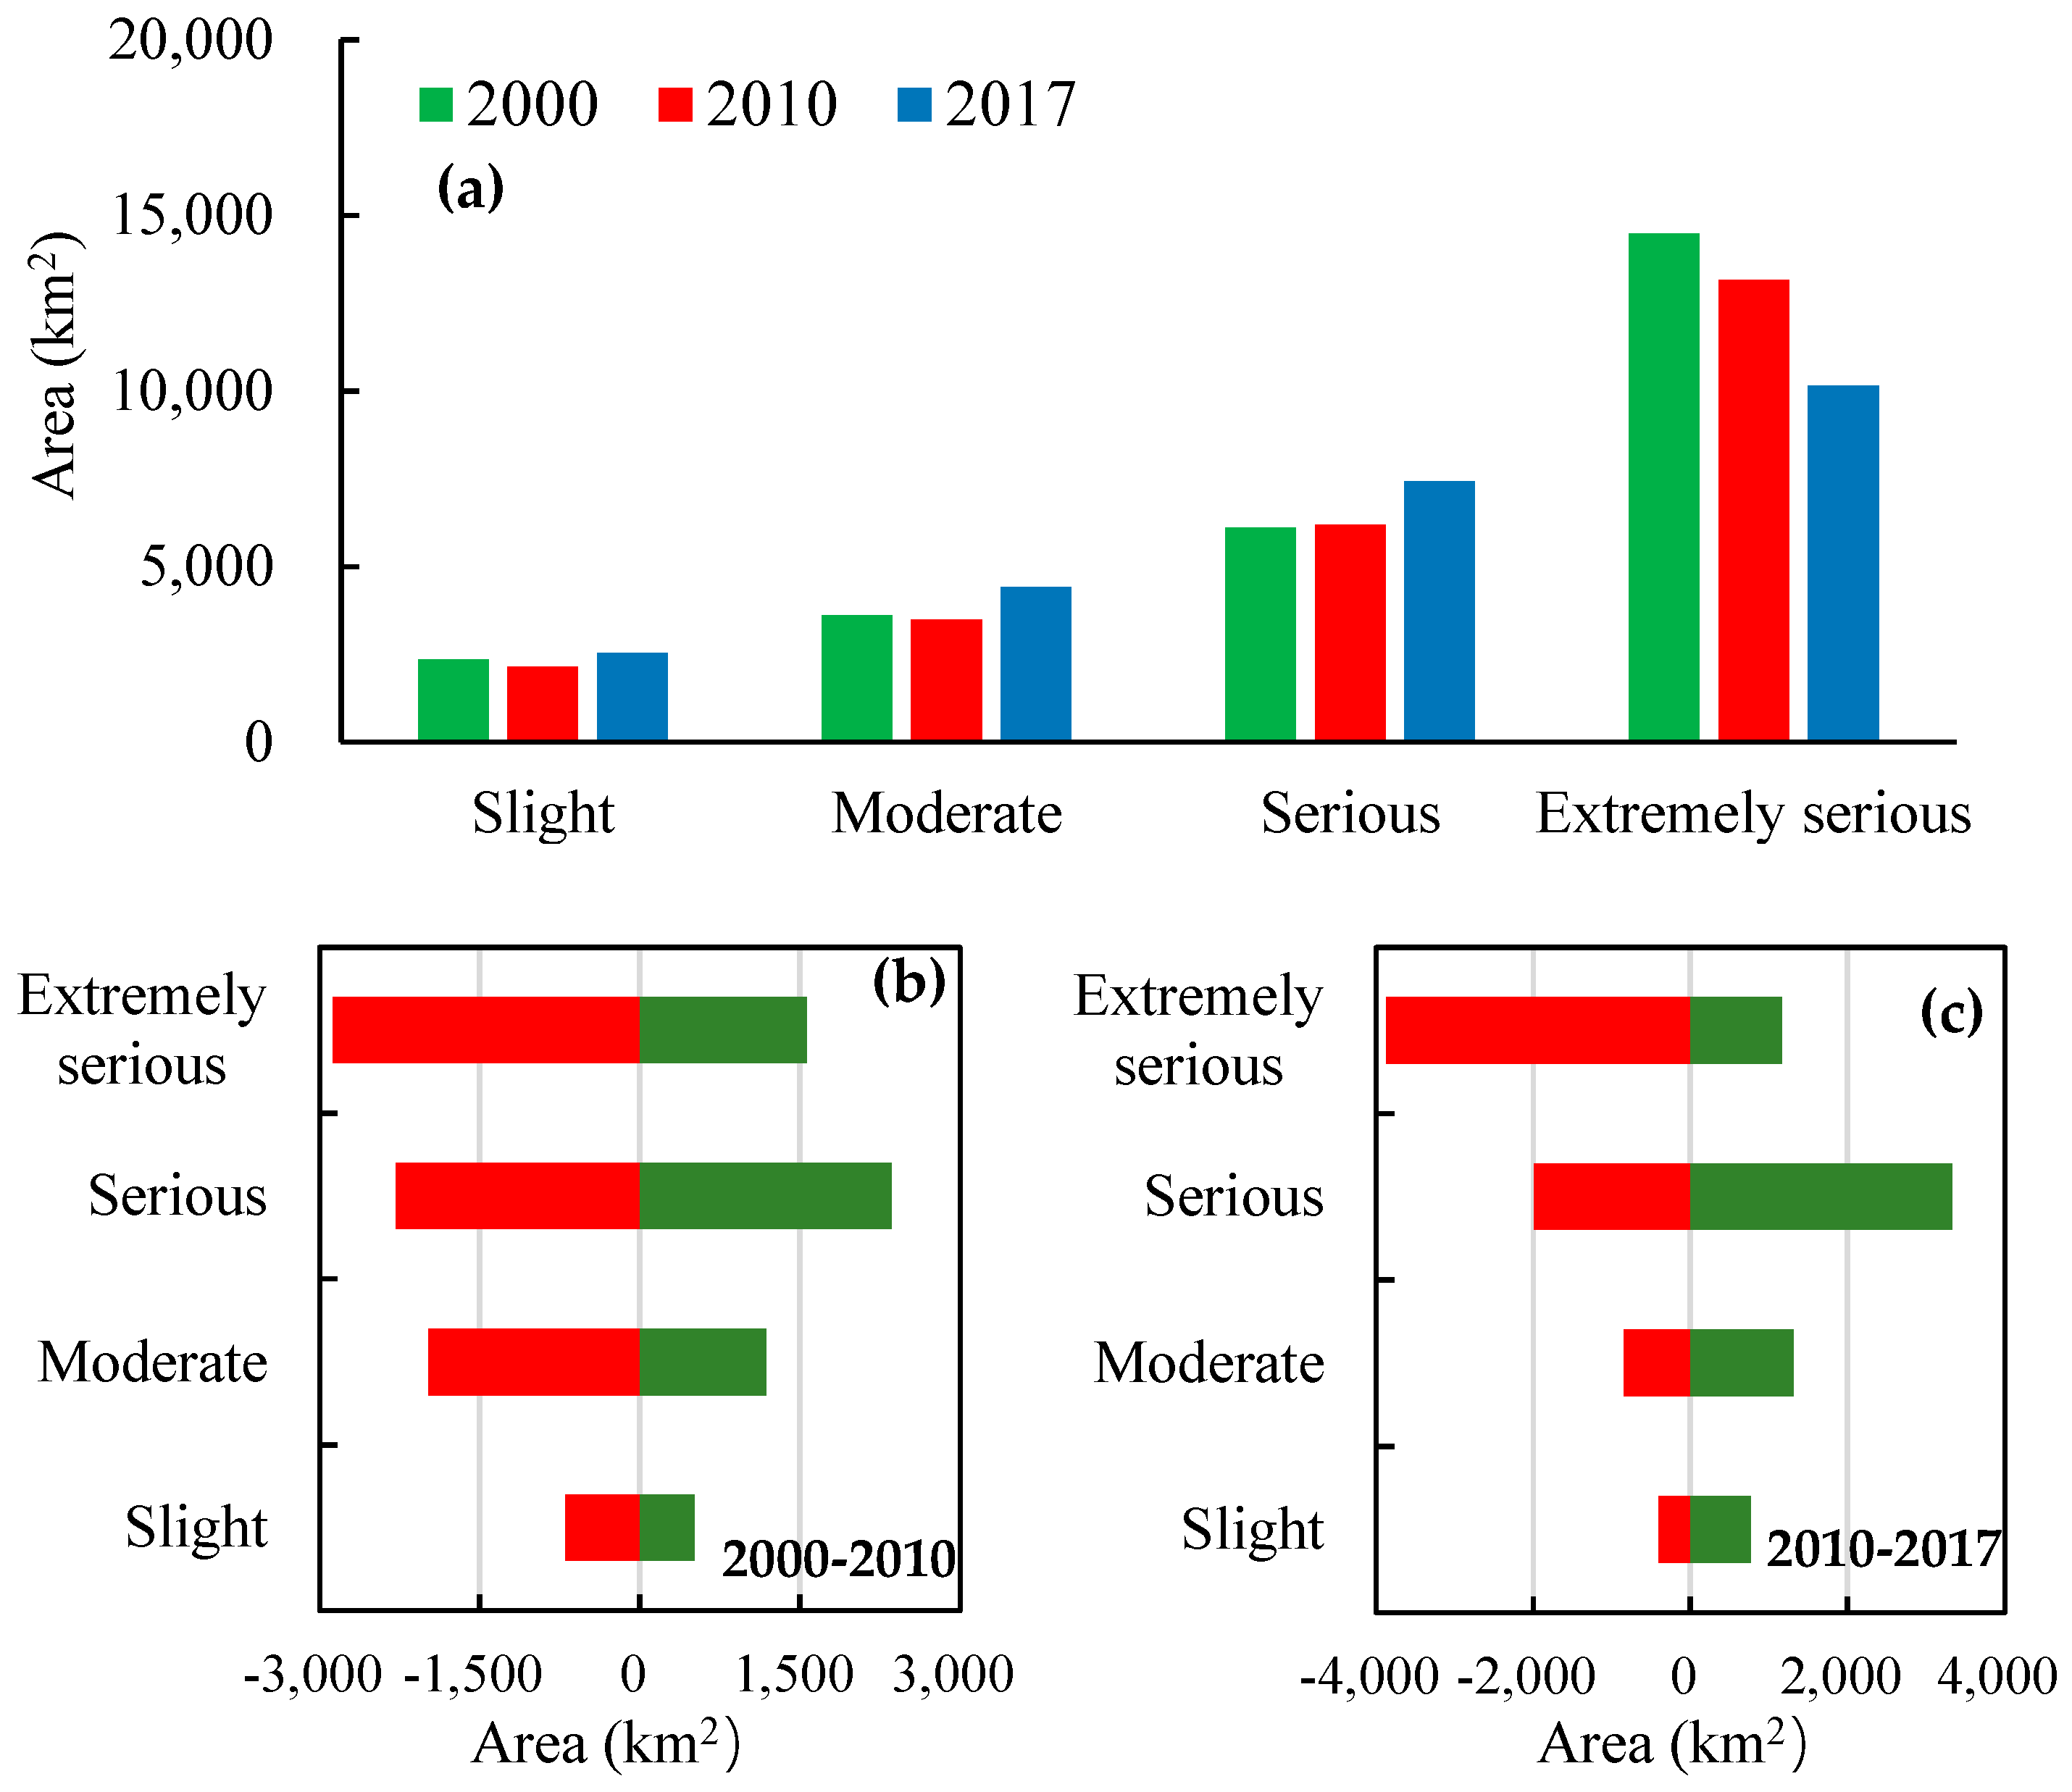
3.2.1. Area Variation of Different Salinized Soil Types
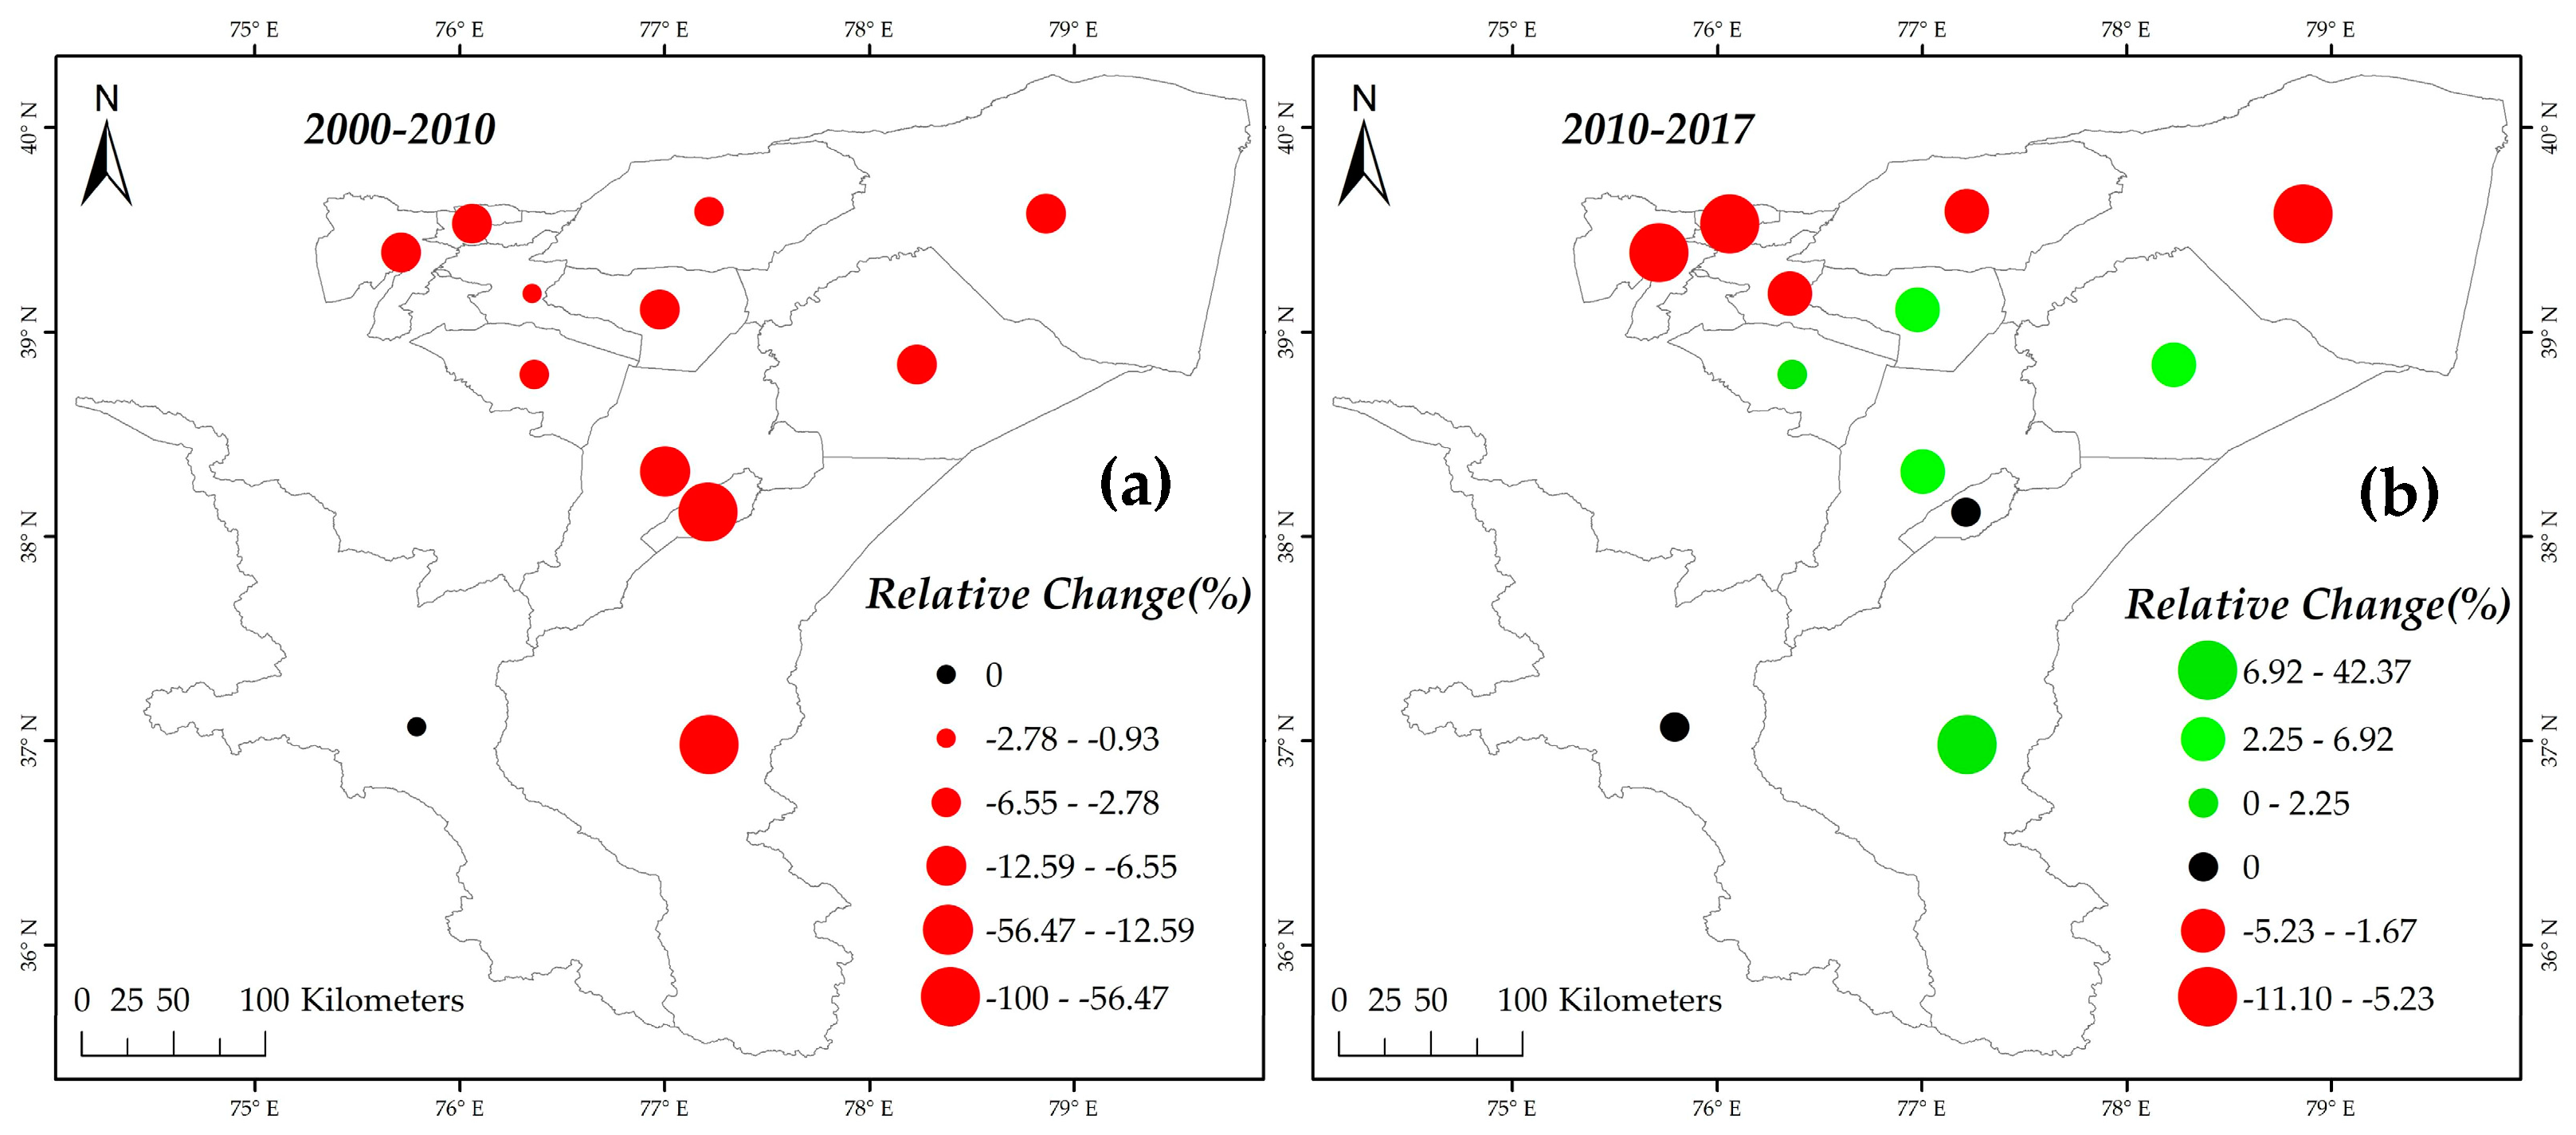
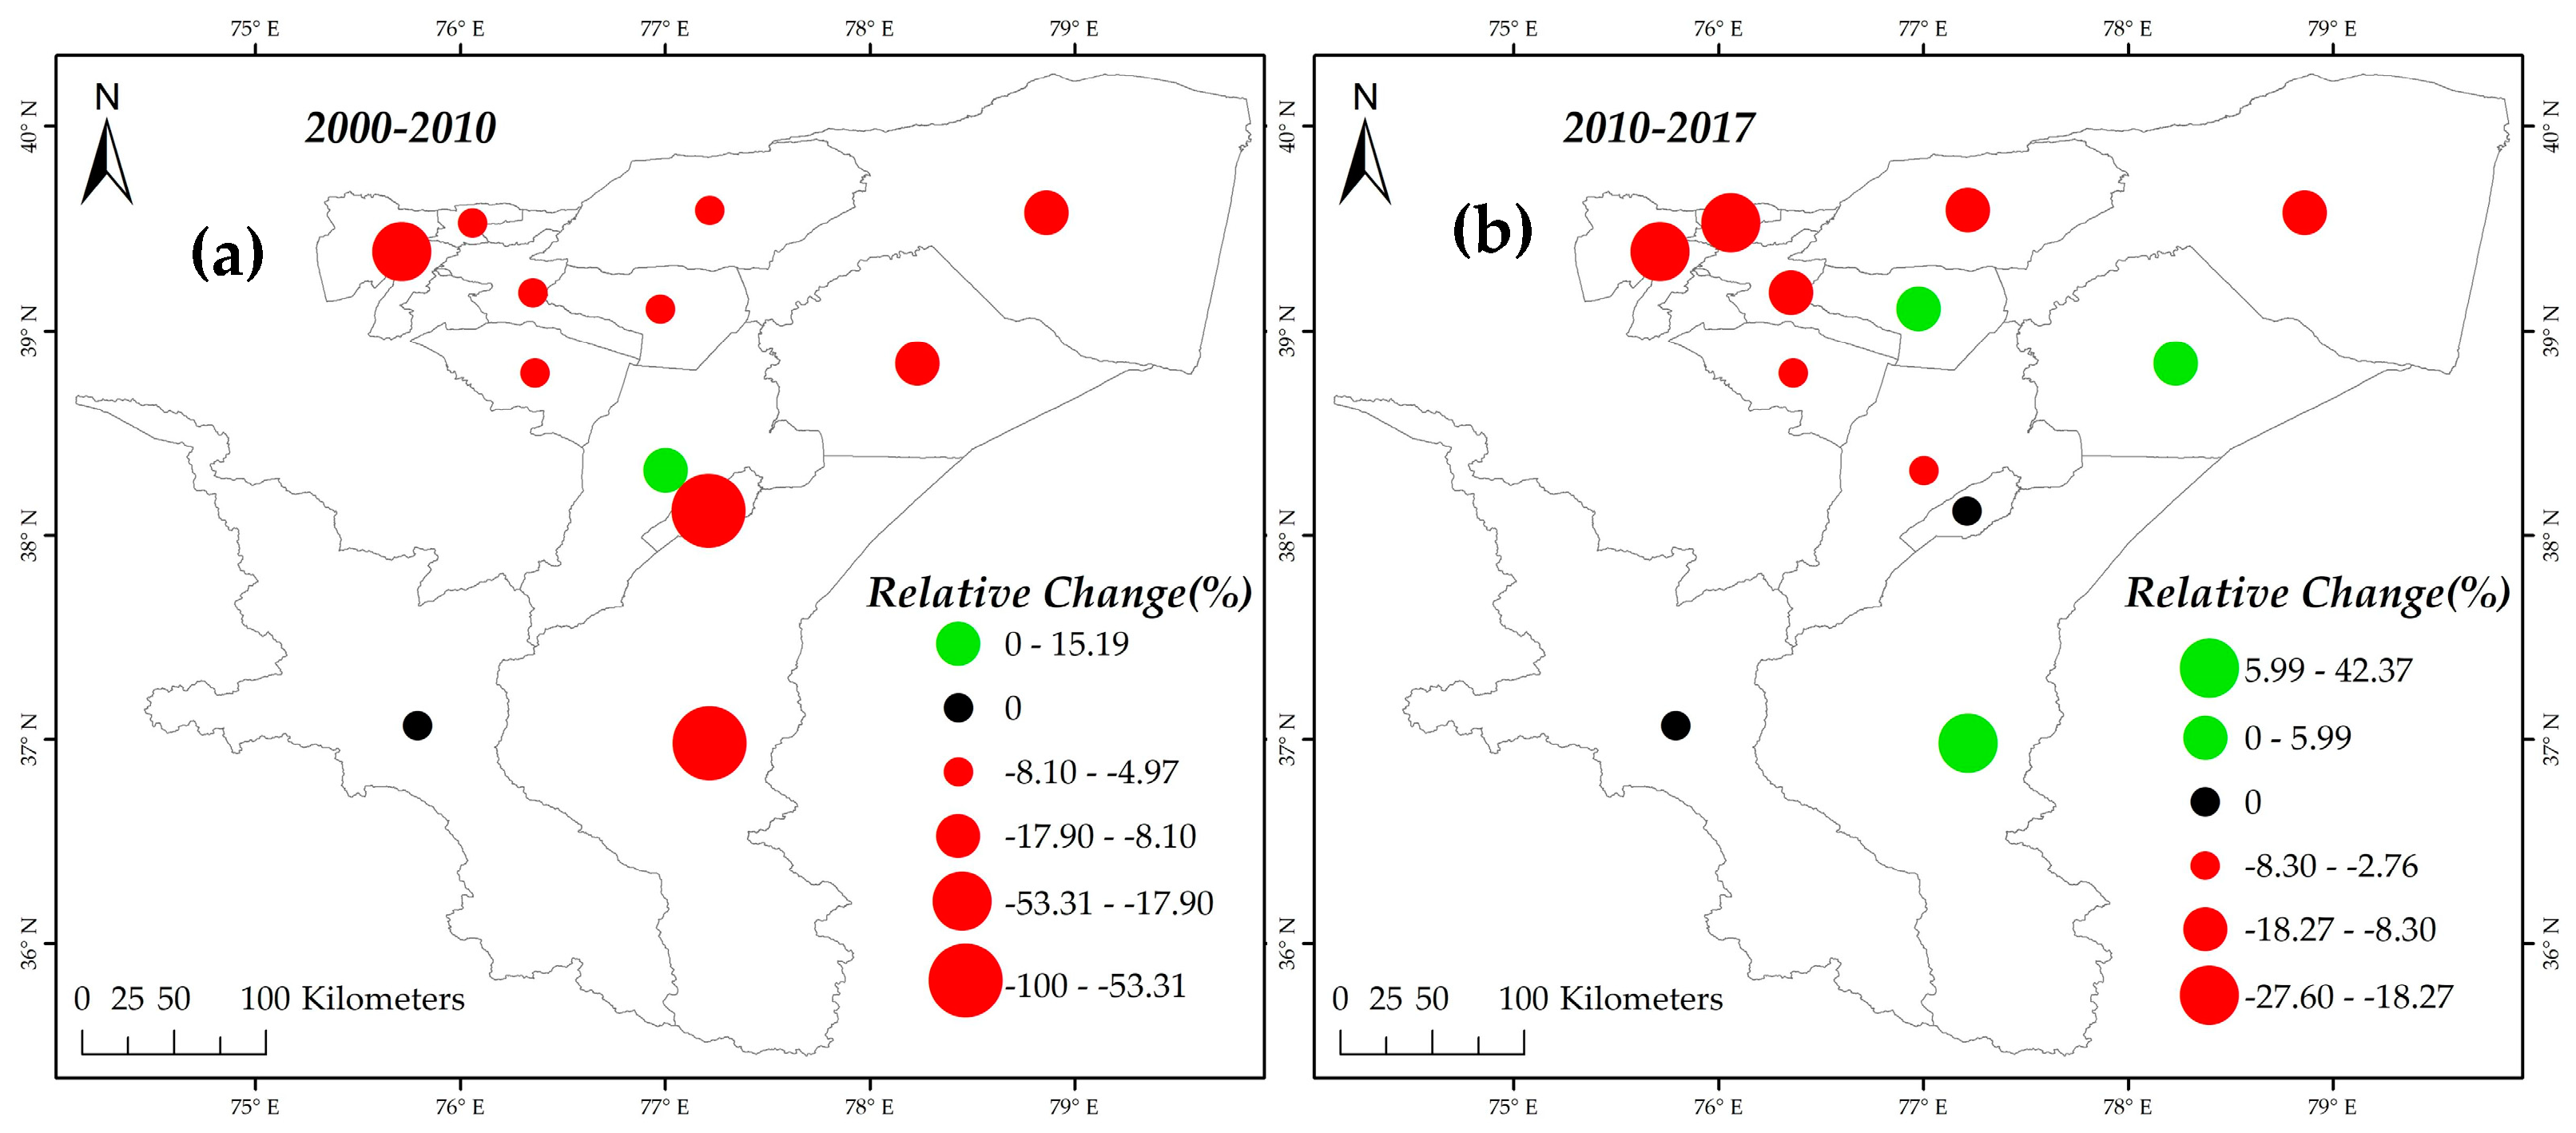
3.2.2. Variation of Soil Salinization Severity
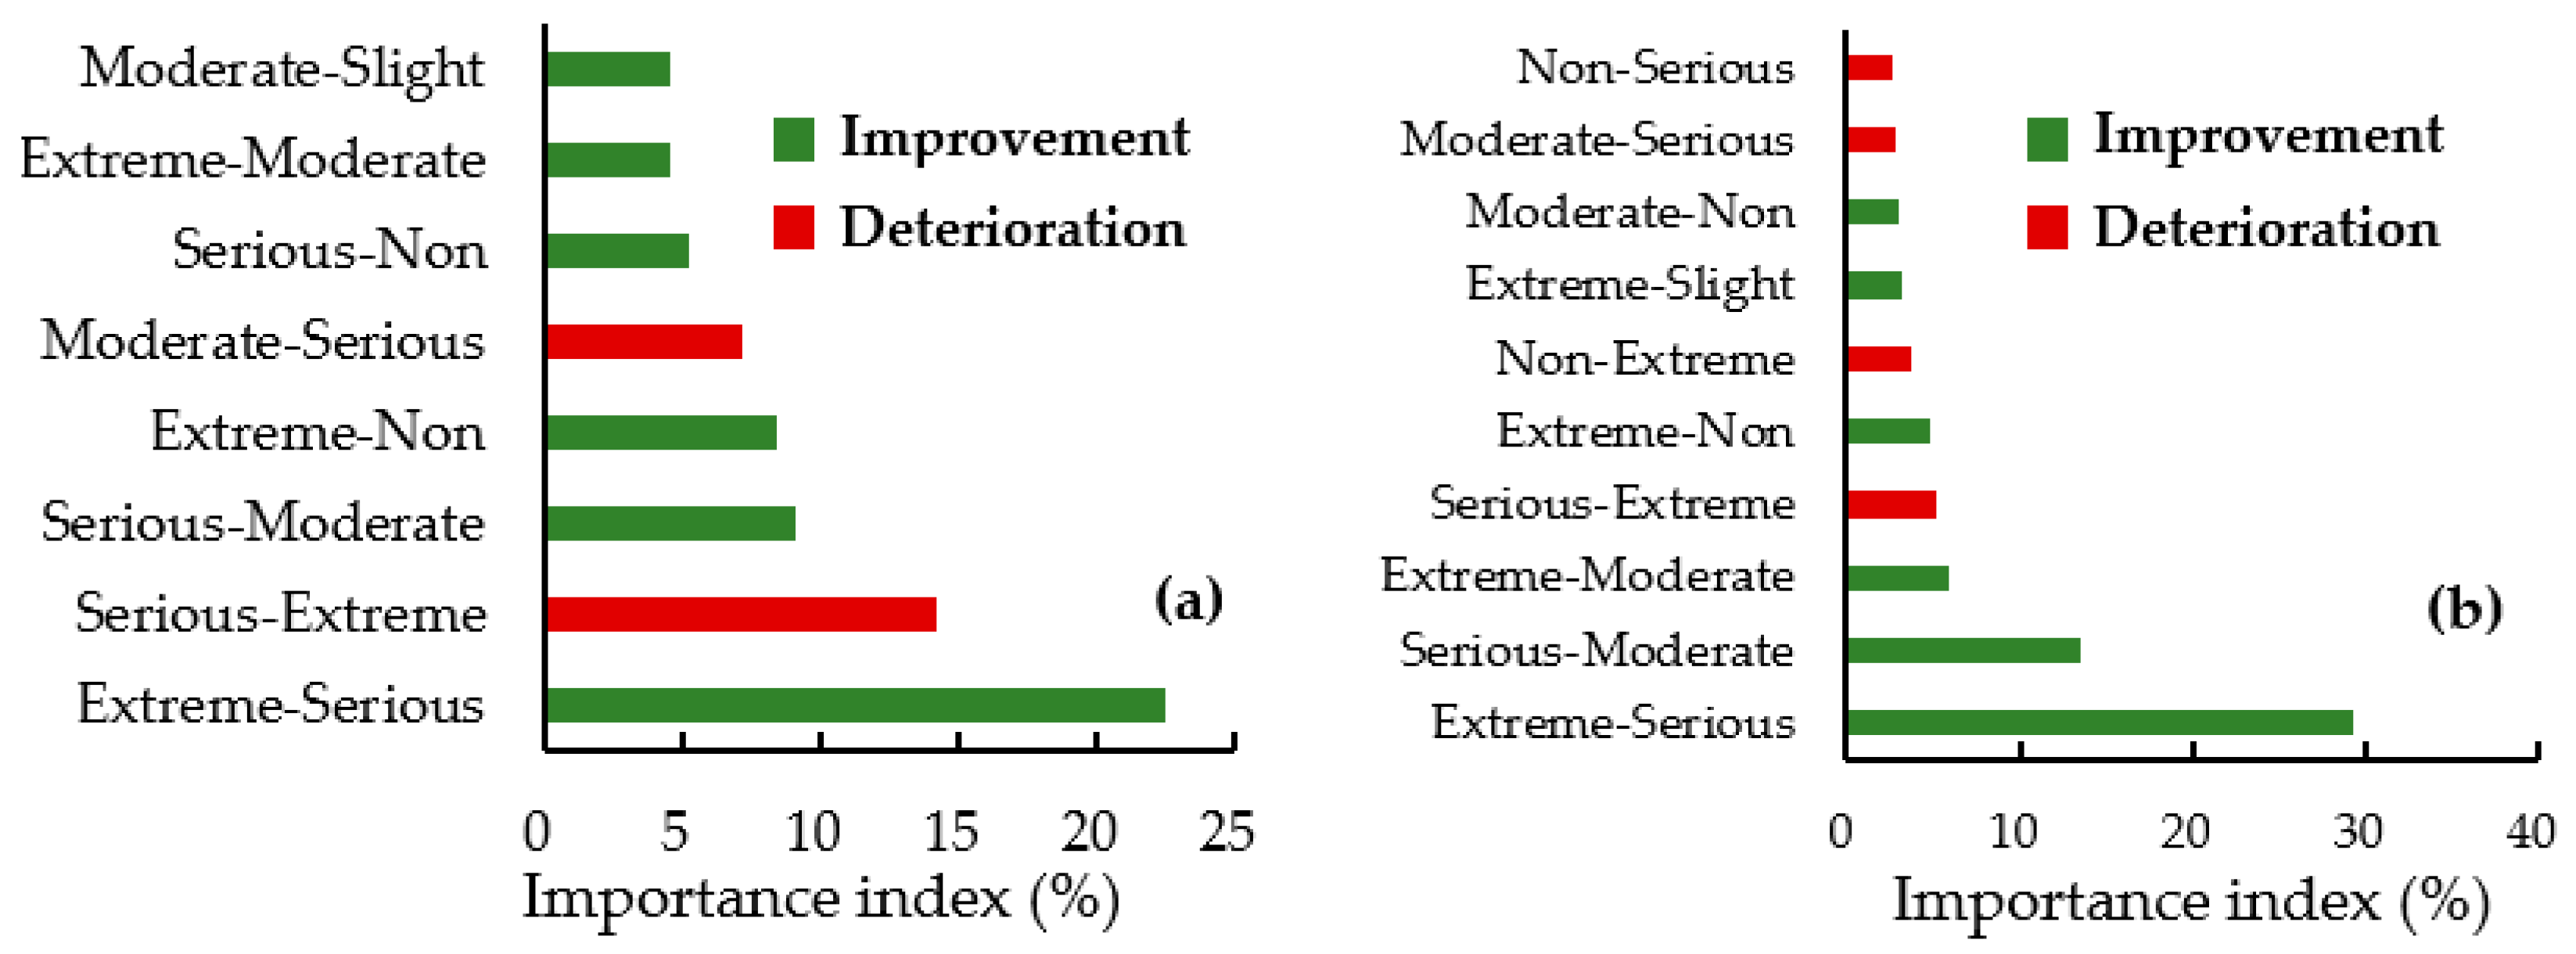
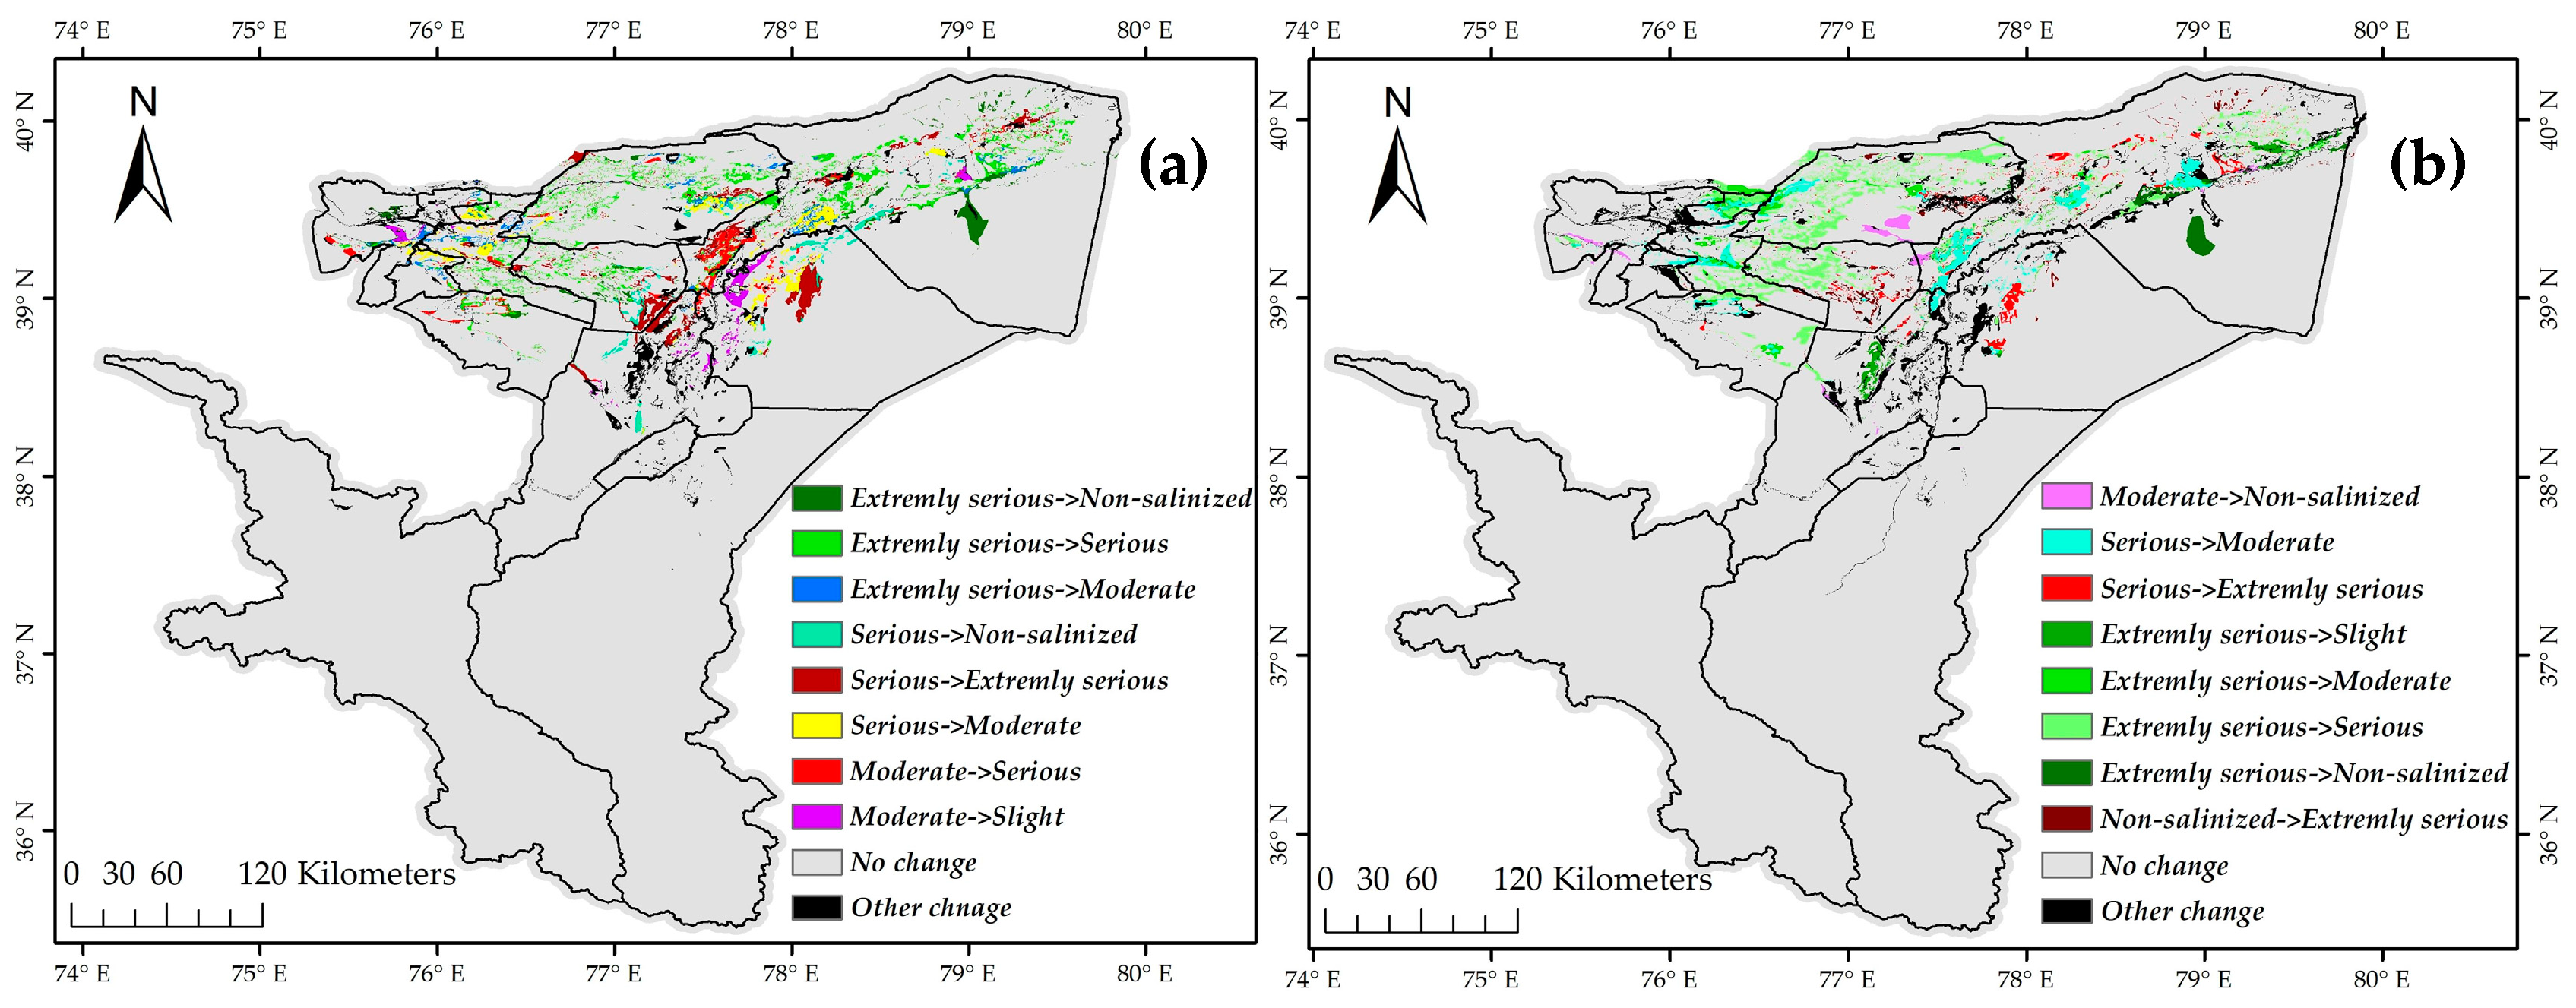
3.2.3. Spatiotemporal Distribution of the Main Change Types of Salinized Soil
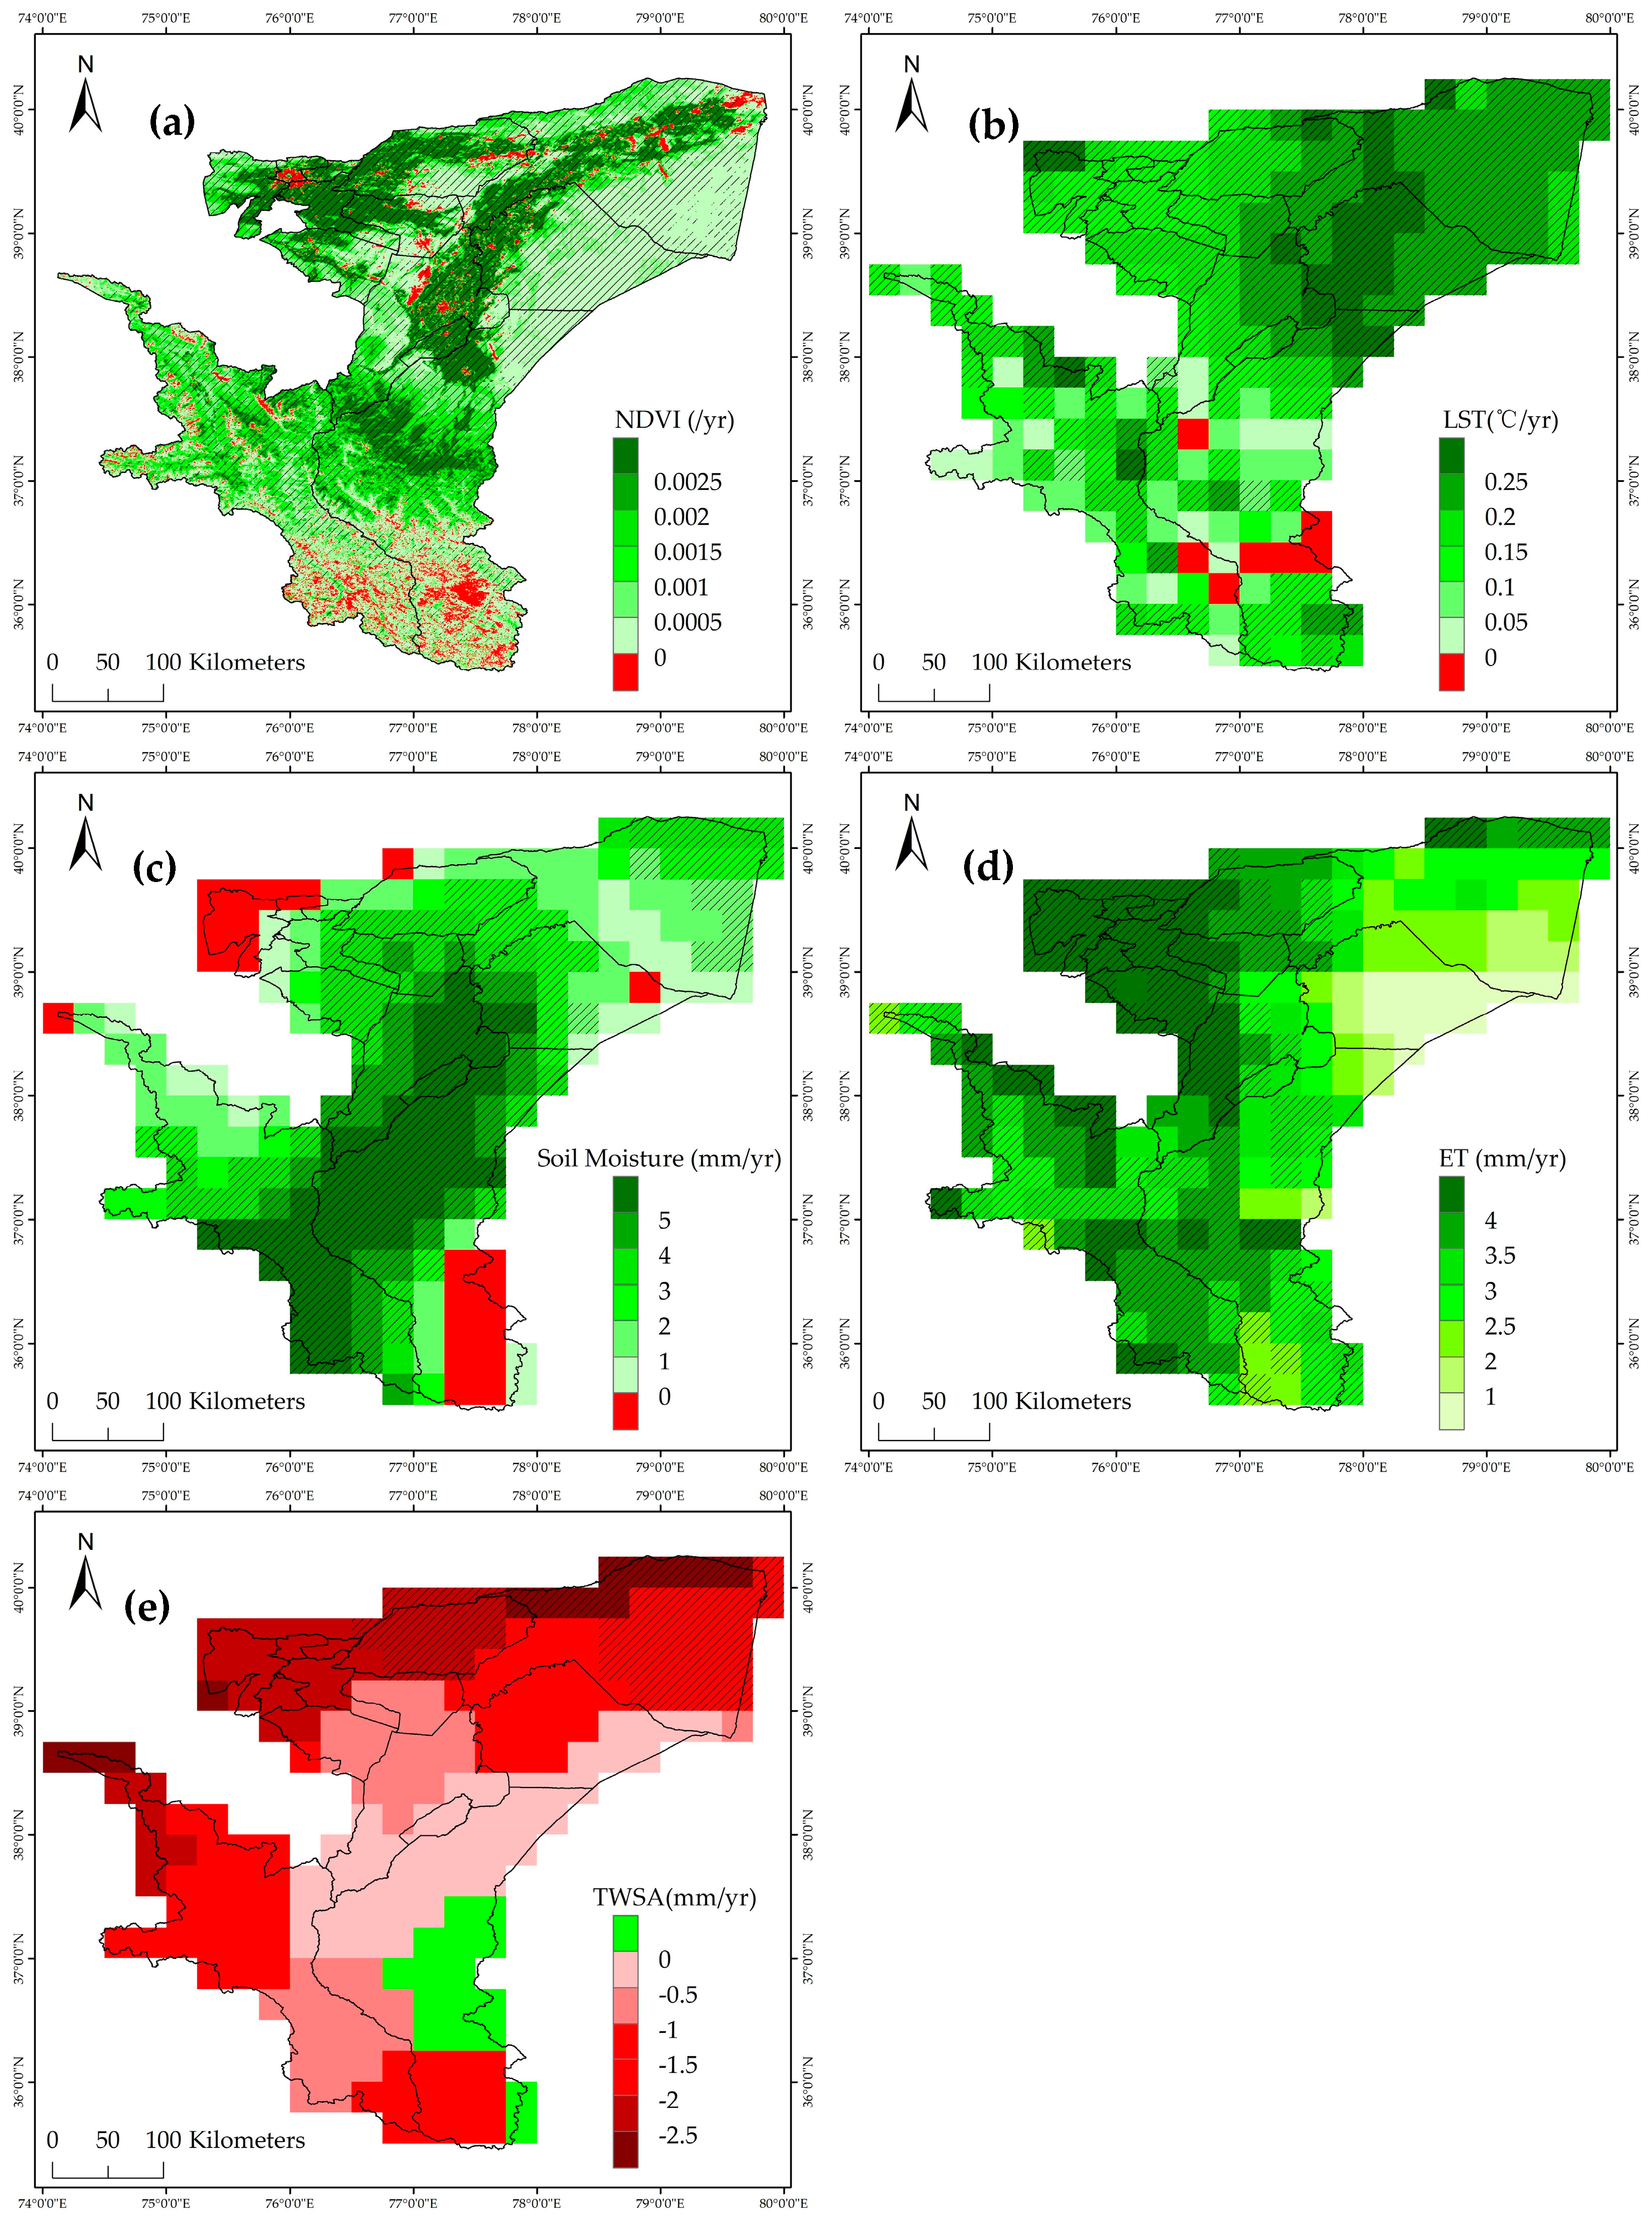
3.3. Spatiotemporal Variations of Eco-Hydrological Parameters in Kashgar Region
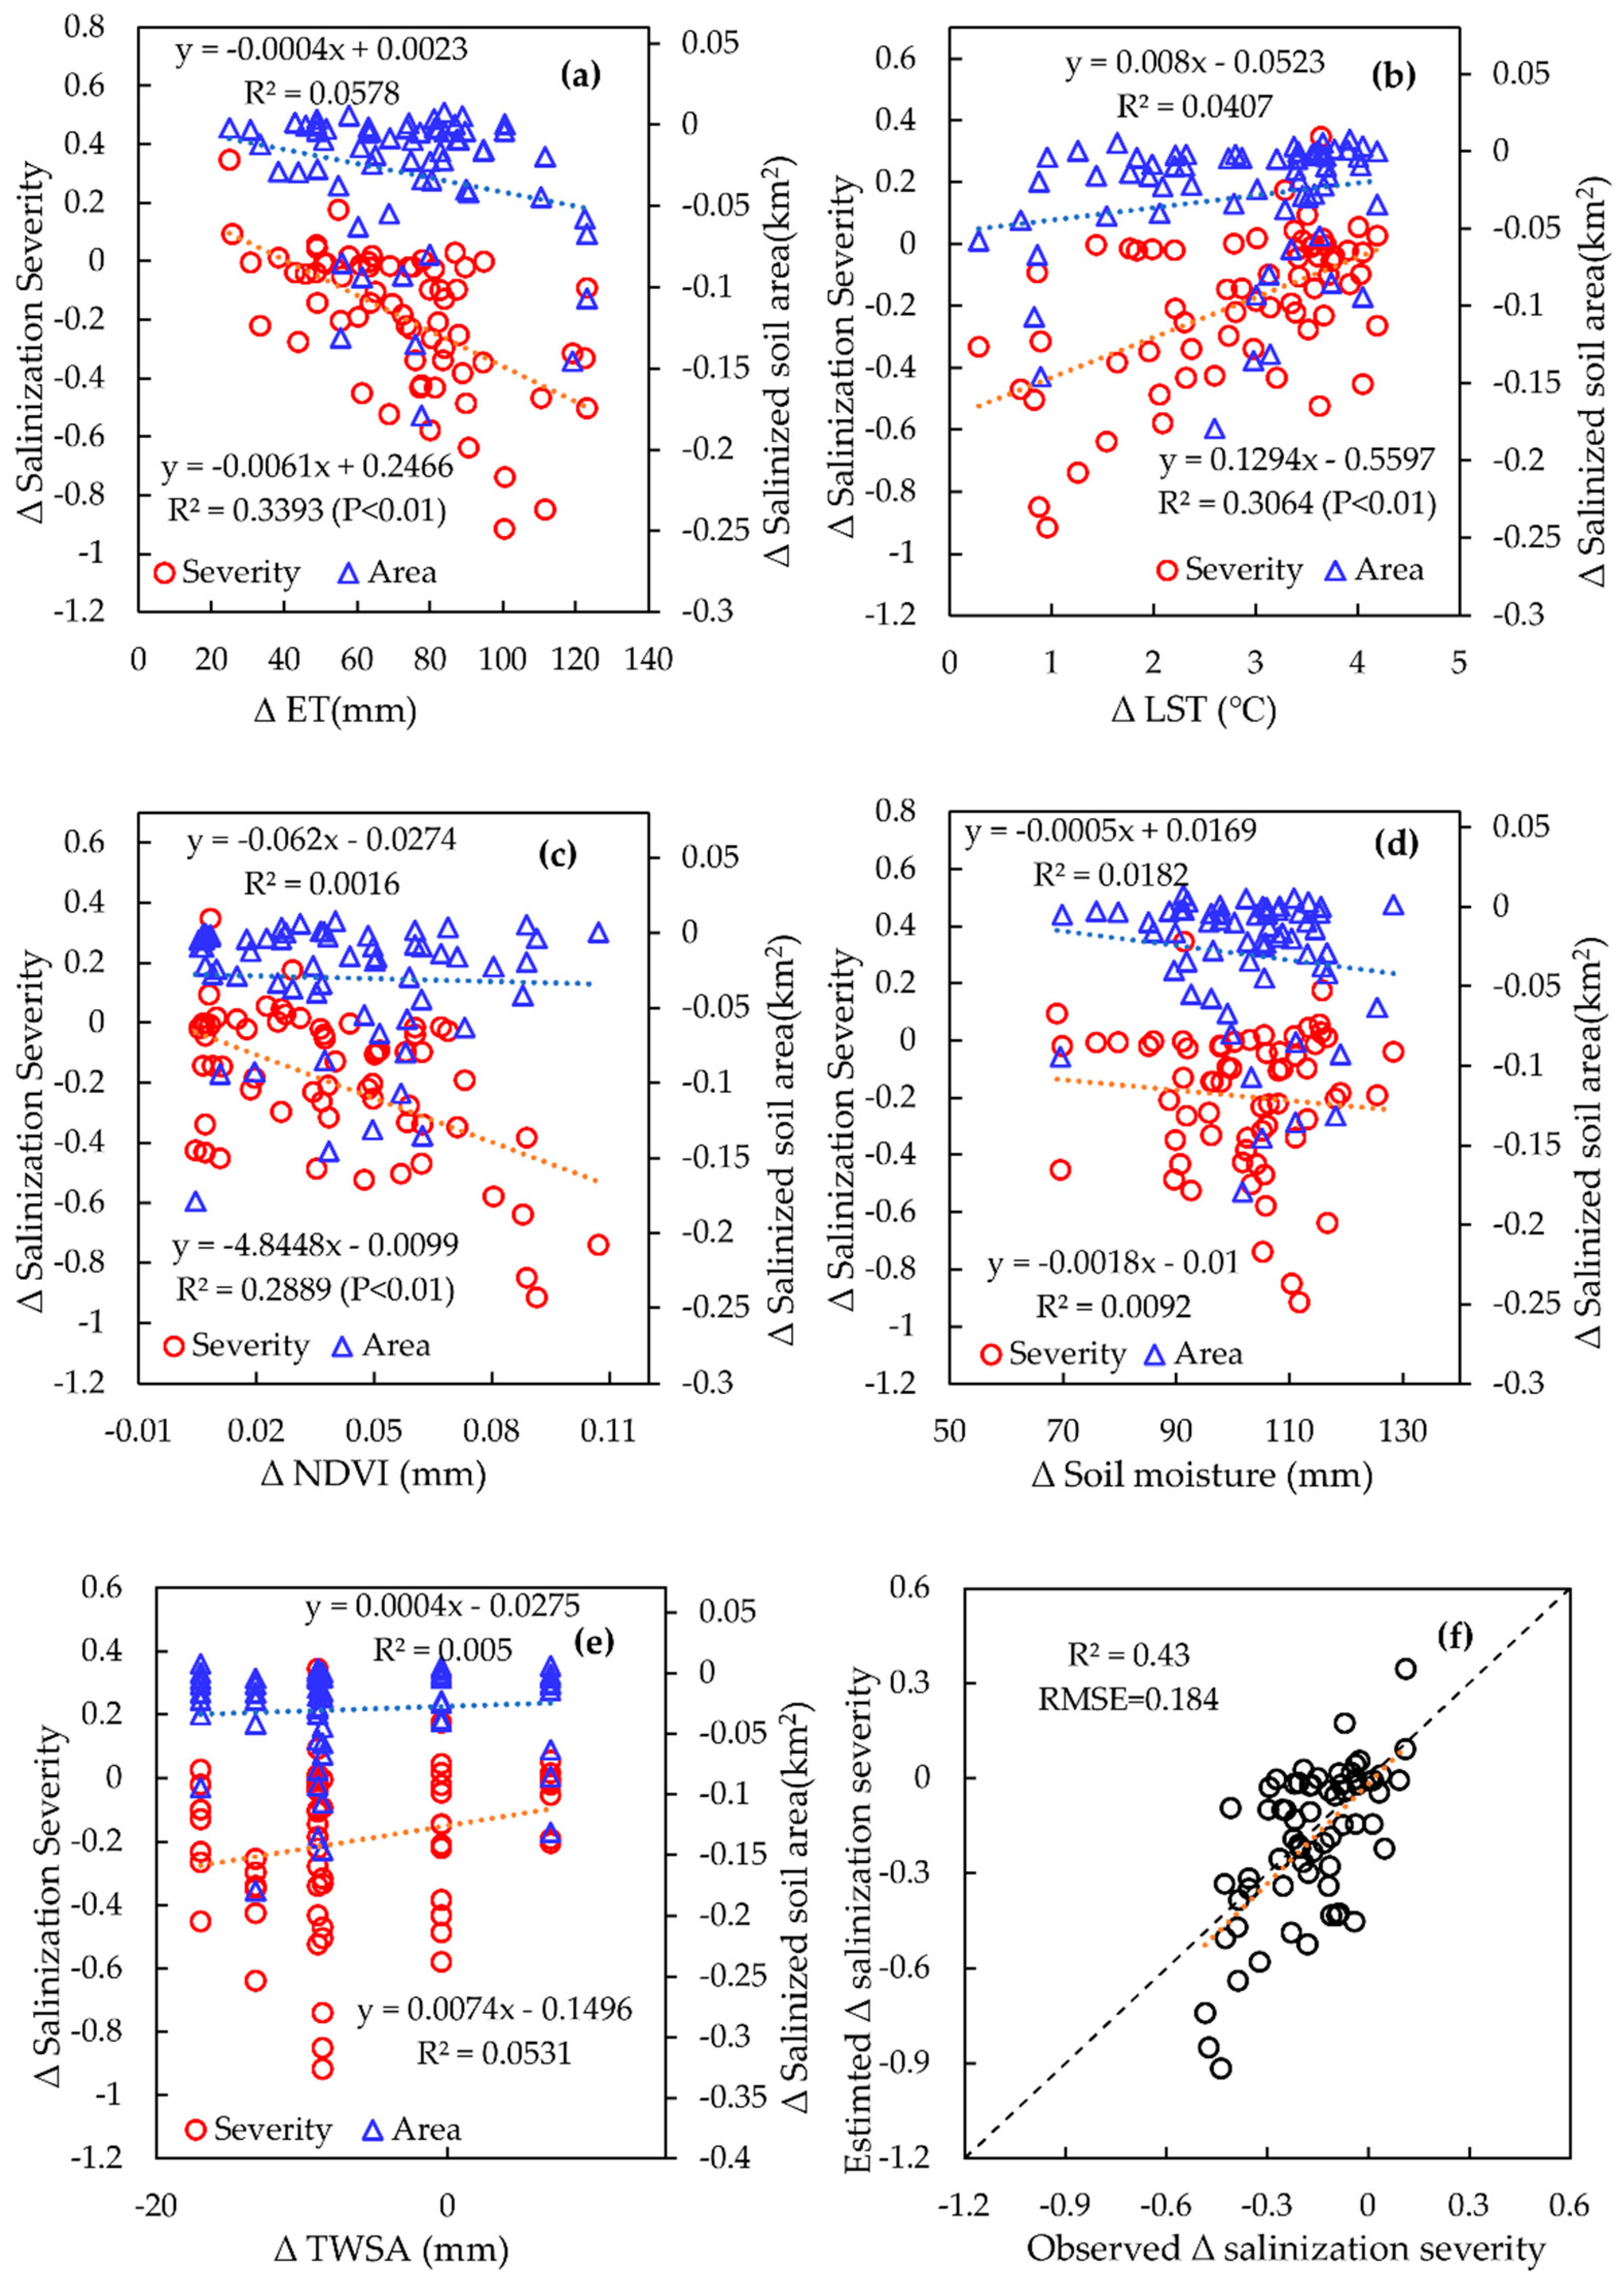
3.4. Responses of Soil Salinization to Key Eco-Hydrological Parameters
4. Discussion
5. Conclusions
Author Contributions
Funding
Data Availability Statement
Acknowledgments
Conflicts of Interest
References
- Szabolcs, I. Salinization of soil and water and its relation to desertification. Desertif. Control Bull. 1992, 21, 32–37. [Google Scholar]
- Schofield, R.V.; Kirkby, M.J. Application of salinization indicators and initial development of potential global soil salinization scenario under climatic change. Glob. Biogeochem. Cycle 2003, 17, 1078. [Google Scholar] [CrossRef]
- Das, R.S.; Rahman, M.; Sufian, N.P.; Rahman, S.M.A.; Siddique, M.A.M. Assessment of soil salinity in the accreted and non-accreted land and its implication on the agricultural aspects of the Noakhali coastal region, Bangladesh. Heliyon 2020, 6, e04926. [Google Scholar] [CrossRef] [PubMed]
- Sahab, S.; Suhani, I.; Srivastava, V.; Chauhan, P.S.; Prasad, V. Potential risk assessment of soil salinity to agroecosystem sustainability: Current status and management strategies. Sci. Total Environ. 2020, 764, 144–164. [Google Scholar]
- Wei, Y.; Ding, J.; Yang, S.; Wang, F.; Wang, C. Soil salinity prediction based on scale-dependent relationships with environmental variables by discrete wavelet transform in the Tarim Basin. Catena 2021, 196, 104939. [Google Scholar] [CrossRef]
- Li, J.; Pu, L.; Han, M.; Zhu, M.; Runsen, Z.; Xiang, Y. Soil salinization research in China: Advances and prospects. J. Geogr. Sci. 2014, 24, 943–960. [Google Scholar] [CrossRef]
- Qiao, M. Soil Salinization in Xinjiang Irrigation Area and Its Governance Model; Xinjiang Science and Technology Press: Urumqi, China, 2008. [Google Scholar]
- Li, L.; Sun, G.; Lu, H.; Lu, H.; Shi, H. Spatiotemporal changes and driving forces of ecological vulnerability in Kashi. Reg. Arid Land Geogr. 2021, 44, 277–288. [Google Scholar]
- Rashid, K.; Jasur, M.; Jilili, A.; Bakhtiyor, K. Challenges for the sustainable use of water and land resources under a changing climate and increasing salinization in the Jizzakh irrigation zone of Uzbekistan. J. Arid Land 2020, 12, 92–105. [Google Scholar]
- Afrasinei, G.; Melis, M.; Arras, C.; Pistis, M.; Buttau, C.; Ghiglieri, G. Spatiotemporal and spectral analysis of sand encroachment dynamics in southern Tunisia. Eur. J. Remote Sens. 2018, 51, 2018. [Google Scholar] [CrossRef] [Green Version]
- Afrasinei, G.; Melis, M.; Buttau, C.; Bradd, J.; Arras, C.; Ghiglieri, G. Assessment of remote sensing-based classification methods for change detection of salt-affected areas (Biskra area, Algeria). J. Appl. Remote Sens. 2017, 11, 016025. [Google Scholar] [CrossRef] [Green Version]
- El Harti, A.; Lhissou, R.; Chokmani, K.; Ouzemou, J.E.; Hassouna, M.; Bachaoui, E.M.; El Ghmari, A. Spatiotemporal monitoring of soil salinization in irrigated Tadla PlainMorocco using satellite spectral indices. Int. J. Appl. Earth Obs. 2016, 50, 64–73. [Google Scholar] [CrossRef]
- Scudiero, E.; Skaggs, T.H.; Corwin, D.L. Comparative regional-scale soil salinity assessment with near-ground apparent electrical conductivity and remote sensing canopy reflectance. Ecol. Indic. 2016, 70, 276–284. [Google Scholar] [CrossRef] [Green Version]
- Scudiero, E.; Skaggs, T.H.; Corwin, D.L. Regional-scale soil salinity assessment using Landsat ETM + canopy reflectance. Remote Sens. Environ. 2015, 169, 335–343. [Google Scholar] [CrossRef] [Green Version]
- Gorji, T.; Yildirim, A.; Hamzehpour, N.; Tanik, A.; Sertel, E. Soil salinity analysis of Urmia Lake Basin using Landsat-8 OLI and Sentinel- 2A based spectral indices and electrical conductivity measurements. Ecol. Indic. 2020, 112, 106173. [Google Scholar] [CrossRef]
- Kristen, W.; Elia, S.; El-Askary, H.M.; Skaggs, T.H.; Mohamed, A.; Corwin, D.L. Validating the use of MODIS time series for salinity assessment over agricultural soils in California, USA. Ecol. Indic. 2018, 93, 889–898. [Google Scholar]
- Zhang, T.; Qi, J.; Gao, Y.; Ouyang, Z.; Zeng, S. Detecting soil salinity with MODIS time series VI data. Ecol. Indic. 2015, 52, 480–489. [Google Scholar] [CrossRef]
- Rocha Neto, O.; Teixeira, A.; Leão, R.; Moreira, L.; Galvão, L. Hyperspectral Remote Sensing for Detecting Soil Salinization Using ProSpecTIR-VS Aerial Imagery and Sensor Simulation. Remote Sens. 2017, 9, 42. [Google Scholar] [CrossRef] [Green Version]
- Ma, L.; Ma, F.; Li, J.; Gu, Q.; Yang, S. Characterizing and modeling regional-scale variations in soil salinity in the arid oasis of Tarim Basin, China. Geoderma 2017, 305, 1–11. [Google Scholar] [CrossRef]
- Chervan, A.M.; Ustinova, A.M.; Tsyrybko, V.B. Spatiotemporal Changes of Soil Salinization in the Soligorsk Mining Region. Eurasian Soil Sci. 2019, 52, 998–1006. [Google Scholar] [CrossRef]
- Hamzehpour, N.; Bogaert, P. Improved spatiotemporal monitoring of soil salinity using filtered kriging with measurement errors: An application to the West Urmia Lake, Iran. Geoderma 2017, 295, 22–33. [Google Scholar] [CrossRef] [Green Version]
- Su, Y.; Li, T.; Cheng, S.; Wang, X. Spatial distribution exploration and driving factor identification for soil salinisation based on geodetector models in coastal area. Ecol. Eng. 2020, 156, 105961. [Google Scholar] [CrossRef]
- Zewdu, S.; Suryabhagavan, K.V.; Balakrishnan, M. Geo-spatial approach for soil salinity mapping in Sego Irrigation Farm, South Ethiopia. J. Saudi Soc. Agric. Sci. 2015, 16, 16–24. [Google Scholar] [CrossRef] [Green Version]
- Niñerola, V.B.; Navarro-Pedreño, J.; Lucas, I.G.; Pastor, I.M.; Vidal, M.M.J. Geostatistical assessment of soil salinity and cropping systems used as soil phytoremediation strategy. J. Geochem. Explor. 2016, 174, 53–58. [Google Scholar] [CrossRef]
- Gebremeskel, G.; Gebremicael, T.G.; Kifle, M.; Meresa, E.; Gebremedhin, T.; Girmay, A. Salinization pattern and its spatial distribution in the irrigated agriculture of Northern Ethiopia: An integrated approach of quantitative and spatial analysis. Agric. Water Manag. 2018, 206, 147–157. [Google Scholar] [CrossRef]
- Barros, R.; Isidoro, D.; Aragüés, R. Three study decades on irrigation performance and salt concentrations and loads in the irrigation return flows of La Violada irrigation districtSpain. Agric. Ecosyst. Environ. 2012, 151, 44–52. [Google Scholar] [CrossRef] [Green Version]
- Zhang, H.; Niu, L.; Hao, J.; Bao, R.; Zhang, Y.; Xing, X. Effect of Micro-topography and Groundwater Depth on Soil Potential Salinization in Heilonggang Basin. Bull. Soil Water Conserv. 2018, 38, 83–90. [Google Scholar]
- Daliakopoulos, I.N.; Tsanis, I.K.; Koutroulis, A.; Kourgialas, N.N.; Varouchakis, A.E.; Karatzas, G.P.; Ritsema, C.J. The threat of soil salinity: A European scale review. Sci. Total Environ. 2016, 573, 727–739. [Google Scholar] [CrossRef] [PubMed]
- Wang, Y.; Deng, C.; Liu, Y.; Niu, Z.; Li, Y. Identifying change in spatial accumulation of soil salinity in an inland river watershed, China. Sci. Total Environ. 2018, 621, 177–185. [Google Scholar] [CrossRef] [PubMed]
- Zheng, S.; Loureno, S.D.N.; Cleall, P.J.; May Chui, T.F.; Ng, A.K.Y.; Millis, S.W. Hydrologic behavior of model slopes with synthetic water repellent soils. J. Hydrol. 2017, 554, 582–599. [Google Scholar] [CrossRef]
- Zewdu, S.; Suryabhagavan, K.V.; Balakrishnan, M. Land-use\/land-cover dynamics in Sego Irrigation Farm, southern Ethiopia: A comparison of temporal soil salinization using geospatial tools. J. Saudi Soc. Agric. Sci. 2014, 15, 91–97. [Google Scholar] [CrossRef] [Green Version]
- He, B.; Ding, J.; Liu, B.; Wang, J. Spatiotemporal Variation of Soil Salinization in Weigan-Kuqa River Delta Oasis. Scien. Silvae Sin. 2019, 55, 185–196. [Google Scholar]
- Landsat5 TM, Landsat 7 ETM+ and Landsat8 OLI Images. Available online: http://earthexplorer.usgs.gov (accessed on 8 June 2020).
- The Normalized Difference Vegetation Index (NDVI) and Land Surface Temperature (LST) MODIS Products. Available online: https://search.earthdata.nasa.gov (accessed on 9 May 2020).
- Gravity Recovery and Climate Experiment (GRACE) Mascon Products. Available online: https://podaac.jpl.nasa.gov/ (accessed on 12 June 2020).
- Global Land Data Assimilation System (GLDAS) Products. Available online: https://search.earthdata.nasa.gov (accessed on 23 September 2020).
- Global Land Evaporation Amsterdam Model (GLEAM) Products. Available online: https://www.gleam.eu (accessed on 30 August 2020).
- Australian Commonwealth Scientific and Research Organization (CSIRO) PML_V2 Products. Available online: http://data.tpdc.ac.cn/zh-hans (accessed on 9 May 2020).
- State Forestry Administration of People’s Republic of China. Atlas of Desertification and Sandified Land in China; Science Press: Beijing, China, 2009.
- Han, H.; Yang, C.; Song, J. Scenario Simulation and the Prediction of Land Use and Land Cover Change in Beijing, China. Sustainability 2015, 7, 4260–4279. [Google Scholar] [CrossRef] [Green Version]
- Luo, Y.; Yang, S.; Liu, X.; Liu, C.; Song, W.; Dong, G.; Zhao, H.; Lou, H. Land use change in the reach from Hekouzhen to Tongguan of the Yellow River during 1998–2010. Acta Geogr. Sin. 2014, 69, 42–53. [Google Scholar]
- Kendall, M.G. A new measure of rank correlation. Biometrika 1938, 30, 81–93. [Google Scholar] [CrossRef]
- Li, H.; Wang, S.; Bai, X.; Luo, W.; Tang, H.; Cao, Y.; Wu, L.; Chen, F.; Li, Q.; Zeng, C. Spatiotemporal distribution and national measurement of the global carbonate carbon sink. Sci. Total Environ. 2018, 643, 157–170. [Google Scholar] [CrossRef] [PubMed]
- Li, H.; Wu, Y.; Chen, J.; Zhao, F.; Wang, F.; Sun, Y.; Zhang, G.; Qiu, L. Responses of soil organic carbon to climate change in the Qilian Mountains and its future projection. J. Hydrol. 2021, 596, 126110. [Google Scholar] [CrossRef]
- Li, H.W.; Wang, S.J.; Bai, X.Y.; Cao, Y.; Wu, L.H. Spatiotemporal evolution of carbon sequestration of limestone weathering in China. Sci. China Earth Sci. 2019, 62, 974–991. [Google Scholar] [CrossRef]
- Mann, H.B. Nonparametric Tests against Trend. Econometrica 1945, 13, 245–259. [Google Scholar] [CrossRef]
- Wang, Z.; Yao, W.; Tang, Q.; Yang, E.; Kong, X.; Wang, L.; Xiao, P. Spatio-temporal change analysis of leaf area index in the Loess Plateau during 2000-2014. Sci. Soil Water Conserv. 2017, 15, 71–80. [Google Scholar]
- Li, J.; Gao, M. Temporal and Spatial Characteristics of Salinization of Coastal Soils in the Yellow River Delta. Chin. J. Soil Sci. 2018, 49, 1458–1465. [Google Scholar]
- Lai, N.; Li, X.; Turdi, A.; Ezezezi, M. Analysis of tempo-spatial dynamic change and the cause of soil salinization in the oasis of the lower reaches of Kaidu River Basin. J. Arid Land Resour. Environ. 2013, 27, 66–73. [Google Scholar]
- Qiao, M.; Zhou, S.; Lu, L.; Yan, J.; Li, H. Temporal and spatial changes of soil salinization and improved countermeasures of Tarim Basin Irrigation District in recent 25 years. Arid Land Geogr. 2011, 34, 604–615. [Google Scholar]
- Yan, Z.; Wang, X.; Gao, F.; Huang, Q.; Yuan, Z.; Zhuo, R. Monitoring analysis on spatio-temporal changes of the soil salinization in the upper stream of Tarim River. J. Arid Land Resour. Environ. 2010, 24, 105–110. [Google Scholar]
- Sun, P.; Wu, Y.; Xiao, J.; Hui, J.; Hu, J.; Zhao, F.; Qiu, L.; Liu, S. Remote sensing and modeling fusion for investigating the ecosystem water-carbon coupling processes. Sci. Total Environ. 2019, 697, 134064. [Google Scholar] [CrossRef]
- Li, J.; Pu, L.; Zhu, M.; Zhang, R. The Present Situation and Hot Issues in the Salt-affected Soil Research. Acta Geogr. Sin. 2012, 67, 1233–1245. [Google Scholar]
- Wang, J.; Huang, X.; Zhong, T.; Chen, Z. Review on Sustainable Utilization of Salt-affected Land. Acta Geogr. Sin. 2011, 66, 673–684. [Google Scholar]


| Parameters | Products | Time Range | Spatial Resolution | Temporal Resolution |
|---|---|---|---|---|
| Land surface reflectance | Landsat TM | July–September, 2009–2011 | 30 m | — |
| Landsat ETM+ | July–September, 1999–2000 | 30 m | — | |
| Landsat OLI | July–September, 2017 | 30 m | — | |
| NDVI | MODIS | 2000–2018 | 500 m | 16 days |
| TWSA | GRACE CSR Mascon | 2003–2018 | 0.25° | Monthly |
| GRACE JPL Mascon | 2003–2018 | 0.25° | ||
| SM | GLDAS_Noah | 2000–2018 | 0.25° | Monthly |
| GLDAS_VIC | 2000–2018 | 1° | ||
| GLDAS_CLSM | 2000–2018 | 1° | ||
| GLEAM | 2000–2018 | 0.25° | ||
| ET | GLDAS_Noah | 2000–2018 | 0.25° | Monthly |
| GLDAS_VIC | 2000–2018 | 1° | ||
| GLDAS_CLSM | 2000–2018 | 1° | ||
| GLEAM | 2000–2018 | 0.25° | ||
| PML_V2 | 2000–2018 | 500 m | 8 days | |
| LST | MODIS | 2000–2018 | 1 km | 8 days |
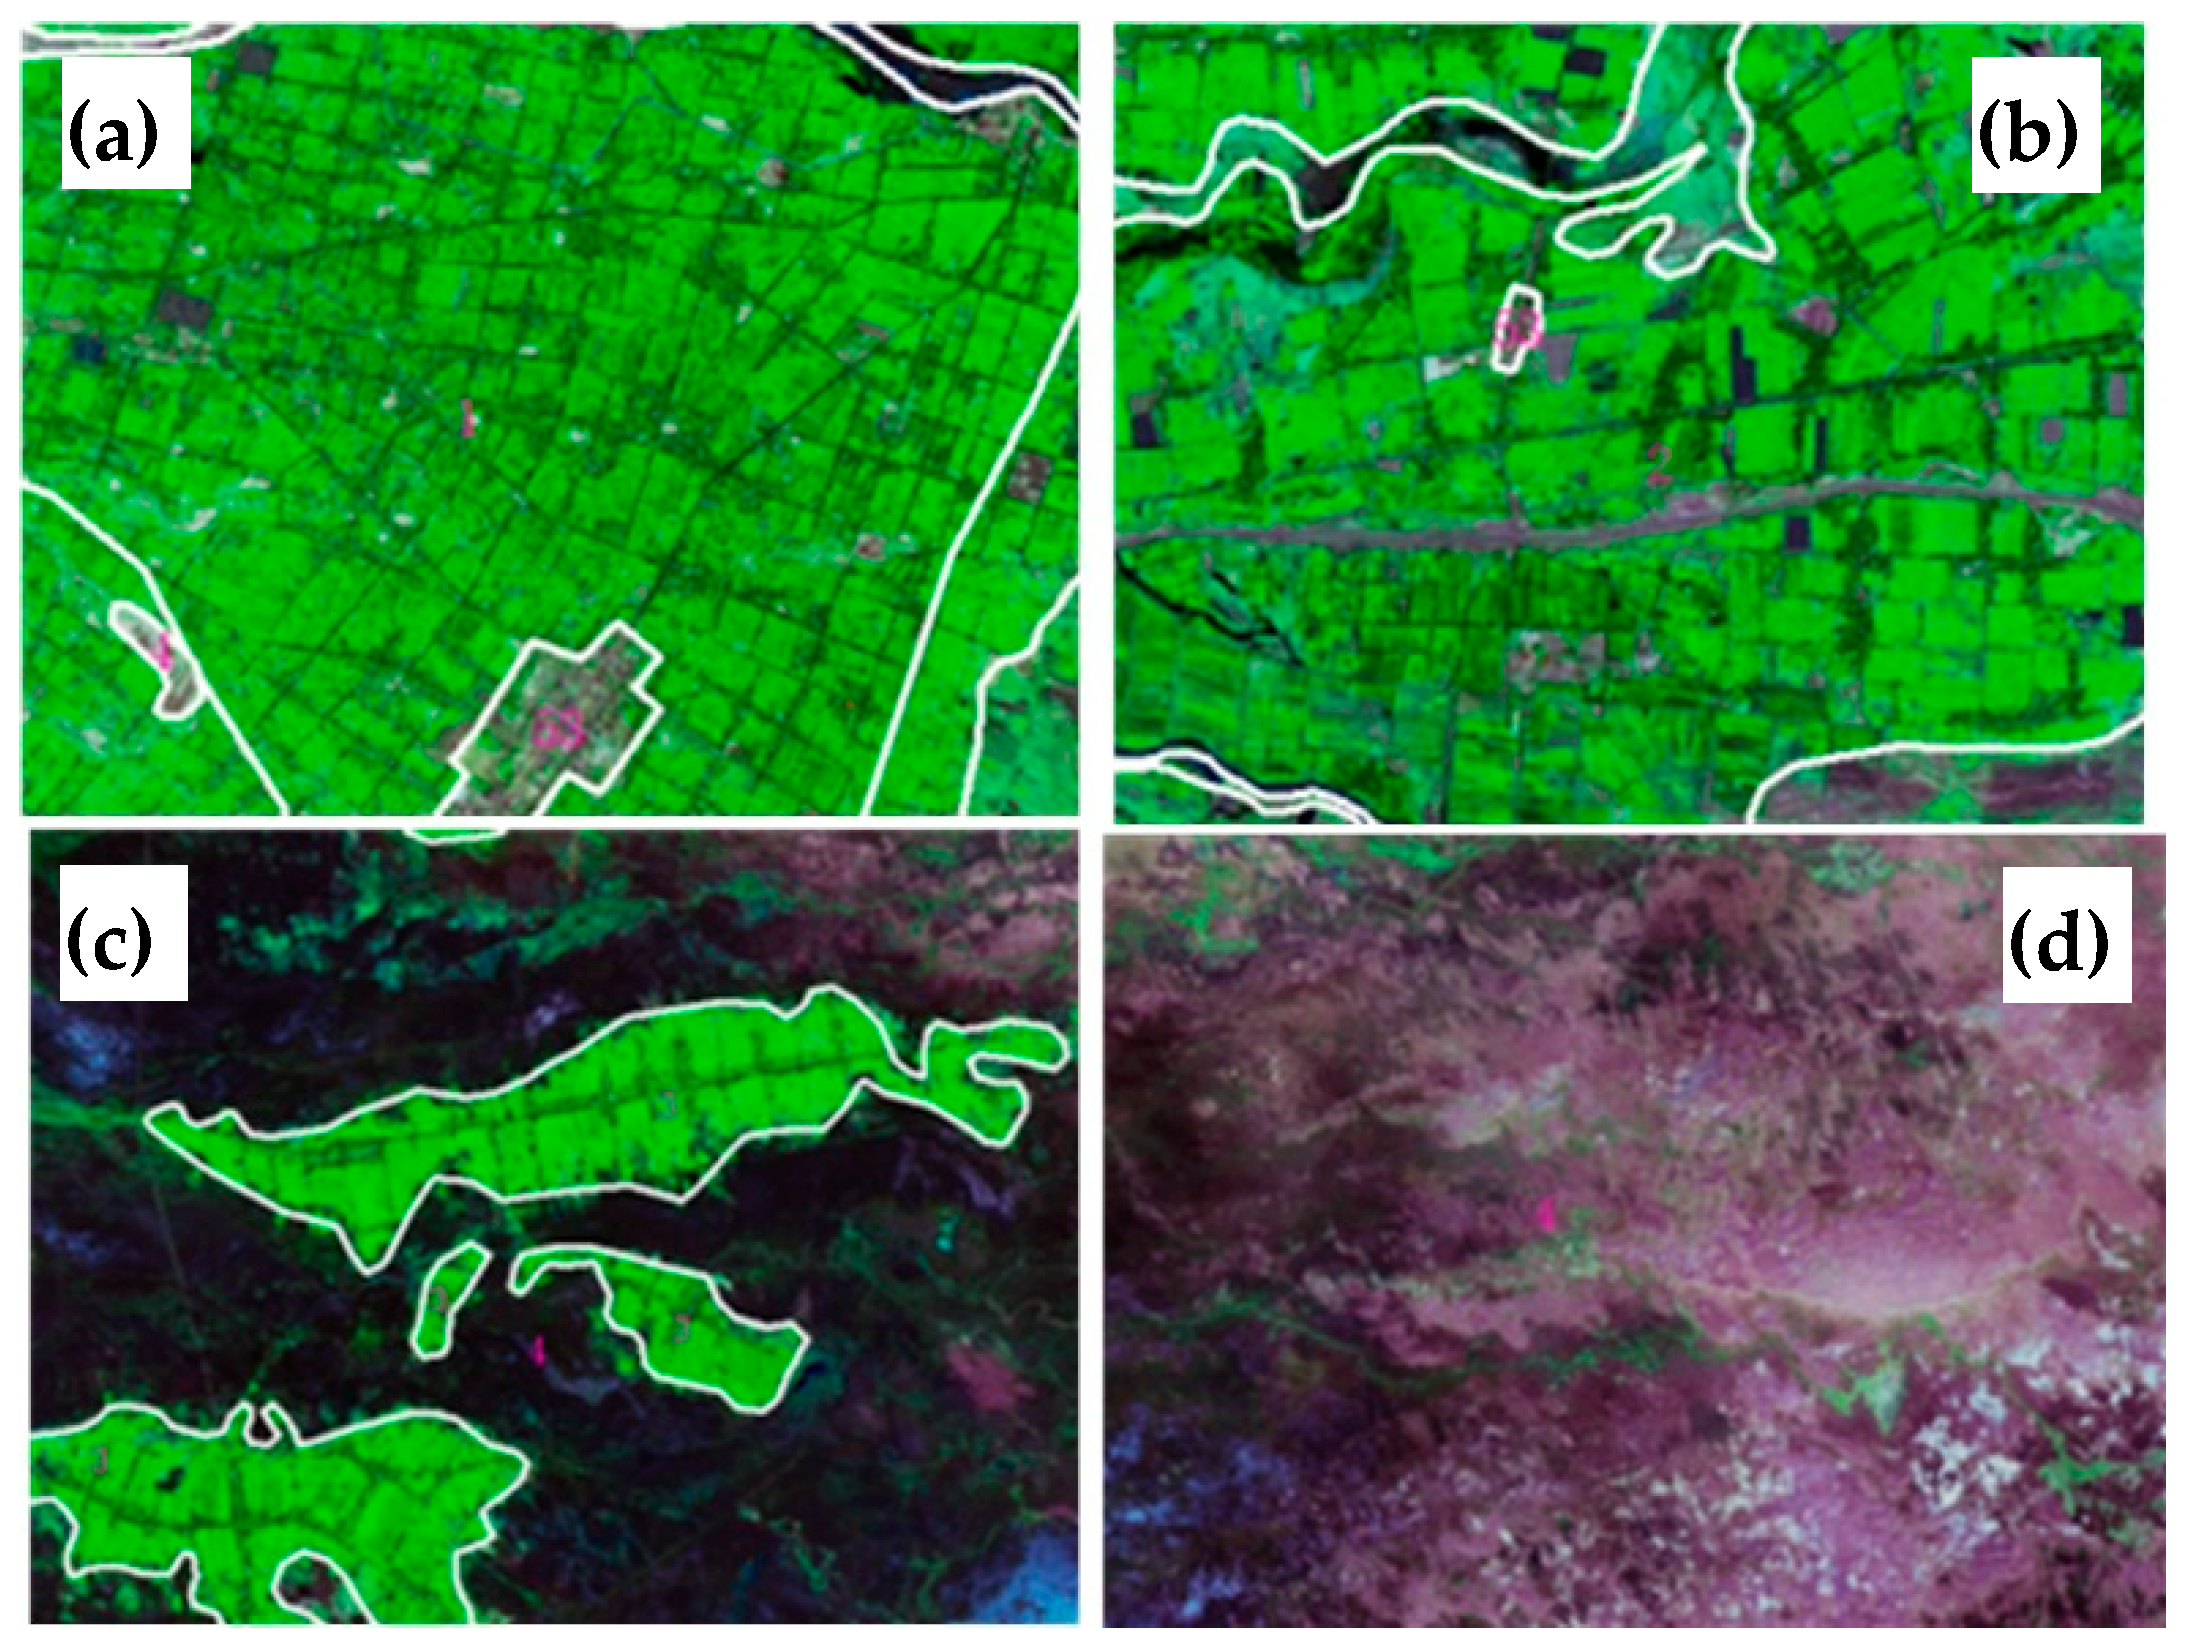
| Categories | Distribution Characteristics | Artificial Visual Interpretation Rules |
|---|---|---|
| Slightly salinized soil | Located in the upstream of Kashgar River Basin and Yarkand River Basin, where plants are all agricultural vegetation with low salinization severity and high vegetation coverage. | Crop growth is slightly inhibited, with 1/10–1/3 of the area being bare, showing light green color and slightly heterogeneous hue in the images. A small amount of white or light gray bright spots are mixed in the green plot in the images, accounting for 5–10% of the whole image. |
| Moderately salinized soil | Located in the lower reaches of the slightly salinized soil regions, and there is a small range of severe salinization area around, where plants are mainly agricultural vegetation. However, the vegetation coverage is lower than that in the slightly salinized regions. The crop types are quite different from those in the slightly salinized regions. The inner plots are mainly smooth and bright in images. | Crop growth is moderately inhibited, with 1/3–1/2 of the area being bare. Uneven spots with green or light green color are usually shown in images. Light tone and white spots are mixed, accounting for 10%–25% of the whole image. |
| Severely salinized soil | Located in the lower reaches with low terrain, where plants are mainly agricultural vegetation. The vegetation coverage is similar to that in the moderately salinized regions. There usually is a higher proportion of smooth spots with high brightness in the images. | Crop growth is severely inhibited, with more than half of the area being bare. Uneven polygons with light green, uneven texture, and rough texture are usually shown in images. White and grayish-white patches are mixed in green patches, accounting for more than 50%–70% of the whole image. |
| Extremely severely salinized soil | It is widely distributed in the lower reaches of Kashgar River Basin, Gaizi River Basin, and Yeerqiang River Basin, where they have more water content. The vegetation type is mainly natural vegetation. The image color of the waterlogged area is mainly black gray, grayish brown, and tan with a dark hue. Image colors of the water-free area that close to the desert are mainly light white, gray-white with a bright hue. | Crop growth is seriously inhibited, with more than 2/3 of the area being bare. The texture of the image is uneven and rough. White and grayish-white patches are mixed in green patches, accounting for more than 70% of the whole image. |
| 2010 | Slight | Moderate | Severe | Extremely Severe | Non-Salinized | Water | Urban Area | |
|---|---|---|---|---|---|---|---|---|
| 2000 | ||||||||
| Slight | 1646.92 | 108.46 | 79.54 | 230.94 | 213.58 | 23.64 | 40.73 | |
| Moderate | 347.76 | 2308.69 | 544.64 | 205.73 | 169.49 | 28.36 | 14.18 | |
| Severe | 44.27 | 699.51 | 3826.26 | 1082.92 | 399.24 | 14.79 | 45.00 | |
| Extremely Severe | 106.45 | 348.89 | 1723.42 | 11,601.19 | 644.47 | 47.80 | 5.12 | |
| Non-salinized | 0.00 | 0.00 | 0.00 | 0.00 | 99,909.98 | 230.08 | 58.07 | |
| Water | 8.13 | 26.73 | 10.79 | 40.58 | 97.79 | 636.49 | 0.37 | |
| Urban area | 2.98 | 2.29 | 3.04 | 1.21 | 1.84 | 0.08 | 95.71 | |
| 2017 | Slight | Moderate | Severe | Extremely Severe | Non-Salinized | Water | Urban Area | |
|---|---|---|---|---|---|---|---|---|
| 2010 | ||||||||
| Slight | 1756.49 | 44.77 | 45.48 | 64.53 | 168.31 | 8.59 | 66.62 | |
| Moderate | 201.50 | 2443.89 | 264.65 | 205.38 | 279.75 | 35.22 | 61.39 | |
| Severe | 104.16 | 1243.43 | 4091.67 | 481.86 | 142.76 | 22.81 | 96.06 | |
| Extremely Severe | 301.55 | 540.78 | 2714.69 | 8981.15 | 449.20 | 124.96 | 39.73 | |
| Non-salinized | 130.43 | 119.38 | 247.36 | 352.28 | 10,0182.26 | 236.05 | 87.18 | |
| Water | 36.27 | 27.79 | 58.32 | 59.93 | 188.12 | 609.27 | 0.76 | |
| Urban area | 0.00 | 0.00 | 0.00 | 0.00 | 0.90 | 0.03 | 258.05 | |
Publisher’s Note: MDPI stays neutral with regard to jurisdictional claims in published maps and institutional affiliations. |
© 2021 by the authors. Licensee MDPI, Basel, Switzerland. This article is an open access article distributed under the terms and conditions of the Creative Commons Attribution (CC BY) license (https://creativecommons.org/licenses/by/4.0/).
Share and Cite
Wang, B.; Dong, X.; Wang, Z.; Qin, G. Characterizing Spatiotemporal Variations of Soil Salinization and Its Relationship with Eco-Hydrological Parameters at the Regional Scale in the Kashi Area of Xinjiang, China from 2000 to 2017. Water 2021, 13, 1075. https://doi.org/10.3390/w13081075
Wang B, Dong X, Wang Z, Qin G. Characterizing Spatiotemporal Variations of Soil Salinization and Its Relationship with Eco-Hydrological Parameters at the Regional Scale in the Kashi Area of Xinjiang, China from 2000 to 2017. Water. 2021; 13(8):1075. https://doi.org/10.3390/w13081075
Chicago/Turabian StyleWang, Bo, Xinguang Dong, Zhihui Wang, and Guoqiang Qin. 2021. "Characterizing Spatiotemporal Variations of Soil Salinization and Its Relationship with Eco-Hydrological Parameters at the Regional Scale in the Kashi Area of Xinjiang, China from 2000 to 2017" Water 13, no. 8: 1075. https://doi.org/10.3390/w13081075