Article

Rainfall Warning Model for Rainfall-Triggered Channelized Debris Flow Based on Physical Model Test—A Case Study of Laomao Mountain Debris Flow in Dalian City

College of Construction Engineering, Jilin University, Changchun 130026, China
*
Author to whom correspondence should be addressed.
Water 2021, 13(8), 1083; https://doi.org/10.3390/w13081083
Submission received: 26 March 2021 / Revised: 12 April 2021 / Accepted: 12 April 2021 / Published: 14 April 2021
(This article belongs to the Section Hydrology)

Abstract

:
Debris flows are among the most frequent and hazardous disasters worldwide. Debris flow hazard prediction is an important and effective means of engineering disaster mitigation, and rainfall threshold is the core issue in debris flow prediction. This study selected the Laomao Mountain debris flow in Dalian as the research object and explored the relationship among the percentage of coarse sand content of soil, rainfall conditions and the critical rainfall values that induce debris flows on the basis of field investigation data, combined with the results of a flume test, soil suction measurement and geomechanical analysis. The new multi-parameter debris flow initiation warning models were obtained through the mathematical regression analysis method. The critical rainfall values of debris flows in this area were calculated by the previous research on the mechanism of hydraulic debris flow initiation (HIMM). Lastly, the multi-parameter debris flow initiation warning models were compared and analyzed with the critical rainfall values obtained using the HIMM method and the rainfall information available in historical rainfall data, and the reliability of the models was verified. The comparison results showed that the new multi-parameter debris flow initiation warning models can effectively modify the traditional intensity–duration model and have certain reliability and practical values. They can provide an effectual scientific basis for future work on the monitoring and prediction of debris flow disasters.

1. Introduction

Debris flows are a type of sudden natural disaster in mountainous areas and a complicated natural geomorphological process [1]. They are among the most frequent and costly hazards worldwide [2]. Dilley [3] suggested that debris flows and landslides claim approximately 1000 lives per year globally. A recent detailed study by Dowling and Santi [4] showed that this number may be even higher (approximately 1200 fatalities per year); between 1950 and 2011, at least 77,779 fatalities were recorded worldwide during 213 debris flow events in 38 countries. Debris flows also cost China up to 2 billion yuan (≈$154,800,000) a year in direct economic losses [5]. In accordance with data, nearly 8500 debris flows are distributed across 29 provinces, with an area of approximately 4.3 km × 106 km [6]. This finding shows that early warning of mudslide disasters is highly necessary.
The early warning of debris flow hazards, as one of the important and effective means of engineering disaster mitigation, has been receiving attention from researchers [7,8,9,10,11,12]. For example, Zhou [13] proved through flume tests that rainfall intensity affects the infiltration of rainwater occurring inside the slope body, which is the main reason for debris flow initiation. Gartner [14] established a prediction model for debris flow initiation through regression analysis by studying 53 areas after fires in consideration of topography, the area affected by the fire, soil properties, rock types, rainfall amounts, and rainfall intensities. Hu [15] demonstrated through flume tests that slope damage is not caused by a positive pore pressure but by a decrease in suction due to soil wetting and that the infiltration capacity of loose source materials controls the initiation and movement of debris flows. Rainfall is the main triggering factor for the initiation and transformation of material sources into debris flows; hence, the determination of critical rainfall conditions is of great significance to developing early warning and evacuation systems and the protection of people’s lives and properties [16]. The rainfall threshold is the core issue in mudslide early warning and is important to study the mechanism of mudslide formation, predict the characteristics of future mudslide activities, and design engineering prevention and control measures, for which considerable research has been conducted [8,9,10,17,18,19,20,21,22,23]. For instance, Takahashi [24], Iverson and Lahusen [25] predicted the formation of debris flows on the basis of studies on slope stability, hydrodynamic action, and the influence of pore water pressure on the formation process of debris flows. Caine [26] first statistically analyzed the empirical relationship among rainfall intensity, rainfall duration, and shallow landslides and proposed an exponential expression (I = 14.82 D−0.39). Afterward, other researchers, such as Wieczorek et al. [27], Jibson et al. [28], Hong et al. [29], Dahal et al. [30], Guzzetti et al. [31], Berti et al. [32], and Saito et al. [33], carried out further research on the empirical relationship between rainfall intensity and rainfall duration, established the empirical expression of rainfall intensity–duration (ID), and proposed debris flow prediction models. Wei et al. [10] investigated a rainfall threshold method for predicting the initiation of channelized debris flows in a small catchment by using rainfall and runoff data from field measurements. Pan et al. [12] calculated the rainfall threshold for debris flow warning by calculating the critical depth of debris flow initiation, combined with flow production and adjustment factors.
From 26 to 28 July 1981, under the influence of typhoon “8108” and the westerly trough, the Laomao Mountain area in the north of Wafangdian and Pulandian, Dalian City, Liaoning province suffered from heavy rainfall of 300 to 670 mm. Consequently, several landslides occurred in the Laomao Mountain area, causing rivers to flood and forming debris flows. Flood swiftly flowed, accompanied by debris flows carrying several tons of boulders. Statistics provided by the Liaoning Land and Resources Department indicated that the affected areas were concentrated in the Laomao Mountain area, reaching 400 km2, with 664 people killed, 5058 injured, and 163,600 affected by the disaster. The debris flow disaster destroyed 1835 houses and thousands of farmlands and fruit trees. This catastrophe also damaged the railroad bed from Changchun to Dalian, which was 4.9 km long, and a total of 406 trains were shut down for eight days [34]. Numerous trains were overturned, causing losses amounting to 102,415,000 yuan. In accordance with the site investigation, the debris flows in the area have disaster-forming characteristics of sudden occurrence, strong cluster, and long outbreak cycle. In the recent 40 years, the geological environment of the region has undergone major changes. Especially in recent years, the annual rainfall in Dalian has increased compared with the average rainfall for many years; the annual average precipitation of the city in 2011 was 909.1 mm, which was 264.7 mm more than the annual average of all years; the rainfall is mostly concentrated in June to September, which provided abundant rainfall for the outbreak of debris flows. The formation of debris flows in this area was mainly controlled by topography and rainfall. Owing to the great amount of material sources, a large catchment area, and a high longitudinal valley ratio, a debris flow can easily break out under heavy rainfall conditions, which will pose a great threat to the households and properties in the area. When the rainfall increases, especially when it becomes concentrated, the possibility of a debris flow erupting again in the Laomao Mountain area also increases. A reliable debris flow initiation warning model should be established to provide accurate basic data for monitoring and forecasting of the debris flow in the Laomao Mountain area and study the causes and mechanism analysis of debris flows in the Laomao Mountain area.
In this study, the Laomao Mountain debris flow in Dalian City was selected as the research object. First, on the basis of the similarity theory of the physical simulation test of debris flow initiation, different rainfall and source conditions were simulated. In accordance with the physical, mechanical, and distribution characteristics of the slope source in Laomaoshan Gully, a similarity physical model test was carried out to determine the critical rainfall of slope source initiation under artificial rainfall conditions. The response relationship between the change in physical and mechanical characteristic parameters and the initiation process of a debris flow was revealed and refined, and two multi-parameter debris flow initiation warning models that can comprehensively reflect the soil properties and geological conditions were proposed. Then, the critical rainfall inducing a debris flow was calculated using the relationship between rainfall and debris flow initiation obtained from the HIMM model. Lastly, the threshold rainfall values obtained using three models were compared with the actual rainfall obtained from the available data to verify their reliability.

2. Materials and Methods
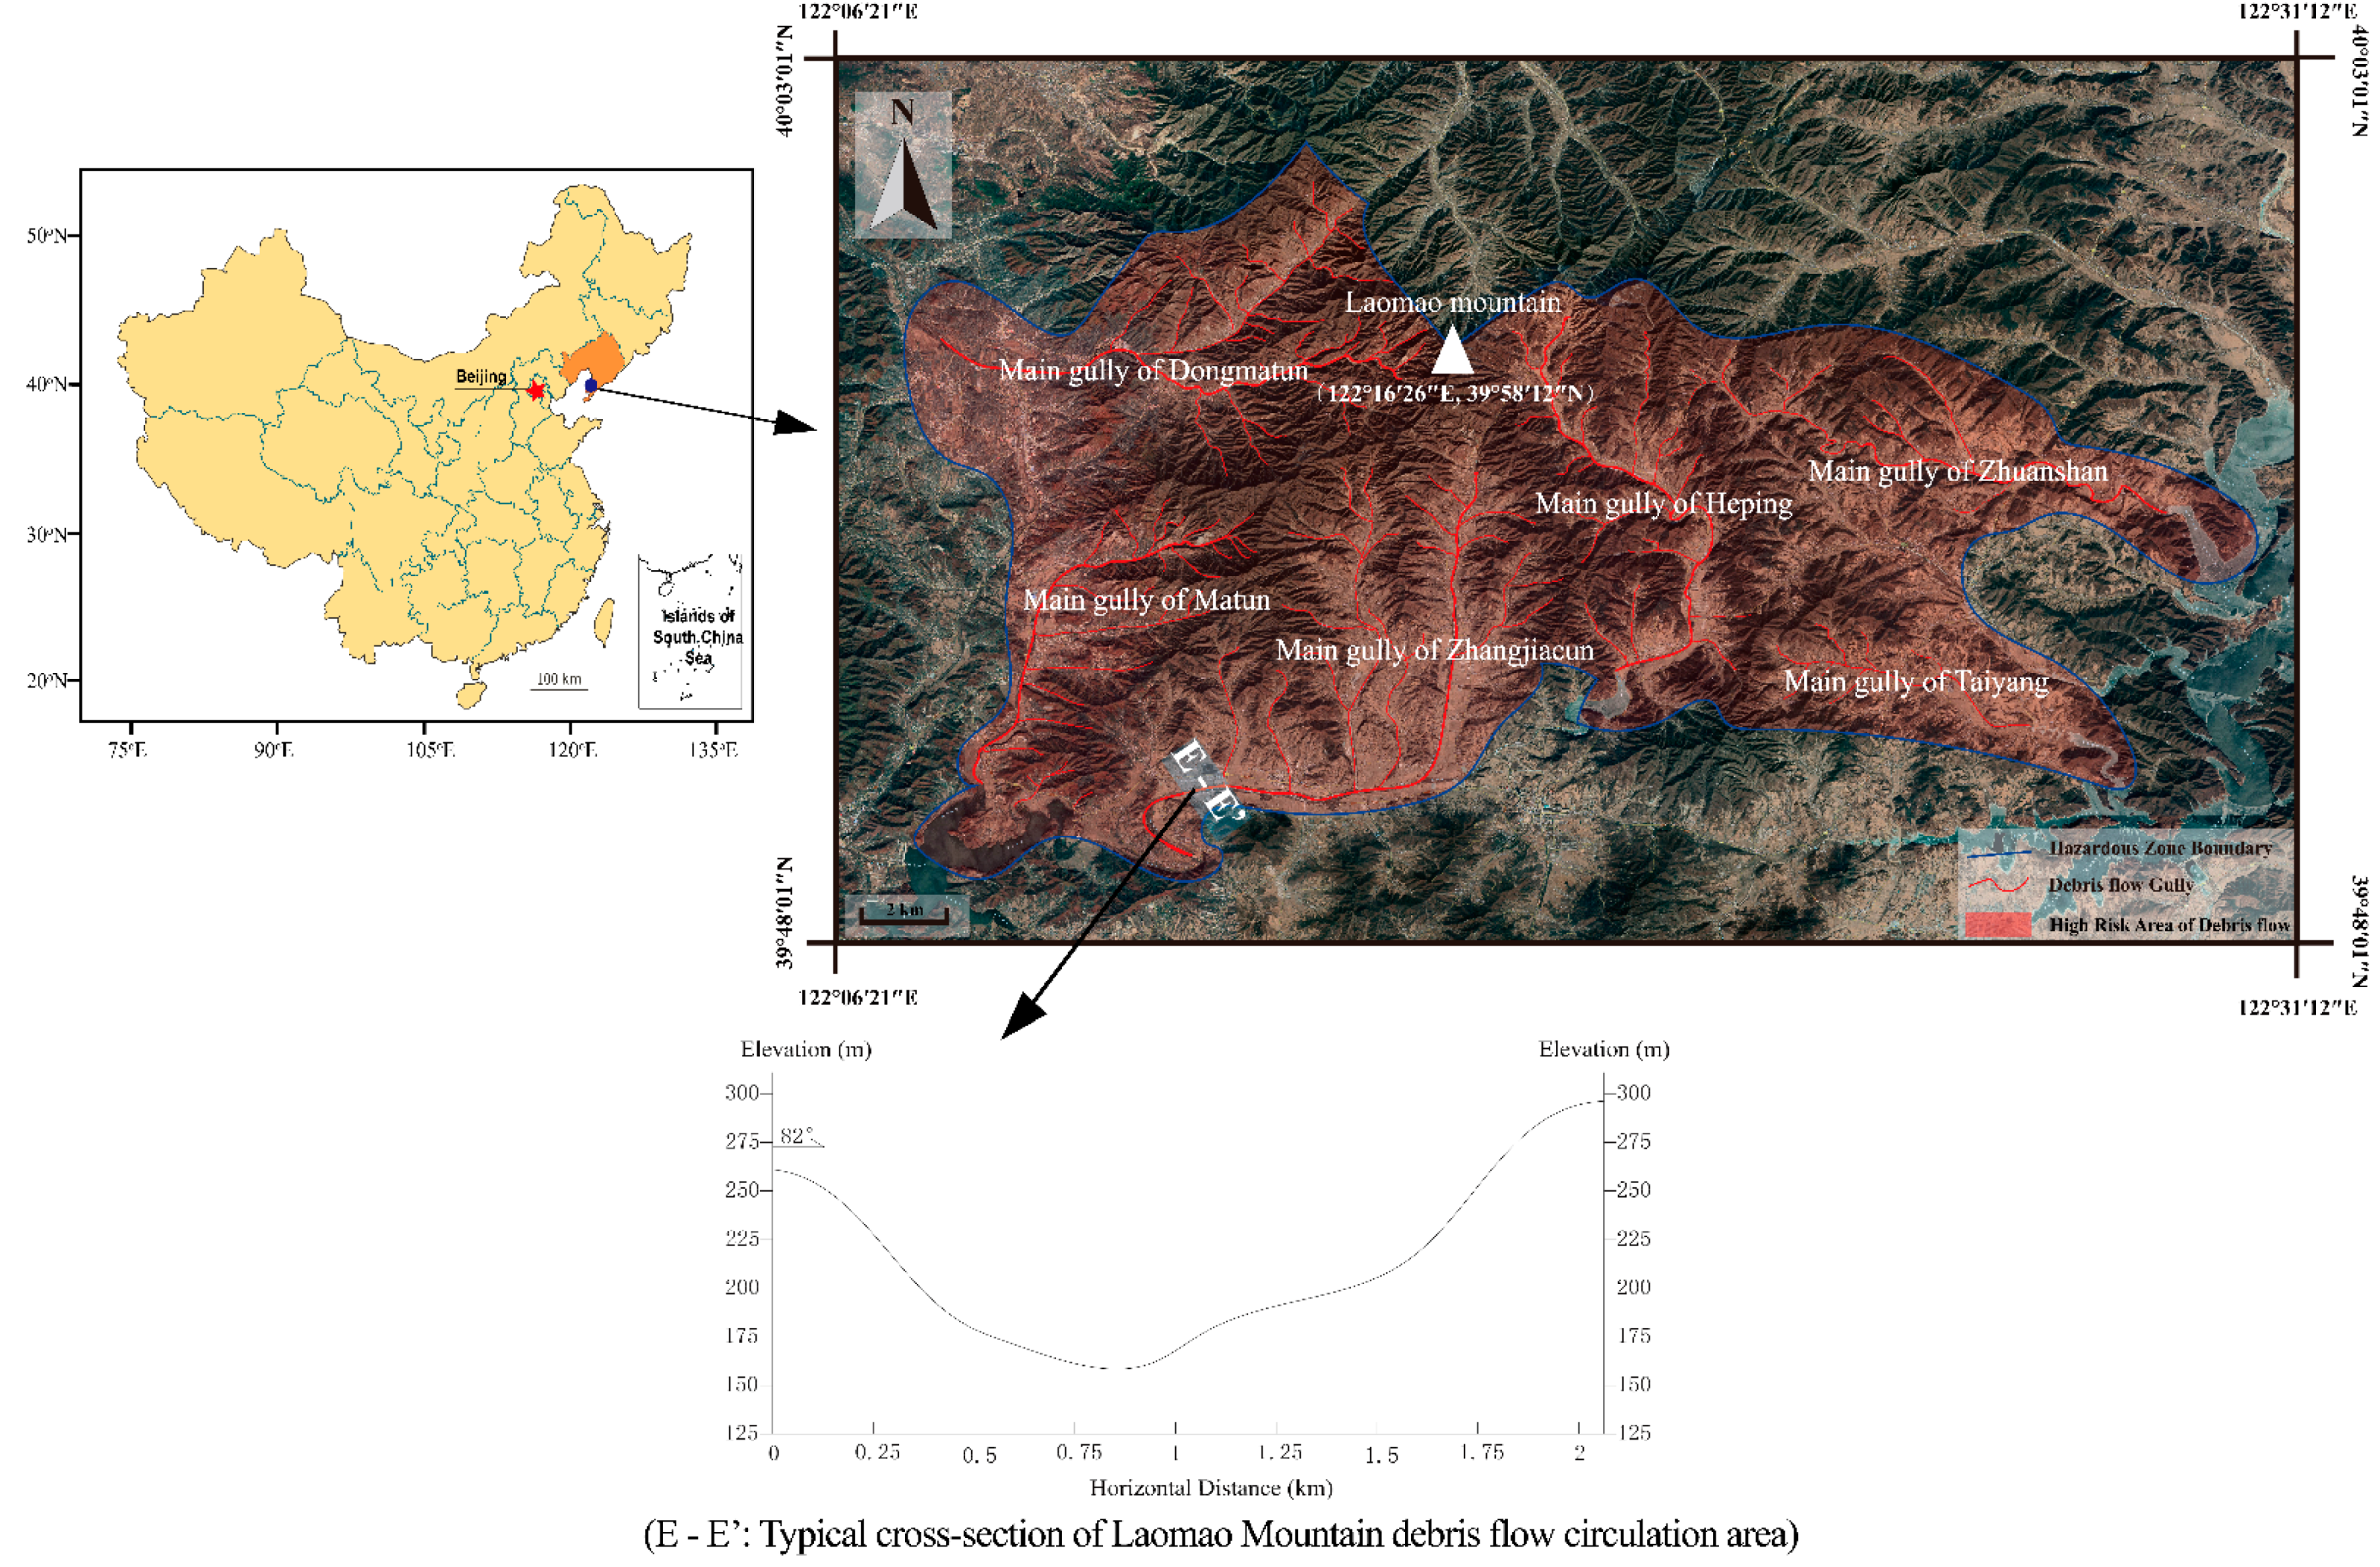
2.1. Study Site

2.1.1. Geological Setting

The Laomao Mountain debris flow located in the southwest extension of the Qianshan Mountain area belongs to the low mountain hilly landscape of the Liaodong Peninsula, with a single type. The total catchment area of the debris flow was 338.8 km2, and the development of a debris flow in this area was influenced by its geological environment, which is a typical gully-type low-frequency rare debris flow.
In accordance with the distribution of the water system and topography, the debris flow in the Laomao Mountain area of Dalian was divided into six main gully debris flows: Dongmatun, Matun, Zhangjiacun, Heping, Zhuanshan and Taiyang, as shown in Figure 1. The characteristic parameters of main debris flow gullies are shown in Table 1.
A detailed field survey and geological investigation were conducted on the source and stratigraphic condition of the area. The distribution, storage capacity, morphology, and other characteristic elements of real sources in the source area of the entire basin of the Laomao Mountain debris flow gully were obtained, as shown in Figure 2.
The topography of the Laomao Mountain area is strongly excised, with steep mountains, narrow valleys, a V-shaped development, and steep slopes of 20 to 60° on both sides. The bank slope of the gully was exposed, the rock body was severely weathered, a potential risk of collapse was observed, and collapse and landslide geological disasters were easy to produce. The main gully section of the debris flow was V-shaped, and the thickness of the loose layer on both sides of the gully was 20 to 30 cm. The source in the gully was large. The main gully provides a large amount of source supply. The toe of the slope has a large amount of boulder accumulation. The vegetation coverage on both sides of the gully was approximately 75%, with weed bushes as the main source. According to the investigation of historical disaster data, a large-scale debris flow broke out in Laomaoshan 160 years ago, and it broke out again in 1981 after 120 years of silence. Moreover, an extreme rainfall event will cause multiple debris flow disasters at the same time, which will pose a considerable threat to the households and properties in the area. Thus, a reliable debris flow initiation warning (or prediction) model should be established to provide accurate basic data for the monitoring and prediction of debris flows in the Laomao Mountain area.
After the soil of the overlying accumulation layer of the formation area of the Laomao Mountain debris flow gully was retrieved, indoor particle fraction experiments were conducted. The soil samples were classified into four types in accordance with the particle size composition by combining the experimental results. While the percentage of particle content in each group of soil samples was determined (as shown in Figure 3), the characteristic parameters of particle composition were also calculated. The effective diameter (d10), median diameter (d30), average diameter (d50), constrained diameter (d60), uniformity coefficient (Cu), and curvature coefficient (Cc) of soil samples are shown in Table 2.
It can be seen that the main component of Laomao Mountain debris flow source soil is coarse-grained soil dominated by sand particles (0.02 to 2 mm), and the content of coarse sand (0.5 to 1 mm) in sand particles is the highest, and there are obvious differences among soil samples.

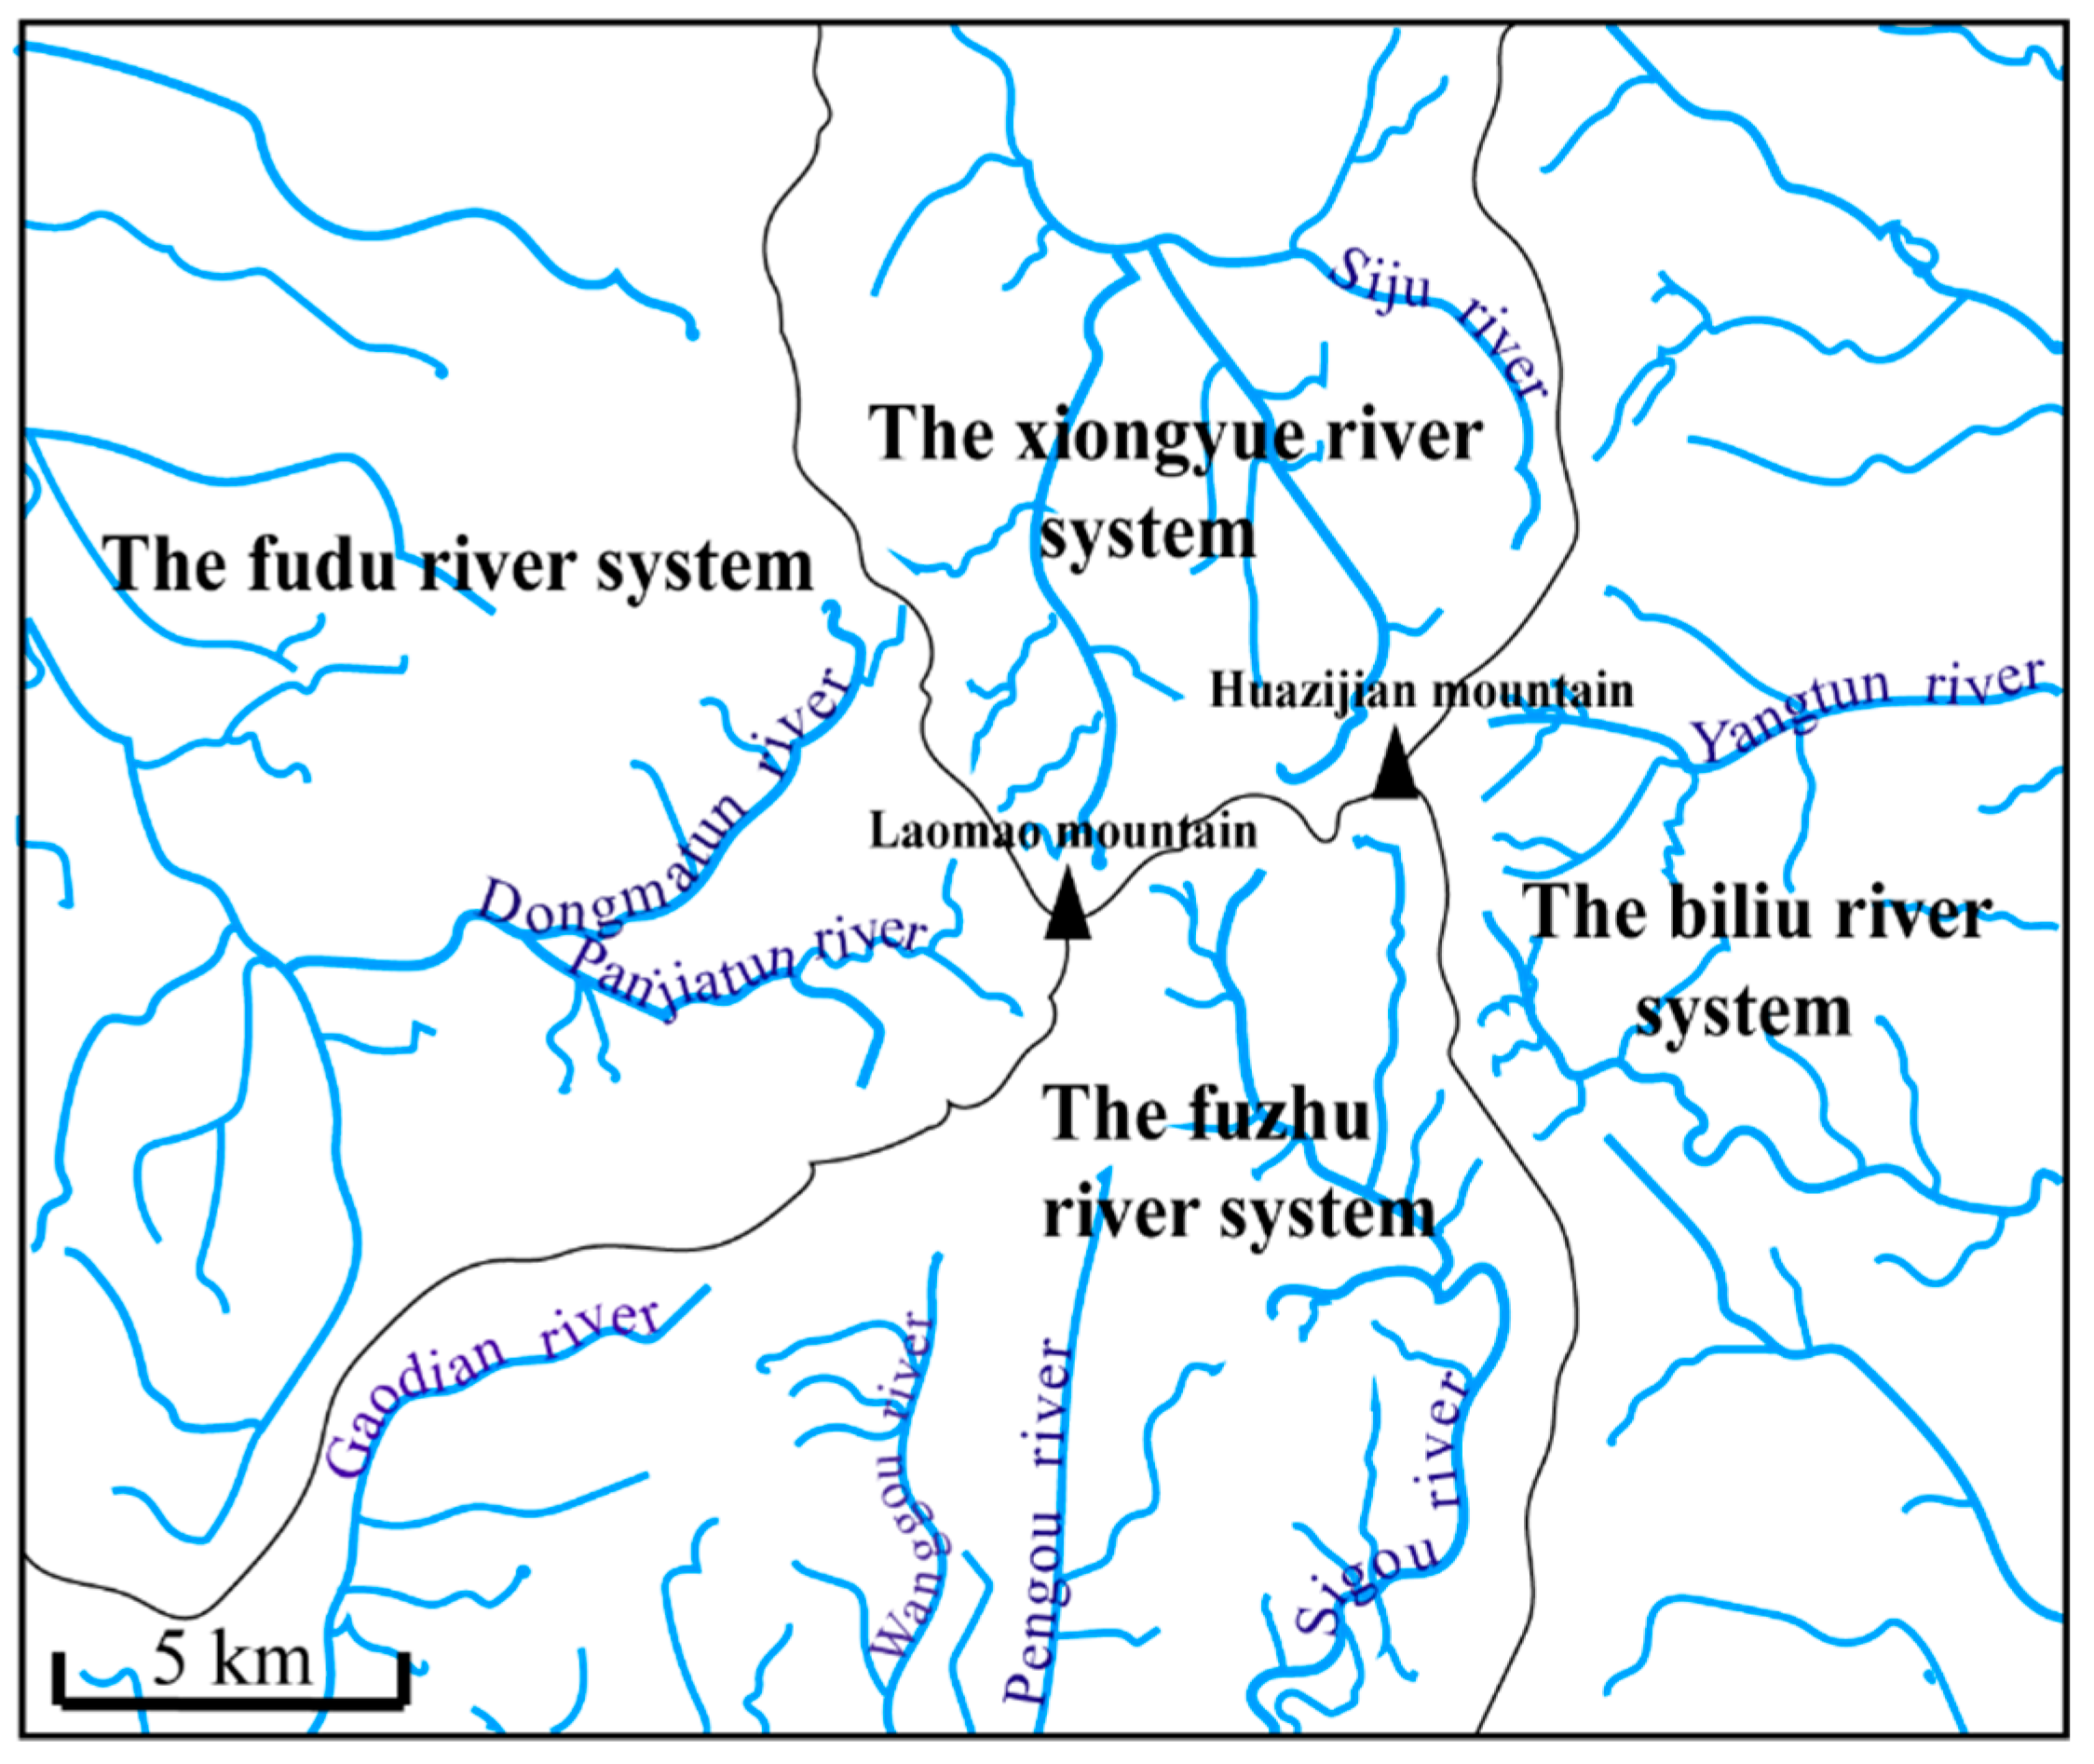
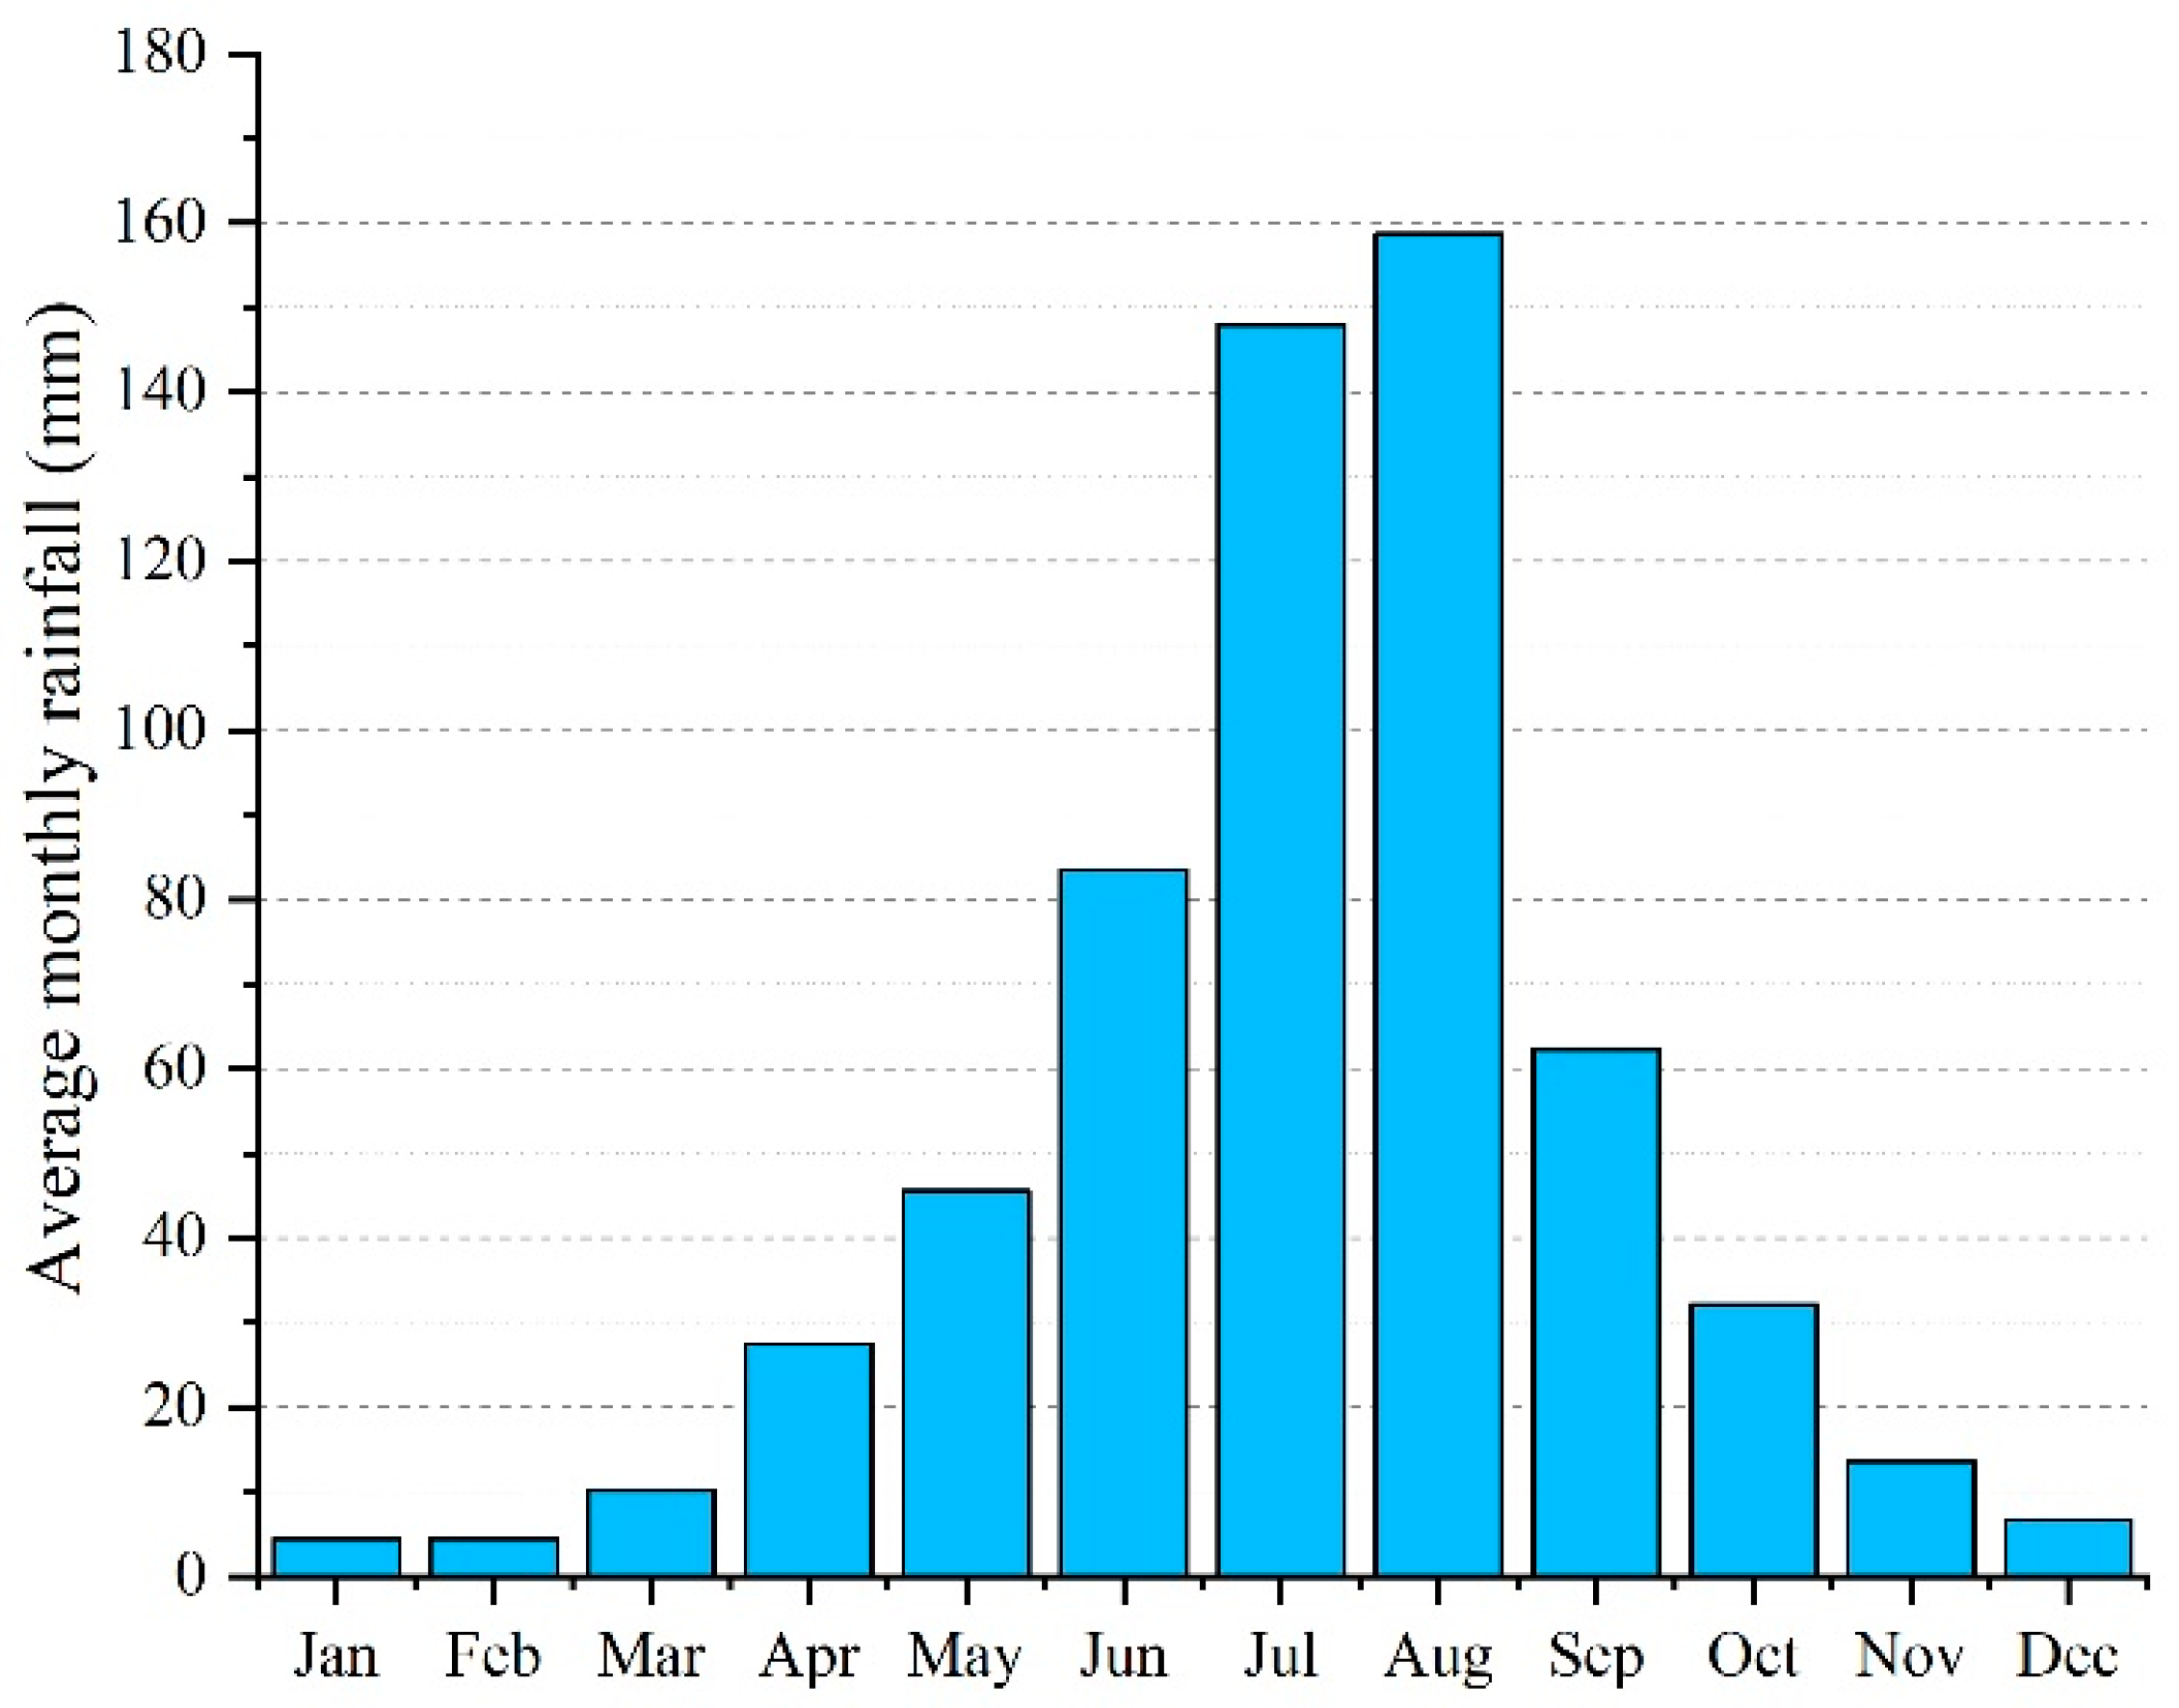
2.1.2. Hydrological Settings

The valleys are mostly distributed in the shape of pincer dendrites, and they are the origin of each water system of the Xiongyue River, Fudo River, Fuzhou River, and Biliu River, as shown in Figure 4.
The Laomao Mountain area is an area with frequent heavy rainfall and high rainfall intensity. Heavy rainfall is the main triggering condition of debris flow in this area. The average precipitation for many years amounts to approximately 600 mm, which is mostly concentrated in July and August and accounts for approximately 60% of the entire year. Heavy rainfall mainly concentrates in mid-July to mid-August, accounting for more than 70% of the total rainstorms, with an average of three days of rainstorms annually. The multi-year precipitation data of Dalian from 1980 to 2019 are shown in Figure 5.
On 27 July 1981, a heavy rainstorm occurred in the Laomao Mountain area. According to the measured rainfall stations in this area, the 1 h rainfall was 116.5 mm and the 3 h rainfall was 233 mm; the 6 h rainfall was 395 mm; the 12 h rainfall was 524 mm; the 24 h rainfall was 583.7 mm; the whole rainstorm lasted 54 h, and the process rainfall reached 768.9 mm, as shown in Table 3.

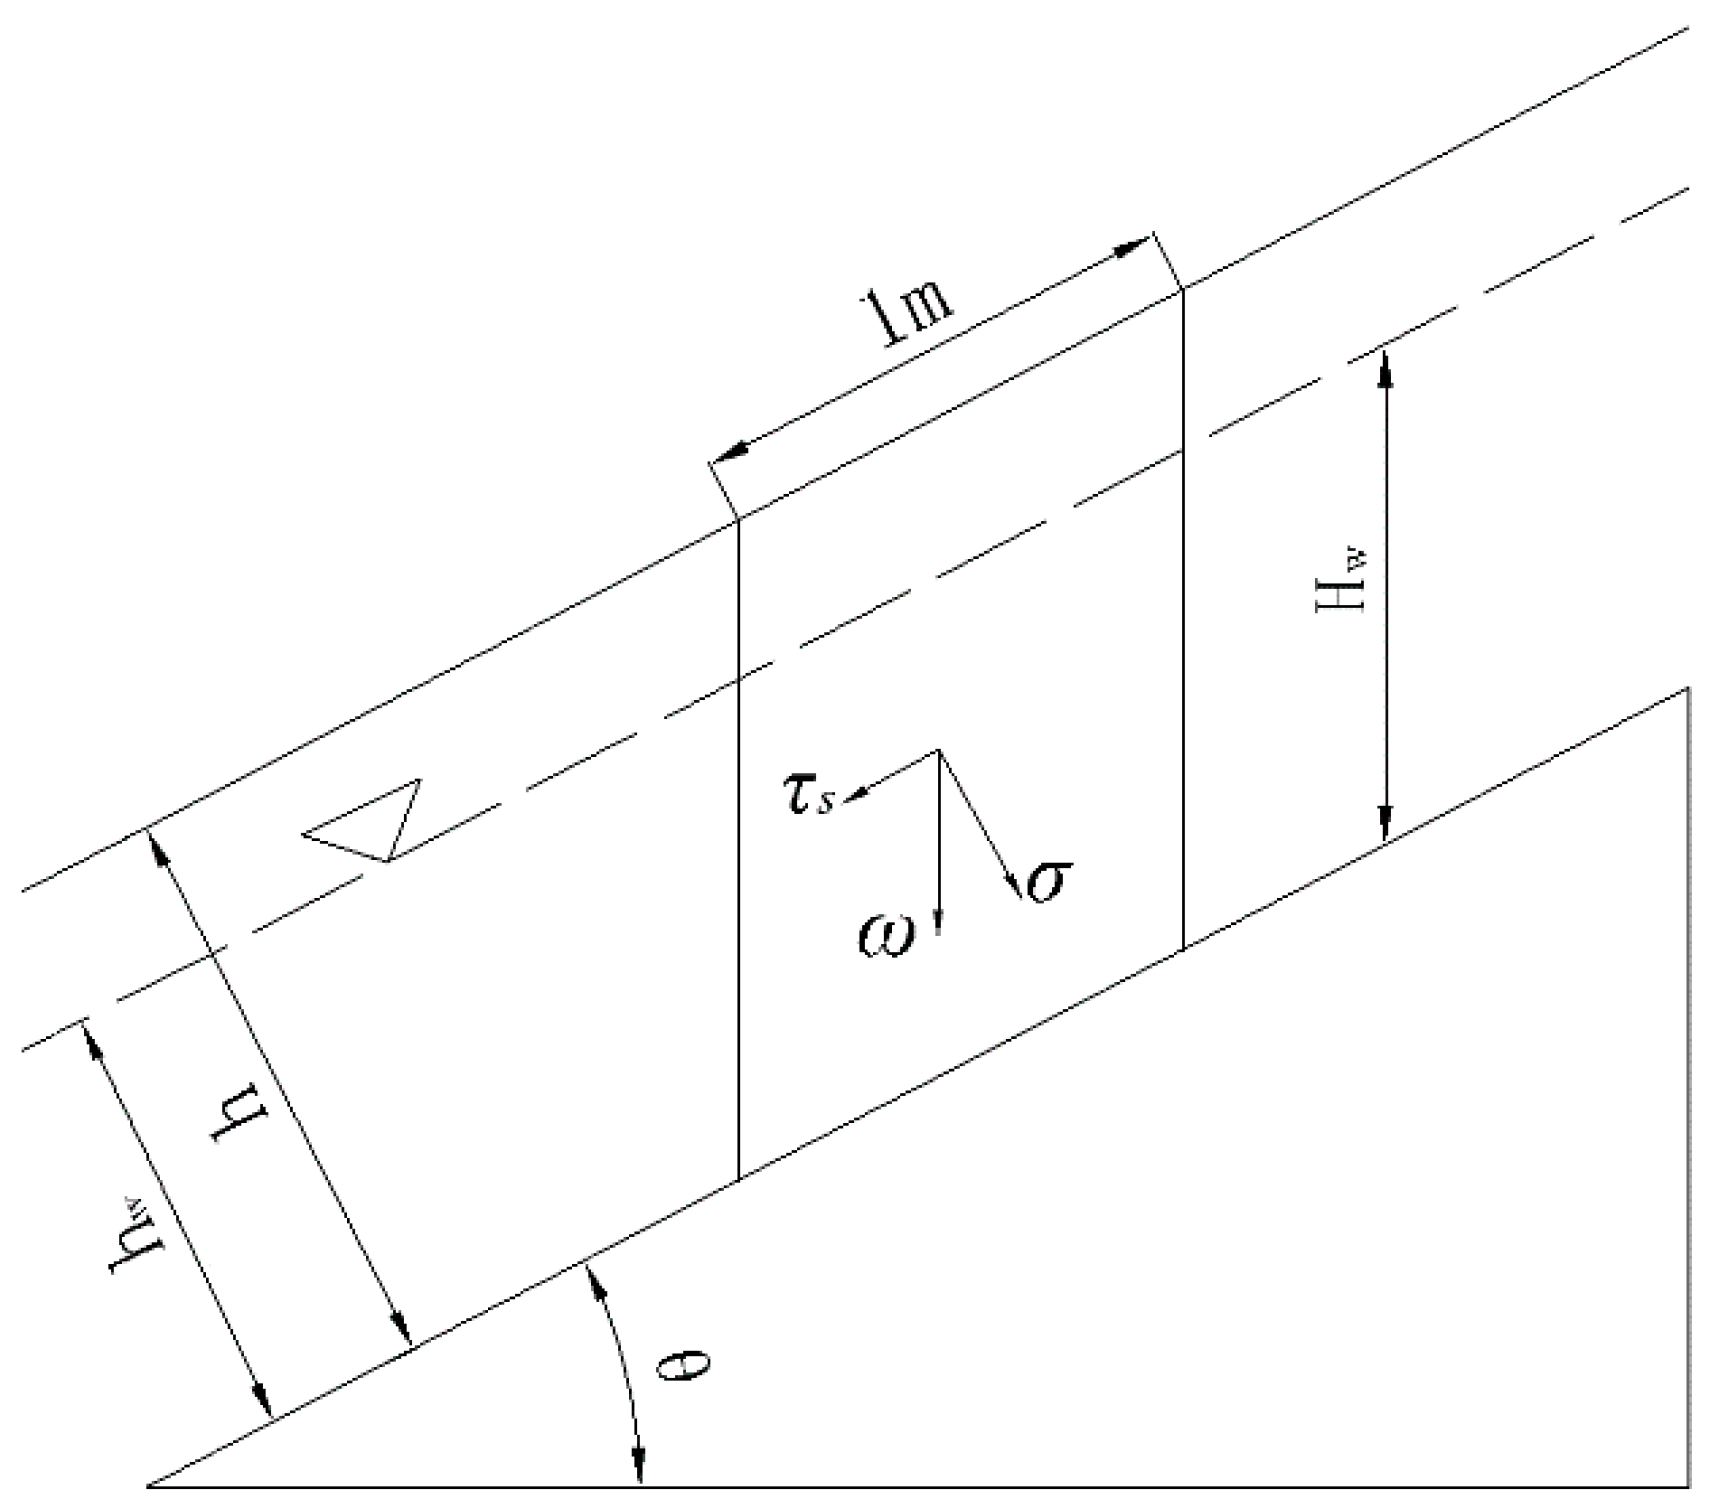
2.2. Hydraulic Debris Flow Initiation Mechanism Calculation Model (HIMM)

Research on debris flow rainfall threshold by domestic and foreign scholars is mainly divided into the following three categories:
  • Empirical method [33,35,36]: The relationship between the corresponding early effective rainfall and characteristic rainfall (10 min, 30 min, 1 h rainfall, etc.) is obtained through the statistical analysis of the actual rainfall and debris flow disaster data to draw the rainfall threshold curve, which is only applicable to areas with long-term observation history;
  • HIMM model [7,37]: The relationship between rainfall and debris flow initiation is obtained by investigating the mechanism of debris flow initiation to calculate the threshold rainfall for debris flow;
  • Storm frequency method [38]: Assuming that the occurrence of a debris flow is the same as that of a rainstorm, the occurrence frequency of a rainstorm is calculated by statistical analysis of rainfall data, then the rainfall threshold inducing a debris flow is calculated, which is mainly suitable for areas with rich rainfall data and lacking debris flow disaster data.
Owing to the long period of debris flows around Laomao Mountain, the area had a large-scale debris flow more than 160 years ago, and another event occurred in 1981 after no activity for more than 120 years. The historical statistics of rainfall and debris flow disasters is lacking. Therefore, among the above methods, only the calculation method of the debris flow initiation mechanism can provide strong reference values for the determination of the debris flow rainfall threshold in the Laomao Mountain area.
The initiation of a debris flow was a result of the combined effect of the preliminary rainfall and the short-time heavy rainfall. Different short-time heavy rainfall can illustrate the triggering rainfall of a debris flow; 10 min, 30 min or 1 h rainfall intensity is usually selected as the triggering rainfall of debris flow in accordance with a specific situation. In this study, a 1 h rainfall intensity was selected for the analysis.
Pre-rainfall refers to the amount of rainfall before the short-duration storm that induces a debris flow, including indirect and direct pre-rainfall [39]; the equation is as follows:
P a = P a 0 + P t
where: P a is the pre-impact rainfall of debris flow (mm); P a 0 is the indirect pre-impact rainfall (mm); P t is the direct pre-impact rainfall (mm).
The indirect pre-impact rainfall (antecedent effective rainfall Pa0) refers to the rainfall of n days before the outbreak of debris flow in the basin; the equation is as follows:
P a 0 = K P 1 + K 2 P 2 + K 3 P 3 + + K n P n
where: P a   (1, 2, 3, … n) is the daily rainfall (mm) of n days before the debris flow outbreak; K is the decreasing coefficient, usually taken as 0.8 to 0.9.
The direct pre-impact rainfall (stimulated rainfall P t ) refers to the rainfall on the day before the debris flow outbreak, which directly affects the water content of loose material source before the debris flow starts. The equation is as follows:
P t = t 0 t n r
where: t 0 is the start time of this (daily) rainfall process; t n is the time before 1 h rain intensity; r is the rainfall amount (mm).
In general, the length and width of the loose accumulation in the bed of the debris flow gully are much larger than the thickness of the accumulation. Accordingly, the infinite slope model was used to analyze the force of the loose accumulation. Let the slope of the debris flow trench bed be θ, the thickness of the loose accumulation be h, and the water depth be hw. The accumulation body was mainly subject to gravity and pore water pressure, and the unit length of the accumulation body was taken for force analysis, as shown in Figure 6.
In accordance with the Mohr–Coulomb strength criterion, the factor of safety of a loose pile is the ratio of shear strength to shear stress, and the formula for the factor of safety of a loose pile is obtained as follows:
F s = τ f τ s = c + ρ s g h ρ w g h w cos θ tan φ ρ s g h sin θ
where: ρ s is the density of the loose accumulation (g/cm3); g is the acceleration of gravity; h is the thickness of the accumulation (m); θ is the slope of the trench bed (◦); φ is the internal friction angle (◦).
In accordance with limit equilibrium theory, when the safety factor is 1, the loose accumulation body is in the limit equilibrium state that is the critical damage state, and the loose accumulation body destabilization causes a debris flow. The water depth hw is the critical water depth h0 that triggers the debris flow. Thus, the formula for calculating the critical water depth h0 can be obtained as follows:
h w = c ρ w g tan φ cos θ + h ρ s ρ w 1 tan θ tan φ
The average flow in the basin Q will be:
Q = B V h w
where: B is the width of the trench (m); V is the average velocity (m/s).
The runoff depth is calculated by the generation method of groundwater accumulation and confluence and the average water layer thickness method of the total runoff of debris flow in the total basin area. Taking 1 h as the unit, the runoff depth of the catchment R will be:
R = 3.6 Q F R = I 60 I m P b
where: F is the mudflow formation area (km2); Q is the average flow of the watershed (m3/s); I 60 is the 1 h rainfall that might induce a debris flow (mm); I m is the maximum storage capacity (mm), generally 80 to 120 mm; P b is the soil water content before the debris flow starts (mm), equal to the pre-rainfall P a   in numerical terms.
Assuming that the soil mass has reached saturation before the debris flow starts, then I m = P a . The runoff depth R calculated using Equation (7) is the 1 h rainfall intensity that might induce a debris flow I60.

3. Physical Simulation Experiment on Debris Flow Initiation

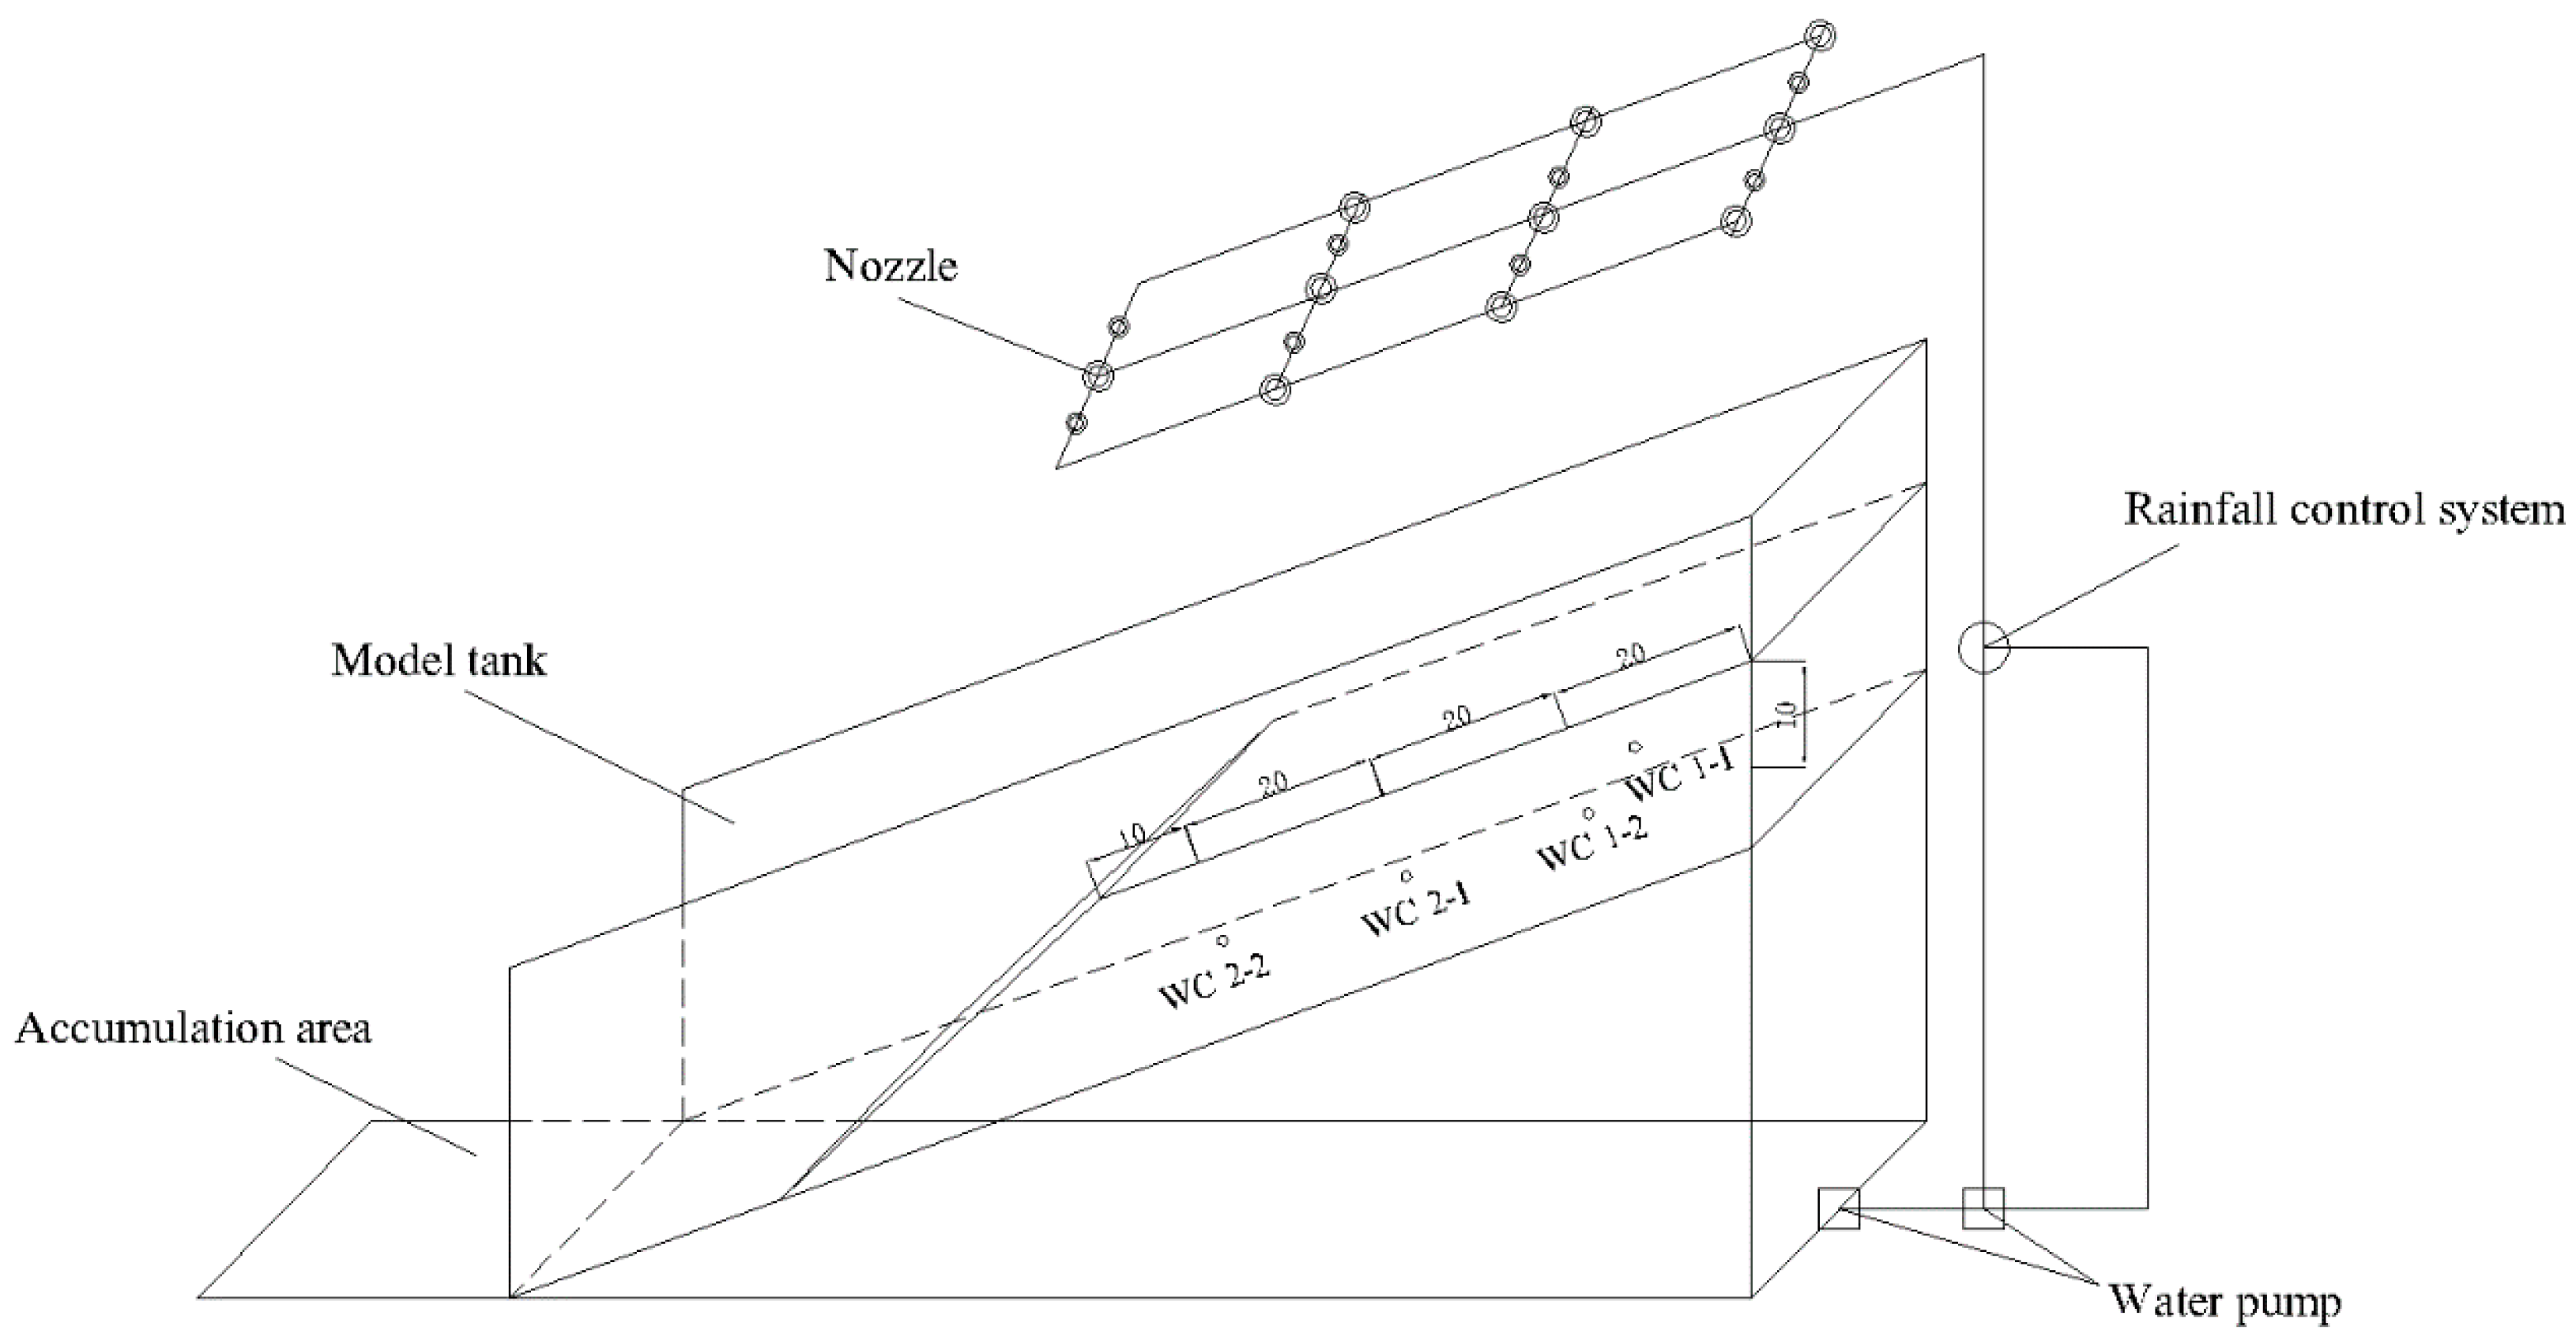
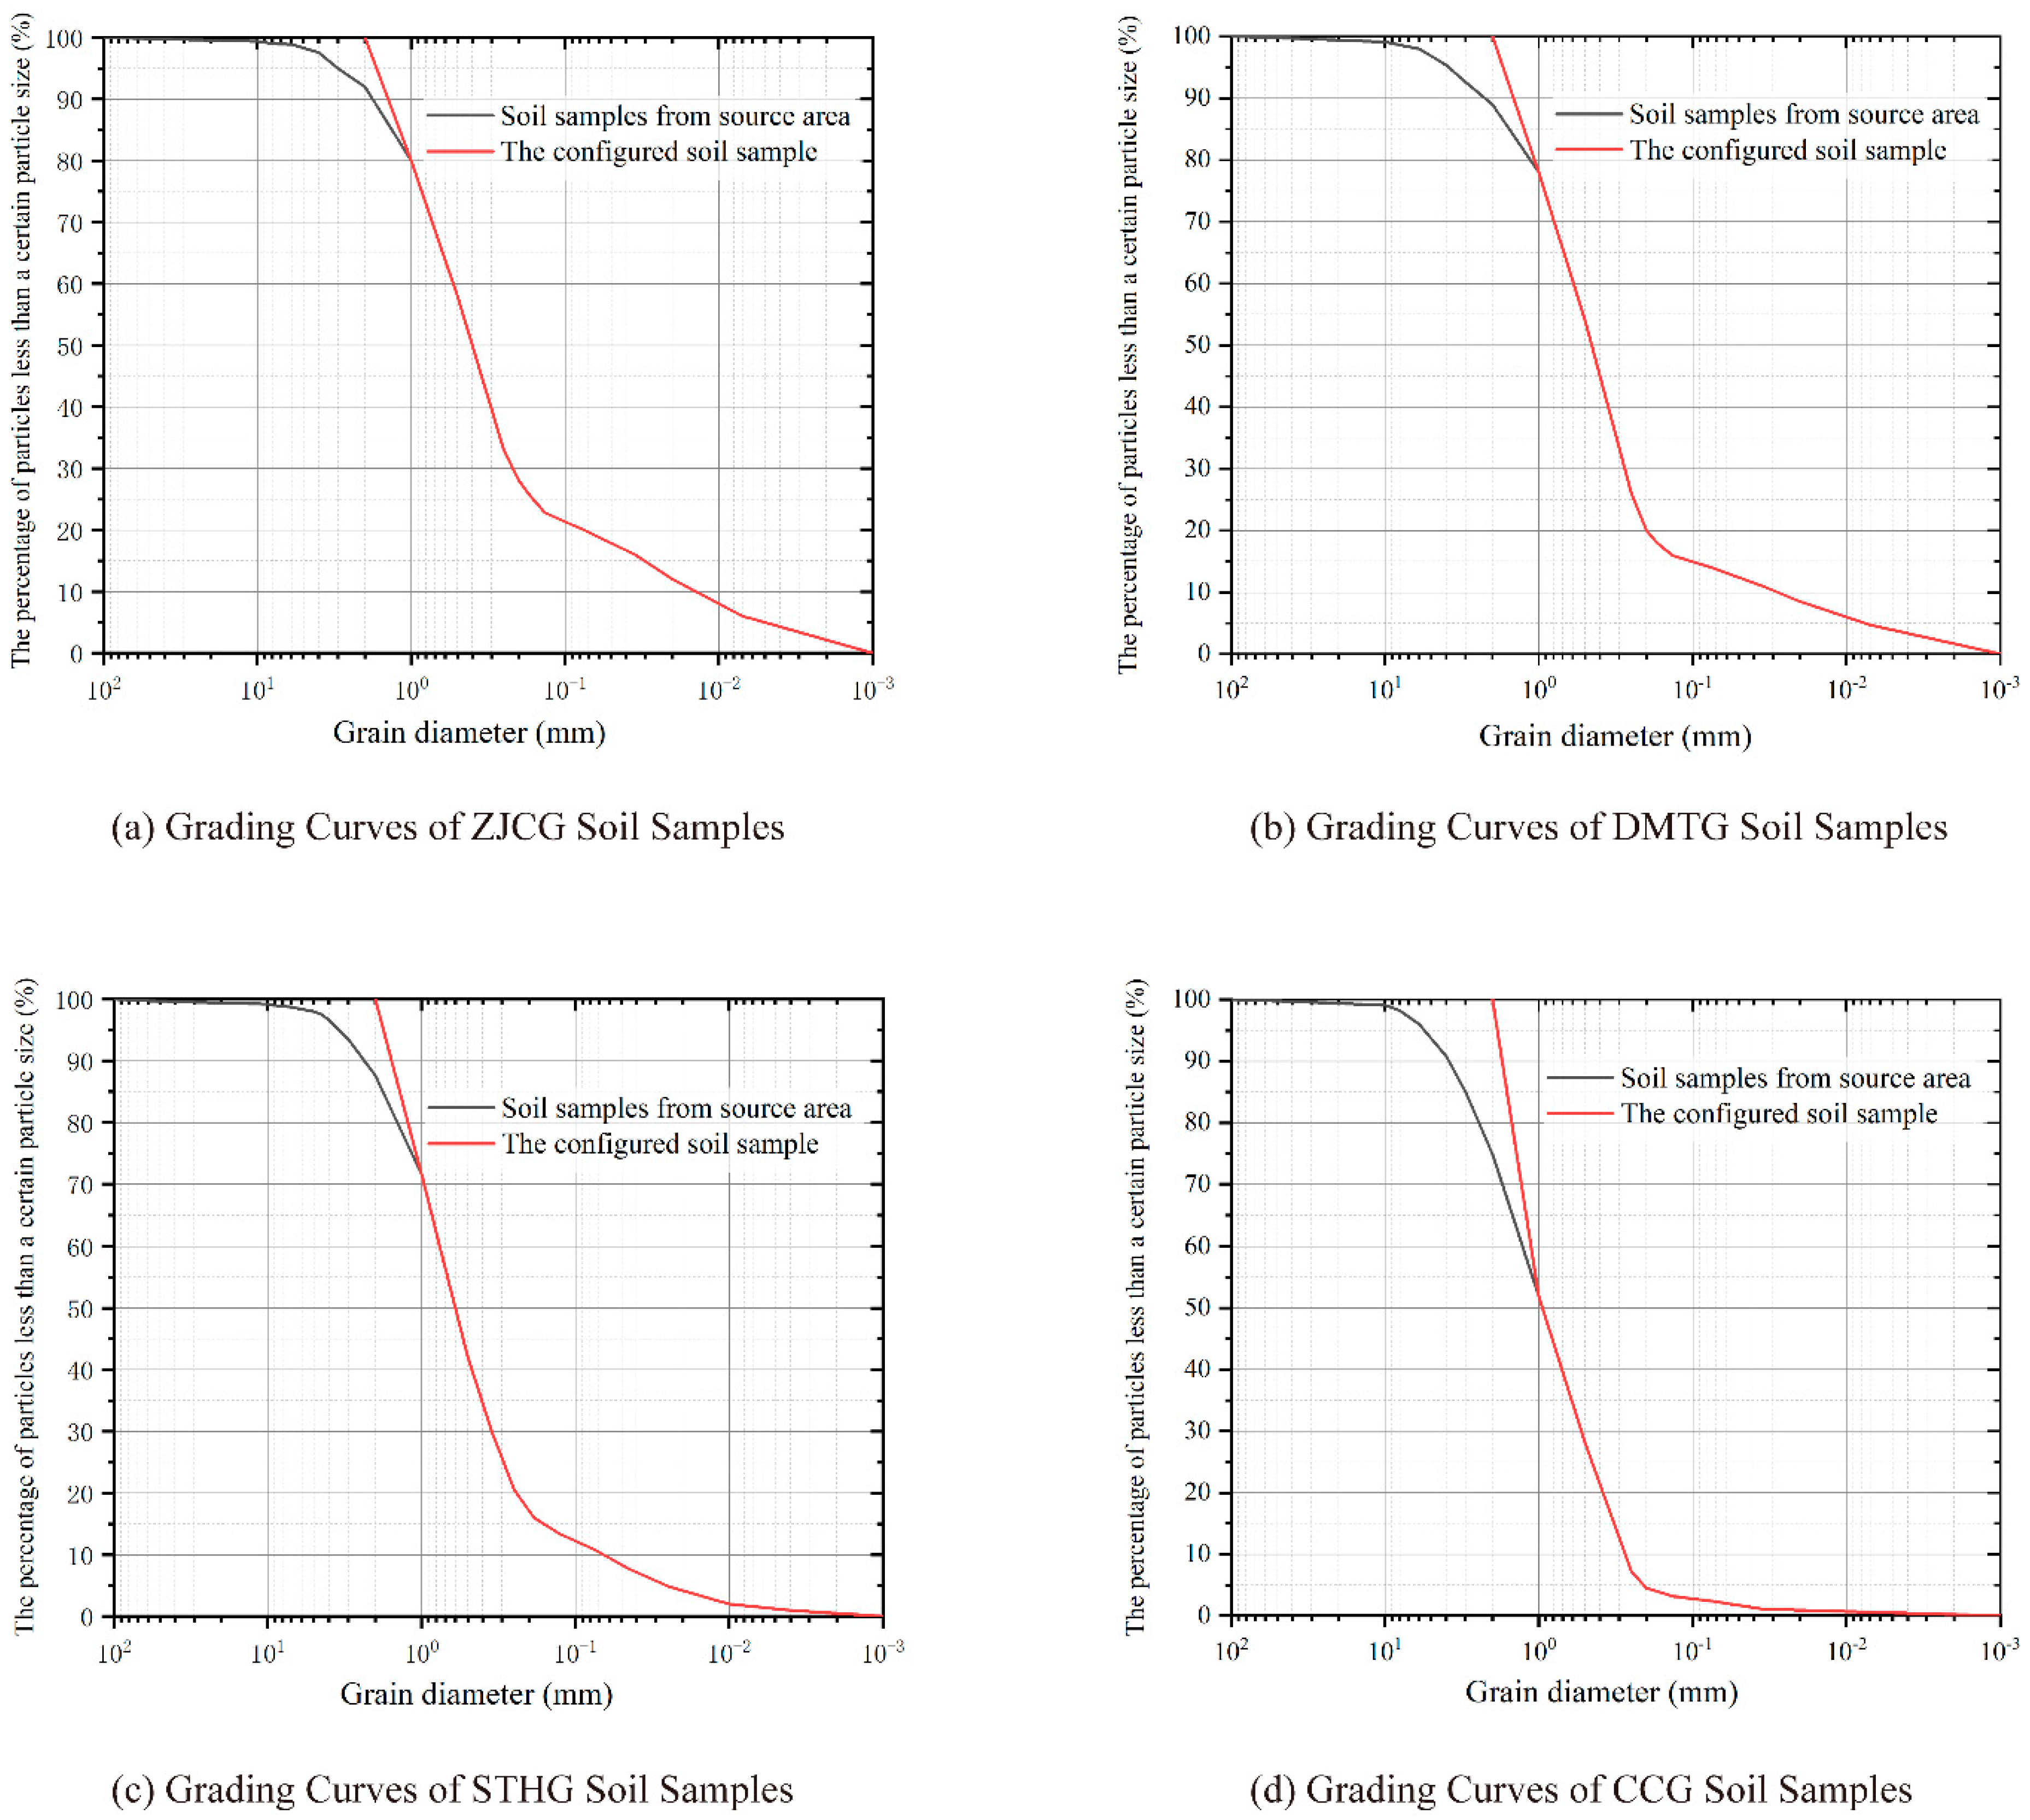
3.1. Design of Experiment

The scale of this test ratio was 1:20, mainly to achieve geometric and rainfall similarities, such that the artificial rainfall test method has certain applicability and feasibility. The model test was conducted via debris flow initiation simulation test in the Chaoyang Campus of Jilin University. The system was mainly composed of model test material source flume, rainfall system, and data acquisition system, as shown in Figure 7. The model flume was L × W × H = 3.0 m × 1.2 m × 2.5 m, with an unconstrained open stacking area at the front of the tank and a visualized tempered glass on three other elevations. The artificial rainfall system consisted of 18 nozzles with an adjustable rainfall intensity ranging from 10 mm/h to 100 mm/h. The sensor data acquisition system consisted of a moisture content sensor and a tension meter, in which the volumetric moisture content parameters were transmitted to a computer via the data acquisition box through the port connection. A total of four volumetric moisture sensors were collected every 15 s, and the rainfall lasted until the main slope was destroyed (the position of probe WC (water content) 2-1 was destroyed). If no damage occurs, the rainfall duration should be greater than 4 h.
The survey results showed that the landform of the debris flow formation area in the Laomao Mountain area was relatively simple, the slope was generally 18 to 60°, among which a 20 to 45° slope body accounted for approximately 75%. An angle of 20° was selected as the typical slope angle and 30° as the V-shaped gully bank slope. A layer of composite geotextile was laid on the V-shaped gully surface to simulate the rough and poor permeable lithologic gully surface. The surface of the composite geotextile was a rough non-woven fabric layer, and the interior was anti-seepage plastic film, which can approximately simulate the surface characteristics of lithologic gully under rainfall conditions. The soil of the accumulation layer was mainly the overlying soil in the debris flow gully, and the recharge mode of solid material was mainly the collapse, landslide, and slope flood accumulation layer. When the soil samples were laid in the test groove, the V-shaped gully was presimulated to lay the gully, and the maximum width of the gully section was 0.9 m. The thickness of the accumulation body was 0.45 m when the width of the section was twice the height. The soil was compacted by three layers to simulate the natural channel condition. The lower layer was the densest, and the upper layer was relatively loose. The average density was controlled to be 1.78 g/cm3, which was evenly spread to the channel. In the middle of the accumulation body, four groups of volumetric water content sensors were installed in the order of the upper, middle, and lower reaches, as shown in Figure 7. Given the long failure time in the upstream, two groups of sensors were symmetrically arranged in the same cross section to obtain detailed data on the change in volumetric moisture content.
The test soil was collected on-site from four overlying mounded layers in the debris flow gully formation area of Laomao Mountain. Owing to the limitation of model size, excluding large boulders, similar simulated materials were selected from the gravel soil after the sieving of 2 mm aperture in the original soil. Then, the equal amount substitution method [40] was used to ensure that < 2 mm was added to the same proportion of soil samples, as shown in Figure 8. The contents of indoor geotechnical experiments include screening (dm), triaxial test (Cohesion (C), internal friction angle (φ)), direct shear test (C, φ), the percentage of coarse sand (P) and soil routine (density (ρ)), etc., as shown in Table 4. The particle composition of the four soil samples (ZJCG (P = 42.7%), DMTG (P = 45.6%), STHG (P = 57.7%), and CCG (P = 72.4%)) was mainly coarse sand, and the content of coarse sand was significantly different. Accordingly, the percentage of coarse sand was the key factor affecting the soil properties in this area.
According to the design principle of similarity, the relationship between rainfall intensity and actual rainfall intensity in the artificial rainfall system is as follows:
I e l m = H t p t l
where: Ie is the rainfall intensity in the model (mm/h); l m is the dimension length of the physical model (m); l is the dimension length of the prototype system (m); t is the rainfall duration(h); H t p is the design rainfall value of the rainstorm in the standard duration (mm), which is calculated by the following equation:
H t p = K p H t ¯
where: K p is modal ratio coefficient, obtained by querying a Pearson type III curve table; H t ¯ is the 1-h-point rainfall mean(mm).
In accordance with the storm design based on the measured storm data of the Wafangdian regional monitoring station in Dalian City, the rainfall return period, the 1-h-point rainfall mean ( H t ¯ ), variation coefficient (Cvt), skewness coefficient (Cs) and modal ratio coefficient (Kp) were determined, and then the design rainfall (Htp) and modeled rainfall intensity (Ie) under 1 h calendar time were estimated, as shown in Table 5. Before each experiment, the artificial rainfall equipment was adjusted to the rainfall intensity of the model in advance, and multiple rainfall measurements were performed until the measurement error was less than 5%.
The experiment rain types were: persistent rainstorm (I = 24.67 mm/h), persistent extraordinary rainstorm (I = 77.65 mm/h), rainstorm to extraordinary rainstorm (I = 45.23 mm/h), and persistent rare extraordinary rainstorm (I = 109.15 mm/h). In total, more than 28 groups of large physical simulation tests were conducted in this experiment. Repeated experiments were performed for the groups with evident phenomena to provide more reliable basic data for determining the rainfall threshold of slope sources.

3.2. The Process of the Experiment

The amount of data from 28 sets of tests under four particle gradations and four rain intensity conditions was enormous. The test phenomenon observation indicated that the slope source initiation mode was mainly influenced and controlled by rainfall intensity and soil coarse sand content, and its destabilization damage stage was divided into different rainfall conditions and soil coarse sand content conditions of the source destabilization damage process. Six sets of typical tests with different particle gradations and rain intensities were taken out to show and verify the overall analysis results. They were 24.58 mm/h for ZJCG (P = 42.7%), 77.65 mm/h for ZJCG, 109.15 mm/h for ZJCG, 77.65 mm/h for DMTG (P = 45.6%), 77.65 mm/h for STHG (P = 57.7%), and 77.65 mm/h for CCG (P = 72.4%).

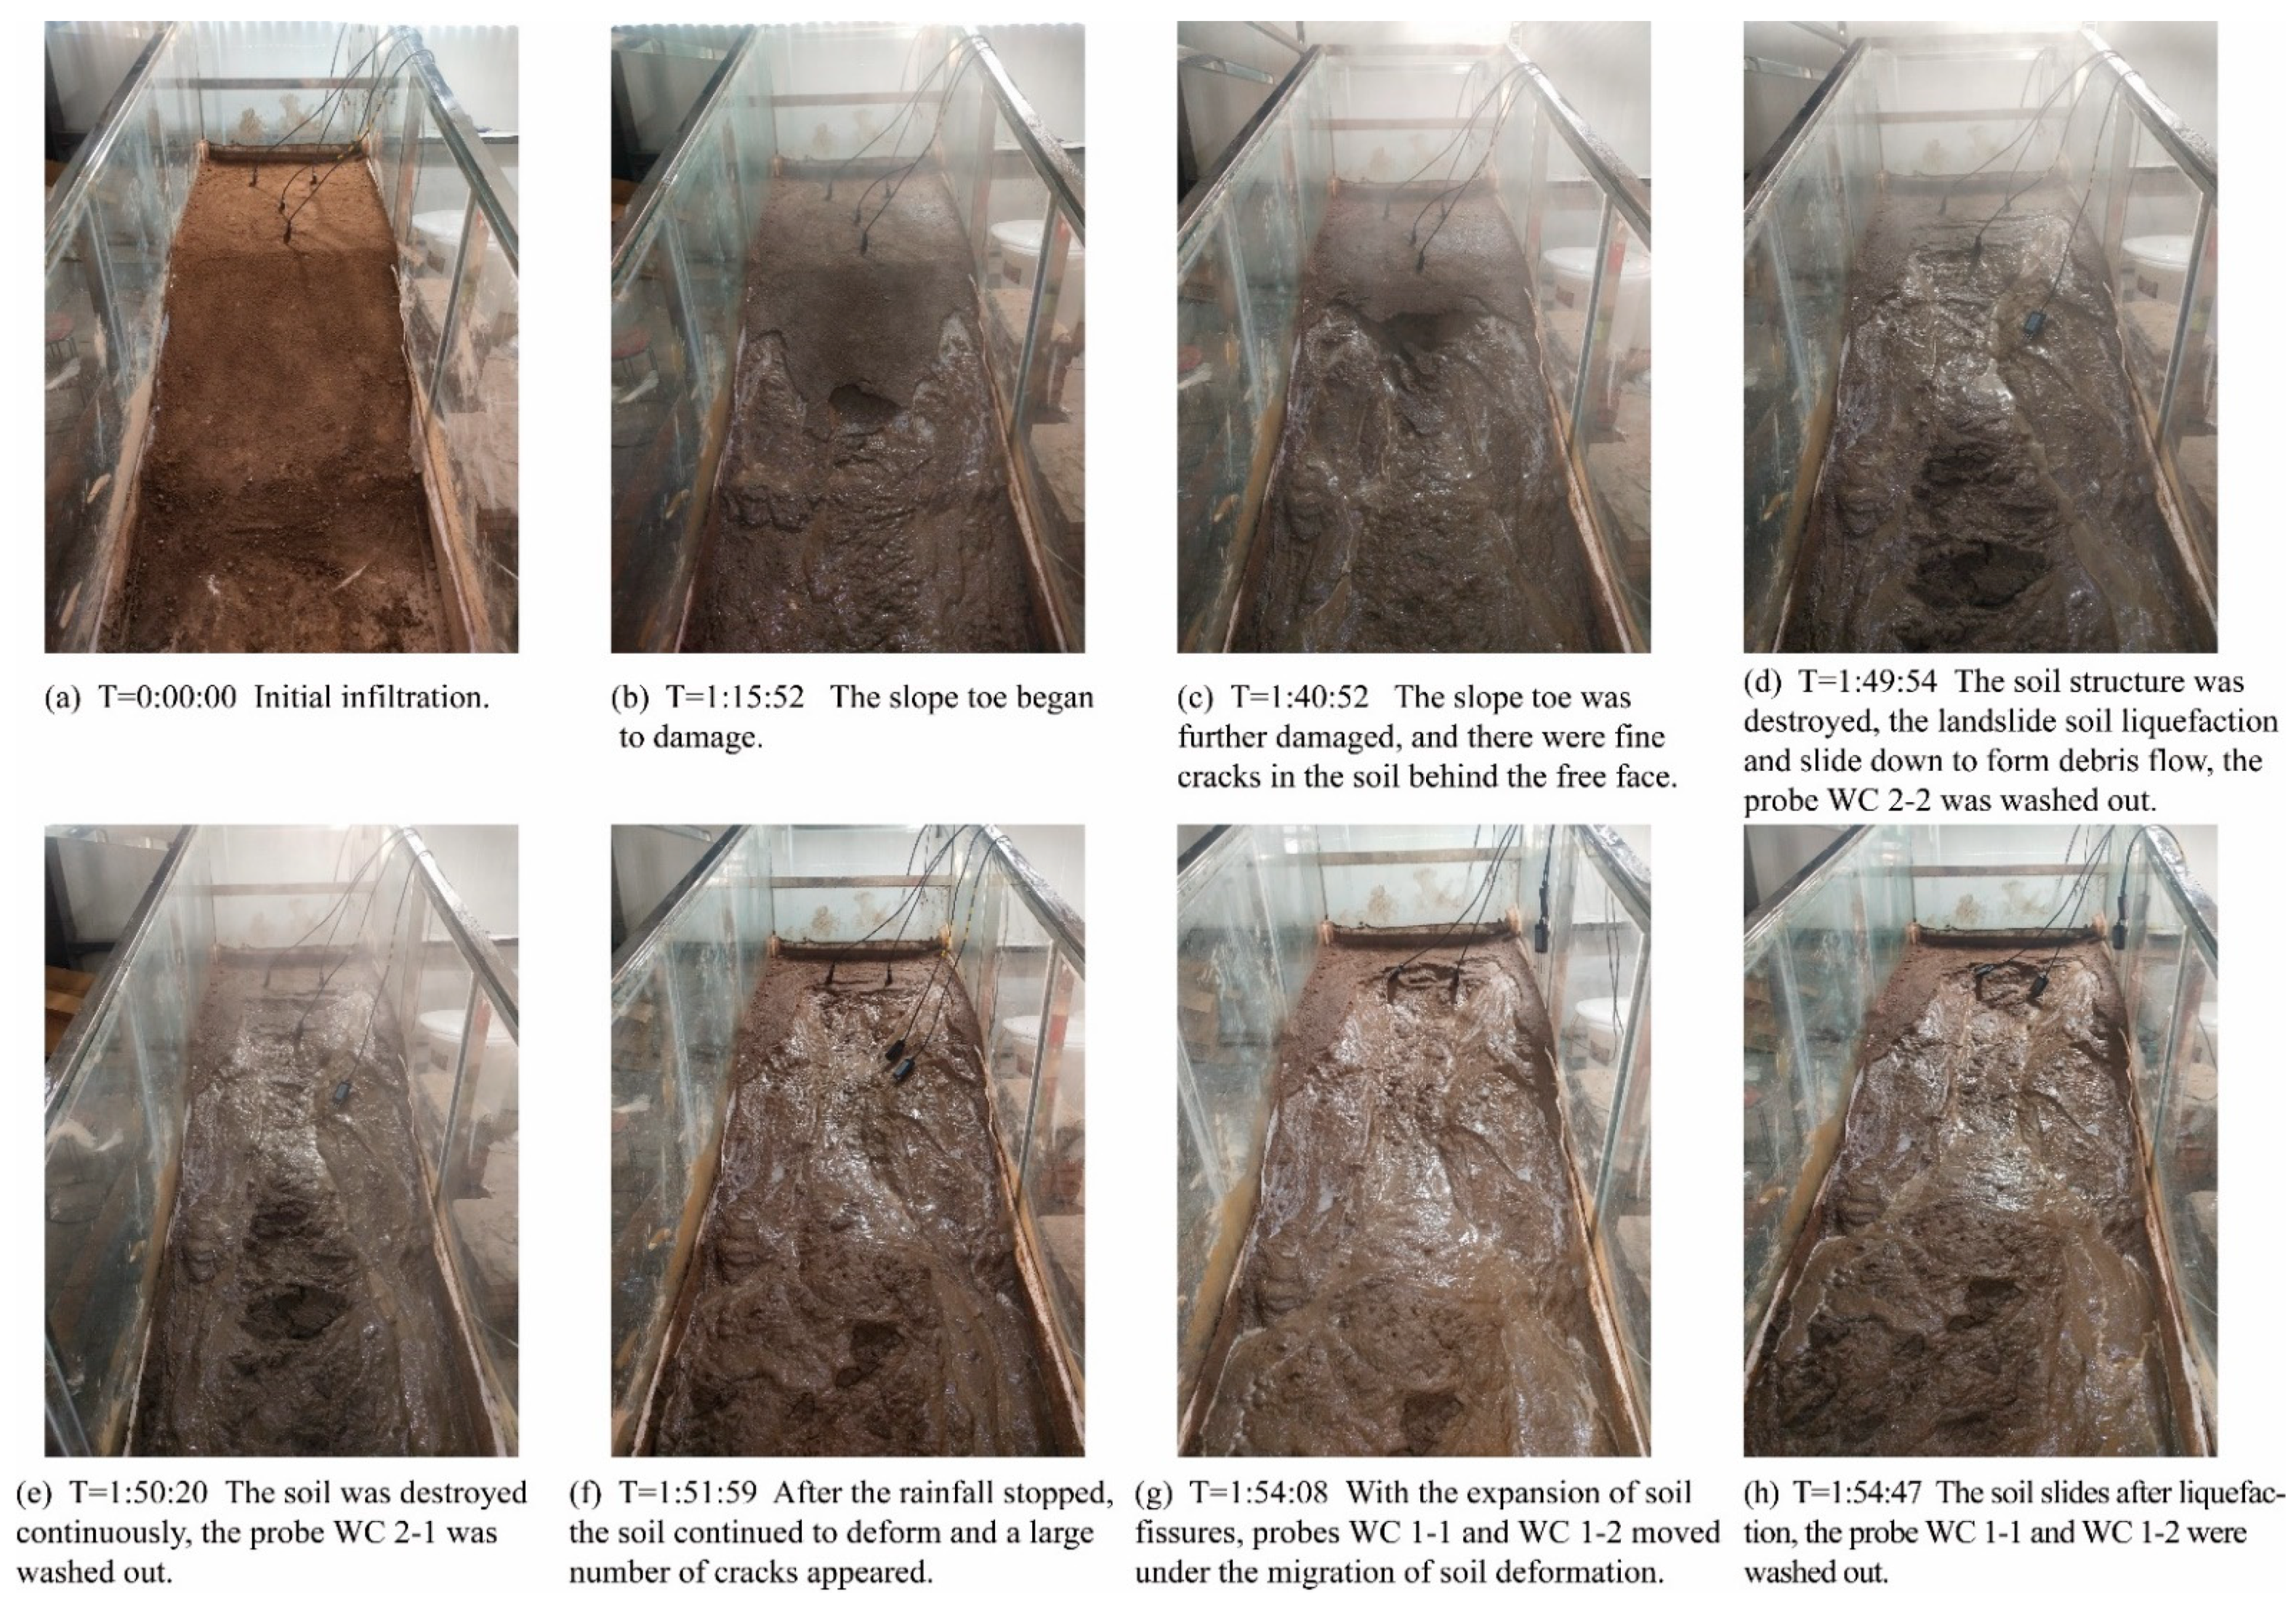
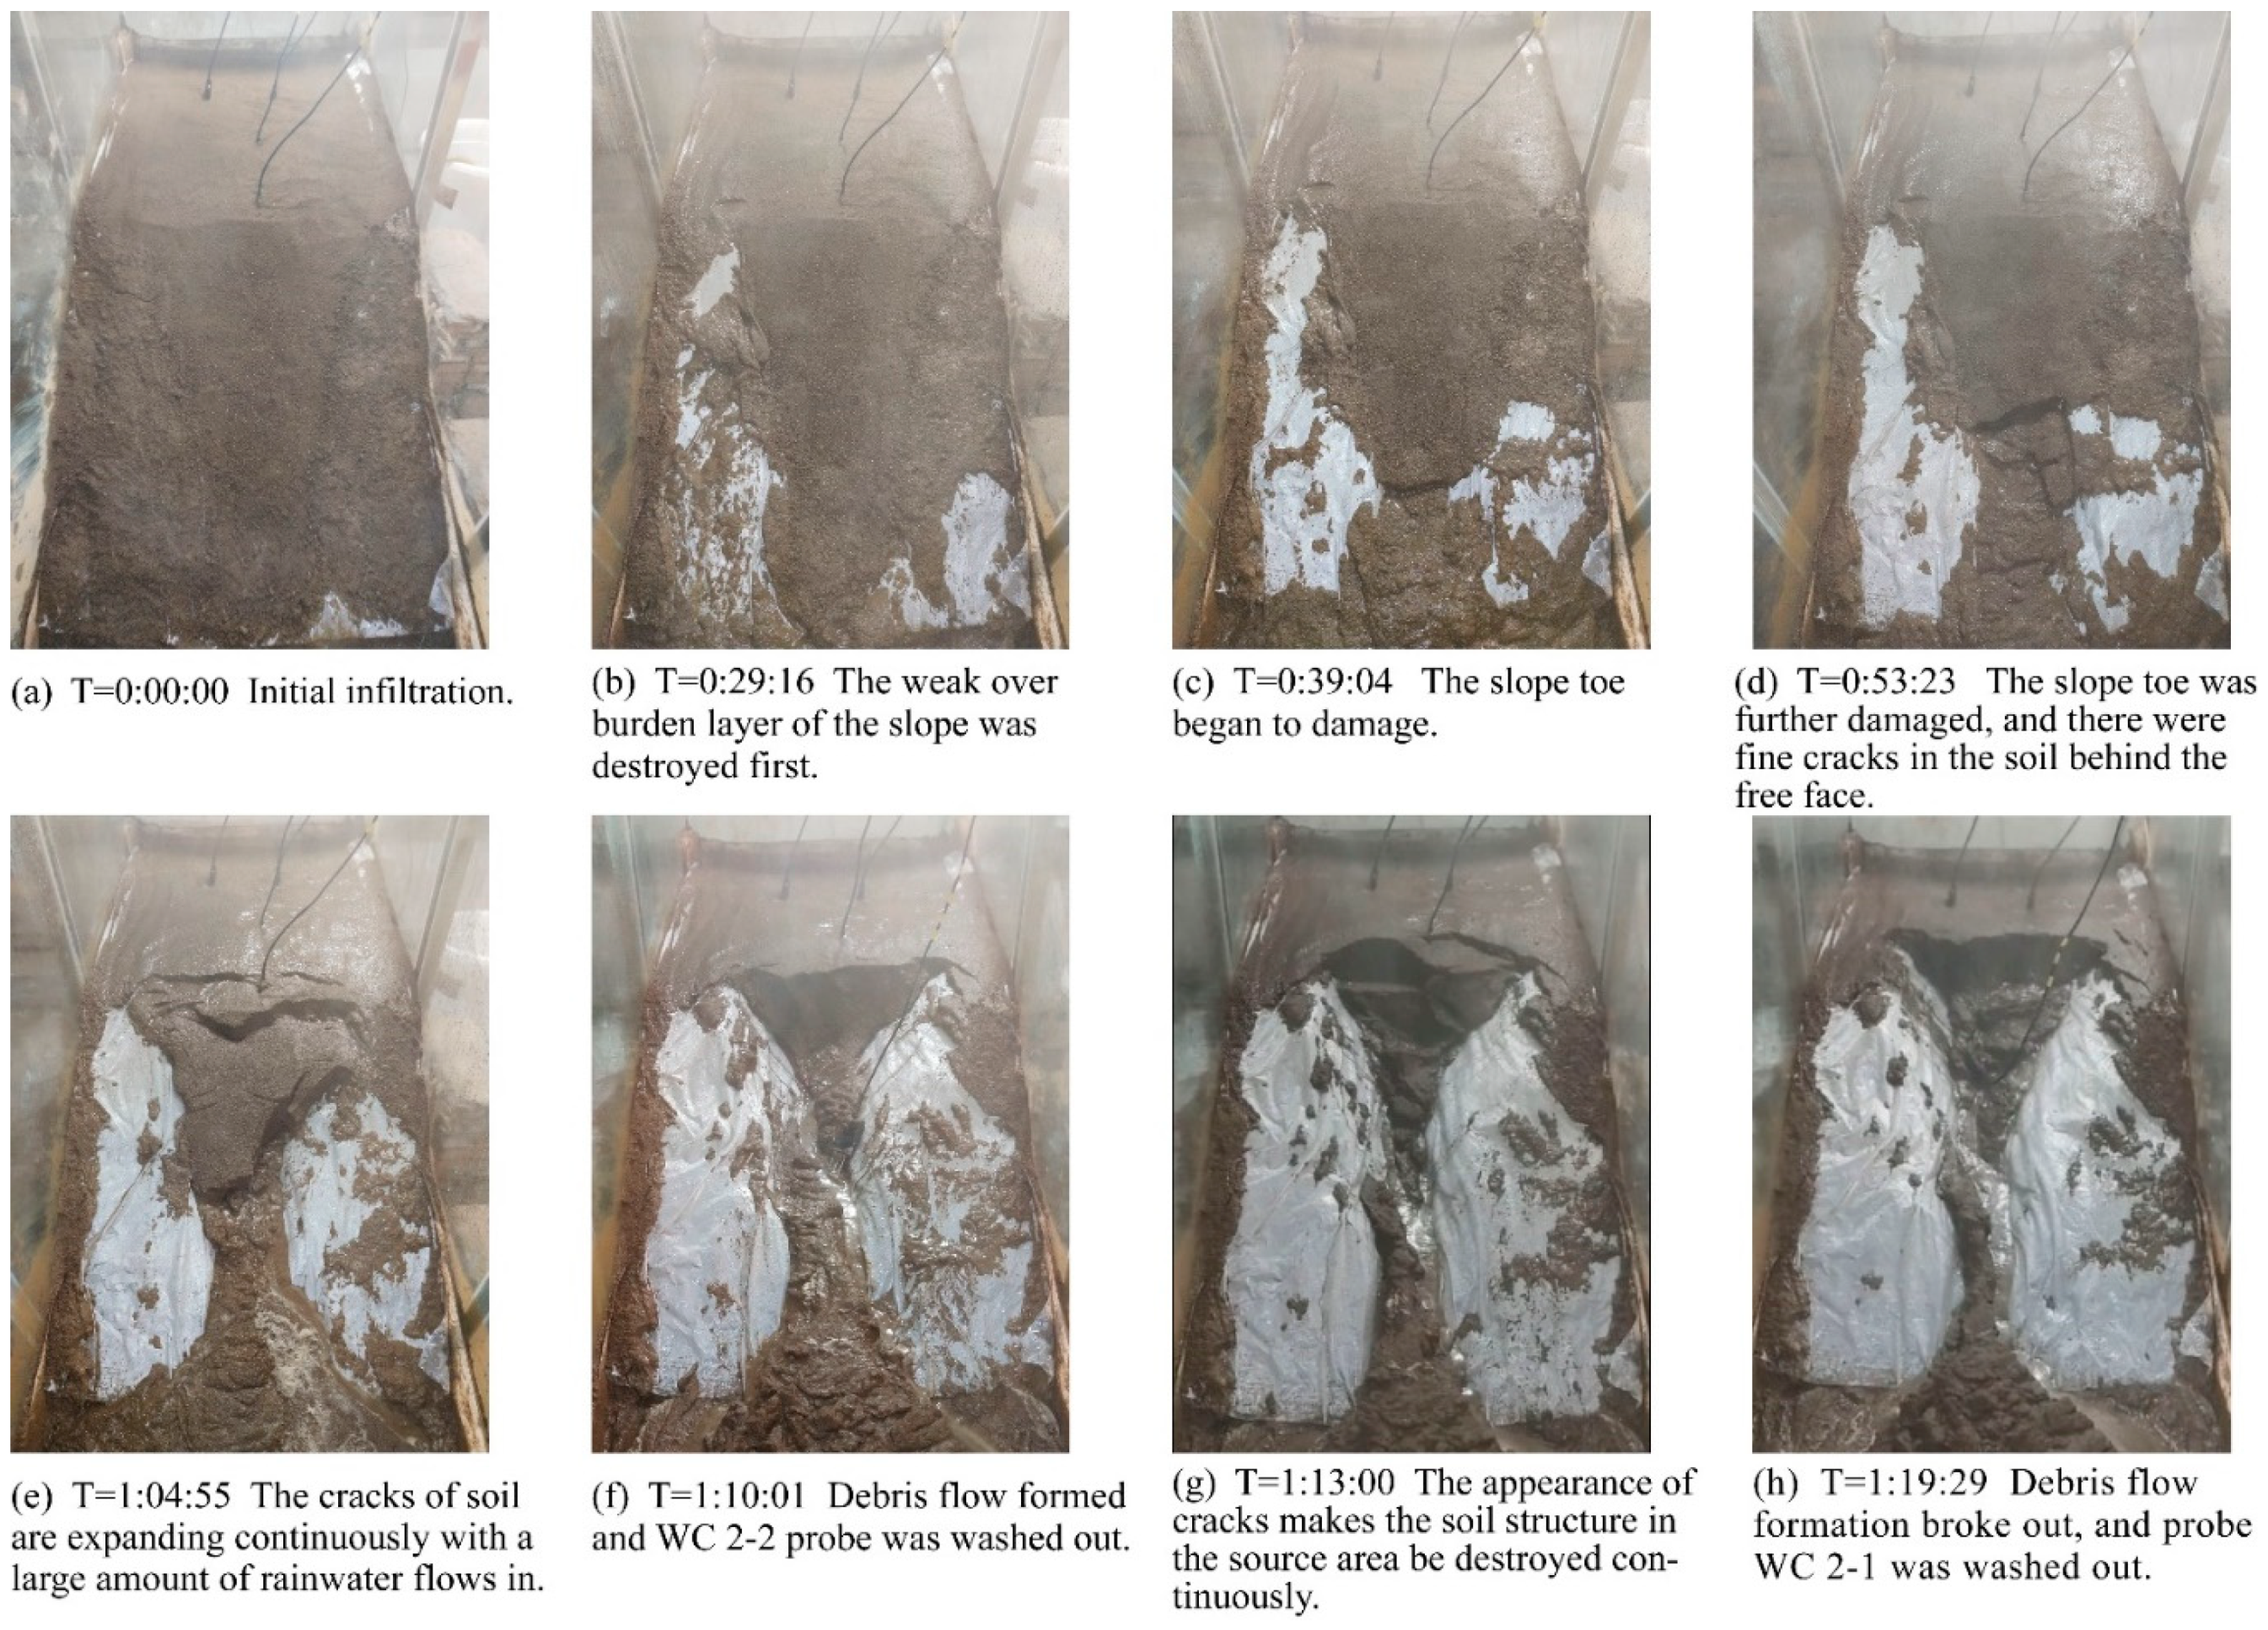
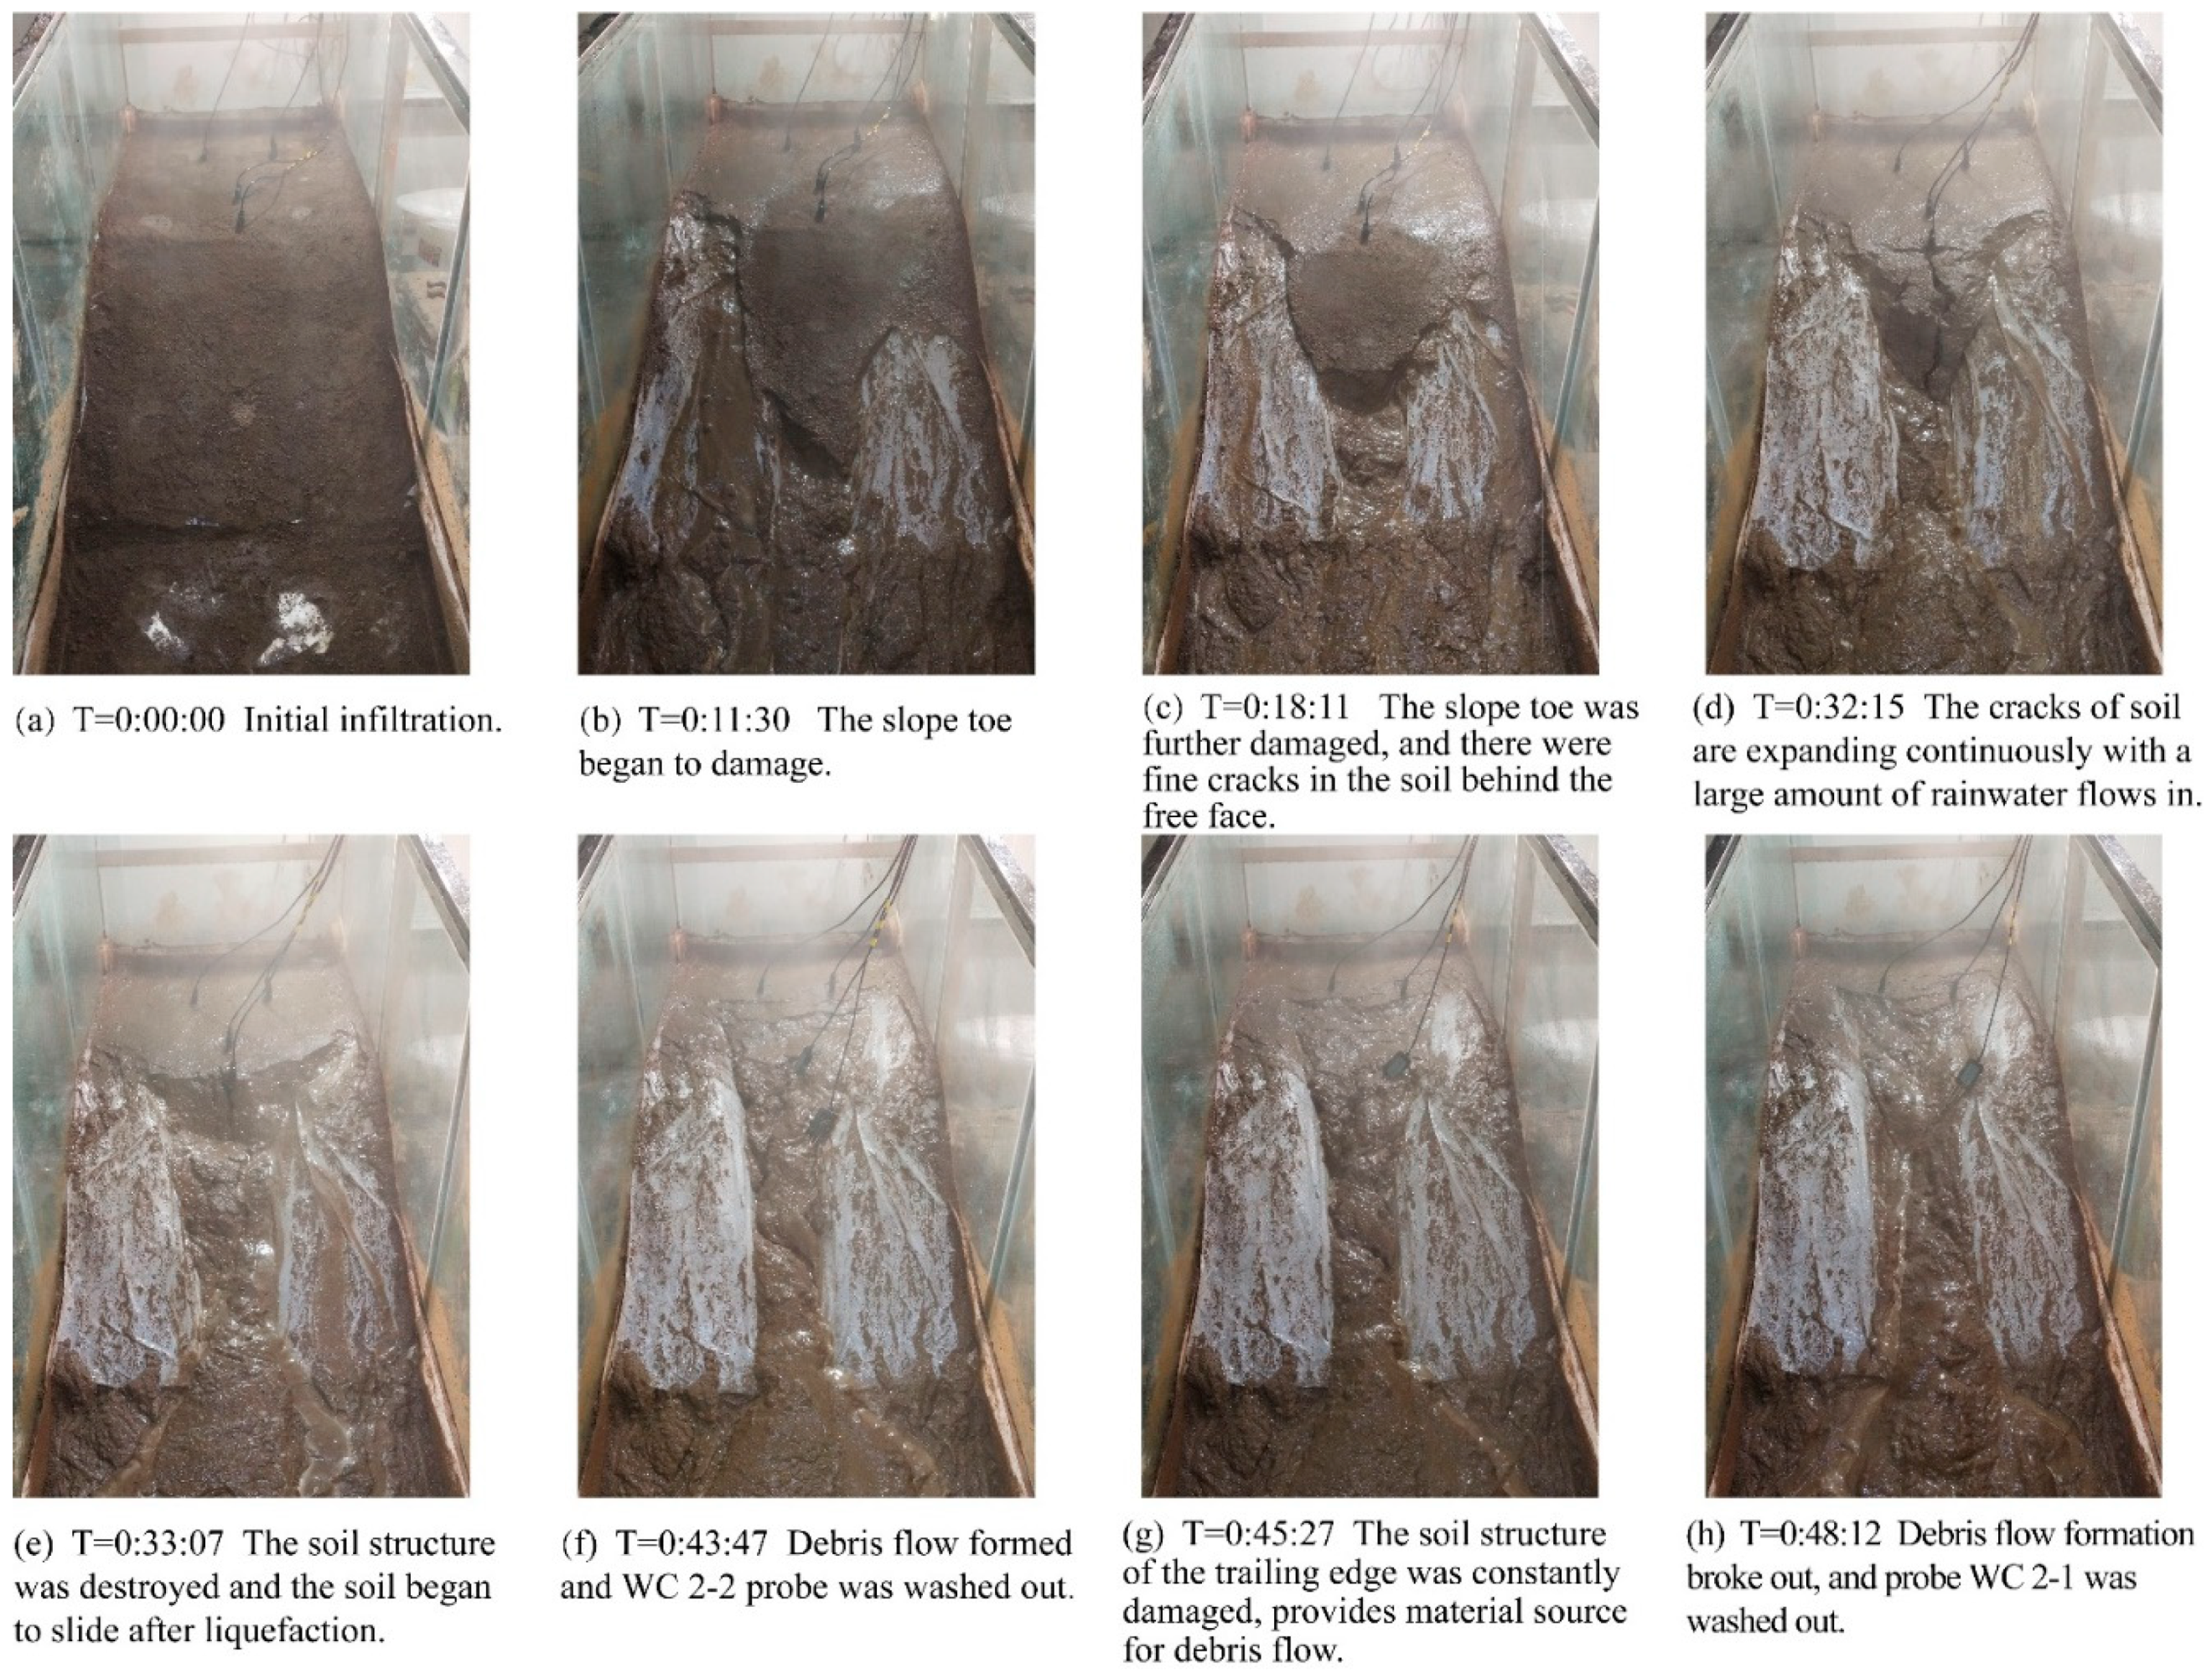
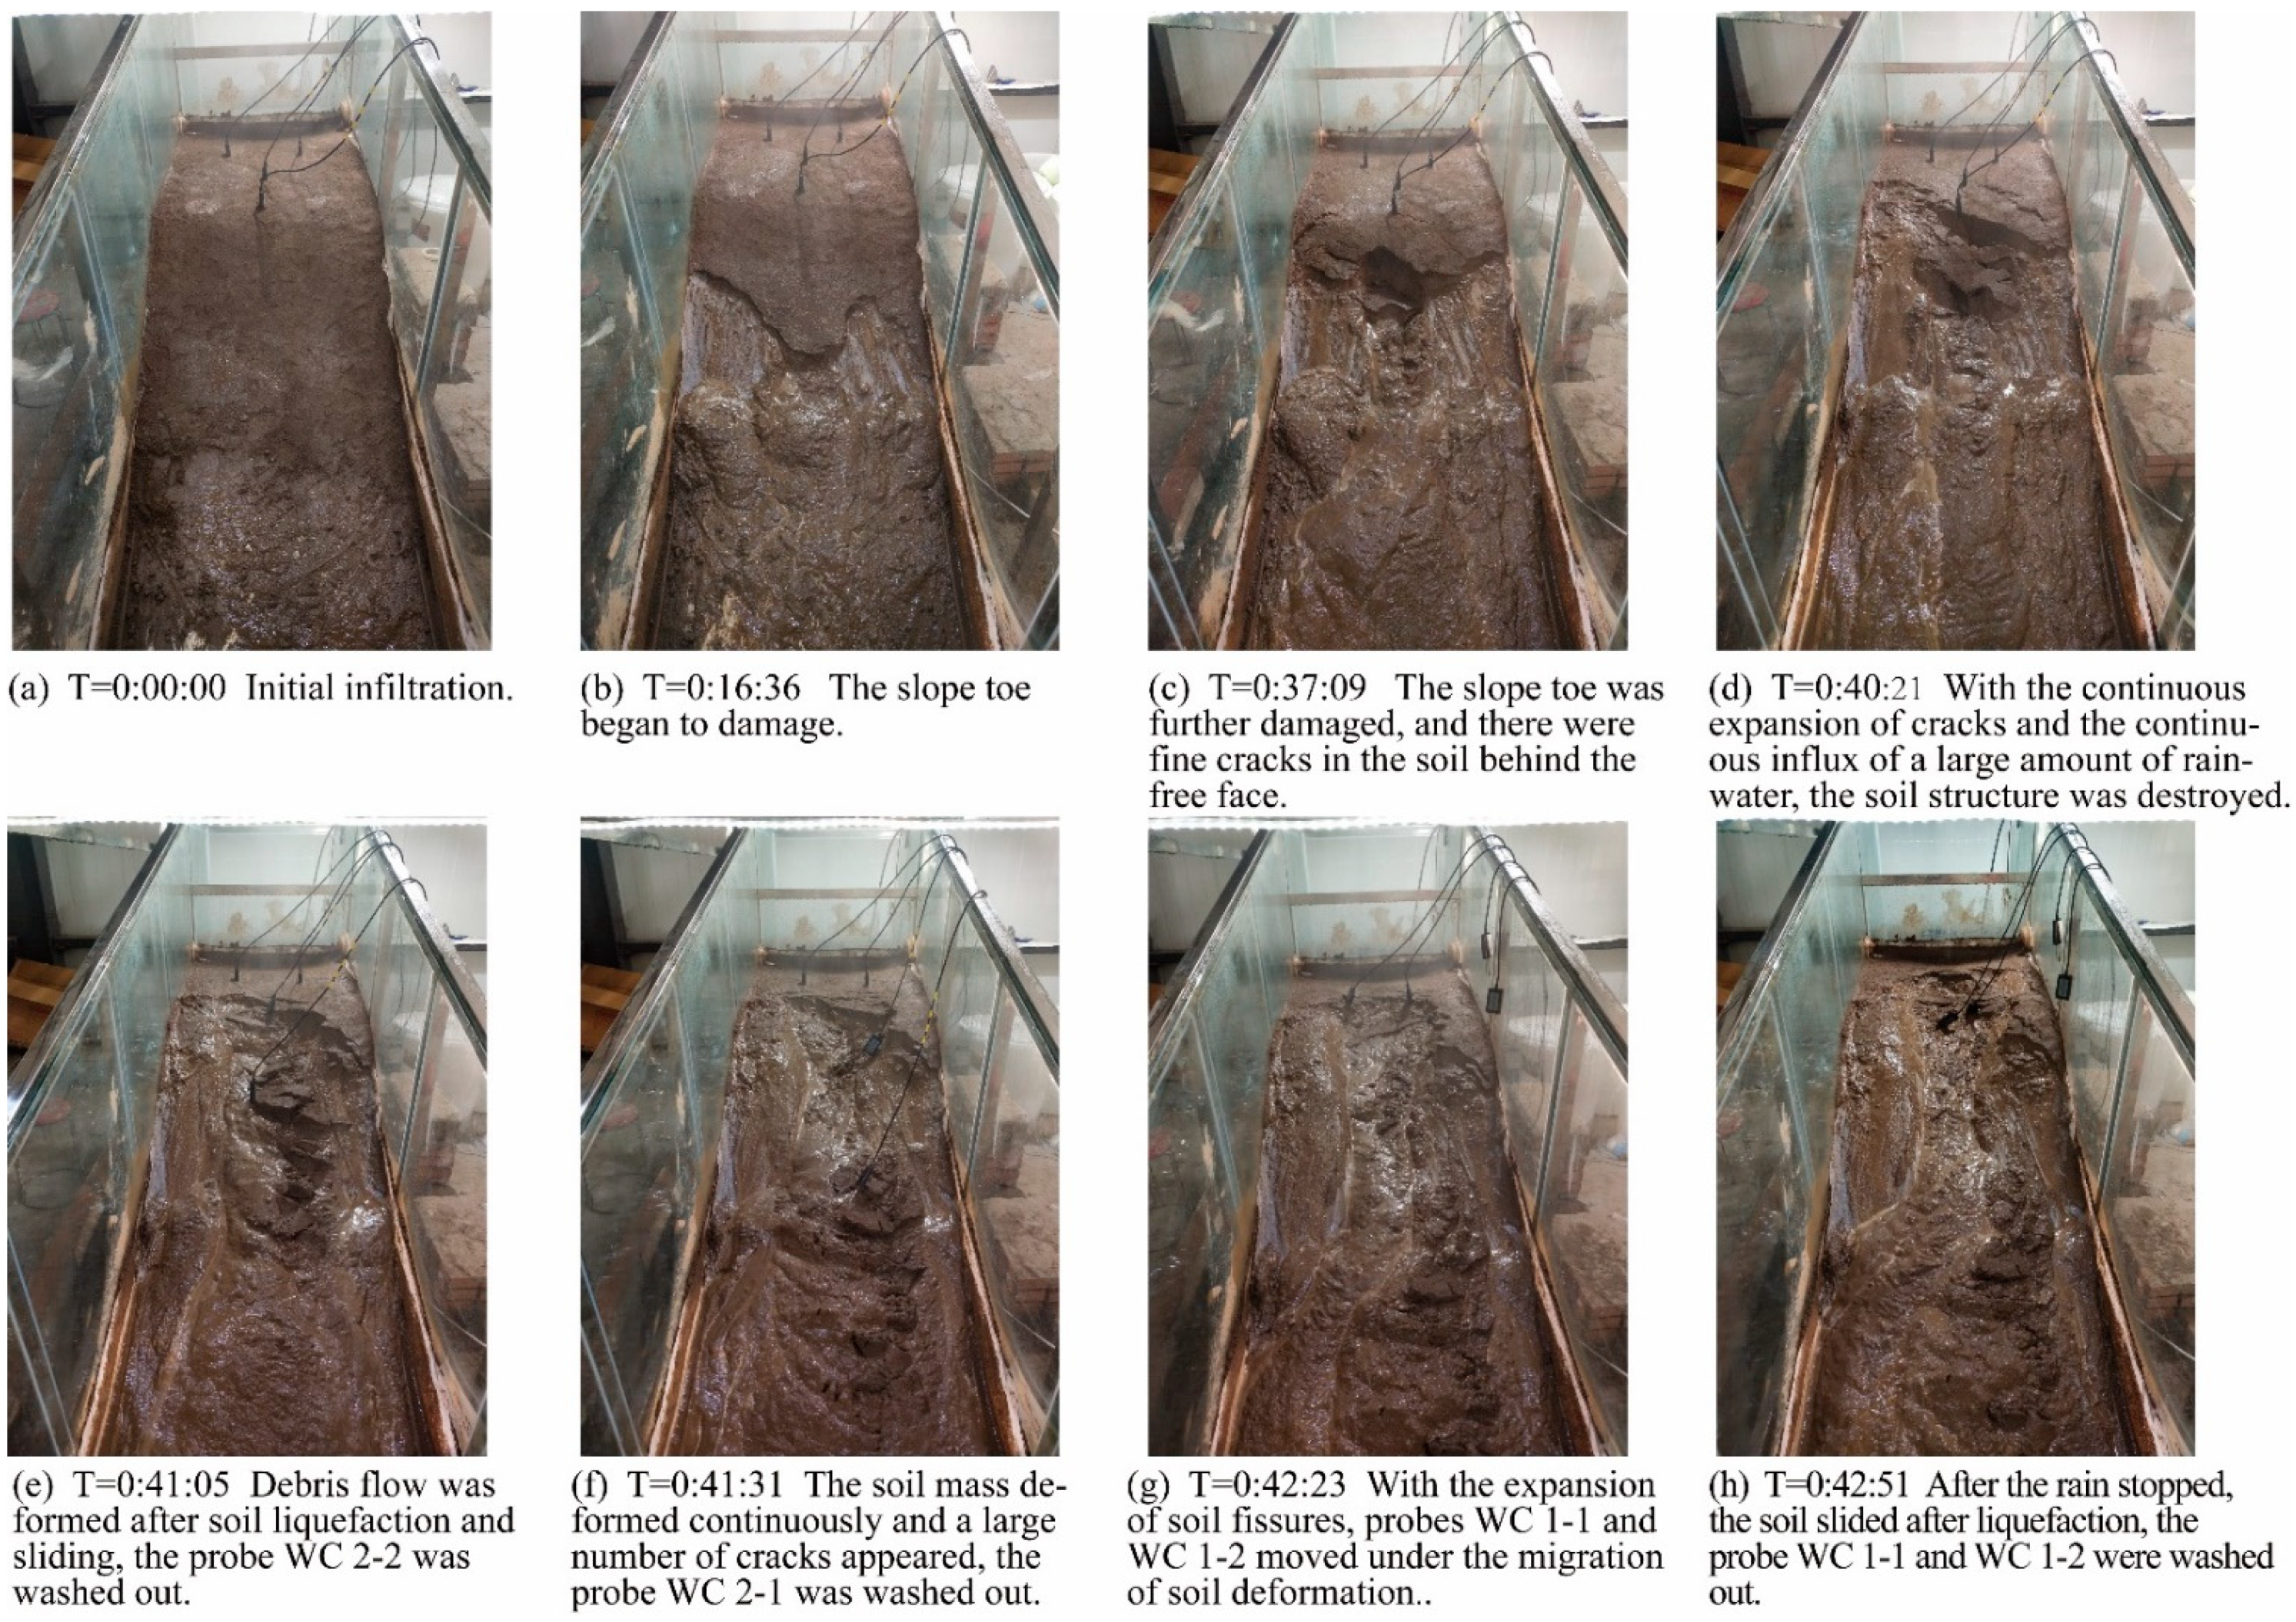
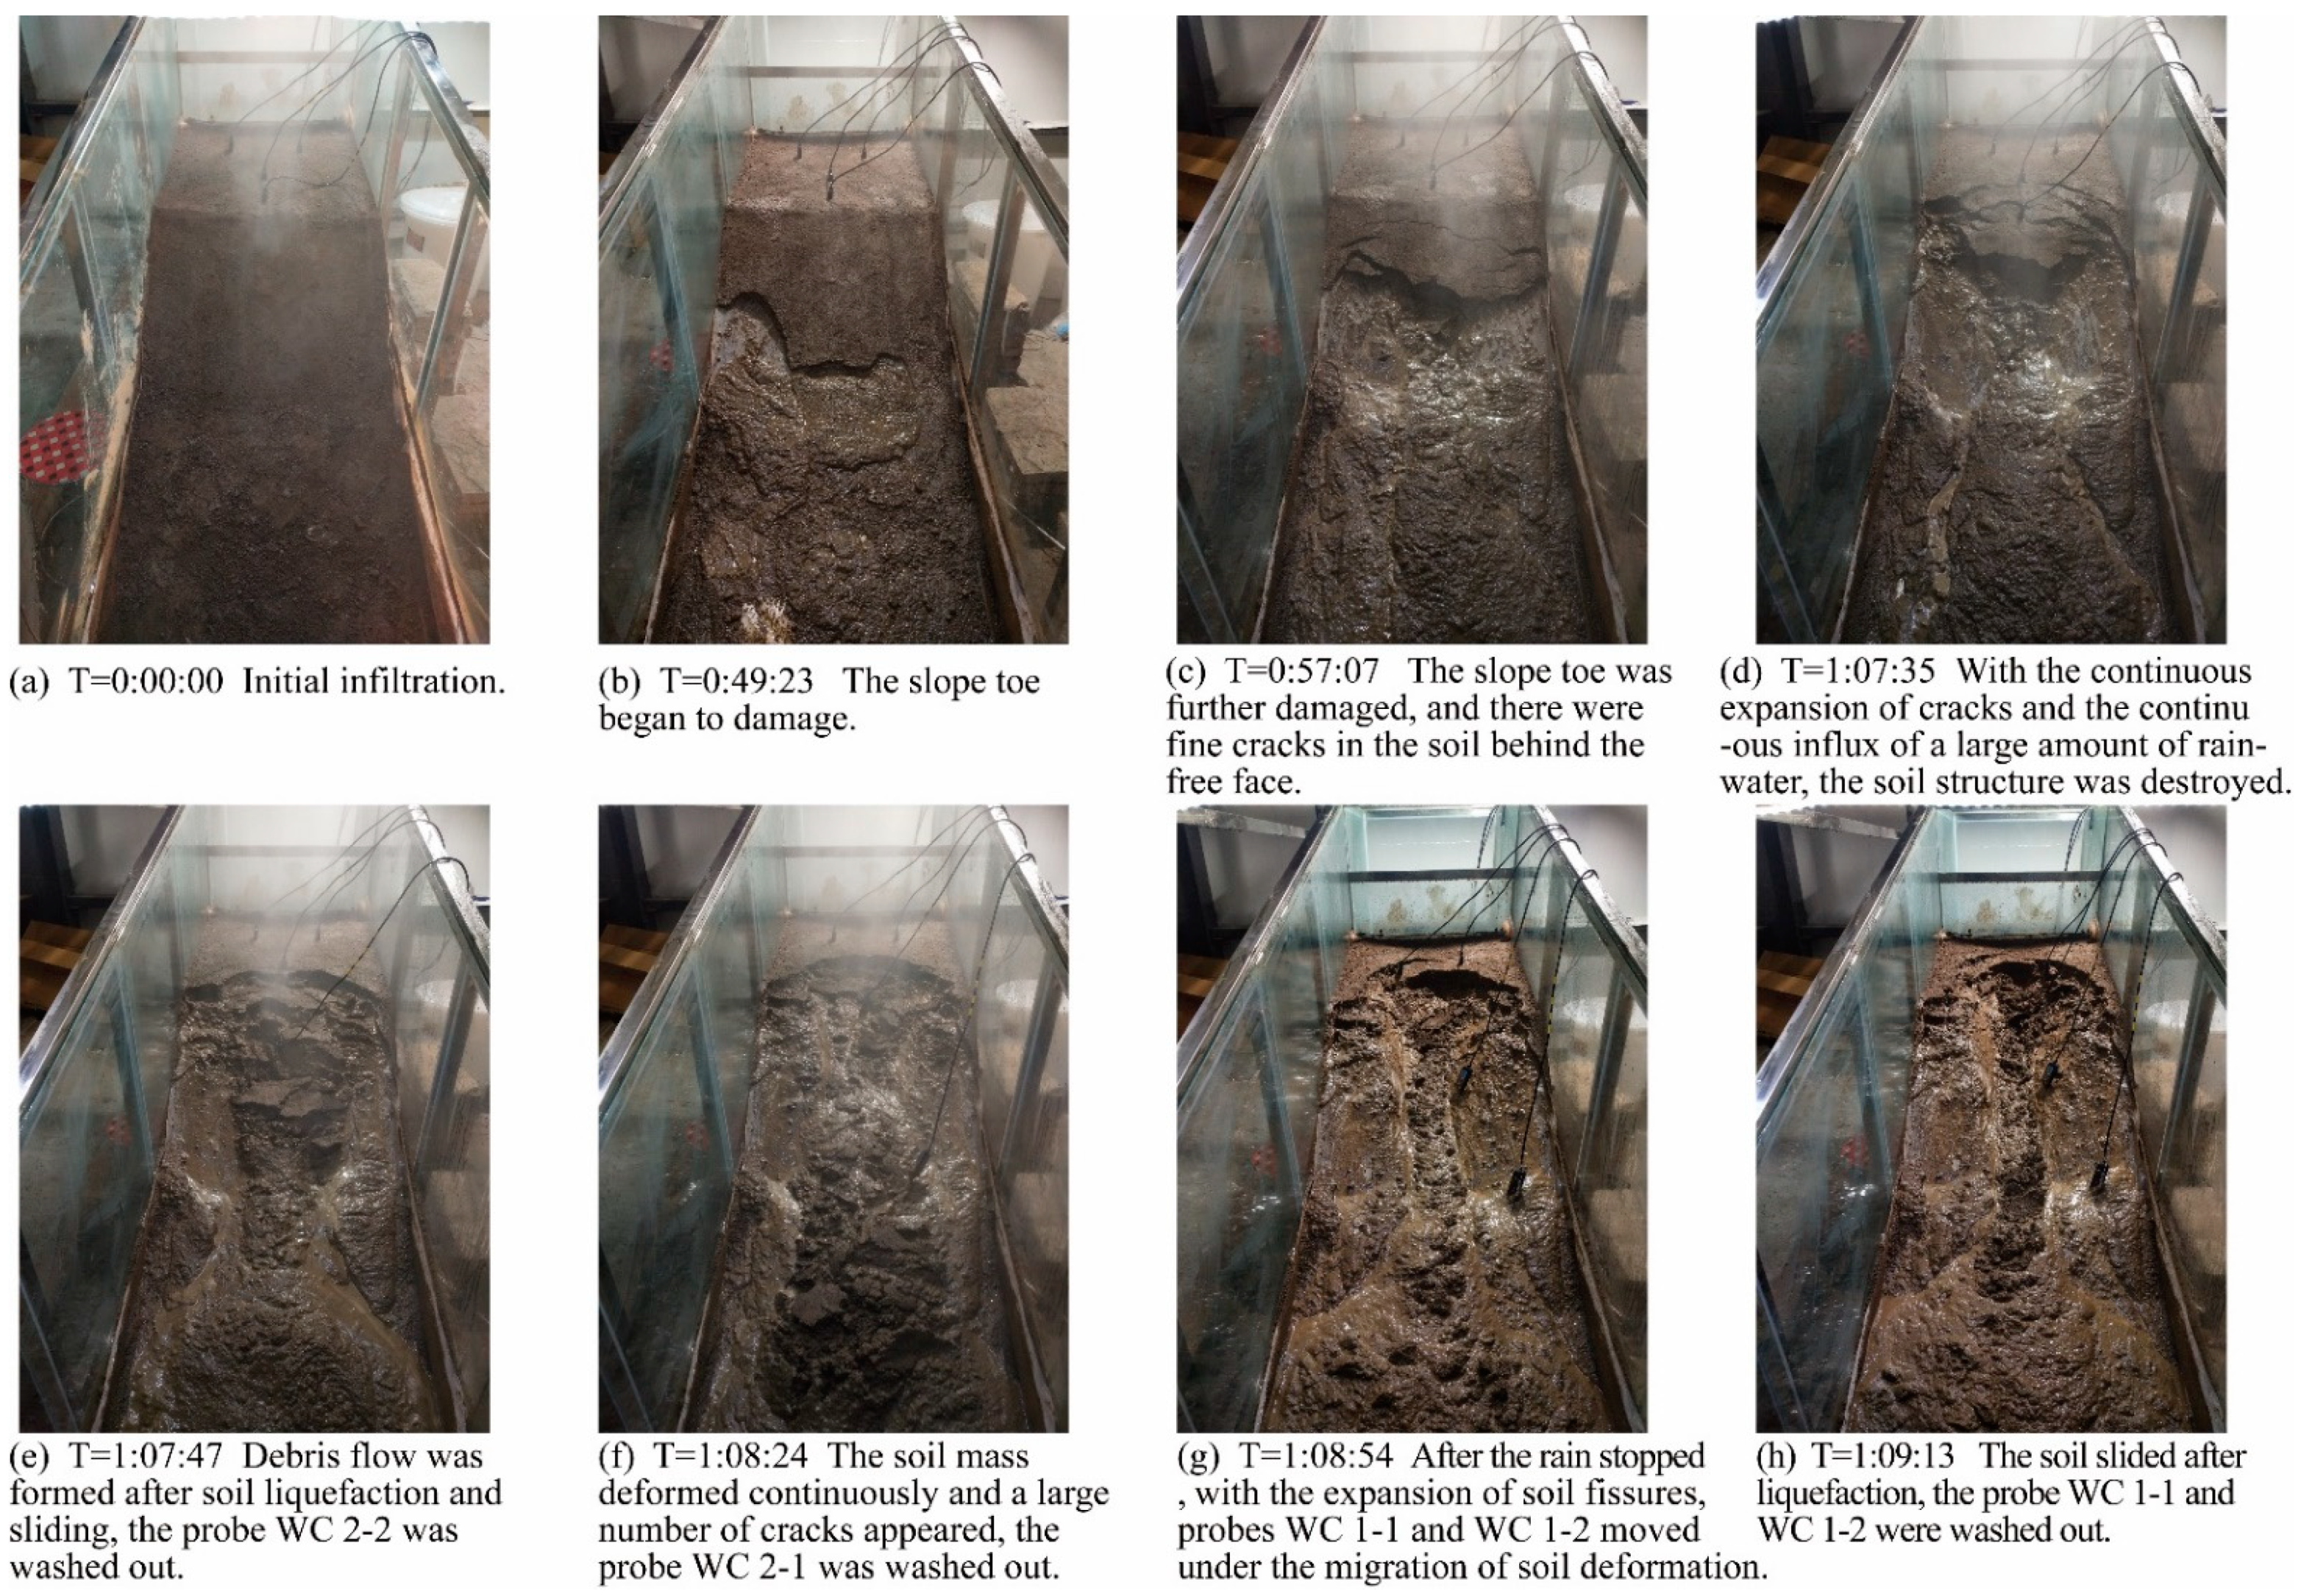
3.2.1. Characteristics of Material Source Damage under Different Rainfall Conditions

The characteristics of physical damage under heavy rainfall (24.58 mm/h) are shown in Figure 9. T = 0:00:00: At the initial infiltration stage, the artificial rainfall device was started to apply rainfall, and rainwater began to infiltrate. The soil surface fine particles were continuously washed and had a downward migration, and turbid water can be seen at the foot of the slope accumulation area; T = 1:15:52. Due to the impermeability of the bottom of the tank, with the continuous infiltration of rainwater, the water content of the soil volume at the bottom of the slope gradually increases and approaches saturation, resulting in a certain height of free water head, coupled with the traction and dragging effect of the bottom laminar flow made the shear strength of the soil at the bottom of the slope less than the shear force, thus causing instability at the foot of the slope. T = 1:40:52: Further destruction of the foot of the slope occurred, and the foot of the slope was destabilized and a slight sliding occurred downward along the bottom of the trough, causing fine cracks to appear and expand in the soil behind the free face. T = 1:49:54: With the continuous influx of rainwater into the fissure, the soil was subjected to the traction effect of the downward seepage of water in the fissure on the back side, the extrusion effect of water self-weight in the fissure and its self-weight; the soil structure was damaged and an avalanche slide occurred. The soil after the avalanche slide then rapidly liquefied and slid down, forming a debris flow and accelerating the slide, and the probe WC 2-2 was washed out. T = 1:50:20: The soil was destroyed continuously, the probe WC 2-1 was washed out. T = 1:51:59: Continued deformation of the soil after the cessation of rainfall accompanied by the appearance of numerous cracks at the trailing edge. T = 1:54:08: Soil fractures continuously expanded and probes WC 1-1 and WC 1-2 were displaced by the migration of soil deformation. T = 1:54:47: The deformed soil liquefied and then slipped, and the probes WC 1-1 and WC 1-2 were flushed out.
The damage characteristics of the material source under the ZJCG and extraordinary rainstorm (77.65 mm/h) are shown in Figure 10. The damage pattern of the source under the extraordinary rainstorm condition was similar to that under the heavy rainstorm condition. The difference was that the soil structure did not continue to be damaged after the rainfall stopped.
The characteristics of the physical damage under the conditions of rare extraordinary rainstorm (109.15 mm/h) were as shown in Figure 11: Initial infiltration stage—preliminary creep stage—emergence of raindrop spattering and surface runoff erosion phenomenon—formation and initiation of debris flow. The difference between the physical source damage pattern under extraordinary rainstorm conditions and the physical source damage pattern under extraordinary rainstorm and heavy rainstorm conditions was obvious raindrop splash erosion, the appearance of obvious surface runoff erosion, and a shorter initiation duration.

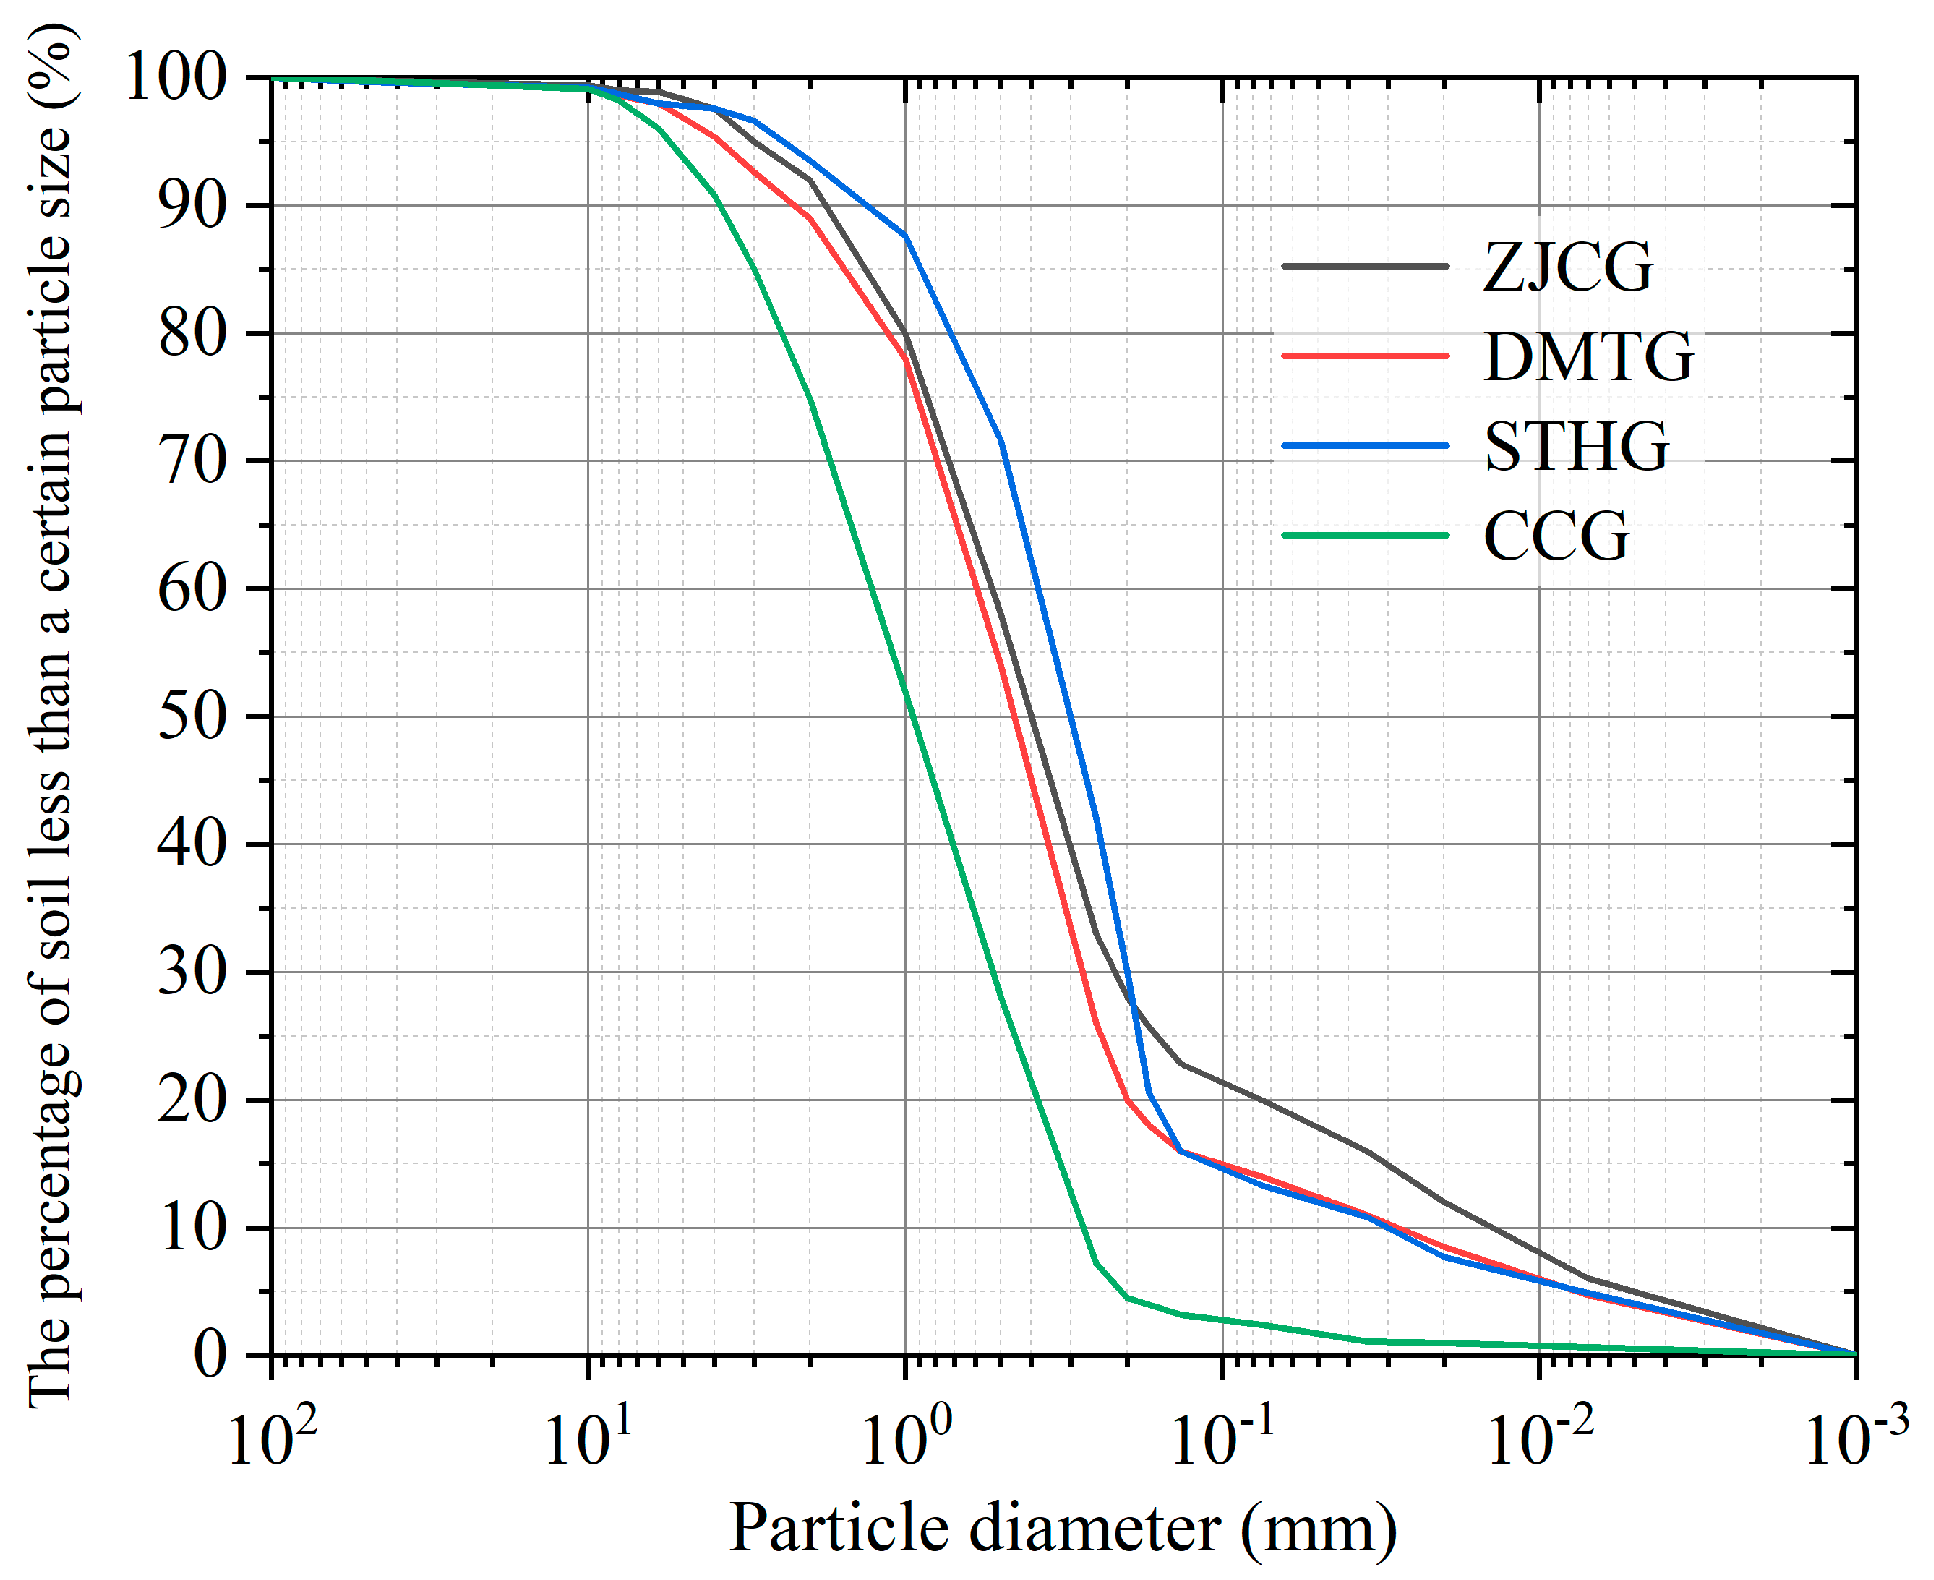
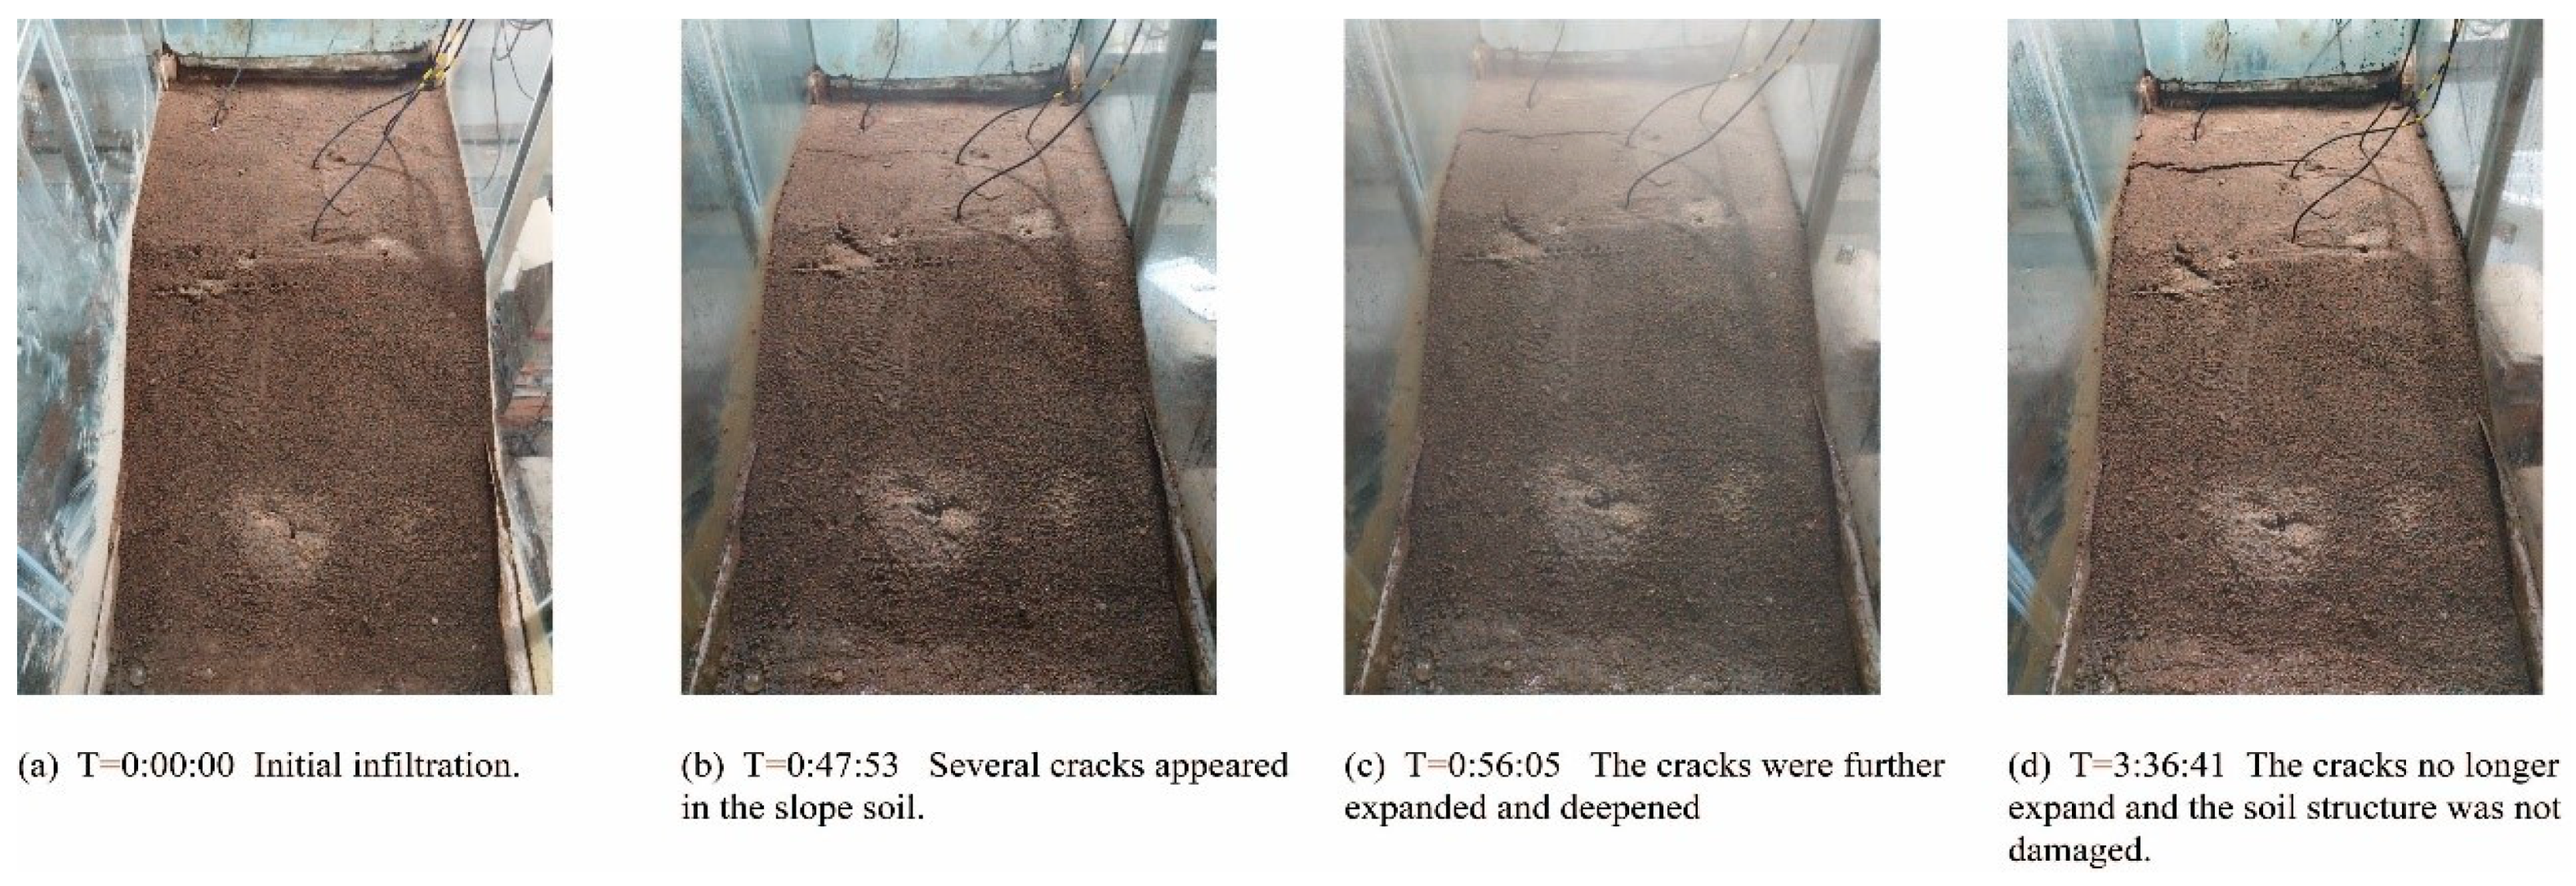
3.2.2. Material Source Destabilization Damage under Different Grading Conditions

The damage characteristics of the material source under the ZJCG condition and extraordinary rainstorm (77.65 mm/h) are shown in Figure 10. T = 0:00:00: At the initial infiltration stage, the artificial rainfall device started to apply rainfall, and rainwater began to infiltrate. The fine particles on the soil surface were continuously scoured and migrated downward, and muddy water could be observed at the accumulation area at the slope toe. T = 0:29:16: The weak cover layer of the slope was the first to be damaged. T = 0:39:04: Owing to the impermeability of the tank bottom, with the continuous infiltration of rainwater, the volumetric moisture content of the soil at the slope bottom gradually increased and approached saturation, resulting in a certain height of free water head, coupled with the traction and dragging effect of the bottom laminar flow. As a result, the shear strength of the soil at the slope bottom was less than the shear force, causing the instability of the slope toe. T = 0:53:23: The slope toe was further damaged, and the damage appeared on the critical surface. The slope body slid slightly downward along the channel bottom, leading to minimal cracks behind the critical surface. T = 1:04:55: The minimal cracks kept expanding, and a large amount of rainwater kept pouring into the cracks. T = 1:10:01: The soil was subjected to the traction effect of water seepage downward in the cracks on the back side, the extrusion effect of water self-weight in the cracks and its self-weight, and the soil structural damage. An avalanche slip occurred. The soil after the avalanche slide then rapidly liquefied and slid down, forming a debris flow, and accelerated the slide. The probe WC 2-2 was washed out. T = 1:13:00: Cracks kept appearing in the source area, and the soil structure was continuously damaged. T = 1:19:29: The debris flow formation broke out, the deformed soil liquefied and slid down, and the probe WC 2-1 was washed out. The damage pattern of the source under the extraordinary rainstorm condition was similar to that under the heavy rainstorm condition. The difference was that the soil structure did not continue to be damaged after the rainfall stopped.
The damage characteristics of the DMTG under an extraordinary rainstorm (77.65 mm/h) is shown in Figure 12. The difference with the experimental phenomenon under ZJCG condition was that the soil under DMTG condition was crumbling and sliding in small pieces, the initiation duration of the material source was shorter, and the soil continued to be deformed and damaged after the rainfall stopped.
The damage characteristics of the STHG condition under an extraordinary rainstorm (77.65 mm/h) is shown in Figure 13. The difference with the experimental phenomenon under the ZJCG condition was that the soil under the STHG condition was crumbling and sliding in large pieces and disintegrated into small pieces during the sliding process, the initiation duration of the material source was shorter, and the soil continued to deform and destroy after the rainfall stopped; the difference with the experimental phenomenon under the DMTG condition was that the soil under the STHG condition was crumbling and sliding in large pieces and disintegrated into small pieces during the sliding process, and the initiation duration of the material source was longer.
The experimental phenomenon of the CCG condition destruction under an extraordinary rainstorm (77.65 mm/h) is shown in Figure 14. T = 0:00:00: In the initial infiltration stage, the artificial rainfall device was activated to apply rainfall, the surface of the soil was wet and infiltrated continuously at the beginning of rainfall, and the infiltration rate of rainwater was rapid. The side of the object source box can be observed that the soil infiltration line continuously extends downward. T = 0:47:53: As the rainfall continues, the water content in the deep part of the soil gradually increased until it was close to saturation, and the soil as a whole slid slightly downward along the bottom of the trough, making a small amount of cracks appear above the slope, and turbid water flow was visible at the toe of the slope. The infiltration rate of rainwater became slower, and surface runoff was formed on the surface of the source. T = 0:56:05: As the rainfall proceeds, the cracks above the broken body expand continuously to form penetrating cracks and deepen continuously. After the washing of rain and surface runoff continuously took away part of the fine particles on the surface of the slope body, the coarse-grained soil skeleton was formed on the surface, and the water flow at the foot of the slope gradually cleared. After the rainfall lasted for about 4 h, the surface of the slope body was consistently undamaged. The difference with the experimental phenomenon under the ZJCG, DMTG and STHG condition was that the permeability of the source body was strong under the CCG condition, no damage occurred at the foot of the slope under the condition of cracks in the slope body, and the skeleton of soil particles was not damaged.

3.3. Experimental Results and Analysis

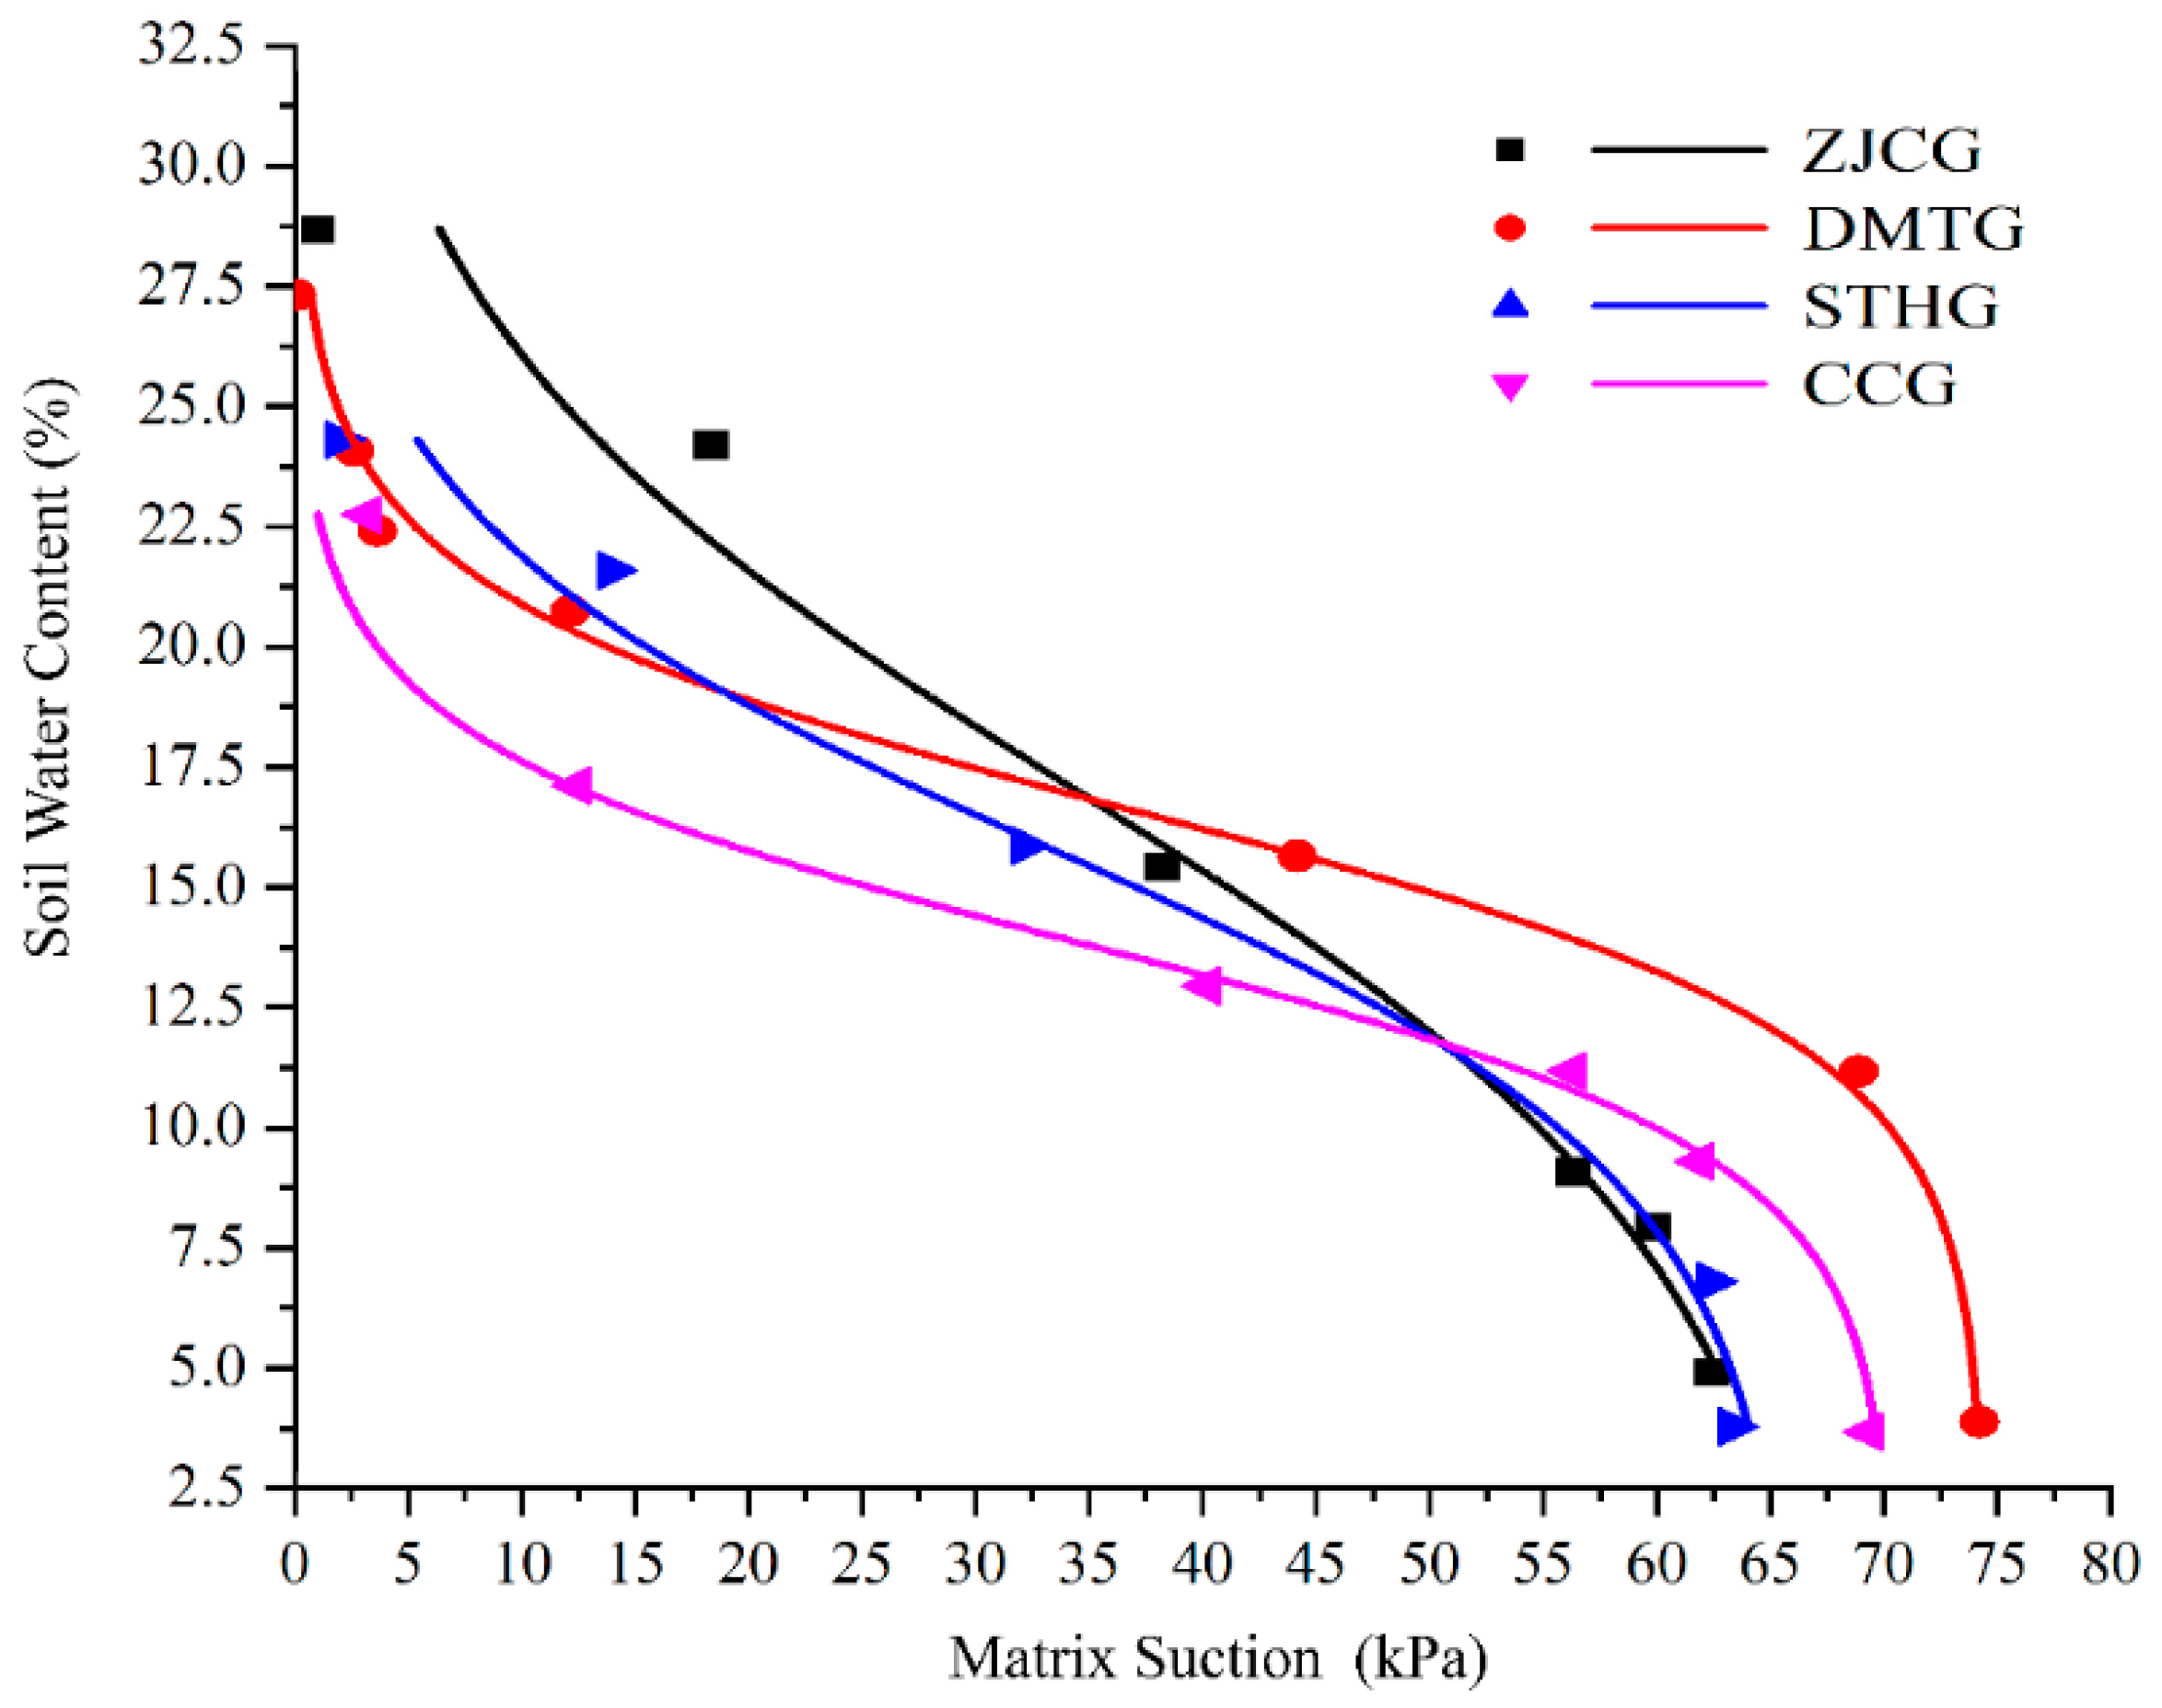
3.3.1. Response of Material Source Destruction and Matrix Suction Change

The water tank test revealed that before the rainfall, the experimental soil was in a non-saturated state, the shear strength of the soil was relatively high due to the matrix suction, and the slope was in a stable state. With the infiltration of rainfall, on the one hand, the initial water level of the soil kept increasing, leading to a gradual increase in shear strength; on the other hand, the infiltration of rainwater led to the continuous saturation of the soil, and the matrix suction decreased. If the soil was completely saturated, the matrix suction decreased to 0. The water content rose during the infiltration of rainfall, resulting in a decrease in the shear strength of the soil. The strength provided by the matrix suction, which was relatively large at a low water content, with a maximum value close to 75 kPa, decreased when the water content increased. When the experimental statistical analysis method is used to seek the expression of soil-water characteristic curve (SWCC), the basic method is that the SWCC obtained from the test is fitted mathematically, and the relationship between the humidity index and matrix suction is established [41,42,43]; the results are shown in Figure 15.
The measured results were highly fitted using the Slogistic1 mathematical regression analysis method, and the SWCCs for each soil gradation were obtained as follows:
SWCC under ZJCG grading (R2 = 0.971):
S = 68.162 1 + e 0.204 M 17.659
SWCC under DMTG grading (R2 = 0.997):
S = 74.056 1 + e 0.448 M 17.168
SWCC under STHG grading (R2 = 0.984):
S = 65.739 1 + e 0.298 M 16.500
SWCC under CCG grading (R2 = 0.995):
S = 69.898 1 + e 0.486 M 14.494
where: S is the matrix suction (kPa); M is the water content (%).
Various researchers have proposed different expressions of SWCC. For expressions using water content as the humidity index, Gardner [42] used Equation (14), Van Genuchten [41] used Equation (15), and Fredlund and Xing [43] used Equation (16).
w = w s 1 + S a q
where: w is the water content; ws is the saturated water content; a, p, and m are test parameters.
S e = 1 + s α n m
where: Se is the effective degree of saturation; s is the matrix suction; α, n, and m are the fitting parameters reflecting the air entry value, the slope at the inflection point of SWCC, and the curvature of SWCC near the residual point, respectively.
w = C s w s ln e + s α p m
where: w is the water content; ws is the saturated water content; a, p, and m are test parameters.
Different researchers have diverse curve-fitting results, and the values of test parameters vary. Benson et al. [44] reported correlations between the fitting parameters of the Van Genuchten [41] model and the particle size distribution of soils. Parameters α and n are correlated, respectively, with the coefficient of uniformity, Cu = d60/d10, and the center of the particle size distribution, d50. Both parameters decrease with an increase in Cu. However, an increase in d50 leads to an increase in α and a decrease in n. Most of these expressions are suitable only for low and medium suction ranges. The equation proposed by Gardner [42] can better reflect the SWCC, and Equation (15) can fit different curves by changing parameters, which is suitable for all suction ranges. Although the results of this study have a high degree of curve fitting, the function form and parameters of the fitting equation are still different from the above equation. Consequently, the equation obtained in this study does not have universal applicability.
From the fitted SWCCs, the variation in substrate suction values is controlled by the variation in water content and soil particle gradation. Soil suction (S)—defined as the difference between pore air pressure (ua) and negative pore water pressure (uw)—in shallow deposits of unsaturated natural soils on steep hillslopes undergoes remarkable changes in space and time due to the variability of topography and stratigraphy in addition to seasonal soil–atmosphere interactions [45]. These changes must be carefully considered when dealing with slope stability conditions in the back analysis of past events and the forecasting of future events for susceptibility analysis [46] and engineering (e.g., design) purposes [47].

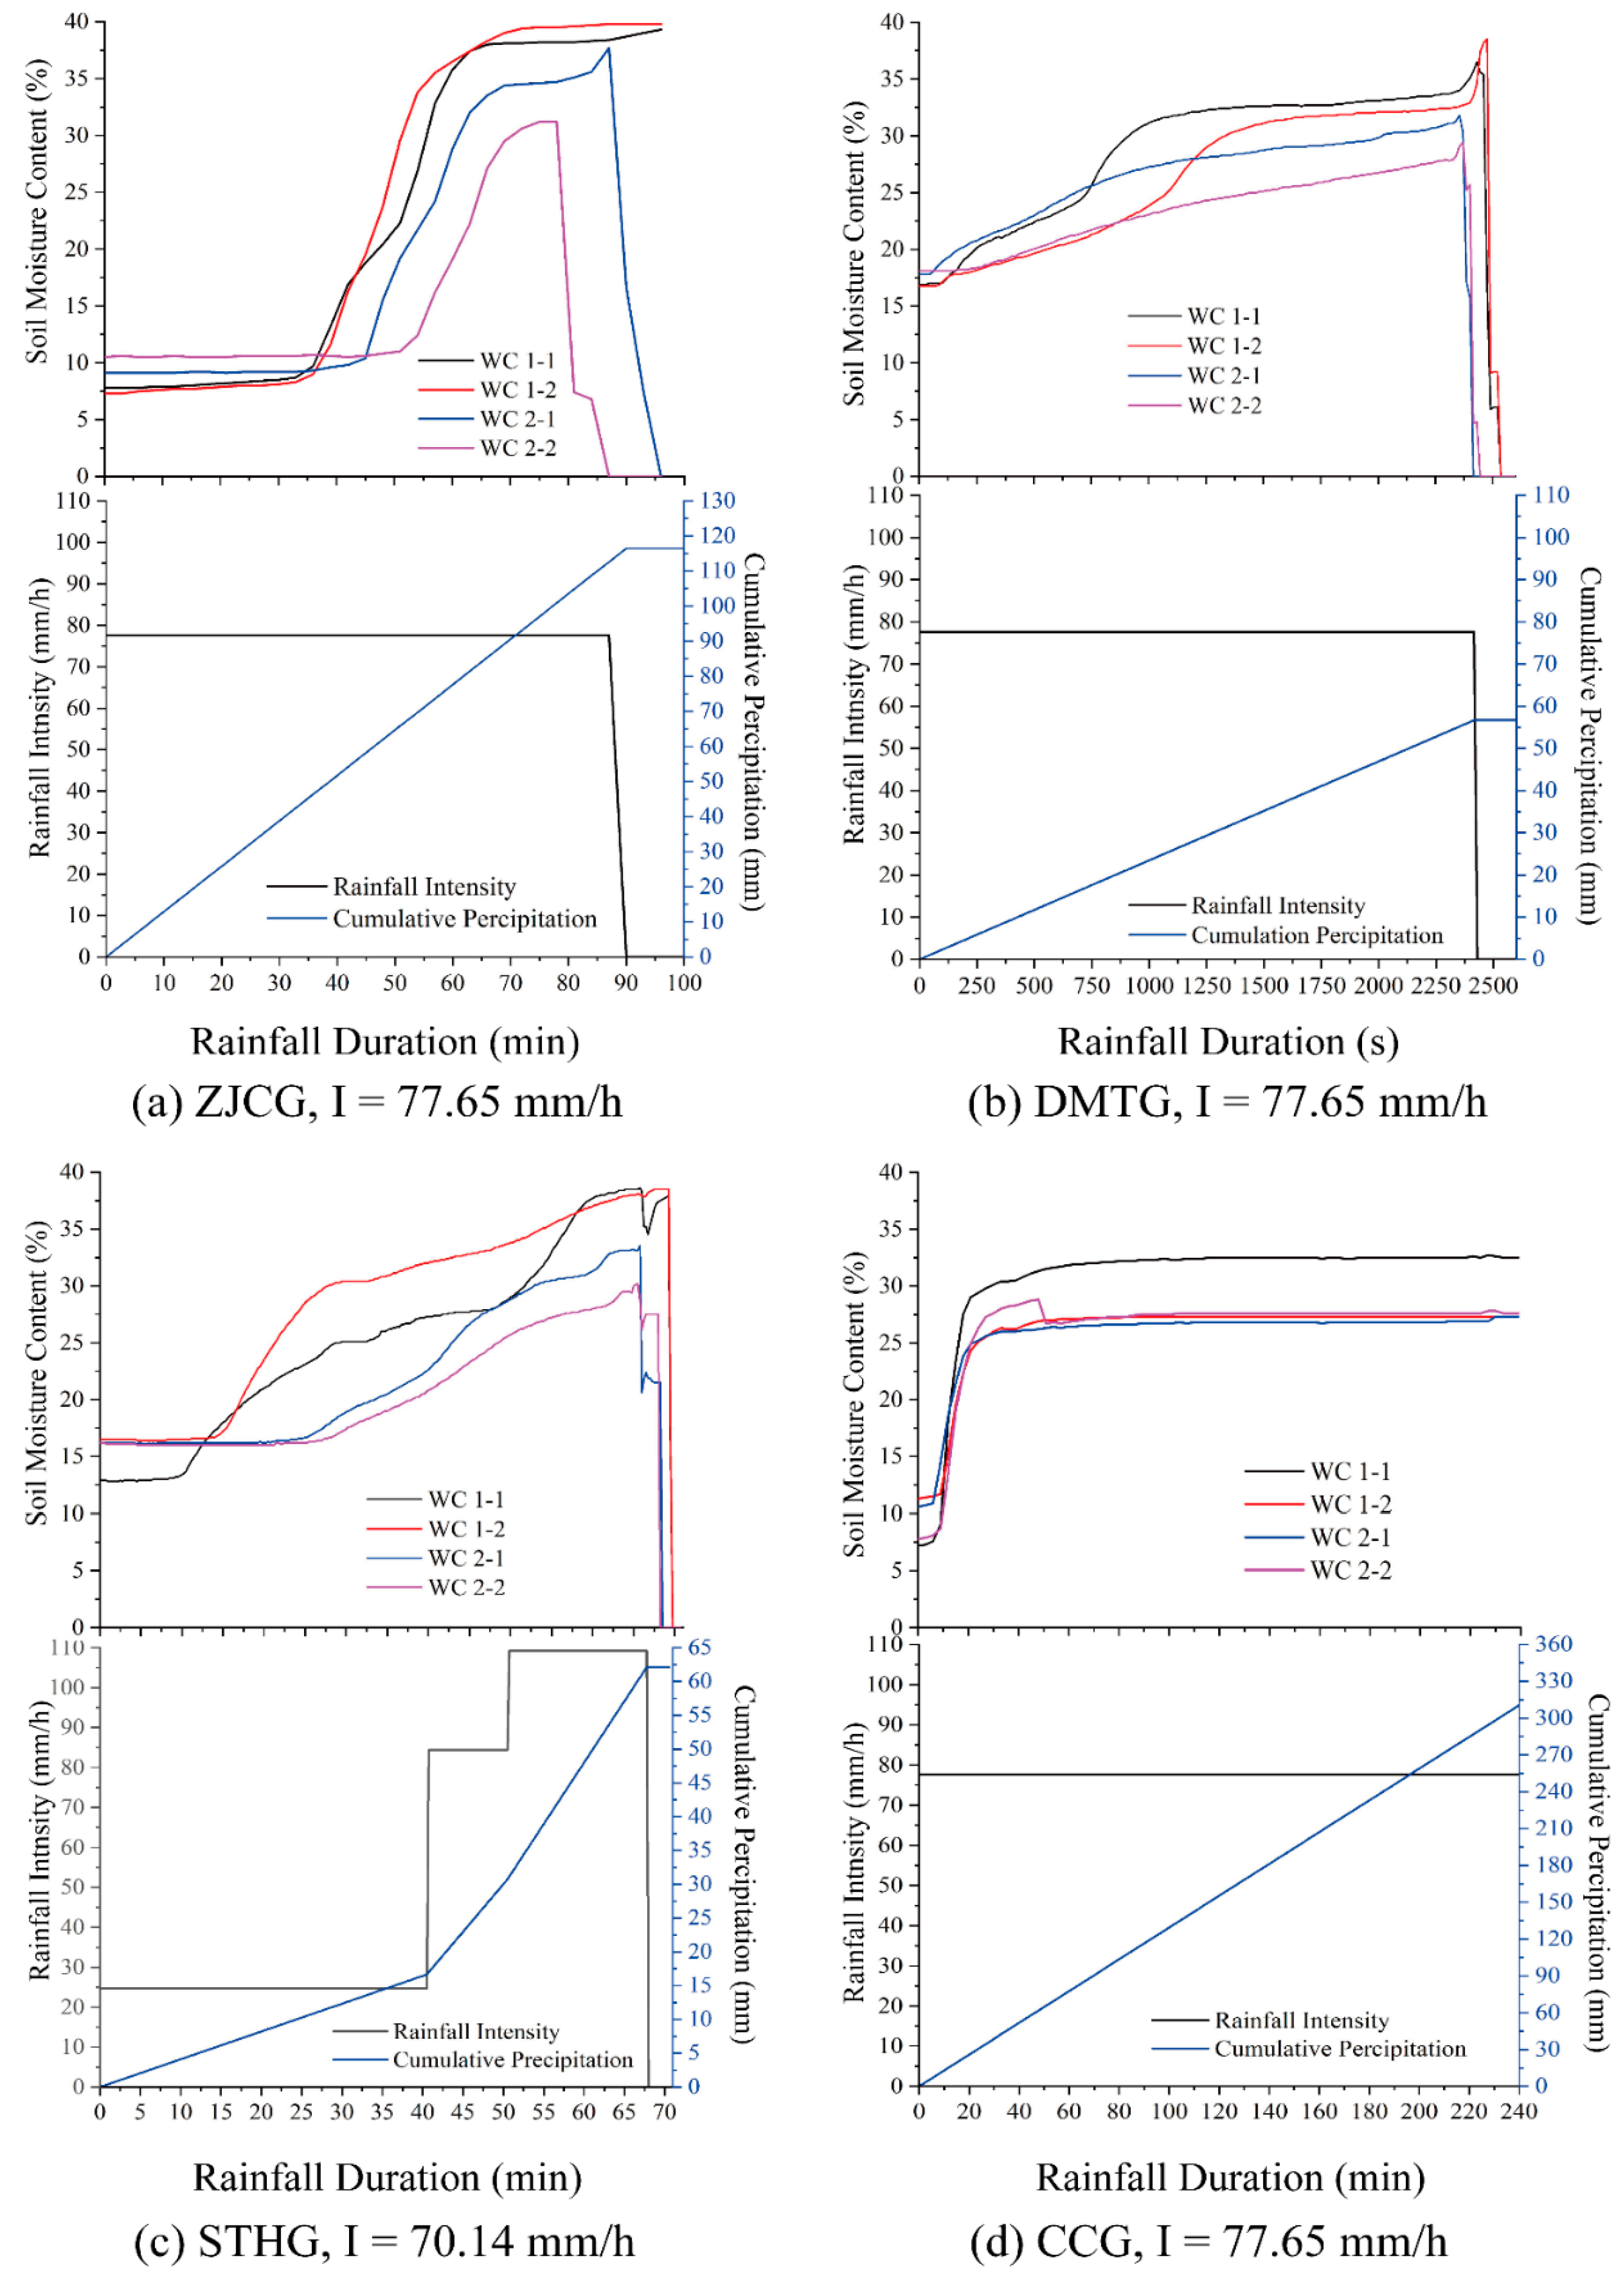
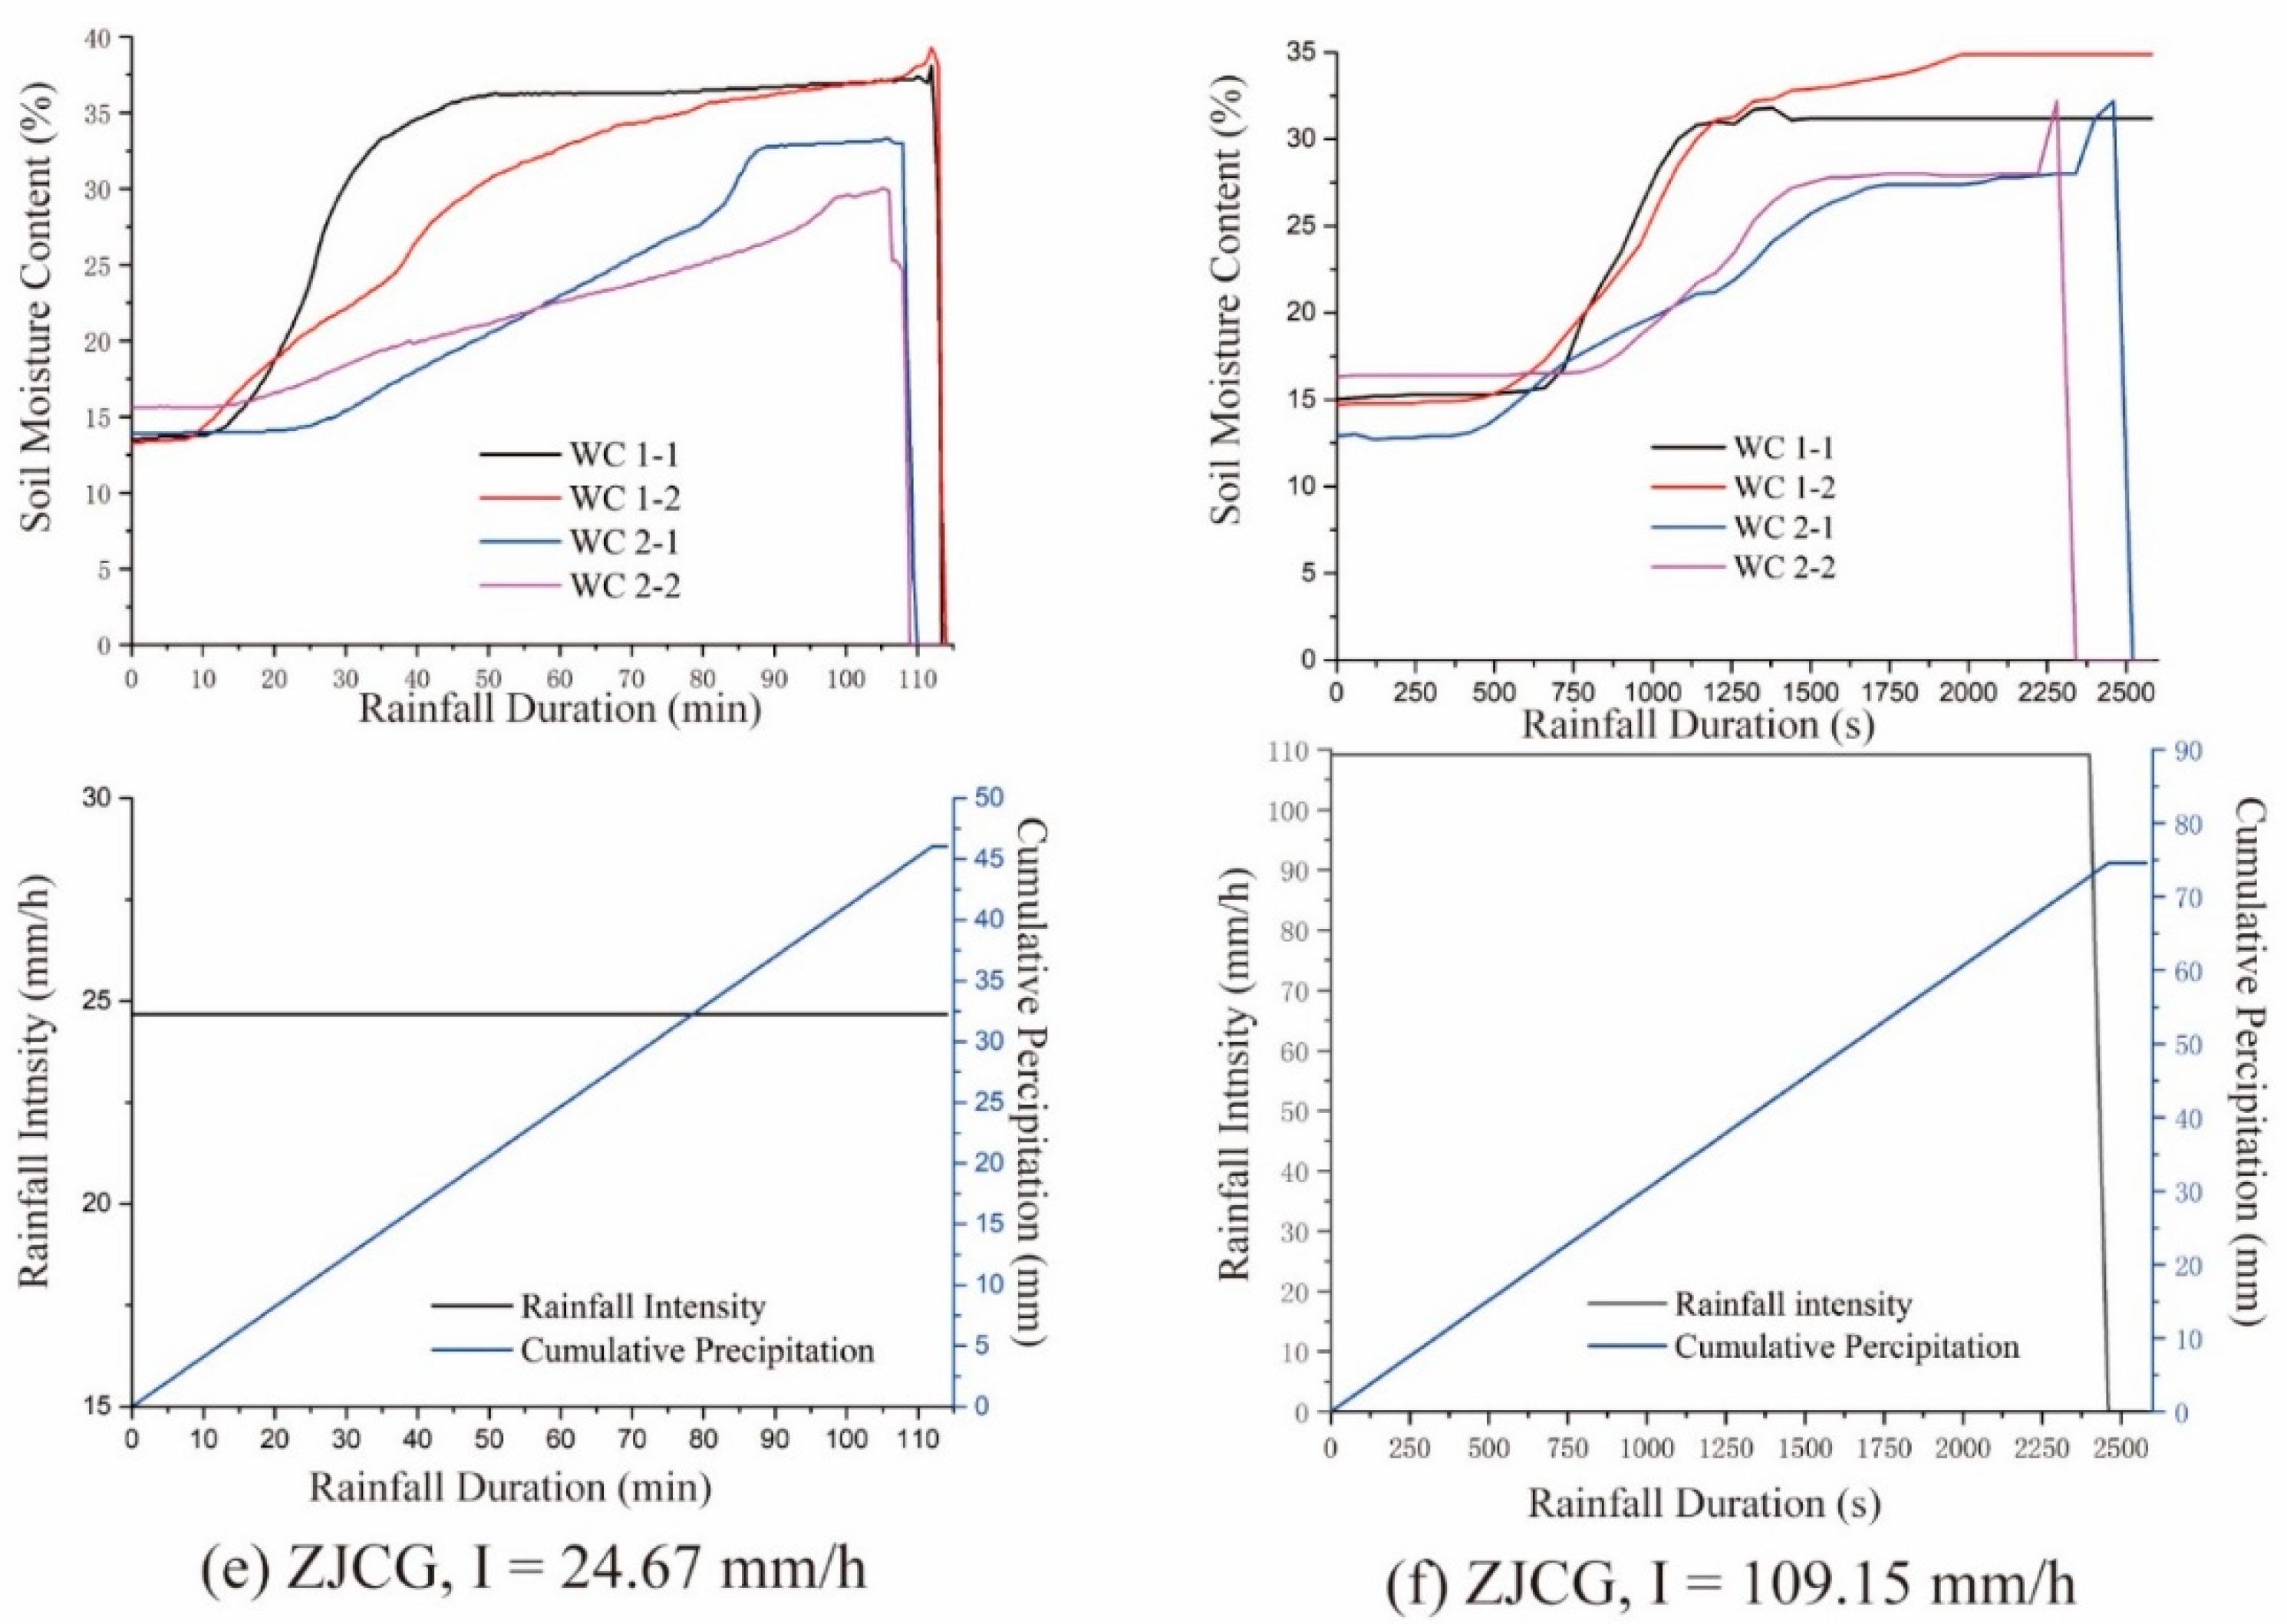
3.3.2. Response of Material Source Destruction and Water Content Change

The change of volumetric water content of soil monitored during the experiment was sorted out, and the change curve of volumetric water content was displayed corresponding to the rainfall conditions of the group of experiments, as shown in Figure 16.
At the beginning of rainfall, the growth of water content has a plateau period, which, due to the water content probe, was laid in the middle of the source body, and the infiltration of rainwater needs a period of time. The higher the content of coarse sand in soil, the shorter the platform period. During the early rainfall period, the higher the content of coarse sand in soil, the faster the growth rate of water content. This is because the size of the pores in soil is directly affected by particle size distribution. Soils with different pore sizes have a stronger ability to gradually desorb moisture than those with uniform pore sizes [48]. The surface area of soil particles is inversely proportional to the particle size; that is, the total surface area of soil particles mainly composed of fine particles is larger than that of soil particles mainly composed of coarse particles [49]. Soils with different pore sizes can desorb moisture more gradually than soils with uniform pore sizes [50]. Due to the small total surface area of soil particles in coarse-grained soil, the intermolecular force interaction is small, which makes the adsorption rate of water higher. Since the size and surface area of holes depend on the size of particles, the content of coarse sand is an important factor affecting the strength of soil mainly composed of coarse sand.
It can be seen that the moisture content measured by the moisture content probe located at the most close to the slope foot (WC 2-2) was less than the other three probes. This is due to the position of WC 2-2 near the toe of the slope, which was the first place to occur the overall failure of the soil structure. Due to the thinness of the soil at the toe of the slope having a certain drainage performance, the water storage performance of the soil is far less than that of the trailing edge soil. After the slope toe was damaged, the position of WC 2-2 often developed a free surface, which made WC 2-2 become washed out first with debris flow fluid. Similarly, because WC 1-1 and WC 1-2 are located at the trailing edge of the source soil, the soil at this location has a very rich time for the rainfall infiltration, and soil thickness also makes the water storage performance of the soil in the region higher than that of the soil at the slope foot.
In addition, under the same soil condition, the growth rate of soil moisture content was proportional to rainfall intensity. Moreover, when the soil had the same initial moisture content, the rainfall duration required for debris flow initiation increased with the increase of rainfall intensity. This is because when the rainstorm intensity is large enough, the rainwater infiltration rate of soil reaches the limit. Even if the rainfall intensity continues to increase, the rainwater infiltration rate will not continue to increase. This makes the rainfall duration required for debris flow initiation reach the minimum when the rainstorm intensity matched perfectly with the rainwater infiltration velocity in the source soil. When the two conditions were not perfectly matched, the rainfall duration required for debris flow initiation under a smaller rainfall intensity was smaller than that under larger rainfall intensity, and the macro performance was that the required cumulative rainfall was smaller.

3.3.3. Conclusions of the Experiment

  • Combined with the above experimental results and phenomenon analysis, the initiation mechanism of debris flow in this area can be described as follows: under the action of early rainfall, the moisture content of loose gully grain source increased, the matrix suction decreased, the soil strength became weak, the soil at the toe of the slope was first destroyed, the soil body produced integrity fine slip, and the trailing edge tension cracked. At this time, the soil structure was in the critical state of instability, and there was no integrity damage. An instantaneous rainstorm after abundant early rainfall made the catchment volume in the valley increase instantaneously, and the moisture content of the source soil continued to rise. Under the traction of the downward seepage of the internal water in the soil, the extrusion of the self-weight of the water in the trailing edge crack and its self-weight, the soil structure was destroyed and collapsed. After, the collapse of soil liquefaction rapidly with surface runoff declined, forming a debris flow.
  • The matrix suction reflected the change in internal stress of the soil structure, which showed an evident decreasing rule after the rainfall started. The moisture content of the soil structure increased continuously with the rainfall. The matrix suction was rapidly reduced to dissipate, and the matrix suction at each monitoring point was 0 when the damage occurred. Accordingly, the matrix suction could support the test results but could not be used as an ideal forecasting index.
  • The volumetric water content reflected the infiltration of rainwater in the slope with the rainfall. It showed an evident growth pattern before the damage and maintained a more stable state after the destabilization.

4. Multi-Parameter Warning Models

4.1. Traditional ID Model

Table 6 shows the statistics of the parameter data with 19 sets. The 19 sets were 28 sets of physical model tests, in which slope destabilization damage and slope debris flow body initiation occurred.
Caine [26] first proposed the ID model for shallow landslides and debris flows in 1980, where I is the rainfall intensity and D is the rainfall duration. The model is in the form of a power function with the standard type of I = a D b , where a and b are parameters. It has become a classical model for predicting the occurrence of landslides or debris flows and has been used to this day. It can discern the critical rainfall conditions for simulating debris flows or landslides.
Ignoring different soil gradation conditions, the rainfall intensity and rainfall duration in the above 19 groups of experimental data were brought into the ID model formula for fitting, and the values of parameters a and b were obtained. The following results were obtained after fitting using origin-lab software:
I = 22.56 D 0.865
where: I is the rainfall intensity (mm/h); D is the rainfall duration (h), and the 1-h rainfall threshold is 22.56 mm.
Although the formation of Laomaoshan debris flow was due to a shallow landslide caused by rainfall that transformed into a debris flow, the measurement of rainfall intensity and duration in this study was obtained from the 1:20 physical laboratory model rather than the actual event. For regions lacking actual rainfall data, the ID warning model only relies on rainfall data for simple regression analysis, with great experience but limited inapplicability. In consideration of the environmental geological background, the physical and mechanical processes of disasters in the region, and the influences of other underground physical parameters, such as volumetric water content reflecting soil permeability, a multi-parameter critical rainfall combination discriminant was established to provide a new idea for constructing a reasonable multi-threshold model of debris flows [51].

4.2. Modified Multi-Parameter Warning Models

The matrix suction reflected the change in internal stress of the soil structure, which showed an evident decreasing rule after the rainfall started. The moisture content of the soil structure increased continuously with the rainfall. The matrix suction was rapidly reduced to dissipate, and the matrix suction at each monitoring point was 0 when the damage occurred. Hence, the matrix suction could support the test results but could not be used as an ideal warning index. The volumetric water content reflected the infiltration of rainwater in the slope with the rainfall, and it showed an obvious growth pattern before the damage and maintained a more stable state after the destabilization. The percentage of coarse sand content (P) and rainfall intensity (I) were an independent variable set in the experiment. The rainfall duration (D) and volumetric moisture content (M) were varied in accordance with different rainfall conditions; thus, they were set as dependent variables. In consideration of the two dependent variables, IPD and IPM models were obtained by using origin-lab software to the individual dependent variables separately.
A high fit can be achieved through exponential 2D surface mathematical regression analysis (as shown in Figure 17), and the IPD model is as follows (R2 = 0.992):
I = 205.18 + 73.06 e P 3.13 + D 1.75
The formula is deformed as:
D = 7 log 2.81 0.014 I 4 0.56 P
where: I is the rainfall intensity (mm/h); P is the percentage of coarse sand; D is the rainfall duration (h).
A high fit can be achieved through extreme cone surface mathematical regression analysis (as shown in Figure 18), and the IPM model is as follows (R2 = 0.679):
M = 29.42 + 1.17 e e P 0.608 0.015 + 4 e e 94.06 I 8.94 + 0.81 e e 0.608 P 0.015 e 94.06 I 8.94
where: I is the rainfall intensity (mm/h); P is the percentage of coarse sand; M is the volumetric moisture content.
Before the model established in this paper is used for debris flow rainfall threshold warning in other areas, test points should be organized in the disaster area, and the parameters can be applied to the area after multiple calibration. The parameters in the multi-parameter early warning model are not widely applicable and are determined by various environmental factors in the debris flow disaster area.
The fitted model equations showed that under the same soil condition, the rainfall duration required to cause a debris flow decreases and the water content of soil failure increases with the increase in rainfall intensity. Under the same rainfall intensity, the rainfall duration required to trigger a debris flow decreases with the increase in coarse sand content in soil, resulting in the increase in water content of soil failure with the increase in sand content in soil. The size of pores in soil is directly affected by particle size distribution. The greater the rainfall intensity is, the smaller the rainfall infiltration rate is, which affects the rainfall duration inducing a debris flow, and the greater the moisture content resulting in soil damage is. The larger the content of coarse sand in the soil is, the larger the particle surface area of the soil is, the more the pores are, and the stronger the ability to absorb water is. Consequently, the rainfall duration required to cause a debris flow is smaller, and the larger the moisture content of soil failure is.

4.3. Multi-Parameter Warning Models Validation

4.3.1. Prediction of Rainfall Threshold by Multi-Parameter Warning Models

In accordance with the soil parameters of main gullies provided by Liaoning Hydrogeological Engineering Geological Survey Institute and laboratory soil test results, and the fitted IPM and IPD warning model Equations (19) and (20), the moisture content and rainfall duration of each main ditch when it reached failure were integrated into the fitted model formula to inverse the rainfall intensity. The critical rainfall prediction results of the debris flow gully in the Laomao Mountain area were calculated, as shown in Table 7.
The prediction results of the IPM model were generally larger than those of the IPD model. The intensities of rainfall that might induce debris flows in the main gullies of Dongmatun, Matun, and Heping predicted using the IPM model were greater than those predicted using the IPD model. By contrast, the intensities of rainfall that might induce debris flows in the main gullies of Zhangjiacun, Zhuanshan and Taiyang predicted using the IPM model were less than those predicted using the IPD model. The prediction results of both models showed that the rainfall intensity that might induce a debris flow in the main gully of Matun was smallest with the highest susceptibility; the rainfall intensities that might induce debris flows in Dongmatun, Zhangjiacun, and Heping were closer with the second highest susceptibility; the rainfall intensities that might induce debris flows in Zhuanshan and Taiyang were largest with the lowest susceptibility.

4.3.2. Prediction of Rainfall Threshold by HIMM

In accordance with the soil parameters provided by Liaoning Hydrogeological Engineering Geological Survey Institute, the critical water depth h 0 was calculated using Equation (5), and the runoff depth R was calculated using Equation (7). The prediction results of critical rainfall in the debris flow gully of the Laomao Mountain area are shown in Table 8.
The prediction results of the HIMM model presented that the critical rainfall amount of the main gully debris flow in Dongmatun was 163.7 mm, and the 1 h rainfall intensity that might induce a debris flow was 83.7 mm; the critical rainfall amount of the main gully debris flow in Matun was 160.1 mm, and the 1 h rainfall intensity that might induce a debris flow was 80.1 mm; the critical rainfall amount of the main gully debris flow in Zhangjiacun was 170.4 mm, and the 1 h rainfall intensity that might induce a debris flow was 90.4 mm; the critical rainfall amount of the main gully debris flow in Heping Village was 161.7 mm, and the 1 h rainfall intensity that might induce a debris flow was 81.7 mm; the critical rainfall of the main gully of Zhuanshan was 174.5 mm, and the 1 h rainfall intensity that might induce a debris flow was 94.5 mm; the critical rainfall of the main gully of Taiyang was 172.9 mm, and the 1 h rainfall intensity that might induce a debris flow was 92.9 mm.
The prediction results obtained using HIMM were generally larger than those predicted using the IPM and IPD models. The rainfall intensities that might induce debris flows in Zhangjia, Zhuanshancun, and Taiyang obtained from the calculation of the initiation mechanism were greater than those predicted using the IPM and IPD models. The rainfall intensities that might induce debris flows in Dongmatun and Heping obtained from the HIMM model were smaller than those predicted using the IPM model and greater than those predicted using the IPD model. The rainfall intensity that might induce a debris flow in Matun obtained from the HIMM model was smaller than those predicted using the IPM and IPD models.
The critical rainfall amount and the rainfall intensity that might induce debris flows in the main gullies of Dongmatun, Matun, and Heping were lowest with the highest susceptibility. The critical rainfall amount and the rainfall intensity that might induce debris flows in the main gullies of Zhangjia and Taiyang were relatively similar to the second highest susceptibility. The critical rainfall amount and the rainfall intensity that might induce a debris flow in the main gully of Zhuanshan Village were highest with the lowest susceptibility. These results were basically consistent with the results obtained from the IPM and IPD models.

4.3.3. Validation of Critical Rainfall Prediction Results in Laomao Mountain Area

In accordance with the rainfall data from 1981 to 2015 from the three regional monitoring stations of Wanjialing, Wafangdian, and Laomaoshan in the Laomao Mountain area, the annual 1 h maximum rainfall (AMR) data of the years when the 1 h rainfall was greater than 50 mm were selected and compared with the predicted critical rainfall (PCR) obtained above. The results are shown in Table 9.
The debris flow rainfall thresholds calculated using the IPM, IPD and HIMM models were largely consistent with the actual situation obtained from the historical rainfall data. The prediction results of the ID model are greatly different from those of the above models. In comparison with the 1 h maximum rainfall data of each year, when the 1 h maximum rainfall of the year was larger than the predicted rainfall threshold of debris flows obtained using the three models, a debris flow would occur, such as the debris flow that occurred in 1981; when the 1 h maximum rainfall of the year was smaller than the predicted rainfall threshold of debris flows obtained using the three models, no debris flow occurred.

5. Discussions

From the results of the comparison and analysis between the debris flow rainfall thresholds calculated using the IPM and IPD models and HIMM and the actual situation obtained from historical rainfall data, the IPM and IPD multi-parameter warning models proposed in this paper are reasonable and can be used for the forecasting of debris flow rainfall thresholds. The supplement of the prediction results of the HIMM model can prevent the overfitting issue of the IPM and IPD multi-parameter warning models leads to large errors. The minimum value among IPM, IPD and HIMM in the calculation results was adopted as the debris flow rainfall threshold. A debris flow occurred when the historical rainfall was larger than the calculation results, no debris flow occurred when it was smaller than the calculation results, and no missed alarm would occur. Therefore, the warning models proposed in this paper have certain safety.
However, this work still has some limitations. First, although our modified multi-parameter warning models proved their reliability after comparison, only four soil samples were involved in this physical model test. After we obtained the fitted SWCCs of matrix suction and water content for each soil sample, the relationship between the parameters in the SWCCs and soil gradations could not be further explored due to excessively few soil samples. Thus, multiple replicate tests should be conducted in the future after further expanding the soil sample size to explore the mechanism of soil gradation to debris flow rainfall threshold.
Second, although our modified multi-parameter warning models include several influencing factors and are reliable for debris flow rainfall threshold forecasts, they are inadequately comprehensive for an integrated warning system. A comprehensive warning system must contain more environmental factors, such as the geologic and geomorphologic factors and the distribution of material source [7]. The rainfall threshold of debris flows is influenced by rainfall characteristics, loose accumulation, river and slope characteristics, and other factors. Therefore, in future research, the material source accumulation thickness, debris flow channel morphology, and the slope of material source should be incorporated into new multi-parameter warning models to establish a more systematic and comprehensive integrated warning system.
The debris flow rainfall threshold results calculated using the IPM model, IPD model, and HIMM were generally consistent, but differences exist among certain data, such as the results of Taiyang. The reasons for the discrepancies are as follows:
  • The soils in each main gully were complex and diverse; hence, certain limitations occur in using single soil sample data in the calculation;
  • The IPM and IPD models require a large amount of physical simulation experimental data in the fitting. Although we have performed multiple repetitions of experimental groups with typical experimental phenomena to avoid chance in the experiments, the contingency of experimental data cannot be completely avoided;
  • Artificial rainfall simulation equipment was used to maintain the same intensity of continuous rainfall. Restricted by the existing experimental conditions, although four rain types were designed in the physical experiment, the randomness and continuous variability of rainfall intensity under natural rainfall still cannot be restored.
In future experiments or before application in other debris flow areas, the types of soil samples collected from on-site physical sources should be expanded, the forecasting of refined zonal rainfall thresholds should be carried out for each main gully basin, and the artificial rainfall simulation equipment should be optimized to meet the precondition of controlling the hourly average rainfall intensity and restore the randomness and continuous variability of rainfall intensity under natural rainfall.
Lastly, the warning models proposed in this study have not yet been validated in other debris flows other than the Laomao Mountain debris flow. The reliability of the models in this study was validated using only five debris flow events. The statement was supported by an analysis based on just one observed event exceeding the triggering threshold. To validate the accuracy of the models further, continuous revisions of the models by using more rainfall and hazard data will be required in the future.

6. Conclusions

  • The initiation mechanism of debris flow in this area can be described as follows: under the action of early rainfall, the moisture content of the loose gully grain source increased, the matrix suction decreased, the soil strength became weak, the soil at the toe of the slope was first destroyed, the soil body produced integrity fine slip, and the trailing edge tension cracked. At this time, the soil structure was in the critical state of instability, and there was no integrity damage. An instantaneous rainstorm after abundant early rainfall made the catchment volume in the valley increase instantaneously, and the moisture content of the source soil continued to rise. Under the traction of the downward seepage of the internal water in the soil, the extrusion of the self-weight of the water in the trailing edge crack and its self-weight, the soil structure was destroyed and collapsed. After this, the collapse of soil liquefaction rapidly with surface runoff declined, forming a debris flow.
  • From the experimental results, the initiation pattern of the slope source under the same slope was mainly influenced and controlled by rainfall intensity and soil gradation conditions. The main manifestation of the influence of the rainfall intensity condition was as follows: the greater the rainfall intensity was, the less the soil body continued to be damaged after the rainfall stopped; an evident raindrop spattering phenomenon would occur, and the initiation duration was shorter. The main manifestation of the influence of the soil grade condition was as follows: the grade of the soil body tended to be destroyed as a whole and disintegrated after large pieces were separated from the slope surface, the initiation duration of the source was long, and extremely poor-grade soil was not damaged.
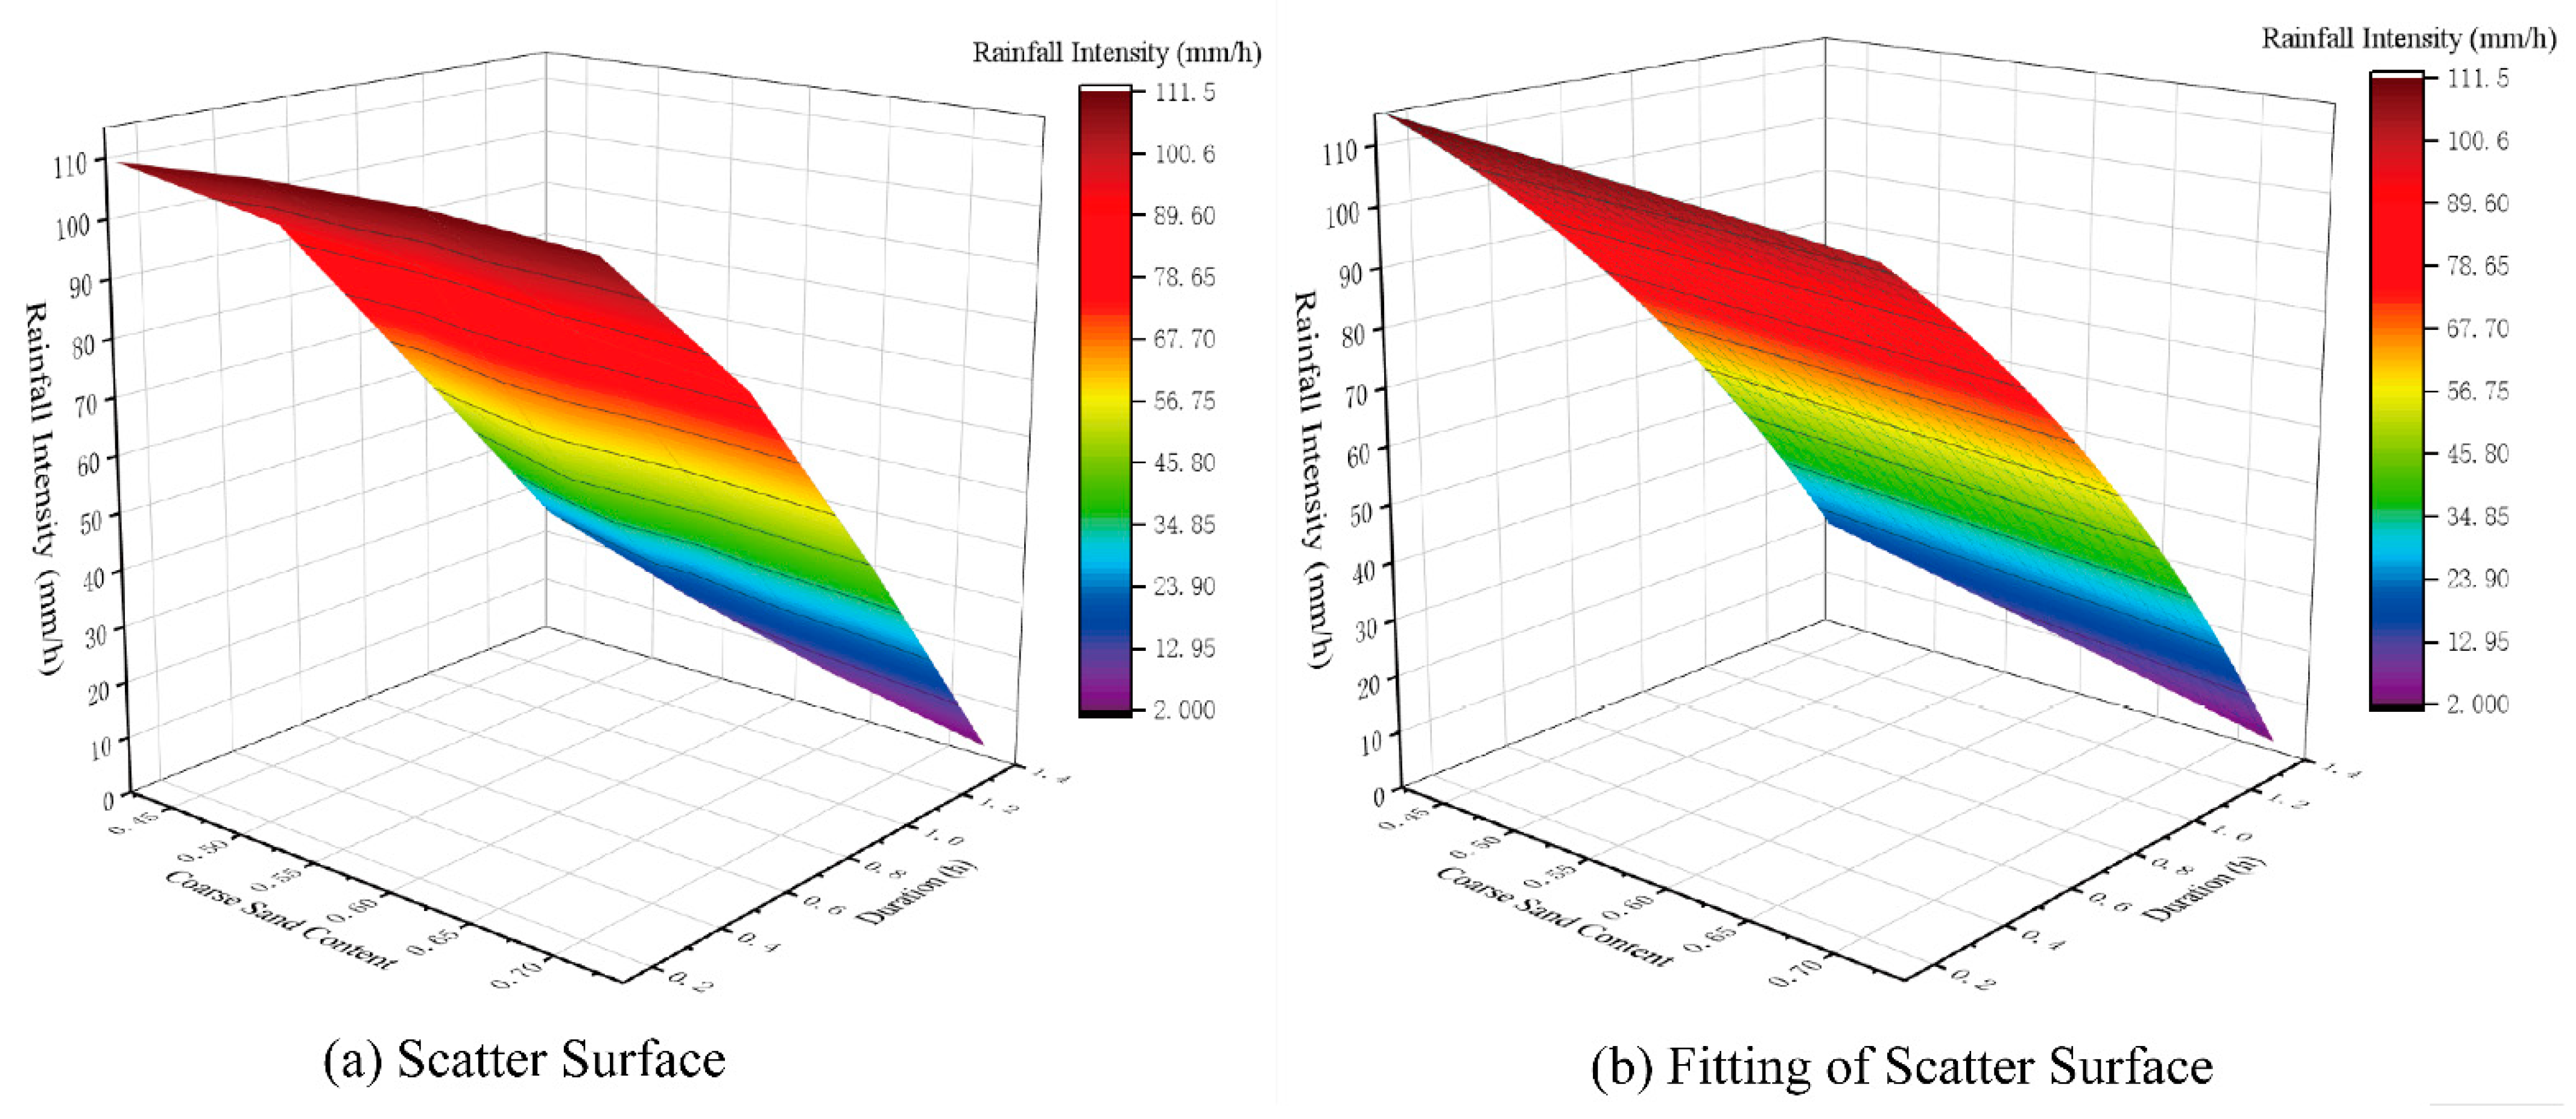
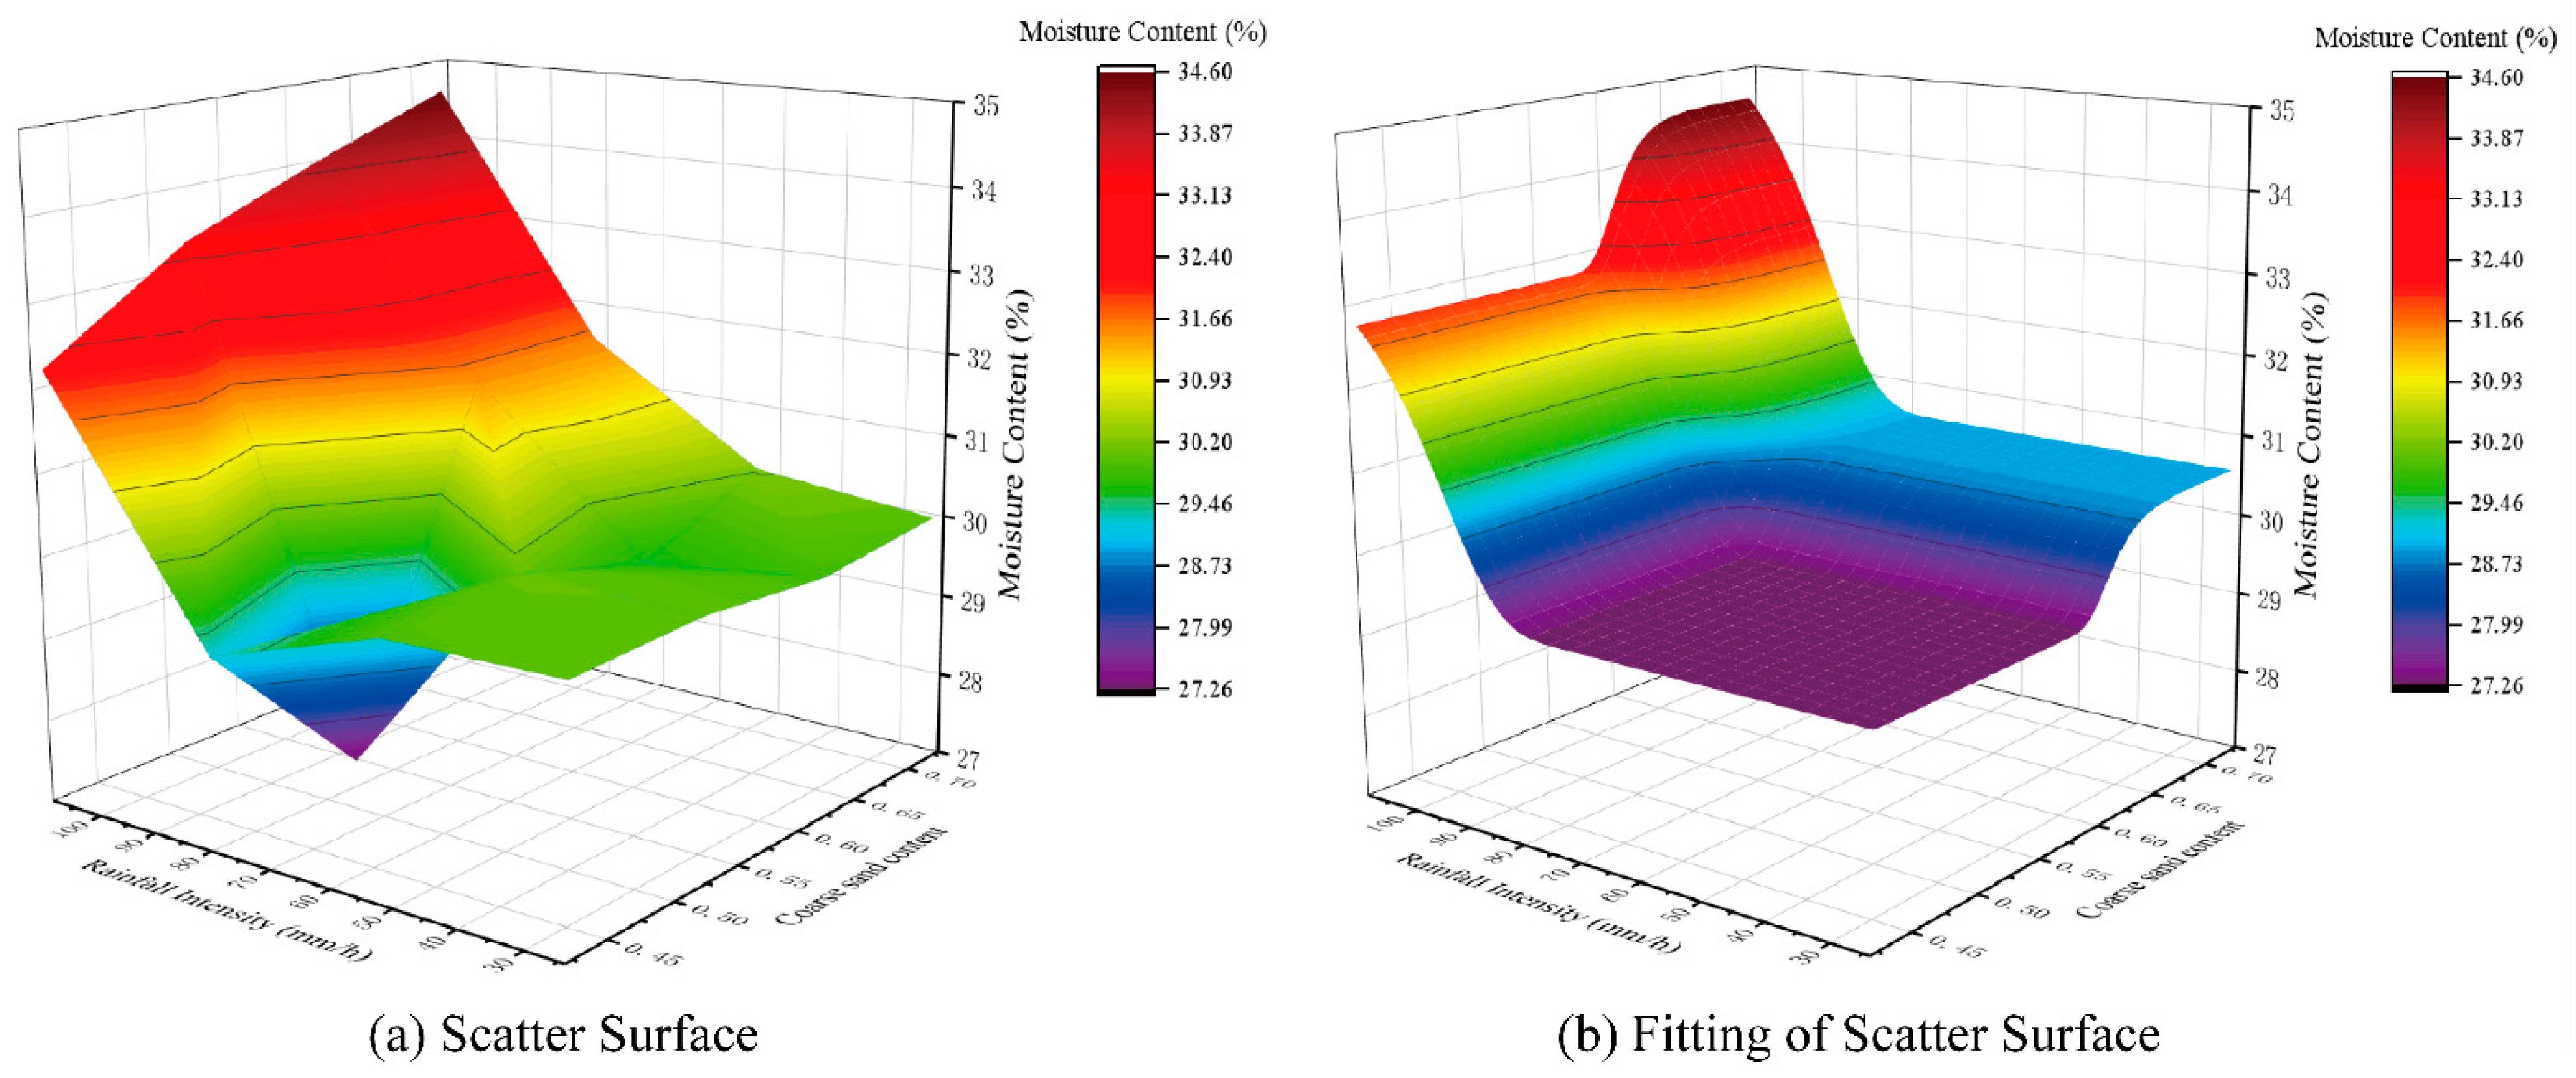
  • We established multi-parameter warning models (IPM, IPD) for destabilization damage in the source area by combining the volumetric water content of the deep subsurface with rainfall intensity and rainfall ephemeris under different gradations to achieve effective corrections of the traditional ID model. The AMR from 1981 to 2015 was selected and compared with the prediction results. The comparison proved the reliability of the prediction results and corrected the deficiency of the traditional ID rainfall threshold model, which is of great practical significance to optimizing the debris flow disaster forecasting and warning work.
  • The IPM, IPD and HIMM prediction results were comprehensively analyzed to obtain the critical rainfall of each main gully of Laomao Mountain debris flow. The results were as follows: 82.08 mm for the main gully of Dongmatun, 80.10 mm for the main gully of Matun, 82.28 mm for the main gully of Zhangjiacun, 80.84 mm for the main gully of Heping, 85.06 mm for the main gully of Zhuanshan, and 82.45 mm for the main gully of Taiyang.

Author Contributions

Data curation, Y.W. and L.N.; Formal analysis, Y.W., X.R., L.N., Y.T., M.Z., Y.X., F.K., Y.H., T.Z., C.B. and C.D.; Funding acquisition, L.N., C.L., M.Z. and Y.X.; Methodology, Y.W., Y.T. and L.N.; Writing—original draft, Y.W.; Writing—review & editing, Y.W., M.Z., Z.L. and L.J. All authors have read and agreed to the published version of the manuscript.

Funding

This research was funded by the National Science Foundation of China (Grant No.41572254 41502322, 41702300), the China Postdoctoral Science Foundation (2020M670867) and the Jilin University Outstanding Youth Foundation

Institutional Review Board Statement

Not applicable.

Informed Consent Statement

Not applicable.

Acknowledgments

The first author would like to express her thanks to Lei Nie, Min Zhang, and Yuhang Teng. Many thanks for Min Zhang, and Yuhang Teng for all hints and suggestions.

Conflicts of Interest

The authors declare that they have no conflict of interest.

References

  1. Wang, Y.; Nie, L.; Zhang, M.; Wang, H.; Xu, Y.; Zuo, T. Assessment of Debris Flow Risk Factors Based on Meta-Analysis—Cases Study of Northwest and Southwest China. Sustainability 2020, 12, 6841. [Google Scholar] [CrossRef]
  2. Santi, P.M.; Hewitt, K.; VanDine, D.F.; Barillas Cruz, E. Debris-flow impact, vulnerability, and response. Nat. Hazards 2010, 56, 371–402. [Google Scholar] [CrossRef]
  3. Dilley, M.; Chen, R.S.; Deichmann, U.; Lerner-Lam, A.L.; Arnold, M.; Agwe, J.; Buys, P.; Kjekstad, O.; Lyon, B.; Yetman, G. Natural Disaster Hotspots: A Global Risk Analysis. In International Bank for Reconstruction; World Bank Publications: Washington, DC, USA, 2005. [Google Scholar]
  4. Dowling, C.A.; Santi, P.M. Debris flows and their toll on human life: A global analysis of debris-flow fatalities from 1950 to 2011. Nat. Hazards 2013, 71, 203–227. [Google Scholar] [CrossRef]
  5. Cui, P.; Liu, S.J.; Tan, W.P. Progress of debris flow forecast in China. J. Nat. Disasters 2000, 9, 10–15. [Google Scholar]
  6. Ni, H.; Zheng, W.; Li, Z.; Ba, R. Recent catastrophic debris flows in Luding county, SW China: Geological hazards, rainfall analysis and dynamic characteristics. Nat. Hazards 2010, 55, 523–542. [Google Scholar] [CrossRef]
  7. Pan, H.-L.; Jiang, Y.-J.; Wang, J.; Ou, G.-Q. Rainfall threshold calculation for debris flow early warning in areas with scarcity of data. Nat. Hazards Earth Syst. Sci. 2018, 18, 1395–1409. [Google Scholar] [CrossRef] [Green Version]
  8. Guo, X.J.; Peng, C.; Yong, L.I. Debris Flow Warning Threshold Based on Antecedent Rainfall: A Case Study in Jiangjia Ravine, Yunnan, China. J. Mt. Sci. 2013, 10, 305–314. [Google Scholar] [CrossRef]
  9. Zhou, W.; Tang, C. Rainfall thresholds for debris flow initiation in the Wenchuan earthquake-stricken area, southwestern China. Landslides 2014, 11, 877–887. [Google Scholar] [CrossRef]
  10. Wei, Z.; Shang, Y.; Zhao, Y.; Pan, P.; Jiang, Y. Rainfall threshold for initiation of channelized debris flows in a small catchment based on in-site measurement. Eng. Geol. 2016, 217, 23–34. [Google Scholar] [CrossRef]
  11. Segoni, S.; Piciullo, L.; Gariano, S.L. A review of the recent literature on rainfall thresholds for landslide occurrence. Landslides 2018, 15, 1483–1501. [Google Scholar] [CrossRef]
  12. Segoni, S.; Lagomarsino, D.; Fanti, R.; Moretti, S.; Casagli, N. Integration of rainfall thresholds and susceptibility maps in the Emilia Romagna (Italy) regional-scale landslide warning system. Landslides 2014, 12, 773–785. [Google Scholar] [CrossRef] [Green Version]
  13. Zhou, J.; Du, Q.; Li, C. Model test of rainfall intensity influence on debris flow starting. J. Nat. Disasters 2016, 25. [Google Scholar] [CrossRef]
  14. Gartner, J.E.; Cannon, S.H.; Santi, P.M.; Dewolfe, V.G. Empirical models to predict the volumes of debris flows generated by recently burned basins in the western U.S. Geomorphology 2008, 96, 339–354. [Google Scholar] [CrossRef]
  15. Hu, W.; Xu, Q.; Wang, G.H.; van Asch, T.W.J.; Hicher, P.Y. Sensitivity of the initiation of debris flow to initial soil moisture. Landslides 2014, 12, 1139–1145. [Google Scholar] [CrossRef] [Green Version]
  16. Zhang, S.; Zhang, L.M. Impact of the 2008 Wenchuan earthquake in China on subsequent long-term debris flow activities in the epicentral area. Geomorphology 2017, 276, 86–103. [Google Scholar] [CrossRef]
  17. Cannon, S.H.; Gartner, J.E.; Wilson, R.C.; Bowers, J.C.; Laber, J.L. Storm rainfall conditions for floods and debris flows from recently burned areas in southwestern Colorado and southern California. Geomorphology 2008, 96, 250–269. [Google Scholar] [CrossRef]
  18. Baum, R.L.; Godt, J.W. Early warning of rainfall-induced shallow landslides and debris flows in the USA. Landslides 2010, 7, 387. [Google Scholar] [CrossRef] [Green Version]
  19. Huang, S.C.; Bo-Tsung. Non-structural mitigation programs for sediment-related disasters after the Chichi Earthquake in Taiwan. J. Mt. Sci. 2010, 7, 291–300. [Google Scholar]
  20. Winter, M.G.; Dent, J.; Macgregor, F.; Dempsey, P.; Motion, A.; Shackman, L. Debris flow, rainfall and climate change in Scotland. Q. J. Eng. Geol. Hydrogeol. 2010, 43, 429–446. [Google Scholar] [CrossRef]
  21. Rosi, A.; Lagomarsino, D.; Rossi, G.; Segoni, S.; Battistini, A.; Casagli, N. Updating EWS rainfall thresholds for the triggering of landslides. Nat. Hazards 2015, 78, 297–308. [Google Scholar] [CrossRef]
  22. Pan, H.; Huang, J.; Wang, R.; Ou, G. Rainfall threshold calculation method for debris flow pre-warning in data-poor areas. J. Earth Sci. 2013, 24, 854–862. [Google Scholar] [CrossRef]
  23. Cong, W.; Pan, M.; Li, T.; Ren, Q.; Li, R. Quantitative Analysis of Critical Rainfall-Triggered Debris Flows. Chin. J. Rock Mech. Eng. 2006, 25, 2808–2812. [Google Scholar]
  24. Takahashi. Mechanical Characteristics of Debris Flow. Hydraul 1978, 1153–1169. [Google Scholar]
  25. Iverson, R.M.; Lahusen, R.G. Dynamic pore-pressure fluctuations in rapidly shearing granular materials. Science 1989, 246, 796–799. [Google Scholar] [CrossRef] [PubMed]
  26. Caine, N. The rainfall intensity-duration control of shallow landslides and debris flows. Geogr. Ann. 1980, 62, 23–27. [Google Scholar]
  27. Wieczorek, G.F. Effect of rainfall intensity and duration on debris flows in central Santa Cruz Mountains, California. Rev. Eng. Geol. 1987, 7, 93–104. [Google Scholar]
  28. Jibson, R.W.; Schultz, A.P. Debris flows in southern Puerto Rico. Geol. Soc. Am. Spec. Pap. 1989, 236, 29–56. [Google Scholar]
  29. Hong, Y.; Hiura, H.; Shino, K.; Sassa, K.; Suemine, A.; Fukuoka, H.; Wang, G. The influence of intense rainfall on the activity of large-scale crystalline schist landslides in Shikoku Island, Japan. Landslides 2005, 2, 97–105. [Google Scholar] [CrossRef]
  30. Dahal, R.K.; Hasegawa, S.; Nonomura, A.; Yamanaka, M.; Masuda, T.; Nishino, K. Failure characteristics of rainfall-induced shallow landslides in granitic terrains of Shikoku Island of Japan. Environ. Geol. 2009, 56, 1295–1310. [Google Scholar] [CrossRef]
  31. Guzzetti, F.; Peruccacci, S.; Rossi, M.; Stark, C.P. The rainfall intensity–duration control of shallow landslides and debris flows: An update. Landslides 2008, 5, 3–17. [Google Scholar] [CrossRef]
  32. Berti, M.; Bernard, M.; Gregoretti, C.; Simoni, A. Physical Interpretation of Rainfall Thresholds for Runoff-Generated Debris Flows. J. Geophys. Res. Earth Surf. 2020, 125. [Google Scholar] [CrossRef]
  33. Saito, H.; Nakayama, D.; Matsuyama, H. Relationship between the initiation of a shallow landslide and rainfall intensity—duration thresholds in Japan - ScienceDirect. Geomorphology 2010, 118, 167–175. [Google Scholar] [CrossRef]
  34. Shen, S.; Liao, W.; Nie, L.; Xu, Y.; Zhang, M. Debris flow hazard assessment at Dongmatun Village in Laomao mountainous area of Dalian, Northeast China. Arab. J. Geosci. 2018, 11, 648. [Google Scholar] [CrossRef]
  35. Zhuang, J.Q.; Cui, P.; Ge, Y.G.; Hong, Y. Relationship between rainfall characteristics and total amount of debris flow. J. Beijing For. Univ. 2009, 31, 77–83. [Google Scholar]
  36. Tian, B.; Wang, Y.Y.; Hong, Y. Weighted Relation Between Antecedent Rainfall and Process Precipitation in Debris Flow Prediction—A Case Study of Jiangjia Gully in Yunnan Province. Bull. Soil Water Conserv. 2008, 28, 71–75. (In Chinese) [Google Scholar]
  37. Pan, H.-L.; Ou, G.-Q.; Huang, J.-c.; Cao, B. Study of rainfall threshold of debris flow forewarning in data lack areas. Rock Soil Mech. 2012, 33, 2122–2226. (In Chinese) [Google Scholar]
  38. Yao, L. A research on the calculation of critical rainfall with frequency of debris flow and torrential rain. J. Soil Water Conserv. 1988, 4, 72–78. (In Chinese) [Google Scholar]
  39. Bruce, J.P.; Clark, R.H. INDEX—Introduction to Hydrometeorology. Introd. Hydrometeorol. 1966, 13, 1–4. [Google Scholar]
  40. Yingyan, Z.; Peng, C.; Xiaoqing, C. Experiment onmechanism of slope failure of debris flow fan and stability analysis. Chin. J. Rock Mech. Eng. 2005, 24, 3827–3934. [Google Scholar]
  41. Genuchten, V.; Th, M. A closed-form equation for predicting the hydraulic conductivity of unsaturated soils. Soil Sci. Soc. Am. J. 1980, 44, 892–898. [Google Scholar] [CrossRef] [Green Version]
  42. Gardner, W.R. Some steady-state solutions of the unsaturated moisture flow equation with application to evaporation from a water table. Soil Sci. 1958, 85, 228–232. [Google Scholar] [CrossRef]
  43. Fredlund, D.G.; Xing, A. Equations for the soil-water characteristic curve. Can. Geotech. J. 1994, 31, 521–532. [Google Scholar] [CrossRef]
  44. Benson, C.H.; Chiang, I.; Chalermyanont, T.; Sawangsuriya, A. Estimating van Genuchten Parameters α and n for Clean Sands from Particle Size Distribution Data. In Proceedings of the Geo-Congress, Atlanta, Georgia, 24 February 2014. [Google Scholar] [CrossRef]
  45. Blight, G.E. Interactions between the atmosphere and the Earth. Geotechnique 1997, 47, 715–766. [Google Scholar]
  46. Fell, R.; Corominas, J.; Bonnard, C.; Cascini, L.; Leroi, E.; Savage, W.Z. Guidelines for landslide susceptibility, hazard and risk zoning for land use planning. Eng. Geol. 2008, 102, 85–98. [Google Scholar] [CrossRef] [Green Version]
  47. Cascini, L.; Sorbino, G.; Cuomo, S.; Ferlisi, S. Seasonal effects of rainfall on the shallow pyroclastic deposits of the Campania region (southern Italy). Landslides 2013, 11, 779–792. [Google Scholar] [CrossRef]
  48. Hillel, D. Environmental Soil Physics: Fundamentals, Applications, and Environmental Considerations; Academic Press: Cambridge, MA, USA, 1998. [Google Scholar]
  49. Tuller, M.; Or, D.; Dudley, L.M. Adsorption and capillary condensation in porous media: Liquid retention and interfacial configurations in angular pores. Water Resour. Res. 1999, 35, 1949–1964. [Google Scholar] [CrossRef]
  50. Hedges, L.V. The meta-analysis of response ratios in. Ecology 1999, 80, 1150–1156. [Google Scholar] [CrossRef]
  51. Qiao, J.; Mingli, L.I.; Yang, Z.; Meng, H.; Jiang, Y. Warning model study of debris flow slope source starting based on experimental method. Adv. Water Sci. 2018. (In Chinese) [Google Scholar] [CrossRef]
Figure 1. General Situation of Laomao Mountain debris flow.
Water 13 01083 g001
Figure 2. Landforms in the Laomao Mountain debris flow gully.
Water 13 01083 g002
Figure 3. Gradation curves of the overlying accumulation layer in the formation area of study area.
Water 13 01083 g003
Figure 4. Water shed and river distribution system in the Laomao Mountain area.
Water 13 01083 g004
Figure 5. Multi-year average monthly precipitation distribution in Dalian from 1980 to 2019.
Water 13 01083 g005
Figure 6. Force analysis of the accumulation in the gully.
Water 13 01083 g006
Figure 7. Physical model of Laomao Mountain debris flow.
Water 13 01083 g007
Figure 8. Gradation curves of test soil samples.
Water 13 01083 g008
Figure 9. The destruction process of ZJCG gradation under the rainstorm (24.58 mm/h).
Water 13 01083 g009
Figure 10. Damage characteristics of ZJCG condition under extraordinary rainstorm (77.65 mm/h).
Water 13 01083 g010
Figure 11. Damage characteristics of ZJCG condition under rare extraordinary rainstorm (109.15 mm/h).
Water 13 01083 g011
Figure 12. Damage characteristics of DMTG condition under extraordinary rainstorm (77.65 mm/h).
Water 13 01083 g012
Figure 13. Damage characteristics of STHG condition under extraordinary rainstorm (77.65 mm/h).
Water 13 01083 g013
Figure 14. Damage characteristics of ZJCG condition under extraordinary rainstorm (77.65 mm/h).
Water 13 01083 g014
Figure 15. SWCCs of soil samples.
Water 13 01083 g015
Figure 16. Variation curve of volumetric water content under different gradation and rainfall conditions.
Water 13 01083 g016aWater 13 01083 g016b
Figure 17. IPD model fitting.
Water 13 01083 g017
Figure 18. IPM model fitting.
Water 13 01083 g018
Table 1. Characteristic parameters of six main gullies.
Main GullyCatchment Area (km2)Length (km)Highest Point (m)Lowest Point (m)Average Longitudinal Slope Ratio (‰)
Dongmatun45.871376610251.07
Matun46.813562.1510433.1
Zhangjiacun66.422074310032.15
Heping38.4312.5365173.0814.2
Zhuanshan48.8113369.5231.3219.6
Taiyang25.3918761.7214.2
(Longitudinal slope ratio: the ratio of the difference between the elevation of the gully source and the gully mouth of the debris flow to the length of the main gully [1]).
Table 2. Soil parameters of the overlying accumulation layer in the formation area of Laomao Mountain debris flow.
Name of the Soil Sampled10 (mm)d30 (mm)d50 (mm)d60 (mm)CuCc
ZJCG0.01580.2270.40.54534.4945.984
DMTG0.02860.2780.450.59920.9444.511
STHG0.06750.3620.610.76811.3782.528
CCG0.2750.4250.951.4755.3640.445
Table 3. Rainstorm condition in the Laomao Mountain area on 27 July 1981.
Rainfall Duration (h)136122454
Accumulated rainfall (mm)116.5233395524583.7768.9
Average Rainfall intensity (mm/h)116.577.6765.8343.6724.3214.24
Table 4. Parameters of soil samples.
Soil SampleC (kPa)ρ (g/cm3)φ (°)d10 (mm)d30 (mm)d60 (mm)
ZJCG131.6521.20.01580.2270.545
DMTG111.7820.30.02860.2780.599
STHG121.9219.40.06750.3620.768
CCG101.8515.10.2750.4251.475
Table 5. Calculation parameters of 1 h rainfall of all rain types.
Rain TypeRainfall Return Period H t ¯   ( mm ) CvtCs/CvtKpHtp (mm)Ie (mm/h)
RainstormTen years41.80.253.51.9179.8424.67
Heavy rainstormThirty years60.40.253.51.95117.7845.23
Extraordinary rainstormFifty years72.80.253.52.09152.1577.65
Rare Extraordinary RainstormA century111.90.253.52.42270.80109.15
Table 6. Statistical table of parameters data of physical model tests.
Soil
Sample
Rainfall Intensity (mm/h)Rainfall
Duration (h)
Percentage of Coarse Sand (%)Moisture
Content (%)
ZJCG109.150.2500.42732.2
ZJCG109.110.3040.42730.1
ZJCG77.650.7000.42731.2
ZJCG70.140.8170.42730.7
ZJCG45.231.1300.42730.1
ZJCG24.671.3830.42730
DMTG109.150.2360.45632.6
DMTG109.110.2630.45632.2
DMTG77.650.6580.45629.4
DMTG70.140.7170.45631.2
DMTG45.231.0170.45630.4
DMTG24.671.2790.45630.1
STHG109.150.2290.57733.7
STHG109.110.2710.57733.8
STHG77.650.6380.57731.2
STHG70.140.6830.57730.7
STHG45.230.9830.57730.2
STHG24.671.2210.57729.9
CCG109.151.5330.72427.6
Table 7. Critical rainfall prediction results of IPM and IPD models in a debris flow gully in the Laomao Mountain area.
Main GullyDongmatunMatunZhangjiacunHepingZhuanshanTaiyang
IPMP0.460.430.450.580.720.72
M (%)27.5028.7527.5025.0024.7524.75
I (mm/h)84.3482.6484.3484.5285.0685.06
IPDP0.460.430.450.580.720.72
D (h)0.660.700.660.610.460.50
I (mm/h)82.0880.2682.2880.8485.5682.45
Table 8. Prediction results of critical rainfall of the debris flow gully in the Laomao Mountain area based on the HIMM model.
Main GullyDongmatunMatunZhangjiacunHepingZhuanshanTaiyang
C (kPa)121312111010
ρ (g/cm3)1.651.781.921.871.781.85
ρw (g/cm3)111111
θ (°)1098976
φ (°)21.220.316.815.715.119.4
h (m)2.11.81.21.40.61.1
h0 (m)5.15.55.35.24.44.3
B (m)223532312920
V (m/s)3.983.283.242.232.72.23
Q (m3/s)446.2627.1552.3358.5343.9193.6
F (km2)19.228.22215.813.17.5
R (mm)83.780.190.481.794.592.9
I60 + Pa (mm)163.7160.1170.4161.7174.5172.9
I60 (mm)83.780.190.481.794.592.9
Table 9. Validation of critical rainfall prediction results.
Main GullyDongmatunMatunZhangjiacunHepingZhuanshanTaiyang
ID model PCR (mm)22.5622.5622.5622.5622.5622.56
1981AMR(mm)116.5116.5116.5116.5116.5116.5
PCR(mm)IPM84.3482.6484.3484.5285.0685.06
IPD82.0880.2682.2880.8485.5682.45
HIMM83.780.190.481.794.592.9
Triggered(Y/N)YYYYYY
2001AMR(mm)52.252.252.252.252.252.2
PCR(mm)IPM84.3482.6484.3484.5285.0685.06
IPD82.0880.2682.2880.8485.5682.45
HIMM83.780.190.481.794.592.9
Triggered(Y/N)NNNNNN
2003AMR(mm)626262626262
PCR(mm)IPM84.3482.6484.3484.5285.0685.06
IPD82.0880.2682.2880.8485.5682.45
HIMM83.780.190.481.794.592.9
Triggered(Y/N)NNNNNN
2010AMR(mm)55.455.455.455.455.455.4
PCR(mm)IPM84.3482.6484.3484.5285.0685.06
IPD82.0880.2682.2880.8485.5682.45
HIMM83.780.190.481.794.592.9
Triggered(Y/N)NNNNNN
2013AMR(mm)75.175.175.175.175.175.1
PCR(mm)IPM84.3482.6484.3484.5285.0685.06
IPD82.0880.2682.2880.8485.5682.45
HIMM83.780.190.481.794.592.9
Triggered(Y/N)NNNNNN
Publisher’s Note: MDPI stays neutral with regard to jurisdictional claims in published maps and institutional affiliations.

