Article

Using Remote Sensing and Multivariate Statistics in Analyzing the Relationship between Land Use Pattern and Water Quality in Tien Giang Province, Vietnam

by
Nguyen Thanh Giao
*,
Nguyen Van Cong
and
Huynh Thi Hong Nhien
College of Environment and Natural Resources, Can Tho University, Can Tho 900000, Vietnam
*
Author to whom correspondence should be addressed.
Water 2021, 13(8), 1093; https://doi.org/10.3390/w13081093
Submission received: 6 March 2021 / Revised: 14 April 2021 / Accepted: 14 April 2021 / Published: 15 April 2021
(This article belongs to the Section Hydrology)

Abstract

:
This study was carried out to understand how land use patterns influence surface water quality in Tien Giang Province using remote sensing and statistical approaches. Surface water quality data were collected at 34 locations with the frequency of four times (March, June, September, and November) in 2019. Water quality parameters were used in the analysis, including pH, temperature, electrical conductivity (EC), total suspended solids (TSS), dissolved oxygen (DO), biological oxygen demand (BOD), chemical oxygen demand (COD), ammonium (N-NH4+), nitrite (N-NO2), nitrate (N-NO3), sulfate (SO42−), orthophosphate (P-PO43−), chloride (Cl), total nitrogen (TN), total phosphorus (TP), and coliform. The relationship between land use patterns and water quality was analyzed using geographic information techniques (GIS), remote sensing (RS), statistical approaches (cluster analysis (CA), principal component analysis (PCA), and Krustal–Wallis), and weighted entropy. The results showed water quality was impaired by total suspended solids, nutrients (N-NH4+, N-NO2, P-PO43−), organic matters (BOD, COD), and ions (Cl and SO42−). Kruskal–Wallis analysis results showed that all water quality parameters in the water bodies in Tien Giang Province were seasonally fluctuated, except for BOD and TN. The highest levels of water pollutants were found mostly in the dry season (March and June). The majority of the land in the study area was used for rice cultivation (40.64%) and residential (27.51%). Water quality in the study area was classified into nine groups corresponding to five combined land use patterns comprising residential–aquaculture, residential–rice cultivation, residential–perennials, residential–rice–perennial, and residential–rice–perennial crops–aquacultural. The concentrations of the water pollutants (TSS, DO, BOD, COD, N-NH4+, N-NO2, Cl, and coliform) in the locations with aquaculture land use patterns (Clusters 1 and 2) were significantly larger than those of the remaining land use patterns. PCA analysis presented that most of the current water quality monitoring parameters had a great impact on water quality in the water bodies. The entropy weight showed that TSS, N-NO2, and coliform are the most important water quality parameters due to residential–aquaculture and residential–rice cultivation; EC, DO, N-NH4+, N-NO2, Cl, and coliform were the significant variables for the land use type of residential–perennial crops; N-NO2, P-PO43−, and coliform for the land use pattern of residential–rice cultivation–perennial crops) and N-NH4+, N-NO2, Cl, and coliform for the land use pattern of residential–rice cultivation–perennial crops–aquaculture. The current findings showed that that surface water quality has been influenced by the complex land use patterns in which residential and rice cultivation may have major roles in causing water impairment. The results of the water quality assessment and the variation in water properties of the land use patterns found in this study provide scientific evidence for future water quality management.

1. Introduction

In the Vietnamese Mekong Delta, rivers can be considered as important water resources serving a variety of purposes, including domestic, industrial, service, irrigation, aquaculture, etc. On the other hand, rivers play a crucial role in transporting numerous pollutants originated from human and natural activities [1]. Therefore, information on river water quality and influencing factors is essential to form an effective water management system. In recent years, factors affecting water quality such as land use/land cover, human activities, topographical characteristics, climate, and other natural processes [2] have become the concern of water resources managers [3,4,5].
In water quality monitoring in Vietnam, the water quality index (WQI) is frequently used to examine changes in water quality; however, this indicator cannot prove sources of water pollution because the index is calculated by normalizing the analytical values [6]. Moreover, most of the approaches to understanding surface-water-polluting sources in Vietnam are mainly based on the results of field surveys and interviews. Meanwhile, there have been several studies of the methods applied to assess and identify sources of water quality fluctuations [7,8,9,10,11,12]. Typically, land use and soil type can be particularly useful in explaining the relationship between water quality and environmental characteristics in the study area. This can be explained by the fact that land use and soil type have a direct impact on the permeation and dispersion rates of pollutants causing fluctuations in water quality [13]. Several recent studies have also shown that different land use patterns can influence the extent and causes of water pollution, the timing of water quality, and the balance of the ecosystems in water bodies [14,15,16]. However, the relationships between land use and water quality are not always consistent, depending on nature- and human-related activities in water bodies [17,18]. Therefore, prediction of potential sources and contaminants of surface water should be performed using multivariate statistical methods. Among the multivariate statistical methods, principal component analysis (PCA) and cluster analysis (CA) have been successfully used in the previous studies for the identification of key water contaminants, potential polluting sources, and classification of water quality [19,20,21].
Socioeconomic development in Tien Giang Province heavily depends on agriculture, which could lead to negative changes in water quality if water management policies are improperly incorporated into the development strategies. Therefore, reliable information on water quality characteristics is needed for the effective management of water resources. However, available information on the relationship between land use and surface water quality in the water bodies in Tien Giang Province is still limited. Therefore, the main objectives of this study are (1) to characterize surface water quality in the water bodies in Tien Giang Province; (2) to analyze the relationship between land use patterns and water quality; and (3) to identify important water quality parameters and potential sources of pollution influencing on surface water quality in the study area. The findings from the current study provide useful information for effective water quality management in Tien Giang Province and in Vietnam.

2. Materials and Methods
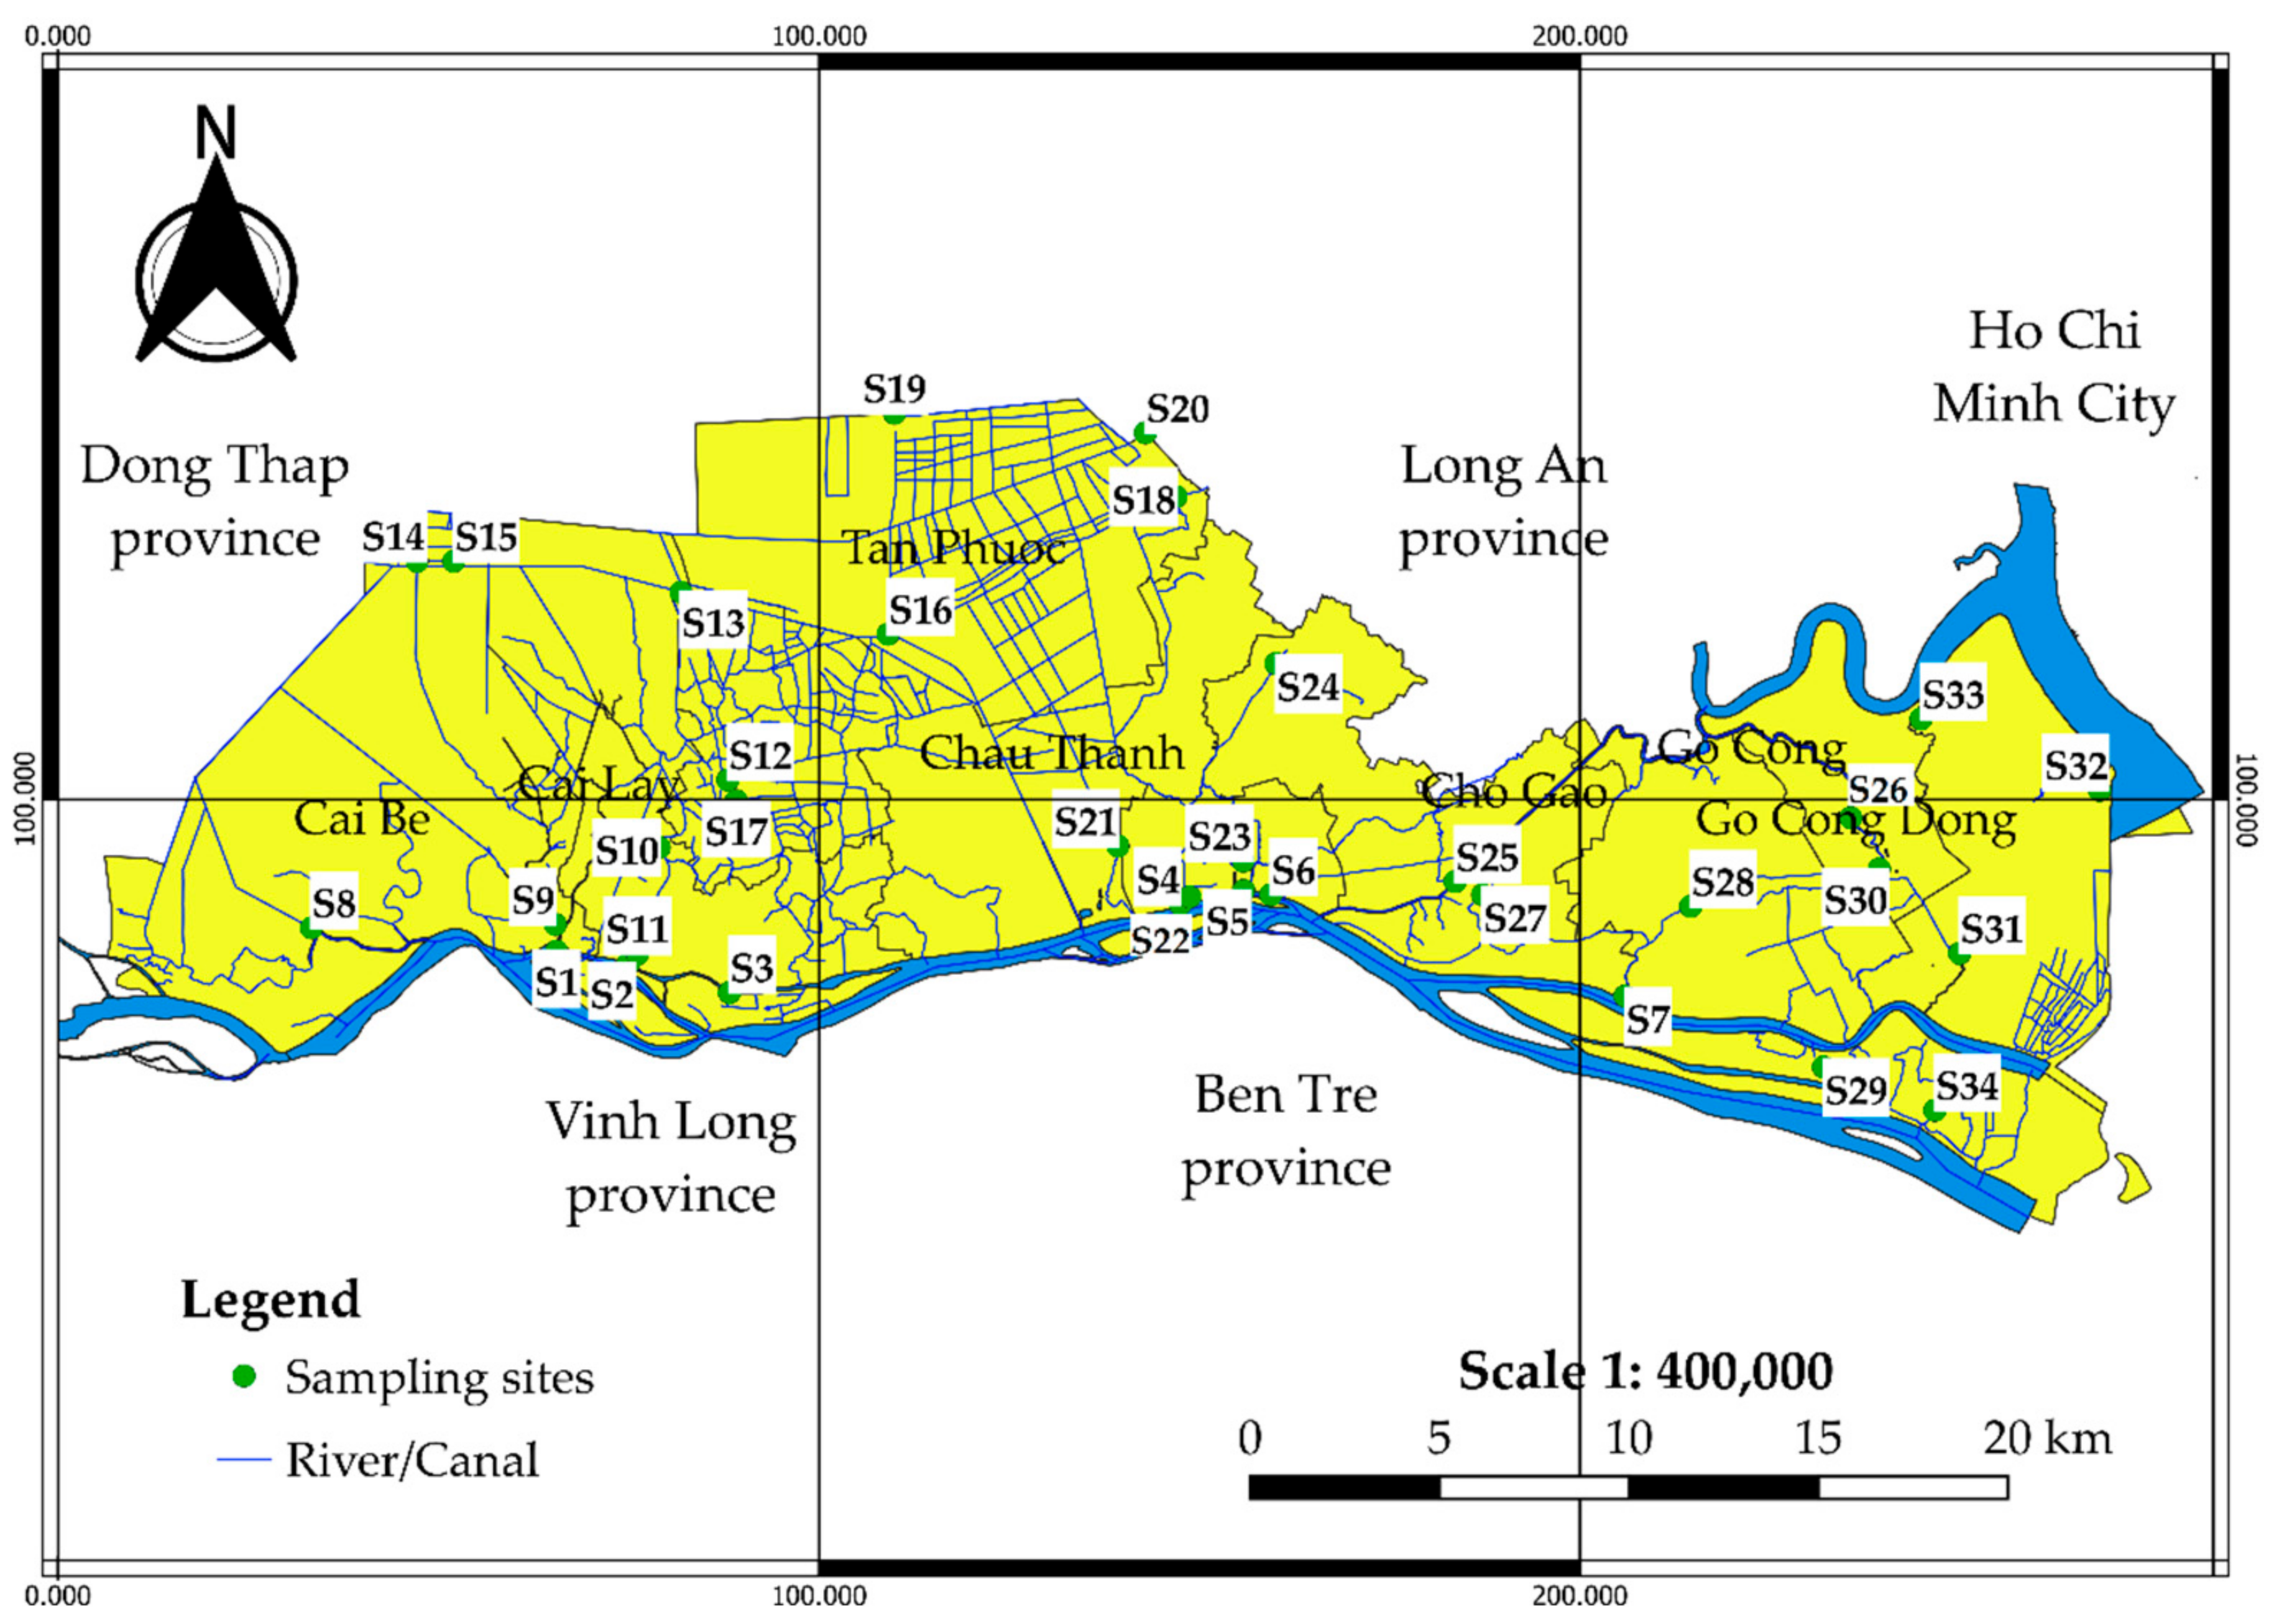
2.1. The Study Area

The study was conducted in Tien Giang, a coastal province in the Vietnamese Mekong Delta, with a coastline of 32 km long. The study area is a province located along the Tien River and is also the end of the flow of the Mekong River before it flows into the East Sea. The area is about 2510.5 km2. The province has a flat terrain with a slope <1% (West to East) and the elevation ranges from 0 to 1.6 m above sea level (0.8–1.1 m) [22]. In particular, the alluvial soil area accounts for 53% of the total area, accounting for most of the areas in Cai Be, Cai Lay, Chau Thanh, Cho Gao, My Tho, and a part of Go Cong Tay District belonging to the areas with freshwater sources. Regarding the soil, approximately 19.4% of the study area is the acid sulfate soil group distributed in the districts of Cai Be, Cai Lay, Tan Phuoc; 14.6% is alluvial soil that is salty. Meanwhile, sand dune soil group accounts for about 3%, scattered in the districts of Cai Lay, Chau Thanh, Go Cong Tay, and mostly concentrated in Go Cong Dong District; some other land groups account for about 10%. Annual rainfall varies from 1100 mm to 1400 mm, averaging about 1175 mm. The annual average temperature is about 27 °C. In addition, due to its proximity to the sea, this makes river basins in Tien Giang Province (coastal rivers) vulnerable to climate change hazards, particularly sea-level rise [22]. The speed of tidal transmission in estuaries is about 30 km h−1 (1.5 times higher than that of the Hau River). This may have caused salinity intrusion in some water bodies near the sea, with water backflow from the sea to the river about 1.2 m s−1. Typically, some areas are likely to be salty in Tien Giang Province, including the districts of Tan Phu Dong, Go Cong Dong, Go Cong Tay, Cho Gao, the town of Go Cong, and the city of My Tho. Therefore, monitoring of water quality in the study area has been of interest to the locality and researchers.

2.2. Water Sampling and Analysis

The water samples were collected periodically every three months (four times per year comprising March, June, September, and November in 2019) at 34 monitoring locations (Figure 1). Surface water quality data were collected from the Department of Natural Resources and Environment of Tien Giang Province. The monitoring locations were in Cai Be District (S1, S8, S9, S14, S15) and Cai Lay District (S2, S3, S10, S11, S12, S13), Tan Phuoc District (S16, S17, S18, S19, S20), My Tho City (S4, S5, S6, S22, S23, Chau Thanh District (S21, S24) and Cho Gao District (S25, S27), Go Cong town area (S30), Go Cong Tay District (S7, S26, S28), Go Cong Dong District (S31, S32, S33), and Tan Phu Dong District (S29, S34). Water samples were quality controlled (collected, transported, and stored) according to the instructions in ISO 5667-6: 2014, TCVN 6663-3: 2016 (ISO 5667-3: 2012) [23,24]. The map of the sampling locations is demonstrated in Figure 1. Each water sample was mixed from three separate water samples at midstream locations, away from two river banks; the collected samples were 30–50 cm below the surface of the water. Water quality parameters including pH, temperature (°C), electrical conductivity (EC, μS cm−1), total suspended solids (TSS, mg L−1), dissolved oxygen (DO, mg L−1), biological oxygen demand (BOD, mg L−1), chemical oxygen demand (COD, mg L−1), ammonium (N-NH4+, mg L−1), nitrite (N-NO2, mg L−1), nitrate (N-NO3, mg L−1), sulfate (SO42−, mg L−1), orthophosphate (P-PO43−, mg L−1), chloride (Cl, mg L−1), total nitrogen (TN, mg L−1), total phosphorus (TP, mg L−1), and coliform (MPN 100mL−1). All analyzes were repeated three times to ensure the representativeness of quantitative results. The pH, temperature, and DO were measured in situ, using a portable pH meter (pH HQ 11D–Hach) and DO meter (HANNA HI9146–Hanna, Romania). The remaining parameters were analyzed according to standard methods [25], such as TSS (SMEWW 2540D:2012), BOD (SMEWW 5210B:2012), COD (SMEWW 5220C:2012), N-NH4+ (US EPA Method 350.2), N-NO2 (SMEWW 4500-NO2-B:2012), N-NO3 (SMEWW 4500-NO3-E:2012), SO42− (SMEWW 4500-SO42−-E:2012), P-PO43− (SMEWW 4500-PO43−-E:2012), Cl (SMEWW 4500G:2012), TN (SMEWW 4500-N:2012), TP (SMEWW 4500-P-E:2012), and coliform (multiple-tube method).

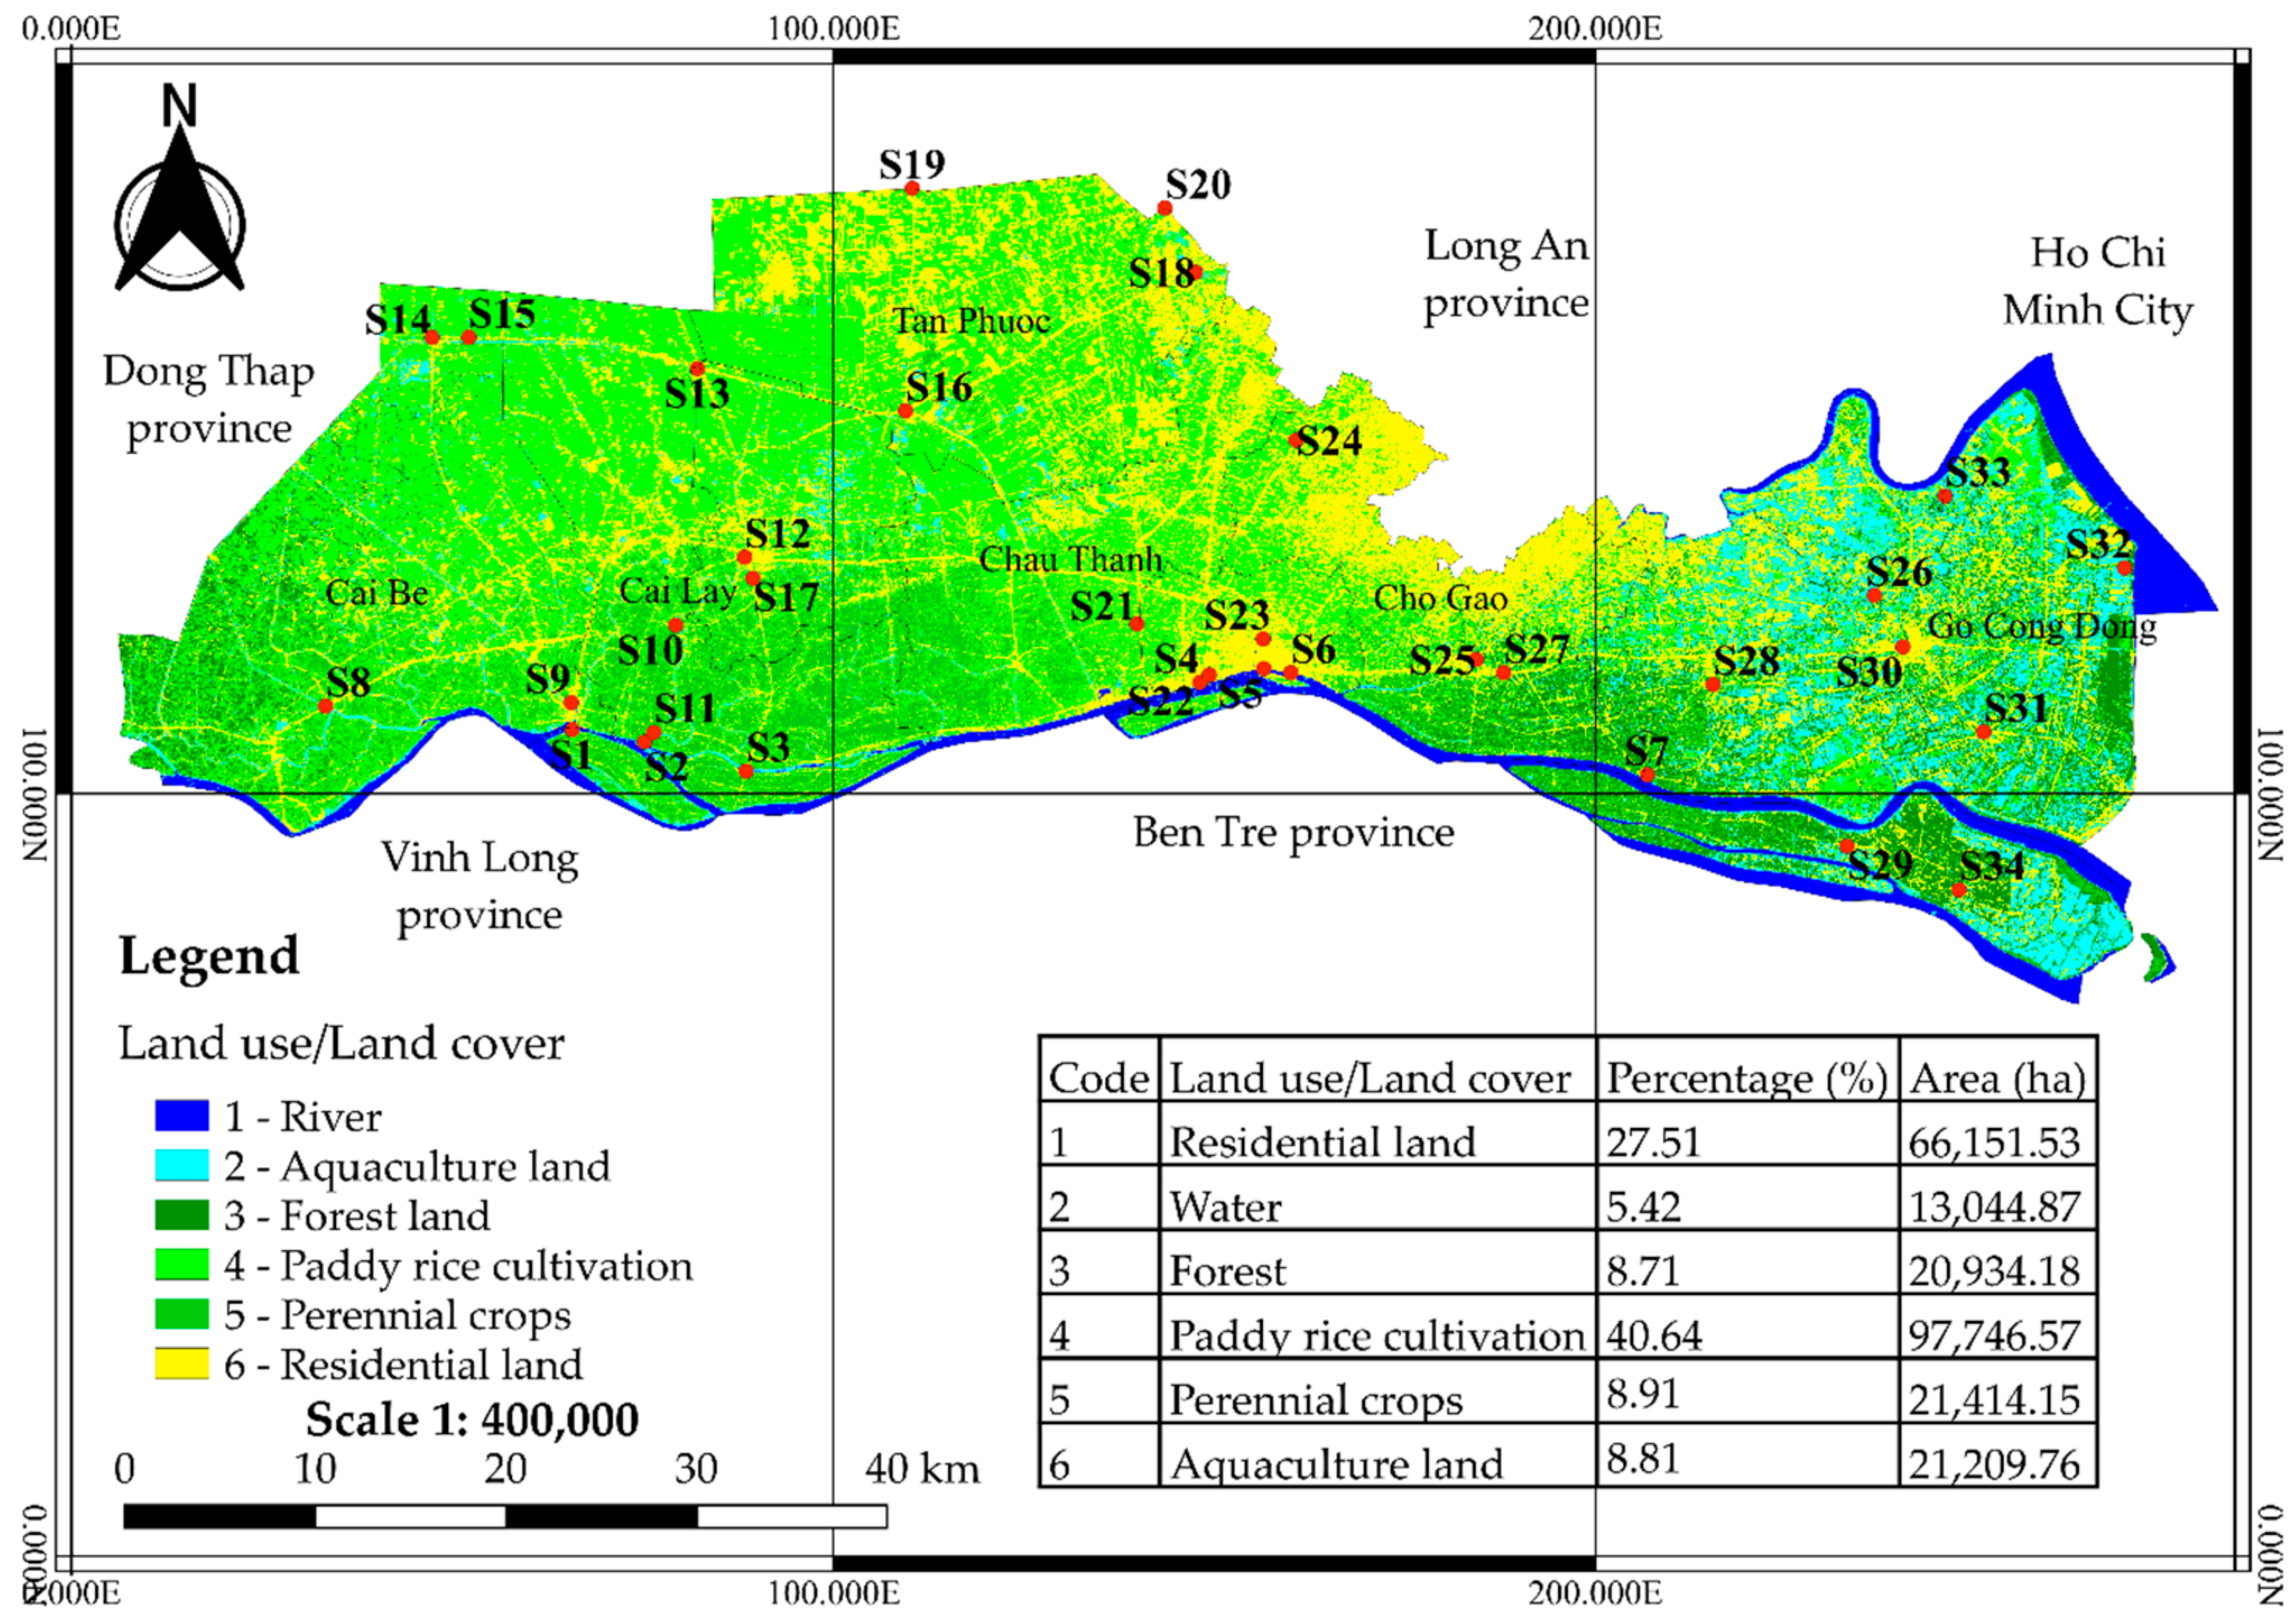
2.3. Land Use/Land Cover Classification

Land use/land cover data for the study area were extracted from remote sensing images using the QGIS 3.16 classification method (https://qgis.org/en/site/forusers/download.html, accessed on 16 December 2020) [26]. The study collected Landsat 8 images with a spatial resolution of 30 × 30 m from the available United States Geological Survey (USGS) database (https://earthexplorer.usgs.gov, accessed on 16 December 2020). In addition, the digitization of the map creates geospatial data areas in shapefile format for zoning the study area. After using Google Earth and the land use planning map of Tien Giang Province, the land use/land cover data have been further revised to reflect the current land use status for 2019. Land use/land cover is classified into six main categories, including water bodies, aquaculture land, rice paddy land, perennial cropland, forest land, and residential land.

2.4. Data Processing

2.4.1. Assessment of Surface Water Quality

For the purpose of assessing the statistically significant differences in surface water quality between the observed months, a test was used to check the validity of the dataset. In particular, the Shapiro–Wilk test was performed instead of the Kolmogorov–Smirnov test because the sample size (number of locations) in the study was less than 50 [27]. Then, a one-way ANOVA analysis was used to evaluate a statistically significant difference if the dataset had a normal distribution (significance level greater than 0.05); on the contrary, if the dataset did not have a normal distribution, then a Kruskal–Wallis (hierarchical one-way ANOVA) analysis was performed. Kruskal–Wallis is described as an alternative nonparametric test for ANOVA analysis. The results were presented in tabular form with the values including mean ± standard deviation (SD) and the notations of the difference with a confidence level of 95%.

2.4.2. Assessment of Surface Water Quality

In this study, cluster analysis (CA) was used to consider whether the water quality monitoring sites can be spatially grouped based on the similarity of water quality characteristics or not. This analysis was performed using Euclidean distance as a measure of similarity/dissimilarity [28]. Specifically, the clusters with the highest similarity would be grouped first, which means that the Euclidean distance is the lowest. Similarly, the similarity level of the clusters would decrease, and eventually, all clusters would be combined into a single cluster. The number of clusters in the study was determined by examining the results of the dendrogram, specifying the ratio of the quotient between the bonding distance of a particular cluster, and the maximum bonding distance ((Dlink/Dmax) × 100 < 60) was considered significant [1]. Each cluster shows its own water quality; in addition, CA analysis could be based on any number of variables, and these variables could be of any type.
Principal component analysis (PCA) was used to identify factors or sources of variation in surface water quality in the study area, in which eigenvalues was used as a measure of change and was explained by each PC [29]; the PCs were selected when eigenvalue coefficients were greater than 1 [30]. The contribution and importance of the initial parameters are shown in the PC through the weighting factors (loading). Furthermore, water samples affected by different sources and processes would have different water quality, which was indicated by a variety of water quality parameters. Therefore, sources of pollution were determined based on the weighting coefficient of water quality parameters in the main components [31]. The higher the weighting coefficient was, the greater the influence [32]. According to research by Liu et al. (2003) [33], loading factors were classified as “strong,” “medium,” and “weak,” with absolute loading values of >0.75, 0.75–0.50, and 0.50–0.30, respectively. In addition, the entropy weight calculation of the surface water quality parameters in each cluster was carried out for a specific analysis in determining the main parameters of the areas affected by land use/land cover.
The weighted entropy was calculated as follows:
Assume that m was the water quality evaluation parameter, and n was the monitoring position. Rij is the correlation of the ith parameter at position j.
R ij = C ij   C ij   min C ij   max   C ij   min
where Cij is the concentration of the parameter i at the monitoring site j.
In most cases, the data size (number of replicates) for each contaminant is different. Therefore, the data should then be standardized before calculating the informational entropy value. The normalized values of the data and the information entropy were calculated using Equation (2) and Equation (3), respectively.
Standardized data:
p ij = R ij j = 1 n R ij  
where pịj is the standardized data of the parameter i at site j.
The value of informational entropy (Hi):
H i = 1 ln   n × j   =   1 n p ij × ln ( p ij )
Finally, the weighted entropy (wi) were obtained from Equation (4) as follows:
w i = 1   H i m   - i = 1 m H i
All calculations and statistical analysis were performed using Excel version 2016 software (Microsoft Crop., Washington, DC, USA), SPSS version 20 software (IBM Crop., Armonk, NY, USA) and Primer software version 5 (Primer-E Ltd., Plymouth, UK).

3. Results and Discussion

3.1. Water Quality Characteristics of Tien Giang Province in 2019

Table 1 provides information on the mean values and standard deviations of the 16 water quality parameters over four observational periods. The pH value was seasonally changed with a tendency to shift gradually from March (7.2 ± 0.5) to September (7.8 ± 0.6). Climatic characteristics and seawater intrusion into 45–50 km (from the estuary) area of the region can be considered the main cause of pH high in September. On the other hand, the average temperature fluctuated from 29.0 ± 1.4 to 31.2 ± 1.0 °C, which tended to decrease gradually until September and increased again in November. The temperature difference may be partly due to the increase in air temperature in the dry season and decreasing in the rainy season. A previous study showed that any change in land cover, depth, and disturbance of runoff could cause temperature fluctuation [34]. In addition, temperature fluctuation depends on the time of the sampling. However, pH and temperature do not affect physical, chemical, and biological processes in water and are still in a suitable range for aquatic life [35,36].
TSS concentration was usually the lowest in the dry season and the highest in the rainy season [37]. This was also consistent with the fluctuation of TSS in surface water bodies in Tien Giang Province with TSS ranging from 77.7 ± 21.3 to 121.8 ± 50.1 mg L−1. The reported TSS concentration in 2014–2015 ranged from 32.5 to 57.4 mg L−1 [38], which was lower than that found in the current study. The increase in TSS may have led to a number of obstacles in using water for domestic activities and for water treatment. DO and EC values over the survey were in the ranges of 3.2 ± 1.1–4.0 ± 1.2 mg L−1, 432 ± 665.7–992.8 ± 1273.6 μS cm−1, respectively, and DO value tended to be lower than that in the period of 2014–2015 (4.9–5.1 mg L−1) [38,39]. Consequently, water quality was impaired resulting in constraints for the activities of organisms. In contrast to TSS, EC and DO values in March and June were higher than those in September and November, and this was similar to the previous report observing EC and DO in water bodies in Ben Tre [40]. High EC values during March and June can be attributed to lower river water volume and higher temperature facilitating ionization [41]. Furthermore, the high amount of organic matter in water has led to a decline in DO concentration in the water [35,42]. This decrease was evidenced by the relatively high levels of BOD and COD with the values ranged from 8.0 ± 2.7 to 8.9 ± 2.6 mg L−1 and from 14.4 ± 4.8 to 17.3 ± 4.4 mg L−1, respectively. The concentrations of BOD and COD were higher than that of 2014–2015 (7.3–11.0 mg L−1 and 11.6–18.0 mg L−1 for BOD and COD, respectively) [38,39]. There were statistically significant differences between seasons for COD (p < 0.05); however, no significant changes were observed in all four observations of BOD (p > 0.05). Since COD mainly consists of BOD, the variation of COD also has the same time variation as for BOD. COD increased in June and decreased in September, then tended to increase again in November. High levels of BOD and COD in this study indicated that the water bodies were organically polluted.
In this study, the concentrations of N-NH4+, N-NO2, and N-NO3 were in the ranges of 0.3 ± 0.4–0.5 ± 0.5 mg L−1, 0.0 ± 0.0–0.2 ± 0.3 mg L−1, 0.1 ± 0.1–0.4 ± 0.2 mg L−1, respectively. There was seasonal variation, in which nitrogen species increased from March to June and then decreased in November. Variation in nitrogen-derived nutrients may be related to water biology, seasonal, and types of cultivated crops. N-NO3 concentration remained at a safe level, i.e., not harmful to human health, at the pH value of 6.5–8.5 [43]. However, nutrient pollution caused by N-NO2 has been found at a relatively high level [44]. When organic matter content is high, nitrate can be reduced to some degree to nitrite, which could account for the high concentrations of this pollutant during June and September [45]. On the other hand, river phosphate is not toxic to humans, animals, or fish and is a limiting factor in eutrophication [46]. The P-PO43− concentration ranged from 0.1 ± 0.2 to 0.1 ± 0.1 mg L−1, indicating the risk of causing eutrophication in the water bodies in the study area. Meanwhile, TN concentration ranged from 3.1 ± 1.3 to 3.8 ± 1.5 mg L−1, with the highest found in March and the lowest in November. N-NO3 concentration is the main parameter that causes TN concentration in river water changes [47]. However, no significant difference was found for TN (p > 0.05), with the mean concentration ranging from 3.1 ± 1.3 to 3.8 ± 1.5 mg L−1. Similar to the other parameters, TP concentration increased from March (0.1 ± 0.2 mg L−1) to June (0.3 ± 0.2 mg L−1) and then decreased gradually until November (0.14 ± 0.2 mg L−1). This was also reported in the previous study, TP concentrations in the months of the rainy season were higher than those in the dry season [48]; This is a different feature compared to the TN parameter. In general, an excess of nutrient concentration during the study period can affect the growth of aquatic plants, especially algae.
The concentrations of Cl and SO42− ions in September and November (rainy season) were lower than that in the dry season, and there were statistically significant differences between the dry and wet months (p < 0.05). This observed result was found to be similar for electrical conductivity values. The concentrations of Cl and SO42− ions ranged between 86.0 ± 235.7 and 366.4 ± 1104.5 mg L−1, and 39.0 ± 15.4 and 67.6 ± 41.5 mg L−1, respectively. In addition, based on the values of pH, EC, Cl, and SO42− in March, it was shown that the water bodies in Tien Giang Province in 2019 were heavily affected by saline intrusion—this is considered a special case of water pollution and has been reported in many other coastal areas [49]. In addition, the discharge of wastewater could result in an increase in the concentration of these two ions in the water [43]. Cl concentrations in the range below 70 mg L−1 are considered safe; however, Cl can have harmful effects on agriculture if it is higher than 350 mg L−1 [50]. Therefore, Cl concentrations in water bodies in June, September, and November may be unsafe and Cl in March was considered unsuitable for irrigation.
Finally, the coliform density through the observational periods tended to increase gradually until the end of the year (November), ranging from 972.9 ± 718.3 to 2261.2 ± 1349.0 MPN 100 mL−1. According to some previous reports of coliform in the water bodies in Dong Thap, Hau Giang, Can Tho, and Soc Trang, coliform density in the surface water in Tien Giang Province tended to be lower [37,51,52,53]. It can therefore be shown that the water bodies were less likely to be directly affected by domestic wastewater and waste from livestock and humans. Therefore, microbiological pollution may not be the main pollution problem in the water bodies in Tien Giang Province.
In summary, the results of water quality analysis during the four observational periods revealed that the river water quality was polluted at an average level and that it tended to be more seriously polluted in the dry months of March and June. The issues of total suspended solids, nutrients, organic matters, and ions pollution should be monitored regularly. Among the water quality parameters, only BOD and TN did not show a clear difference between observed seasons. On the other hand, the seasonal variation of the remaining parameters has significantly influenced the pollution concentration of rivers.

3.2. Distribution of Land Use Patterns

Satellite imagery was used to analyze different land use patterns by the available knowledge about the study area. The spatial distribution of land use patterns in 2019 is shown in Figure 2. Agricultural cultivation was considered the main activity of Tien Giang Province at the time of the study. As can be seen, most of the area used for rice cultivation accounted for about 97,746.6 ha (approximately 40.6% of the total area), which was distributed mainly in the north and northwest of the province. This was consistent with the soil characteristics in the area; alluvial soil occupied most of the area in Cai Be, Cai Lay, Chau Thanh districts. Meanwhile, perennial crop cultivation was often concentrated along the Tien River basin from west to east with an area of about 8.9%, equivalent to 21,414.2 ha. Agricultural land can be polluted by transporting fine residues, fertilizers, pesticides, etc. [54]. In addition, in the coastal area land (east and southeast of the province) with reflectance factor used for aquaculture accounts for 21,209.8 ha (about 8.8% of the total area, distributed mainly in Tan Phu Dong and Go Cong Dong District). According to the socioeconomic report of the People’s Committee of Tan Phu Dong District in 2019, this land was mainly used for shrimp farming and rice–shrimp cultivation. Residential land was the second highest with 66,151.5 ha (27.5%); residential areas were mainly concentrated around cities in the region and contiguous areas of Long An Province. Residential land indicated that this was an adverse factor for water quality due to the lack of wastewater treatment systems and impervious surfaces comprising the majority of the area [13,55]. The total area for forest land and water bodies was about 20,934.2 ha and 13,044.9 ha, respectively, accounting for 8.7% and 5.4% of the area. Forests were concentrated mainly in the Tan Phu Dong District. Forest land plays important role in the hydrological process by water permeation and reducing both surface runoff and soil erosion [13,56,57].

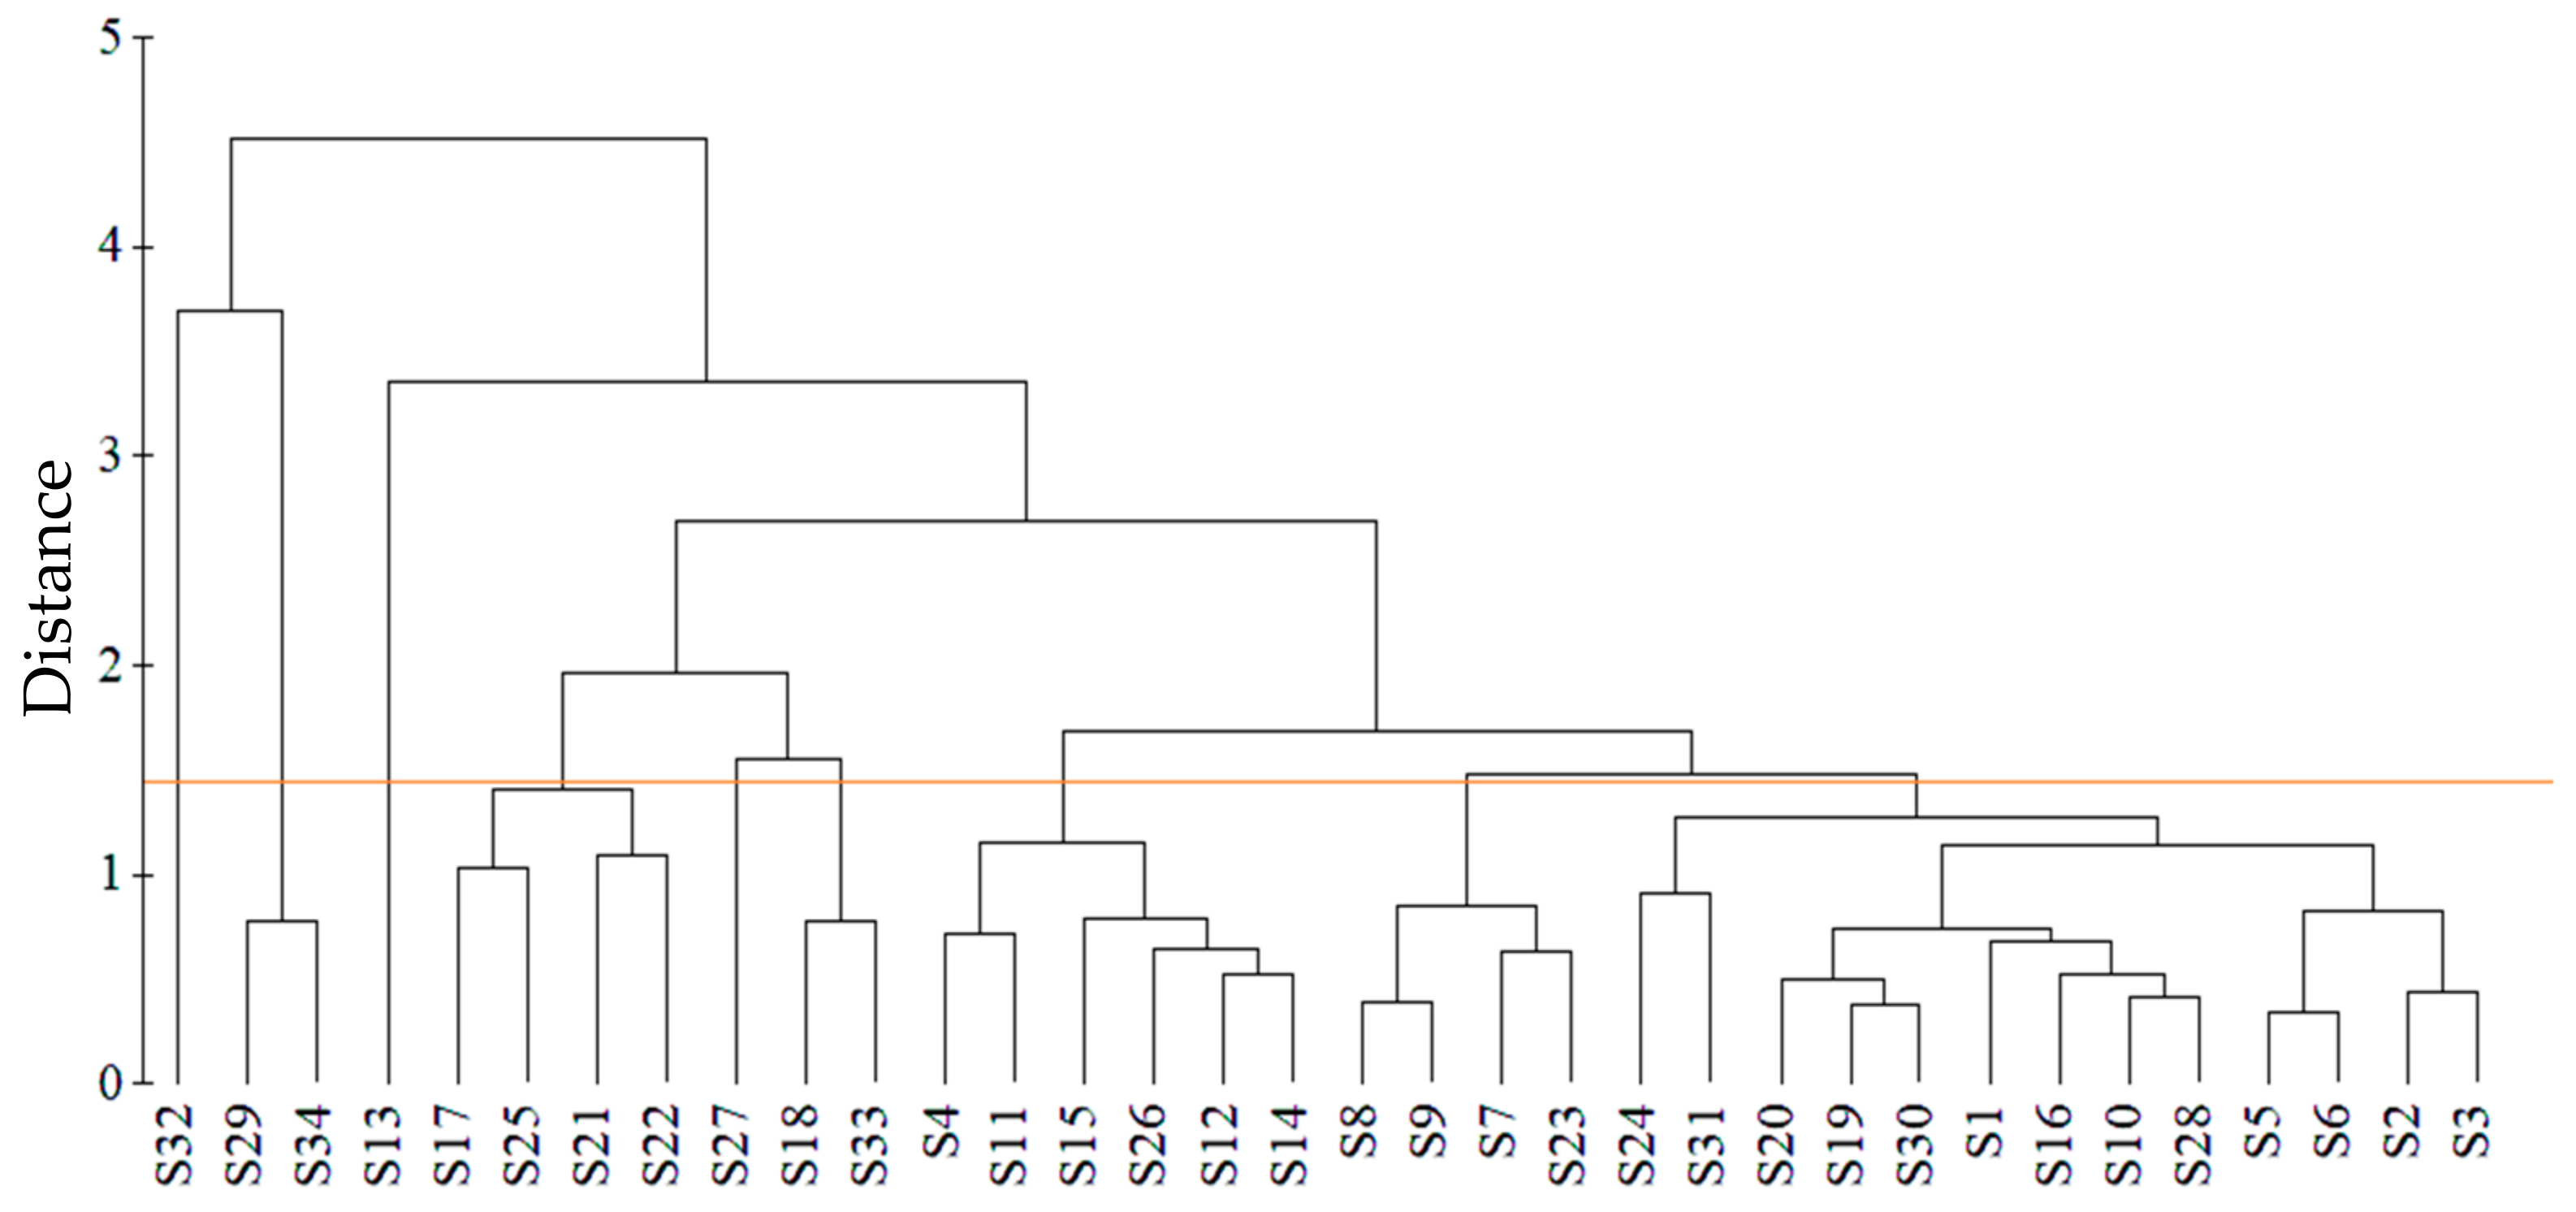
3.3. Clustering Surface Water Quality in Tien Giang Province

Figure 3 shows that 34 sampling sites in the study area were divided into nine clusters with Euclidean distances less than 2. In addition, the mean values of water quality parameters at each cluster are presented in Table 2 for comparing and evaluating water quality between clusters.
The results from Figure 3 indicate that the Euclidean distance between Cluster 1 and Cluster 2, compared to the other clusters, also showed a significant difference in water quality between the locations of Cluster 1 and Cluster 2. This can be seen at the positions S29, S32, and S34, which are located near the sea and affected by the tidal regime and great seawater encroachment. In addition, these locations belong to the large concentration of aquaculture of the province. The results of the water quality assessment show that the locations in Cluster 1 and Cluster 2 had water quality considered the most polluted, including pollution of organic matters, nutrients, microorganisms, ions). Electrical conductivity and Cl were major parameters distinguishing the water quality of Cluster 1 and Cluster 2 from the other clusters. Specifically, values of EC and Cl at the positions of Cluster 1 (EC: 1394.5 μS cm−1, Cl: 430.4 mg L−1) and Cluster 2 (EC: 2915.0 μS cm−1, Cl: 2332.1 mg L−1) (Table 2) were much higher than those in the other positions. The average values per year of EC and Cl at the sampling sites were calculated from four observations before the mean values of parameters were calculated in the cluster; therefore, the seasonal variation of these parameters has also partly affected the results of water quality classification in CA, especially for locations located near the sea such as in Cluster 1 and Cluster 2. Moreover, the difference of EC was not the exception for the possibility that there was a difference in the geological composition, different humidity of the water body [58], the types of mud and clay are abundant of soluble ions. As can be inferred from Table 2, the concentration of nutrients derived from nitrogen is an important factor in eutrophication occurring in coastal waters, while phosphorus has been found in freshwater bodies. This result has also been reported in previous research that nitrogen is the primary cause of eutrophication in many coastal ecosystems [59]. Moreover, coliform densities in the Cluster 1 and Cluster 2 were found at high density, with values of 2170 MPN 100 mL−1, 3366.7 MPN 100 mL−1, respectively.
Meanwhile, Cluster 3 covered only one site (S13), where there was a major surface cover of the residential and rice cultivation with a high concentration of organic substances and nutrients derived from nitrogen. For Cluster 4 and Cluster 5, positions S17, S21, S22, S25, and S27, respectively, were included. Both Cluster 4 and Cluster 5 were identified on perennial farmland and surrounded by residential areas, where fewer nitrogen fertilizers were applied. Therefore, in contrast to Cluster 3, water quality characteristics in these clusters were determined to have a lower concentration of nitrogen-containing wastes, mainly phosphorus-derived nutrients. This was consistent with the fact that in the Vietnamese Mekong Delta, compared with rice cultivation, the amount of fertilizer used for fruit/perennial crop cultivation was assessed at a higher level, and farmers overuse phosphorus but lack nitrogen and potassium. In addition, the tradition of perennial crop cultivation in the highlands of the Mekong Delta, where rainwater can easily wash away many nutrients. Therefore, weather problems are also a part of the reason for the water quality classification results of Clusters 4 and 5. Moreover, the locations in Clusters 4 and 5 were located far away from the main river system (Tien River), thus limiting drainage capacity in the rainy season.
Cluster 6 consisted of the sites S18 and S33, which were located on the edge or perimeter of the study area and were mainly surrounded by rice farming and residential area. Therefore, organic matter pollution has also been recorded at these sites. Cluster 7 included the positions S4, S11, S12, S14, S15, and S26, while Cluster 8 included the positions S7, S8, S9, and S23. Clusters 7 and 8 were nearly the same but differ in the pollution levels, and both were mainly represented by residential land and agricultural (rice and perennial) land. Finally, the remaining sites were grouped together into one cluster (Cluster 9), which was a cluster representing all different land uses. However, the water quality in this cluster had a relatively low level of pollution. These locations were located near and along the Tien River, which accounted for the high dilution and self-cleaning ability of the water source.

3.4. Identification of Critical Water Parameters and Potential Sources of Water Variation

PCA analysis was performed using 16 water quality parameters at 34 monitoring locations with the values of the average of four sampling periods; the analytical results are shown in Table 3. From Table 3, it can be seen that the values of EC, COD, BOD, N-NH4+, and coliform negatively correlated with the component PC1, which has eigenvalue coefficient and the percentage of variance of 4.63 and 29.0%, respectively. These parameters may be closely related to the runoff from fertilized farmland and domestic wastes. Component PC2 had eigenvalues of 2.59, and the percentage of variance was 16.2%, which negatively correlated with the surface water parameters such as EC, DO, Cl and positively correlated with TSS, N-NO2, and TP. This PC2 reflected the effects of seasonal variation, saline intrusion by electrical conductivity, and Cl in water, which was the parameter directly related to total dissolved salts [61,62]. Meanwhile, TSS may be related to land use conversion, weather conditions (rain) and soil erosion, and sedimentation of basins [63]. Furthermore, the evaluation results in Section 3.1 and the PCA analysis have shown that EC, TSS, and Cl parameters can be considered the three most markedly seasonal variations of water bodies in Tien Giang Province. Due to the important role of water regimes in the rainy season (rainfall accounting for 90% of the annual rainfall and water flow from upstream) and dry season (water flow from upstream), which affected the concentration of dissolved salts in the water. In addition, at lower DO levels, the denitrification reaction can promote the formation of N-NO2. This may be the reason why N-NO2 and DO showed a negative correlation in PC2.
pH was found to have a negative correlation with P-PO43− and TP in the PC3. In contrast, pH, and TN were negatively correlated in PC6 with the Eigenvalues values, and the percentage of variance was 1.02 and 6.4%, respectively. In parallel, PC5 also correlated with nutrient-related sources of pollution (N-NO3 and TP). Furthermore, the correlation parameters with PC4 included pH, N-NH4+, N-NO2, N-NO3, and SO42−; these PCs can be predicted to be affected by agriculture and aquatic wastewater with 38.4% variation of the physicochemical composition explained. Aquatic wastewater contains many organic substances such as organic carbon, uric acid, and nutrients such as nitrogen and phosphorus. These compounds were derived from fertilizers, antibiotics, uneaten food, and metabolism converted to dissolved organic matter and nutrients [64]. Additionally, agriculture has previously been identified as one of the main sources of nitrogen (N) and phosphorus (P) contributing to water pollution; about 82% of the articles were related [57,65]. PCA analysis showed that all parameters could cause pollution of river water quality; however, the importance of the parameters at different land use patterns was not specified. Therefore, a method to calculate the weights of each parameter for different land use/land cover types has been performed in the next section of this study. This calculation confirmed the specificity and scientificity of the PCA analysis in the study. This was because each type of land use/land cover could induce a different pollutant concentration and parameter [66].
According to the land use pattern distribution map and CA analysis (Figure 2 and Figure 3), the sites in Cluster 1 and Cluster 2 were distributed in the water bodies with a high aquaculture land use pattern, while Cluster 4 and Cluster 5 were located in the water bodies with high population and perennial crop cultivation. Similarly, Cluster 3 and Cluster 6 were suggested to be the water bodies mainly affected by residential area–rice cultivation; Clusters 7 and 8 were the residential area–cultivating rice and perennial crops. Finally, the positions in Cluster 9 were affected by all of the mentioned land use patterns. Therefore, the computation of entropy weights at each land use type is divided into five water body sectors with different impact factors.
In this study, TSS, N-NO2, and coliforms had the highest levels of pollution in the use of residential land–aquaculture; this result was similarly noted in the previous study in aquacultural areas in An Giang [67]. However, for residential land use–rice cultivation, the number, and importance of polluting parameters tended to increase, including TSS, N-NO2, TP, and coliform. This has been reported in previous research [66]. Furthermore, Table 4 shows the great influence of residential land–perennial crop cultivation on water quality by the parameters EC, DO, N-NH4+, N-NO2, Cl, and coliform. The high degree of EC influence on this type of land use was consistent with the other studies reporting that perennial and residential (urban and rural) land were the two main land use types causing the increase in this parameter [16], which is considered to be the most polluting places for water quality [16]. However, the rating was in contrast to the average values of the parameters at Clusters 4 and 5; This difference may be due to the fact that the land used for perennial crops was not large enough. It was shown that the popularity of the usage pattern also greatly influenced the variation in water quality. The study has also found that the mixed land use pattern of residential, rice cultivation, and perennial crops can significantly affect N-NO2, P-PO43−, and TP. This type of land use has been identified as a major contributor to the increase in nutrients in the water and has been reported in several studies [16,68]. The highest levels of coliform importance were found in the mixed land use pattern that combined all activities of residential, rice farming, perennial, aquaculture. N-NH4+, N-NO2, and Cl were the next most important parameters for quality variation in the study area with the complex socioeconomic activities. Temperature, pH, SO42−, N-NO3, and TN did not show a high degree of importance in the water bodies for different soil covers. This result was consistent with the water quality characteristics evaluated in Section 3.1, in which it has been suggested that temperature, pH, SO42−, N-NO3, and TN were still at safe levels. In addition, according to the previous study of Ly and Giao (2018) [69] and Giao (2020) [70], there was also no significant change in temperature and pH between water bodies. In general, the concentration of nitrogen (N-NH4+, N-NO2, and TN) and orthophosphate (P-PO43−, and TP) tended to increase in the areas with a higher density of agricultural and residential land use, suggesting that these high levels may be the cause of wastewater inputs in residential areas and the fertilization of nitrogen and phosphate fertilizers in cultivated areas. In addition, coliform densities were found to be of high importance in most of the residential affected water bodies. Therefore, in order to reduce the impacts of economic activities on water quality, it is necessary to establish a suitable soil cover for each water body that both brings economic and environmental efficiency.

4. Conclusions

The results of the current study show that water quality in the study area was polluted by suspended solids, nutrients, organic matter, and ions. The seasonal change of water quality was indicated by the higher concentrations of water pollutants in the dry season than the wet season, except for TN and BOD. Five major land uses including residential–aquaculture, residential–rice cultivation, residential–perennials, residential rice–perennial, and residential–rice–perennial–aquacultural were identified in Tien Giang Province, in which residential and rice cultivation were the majorities. CA analysis divided the sampling sites in the study areas into nine groups distributed on five land use patterns. Water quality at Cluster 1 and Cluster 2 (the locations with aquaculture land use patterns) was lower than that in the other land use patterns. The PCA analysis results show that five potential water-polluting sources resulting in water quality variation and all the current water quality monitoring variables were significant. The entropy weight calculation results show that TSS, N-NO2, and coliform were the important water parameters in the water bodies within the land use types of residential–aquaculture and residential–rice cultivation; EC, DO, N-NH4+, N-NO2, Cl, and coliform were significant in the residential–perennial land use type. Water quality in the land area of residential–rice cultivation–perennial crops was contaminated by N-NO2, P-PO43−, and coliform. Finally, the parameters of N-NH4+, N-NO2, Cl, and coliform were the main concerns for water quality in mixed land use patterns of residential–rice cultivation–perennial crops–aquaculture. The current results reflect the temporal and spatial variation of surface water quality in various land use patterns in Tien Giang Province, and this information could be very useful for future water quality management.

Author Contributions

Conceptualization, N.T.G. and H.T.H.N.; methodology, N.T.G.; software, H.T.H.N.; validation, N.T.G., H.T.H.N., and N.V.C.; formal analysis, H.T.H.N.; investigation, N.V.C.; resources, N.T.G.; data curation, N.T.G.; writing—original draft preparation, H.T.H.N. and N.V.C.; writing—review and editing, N.T.G. and N.V.C.; visualization, H.T.H.N.; supervision, N.T.G.; project administration, N.T.G. All authors have read and agreed to the published version of the manuscript.

Funding

This research received no external funding.

Institutional Review Board Statement

Not Applicable.

Informed Consent Statement

Not Applicable.

Data Availability Statement

Not Applicable.

Acknowledgments

The authors would like to thank the Department of Natural Resources and Environment Tien Giang Province for providing water monitoring data. All opinions expressed in this paper represent the scientific and personal views of the authors and do not necessarily reflect the views of the data provider.

Conflicts of Interest

The authors declare no conflict of interest.

References

  1. Herojeet, R.; Rishi, M.S.; Lata, R.; Dolma, K. Quality characterization and pollution source identification of surface water using multivariate statistical techniques, Nalagarh Valley, Himachal Pradesh, India. Appl. Water Sci. 2017, 7, 2137–2156. [Google Scholar] [CrossRef]
  2. Sharma, C.M.; Kang, S.; Tripathee, L.; Paudyal, R.; Sillanpaa, M. Major ions and irrigation water quality assessment of the Nepalese Himalayan rivers. Environ. Dev. Sustain. 2021, 23, 2668–2680. [Google Scholar] [CrossRef]
  3. Amiri, S.; Mazaheri, M.; Samani, J.M.V. Introducing a general framework for pollution source identification in surface water resources (theory and application). J. Environ. Manag. 2019, 248, 109281. [Google Scholar] [CrossRef] [PubMed]
  4. Kuwayama, Y.; Olmstead, S.M.; Wietelman, D.C.; Zheng, J. Trends in nutrient-related pollution as a source of potential water quality damages: A case study of Texas, USA. Sci. Total Environ. 2020, 724, 137962. [Google Scholar] [CrossRef]
  5. Howladar, M.F.; Chakma, E.; Koley, N.J.; Islam, S.; Numanbakth, M.A.A.; Ahmed, Z.; Chowdhury, T.R.l.; Akter, S. The water quality and pollution sources assessment of Surma river, Bangladesh using, hydrochemical, multivariate statistical and water quality index methods. Groundw. Sustain. Dev. 2021, 12, 100523. [Google Scholar] [CrossRef]
  6. Pesce, S.F.; Wunderlin, D.A. Use of water quality indices to verify the impact of Cordoba City (Argentina) on Suquia River. Water Res. 2000, 34, 2915–2926. [Google Scholar] [CrossRef]
  7. Ouyang, Y.; Nkedi-Kizza, P.; Wu, Q.T.; Shinde, D.; Huang, C.H. Assessment of seasonal variations in surface water quality. Water Res. 2006, 40, 3800–3810. [Google Scholar] [CrossRef]
  8. Razmkhah, H.; Abrishamchi, A.; Torkian, A. Evaluation of spatial and temporal variation in water quality by pattern recognition techniques: A case study on Jajrood River (Tehran, Iran). J. Environ. Manag. 2010, 91, 852–860. [Google Scholar] [CrossRef]
  9. Ban, X.; Wu, Q.; Pan, B.; Pan, B.; Du, Y.; Feng, Q. Application of Composite Water Quality Identification Index on the water quality evaluation in spatial and temporal variations: A case study in Honghu Lake, China. Environ. Monit. Assess. 2014, 186, 4237–4247. [Google Scholar] [CrossRef]
  10. Singh, S.K.; Kumar, V.; Kanga, S. Land use/land cover change dynamics and river water quality assessment using geospatial technique: A case study of Harmu River, Ranchi (India). Int. J. Sci. Res. Comput. Sci. Eng. 2017, 5, 17–24. [Google Scholar]
  11. Soltani, A.A.; Bermad, A.; Boutaghane, H.; Oukil, A.; Abdalla, O.; Hasbaia, M.; Oulebsir, R.; Zeroual, S.; Lefkir, A. An integrated approach for assessing surface water quality: Case of Beni Haroun dam (Northeast Algeria). Environ. Monit. Assess. 2020, 192, 630. [Google Scholar] [CrossRef]
  12. Bonansea, M.; Bazan, R.; German, A.; Ferral, A.; Beltramone, G.; Cosavella, A.; Pinotti, L. Assessing land use and land cover change in Los Molinos reservoir watershed and the effect on the reservoir water quality. J. S. Am. Earth Sci. 2021, 108, 103243. [Google Scholar] [CrossRef]
  13. Zavareh, M.; Maggioni, V.; Sokolov, V. Investigating water quality data using principal component analysis and granger causality. Water 2021, 13, 343. [Google Scholar] [CrossRef]
  14. Kim, T.; Kim, Y.; Shin, J.; Go, B.; Cha, Y. Assessing Land-Cover Effects on Stream Water Quality in Metropolitan Areas Using the Water Quality Index. Water 2020, 12, 3294. [Google Scholar] [CrossRef]
  15. Kronvang, B.; Wendland, F.; Kovar, K.; Fraters, D. Land Use and Water Quality. Water 2020, 12, 2412. [Google Scholar] [CrossRef]
  16. Palma, P.; Fialho, S.; Lima, A.; Mourinha, C.; Penha, A.; Novais, M.H.; Rosado, A.; Morais, M.; Potes, M.; Costa, M.J.; et al. Land-cover patterns and hydrogeomorphology of tributaries: Are these important stressors for the water quality of reservoirs in the mediterranean region? Water 2020, 12, 2665. [Google Scholar] [CrossRef]
  17. Tu, J. Spatial variations in the relationships between land use and water quality across an urbanization gradient in the Watersheds of Northern Georgia, USA. Environ. Manag. 2013, 51, 1–17. [Google Scholar] [CrossRef]
  18. Liu, J.; Zhang, X.; Wu, B.; Pan, G.; Xu, J.; Wu, S. Spatial scale and seasonal dependence of land use impacts on riverine water quality in the Huai River basin, China. Environ. Sci. Pollut. Res. 2017, 24, 20995–21010. [Google Scholar] [CrossRef]
  19. Lin, Y.; Han, P.; Huang, Y.; Yuan, G.L.; Guo, X.; Li, J. Source identification of potentially hazardous elements and their relationships with soil properties in agricultural soil of the Pinggu district of Beijing, China: Multivariate statistical analysis and redundancy analysis. J. Geochem. Explor. 2017, 173, 110–118. [Google Scholar] [CrossRef]
  20. Misaghi, F.; Delgosha, F.; Razzaghmanesh, M.; Myers, B. Introducing a water quality index for assessing water for irrigation purposes: A case study of the Ghezel Ozan River. Sci. Total Environ. 2017, 589, 107–116. [Google Scholar] [CrossRef]
  21. Fathi, E.; Zamani-Ahmadmahmoodi, R.; Zare-Bidaki, R. Water quality evaluation using water quality index and multivariate methods, Beheshtabad River, Iran. Appl. Water Sci. 2018, 8, 210. [Google Scholar] [CrossRef] [Green Version]
  22. Thuong, T.V.; Ngoc, P.V.; Hung, D.N. Manifestations of climate change and sea level rise in Tien giang province during the period of 1978–2015. J. Sci. Ho Chi Minh City Univ. Educ. 2016, 9, 188–200. [Google Scholar]
  23. Vietnam Environment Administration (VEA). Guidance on Sampling of Rivers and Streams (TCVN 6663-6:2018); Ministry of Science and Technology: Hanoi, Vietnam, 2018.
  24. Vietnam Environment Administration (VEA). Preservation and Handling of Water Samples; Ministry of Science and Technology: Hanoi, Vietnam, 2018.
  25. APHA; AWWA; WEF. Standard Methods of for the Examination of Water and Wastewater, 22nd ed.; American Public Health Association: Washington, DC, USA, 2012. [Google Scholar]
  26. QGIS Development Team. QGIS Geographic Information System. Open Source Geospatial Foundation Project; QGIS Development Team: Chicago, IL, USA, 2016; Available online: https://qgis.org/en/site/forusers/download.html (accessed on 10 February 2020).
  27. Jureckova, J.; Picek, J. Shapiro-Wilk-type test of normality under nuisance regression and scale. Comput. Stat. Data Anal. 2007, 51, 5184–5191. [Google Scholar] [CrossRef]
  28. Ward, J.H. Ward’s method. J. Am. Stat. Assoc. 1963, 58, 236–246. [Google Scholar] [CrossRef]
  29. Nosrati, K.; Van, D.E.M. Assessment of groundwater quality using multivariate statistical techniques in Hashtgerd Plain, Iran. Environ. Earth Sci. Vol. 2012, 65, 331–344. [Google Scholar] [CrossRef]
  30. Field, A. Discovering Statistics Using SPSS, 3rd ed.; SAGE: London, UK, 2009. [Google Scholar]
  31. Li, Q.; Zhang, H.; Gou, S.; Fu, K.; Liao, L.; Cheng, S. Groundwater pollution source apportionment using principal component analysis in a multiple land-use area in southwestern China. Environ. Sci. Pollut. Res. 2020, 27, 9000–9011. [Google Scholar] [CrossRef] [PubMed]
  32. Felipe-Sotelo, M.; Andrade, J.M.; Carlosena, A.; Tauler, R. Temporal characterisation of river waters in urban and semi-urban areas using physico-chemical parameters and chemometric methods. Anal. Chim. Acta 2007, 583, 128–137. [Google Scholar] [CrossRef] [PubMed]
  33. Liu, C.W.; Lin, K.H.; Kuo, Y.M. Application of factor analysis in the assessment of groundwater quality in a Blackfoot disease area in Taiwan. Sci. Total Environ. 2003, 313, 77–89. [Google Scholar] [CrossRef]
  34. Shamsuddin, M.K.N.; Sulaiman, W.N.N.A.; Ramli, M.F.B.; Kusin, F.M. Geochemical characteristic and water quality index of groundwater and surface water at Lower River Muda Basin, Malaysia. Arab. J. Geosci. 2019, 12, 309. [Google Scholar] [CrossRef]
  35. Kukrer, S.; Mutlu, E. Assessment of surface water quality using water quality index and multivariate statistical analyses in Saraydüzü Dam Lake, Turkey. Environ. Monit. Assess. 2019, 191, 71. [Google Scholar] [CrossRef] [PubMed]
  36. Obiri, S.; Addico, G.; Mohammed, S.; Anku, W.W.; Darko, H.; Collins, O. Water quality assessment of the Tano Basin in Ghana: A multivariate statistical approach. Appl. Water Sci. 2021, 11, 49. [Google Scholar] [CrossRef]
  37. Giao, N.T.; Anh, P.K.; Nhien, H.T.H. Spatiotemporal analysis of surface water quality in Dong Thap province, Vietnam using water quality index and statistical approaches. Water 2021, 13, 336. [Google Scholar] [CrossRef]
  38. Hung, N.Q. Evaluate Changes in Surface Water Quality in a Number of Major Rivers and Canals in Tien Giang Province. Master’s Thesis, Can Tho University, Can Tho, Vietnam, 2016. [Google Scholar]
  39. Dieu, H.T.Q.; Phong, N.H.; Hop, N.V. Study on Tien river water quality assessment. J. Anal. Sci. 2016, 21, 38–48. [Google Scholar]
  40. Yen, T.T.H.; Thai, T.T.; Lam, N.L.Q.; Quang, N.X.; Luu, P.T. The planktonic diatom community structure and the water quality in the Ba Lai and Ham Luong rivers, Ben Tre province. Ho Chi Minh City Univ. Educ. J. Sci. 2018, 15, 144–154. [Google Scholar]
  41. Chikogu, V.; Adamu, I.C.; Vivan, E.L. Public health effects of effluent discharge of kaduna refinery into river Romi. Greener J. Med. Sci. 2012, 2, 64–69. [Google Scholar]
  42. Guettaf, M.; Maoui, A.; Ihdene, Z. Assessment of water quality: A case study of the Seybouse River (North East of Algeria). Appl. Water Sci. 2017, 7, 295–307. [Google Scholar] [CrossRef] [Green Version]
  43. Beshiru, A.; Okareh, O.T.; Chigor, V.N.; Igbinosa, E.O. Assessment of water quality of rivers that serve as water sources for drinking and domestic functions in rural and pre-urban communities in Edo North, Nigeria. Environ. Monit. Assess. 2018, 190, 387. [Google Scholar] [CrossRef]
  44. Vietnam Environmental Protection Agency. National Technical Regulation on Surface Water Quality (QCVN 08-2015/BTNMT); Vietnam Environmental Protection Agency: Hanoi, Vietnam, 2015. [Google Scholar]
  45. Taoufik, G.; Khouni, I.; Ghrabi, A. Assessment of physico-chemical and microbiological surface water quality using multivariate statistical techniques: A case study of the Wadi El-Bey River, Tunisia. Arab. J. Geosci. 2017, 10, 181. [Google Scholar] [CrossRef]
  46. Chadli, K.; Boufala, M. Assessment of water quality using Moroccan WQI and multivariate statistics in the Sebou watershed (Morocco). Arab. J. Geosci. 2021, 14, 27. [Google Scholar] [CrossRef]
  47. Wan, J.; Bu, H.; Zhang, Y.; Meng, W. Classification of rivers based on water quality assessment using factor analysis in Taizi River basin, northeast China. Environ. Earth Sci. 2013, 69, 909–919. [Google Scholar] [CrossRef]
  48. Qin, G.; Liu, J.; Xu, S.; Wang, T. Water quality assessment and pollution source apportionment in a highly regulated river of Northeast China. Environ. Monit. Assess. 2020, 192, 446. [Google Scholar] [CrossRef] [PubMed]
  49. Rahman, M.M.; Hassan, M.Q.; Islam, M.S.; Shamsad, S.Z.K.M. Environmental impact assessment on water quality deterioration caused by the decreased Ganges outflow and saline water intrusion in south-western Bangladesh. Environ. Geol. 2020, 40, 31–40. [Google Scholar] [CrossRef]
  50. Naseem, S.; Hamza, S.; Bashir, E. Groundwater geochemistry of Winder agricultural farms, Balochistan, Pakistan and assessment for irrigation water quality. Eur. Water 2010, 31, 21–32. [Google Scholar]
  51. Tuan, D.D.A.; Thu, B.A.; Trung, N.H. Assessing quality of surface water for urban water supply source for Soc Trang City. Sci. J. Can Tho Univ. 2019, 4A, 61–70. [Google Scholar]
  52. Giao, N.T. Spatial variations of surface water quality in Hau giang province, Vietnam using multivariate statistical techniques. Environ. Nat. Resour. J. 2020, 18, 400–410. [Google Scholar] [CrossRef]
  53. Giao, N.T. Surface water quality at the branches adjacent to Hau river in Can Tho city. Sci. Technol. J. Agric. Rural Dev. 2020, 15, 79–86. [Google Scholar]
  54. Feld, C.; Birk, S.; Eme, D.; Gerisch, M.; Hering, D.; Kernan, M.; Maileht, K.; Mischke, U.; Ott, I.; Pletterbauer, F.; et al. Disentangling the effects of land use and geo-climatic factors on diversity in European freshwater ecosystems. Ecol. Indic. 2016, 60, 71–83. [Google Scholar] [CrossRef] [Green Version]
  55. Hobbie, S.E.; Finlay, J.C.; Benjamin, D.; Nidzgorski, D.A.; Millet, D.B.; Baker, L.A. Contrasting nitrogen and phosphorus budgets in urban watersheds and implications for managing urban water pollution. Proc. Natl. Acad. Sci. USA 2017, 114, 4177–4182. [Google Scholar] [CrossRef] [Green Version]
  56. Chowdhury, M.; Hasan, M.E.; Abdullah-Al-Mamun, M.M. Land use/land cover change assessment of Halda watershed using remote sensing and GIS. Egypt. J. Remote Sens. Space Sci. 2020, 23, 63–75. [Google Scholar] [CrossRef]
  57. Camara, M.; Jamil, N.R.; Abdullah, A.F.B. Impact of land uses on water quality in Malaysia: A review. Ecol. Process. 2019, 8, 10. [Google Scholar] [CrossRef]
  58. Mainali, J.; Chang, H. Environmental and spatial factors affecting surface water quality in a Himalayan watershed, Central Nepal. Indicators 2021, 9, 100096. [Google Scholar]
  59. Robert, W.H.; Mario, R. Nitrogen as the limiting nutrient for eutrophication in coastal marine ecosystems:Evolving views over three decades. Limnol. Oceanogr. 2006, 51, 364–376. [Google Scholar]
  60. Barakat, A.; Baghdadi, M.E.; Rais, J.; Aghezzaf, B.; Slassi, M. Assessment of spatial and seasonal water quality variation of Oum Er Rbia River (Morocco) using multivariate statistical techniques. Int. Soil Water Conserv. Res. 2016, 4, 284–292. [Google Scholar] [CrossRef]
  61. Harilal, C.C.; Hashim, A.; Arun, P.R.; Baji, S. Hydrogeochemistry of two rivers of Kerala with special reference to drinking water quality. Ecol. Environ. Conserv. 2004, 10, 187–192. [Google Scholar]
  62. Neissi, L.; Tishehzan, P.; Albaji, M. Chemical assessment of surface water quality in upstream and downstream of Jare Dam, Khuzestan, Iran. Environ. Earth Sci. 2019, 78, 83. [Google Scholar] [CrossRef]
  63. Ly, K.; Metternicht, G.; Marshall, L. Linking changes in land cover and land use of the lower mekong basin to instream nitrate and total suspended solids variations. Sustainability 2020, 12, 2992. [Google Scholar] [CrossRef] [Green Version]
  64. Wang, X.; Cuthbertson, A.; Gualtieri, C.; Shao, D. A review on mariculture effluent: Characterization and management tools. Water 2020, 12, 2991. [Google Scholar] [CrossRef]
  65. Song, Y.; Song, X.; Shao, G.; Hu, T. Effects of land use on stream water quality in the rapidly urbanized areas: A multiscale analysis. Water 2020, 12, 1123. [Google Scholar] [CrossRef] [Green Version]
  66. Wilson, C.; Weng, Q. Assessing surface water quality and its relation with urban land cover changes in the lake Calumet area, Greater Chicago. Environ. Manag. 2010, 45, 1096–1111. [Google Scholar] [CrossRef]
  67. Giao, N.T. Surface water quality in aquacultural areas in An Giang province, Vietnam. Int. J. Environ. Agric. Biotechnol. 2020, 5, 1054–1061. [Google Scholar] [CrossRef]
  68. Ignatius, A.R.; Rasmussen, T.C. Small reservoir effects on headwater water quality in the rural-urban fringe, Georgia Piedmont, USA. J. Hydrol. Reg. Stud. 2016, 8, 145–161. [Google Scholar] [CrossRef] [Green Version]
  69. Ly, N.H.T.; Giao, N.T. Surface water quality in canals in An Giang province, Viet Nam, from 2009 to 2016. J. Vietnam. Environ. 2018, 10, 113–119. [Google Scholar] [CrossRef]
  70. Giao, N.T. Evaluating current water quality monitoring system on Hau river, Mekong Delta, Vietnam using multivariate statistical techniques. Appl. Environ. Res. 2020, 42, 14–25. [Google Scholar]
Figure 1. Map of the surface water sampling sites in Tien Giang Province.
Water 13 01093 g001
Figure 2. Land use distribution/land cover in Tien Giang in 2019.
Water 13 01093 g002
Figure 3. Clustering surface water quality in Tien Giang Province.
Water 13 01093 g003
Table 1. Characteristics of surface water in Tien Giang Province in 2019.
ParameterUnitMarchJuneSeptemberNovemberAsymp. Sig.Decision
pH-7.2 ± 0.57.5 ± 1.17.8 ± 0.67.8 ± 0.20.0*
Temp°C30.2 ± 0.731.2 ± 1.029.0 ± 1.429.9 ± 0.90.0*
ECμS cm−1540.6 ± 473.1992.8 ± 1273.6405.9 ± 537.0432.0 ± 665.70.0*
TSSmg L−178.9 ± 53.2121.8 ± 50.177.7 ± 21.3103.7 ± 34.70.0*
DOmg L−14.0 ± 1.23.6 ± 1.13.9 ± 0.93.32 ± 1.10.0*
CODmg L−114.4 ± 4.816.6 ± 5.115.4 ± 3.817.3 ± 4.40.0*
BODmg L−18.0 ± 2.78.9 ± 2.68.3 ± 2.48.7 ± 2.10.3
N-NH4+mg L−10.3 ± 0.10.5 ± 0.50.5 ± 0.50.3 ± 0.40.0*
N-NO2mg L−10.1 ± 0.20.2 ± 0.30.0 ± 0.00.2 ± 0.30.0*
N-NO3mg L−10.4 ± 0.20.4 ± 0.20.3 ± 0.10.1 ± 0.10.0*
P-PO43−mg L−10.1 ± 0.20.1 ± 0.10.1 ± 0.10.1 ± 0.10.0*
TNmg L−13.8 ± 1.53.2 ± 1.53.5 ± 1.33.1 ± 1.30.3
TPmg L−10.1 ± 0.20.3 ± 0.20.2 ± 0.10.1 ± 0.20.0*
Clmg L−1366.4 ± 1104.5254.2 ± 641.9118.7 ± 261.986.0 ± 235.70.0*
SO42−mg L−161.9 ± 31.567.6 ± 41.557.4 ± 21.939.0 ± 15.40.0*
ColiformMPN 100 mL−1972.9 ± 718.31556.3 ± 1023.71762.33 ± 790.92261.2 ± 1349.00.0*
* There was seasonal variation, which has a significance level of less than 0.05 (p < 0.05).
Table 2. Water quality in the clusters.
Parameter.Cluster 1Cluster 2Cluster 3Cluster 4Cluster 5Cluster 6Cluster 7Cluster 8Cluster 9QCVN 08-MT (1)
pH7.97.57.57.37.97.57.77.87.56–8.5
Temp30.330.231.029.729.831.530.029.730.1-
EC1394.52915.0494.0456.6892.3991.5340.3258.2358.5-
DO3.15.12.53.73.24.73.44.03.5≥ 6
TSS76.889.9137.387.9124.561.3102.599.695.520
COD23.820.617.813.813.514.815.013.616.710
BOD13.011.410.07.37.58.38.16.88.74
N-NH4+0.80.60.30.50.50.30.40.20.40.3
N-NO20.50.10.70.10.00.10.20.10.10.05
N-NO30.30.20.40.30.30.20.40.30.32
P-PO43−0.10.10.00.10.20.00.20.10.10.1
TN3.83.24.23.14.14.43.63.43.1
TP0.10.10.20.20.20.10.30.20.2
SO42−58.169.8125.264.366.251.865.344.446.12–80 (2)
Cl430.42332.144.592.378.5224.928.226.454.1250
Coliform2170.03366.73150.0928.8847.51275.02355.0766.31413.72500
Notes: (1) Ministry of Environment and Natural Resources (2015) [44], (2) Barakat et al. (2016) [60].
Table 3. Key parameters influencing water quality in Tien Giang Province in 2019.
ParametersPC1PC2PC3PC4PC5PC6
pH0.13−0.060.35−0.35−0.290.46
Temp−0.17−0.10−0.19−0.19−0.640.05
EC−0.32−0.340.230.06−0.02−0.16
DO0.08−0.440.260.03−0.21−0.22
TSS−0.070.390.300.00−0.12−0.12
COD−0.390.060.120.130.120.26
BOD−0.410.040.110.070.010.27
N-NH4+−0.310.13−0.060.470.160.19
N-NO2−0.290.31−0.10−0.330.010.08
N-NO30.120.160.29−0.360.45−0.23
P-PO43−0.160.240.420.20−0.11−0.20
Cl−0.27−0.360.260.080.04−0.23
SO42−−0.280.14−0.11−0.43−0.07−0.24
TN−0.150.24−0.250.18−0.26−0.55
TP0.120.350.330.26−0.350.07
Coliform−0.330.050.29−0.180.07−0.13
Eigenvalues4.632.592.361.521.241.02
%Variation29.016.214.79.57.86.4
Cum. %Var29.045.259.969.477.183.5
Table 4. Entropy weights of water quality parameters for different land use types.
Land UseResidential-
Aquaculture
Residential-Paddy Rice
Cultivation
Residential-Perennial CropsResidential-
Perennial Crops-Paddy Rice
Cultivation
Residential-Perennial Crops-Paddy Rice
Cultivation-
Aquaculture
HiwiHiwiHiwiHiwiHiwi
Temp0.970.040.950.030.980.010.890.050.930.04
pH0.940.060.970.021.000.000.910.041.000.00
EC0.960.040.970.020.800.090.880.060.910.06
DO0.960.040.960.030.440.250.930.030.970.02
BOD50.950.050.960.020.980.010.880.060.910.06
COD0.950.050.970.020.980.010.970.010.940.04
TSS0.860.150.830.110.990.000.970.010.890.07
N-NH4+0.950.060.960.020.750.110.880.060.820.12
N-NO20.920.090.710.180.730.120.680.150.830.11
N-NO30.970.040.970.020.930.030.910.040.980.01
P-PO43−0.970.040.910.050.970.010.640.170.940.04
Cl0.960.040.950.030.640.160.860.070.840.11
SO42−0.960.040.960.030.950.020.940.030.930.05
TN0.960.040.960.030.830.080.920.040.990.01
TP0.950.050.720.180.990.000.780.100.940.04
Coliform0.840.170.680.200.790.090.880.060.690.21
Publisher’s Note: MDPI stays neutral with regard to jurisdictional claims in published maps and institutional affiliations.

