
Land Use and Land Cover Change Assessment in the Context of Flood Hazard in Lagos State, Nigeria


Department of Geology and Geological Engineering, Colorado School of Mines, Golden, CO 80401, USA
*
Author to whom correspondence should be addressed.
Water 2021, 13(8), 1105; https://doi.org/10.3390/w13081105
Submission received: 15 March 2021
/
Revised: 11 April 2021
/
Accepted: 15 April 2021
/
Published: 17 April 2021
(This article belongs to the Section Hydrology)
Abstract
:Incessant flooding is a major hazard in Lagos State, Nigeria, occurring concurrently with increased urbanization and urban expansion rate. Consequently, there is a need for an assessment of Land Use and Land Cover (LULC) changes over time in the context of flood hazard mapping to evaluate the possible causes of flood increment in the State. Four major land cover types (water, wetland, vegetation, and developed) were mapped and analyzed over 35 years in the study area. We introduced a map-matrix-based, post-classification LULC change detection method to estimate multi-year land cover changes between 1986 and 2000, 2000 and 2016, 2016 and 2020, and 1986 and 2020. Seven criteria were identified as potential causative factors responsible for the increasing flood hazards in the study area. Their weights were estimated using a combined (hybrid) Analytical Hierarchy Process (AHP) and Shannon Entropy weighting method. The resulting flood hazard categories were very high, high, moderate, low, and very low hazard levels. Analysis of the LULC change in the context of flood hazard suggests that most changes in LULC result in the conversion of wetland areas into developed areas and unplanned development in very high to moderate flood hazard zones. There was a 69% decrease in wetland and 94% increase in the developed area during the 35 years. While wetland was a primary land cover type in 1986, it became the least land cover type in 2020. These LULC changes could be responsible for the rise in flooding in the State.
1. Introduction
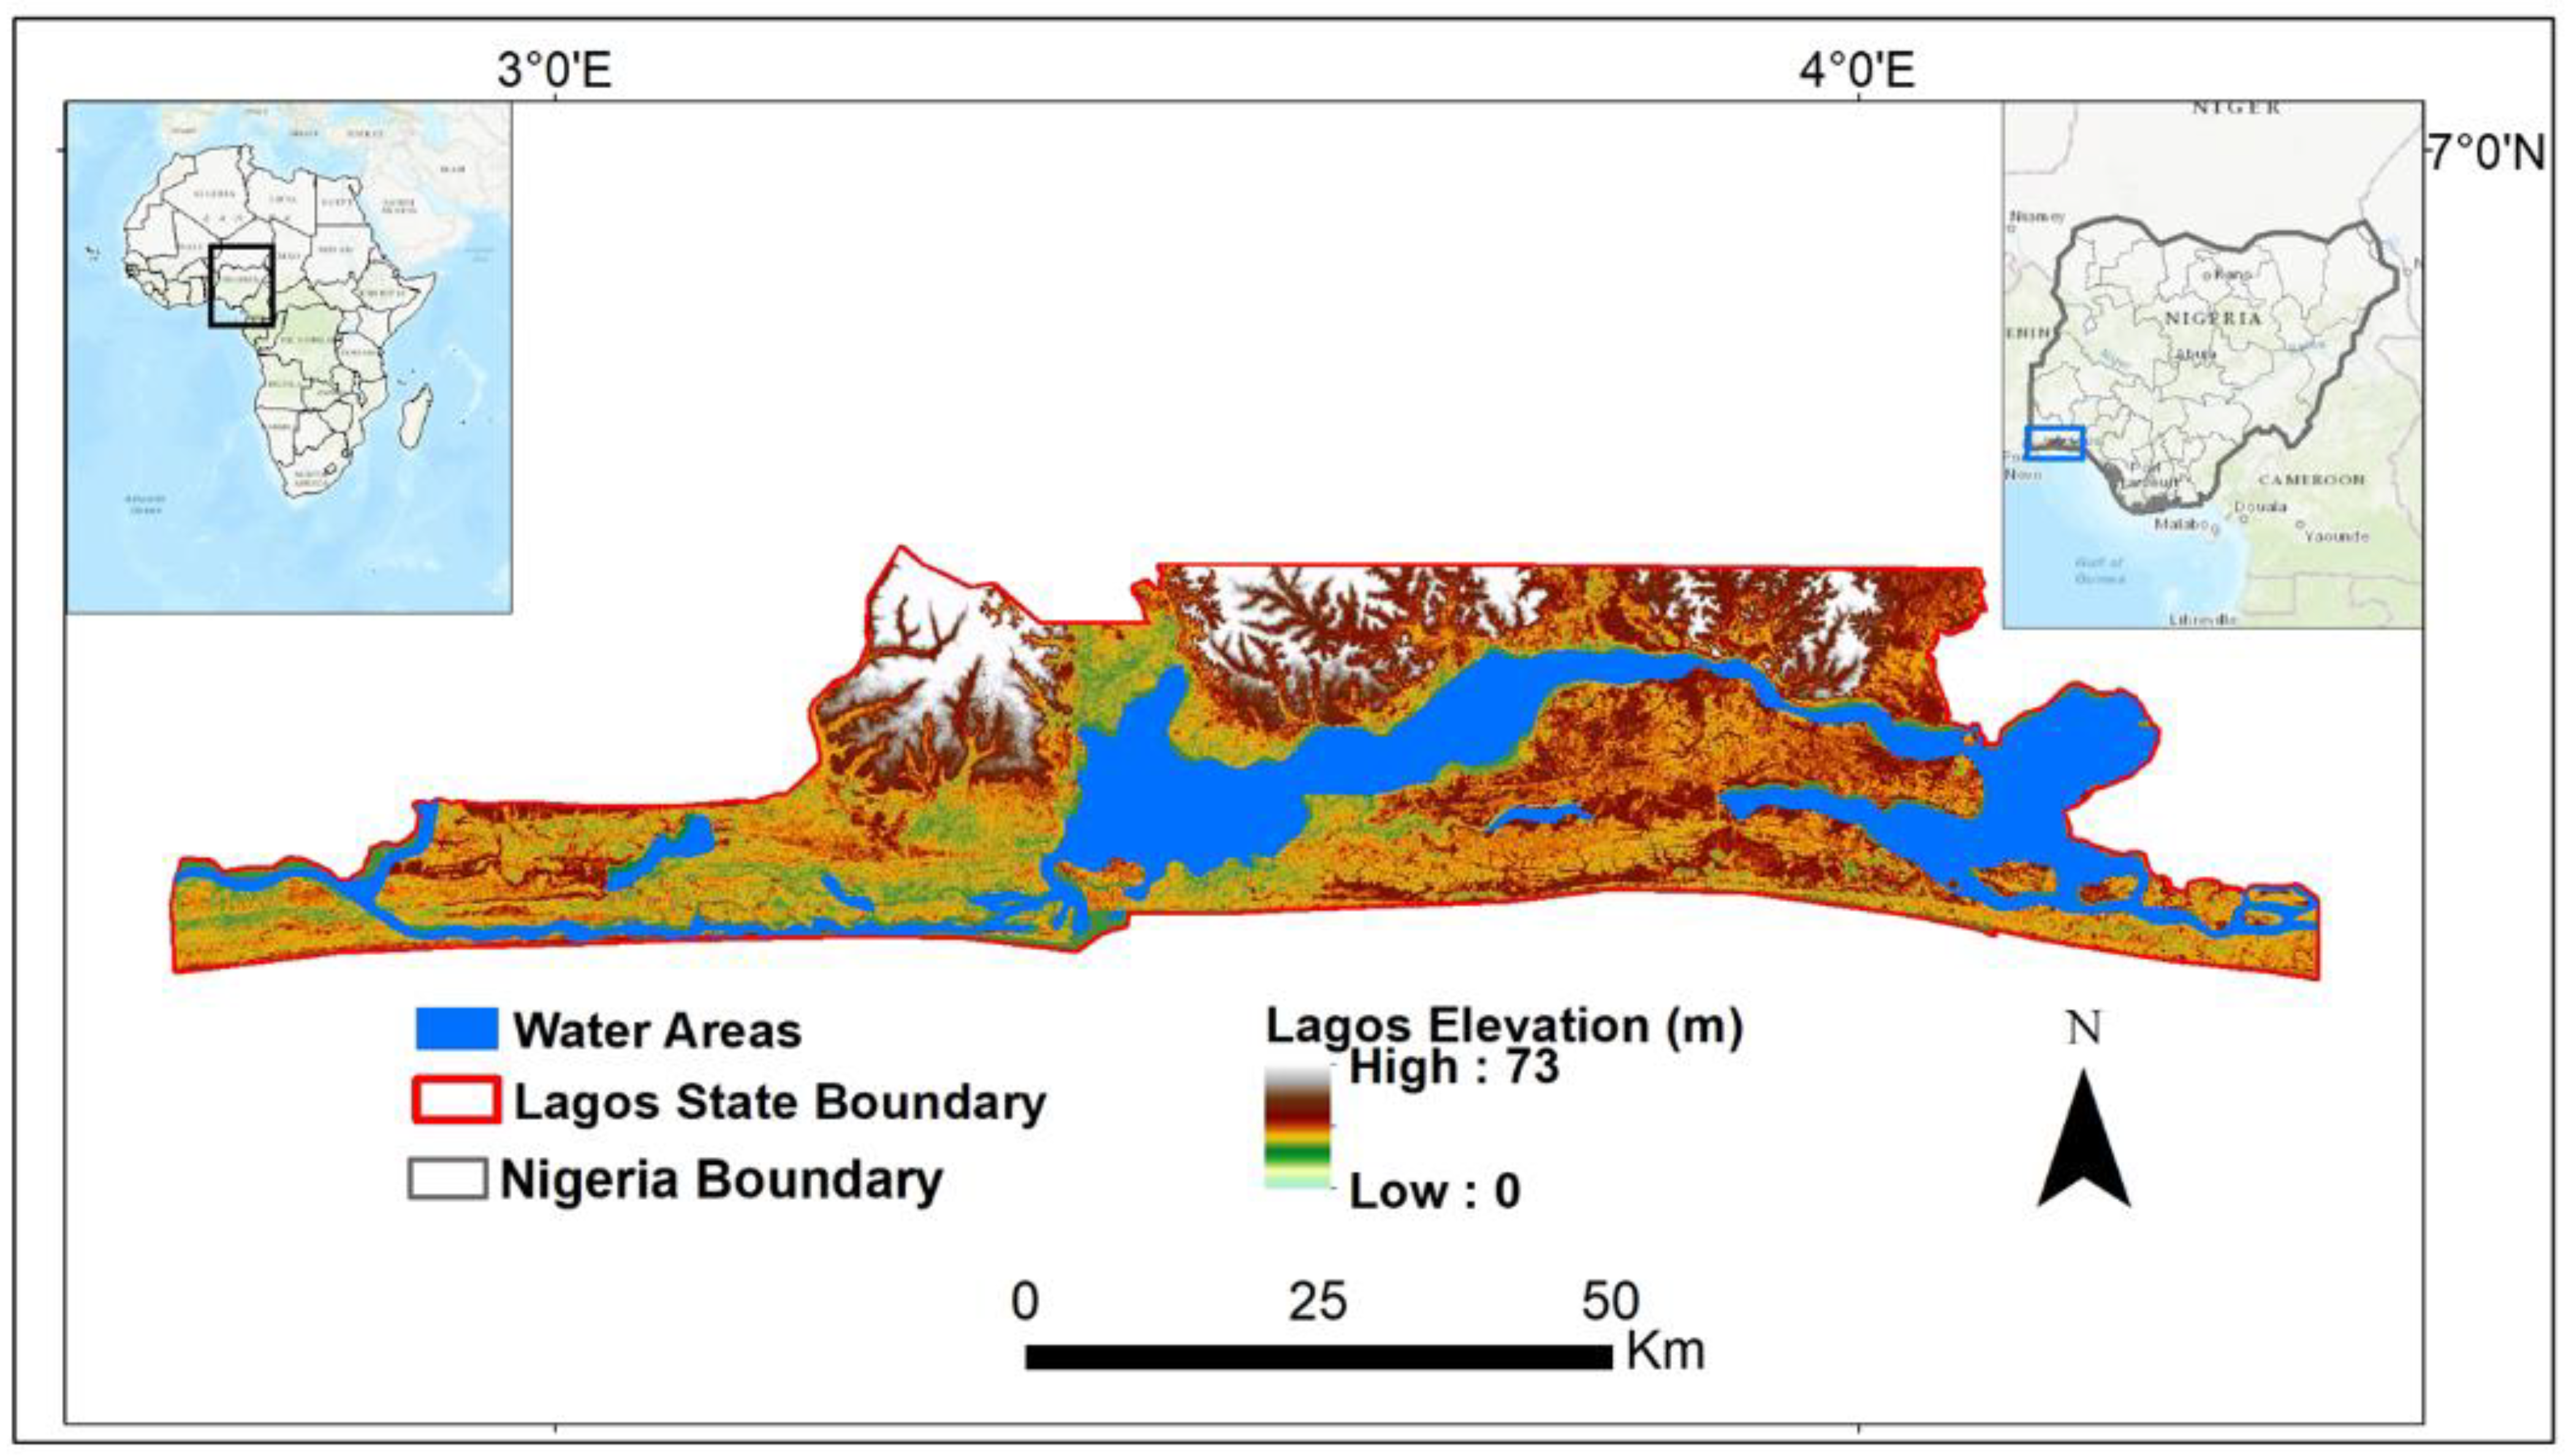
Located in Nigeria’s southwestern zone, Lagos State is regarded as a hotspot in terms of urban expansion. Among all the 36 states in Nigeria, it is the smallest in area, comprising 19 local government areas, including the City of Lagos, the nation’s largest metropolitan area (Figure 1). The United Nations predicted there would be a megacity in Africa by 2015 [1], the City of Lagos made that mark by 2020 [2]. The city currently ranks number seven in the fastest growing cities and urban areas globally, with an average annual growth of 4.4% in population from 2006 to 2020. It continues to grow in population density and urbanization, with a current population of over 21 million and over 6000 residents per square kilometer. A rise in population in urban areas is known to directly affect the demand for housing, which in turn leads to an increase in developed land. Urban development in Lagos State is taking place by land reclamation [3] through dredging from lagoons and converting coastal wetlands into urbanized communities, which is a direct result of urban sprawl. Urban sprawl means the loss of wetland, forest, and agricultural land to houses, roads, and industries, leading to environmental challenges and changing demographics [4]. Environmental challenges, such as flooding, are the major natural disaster that plagues Lagos State, which is assumed to be stimulated by urban sprawl. The expansion of developed land is taking place in many flood-prone areas and has also led to a change in the coastline geometry (Figure 1). Monitoring urban sprawl and identifying the pace of the spread and spatial pattern is a primary concern for urban planners and policymakers, primarily due to insufficient data availability and lack of technical knowledge and tools. Additionally, there are no data from “standard” hydrology and climatology for most developing counties, such as Nigeria. It should be noticed that the accuracy of the presented study cannot be compared with modern techniques based on well-sampled water bodies. Still, in this case, those data are practically inaccessible.
Changes in Land Use and Land Cover (LULC) associated with urban sprawl can be measured and analyzed [5] using remote sensing and Geographic Information Systems (GIS) [6,7,8,9,10,11,12,13] but have not been done yet for the entire Lagos State due to the issues mentioned above. Commonly, LULC analysis aims to identify changes in the same geographical area between the two timeframes considered [14]. Remotely sensed satellite imageries enable us to look at LULC retrospectively and could be used to monitor urban sprawl over time [15,16]. Images from different timeframes can be compared after using satellite image-based land cover classification techniques to illuminate the developed and undeveloped land changes.
Several studies have linked urban expansion in Lagos, Nigeria, to flooding [17,18,19]. The area comprises islands of different water bodies, ranging from lagoons and beaches to creeks, making it naturally susceptible to flooding. Urban flooding in Lagos State is expected, and the socioeconomic impact keeps increasing over the years. Urbanization is a common phenomenon in different parts of the world [20]. However, intensive unplanned urban growth has negative consequences on many environmental aspects [21]. For instance, urbanization resulting in a decrease in wetland, vegetation [22,23], and soil cover leading to an increase in impermeable surfaces can reduce rainfall infiltration and increase runoff to streams and rivers, and eventually cause flooding [24,25]. Vegetation can significantly affect hydrological fluxes due to variations in the physical characteristics of the land surface, soil, and vegetation [22,23]. The adverse effects of flooding could be reduced with proper urban planning, starting with the identification of flood-prone areas through flood hazard mapping and assessment of LULC changes causing flooding in those areas [26].
Flood hazard mapping requires specific hydrologic measurements [27,28] from flood monitoring systems such as river and stream gauges, which are valuable but can be time-consuming, and expensive [29]. More so, in most developing countries, such hydrologic records are insufficient or absent, and the cost of installing these systems could be limiting [30]. Consequently, flood hazard studies based on direct measurements may be impossible in most developing countries because there are no historical data available to determine certain flood levels and recurrence intervals for a particular flood event [30]. Flood hazard evaluation based on satellite data and damage reports could substitute for unavailable quantitative data [31,32,33]. Here, we created a remote sensing and GIS-based flood hazard map using seven criteria combined in a weighted overlay analysis. Each criterion’s weight was estimated using the Multiple-Criteria Decision-Making (MCDM) methods which suggest the different influence each criterion has on the hazard delineation process.
Multiple-Criteria Decision-Making (MCDM) and Geographic Information System (GIS) methods have been considered by several researchers [34,35,36,37,38,39,40,41] to be very versatile in terms of providing the techniques and strategies for analyzing complex decision-making problems comprising incomparable criteria. The MCDM methods are broadly categorized into objective and subjective methods [42], with each category based on the role of the decision-maker in the context of determining the importance of a criterion. Of all the different MCDM methods for determining the weights of each criterion in GIS applications, the Analytic Hierarchy Process (AHP) [42,43,44,45,46,47,48,49,50,51,52,53,54] is commonly used, while the Shannon Entropy weighting method is less widely used [55,56,57,58]. A combined AHP and GIS approach was used in Kenya and Greece for urban flood vulnerability and risk mapping [59,60]. This study applied a combined (hybrid) AHP and entropy MCDM method for flood hazard mapping in Lagos State, an approach suggested to be efficient for determining criteria weights for GIS-based applications [56,59].
Therefore, this work aims to detect the link between LULC dynamics and flooding in Lagos State over 35 years through a multi-year (1986, 2000, 2016, and 2020) study. A map-matrix-based post-classification method was used to investigate LULC changes to identify the losses or increase in the specified land cover types. Additionally, a flood hazard map was created to evaluate LULC morphology and impacts to the continuous rise of flooding in the State using a hybrid weighting MCDM approach. This study could ultimately bring awareness to the general public, urban planners, and land-use managers on increasing flood hazard areas due to the loss of wetland and the expansion of the developed area, hence, promoting a better practice of land use in Lagos State.
2. Data and Methods
This section presents the data acquisition and data processing methods for LULC analysis and flood hazard mapping. Approaches used to analyze the accuracy of the studies are also included in this section.
2.1. Land Use and Land Cover (LULC) Analysis
The purpose of the LULC analysis was to quantify the changes in the land cover types over time in Lagos State, Nigeria, and ascertain how these changes influence flooding. Certain land cover losses, such as loss of wetland and vegetation, when replaced with an impervious surface such as pavements, could decrease rainfall infiltration and increase the surface runoff.
2.1.1. Data Acquisition and Preprocessing
The Landsat 5, Landsat 7 Enhanced Thematic Mapper Plus (ETM+), and Landsat 8 Operational Land Imager (OLI) scenes were downloaded via the United States Geological Survey (USGS) Global Visualization Viewer (Glovis—https://glovis.usgs.gov/app?fullscreen=1 (accessed on 11 December 2020)) for this study. The satellite images were used as they provide data dating back to 1986, which is the start of our time step. The spatial resolution of the Landsat images is 30 m. Table 1 shows the Landsat data types and their corresponding acquisition date for the multispectral scenes.
2.1.2. Scenes Classification and Post-Classification Change Detection Analysis
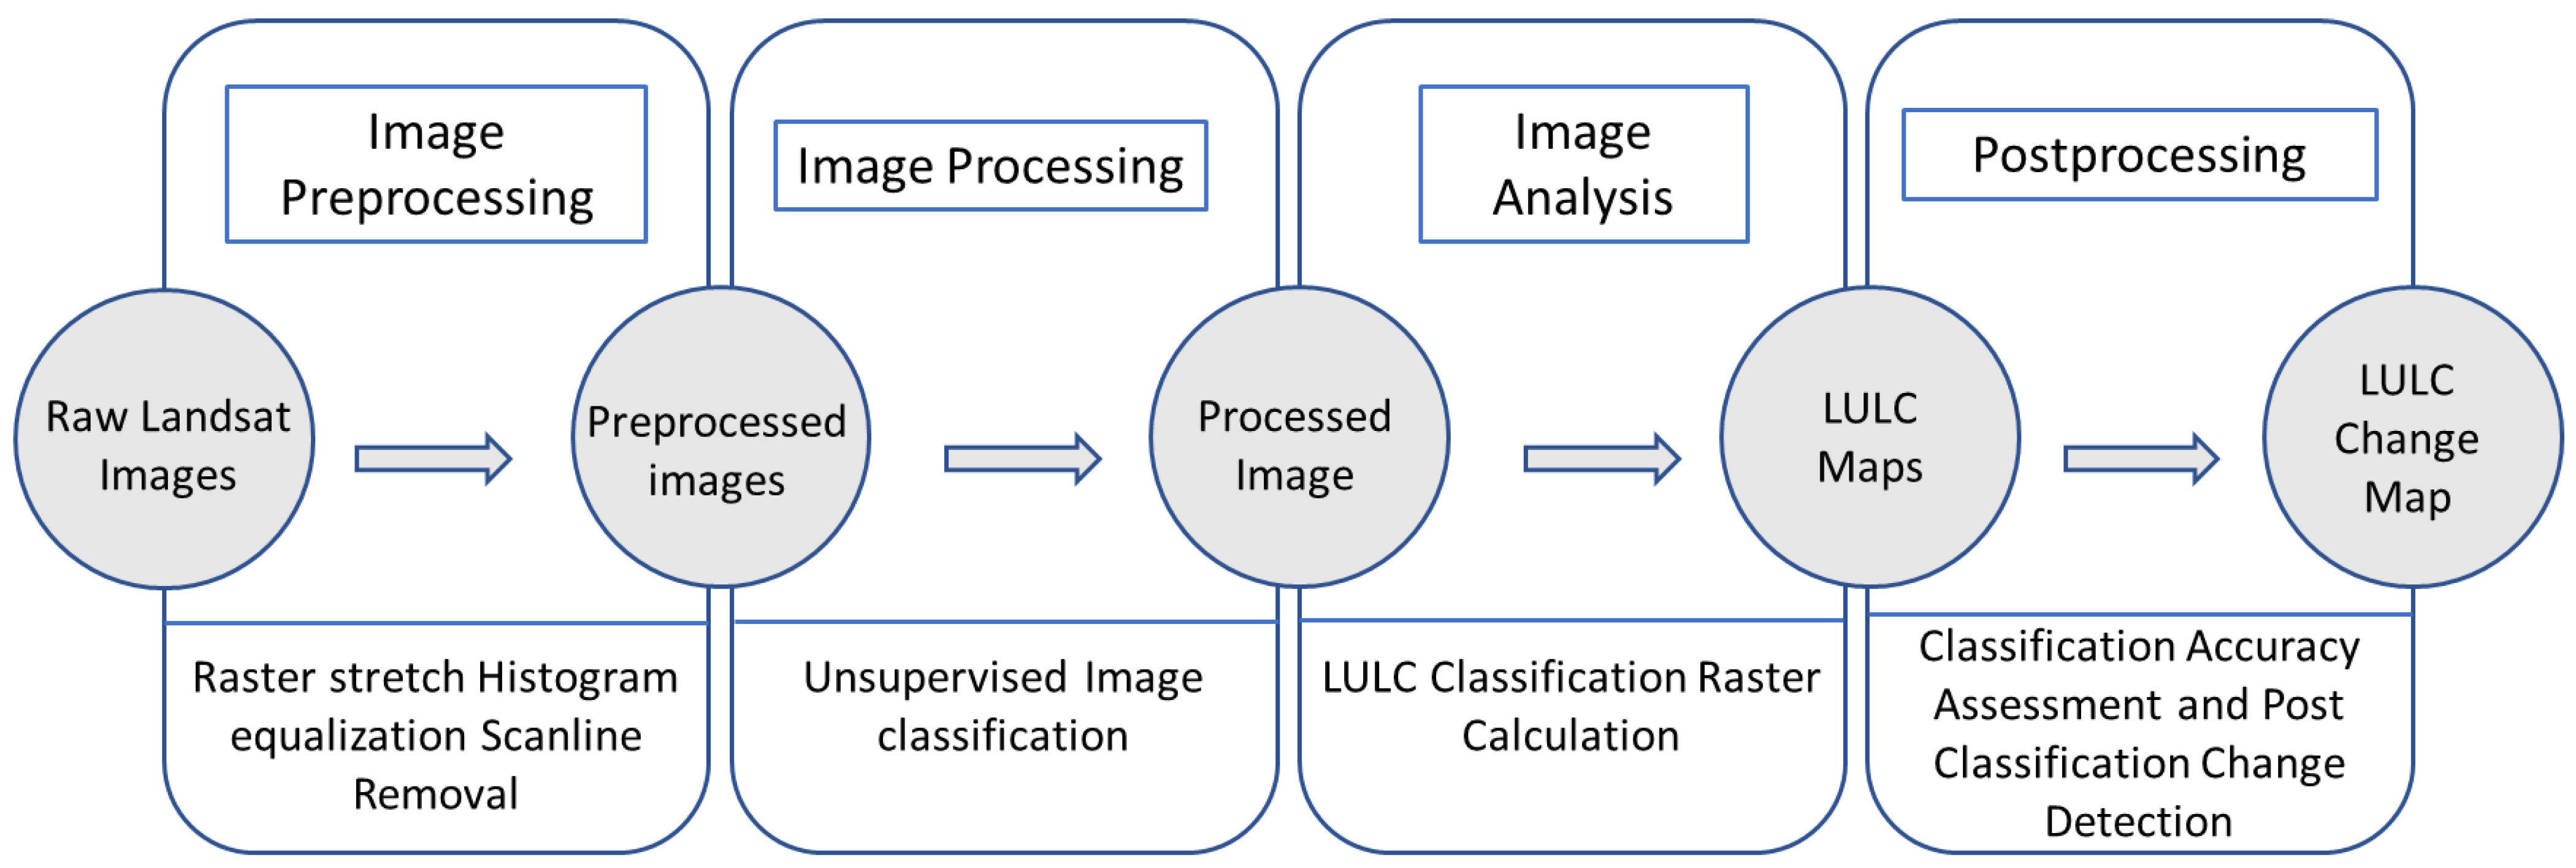
Once the data were downloaded, an Iso Cluster unsupervised classification technique was applied to LULC assessment images. The LULC classification was restricted to areas where satellite imagery has minimal cloud cover. Since we are interested in changes associated with wetland, vegetation, and developed areas, we classified the images into four classes, i.e., water, wetland, vegetation, and developed. Table 2 shows the land cover types and the explanations used in this study. The recoding values in Table 2 were used for the analysis of land cover change detection as described next [60].
Several change detection methods have been proposed, including image differencing, principal component analysis [55,56,57,58], and post-classification comparison [59,60,61,62,63,64]. The post-classification change detection method we used here involves LULC changes estimated by performing map matrix (in ArcMap) calculations categorized into two steps. The first step was LULC map recoding, followed by raster calculation comprising map multiplication and addition. We reclassified the LULC maps for all the years (1986, 2000, 2016, and 2020) using the recoding values listed in Table 2. Furthermore, we paired the years from past to recent such that the resulting intervals were 1986–2000, 2000–2016, and 2016–2020. Raster multiplication was performed on each pair of LULC maps. Finally, we performed a raster addition between the raster multiplication output and the most recent years in each interval. The resulting maps from the above calculations quantitatively depict the changes for the different land covers over time. Equations (1) and (2) explain the above process mathematically.
where: Yt1 is the LUL map from a previous year, Yt2 is the LULC map for a recent year, Yt denotes LULC map product from previous and recent years, CD is the detected change, which is the addition of the LULC map product (Yt) and the LULC map for a recent year (Yt2).
Yt = Yt1 ∗ Yt2
CD = Yt + Yt2
2.1.3. LULC Map Accuracy Assessment
An assessment of the LULC map accuracy was made to evaluate the reliability of the classified images. This accuracy assessment is based on ground referencing, also known as ground-truthing. Ground referencing includes comparing data collected in the field or data from higher spatial resolution imagery to a classified map. As a result of the field data unavailability, we compared our classified images to images from Google Earth. The imageries from our analysis and Google Earth were used to calculate an error matrix, which is a table comparing the land cover classes found on the Google Earth imagery to those in the classified images at the same location. To ascertain the classified images’ accuracy, we sampled 100 points on the derived landcover maps to Google Earth imageries by constructing a confusion matrix and estimated the producer’s accuracy, user’s accuracy, and kappa.
2.2. Flood Hazard Analysis
This analysis was essential to delineate the different levels of hazard and exposure of various areas of Lagos State to flooding categorically. Additionally, apart from getting an insight into the most dominant criteria responsible for flooding in the study area, the spatial distribution of the changes in the wetland, vegetation, and developed land covers in relation to the identified flood hazard zones could be assessed.
2.2.1. Criteria for Flood Mapping
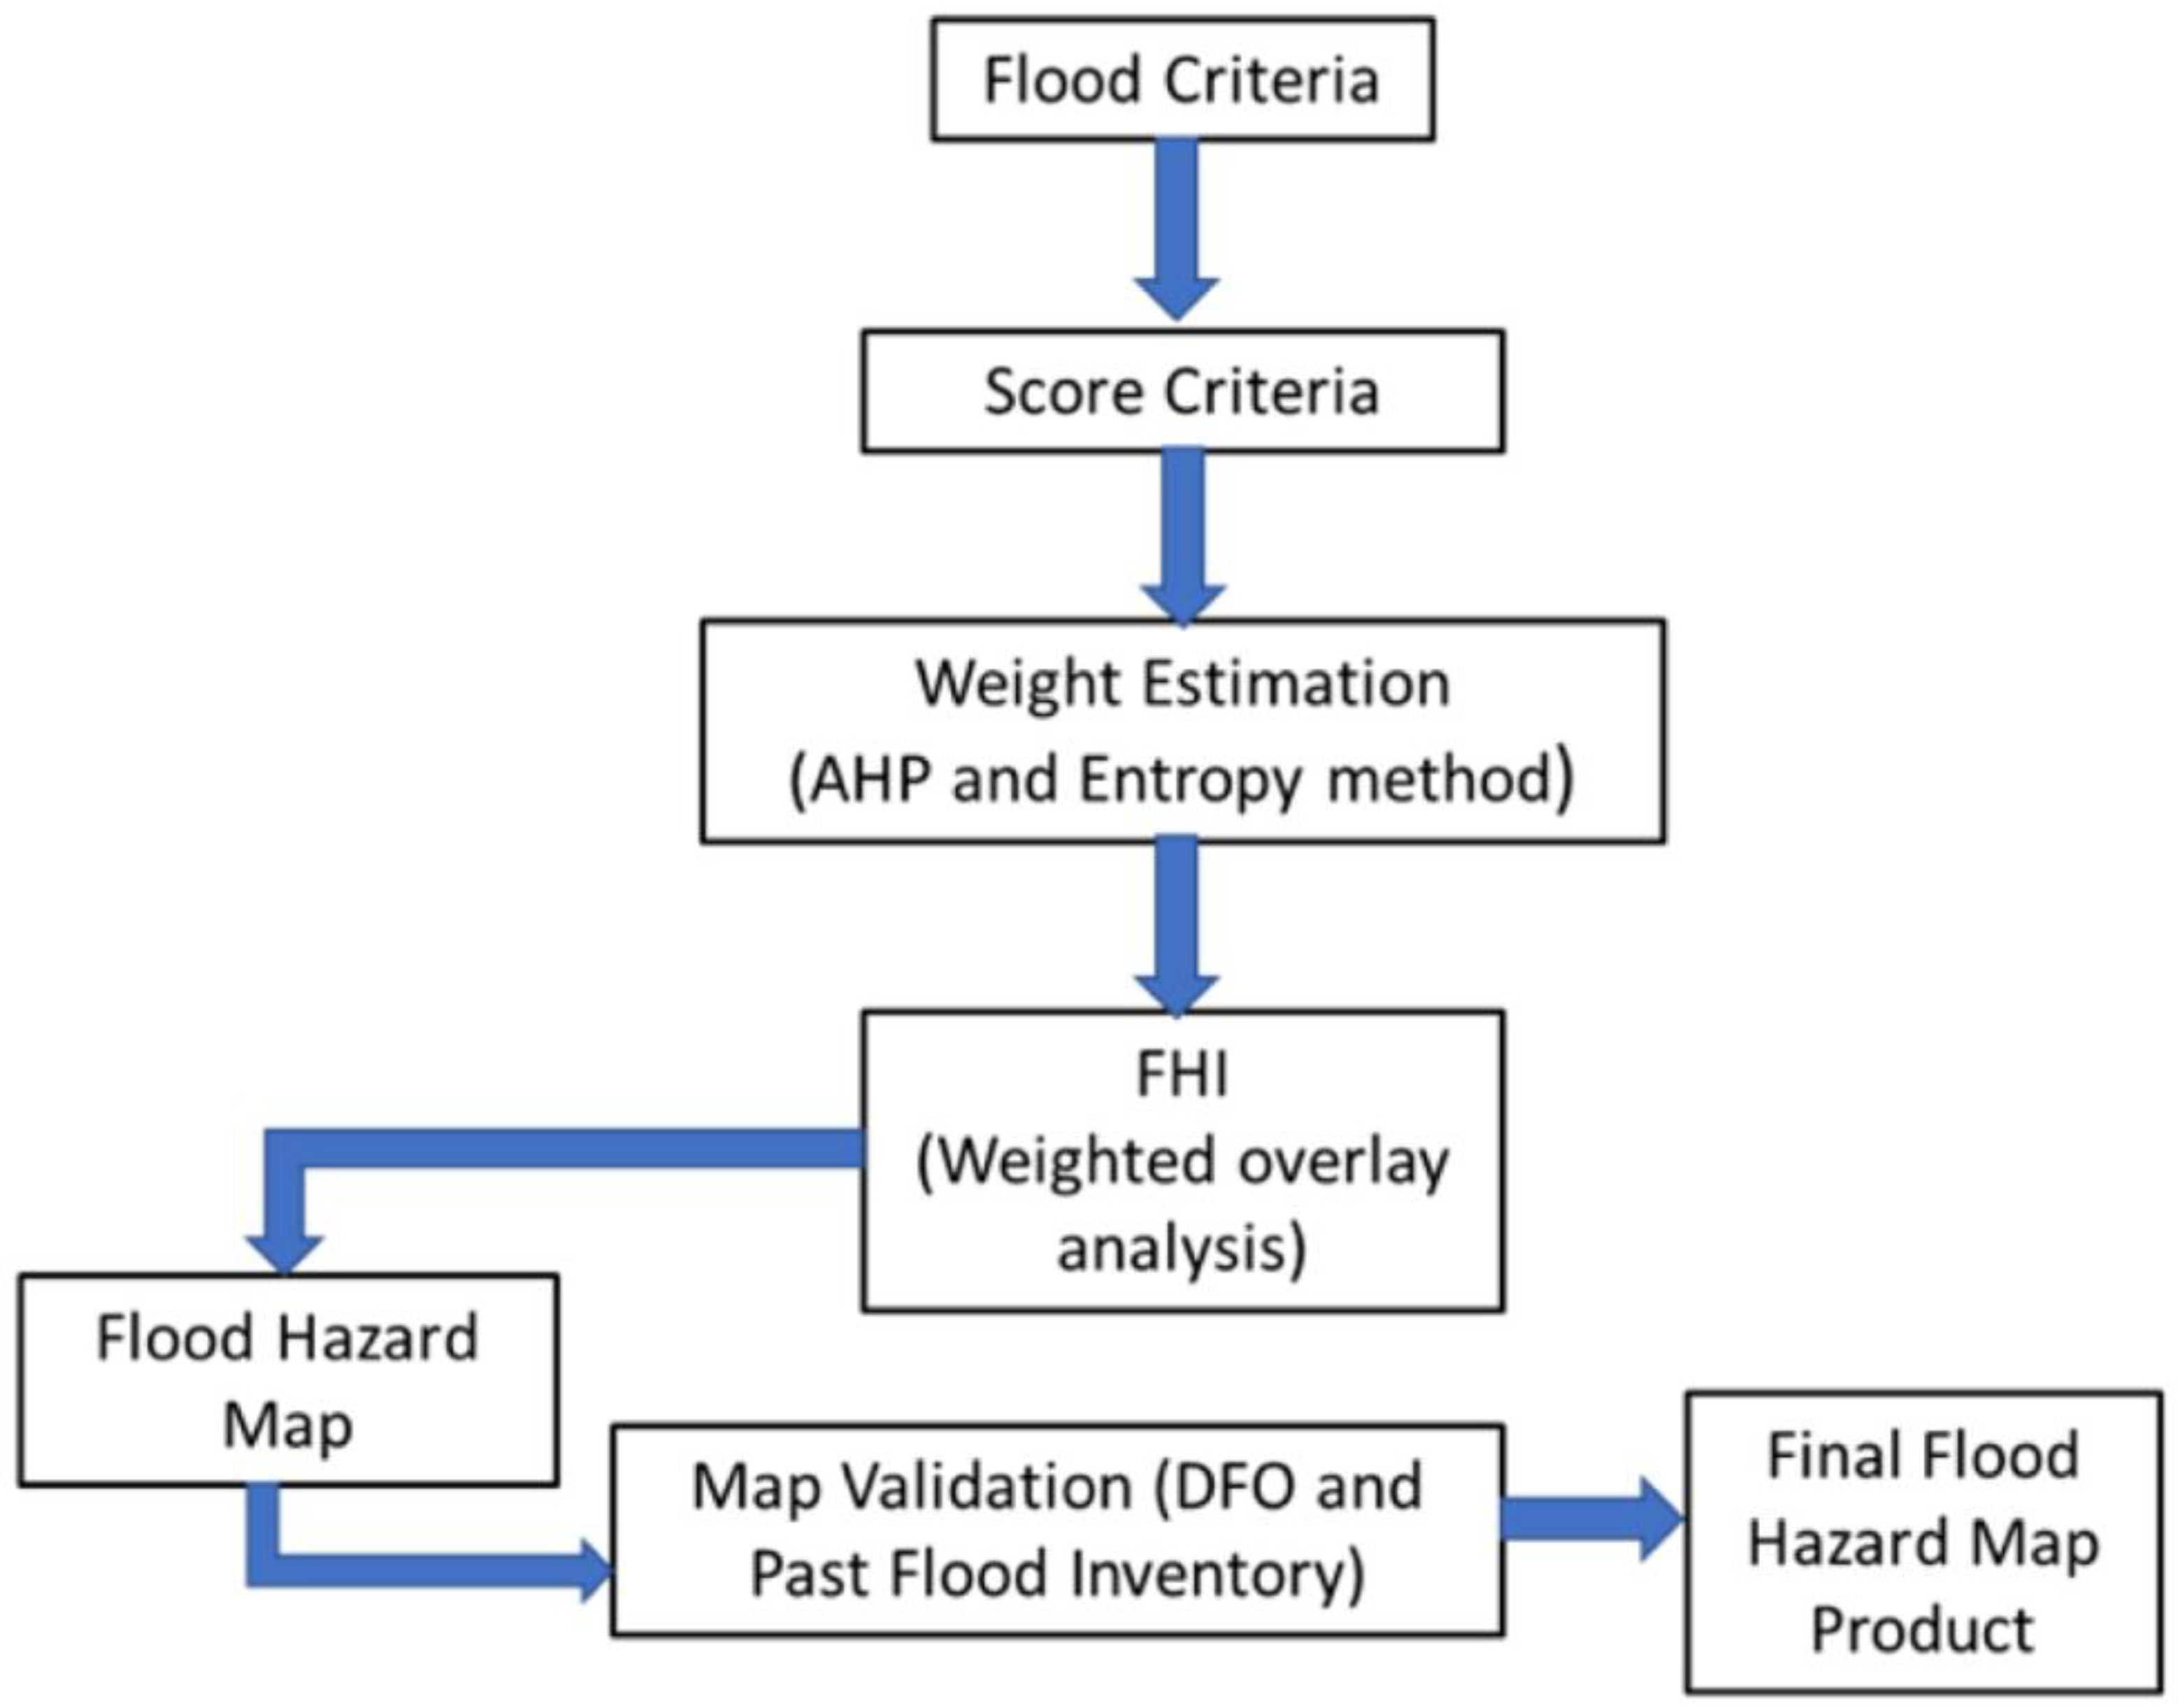
A combination of criteria has been suggested by several researchers [65,66,67,68,69,70] to be factors at play in flood-prone areas. Seven criteria were identified and defined to be critical for delineating flood hazard areas in Lagos State, Nigeria. These factors include elevation, rainfall intensity, Flood Potential Index (FPI), Storage Deficit (Sdef), flow accumulation, proximity to water areas, and stream network. For these data, we created a rainfall intensity map from the downloaded Global Precipitation Climatology Center (GPCC) at the NASA GES DISC Earth Data website. A 30 m Shuttle Radar Topography Mission (SRTM) Digital Elevation Model (DEM) was downloaded from the USGS Earth Explorer website. The slope and stream polyline map for our area of interest were generated using the DEM data, while the water area map was downloaded from the ArcGIS online map service in ArcMap. The FPI and Sdef were calculated following the methodology by [71]. Based on the workflow displayed in Figure 3, we produced a flood hazard map for the entire area of Lagos State.
2.2.2. Determining the Weights of Each Criterion
A combined (hybrid) AHP and Shannon Entropy weighting method was applied to determine each criterion’s weight for the flood hazard assessment analysis. Initially, we computed the criteria weights using the individual MCDM (AHP and Shannon Entropy) method and subsequently applying Equation (3) to combine the weights estimated from both methods. Hence, a hybrid approach combined the MCDM methods from AHP and Shannon Entropy weighing estimation methods. We used the methods proposed by [72,73] for computing the AHP and Entropy weights, respectively.
where Wj, Xj, and Yj are the hybrid, AHP, and Entropy weights and j = 1… n) to generate the hybrid weights.
Wj = (Xj + Yj)/2
2.2.3. Weighted Overlay Analysis
The weighted overlay analysis is one of the approaches applied to multi-criteria problems. Flood hazard mapping requires the determination of contributing factors to flooding in an area. Based on data availability, for our analysis, we hypothesized that areas with a high amount of rainfall, low elevation, high FPI, low Sdef, high flow accumulation, close to water bodies are more susceptible to flooding. In order to carry out the weighted overlay analysis, thematic map layers were created for each criterion and normalized to the same scale. The map formats were unified into raster format since the datasets were a mixture of vector and raster formats. The weighted overlay analysis could only be performed on raster datasets in ArcGIS. The streamlines and water area map layers were rasterized from shapefiles to distance raster using the Euclidean distance tool, which calculates the Euclidean distance from the source for each cell in a raster. The final model was produced by applying Equation (4).
where FHI is the Flood Hazard Index resulting from the weighted overlay analysis, Ci is the ith criterion, wi represents the ith criterion’s corresponding weight, i = 1…n, and n is the total number of criteria.
2.2.4. Model Validation
The flood hazard map produced was qualitatively validated using the flood inventory map created by compiling past flood events in the study area from 1968 to 2020. Table 3 summarizes the flood events in 26 locations within Lagos State throughout the years. We also compared the flood hazard map generated from our study to the flood reports by the Dartmouth Flood Observatory (DFO) in Lagos State over the years. The DFO reports flood events worldwide based on news, governmental, instrumental, and remote sensing sources and might be biased towards more significant flood events [71].
3. Results
This section describes the results from landcover classifications for the images acquired in 1986, 2000, 2016, and 2020, as well as the LULC change detection in the context of flood mapping. Assessment of the accuracies of the classification and change detection analysis were also presented.
3.1. Land Cover Classification
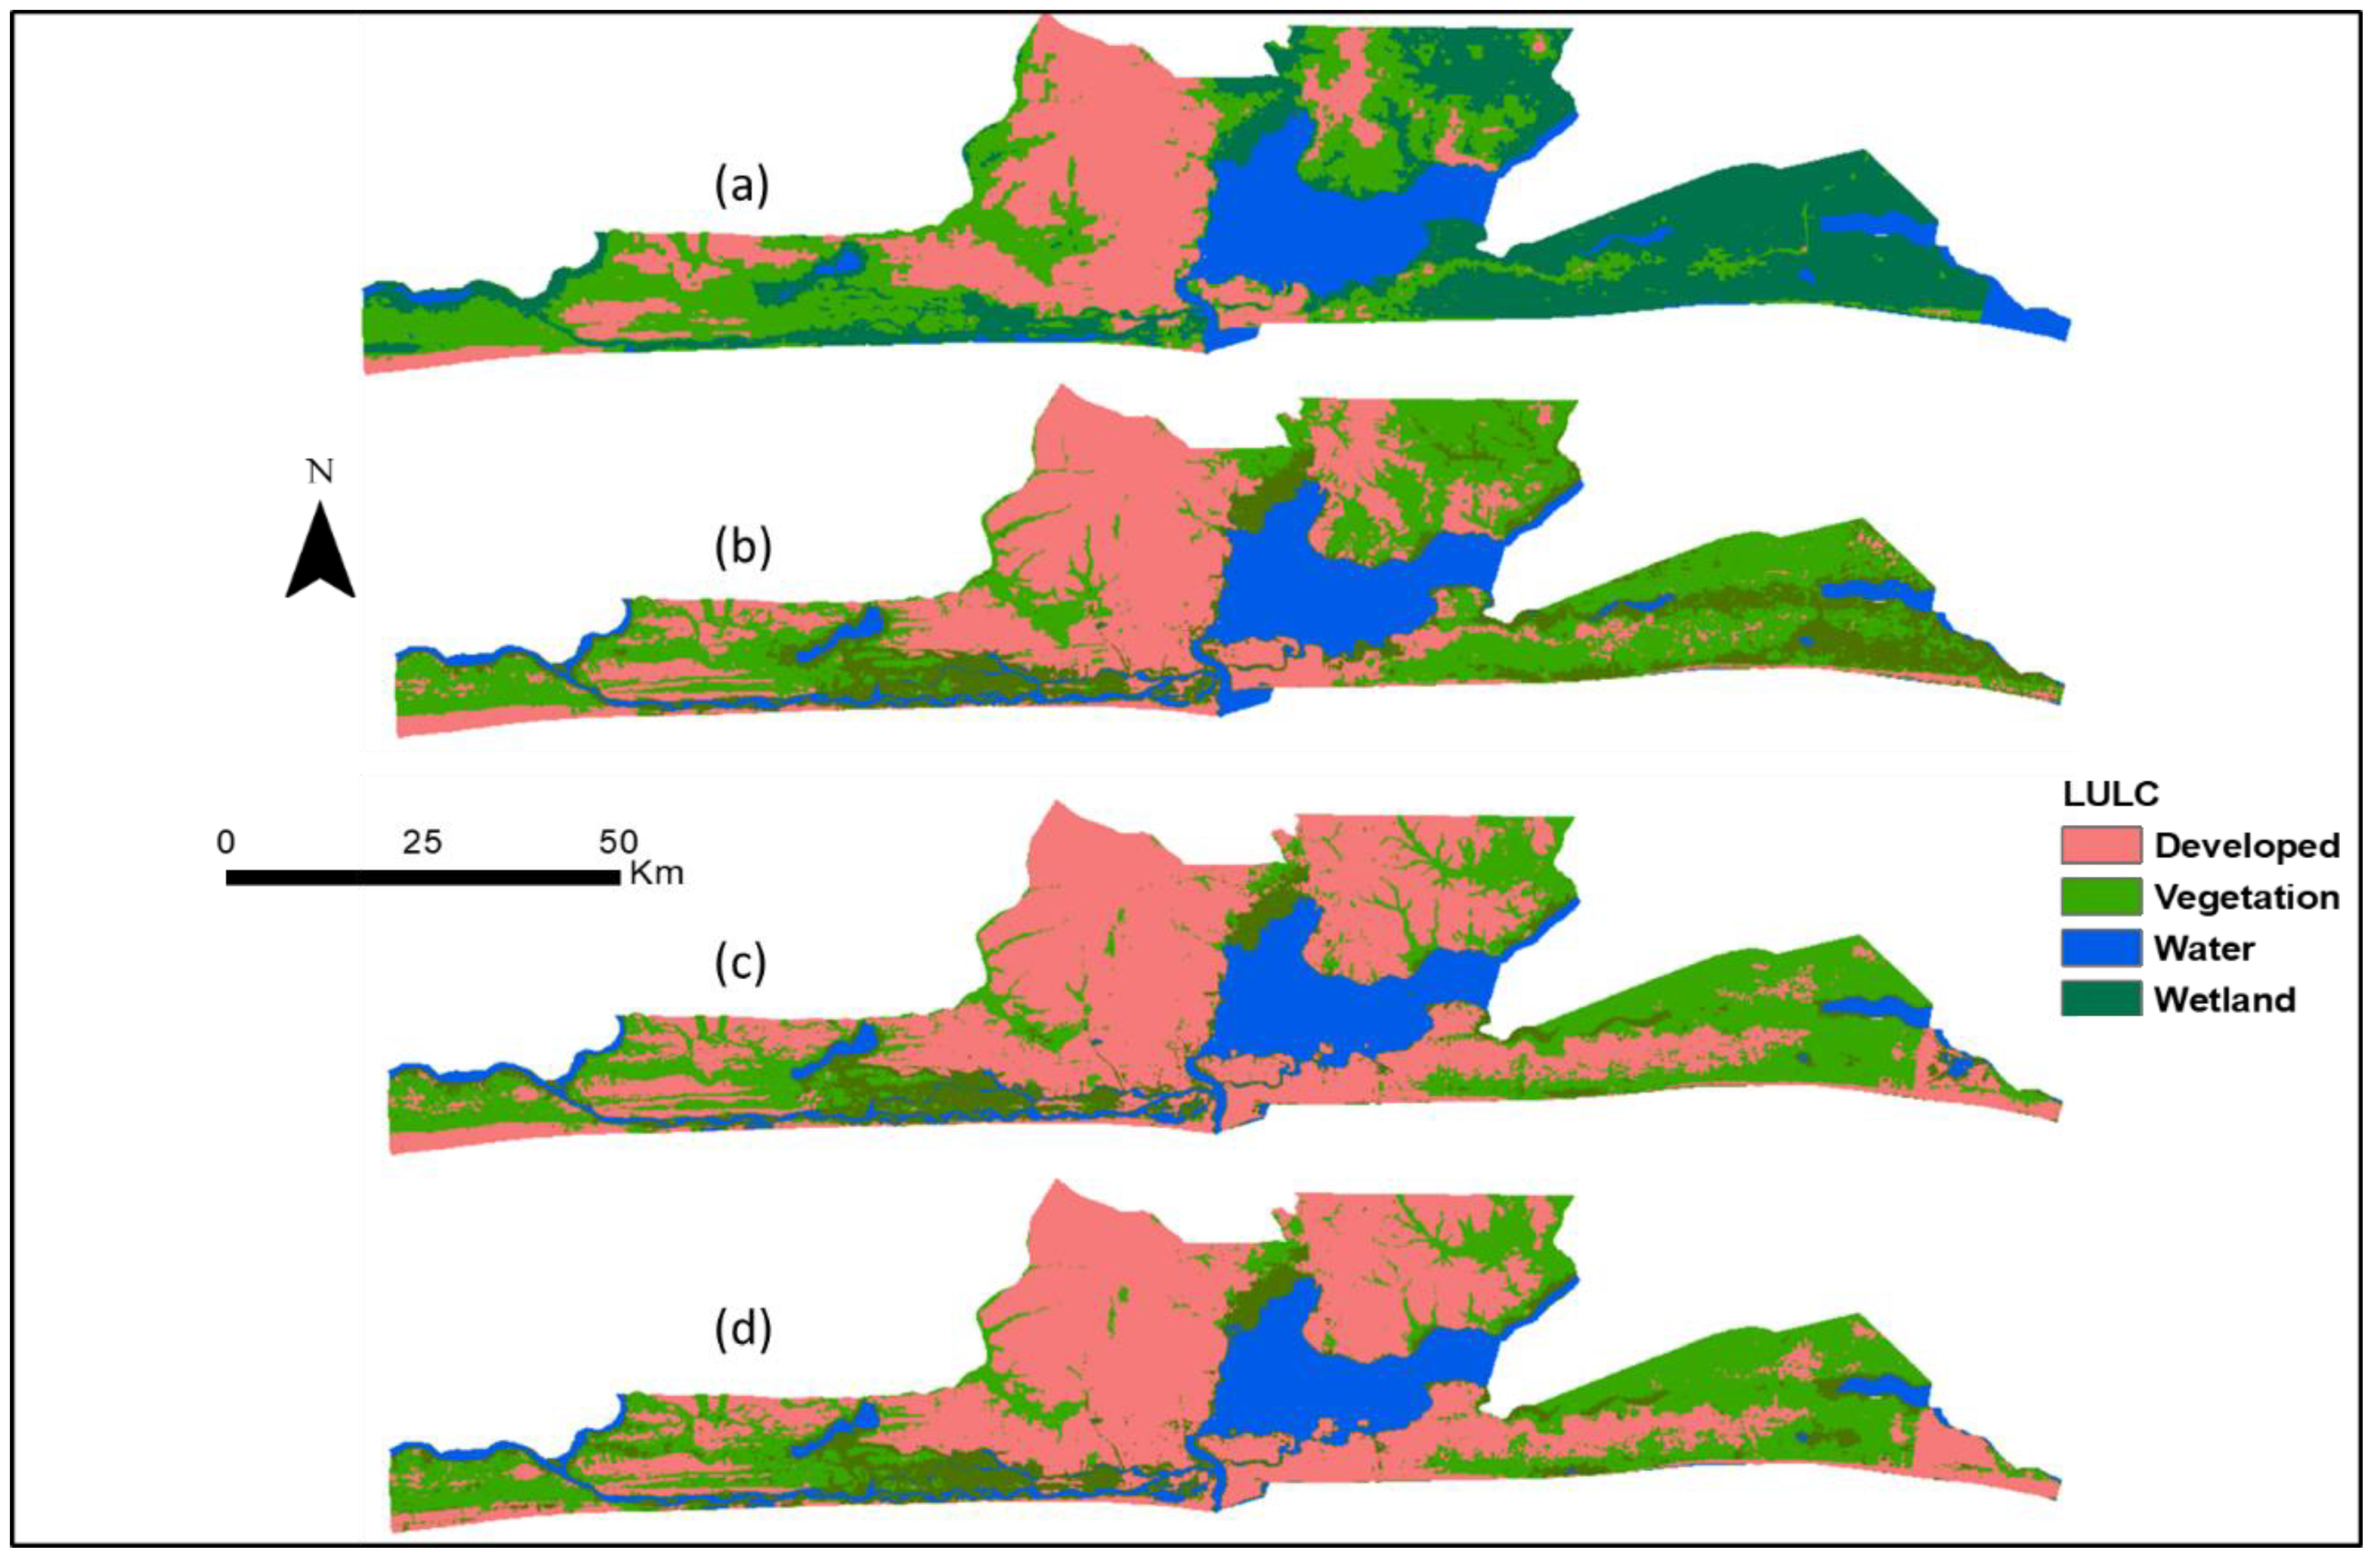
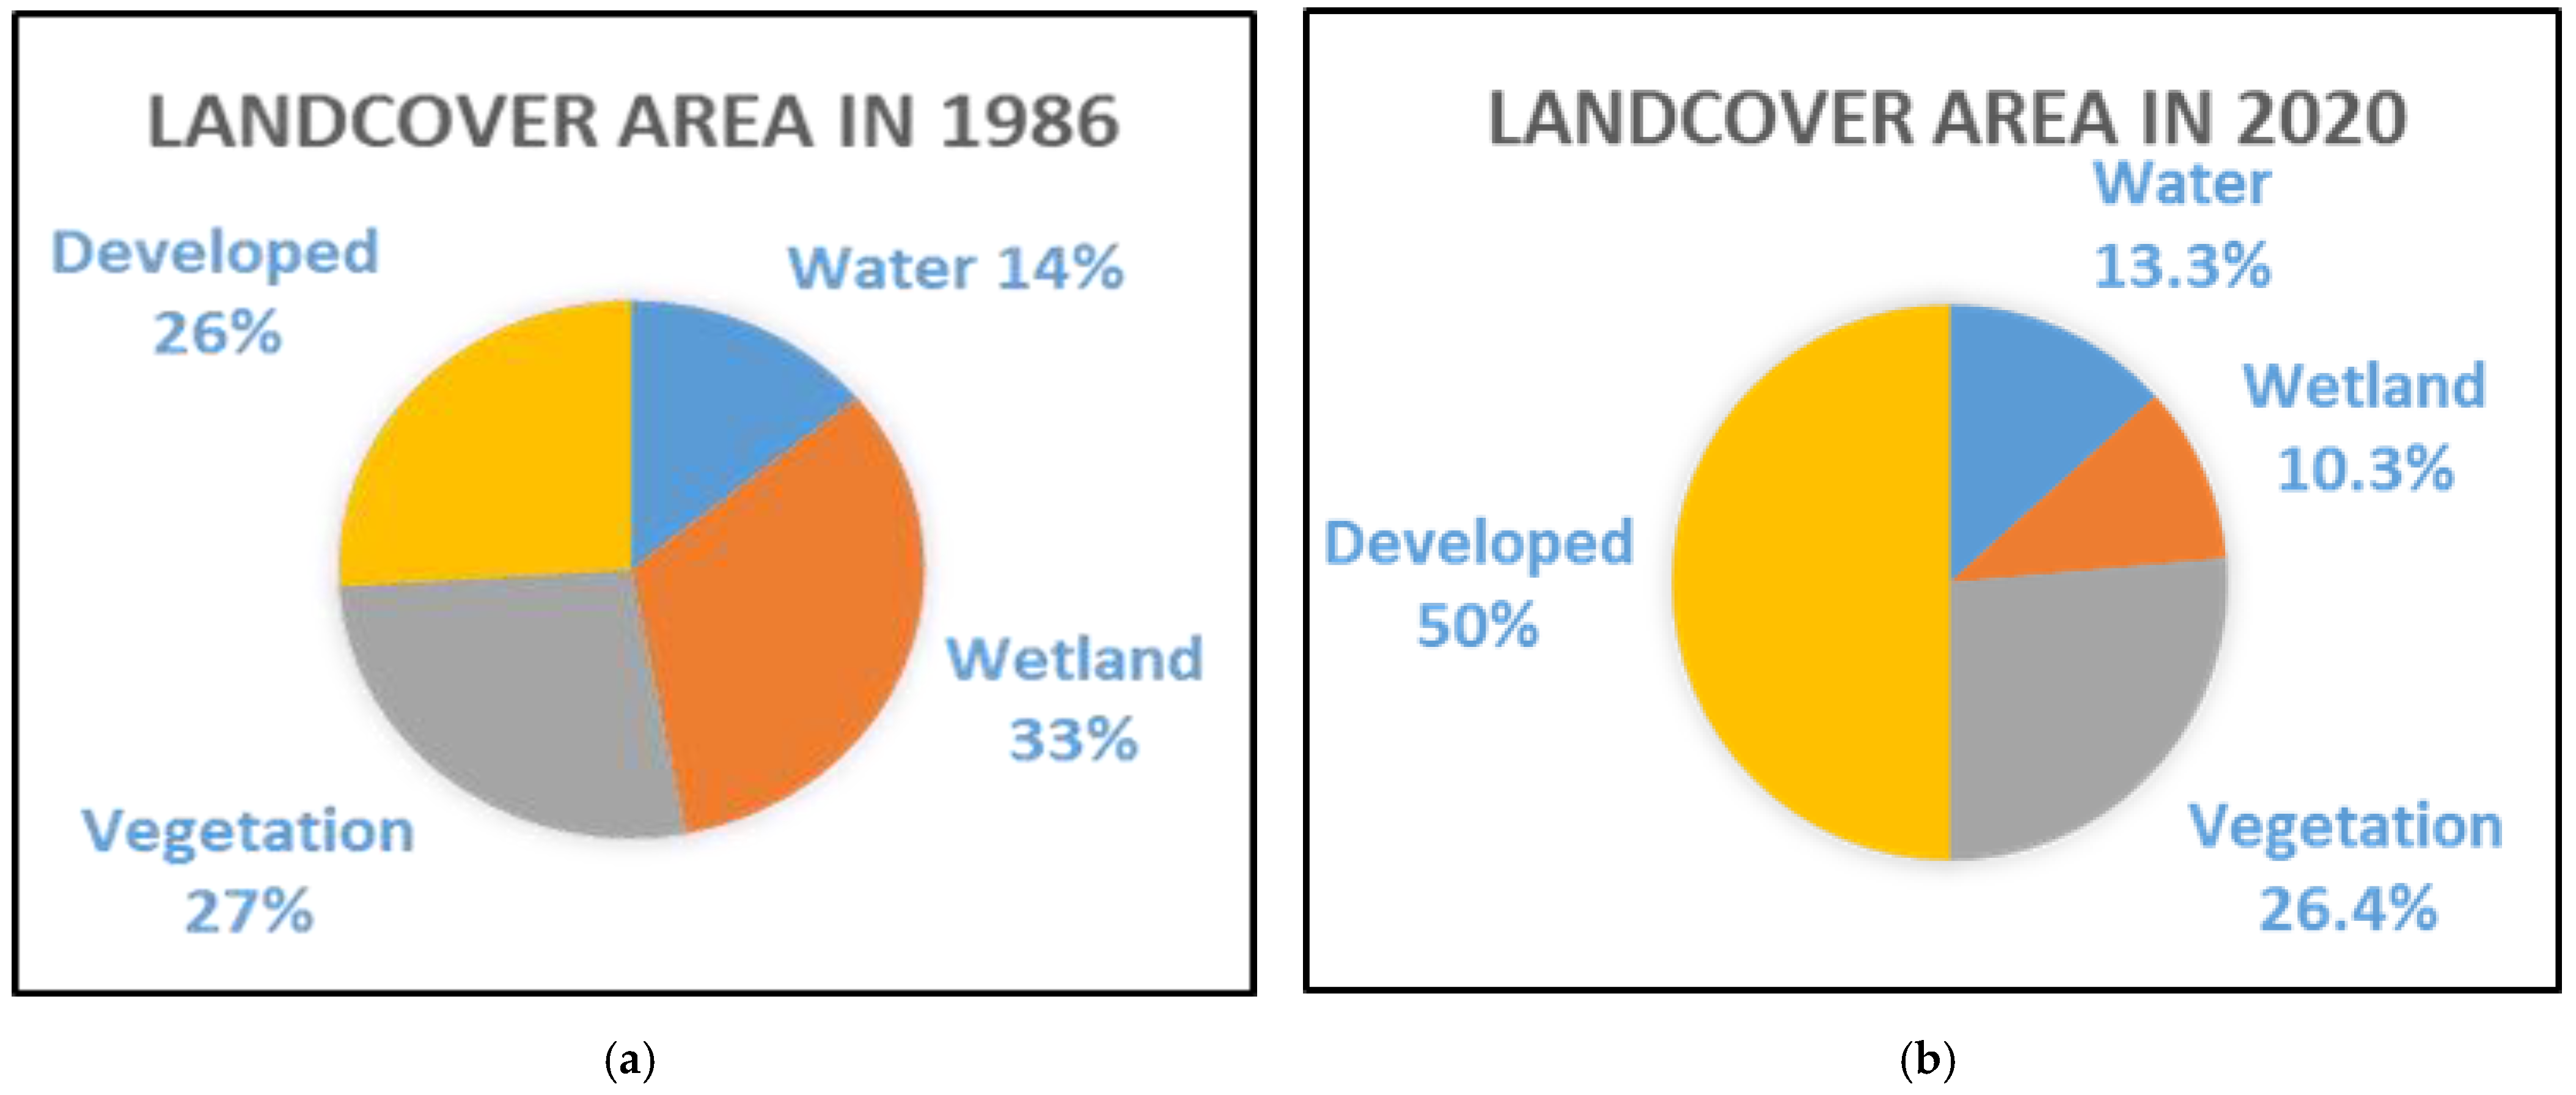
Using the Iso Cluster unsupervised classification, four major land cover types were classified. These include water, wetland, vegetation, and the developed areas. Figure 4 visually depict the land cover changes for 1986, 2000, 2016, and 2020. Figure 5a,b explain each land cover type’s area relative to the total area of the study area between 1986 and 2020. In 1986, water, wetland, vegetation and developed were 14%, 33%, 27% and 26%, respectively, and by 2020, they were 13.3%, 10.3%, 26.4% and 50%, respectively. Table 4 further explains a pair-wise evaluation of the change across the 35 years included in the study. There is a dramatic increment in the developed areas and a significant loss of wetland. The negative and positive signs associated with the table’s values depict an increase (positive values) or decrease (negative values) in a particular land cover type in each paired time category. While the water, wetland, and vegetation land cover fluctuate between increasing and decreasing, the developed land cover increased in all the paired timeframes.
We compared 100 points sampled on the derived land cover maps from this analysis to higher resolution Google Earth imageries by constructing a confusion matrix to ascertain the accuracy of the classified images. We found that the producer’s accuracy, user’s accuracy, and kappa are 0.96, 0.98, and 0.87, respectively.
3.2. Change Detection
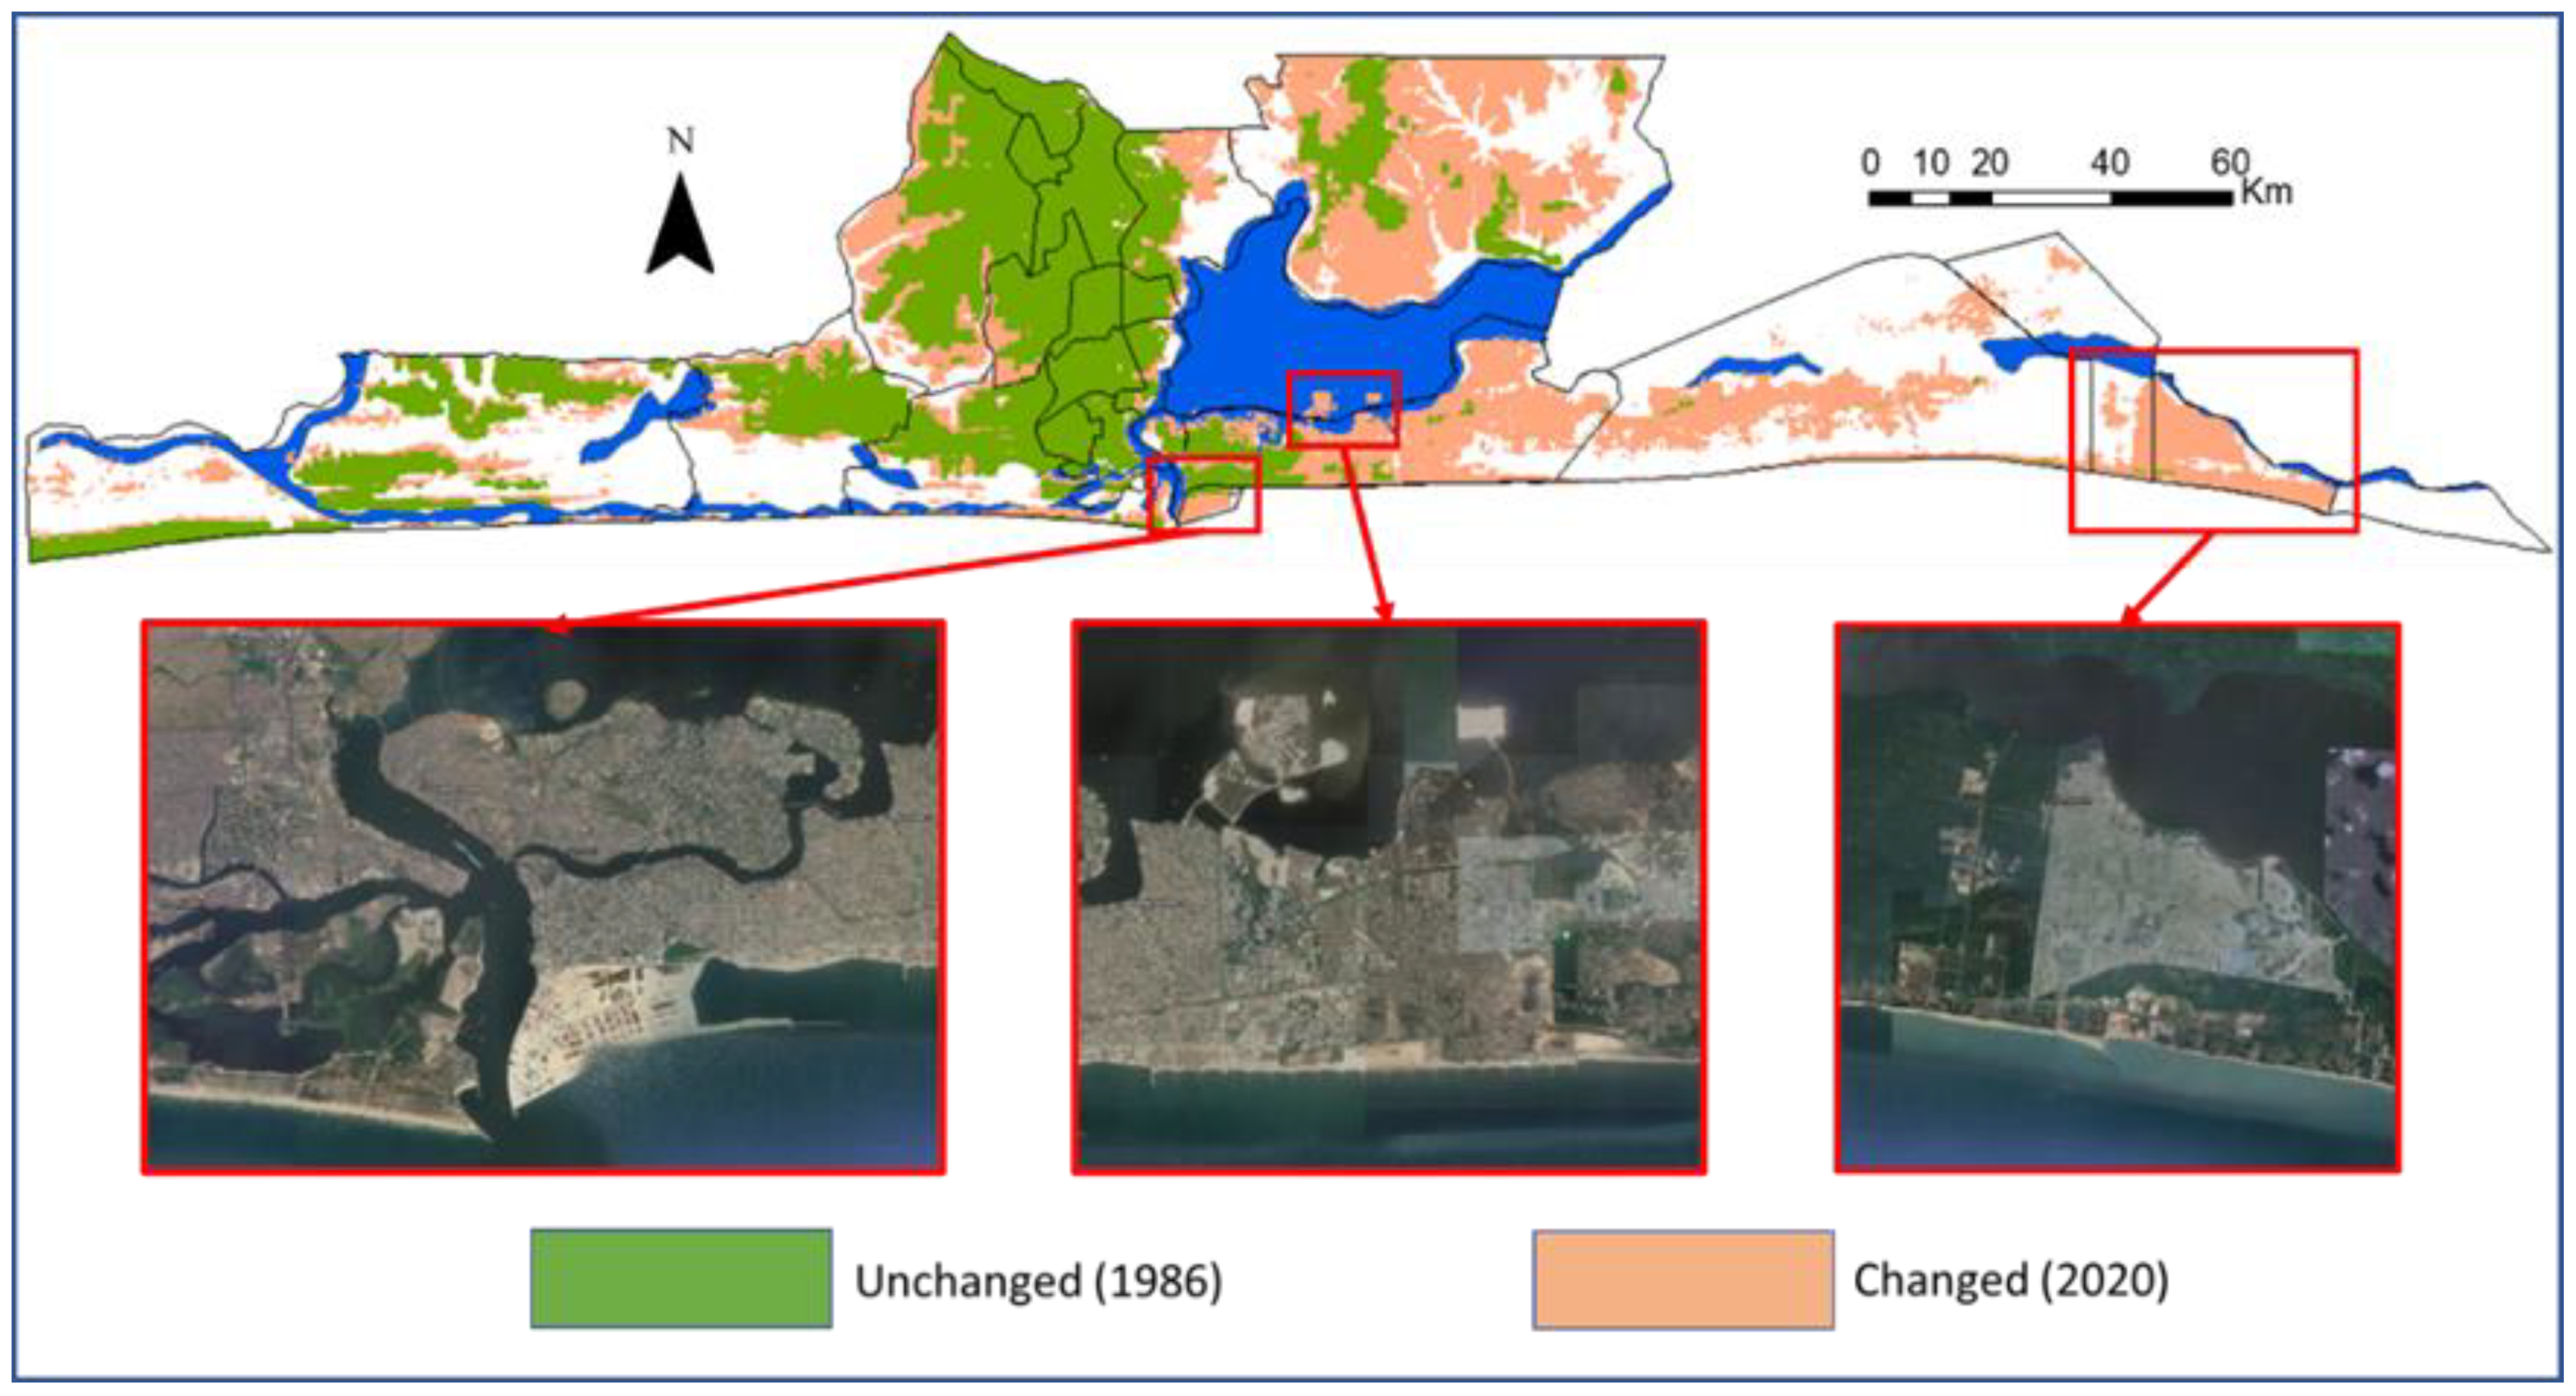
The post-classification change detection analysis resulted in a map showing the transformation of one land cover type to another. The change detection process was estimated for the paired timeframes of 1986–2000, 2000–2016, 2016–2020, and 1986–2020, respectively. Figure 6 visually displays the LULC changes from 1986 to 2020. For the purpose of visual illustration of all changes, especially those related to developed areas, we grouped all changes from water-developed, wetland-developed, and vegetation-developed together as developed areas for 2020 (developed area 2020) in Figure 6a. We kept these land cover changes separate in Figure 6b. In contrast, developed areas in 1986 were classified as developed to developed in Figure 6b and within the cross-hatched area in the landcover change map of Figure 6a. Overall, half (52%) of the total study area changed between 1986 and 2020.
Assessment of the post-classification change detection accuracy was carried out by comparing the changed areas to Google Earth imagery and identifying areas of known changes in Lagos State. Figure 7 is the visual comparison of three areas of known changes to our change detection map. In Figure 7, the Google Earth image on the left is the Eko Atlantic in Lagos State; the middle image represents two reclaimed islands through dredging. The image on the right is the Dangote refineries still under construction.
3.3. Flood Hazard Mapping
We applied the weighted overlay method in creating the flood hazard map. In order to perform this analysis, we estimated the weights of the seven criteria identified as contributing factors to flooding in Lagos State. The AHP and Shannon Entropy weighting methods were used for the weight estimation, and eventually, a combined (Hybrid) weight was adopted in our hazard map production. Table 5 summarizes the result of the AHP weighting method, which is considered a subjective method of criteria weight estimation. The method weighted rainfall intensity (31.9%) more than the other criteria and suggests the criterion to be the most important criteria for flood hazard in the study area. However, the entropy weighting method is considered an objective method of generating criteria weights. The method weighted elevation (34.0%) more than the other criteria. A combination (hybrid) of both methods’ values by simply averaging them gave elevation (30.3%) more weights than the other criteria.
The weighted overlay calculations gave a range of values from zero to one where values close to one would be very high flood hazard zones, and values close to zero would be low flood hazard zones. We reclassified the flood hazard map using the Jenks natural breaks classification into five categories: very high, high, moderate, low, and very low.
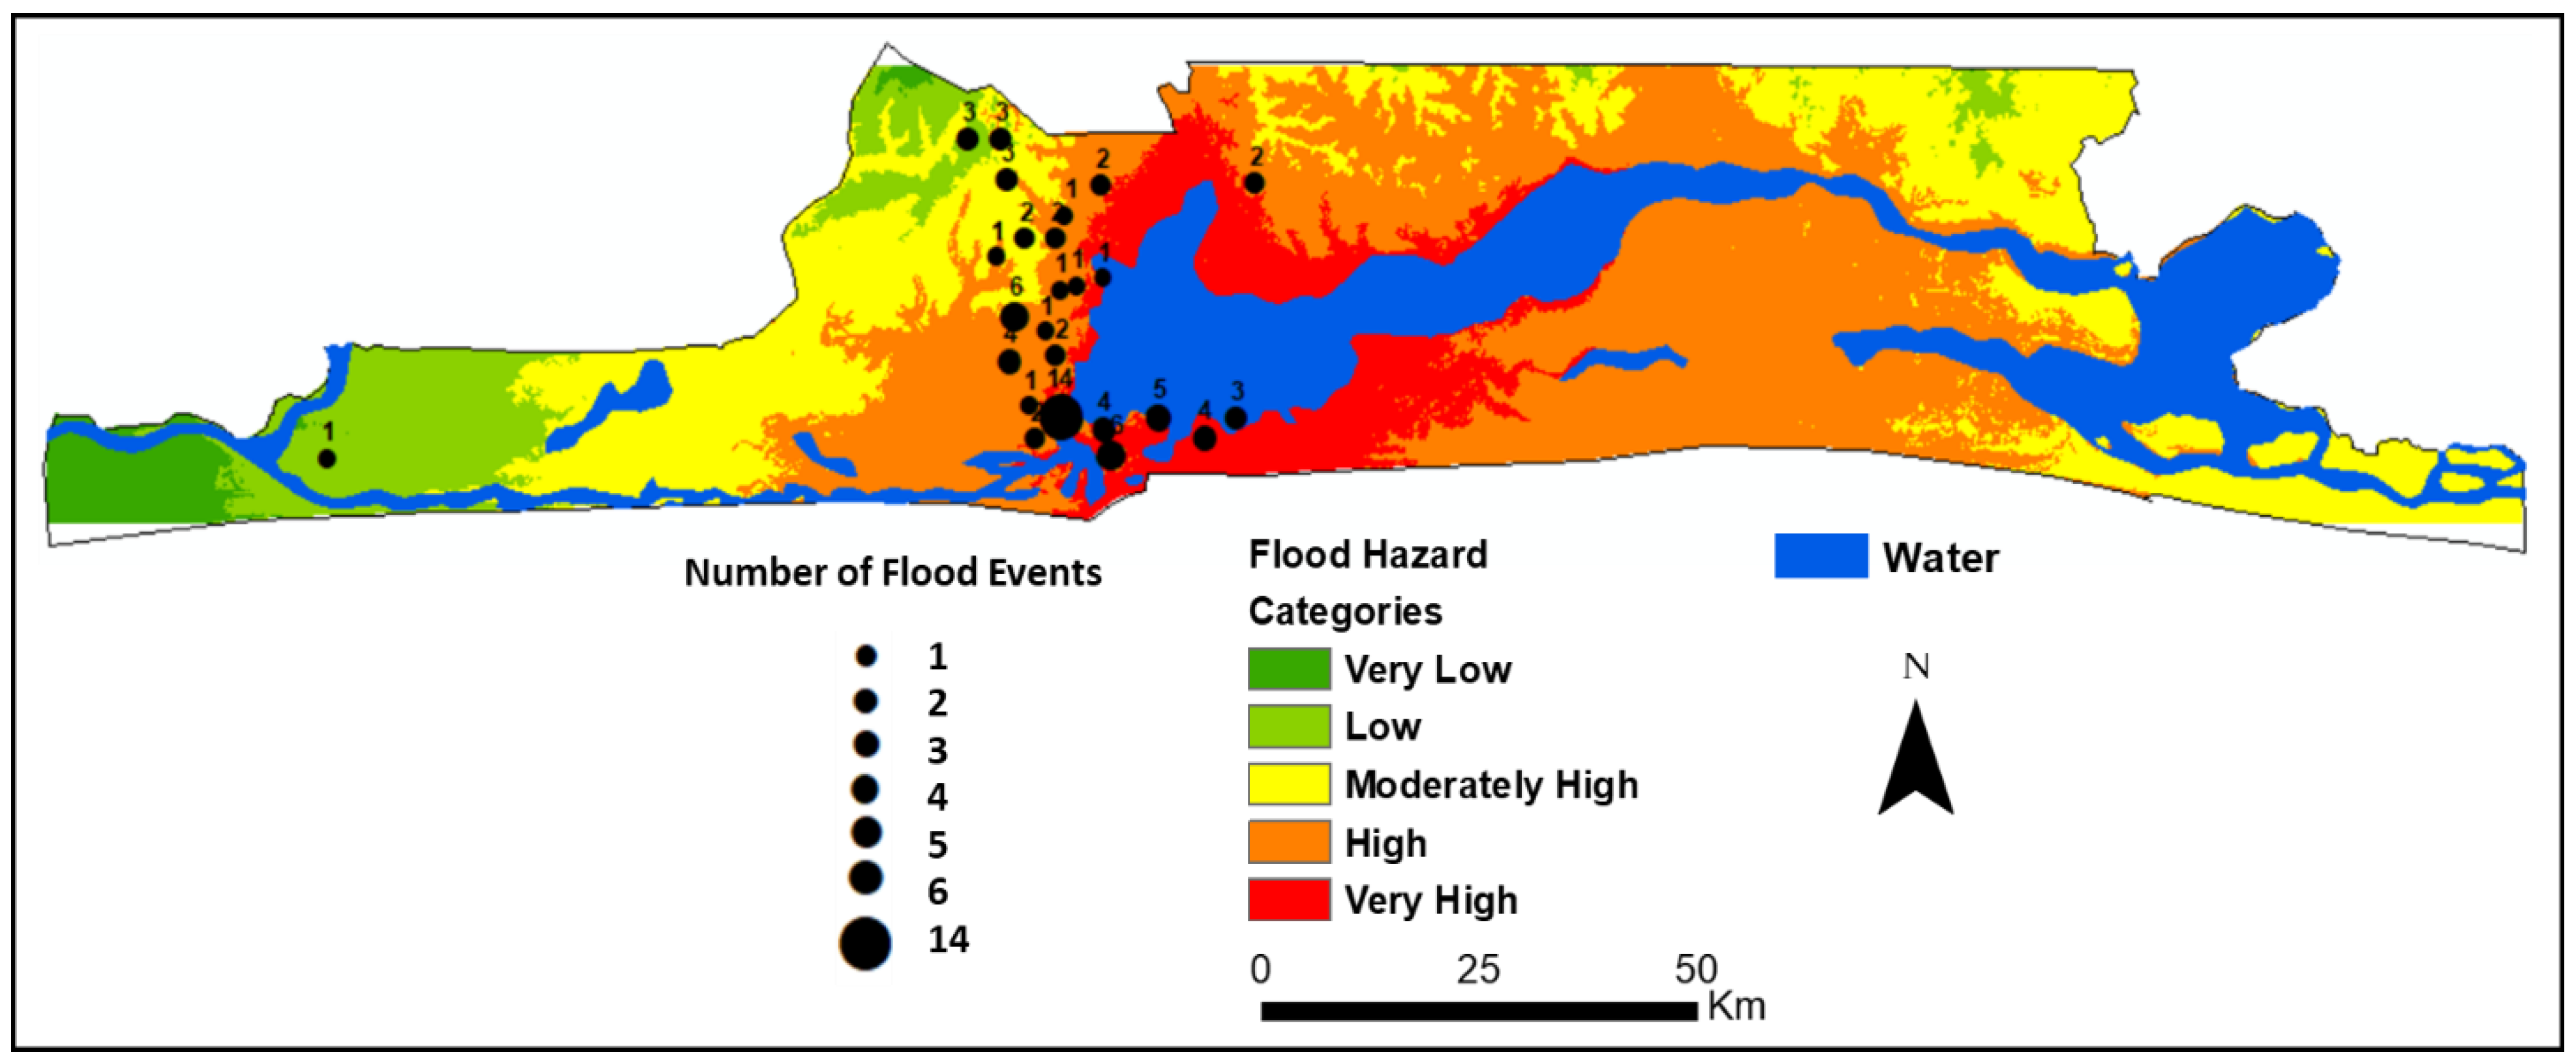
For validation, the resulting flood hazard map produced from the weighted overlay method was compared to past flood inventory in Lagos State (Figure 8 and Table 6). The past flood events were represented with points proportional to the number of repeated flood events for that particular area (Figure 8). We extracted the flood hazard zones’ values to the flood inventory points (Table 6) and found that 92% of the points fell within the very high to moderate flood hazard zones, while 8% was within the low flood hazard zone. In general, the flood inventory points show good agreement with our flood mapping and flood hazard classification.
In addition to comparing the flood hazard map to past flood events, we also compared the flood hazard map to the DFO-reported flood in Lagos State. Each entry in Table 7 represents a discrete flood event displayed in polygons with the center point coordinates. For our study area, large flood events archived by the DFO are for the years 1990, 2002, 2004, and 2007, respectively (Table 7). The areas where the DFO reported flooding were within the flood hazard zone of the map we produced.
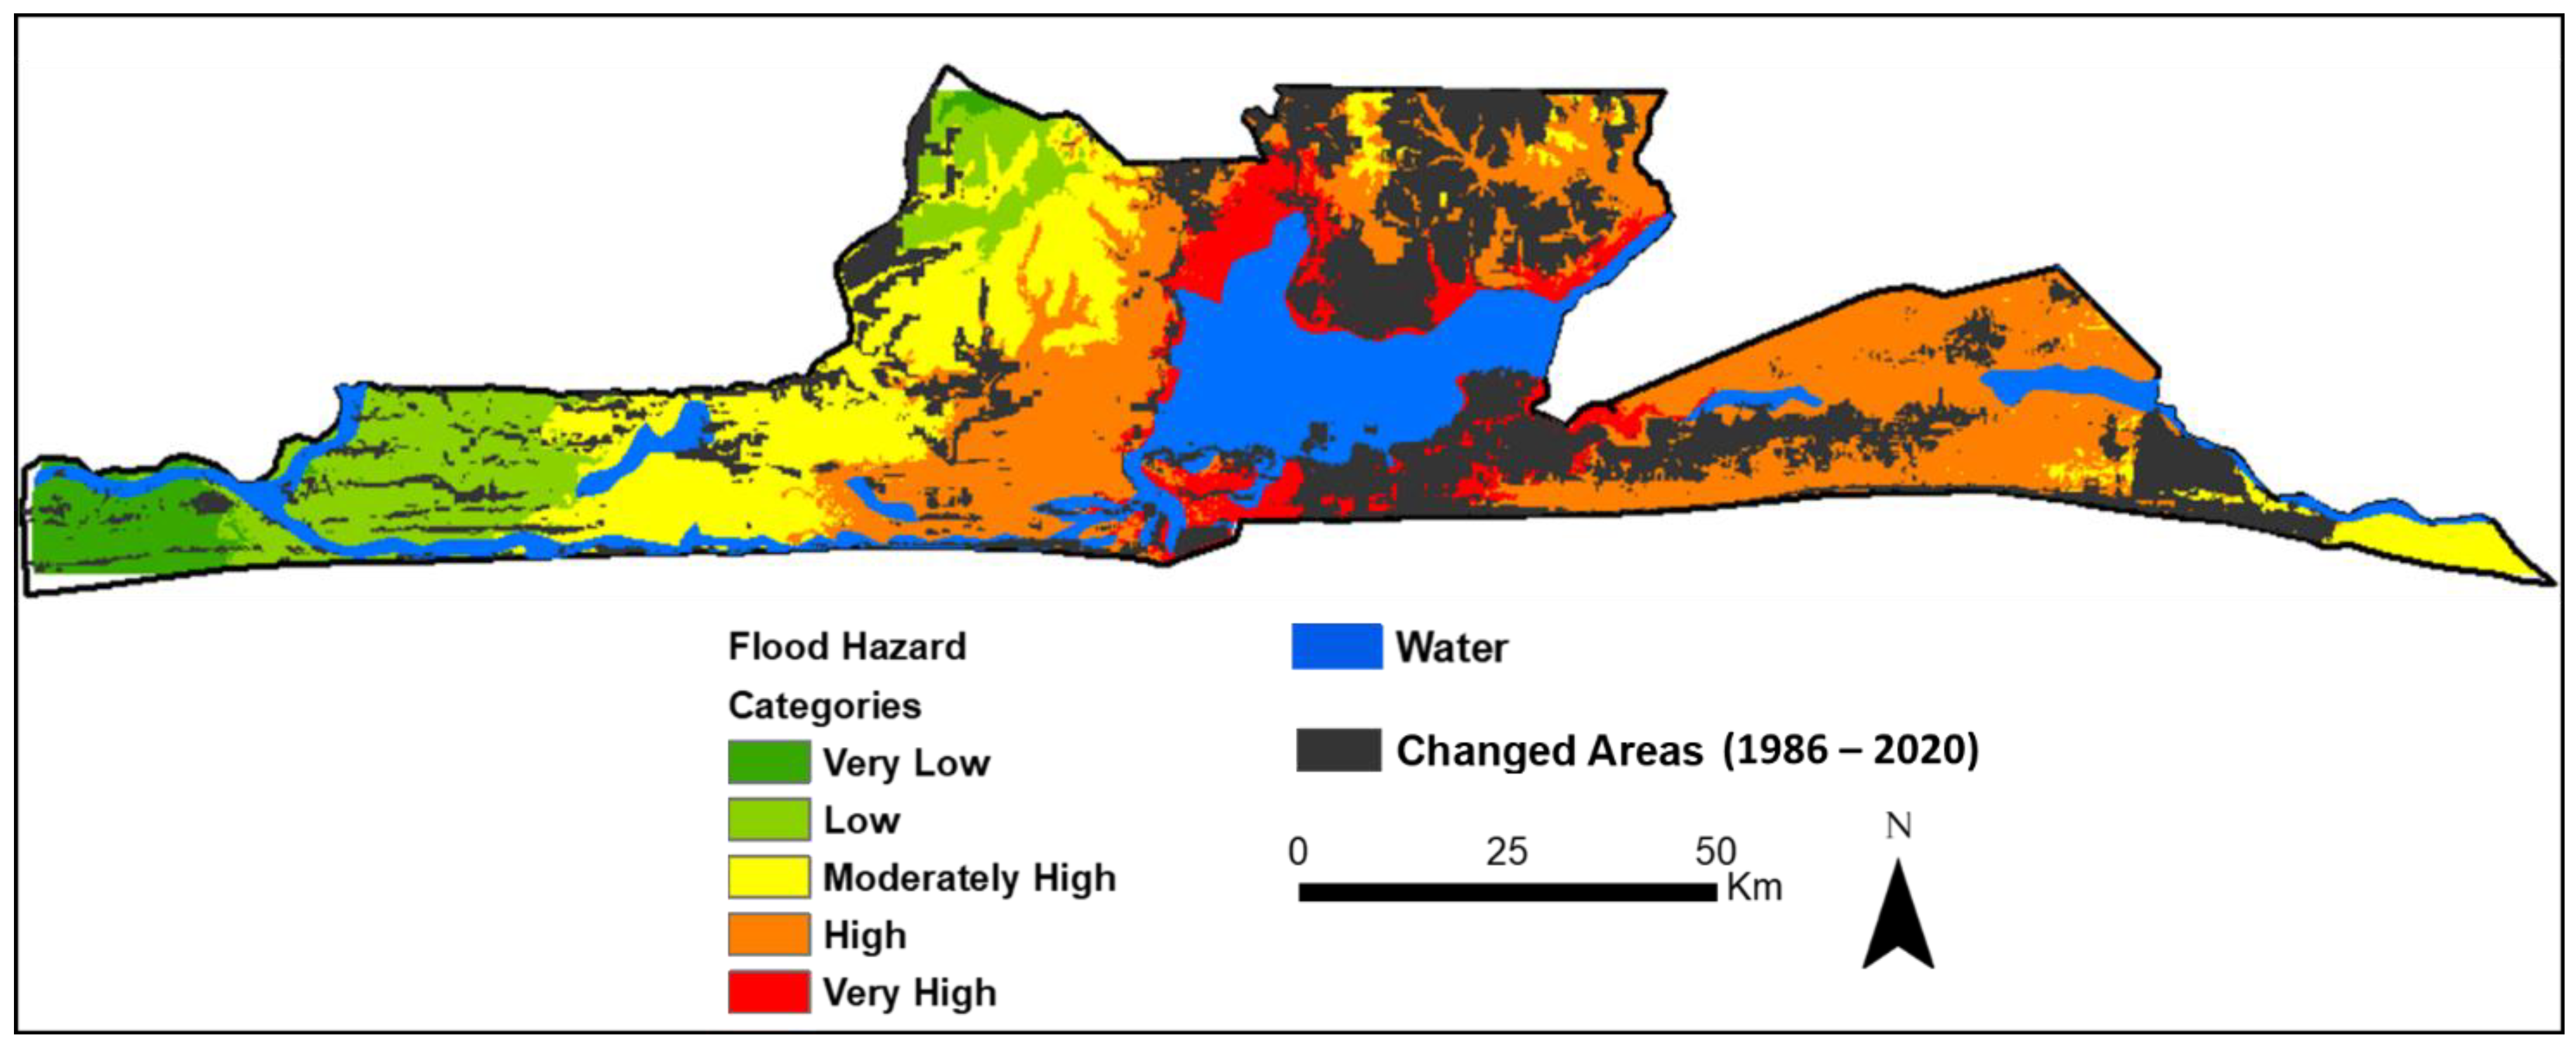
Since part of our analysis is seeking the impact of urbanization on the incessant flooding in Lagos State, we superimposed the LULC map of developed areas from 1986 to 2020 on the flood hazard map to aid visual interpretation. We also converted the developed area raster layer to points and extracted the flood hazard map values to each of the points. The result (Table 8 and Figure 9) revealed that approximately 91% of the points correspond to very high to moderate flood hazard zones. This outcome indicates a strong correlation between developed areas and flood events, which could imply that urbanization is responsible for increasing flood hazards in Lagos State. With over 90% of the centroids of developed areas inside the very high to moderate flood zones, we infer that Lagos State is in exceedingly flood-prone areas.
4. Discussion
We classified the study area into four major land cover types, including water, wetland, vegetation, and the developed areas, based on satellite images acquired in 1986, 2000, 2016, and 2020. Rapid growth in population results in urban sprawl into wetland and lagoons areas. The creation of impervious surfaces and ultimately more runoff could be the major reason for flooding in Lagos State.
The post-classification change detection analysis resulted in a map showing the transformation of one land cover type to another. The change detection process was estimated for the paired timeframes of 1986–2000, 2000–2016, 2016–2020, and 1986–2020, respectively. Figure 6 visually displays the LULC changes from 1986 to 2020. Our study revealed that of all the land cover types identified in Lagos State, decrement in wetland and increment in developed areas consist of the most land cover changes from 1986 to 2020. Our study further revealed that urban development encroachment into wetland areas is supported by estimating the wetland areas and developed land areas in 1986 and 2020, respectively. With 33% of the study area’s total area, the wetland was the primary land cover in 1986, and it became the least with 10.3% of the total area by 2020. The developed area also increased from 26% to 50% of the total area, almost doubling in the study area over 35 years. The areas of vegetation and water bodies remained approximately the same over the same period.
Seven causative criteria or contributing factors were used for flood hazard mapping. We used the weighted overlay MCDC method in combining these criteria and creating the flood hazard map. The weights of the seven criteria were estimated by a combined (hybrid) AHP and Shannon Entropy methods. We reclassified the resulting flood hazard map using the Jenks natural breaks classification into five categories: very high, high, moderate, low, and very low. Our results have also shown that over the years, urbanization has been happening in areas susceptible to very high to moderately high flood hazard zones, which is evident by the recent increase in flood occurrence in these areas.
We could not perform an accuracy assessment based on ground referencing or ground-truthing due to the lack of field data. Instead, we compared our classified maps to higher resolution images from Google Earth. An assessment of its accuracy was made to evaluate the reliability of the classified images. The outcome of the accuracy assessment of the LULC classification against the Google Earth imagery showed that 93 of 100 points were correctly classified. Evaluation of the accuracy of the post-classification change detection was also carried out by comparing the changed areas to higher resolution Google Earth imagery due to the unavailability of in situ data. Three areas within known LULC changes in Lagos State were used for the comparisons. These comparisons show good agreement. For validation of flooding analysis, the flood hazard map produced from this study was compared to flood inventory in Lagos State. The comparison showed that 92% of the flooding events fell within the very high to moderate flood hazard zones, while 8% was within the low flood hazard zone. In general, the flood inventory points show good agreement with our flood mapping and flood hazard classification. In addition, we also compared the flood hazard map to the DFO reported flood in Lagos State. The large flood events archived by the DFO were within the flood hazard areas of the map produced in this study. The highlights of our study include (1) introduced a map-matrix-based, post-classification LULC change detection method to estimate multi-year land cover changes over a few decades; (2) used a combined (hybrid) Analytical Hierarchy Process (AHP) and Shannon Entropy weighting method to carry out a weighted overlay MCDM flooding mapping; (3) put the LULC changes in the context of flood hazards and identify the possible causes of continuous rise in flooding in Lagos State, Nigeria.
5. Conclusions
Lagos State is bounded on the south by the Atlantic Ocean, which makes it flood-prone geographically., Our study reveals the extent to which different regions of the State are vulnerable to flooding and provides insights for urban planning, urban regulation, hazard awareness, insurance of property, and mitigation actions to alleviate flood hazards. Lagos is currently a megacity with a population of over 21 million people, and at the present rate of population rise, 2.5 billion people will live in urban areas by 2050. More so, our study revealed that there is a significant loss of wetland, and this has doubled in developed areas during the past few decades. Most developed areas are already in flood hazard zones.
Consequently, more attention should be given to flood mitigation measures for existing and proposed developed areas. Existing developed land cover, such as buildings already situated in flood hazard zones, could be flood-proof to minimize flood damages to properties. New developed areas could make provisions for flooding during the initial design and construction of structures by avoiding floodplains and/or incorporating necessary drainage measures to construct flood-proof facilities.
The assessment of the LULC changes in the context of flooding hazards in Lagos State brings insights into how these changes are worsening the already flood-prone areas. The situation can be mitigated by practicing adequate urban planning and regulation. Inadequate urban planning and lacking regulations have direct consequences of incessant flooding in the State. Additionally, our study emphasized the importance of remote sensing and GIS for LULC assessment and flood studies in developing countries, where there are no data from “standard” hydrology and climatology, and there is an increased rate of urban expansion in high flood hazard zones. Here, we present a low to no cost method to estimate LULC changes and identify flood hazard levels where ground-based data unavailability or security prohibits installing such systems. It should be emphasized that the accuracy of the presented method cannot be compared with modern techniques based on well-sampled water bodies. Still, in this case, those data are practically inaccessible. Our study tackled a complex problem with the help of publicly available data and their detailed analysis.
Author Contributions
Conceptualization, D.I. and W.Z.; methodology, D.I.; software, D.I. and W.Z.; validation, D.I.; formal analysis, D.I.; investigation, D.I.; resources, W.Z.; data curation, D.I.; writing—original draft preparation, D.I.; writing—review and editing, W.Z.; visualization, D.I.; supervision, W.Z.; project administration, W.Z.; funding acquisition, D.I. and W.Z. All authors have read and agreed to the published version of the manuscript.
Funding
This work was funded by the American Association of University Women (AAUW) scholarship in 2018 and the Chevron international fellowship at the Colorado School of Mines in 2019.
Institutional Review Board Statement
Not applicable.
Informed Consent Statement
Not applicable.
Data Availability Statement
The data presented in this work are available upon request from the corresponding author.
Acknowledgments
The authors would like to thank the anonymous reviewers whose contributions have led to the improvement of this paper.
Conflicts of Interest
The authors declare no conflict of interest.
References
- United Nations: World Urbanization Prospects: The 2014 revision. United Nations Department of Economic and Social Affairs Rep. p. 517. Available online: https://population.un.org/wup/Publications/Files/WUP2014-Report.pdf (accessed on 27 January 2021).
- Idowu, T.E.; Home, P.G. Probable Effects of Sea Level Rise and Land Reclamation Activities on Coastlines and Wetlands. In Proceedings of the 2015 Jomo Kenyata University of Agriculture and Technology Scientific Conference, Nairobi, Kenya, 12–13 November 2015; pp. 207–220. [Google Scholar]
- Eko Atlantic—The New Gateway to Africa. Available online: http://www.ekoatlantic.com/wpcontent/uploads/2012/12/EKOATLANTIC_Broch_2012.pdf (accessed on 6 September 2015).
- Barrington-Leigh, C.; Millard-Ball, A. A century of sprawl in the United States. Proc. Natl. Acad. Sci. USA 2015, 112, 8244–8249. [Google Scholar] [CrossRef] [Green Version]
- Idowu, D.; Zhou, W. Land Use/Land Cover Measurements and Flood Hazard Mapping in Lagos State, Nigeria. In Proceedings of the 3rd Conference of the Arabian Journal of Geosciences (CAJG), Tunisia, Tunisia, 2–5 November 2020. in press. [Google Scholar]
- Mahesh, K.J.; Garg, P.K.; Deepak, K. Monitoring and modelling of urban sprawl using remote sensing and GIS techniques. Int. J. Appl. Earth Obs. Geoinf. 2008, 10, 26–43. [Google Scholar] [CrossRef]
- Sudhira, H.S.; Ramachandra, T.V.; Jagadish, K.S. Urban sprawl: Metrics, dynamics and modelling using GIS. Int. J. Appl. Earth Obs. Geoinf. 2004, 5, 29–39. [Google Scholar] [CrossRef]
- Yang, X.; Liu, Z. Use of satellite derived landscape imperviousness index to characterize urban spatial growth. Comput. Environ. Urban Syst. 2005, 29, 524–540. [Google Scholar] [CrossRef]
- Haack, B.N.; Rafter, A. Urban growth analysis and modelling in the Kathmandu valley Nepal. Habitat Int. 2006, 30, 1056–1065. [Google Scholar] [CrossRef]
- Gomarasca, M.A.; Brivio, P.A.; Pagnoni, F.; Galli, A. One century of land use changes in the metropolitan area of Milan (Italy). Int. J. Remote Sens. 1993, 14, 211–223. [Google Scholar] [CrossRef]
- Green, K.; Kempka, D.; Lackey, L. Using remote sensing to detect and monitor land-cover and land-use change. Photogr. Eng. Remote Sens. 1994, 60, 331–337. [Google Scholar]
- Yeh, A.G.O.; Li, X. Measurement and monitoring of urban sprawl in a rapidly growing region using entropy. Photogr. Eng. Remote Sens. 2001, 67, 83. [Google Scholar]
- Yang, X.; Lo, C.P. Modelling urban growth and landscape changes in the Atlanta metropolitan area. Int. J. Geogr. Inform. Sci. 2003, 17, 463–488. [Google Scholar] [CrossRef]
- Radke, J.; Andra, S.; Al-Kofani, O.; Roysan, B. Image change detection algorithms: A systematic survey. IEEE Trans. Image Process. 2005, 14, 291–307. [Google Scholar] [CrossRef]
- Tewolde, M.G.; Cabral, P. Urban Sprawl Analysis and Modeling in Asmara, Eritrea. Remote Sens. 2011, 3, 2148–2165. [Google Scholar] [CrossRef] [Green Version]
- Magidi, J.; Ahmed, F. Assessing urban sprawl using remote sensing and landscape metrics: A case study of City of Tshwane, South Africa (1984–2015). Egypt. J. Remote Sens. Space Sci. 2019, 22, 335–346. [Google Scholar] [CrossRef]
- Adeloye, A.; Rustum, R. Lagos (Nigeria) flooding and influence of urban planning. Proc. Inst. Civ. Eng. Urban Des. Plan. 2011, 164, 175–187. [Google Scholar] [CrossRef]
- Adelekan, I.O. Vulnerability of poor urban coastal communities to flooding in Lagos, Nigeria. Environ. Urban. 2010, 22, 433–450. [Google Scholar] [CrossRef] [Green Version]
- Nkwunonwo, U.C.; Whitworth, M.; Baily, B. Review article: A review and critical analysis of the efforts towards urban flood risk management in the Lagos region of Nigeria. Nat. Hazards Earth Syst. Sci. 2016, 16, 349–369. [Google Scholar] [CrossRef] [Green Version]
- Ritchie, H.; Roser, M. “Urbanization”. Published Online at OurWorldInData.org. 2018. Available online: https://ouworldindata.org/urbanization (accessed on 2 April 2021).
- Miller, J.D.; Hutchins, M. The impacts of urbanisation and climate change on urban flooding and urban water quality: A review of the evidence concerning the United Kingdom. J. Hydrol. Reg. Stud. 2017, 12, 345–362. [Google Scholar] [CrossRef] [Green Version]
- Srivastava, A.; Kumari, N.; Maza, M. Hydrological Response to Agricultural Land Use Heterogeneity Using Variable Infiltration Capacity Model. Water Resour. Manag. 2020, 34, 3779–3794. [Google Scholar] [CrossRef]
- Maza, M.; Srivastava, A.; Bisht, D.S.; Raghuwanshi, N.S.; Bandyopadhyay, A.; Chatterjee, C.; Bhadra, A. Simulating the hydrological response of a monsoon dominated reservoir catchment and command with heterogeneous cropping pattern using VIC model. J. Earth Syst. Sci. 2020, 129, 1–16. [Google Scholar] [CrossRef]
- Konrad, C.P. Effects of Urban Development on Floods; Fact Sheet 076-03; U.S. Geological Survey: Tacoma, WA, USA, 2016. Available online: https://pubs.usgs.gov/fs/fs07603/ (accessed on 25 February 2021).
- Konrad, C.P.; Booth, D.B. Hydrologic Trends Associated with Urban Development for Selected Streams in Western Washington: U.S. Geological Survey Water-Resources Investigations Report 2002. 02-4040. 2002; p. 40. Available online: http://water.usgs.gov/pubs/wri/wri024040 (accessed on 25 February 2021).
- Rahmati, O.; Pourghasemi, H.R. Identification of Critical Flood Prone Areas in Data-Scarce and Ungauged Regions: A Comparison of Three Data Mining Models. Water Resour. Manag. 2017, 31, 1473–1487. [Google Scholar] [CrossRef]
- Spachinger, K.; Dorner, W.; Metzka, R.; Serrhini, K.; Fuchs, S. Flood risk and flood hazard maps—Visualization of hydrological risks. IOP Conf. Ser. Earth Environ. Sci. 2008, 4, 012043. [Google Scholar] [CrossRef] [Green Version]
- Brunner, G.W. HEC-RAS, River Analysis System Hydraulic Reference Manual; US Army Corps of Engineers Hydrologic Engineering Center: Davis, CA, USA, 2016; pp. 1–547.
- Thiemig, V.; Bisselink, B.; Pappenberger, F.; Thielen, J. A pan-African flood forecasting system Hydrol. Earth Syst. Sci. Discuss 2014, 11, 5559–5597. [Google Scholar]
- Kossi, K.; Jeffrey, N.; Mark, A.T.; Bernd, D. Modelling of flood hazard extent in data sparse areas: A case study of the Oti River basin, West Africa. J. Hydrol. Reg. Stud. 2017, 10, 122–132. [Google Scholar] [CrossRef] [Green Version]
- Brakenridge, G.R. Flood Risk Mapping From Orbital Remote Sensing. In Global Flood Hazard: Pllications in Modeling, Mapping, and Forecasting (Geophysical Monograph Series), 1st ed.; Schumann, G.J.-P., Bates, P.D., Apel, H., Aronica, G.T., Eds.; American Geophysical Union and Wiley: New York, NY, USA, 2018. [Google Scholar] [CrossRef]
- Argaz, A.; Ouahman, B.; Darkaoui, A.; Bikhtar, H.; Ayouch, E.; Lazaar, R. Flood Hazard Mapping Using remote sensing and GIS Tools: A case study of Souss Watershed. J. Mater. Environ. Sci. 2019, 10, 170–181. [Google Scholar]
- Gashaw, W.; Legesse, D. Flood Hazard and Risk Assessment Using GIS and Remote Sensing in Fogera Woreda, Northwest Ethiopia. In Nile River Basin; Melesse, A.M., Ed.; Springer: Dordrecht, The Netherlands, 2011. [Google Scholar] [CrossRef]
- Rincon, D.; Khan, U.; Armenakis, C. Flood risk mapping using gis and multi-criteria analysis: A greater Toronto area case study. Geosciences 2018, 8, 275. [Google Scholar] [CrossRef] [Green Version]
- Fernández, D.S.; Lutz, M.A. Urban flood hazard zoning in Tucumán Province, Argentina, using GIS and mul-ticriteria decision analysis. Eng. Geol. 2010, 111, 90–98. [Google Scholar] [CrossRef]
- Gamper, C.; Thöni, M.; Weck-Hannemann, H. A conceptual approach to the use of cost benefit and multi criteria analysis in natural hazard management. Nat. Hazards Earth Syst. Sci. 2006, 6, 293–302. [Google Scholar] [CrossRef] [Green Version]
- Omid, R.; Hossein, Z.; Mosa, B. Flood hazard zoning in Yasooj region, Iran, using GIS and multi-criteria decision analysis. Geomat. Nat. Hazards Risk 2016, 7, 1000–1017. [Google Scholar] [CrossRef] [Green Version]
- Elsheikh, R.; Ouerghi, S.; Elhag, A. Flood Risk Map Based on GIS, and Multi Criteria Techniques (Case Study Terengganu Malaysia). J. Geogr. Inf. Syst. 2015, 7, 348–357. [Google Scholar] [CrossRef] [Green Version]
- Odu, G. Weighting methods for multicriteria decision making technique. J. Appl. Sci. Environ. Manag. 2019, 23, 1449–1457. [Google Scholar]
- Semmens, S.N.; Zhou, W.; van Wesenbeeck, B.K.; Santi, P.M. Application of Multiple Criteria Decision Making Model for Evaluation of Levee Sustainability. Environ. Eng. Geosci. 2017, 23, 65–78. [Google Scholar] [CrossRef]
- Seejata, K.; Yodying, A.; Wongthadam, T.; Mahavik, N.; Tantanee, S. Assessment of flood hazard areas using Analytical Hierarchy Process over the Lower Yom Basin, Sukhothai. Prov. Procedia Eng. 2018, 212, 340–347. [Google Scholar] [CrossRef]
- Gigović, L.; Pamučar, D.; Bajić, Z.; Drobnjak, S. Application of GIS-Interval Rough AHP Methodology for Flood Hazard Mapping in Urban Areas. Water 2017, 9, 360. [Google Scholar] [CrossRef] [Green Version]
- Yagoub, M.M.; Alsereidi, A.A.; Mohamed, E.A. Newspapers as a validation proxy for GIS modeling in Fujairah, United Arab Emirates: Identifying flood-prone areas. Nat. Hazards 2020, 104, 111–141. [Google Scholar] [CrossRef]
- Radwan, F.; Alazba, A.A.; Mossad, A. Flood risk assessment and mapping using AHP in arid and semiarid regions. Acta Geophys. 2019, 67, 215–229. [Google Scholar] [CrossRef]
- Danumah, J.H.; Odai, S.N.; Saley, B.M. Flood risk assessment and mapping in Abidjan district using multi-criteria analysis (AHP) model and geoinformation techniques (cote d’ivoire). Geoenviron. Disasters 2016, 3, 10. [Google Scholar] [CrossRef] [Green Version]
- Chen, J.; Li, Y.; Zhou, W.; Xu, C.; Wu, S.; Yue, W. AHP-Based Susceptibility Assessment on Debris Flows in Semiarid Mountainous Region: A Case of Benzilan-Changbo Segment in the Upper Jinsha River, China. In Geo-Spatial Knowledge and Intelligence. GSKI 2017; Yuan, H., Geng, J., Liu, C., Bian, F., Surapunt, T., Eds.; Communications in Computer and Information Science; Springer: Singapore, 2018; Volume 848, pp. 495–509. [Google Scholar]
- Zhou, W.; Minnick, M.; Chen, J.; Garret, J.; Acikalin, E. GIS-based Landslide Susceptibility Analysis Methods Suitable for Different Sizes of Study Area. Nat. Hazards Rev. 2021, in press. [Google Scholar] [CrossRef]
- Malczewski, J.; Rinner, C. Multicriteria Decision Analysis in Geographic Information Science; Springer: New York, NY, USA, 2015; p. 335. [Google Scholar]
- Nyimbili, P.H.; Erden, T. A Hybrid Approach Integrating Entropy-AHP and GIS for Suitability Assessment of Urban Emergency Facilities. ISPRS Int. J. Geo Inf. 2020, 9, 419. [Google Scholar] [CrossRef]
- Wu, S.; Chen, J.; Xu, C.; Zhou, W. Susceptibility Assessments and Validations of Debris-Flow Events in Meizoseismal Areas: Case Study in China’s Longxi River Watershed. Nat. Hazards Rev. 2020, 21, 1–13. [Google Scholar] [CrossRef]
- Chen, J.; Li, Y.; Zhou, W.; Iqbal, J.; Cui, Z. Debris-Flow Susceptibility Assessment Model and Its Application in Semiarid Mountainous Areas of the Southeastern Tibetan Plateau. Nat. Hazards Rev. 2017, 18. [Google Scholar] [CrossRef]
- Ouma, Y.O.; Tateishi, R. Urban flood vulnerability and risk mapping using integrated multi-parametric AHP and GIS: Methodological overview and case study assessment. Water 2014, 6, 1515–1545. [Google Scholar] [CrossRef]
- Stefanidis, S.; Stathis, D. Assessment of flood hazard based on natural and anthropogenic factors using analytic hierarchy process (AHP). Nat. Hazards 2013, 68, 569–585. [Google Scholar] [CrossRef]
- Vanolya, N.M.; Jelokhani-Niaraki, M. The use of subjective–objective weights in GIS-based multi-criteria decision analysis for flood hazard assessment: A case study in Mazandaran. Iran. Geoj. 2019, 86, 1–20. [Google Scholar]
- Mamdouh, M.E. Applying post classification change detection technique to monitor an Egyptian coastal zone (Abu Qir Bay). Egypt. J. Remote Sens. Space Sci. 2016, 19, 23–36. [Google Scholar] [CrossRef] [Green Version]
- Hafez, A.A. Evaluation of change detection techniques for monitoring land-cover changes: A case study in new Burg El-Arab area. Alex. Eng. J. 2011, 50, 187–195. [Google Scholar] [CrossRef] [Green Version]
- Al-doski, J.; Mansor, S.B.; Shafri, H.Z.M. Change detection process and techniques. Civ. Environ. Res. 2013, 3, 37–45. [Google Scholar]
- Lu, D.; Mausel, P.; Brondízio, E.; Moran, E. Change detection techniques. Int. J. Remote Sens. 2004, 25, 2365–2401. [Google Scholar] [CrossRef]
- Jensen, J.R.; Ramsat, E.W.; Mackey, H.E.; Christensen, E.J.; Sharitz, R.P. Inland wetland change detection using air-craft MSS data. Photogramm. Eng. Remote Sens. 1987, 53, 521–529. [Google Scholar]
- Anderson, J.R.; Hardy, E.E.; Roach, J.T.; Witmer, R.E. A Land Use and Land Cover Classification System for Use with Remote Sensor Data. U.S. Geol. Surv. Prof. Pap. 1976, 964, 28. [Google Scholar]
- Dimyati, M.; Mizuno, K.; Kobayashi, S.; Kitamura, T. An analysis of land use/cover change using the combination of MSS Landsat and land use map-a case study in Yogyakarta, Indonesia. Int. J. Remote Sens. 1996, 17, 931–944. [Google Scholar] [CrossRef]
- Fichera, C.R.; Modica, G.; Pollino, M. Land cover classification and change-detection analysis using multi-temporal remote sensed imagery and landscape metrics. Eur. J. Remote Sens. 2012, 45, 1–18. [Google Scholar] [CrossRef]
- Macleod, R.D.; Congalton, R.G. A quantitative comparison of change-detection algorithms for monitoring eel-grass from remotely sensed data. Photogramm. Eng. Remote Sens. 1998, 64, 207–216. [Google Scholar]
- Ward, D.; Phinn, S.R.; Murray, A.T. Monitoring growth in rapidly urbanizing areas using remotely sensed data. Prof. Geogr. 2000, 52, 371–386. [Google Scholar] [CrossRef]
- Cirella, G.T.; Iyalomhe, F.O. Flooding Conceptual Review: Sustainability-Focalized Best Practices in Nigeria. Appl. Sci. 2018, 8, 1558. [Google Scholar] [CrossRef] [Green Version]
- Ozkan, S.P.; Tarhan, C. Detection of Flood Hazard in Urban Areas Using GIS: Izmir Case. Procedia Technol. 2016, 22, 373–381. [Google Scholar] [CrossRef] [Green Version]
- Mukherjee, F.; Singh, D. Detecting flood prone areas in Harris County: A GIS based analysis. GeoJournal 2020, 85, 647–663. [Google Scholar] [CrossRef]
- Boakye, K.O.; Isaac, A.; Anthony, E.; Etornam, B.F. Assessment of flood prone zones in the Tarkwa mining area of Ghana using a GIS-based approach. Environ. Chall. 2021, 3, 100028. [Google Scholar] [CrossRef]
- Jamal, M.S.; Ibne, A.; Imtiaz Saimon, M.N.; Afrin, S.; Islam, S.; Mila, S.A.; Sazzad, T.M.S. GIS Based Information System to Identify Flood Prone Area in Bangladesh. In Proceedings of the 2nd International Conference on Sustainable Technologies for Industry 4.0 (STI), Dhaka, Bangladesh, 19–20 December 2020; pp. 1–4. [Google Scholar] [CrossRef]
- Diakakis, M.; Deligiannakis, G.; Pallikarakis, A.; Skordoulis, M. Factors controlling the spatial distribution of flash flooding in the complex environment of a metropolitan urban area. The case of Athens 2013 flash flood event. Int. J. Disaster Risk Reduct. 2016, 18, 171–180. [Google Scholar] [CrossRef]
- Idowu, D.; Zhou, W. Performance Evaluation of a Potential Component of an Early Flood Warning System—A Case Study of the 2012 Flood, Lower Niger River Basin, Nigeria. Remote Sens. 2019, 11, 1970. [Google Scholar] [CrossRef] [Green Version]
- Saaty, T.L. The Analytic Hierarchy Process: Planning, Priority Setting, Resources Allocation 1980; Mcgraw-Hill: New York, NY, USA, 1980. [Google Scholar]
- Shannon, C.E.; Weaver, W. The Mathematical Theory of Communication; University of Illinois Press: Urbana, IL, USA, 1949. [Google Scholar]
Figure 1.
Location map of Lagos State.

Figure 2.
Work flowchart for creating the LULC and LULC change maps.

Figure 3.
Flood hazard mapping workflow.

Figure 4.
LULC classification maps for (a) 1986, (b) 2000, (c) 2016, and (d) 2020 for the State of Lagos, Nigeria.
Figure 4.
LULC classification maps for (a) 1986, (b) 2000, (c) 2016, and (d) 2020 for the State of Lagos, Nigeria.

Figure 5.
Graphical representation of a 34-year LULC change in the study area between (a) 1986 and (b) 2020.
Figure 5.
Graphical representation of a 34-year LULC change in the study area between (a) 1986 and (b) 2020.

Figure 6.
(a) The spatial distribution of developed and undeveloped areas in 1986 (hatched areas) and 2020 (solid color). (b) The distribution of landcover changes in one land cover type with reference to another land cover type from 1986 to 2020.
Figure 6.
(a) The spatial distribution of developed and undeveloped areas in 1986 (hatched areas) and 2020 (solid color). (b) The distribution of landcover changes in one land cover type with reference to another land cover type from 1986 to 2020.

Figure 7.
Land cover changes in comparison to Google Earth Images acquired in 2019 showing changes on the ground for the Eko Atlantic (left), two reclaimed islands through dredging (middle), and the Dangote refineries (right).
Figure 7.
Land cover changes in comparison to Google Earth Images acquired in 2019 showing changes on the ground for the Eko Atlantic (left), two reclaimed islands through dredging (middle), and the Dangote refineries (right).

Figure 8.
Flood hazard map with the number of flood events and past flood inventory points.

Figure 9.
An overlay of developed areas on the flood hazard map.


Table 1.
Summary of the acquired multispectral Landsat scenes.
| Data | Date (Dd/Mm/Yyyy) | Source |
|---|---|---|
| Landsat 5 | 24 December 1986 | Unites States Geological Survey (USGS) |
| Landsat 7 ETM + | 6 February 2000 | |
| Landsat 8 OLI | 10 February 2016 | |
| 20 January 2020 |
Table 2.
Land cover types, descriptions, and their recoded values.
| Land Cover | Description | Recoding Values |
|---|---|---|
| Water | Streams, canals, lakes, bays, and estuaries | 1 |
| Wetland | Swamps, marshes, and mudflats | 5 |
| Vegetation | Agricultural land, rangeland, and forestland | 7 |
| Developed | Urban or built-up land, such as residential, industrial and commercial | 11 |
Table 3.
List of recorded flood events in various locations within Lagos State from 1968 to 2020 compiled based on literature [19] and online news sources (e.g., Aljazeera, Arise News, GistNigeria by Channels, and Floodlist).
Table 3.
List of recorded flood events in various locations within Lagos State from 1968 to 2020 compiled based on literature [19] and online news sources (e.g., Aljazeera, Arise News, GistNigeria by Channels, and Floodlist).
| Location | Dates | Number of Flood Events | Longitude | Latitude |
|---|---|---|---|---|
| Lagos Island | June 1968, July 1970, July 1971, July 1972, July 1990, July 2002, June 2004, July 2005, October 2008, July 2009, October 2010, July 2011, October 2012, and June 2020 | 14 | 3°22′51.695″ E | 6°27′23.17″ N |
| Lekki Phase 1 | June 2015, July 2017, October 2019, and June 2020 | 4 | 3°28′35.334″ E | 6°26′37.688″ N |
| Victoria Island | June 2000, July 2000, September 2000, June 2015, July 2017, and October 2019 | 6 | 3°24′52.979″ E | 6°25′57.26″ N |
| Ijora | June 1968 | 1 | 3°21′35.892″ E | 6°27′53.491″ N |
| Surulere | June 1969, July 1974, October 2010, and June 2020 | 4 | 3°20′50.41″ E | 6°29′34.561″ N |
| Yaba | June 1969 and July 1974 | 2 | 3°22′41.588″ E | 6°29′49.722″ N |
| Idiaraba Mushin | June 1974, May 1999, June 1999, July 1999, July 2011, and June 2020 | 6 | 3°21′5.571″ E | 6°31′15.631″ N |
| Ikorodu | August 1974, June 2015, and June 2020 | 3 | 3°29′51.137″ E | 6°37′39.699″ N |
| Ikoyi | August 2007, June 2000, July 2000, September 2000, and June 2015 | 5 | 3°26′44.157″ E | 6°27′23.17″ N |
| Kosofe | August 2007 and July 2017 | 2 | 3°25′13.193″ E | 6°36′3.682″ N |
| Apapa | October 2010 and June 2015 | 2 | 3°21′51.053″ E | 6°26′37.688″ N |
| Lagos Mainland | June 2015 | 1 | 3°22′16.32″ E | 6°30′45.31″ N |
| Ikeja | July 2011, June 2015, and October 2019 | 3 | 3°20′45.357″ E | 6°36′34.003″ N |
| Oshodi | October 2019 | 1 | 3°20′20.089″ E | 6°33′37.13″ N |
| Badagry | June 2015 | 1 | 2°53′43.177″ E | 6°25′52.206″ N |
| Ketu | June 2015 | 1 | 3°23′1.802″ E | 6°35′13.147″ N |
| Ojota | May 2018 and June 2020 | 2 | 3°22′41.588″ E | 6°34′17.558″ N |
| Bariga | May 2018 | 1 | 3°22′51.695″ E | 6°32′21.327″ N |
| Maryland | May 2018 and October 2019 | 2 | 3°21′30.839″ E | 6°34′17.558″ N |
| Ogba | July 2011, June 2015, and October 2019 | 4 | 3°20′30.196″ E | 6°38′4.967″ N |
| Oworonshoki | May 2018 | 1 | 3°24′32.765″ E | 6°32′46.595″ N |
| Shomolu | May 2018 | 1 | 3°23′32.123″ E | 6°32′31.434″ N |
| Ebute Ero | October 2010, July 2011, October 2012, and June 2020 | 4 | 3°24′32.765″ E | 6°26′57.902″ N |
| Agege | July 2011, June 2015, and October 2019 | 3 | 3°19′9.34″ E | 6°38′4.967″ N |
| Agbede | June 2015 and June 2020 | 2 | 3°30′36.619″ E | 6°36′23.896″ N |
Table 4.
Pair-wise percentage change for the year of study.
| Land-Cover Types | Percentage Change (%) | |||
|---|---|---|---|---|
| 1986–2000 | 2000–2016 | 2016–2020 | 1986–2020 | |
| Water | 5 | −6 | −3 | −4 |
| Wetland | −50 | −43 | 8 | −69 |
| Vegetation | 24 | −18 | −3 | −2 |
| Developed | 37 | 40 | 1 | 94 |
Table 5.
Criteria weights from the AHP, Entropy, and Hybrid weighting methods.
| Criteria | AHP Weights (%) | Entropy Weights (%) | Hybrid Weight (%) |
|---|---|---|---|
| Elevation | 26.5 | 34.0 | 30.3 |
| Rain | 31.9 | 20.4 | 26.2 |
| FPI | 14.2 | 15.4 | 14.8 |
| Sdef | 14.2 | 15.4 | 14.8 |
| Flow Accumulation | 5.4 | 5.2 | 5.3 |
| Stream | 3.9 | 4.5 | 4.2 |
| Water | 3.9 | 5.1 | 4.5 |
Table 6.
Percentages of the flood inventory points within the flood hazard categories.
| Flood Hazard Category | Percentage of Inventory Points (%) |
|---|---|
| Very High | 19 |
| High | 54 |
| Moderate | 19 |
| Low | 8 |
| Very Low | 0 |
Table 7.
Dartmouth Flood Observatory reported flood events in the study area.
| Longitude | Latitude | Began | Ended | Validation | Dead | Displaced | Main Cause | Severity |
|---|---|---|---|---|---|---|---|---|
| 3°31′2.59″ E | 6°30′43.165″ N | 3 July 1990 | 4 July 1990 | News | 5 | 3000 | Heavy rain | 1 |
| 3°16′51.805″ E | 6°34′50.3509″ N | 24 July 2002 | 26 July 2002 | News | 2 | 0 | Heavy rain | 1 |
| 3°29′11.065″ E | 6°34′54.5939″ N | 17 June 2004 | 17 June 2004 | News | 0 | 0 | Heavy rain | 1 |
| 3°17′54.902″ E | 6°29′59.0489″ N | 1 August 2007 | 15 August 2007 | News | 6 | 5000 | Heavy rain | 1 |
Table 8.
Analysis of changes in flood hazard areas.
| Flood Hazard Category | Percentages of Developed Areas (1986–2020) % |
|---|---|
| Very High | 26.5 |
| High | 46.4 |
| Moderate | 18.2 |
| Low | 6.5 |
| Very Low | 1.8 |
Publisher’s Note: MDPI stays neutral with regard to jurisdictional claims in published maps and institutional affiliations. |
© 2021 by the authors. Licensee MDPI, Basel, Switzerland. This article is an open access article distributed under the terms and conditions of the Creative Commons Attribution (CC BY) license (https://creativecommons.org/licenses/by/4.0/).
Share and Cite
MDPI and ACS Style
Idowu, D.; Zhou, W. Land Use and Land Cover Change Assessment in the Context of Flood Hazard in Lagos State, Nigeria. Water 2021, 13, 1105. https://doi.org/10.3390/w13081105
AMA Style
Idowu D, Zhou W. Land Use and Land Cover Change Assessment in the Context of Flood Hazard in Lagos State, Nigeria. Water. 2021; 13(8):1105. https://doi.org/10.3390/w13081105
Chicago/Turabian StyleIdowu, Dorcas, and Wendy Zhou. 2021. "Land Use and Land Cover Change Assessment in the Context of Flood Hazard in Lagos State, Nigeria" Water 13, no. 8: 1105. https://doi.org/10.3390/w13081105
Note that from the first issue of 2016, this journal uses article numbers instead of page numbers. See further details here.