
Evaluating the Collaborative Security of Water–Energy–Food in China on the Basis of Symbiotic System Theory
by
 , , ,
, , ,
Xiao Li
1,2 ,
,
Cuishan Liu
2,3,*,
Guoqing Wang
2,3,4,
Zhenxin Bao
2,3,
Yanfang Diao
5 and
Jing Liu
6 1
State Key Laboratory of Hydraulic Engineering Simulation and Safety, Tianjin University, Tianjin 300072, China
2
Research Center for Climate Change, Ministry of Water Resources, Nanjing 210029, China
3
State Key Laboratory of Hydrology-Water Resources and Hydraulic Engineering, Nanjing Hydraulic Research Institute, Nanjing 210009, China
4
Yangtze Institute for Conservation and Development, Nanjing 210098, China
5
College of Water Conservancy and Civil Engineering, Shandong Agriculture University, Taian 271000, China
6
Institute of Hydrology and Water Resources, College of Civil Engineering and Architecture, Zhejiang University, Hangzhou 310058, China
*
Author to whom correspondence should be addressed.
Water 2021, 13(8), 1112; https://doi.org/10.3390/w13081112
Submission received: 24 March 2021
/
Revised: 9 April 2021
/
Accepted: 15 April 2021
/
Published: 17 April 2021
(This article belongs to the Special Issue The Water-Energy-Food Nexus: Sustainable Development)
Abstract
:Water, energy, and food are essential resources for humanity. The growing shortages of these resources and serious deterioration of river environments are having a big impact on the sustainable development of the economy and society in China. Water, energy, and food support human life and yet coexist in different ways, and therefore it is critical to find a way for all three key elements to be secured in order to support high standards of sustainable development in China. We used the criteria of stability, coordination, and sustainability of symbiotic systems to select 33 indexes that were then used to establish an index system. The weight of index was determined by using the entropy weight method combined with Analytic Hierarchy Process. The fuzzy comprehensive evaluation method was used to calculate the collaborative security index, which was the basis of our evaluation of the collaborative water–energy–food security of China in time and space. The results show that North China and Northwest China are at high water–food–energy security risk, while East, Central, and South China are at moderate risk. With the exception of Southwest China and South China, risk in most parts of the country has risen over the past decades, while it has fallen in Shandong, Henan, Sichuan, and Yunnan provinces.
1. Introduction
Water, energy, and food are the basis of human existence, but as the population has increased and the global climate changed [1], societies have faced major challenges from resource shortages and environmental degradation [2]. China is no exception. As its population, economy, and living standards have risen, so too have its food and energy demands [3,4], which require a large amount of water. However, China is short of water, and what it has is distributed unevenly in space and time. Its water and land resources also do not match [5]. These problems restrict the sustainable development of China’s economy and society.
In recent years, fresh water resources have grown increasingly scarce, food supplies more uncertain, and the demand for energy ever greater. The interdependence and conflict between the three elements make the relationship between water, energy, and food more complex, and the impact of one on the others is more extensive. The three elements are interrelated, interdependent, mutually restricted [6], and closely linked. The relationships between the three systems must be studied and their development coordinated to promote regional sustainable development. Balancing these relationships is also the direction of global security and sustainable development.
The water–energy–health–food–biodiversity relationship was first proposed in 2002 at the World Summit on Demand Sustainable Development in Johannesburg, South Africa. Previously, studies on water resources, energy, and food were often based on a single resource and isolated the three [7]. Such research provides strategies for optimal management and adaptation of resources within departments [8] and can be used as a basis for multi-resource linkages. Focusing only on the supply and demand of a single resource, however, will cause the “sub-optimal” problem, which may lead to the collapse of other resource systems [9].
Many problems in the field of water, energy, and food are intertwined, and these interrelationships need to be identified to achieve synergy in resources and avoid potential risks [2]. The energy demand is increasing rapidly in China, where a great deal of consumption and pollution of water resources is the result of coal-based energy development [10,11]. The country is also characterized by a mismatch in spatial distribution of energy and water resources [12], and a shortage of water resources that threatens the development and utilization of energy. Agriculture is the biggest user overall of water, accounting for 65% of total water use. Agricultural production in the northern region, represented by the Yellow River Basin, is highly dependent on irrigation and is prone to severe water shortages [13]. Biomass energy is emerging as an important player in alleviating energy pressure, but biological energy will also compete with food production for agricultural resources [14], which may have a negative impact on food security [15]. In addition, food production will consume energy directly or indirectly through the use of agricultural machinery, fertilizers, pesticides, plastic film, and other means of production.
Water, energy and food are interdependent and are essential resources for sustainable integrated management [16]. To integrate management of these resources, the International Atomic Energy Agency (IAEA) has proposed a CLEW (climate, land, energy, and water) analytical framework that takes into account factors such as land use and climate change, offering it for the systematic study of energy, hydrology, and agriculture [2]. The Stockholm Environmental Research Institute combined its WEAP (Water Evaluation And Planning System) model with the LEAP (Long-range Energy Alternatives Planning System) model to study the water–energy–food relationship, advancing research on the impact of water, energy, and food supply and demand in the context of climate change [17]. However, the construction of correlation in these study frameworks only takes into account the natural attributes of resources including supply and demand ratio and climate change, and does not consider socio-economic factors such as population size, urbanization, and globalization, which also have an impact on the food–energy–water system [18]. The inclusion of social development attributes in the system will gradually become an important direction of this area of study [1].
By constructing multivariate simulation, the system dynamics model (SD model) can be used to simulate the general trend of water, energy, and food demand under the influence of socio-economic attributes such as population size and economic level [19]. In 2014, Sahin et al. applied the SD model to the water–energy–food relationship for quantitative simulation [20]. In addition, the general equilibrium model was also gradually applied to the correlated study of water, energy, and food. As an example, the GTAP-W (Global Trade Analysis Project for Water) model simulates the conditions between environmental sustainability and economic development under various water-use scenarios, providing an optimal management scheme for water resources [21]. The SIMPLE (Simplified international model of agriculture prices, land use and the environment) model takes food production as the output element, and energy and water as input elements, and establishes a local equilibrium model at the regional level. The Computable General Equilibrium (CGE) model is a powerful tool for policy analysis and can also be used to construct input–output models with water factors [22].
However, the studies thus far have focused on a certain region or watershed, and there is little assessment of the situation at a national level. In the existing studies, the evaluation system also often separates the water resources, energy, and food systems. They discuss the three resources in terms of the supply–demand relationship [23] and the coupling coordination degree of resources [24], creating an index system based mainly on resource supply conditions and resource demand pressure. There is less concern for the relationship between resources and the social economy, or the synergy between the three. This study focuses on symbiosis, constructing a symbiotic framework for the three elements from three aspects: stability, coordination, and sustainability. In it, provinces are the study units, and the basis for an evaluation index system for regional collaborative security to calculate and analyze the development and change of the water–energy–food system in China in different regions and the country as a whole.
Another important problem in collaborative security evaluation is to assign weight to each index on the basis of the influence degree of each index on water–energy–food coordination. The commonly used weight determination methods can be divided into two categories: subjective and objective. Subjective weighting methods include the Delphi Method, the Analytic Hierarchy Process (AHP), the binomial coefficient method, and the month-on-month scoring method. These methods can be focused on the evaluation target and be very effective; however, there may be some deviation between subjective judgment and the actual situation due to the lack of an objective basis. The main objective weighting methods are the entropy, multi-objective programming, deviation, and mean square deviation methods. These methods have a strong mathematical basis, and the evaluation results are more objective, but it is possible that the subjective analysis of the evaluation indexes is neglected due to the overreliance on the sample data and quantitative statistical methods. Both methods have shortcomings and strengths, and therefore in order to make up for their deficits, the subjective weight and objective weight were combined organically in this study, and the entropy value method AHP combination weight result was applied as the weight of the index system.
There are many quantitative analysis methods in the multi-index comprehensive evaluation approach. The comprehensive index method is a concise and clear evaluation method, but there may be linear substitution. Although principal component analysis [25] is a combination of qualitative analysis and quantitative analysis, some information will be excluded in the process of selecting the principal component, which will further affect the evaluation result [26]. The fuzzy comprehensive evaluation method [27] applies fuzzy rules and is often used to solve non-deterministic problems. Water–energy–food collaborative security is a dynamic and variable fuzzy concept. This study classifies the characteristic values of water–energy–food collaborative security by a variable fuzzy evaluation method and evaluates the collaborative security of 30 provincial areas in China and the country as a whole in terms of stability, coordination, and sustainability, as well as the country’s overall spatial distribution and temporal evolution. The objective of this study was to explore the water–energy–food security in China from the perspective of synergy and symbiosis. Compared with the traditional research, this study does not establish the system from the perspective of the independence of the three resources but pays more attention to the relationship between them.
2. Materials and Methods
2.1. Study Area
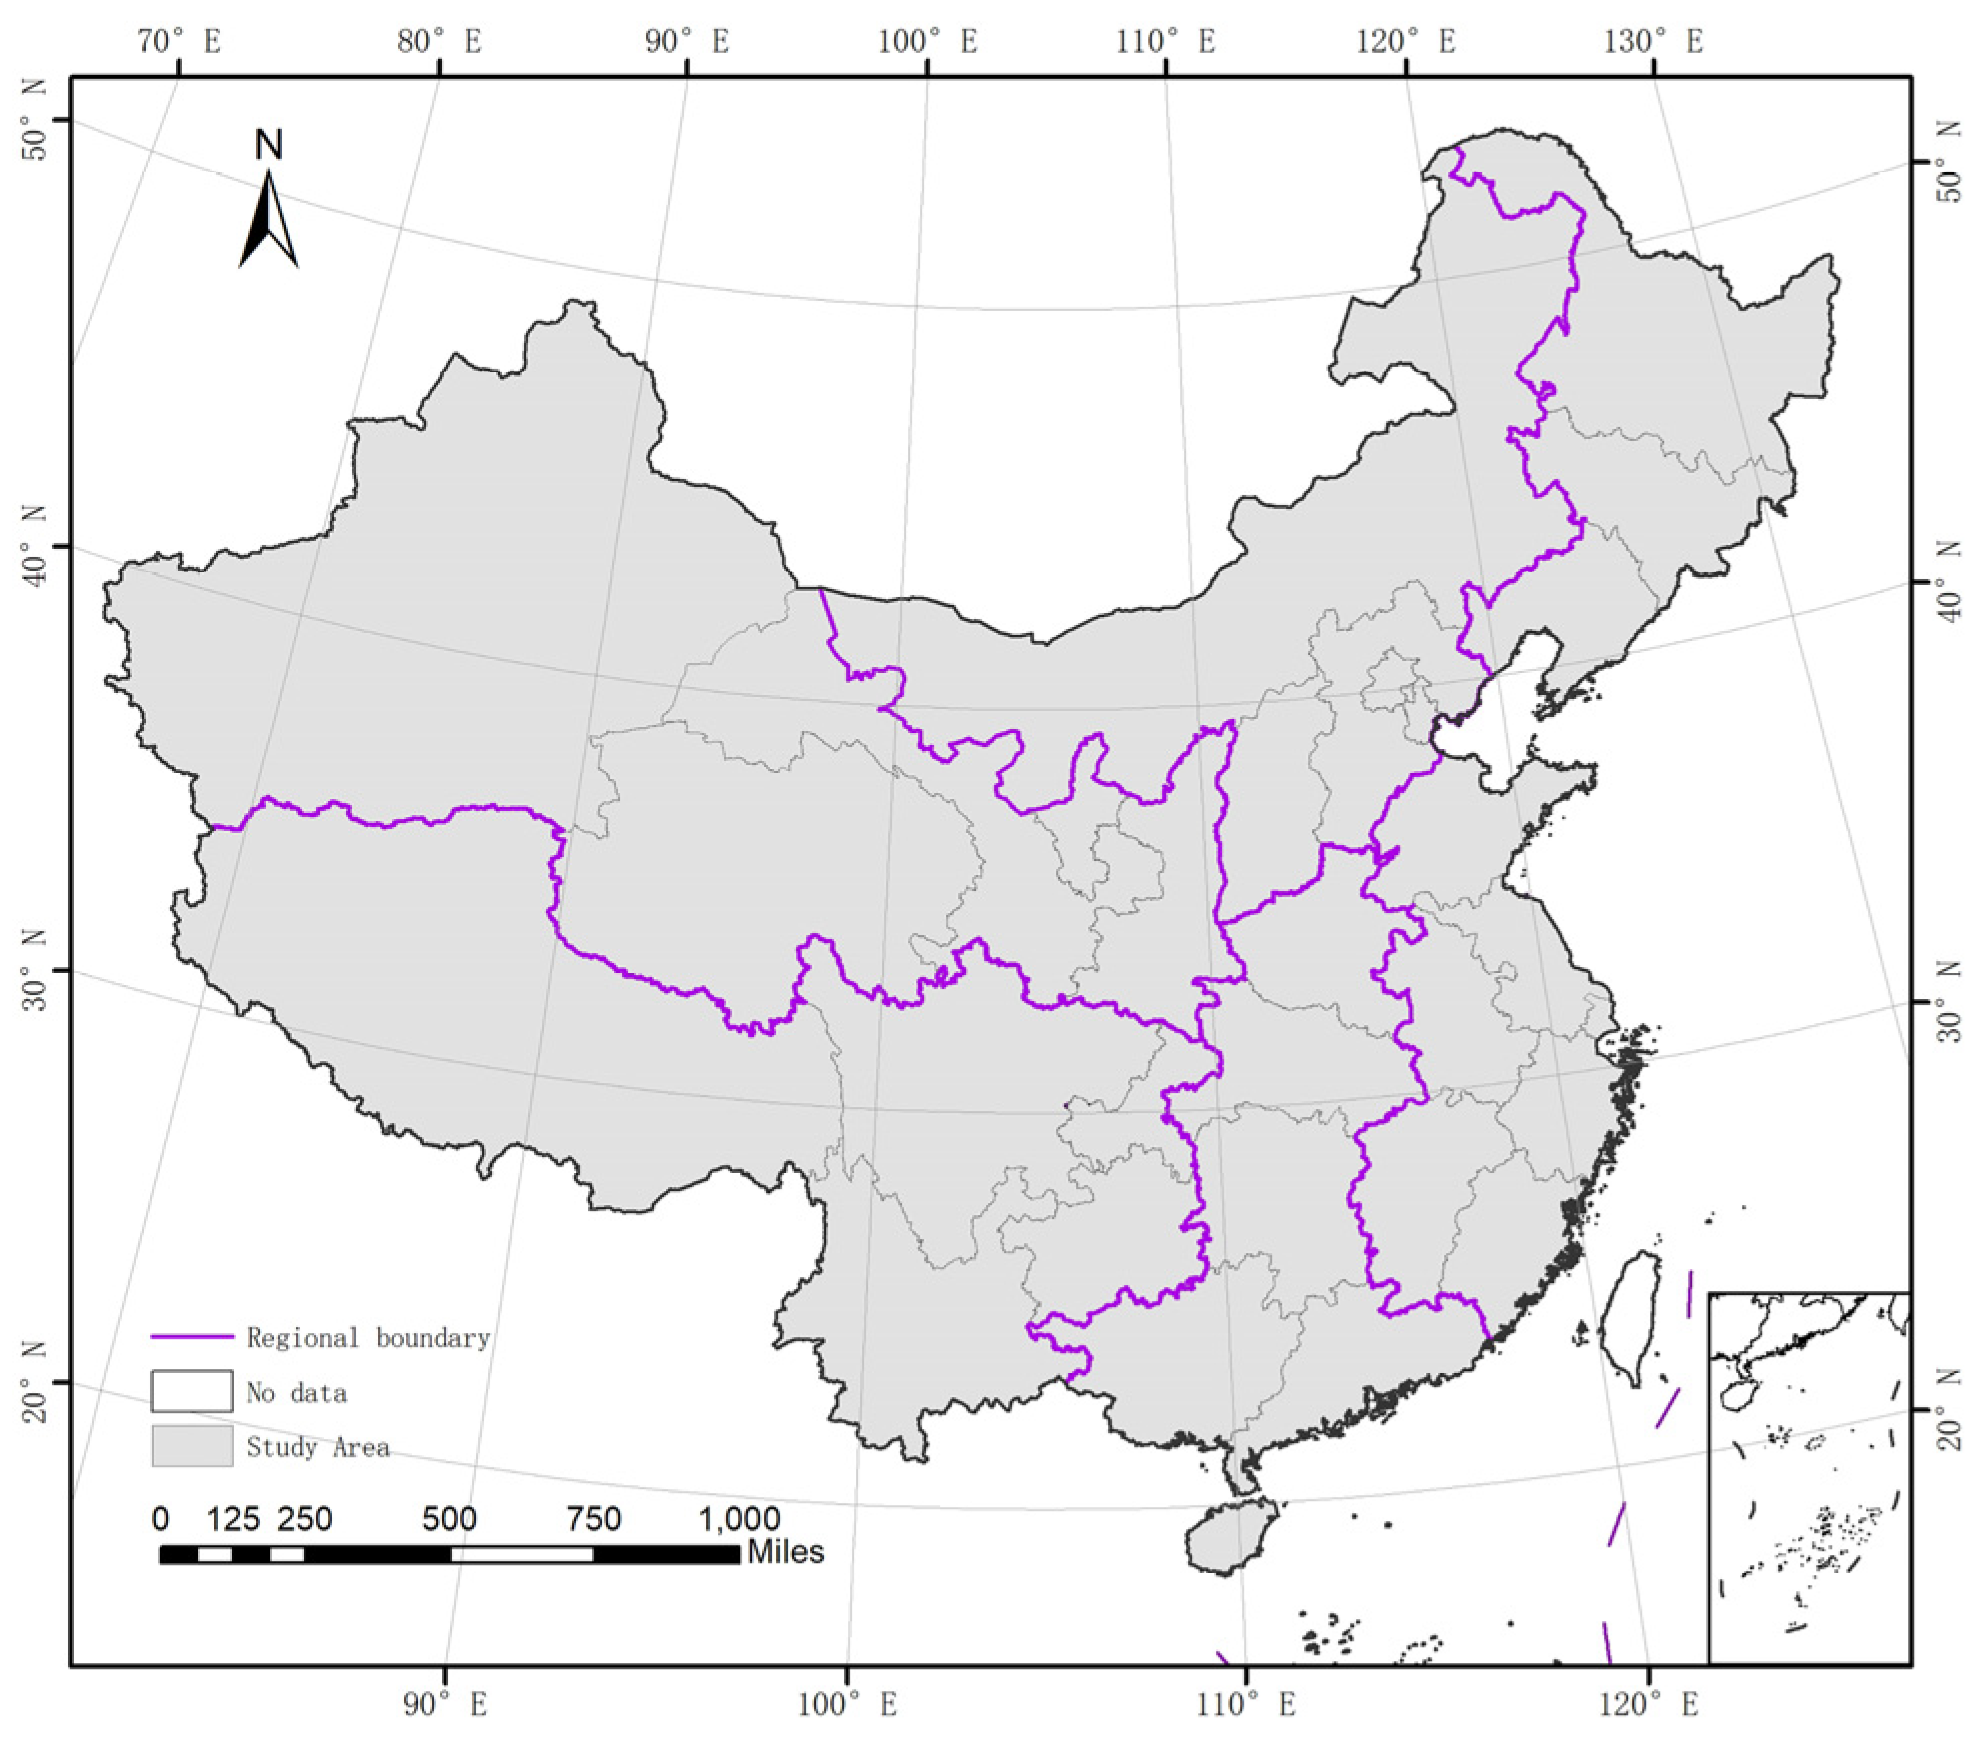
The study scope is mainland China, and the basic study unit is the provincial administrative unit. The Chinese mainland covers a vast territory with different natural environments and economic conditions. Since the spatial variation of the study area is large, it can be divided into North China, Northeast China, Northwest China, East China, South Central China, and Southwest China (Figure 1) according to geographical location, statistical data, and resource allocation.
2.2. Data and Preprocessing
The study of water–energy–food collaborative security requires a comprehensive analysis of the supply–demand balance, coordination relation, and external environment of 3 kinds of resources. This involves a large amount of data. This study used 5 types of data: water resources, energy, food, socioeconomic data, and environmental data. In order to ensure scientific results, we mostly used publications of authoritative national statistical institutions as the sources of information, as summarized in Table 1.
2.3. Resource Situation
China has only about 2100 m3 of water per capita, about a one-quarter of the global level and 127 out of 192 countries in the world [28]. The uneven distribution of water adds difficulty to the rational utilization of the resource in China. Southwest China has the most abundant water resources, while the Yellow River Basin and the North China Plain have scarce supplies. There is less than 200 m3 of water per capita in Beijing, Tianjin, Hebei, and other regions, but the average utilization rate of water resource development in North China is up to 70.1%.
Coal is the most important energy source in China and plays an important role in energy production. Shanxi Province is China’s largest coal-producing province, with raw coal production accounting for about one-quarter of the country’s output; Shaanxi–Mongolia coal-producing region at the border of Inner Mongolia and Shaanxi is the second largest coal-producing region. Heilongjiang, Shandong, Henan, and Xinjiang have large oil and gas fields and coal bases. Meanwhile in the southwest, hydropower is an important component of primary energy. Central South China has few sources of energy, and the energy output is relatively small. To meet increases in demand, China’s total net energy imports have grown rapidly, reaching 677 million tons in 2016, accounting for 15.5% of total energy consumption in that year. Among them, crude oil is a relatively short source of energy in China, with net import volume increasing year by year to become the most important commodity in China’s energy foreign trade. At the same time, China has shifted from being a net coal exporter to a net coal importer since 2009, with volumes gradually increasing.
China has a population of 1.4 billion, accounting for 22% of the world’s total. It is a big food producer and consumer but has only 7% of the world’s arable land, with less than 0.1 ha of arable land per capita. As the economy has grown, so too has the population and the rate of urbanization, raising demand for forage and industrial grain. China’s food consumption has unceasingly risen, and the food self-sufficiency rate is less than 90%, leaving nearly 200 million people dependent on food imports. However, the distribution of water resources does not match that of the population and cultivated land.
2.4. Theoretical Basis
The theory of “symbiosis” originated from biology. It was first proposed by German biologist Anton de Bery in 1879 [29]. Over the years, the concept has been widely used in many fields, such as the study of society, the economy, and ecology [30,31]. The 3 elements of symbiosis are the symbiotic unit, the symbiotic model, and the symbiotic environment. The symbiotic system is a kind of collection of symbiotic relationships constituted by symbiotic units based on a kind of symbiotic model.
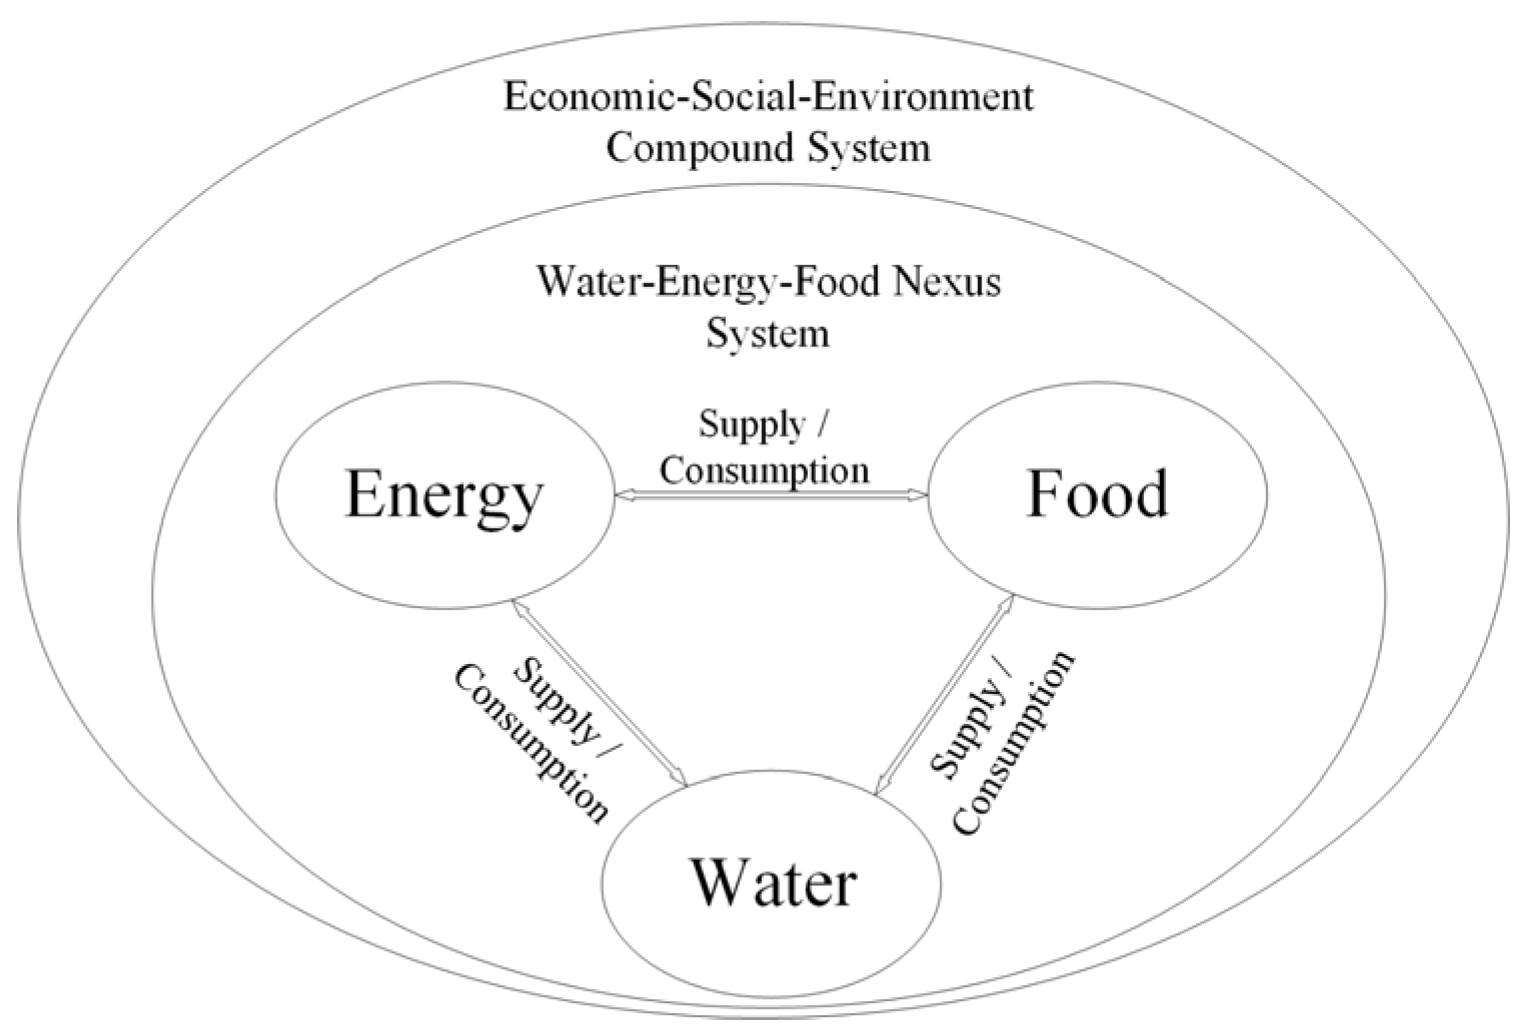
Water resources, energy, and food are the most important basic resources for economic and social development. The 3 are in a state of interdependence. On the basis of the specific relationship, a specific co-evolutionary development model is formed in which the elements can co-exist and form a water–energy–food symbiotic system (Figure 2). Water, energy, and food are the 3 basic symbiotic units that are the main parts of the symbiotic relationship There are interactions between them, forming the symbiotic interface, and further forming and developing the symbiotic relationship on the basis of the symbiotic interface. At the same time, changes in the social, economic, and ecological environments affect the interaction of water, energy, and food, and as a necessary basis for water–energy–food production and the sustainable symbiotic relationship, the symbiotic environment of the water–energy–food symbiotic system is formed.
The key to achieving the goal of water–energy–food collaborative security is to solve the problems of stability, coordination, and sustainability of the composite system. Therefore, water–energy–food collaborative security is taken as the goal to evaluate the stability, coordination, and sustainability of the system. In terms of stability, this study evaluated the supply and demand balance of water resources, energy, and food resources, while in terms of the coordination, it looked at the interdependence and mutual consumption of water, energy, and food. In terms of the sustainable subsystem, the study evaluated the sustainability of the system under limited external conditions. Comprehensive evaluation of collaborative security is made from the three aspects.
2.5. Indicator Selection
Constructing a scientific and reasonable index system is the basis of studying and evaluating water–energy–food collaborative security. China is a vast country with great regional differences in resource endowment and social development. In order to take into account the supply and demand of resources, resource allocation, socioeconomic constraints, and the impact on the ecological environment, we followed the principles of systematicness, measurability, and representativeness, and took the stability, coordination, and sustainability of the symbiotic system as the criteria for the selection of indexes.
Under the specific space–time environment condition, the water–energy–food symbiotic system has stability risk because of the uncertainty of resource quantity and demand, and the possibility of supply shortages of regional water, energy, and food. Therefore, under the stability criterion (S), water resources system (WS), energy system (ES), and food system (FS) constitute the subsystem layer selection index.
The 3 resources of water, energy, and food interact with each other. When the utilization efficiency of resources is low, the consumption of the 3 resources increases with each other, and the resource allocation is tight, resulting in a coordination risk for the water–energy–food symbiotic system. Under the coordination criterion (C), water–energy system (WEC), water–food system (WFC), and energy–food system (EFC) constitute the subsystems.
The water–energy–food symbiotic system is influenced and counteracted by the external environment. If the economic and social development is not positive and the natural ecological condition is poor, a sustainable risk will arise. Therefore, the sustainability criterion (T), economic system (JT), social system (HT), and natural system (ZT) constitute the subsystem and were selected for indexes.
To summarize, in accordance with the 3 criteria, we selected 33 indexes according to 3 subsystems, covering the symbiotic unit, symbiotic relationship, and symbiotic environment of the system, and the index system of water–energy–food collaborative security evaluation was established (Table 2).
2.6. Weight Determination
2.6.1. Entropy Weight Method
The entropy weight method is a commonly used weight calculation method in which information entropy is used to give weight to each index according to the degree of dispersion of each index.
The steps to calculate the weight by entropy weight are as follows:
① Normalized processing
The min–max normalization method is a simplified calculation method in which the dimensional value is transformed into a dimensionless value and becomes a scalar.
Given the m indexes X1, X2,..., Xm, assume that the j index of the i user is xij, which is normalized to be , if the index is positive:
If the index is negative:
In the formula: min (xj) is the minimum of the j index and max (xj) is the maximum of the j index.
② Calculate the proportion of the index
The proportion of the j index of the i user:
③ Calculate the information entropy of the index
Calculate the information entropy of j index:
In the formula, K is a constant, .
④ Calculate the weight of the index
2.6.2. AHP
The analytic hierarchy process (AHP) is a qualitatively and quantitatively combined, systematic, and hierarchical analysis method. It can be used to solve problems that involve multiple goals, principles, or levels [32].
The steps of analytic hierarchy process are as follows:
① Set up a hierarchy model;
② Construct a pair of comparison matrices;
③ Carry out hierarchical single sorting and consistency testing;
④ Conduct hierarchical total sorting and combinatorial consistency testing.
2.6.3. Combination Weight
The evaluation of water–energy–food collaborative security involves many indexes, and the evaluation system is complex. For the scientific evaluation of the complex giant system, we should combine the subjective and objective factors and take the result of the entropy value method and AHP organic combination weight as the weight of the index system.
Take the combination weight value as follows:
In the formula, is the entropy value method index weight, is the AHP index weight, and respectively represent the relative importance degree of the objective weight and the subjective weight, , , .
Taking = 0.7 and = 0.3, the combination weight of each index and the weight of each criterion are calculated as shown in Table 3.
2.7. Calculation of Evaluation Index
Fuzziness exists in many engineering fields. The fuzzy set theory established by Dzitac in 1965 [33] provides a scientific theory and method for the study of fuzzy concepts, things, and phenomena. In 2005, on the basis of engineering fuzzy set theory and method [34], Professor Chen Shouyu created variable fuzzy set theory and creatively put forward the concept of relative membership degree. Chen established an engineering fuzzy set theory, model, and method on the basis of the concept of relative membership degree, and then developed it into variable fuzzy set [35]. Water–energy–food collaborative security is a dynamic fuzzy concept that can be evaluated by the variable fuzzy method [36].
2.7.1. Standard Value of Evaluation Index
2.7.2. Calculation of Security Index
The security indexes of S, C, and T criteria of water–energy–food symbiotic systems in each province and the country are calculated, and the collaborative security index is obtained by combining the 3 criteria.
The standard values of each index are determined as in Section 2.7.1, and the matrix of attraction (dominant) domain and the range matrix and the matrix point-valued M of variable sets corresponding to each criterion and total target are constructed [36]. Taking the S criterion as an example, the matrices , , and are constructed; the relative position of the sample eigenvalue and the point are determined; and the degree of difference (Equations (7)–(9)) is calculated; the relative membership degree of the index to the h grade is calculated by Equation (10).
In Equations (7) and (8), β is a non-negative index, and it is usually preferred that β is 1, that is, the relative difference function model is a linear function, and Equations (7) and (8) satisfy: ① when x = a and x = b, ; ② when x = M, ; ③ when x = c and x = d, .
In the formula, is the non-normalized comprehensive relative membership degree, is the criterion parameters for the model optimization, is the index weight, m is the identification index number, p is the distance parameter, p = 1 is the Hamming distance, and p = 2 is the Euclidean distance.
The weight vector of the index under the criteria and the total target is obtained from Table 3, and the weight vector is substituted into the variable fuzzy evaluation model (11) to solve the comprehensive relative membership matrix. According to Equation (12), the stability relative membership matrix of each region is obtained after the results are normalized. According to the inapplicability of the maximum membership principle of the fuzzy concept under the condition of classification, the grade eigenvalue (Equation (13)) is used as the stability index for evaluation. The coordination index, the sustainability index, and the comprehensive index can be gained in the same way.
2.7.3. Evaluation Grade
The security index of the criteria solved in Section 2.7.2 are divided into 5 grades from low to high intervals, corresponding to the lower, low, middle, high, and higher security, as shown in Table 4.
3. Results
3.1. Evolution of China’s Collaborative Security
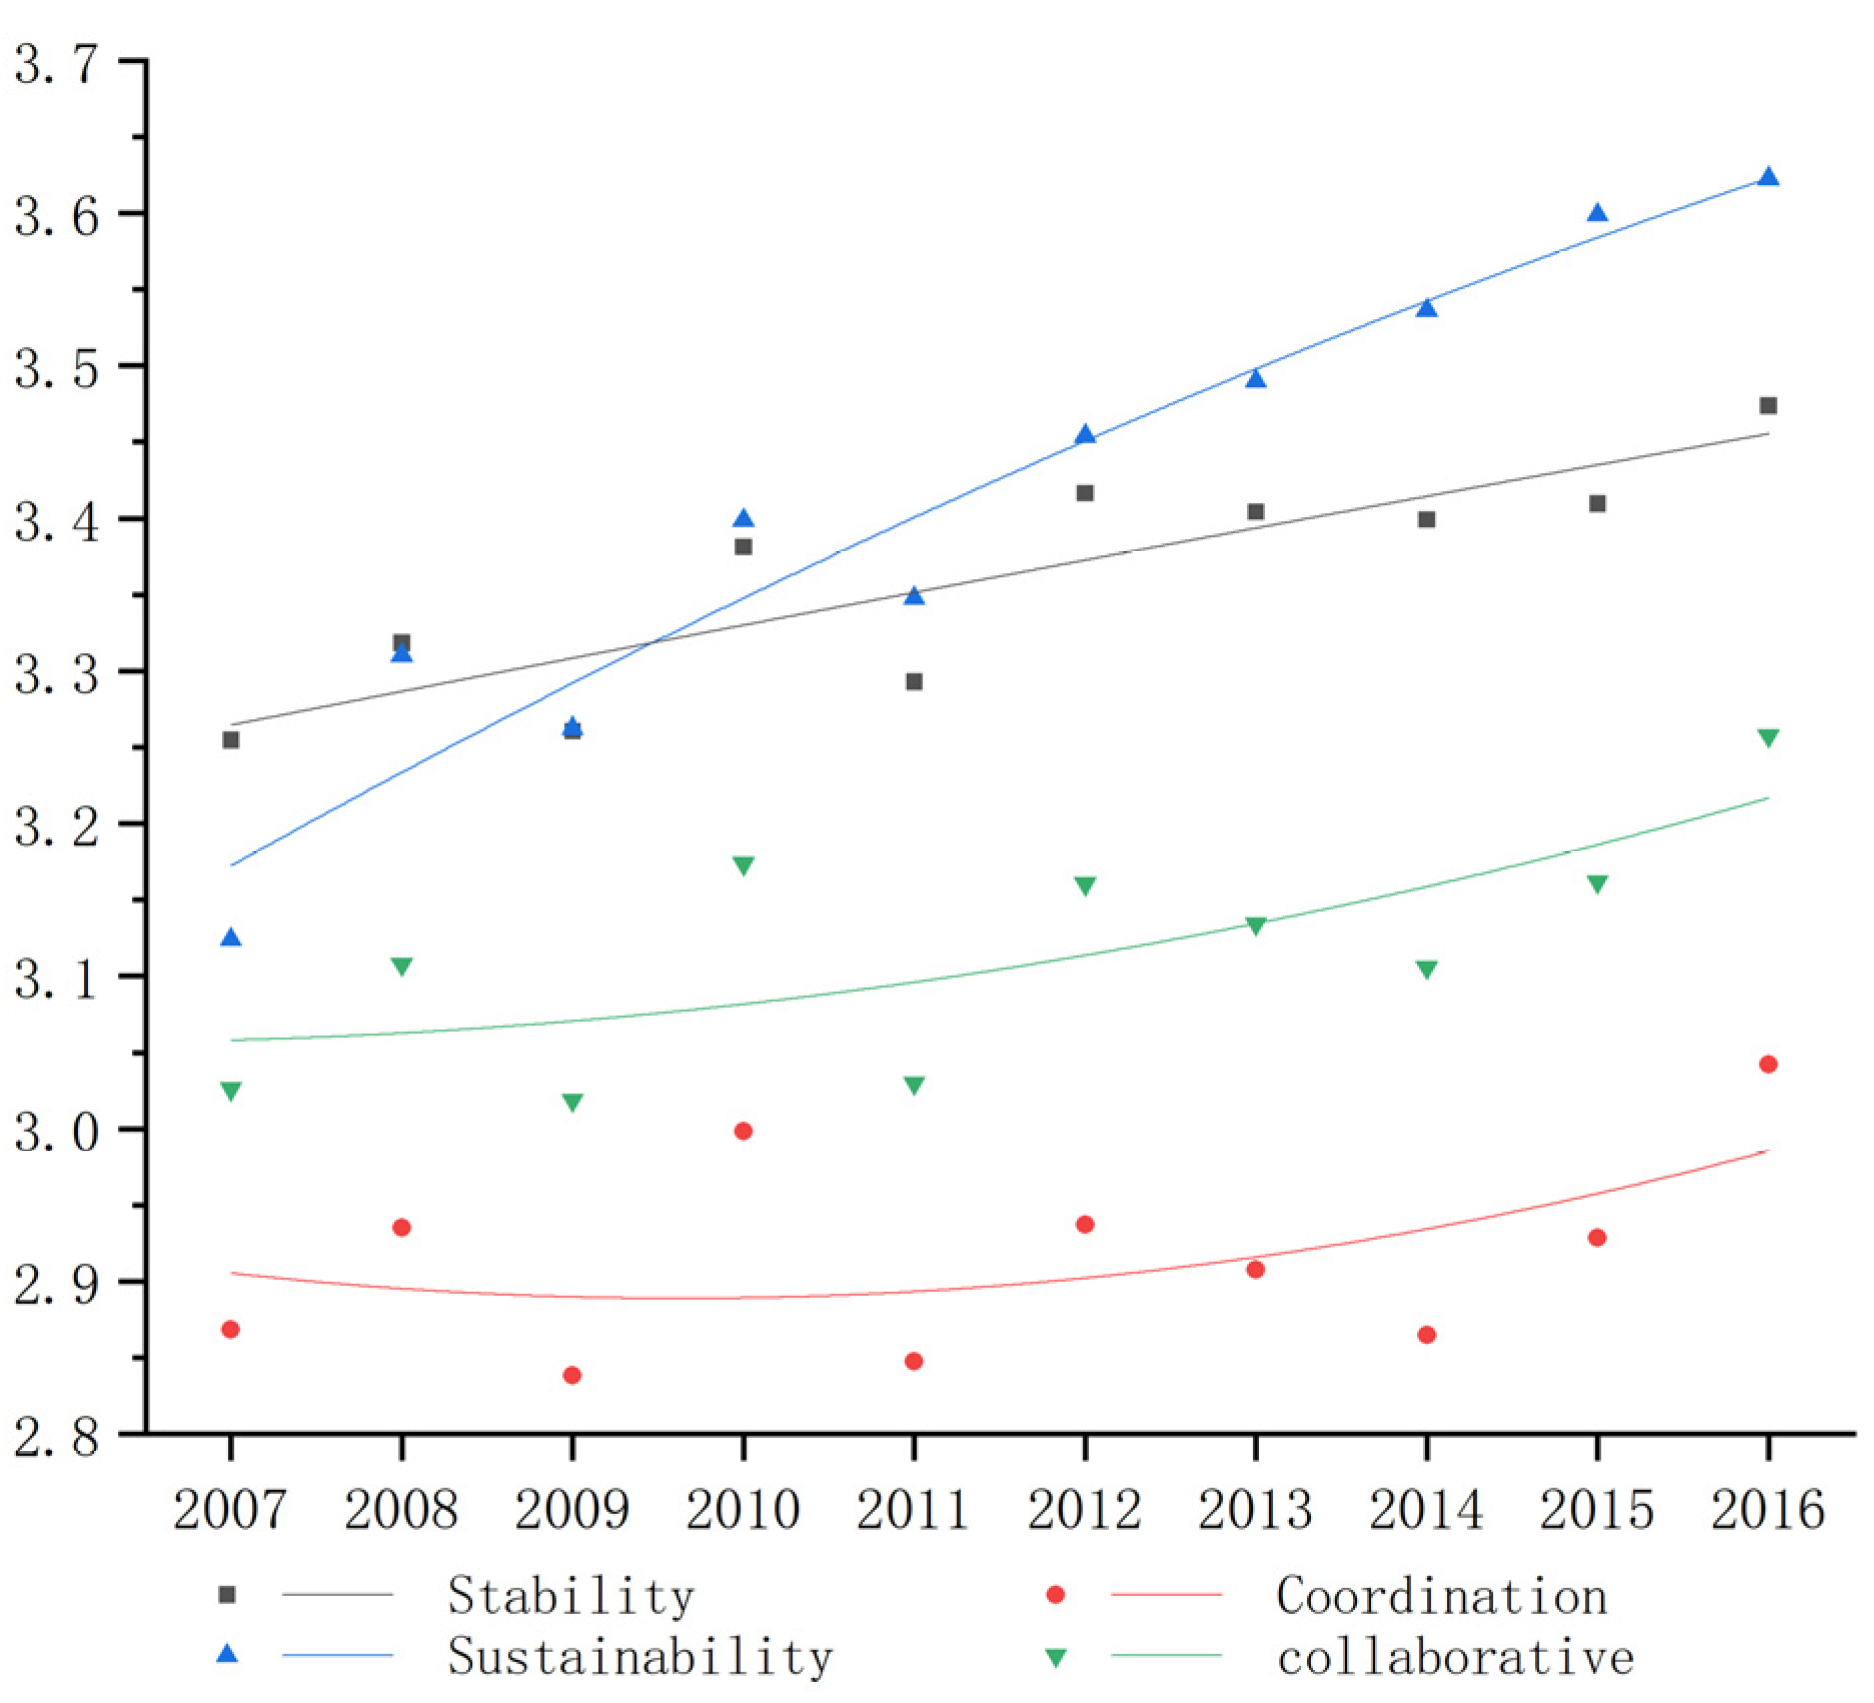
The stability, coordination, sustainability, and collaborative security indexes of China’s water–energy–food system were calculated on the basis of the formulae in Section 2.7.2, and the quadratic fitting curve was drawn (Figure 3). From 2007 to 2016, China’s water–energy–food system criteria and collaborative security index showed an upward trend.
The stability eigenvalue fitting curve was approximately linear, and the variation of system stability was greatly influenced by the rational exploitation and high-efficiency utilization of water resources. The utilization ratio of water resource development and groundwater resources decreased, the utilization ratio of non-conventional water resources increased, and the water consumption per 10,000 yuan of GDP decreased dramatically from 215 m3 in 2007 to 82 m3 in 2016. With the increase of output, industrial upgrades, and promotion of energy conservation, the energy consumption of China’s per 10,000 yuan of GDP decreased by 49% from 2007 to 2016, and the per capita food output increased by more than 25%. In the course of China’s rapid development, problems such as increased population and rapid growth of energy and food demand increased, with the self-sufficiency rate of energy decreasing from about 85% to 79%, and the self-sufficiency rate of food decreasing from 96% to 86%. This is consistent with the research conclusion of Jin et al. (2019) in that the contradiction between energy and food supply and demand is on the rise in China [39], which restricts the stability of the system.
The characteristic value of coordination fluctuated greatly. As agricultural water-saving technology increased in use from 2007 to 2016, irrigation became more efficient. The average irrigation water consumption per mu fell from 29 m3/ha to 25 m3/ha, and the effective utilization coefficient of irrigation water in farmland was raised from 0.49 to 0.54. The annual variation of precipitation affected the change of agricultural water consumption and was also an important factor causing the fluctuation of coordination degree between water, energy, and food.
The rise in sustainability has been significant, and the fitting curve was approximately linear. From 2007 to 2016, China’s GDP per capita grew rapidly and the proportion of tertiary industry increased year by year. As productivity developed, the extent and scope of the social transformation from a traditional rural society dominated by agriculture to a modern urban society dominated by non-agricultural industries such as manufacturing (secondary industry) and the service industry (tertiary industry) also grew. In terms of environmental protection, China’s per 10,000 yuan of GDP greenhouse gas emissions (CO2) fell from 4791.8 kg/10,000 yuan in 2007 to 2697.4 kg/10,000 yuan in 2016, with a decrease of 43.7%.
On the basis of the analysis of the stability, coordination, and sustainability of China’s water–energy–food symbiotic system, we found that all the indexes of the nine subsystems of the three criteria were combined to calculate the time series change of collaborative security. Overall, the value range of China’s water–energy–food collaborative security index was found to be 3.0–3.3. The economy, social development, and resources and energy-use efficiency improved, and resource supply and demand balance became more coordinated. More attention was also paid to environmental issues. Under the influence of natural environment changes and human activities, the collaborative security index is changing, and its evolution trend is highly correlated with the sustainability index, showing an accelerated upward trend on the whole.
3.2. Spatial and Temporal Distribution
3.2.1. Regional Collaborative Security Index
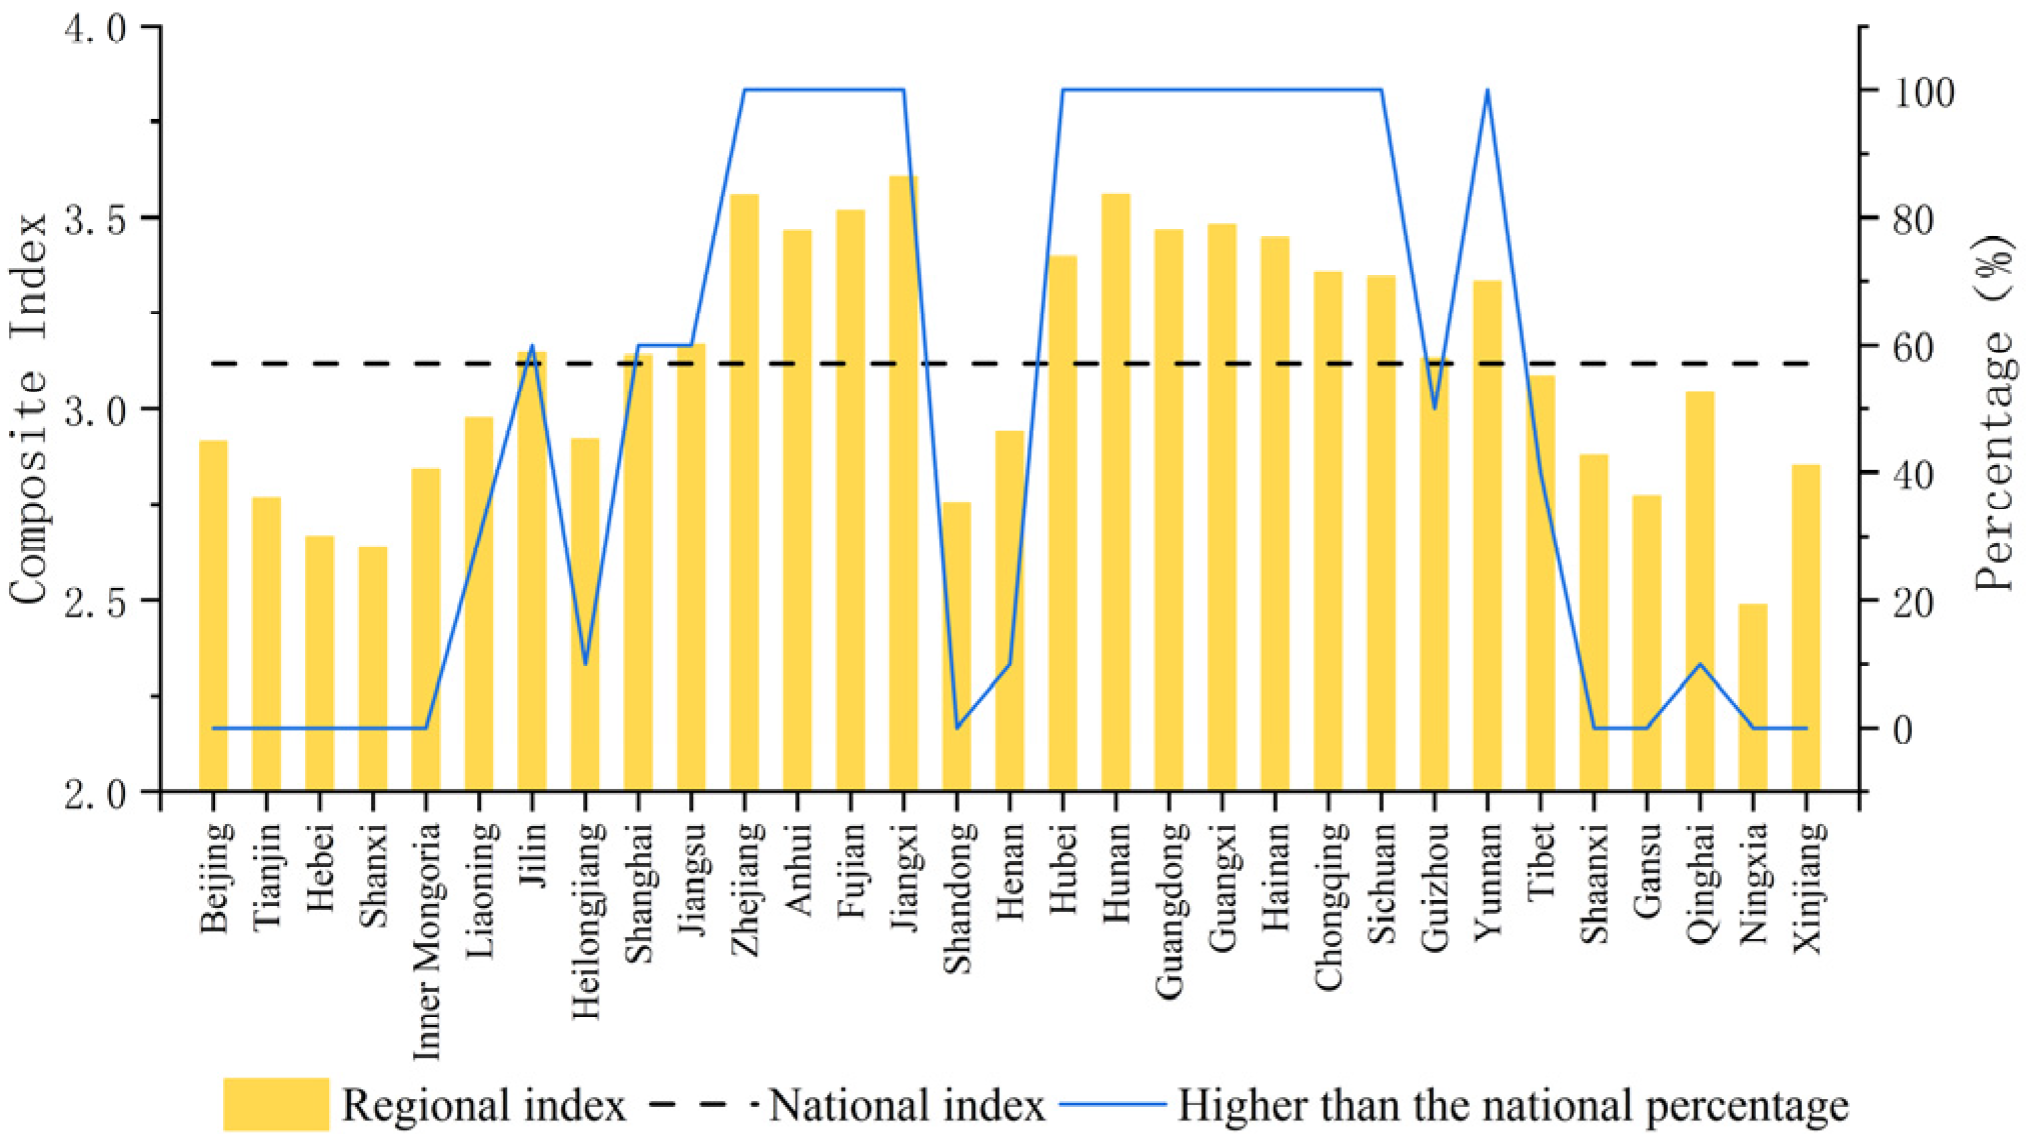
The proportion of national and provincial collaborative security index, the time-series mean, and the statistical sequence higher than the national value of the year were calculated as shown in Figure 4. By comparing the collaborative security index of each province with that of the whole country year by year, we can see that the collaborative security of five provinces in North China, four provinces in Northwest China except Qinghai, and Shandong Province were all lower than that of the whole country in the statistical period. Most of the provinces whose collaborative security was lower than that of the whole country are in North China, Northwest China, and Northeast China. Ningxia, Shanxi, and Hebei had the lowest security, while the collaborative security of most of the provinces in East China, South Central China, and Southwest China is higher than that of the whole country.
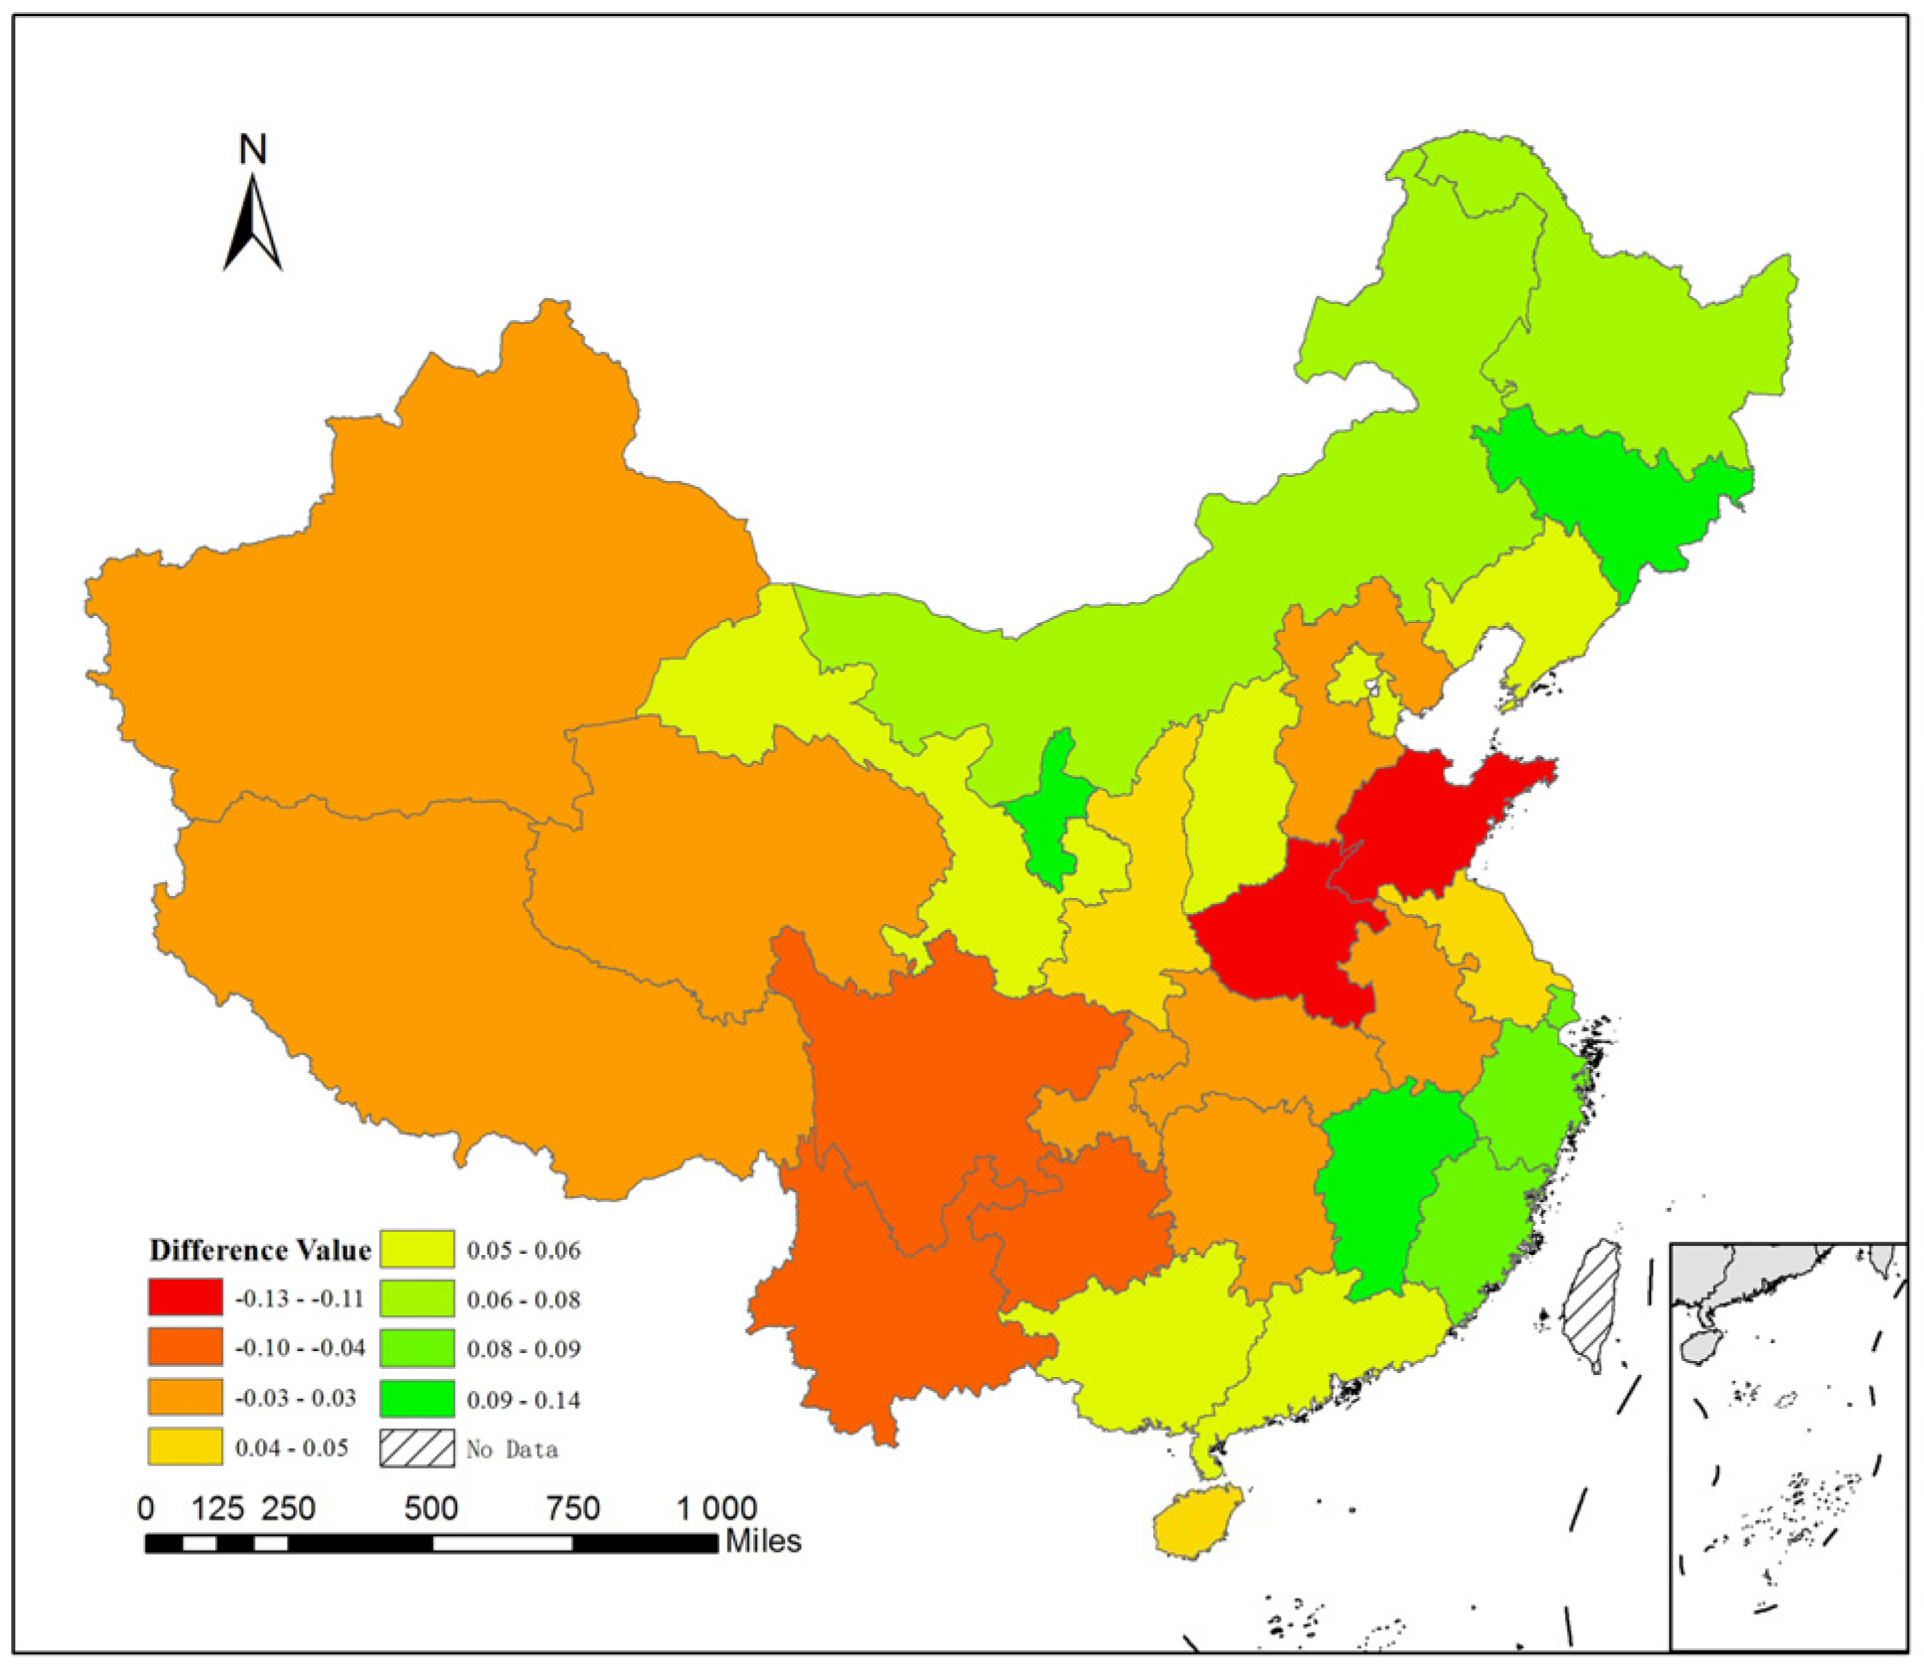
3.2.2. Collaborative Security Change Trend
In order to evaluate the dynamic change of collaborative security during the statistical period, we carried out the trend test by using the Mann–Kendall test method in 30 provincial areas for the statistical period. Water–energy–food collaborative security rose in most provinces, especially in Inner Mongolia, Zhejiang, Jiangxi, Shaanxi, and Ningxia. At the same time, there was a downward trend in security in some provinces, especially in Shandong, Henan, Sichuan, and Yunnan.
The time series was divided into two periods: from 2007 to 2011 and from 2012 to 2016. The mean value of collaborative security was calculated, and its variation degree was compared (Figure 5). Shandong and Henan had the most serious decline in collaborative security characteristic value, and Sichuan, Yunnan, and Guizhou showed a significant decline. At the same time, the collaborative security of Jilin, Jiangxi, and Ningxia increased clearly, and that of Shanghai, Zhejiang, and Fujian also increased.
The fluctuation of precipitation and the corresponding change of water resources resulted in the dynamic change of water–energy–food collaborative security. Inner Mongolia, Shaanxi, and Ningxia have greatly increased their energy output, and at the same time promoted their economic development. A declining utilization ratio of water resource development in Zhejiang and Jiangxi and industrial upgrades have brought about sound economic and social development, which are the major driving forces for the enhancement of collaborative security. Insufficient power for industrial upgrades, a falling economic growth rate, and high growth in energy demand and greenhouse gas emissions are the main reasons for the decline in collaborative safety in Shandong, Henan, and Guizhou.
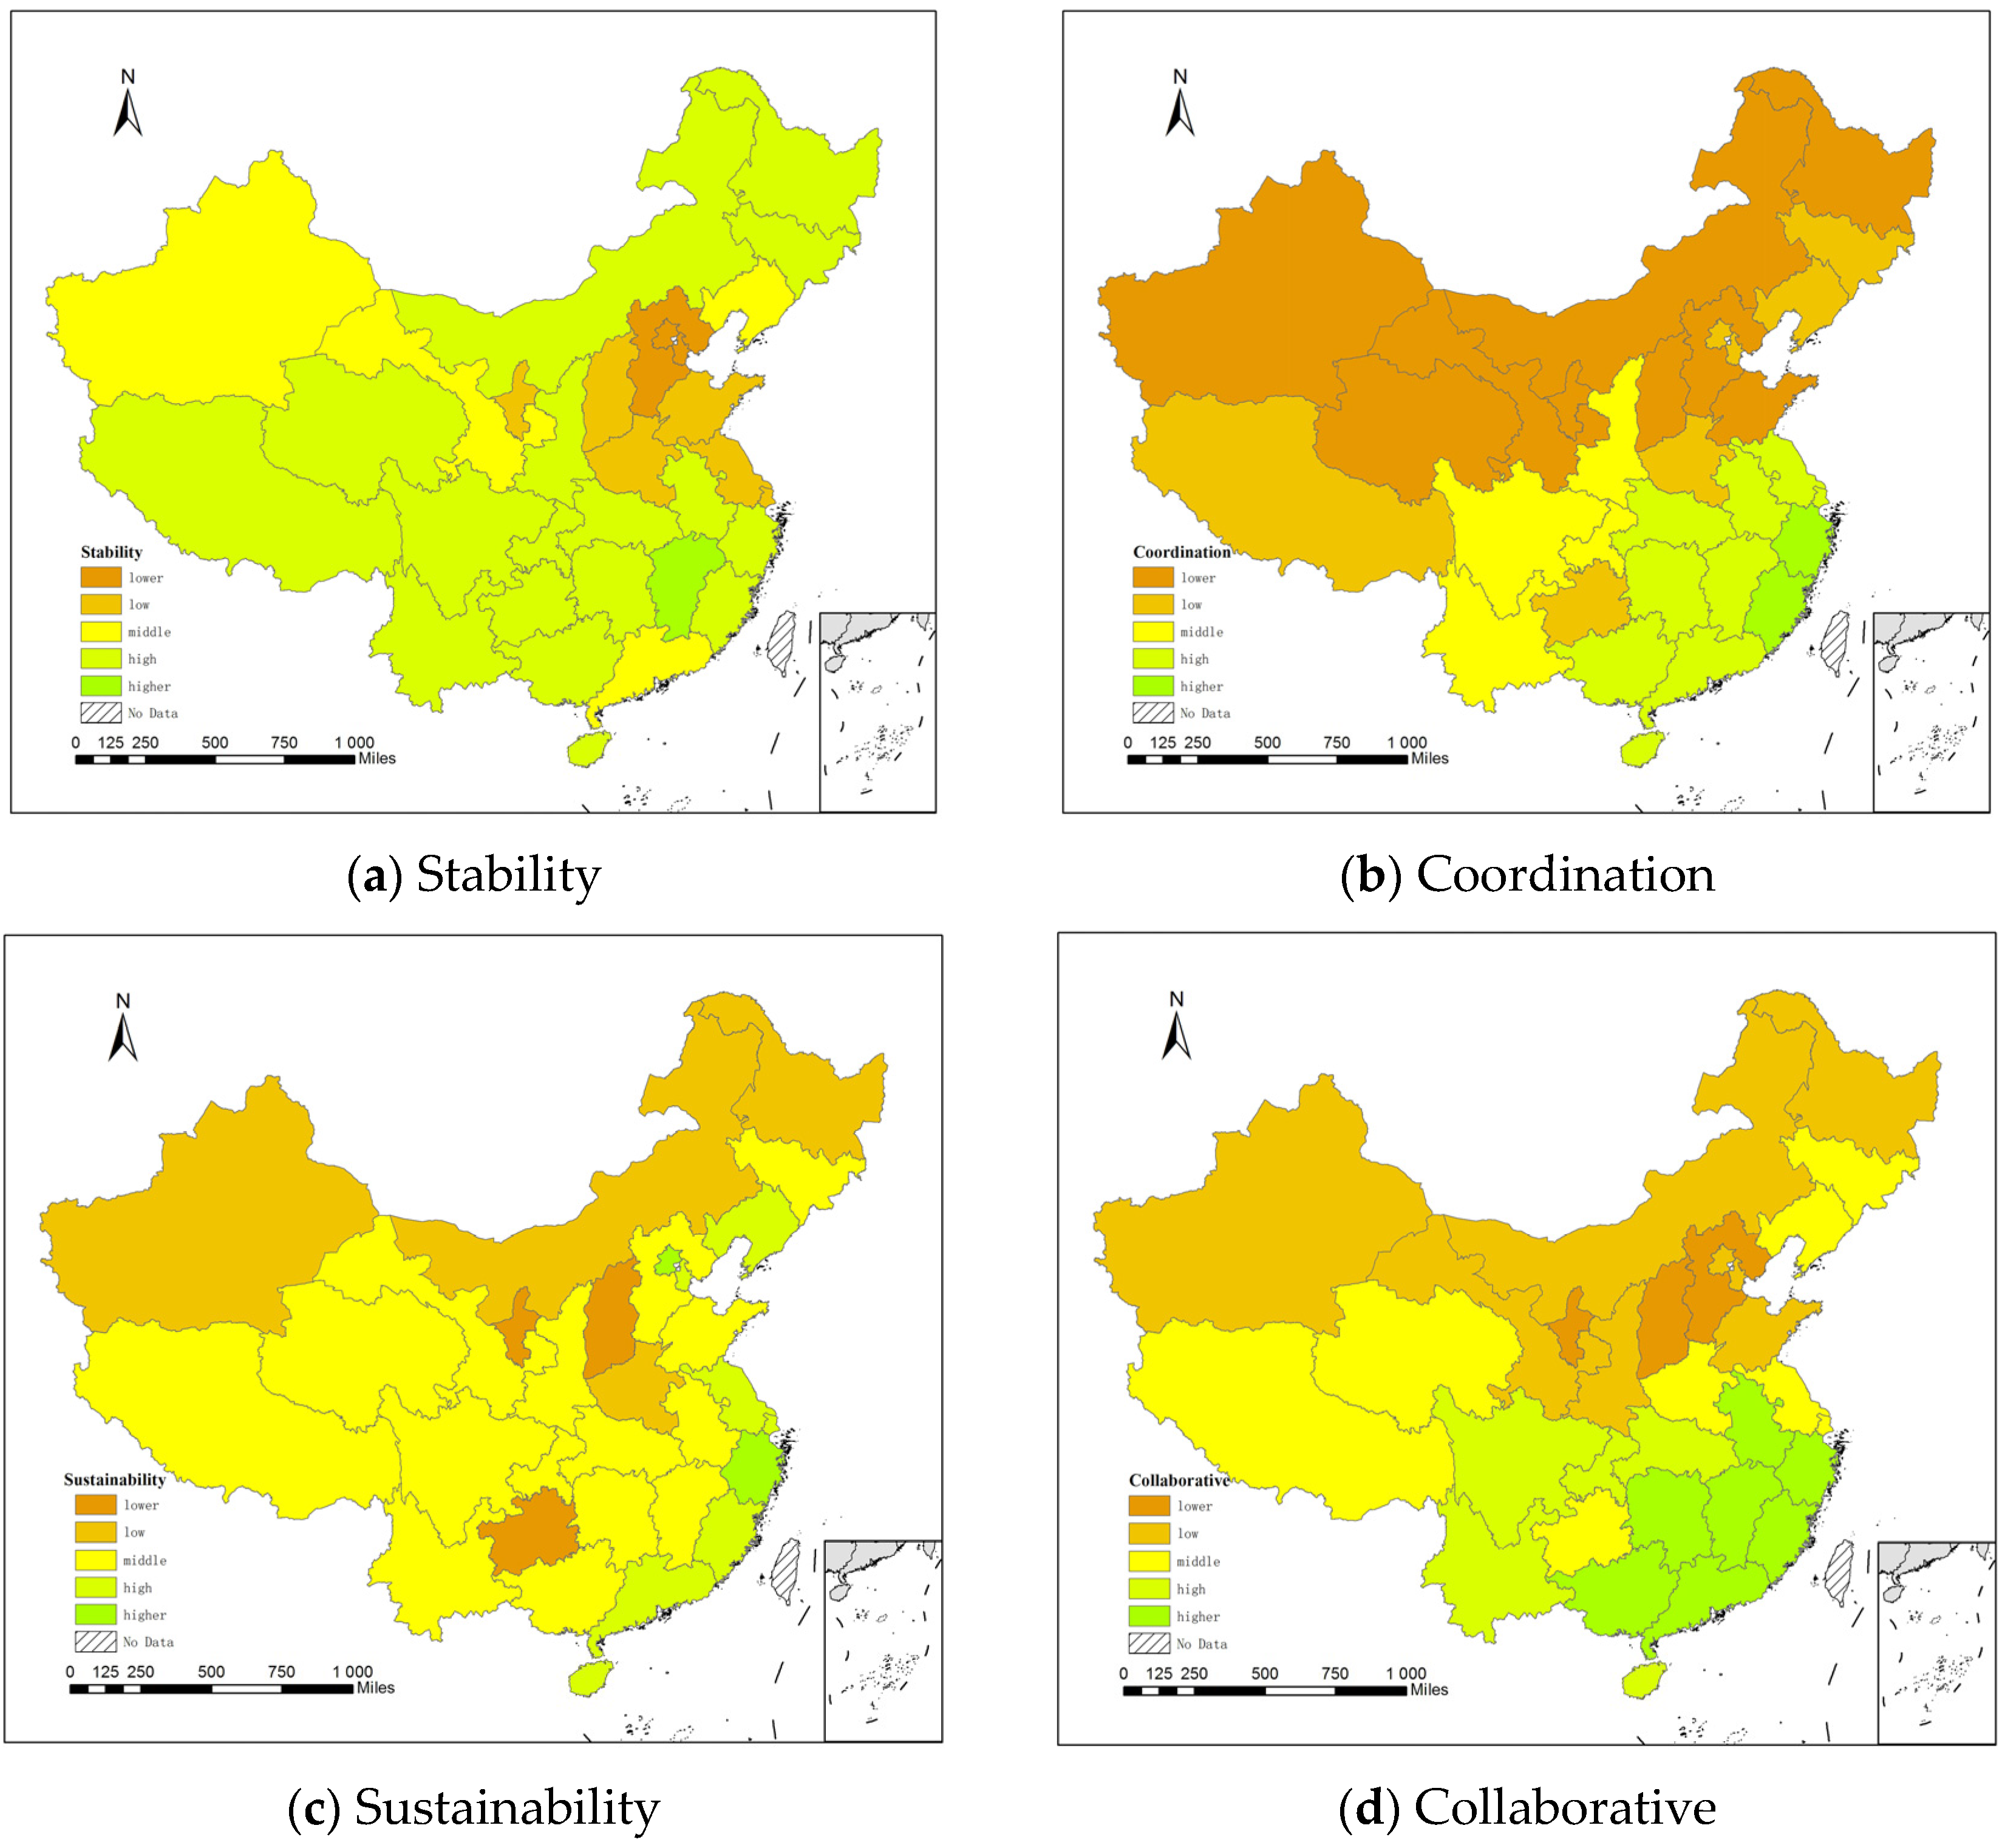
3.2.3. Collaborative Security Gradation at National Scale
The average grade of each criterion and the collaborative security of each province in China during the statistical period were analyzed on the basis of the classification standard in Section 2.7.3, and the significant regional differences are shown in terms of spatial distribution (Figure 6). In the stability grade distribution, the central and eastern regions were worst, followed by the northwest. The security grade of Beijing, Tianjin, and Hebei was lower, and the security grade of Shanxi, Shandong, Jiangsu, Shanghai, Henan, and Ningxia was low. However, most of China’s regional stability grade was higher and was in the middle- and low-risk state. In terms of coordination, the security grade in most areas of Northern China was lower, the security grade in the Southwest China was in the middle, and the security grade in Southeast China was higher. In terms of sustainability, security was low in the north central region. The security grade of Shanxi, Guizhou, and Ningxia was lower; the security grade of Inner Mongolia, Heilongjiang, Henan, and Xinjiang was low; and the security of the eastern and southern coastal areas was relatively higher, with most of the country being in a medium-risk state. The basic distribution pattern of water–energy–food collaborative security in China was that North China and Northwest China were found to have the lowest security grade with relatively high risk, Southwest China was relatively secure, and Southeast China was the region with the highest collaborative security in terms of the three criteria.
Hebei province has a large population with developed industry, extensive land cultivation, large water resource demand but serious shortage of water resources, and serious environmental problems. Shanxi Province’s water consumption for energy and farming was found to be high, but there is little precipitation and thus there is the problem that energy and food compete with each other for water. In Shanxi, economic development is dependent on the energy industry, and as a result, has a large amount of greenhouse gas emissions. Furthermore, the sustainability of the environmental system is poor. Ningxia, an important energy and food production base in Northwest China, is challenged by drought and little rain, a serious shortage of water resources, and poor economic and social development, resulting in severe environmental problems. The shortage of water resources is a common problem in the north of China, and it is the key factor that restricts the collaborative security in these areas. Meanwhile, precipitation is abundant in the south, the economy and society in the South China and the south of East China are developed, and the ecological environment is good; therefore, the collaborative security in these areas is higher.
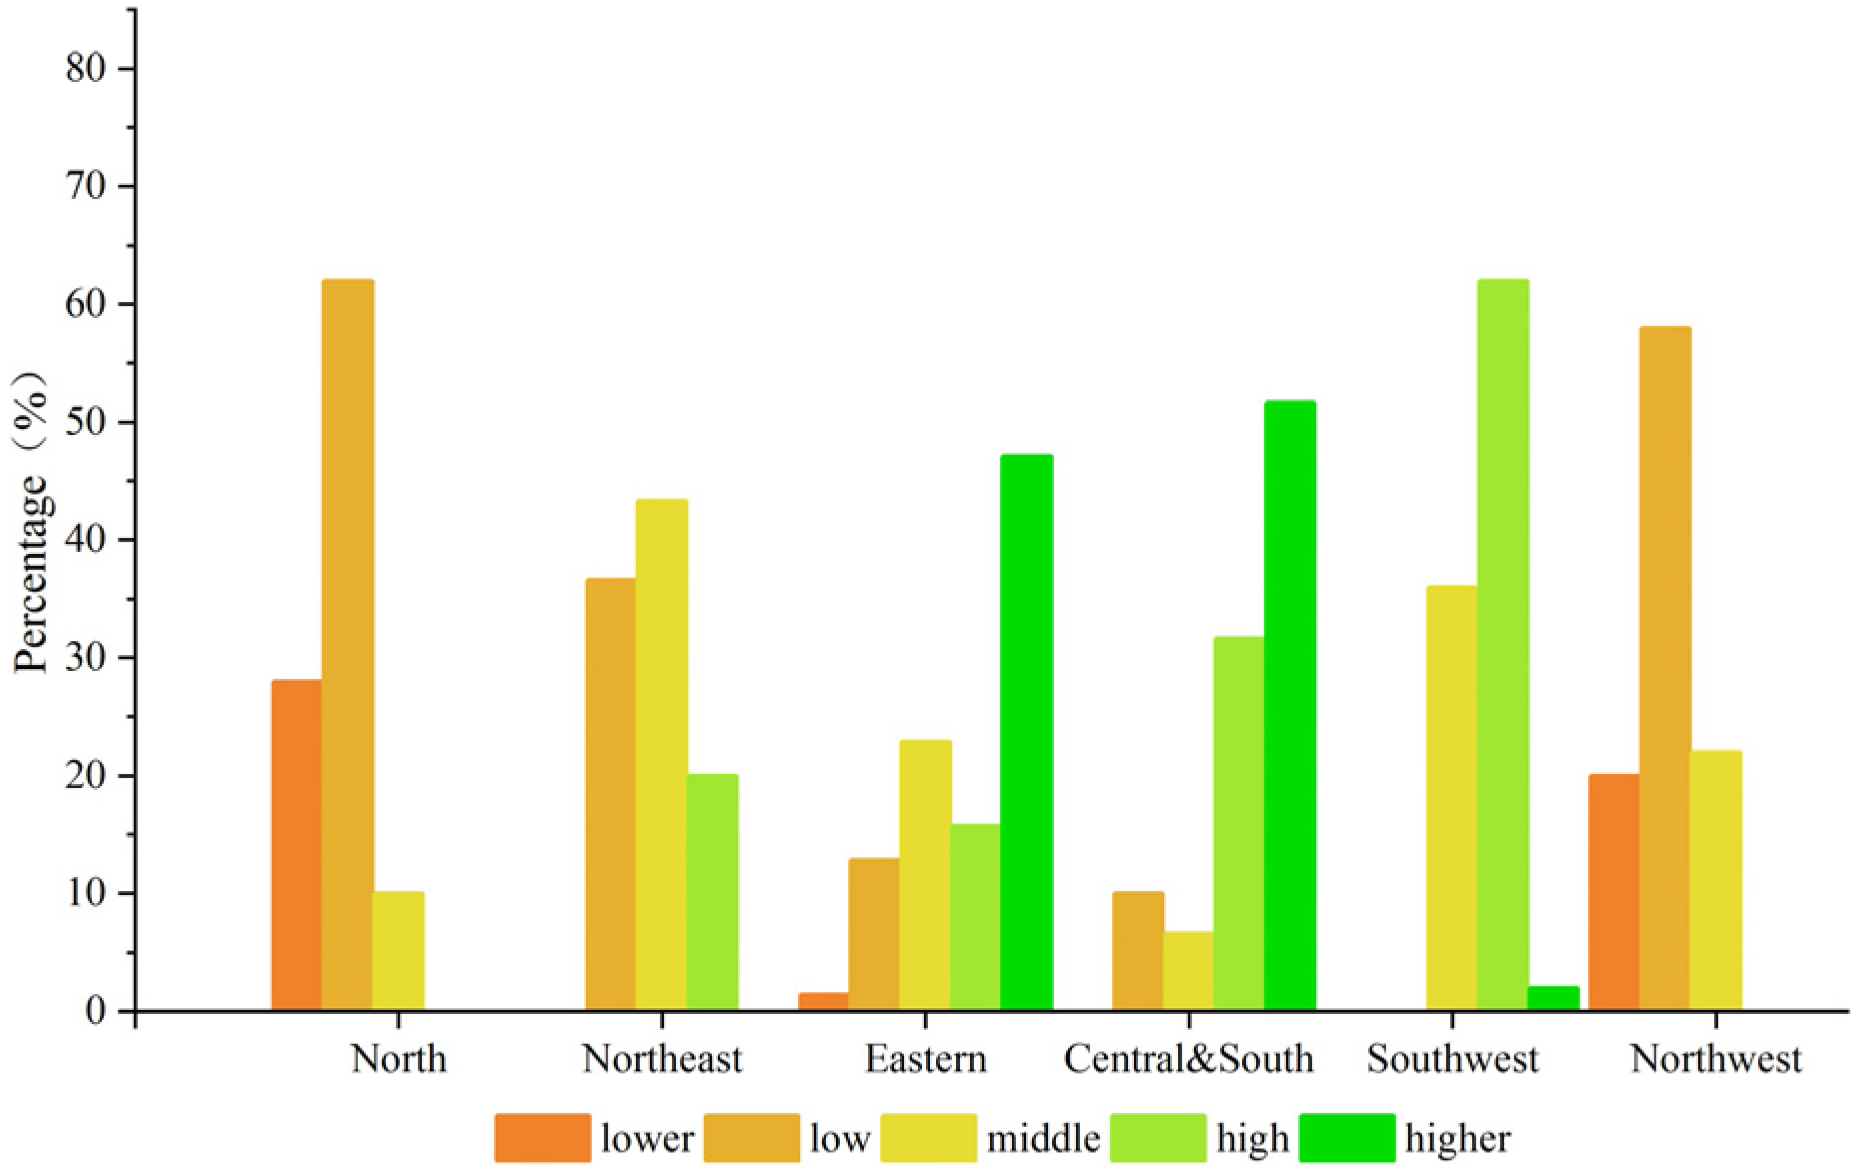
3.2.4. Collaborative Security Gradation at Regional Scale
The water–energy–food collaborative security grade was calculated in six geographical sub-regions (Figure 7). In the statistical period, the proportion of lower-grade data in North China was 28%, the proportion of low-grade data was 62%, and the cumulative rate was 90%, which made it the lowest area of collaborative security in China. The proportions of lower-grade and low-grade data in Northwest China were 20% and 58%, respectively, and the collaborative risk was second only to that in North China. There were no higher- and high-grade regions in North China and Northwest China. The proportions of middle and low grades were higher in the Northeast China, and there were no regions with higher and lower grades. The higher grade in East China was about 47%, the higher and high grades accounted for 63% cumulatively, the lower grade was only 1.4%, and the low grade was about 14%. Central and South China had higher ratios, which was 51.7%, and high accounted for 31.7%. The higher and high accumulated about 83% cumulatively in Central and South China, which was the highest area without any lower-grade regions. The collaborative security grade in Southwest China was mainly high, reaching 62%, followed by middle grade, and there were no areas with lower and low grades.
4. Discussion
China has a vast territory, and therefore there are various factors influencing the collaborative security of different areas. Analysis of the evaluation result and influencing factors suggests that different measures should be taken in different areas in order to improve the collaborative security level of water, energy, and food. In the north the optimal allocation and high-efficient utilization of the limited supplies of waters is at the core of collaborative risk adjustment. For example, provinces such as Hebei should promote water-efficient agriculture, complete agricultural water conservancy projects, further improve water utilization efficiency in agriculture, and control the water resource risk brought by fluctuations in rainfall. It should also strengthen oversight of industrial pollution, reduce water pollution, and improve the environment. Ningxia and other northwest energy bases can further promote water conservation and emission reductions and promote financing of local water conservation to protect the Yellow River and guarantee food supplies. The southwest should control polluting and energy-intensive industry, as well as promote sustainable economic development by focusing on the emerging high-tech and information sectors.
Efficient use of water resources by industry and agriculture is central to water–energy–food collaborative security. Reducing risks to the system will depend on promoting technological progress and industrial upgrades, and control of energy consumption and greenhouse gas emissions while at the same time maintaining rapid socio-economic development. In addition, reducing food waste in logistics, warehousing, transportation, consumption, and other links is also an important measure to reduce food risks [40].
5. Conclusions
On the basis of the symbiosis theory, we established an evaluation system built on three aspects: supply and demand of resources, coordination of relevance, and connection with the outside. In the traditional study of the water–energy–food nexus, the three kinds of resources are taken as the core and the index system is built around resource endowment and consumption. As a result, the coordination relationship between resources and the connection with external environment is not considered. We highlighted the relationship between resources and the external environment and selected more detailed indexes to make the evaluation more systematic. The combination of the entropy method and AHP was used to determine the weight of each index and criterion, so as to reduce the disadvantage of subjective or objective methods. In addition, the variable fuzzy evaluation method was applied to assess the spatial distribution and temporal variation of the water–energy–food collaborative security level in China.
The evaluation result shows that the collaborative security of water, energy, and food in China presents a higher distribution of space in the south than the north. The collaborative security was found to be comparatively poor in North and Northwest China, where there are high-risk areas. The security problem was found to be especially acute in the north. The collaborative security of East China and Central South China was high, and the security level of most of the provinces in these two regions was relatively high. In terms of the dynamic change of collaborative security, Northeast and Southeast China and Ningxia showed an upward trend, while provinces such as Shandong, Henan, and some provinces in the southwest decreased significantly.
Author Contributions
This study was calculated and written by X.L.; C.L. designed the experimental framework of this work; Y.D. provided the calculation method; G.W., Z.B., and J.L. contributed to the revision of manuscript and data collection. All authors have read and agreed to the published version of the manuscript.
Funding
This research was funded by the National Key Research and Development Programs of China (no. 2017YFC0404602), the NSFC-NSF Research Project (no. 41961124007), and Key Technology Research and Development Program of Shandong Province (no. 2019GSF111043).
Data Availability Statement
The data presented in this study are available on request from the corresponding author or the first author
Conflicts of Interest
The authors declare no conflict of interest
References
- Rasul, G.; Sharma, B. The nexus approach to water–energy–food security: An option for adaptation to climate change. Clim. Policy. 2016, 16, 682–702. [Google Scholar] [CrossRef] [Green Version]
- Bazilian, M.; Rogner, H.; Howells, M.; Hermann, S.; Arent, D.; Gielen, D.; Steduto, P.; Mueller, A.; Komor, P.; Tol, R.S.J.; et al. Considering the energy, water and food nexus: Towards an integrated modelling approach. Energy Policy. 2011, 39, 7896–7906. [Google Scholar] [CrossRef]
- National Bureau of Statistics. China Statistical Yearbook; China Statistics Press: Beijing, China, 2017.
- National Bureau of Statistics. China Energy Statistical Yearbook; China Statistics Press: Beijing, China, 2017.
- Wang, X.J.; Zhang, J.Y.; Gao, J.; Shahid, S.; Xia, X.H.; Geng, Z.; Tang, L. The new concept of water resources management in China: Ensuring water security in changing environment. Environ. Dev. Sustain. 2018, 20, 897–909. [Google Scholar] [CrossRef]
- Chen, C.F.; Feng, K.L.; Ma, H.W. Uncover the interdependent environmental impacts associated with the water-energy-food nexus under resource management strategies. Resour. Conserv. Recycl. 2020, 160. [Google Scholar] [CrossRef]
- Kahrl, F.; Rolandholst, D. China’s water-energy nexus. Water Policy. 2008, 10, 51–65. [Google Scholar] [CrossRef]
- Forouzani, M.; Karami, E. Agricultural water poverty index and sustainability. Agron. Sustain. Dev. 2011, 31, 415–431. [Google Scholar] [CrossRef] [Green Version]
- Sharma, B.R.; Villholth, K.G.; Sharma, K.D. Groundwater Research and Management: Integrating Science into Management Decisions; International Water Management Institute: Colombo, Sri Lanka, 2006; pp. 242–257. [Google Scholar]
- Dong, S.N.; Xu, B.; Yin, S.X.; Han, Y.; Zhang, X.D.; Dai, Z.X. Water Resources Utilization and Protection in the Coal Mining Area of Northern China. Sci. Rep. 2019, 9. [Google Scholar] [CrossRef] [PubMed] [Green Version]
- Zhang, Z.Y.; Ma, X.J.; Lian, X.Y.; Guo, Y.S.; Song, Y.Q.; Chang, B.S.; Luo, L.Q. Research on the relationship between China’s greenhouse gas emissions and industrial structure and economic growth from the perspective of energy consumption. Environ. Sci. Pollut. Res. 2020, 27, 41839–41855. [Google Scholar] [CrossRef] [PubMed]
- Lin, G.; Jiang, D.; Fu, J.Y.; Dong, D.L.; Sun, W.J.; Li, X. Spatial Relationships of Water Resources with Energy Consumption at Coal Mining Operations in China. Mine Water Environ. 2020, 39, 407–415. [Google Scholar] [CrossRef]
- Wang, A.L.; Gao, C.C. Study on the Relationship of Spatio-temporal Matching Between Water Resources and Economic Development Factors in the Yellow River Basin. Fresenius Environ. Bull. 2018, 27, 6591–6597. [Google Scholar]
- Field, C.; Campbell, J.; Lobell, D. Biomass energy: The scale of the potential resource. Trends Ecol. Evol. 2008, 23, 65–72. [Google Scholar] [CrossRef] [PubMed]
- Chen, L.; Li, X.; Wen, W.; Jia, J.; Li, G.; Deng, F. The status, predicament and countermeasures of biomass secondary energy production in China. Renew. Sustain. Energy Rev. 2012, 16, 6212–6219. [Google Scholar] [CrossRef]
- Amorim, W.S.; Valduga, I.B.; Ribeiro, J.M.P.; Williamson, V.G.; Krauser, G.E.; Magtoto, M.K.; Guerra, J.B. The nexus between water, energy, and food in the context of the global risks: An analysis of the interactions between food, water, and energy security. Environ. Impact Assess. Rev. 2018, 72, 1–11. [Google Scholar] [CrossRef]
- Karlberg, L.; Hoff, H.; Amsalu, T.; Andersson, K.; Young, C. Tackling complexity: Understanding the food-energy-environment nexus in Ethiopia’s Lake Tana Sub-basin. Water Altern. 2015, 8, 710–734. [Google Scholar]
- Halbe, J.; Pahlwostl, C.; Lange, M.; Velonis, C. Governance of transitions towards sustainable development-the water-energy-food nexus in Cyprus. Water Int. 2015, 40, 877–894. [Google Scholar] [CrossRef]
- Ravar, Z.; Zahraie, B.; Sharifinejad, A.; Gozini, H.; Jafari, S. System dynamics modeling for assessment of water–food–energy resources security and nexus in Gavkhuni basin in Iran. Ecol. Indicators. 2019, 108. [Google Scholar] [CrossRef]
- Sahin, O.; Stewart, R.A.; Richards, R.G. Addressing the water-energy-climate nexus conundrum: A system approach. In Proceedings of the 7th International Congress on Environment Modelling and Software, San Diego, CA, USA, 15–19 June 2014. [Google Scholar]
- Calzadilla, A.; Rehdanz, K.; Tol, R.S.J. The economic impact of more sustainable water use in agriculture: A computable general equilibrium analysis. J. Hydrol. 2010, 384, 292–305. [Google Scholar] [CrossRef]
- Liu, J.; Hertel, T.; Taheripour, F. Analyzing Future Water Scarcity in Computable General Equilibrium Models. Water Econ. Policy 2017, 2, 1799–1813. [Google Scholar] [CrossRef] [Green Version]
- Bai, J.F.; Zhang, H.j. Spatio-temporal Variation and Driving Force of Water-Energy-Food Pressure in China. Sci. Geogr. Sinica. 2018, 38, 1653–1660, In Chinese. [Google Scholar] [CrossRef]
- Li, C.Y.; Zhang, S.Q. Chinese provincial water-energy-food coupling coordination degree and influencing factors research. China Popul. Resour. Environ. 2020, 30, 120–128. [Google Scholar] [CrossRef]
- Shao, H.; Liu, M.; Shao, Q.; Sun, X.; Wu, J.; Xiang, Z.; Yang, W. Research on eco-environmental vulnerability evaluation of the Anning River Basin in the upper reaches of the Yangtze River. Environ. Earth Sci. 2014, 72, 1555–1568. [Google Scholar] [CrossRef]
- Shao, H.Y.; Sun, X.F.; Tao, S.Q.; Xiang, Z.Y.; Xian, W. Environmental vulnerability assessment in middle-upper reaches of Dadu River Watershed using Projection Pursuit Model and GIS. Carpathian J. Earth Environ. Sci. 2015, 10, 143–146. [Google Scholar]
- Adriaenssens, V.; Baets, B.D.; Goethals, P.L.M.; Pauw, N.D. Fuzzy rule-based models for decision support in ecosystem management. Sci. Total. Environ. 2004, 319, 1–12. [Google Scholar] [CrossRef]
- Xia, J.; Shi, W. Perspective on water security issue of changing environment in China. J. Hydraul. Eng. 2016, 47, 292–301. [Google Scholar]
- Hu, S.J. A Theory of Social Symbiosis; Fudan University Press: Shanghai, China, 2012. [Google Scholar]
- Nie, N.; Zhou, J. Analysis of value-added role of logistics-finance based on symbiotic theory. J. Southeast Univ. (Nat. Sci. Ed.) 2007, S2, 249–252, In Chinese. [Google Scholar]
- Wang, C.; Fei, Z.H.; Ye, Q.L.; Zhang, Y.Y. Rural settlement space reconstruction strategy and implementation based on symbiosis theory on village scale. Trans. Chin. Soc. Agric. Eng. 2014, 30, 205–214, In Chinese. [Google Scholar] [CrossRef]
- Libiao, B.; Hailing, W.; Chunming, S.; Qiang, D.; Yi, L. Assessment of SIP Buildings for Sustainable Development in Rural China Using AHP-Grey Correlation Analysis. Int. J. Environ. Res. Public Health 2017, 14, 1292. [Google Scholar] [CrossRef] [Green Version]
- Dzitac, I.; Filip, F.G.; Manolescu, M.J. Fuzzy Logic Is Not Fuzzy: World-renowned Computer Scientist Lotfi, A. Zadeh. Int. J. Comput. Commun. Control. 2017, 12, 748. [Google Scholar] [CrossRef] [Green Version]
- Chen, S.Y. Theory and model of engineering variable fuzzy set-Mathematical basis for fuzzy hydrology and water resources. J. Dalian Univ. Technol. 2005, 45, 308–312, In Chinese. [Google Scholar]
- Chen, S.Y. Variable Fuzzy Methods and Mistake Demonstration in Extension Dependence Function. Water Resour. Power. 2005, 25, 1–14, In Chinese. [Google Scholar]
- Chen, S.Y.; Hu, J.M. Variable fuzzy assessment method and its application in assessing water resources carrying capacity. J. Hydraul. Eng. 2006, 3, 264–271+277, In Chinese. [Google Scholar] [CrossRef]
- Wang, S.; Yu, H.; Xin, Z.; Ding, J. Comprehensive evaluation method for water resources carrying capacity in river basins. J. Hydraul. Eng. 2003, 34, 88–92. [Google Scholar] [CrossRef]
- Meng, L.; Chen, Y.; Li, W.; Zhao, R. Fuzzy Comprehensive Evaluation Model for Water Resources Carrying Capacity in Tarim River Basin, Xinjiang, China. Chin. Geogr. Sci. 2009, 19, 85–95. [Google Scholar] [CrossRef]
- Jin, L.; Chang, Y.; Ju, X.; Xu, F. A Study on the Sustainable Development of Water, Energy, and Food in China. Int. J. Environ. Res. Public Health. 2019, 16, 3688. [Google Scholar] [CrossRef] [PubMed] [Green Version]
- Xie, N.; Zhong, L.; Ouyang, L.; Xu, W.; Zeng, Q.; Wang, K.; Zaynab, M.; Chen, H.; Xu, F.; Li, S. Community Composition and Function of Bacteria in Activated Sludge of Municipal Wastewater Treatment Plants. Water 2021, 13, 852. [Google Scholar] [CrossRef]
Figure 1.
Study area.

Figure 2.
Water–energy–food symbiotic system.

Figure 3.
National collaborative security index from 2007 to 2016.

Figure 4.
Statistics of collaborative security at provincial scale.

Figure 5.
Spatial distribution of the difference value.

Figure 6.
Spatial distribution of security index: (a) stability index; (b) coordination index; (c) sustainability index; (d) collaborative index.
Figure 6.
Spatial distribution of security index: (a) stability index; (b) coordination index; (c) sustainability index; (d) collaborative index.

Figure 7.
Distribution of cooperative security grades in different regions.


Table 1.
Description of the data used in our study.
| Data Type | Data Details | Data Source |
|---|---|---|
| Water resources | Precipitation; water resources in the region; water supply and composition; water consumption and composition; irrigation water consumption per mu; effective utilization coefficient of irrigation water | China Water Resources Bulletin |
| Water consumption quota | Industry Water Use Quota in various regions | |
| Energy source | Primary energy output; energy balance table; subindustry energy consumption; total power of agricultural machinery | China Energy Statistical Yearbook |
| Biomass power generation | National Monitoring and Evaluation Report on Biomass Power Generation | |
| Food | Cultivated land; food yield; food consumption | China Statistical Yearbook |
| Food import and export volume | General Administration of Customs People’s Republic of China | |
| Society and economy | Population; GDP (Gross Domestic Product); added value of various industries | China Statistical Yearbook |
| Environment | Land area; forest coverage rate; fertilizer application rate | China Statistical Yearbook |
| Greenhouse gas emissions of various types of energy | National Energy Administration | |
| Water resources reuse rate | Annual Statistic Report on Environment in China | |
| Other | Conversion coefficient of standard coal | China Energy Statistical Yearbook |
| Greenhouse gas emission coefficient | National Energy Administration |
Table 2.
Evaluation index system of water–energy–food cooperative security.
| Target | Criterion | Subsystem | Index | Significance | Unit | Effect Direction |
|---|---|---|---|---|---|---|
| Water–energy–food collaborative security | Stability, S | Water resources system, WS | Water resources per capita, W1 | Carrying capacity of water resources | m3/person | + |
| Water resource development utilization rate, W2 | Water resource development and utilization potential | % | - | |||
| Groundwater resource utilization rate, W3 | Groundwater resource security | % | - | |||
| Non-conventional water resource ratio, W4 | Water-saving capacity | % | + | |||
| Water consumption of 10,000 yuan GDP, W5 | Water use efficiency | m3/10,000 yuan | - | |||
| Energy system, ES | Energy production per capita, E1 | Energy abundance and supply | Tons of standard coal/person | + | ||
| Energy consumption of 10,000 yuan GDP, E2 | The degree of economic demand and dependence on energy | Tons of standard coal/10,000 yuan | - | |||
| Energy consumption elasticity factor, E3 | Changes in the degree of economic dependence on energy | — | - | |||
| Energy self-sufficiency rate, E4 | The degree of satisfaction of energy supply to demand | % | + | |||
| Food system, FS | Arable land per capita, F1 | The matching degree of cultivated land and population | m2/person | + | ||
| Food yield per capita, F2 | The degree to which food production matches population | kg/person | + | |||
| The proportion of the added value of primary production, F3 | The proportion of agriculture in the economic structure | % | - | |||
| Food self-sufficiency rate, F4 | The degree of satisfaction of food supply to demand | % | + | |||
| Coordination, C | Water–energy system, WEC | Water consumption per unit of energy production, WE1 | Energy production water efficiency | m3/tons standard coal | - | |
| Energy production water use ratio, WE2 | Pressure of energy production on water resources | % | - | |||
| Repetitive utilization rate of industrial water, WE3 | Industrial water-saving level | % | + | |||
| Water–food system, WFC | Agricultural water use ratio, WF1 | Pressure of agricultural production on water resources | % | - | ||
| Average irrigation water consumption, WF2 | Agricultural water use efficiency | m3/ha | - | |||
| Efficient utilization coefficient of irrigation water in farmland, WF3 | Irrigation water management level | — | + | |||
| Annual precipitation, WF4 | Effects of climate on irrigation water use | Mm | + | |||
| Energy–food system, EFC | Agricultural machinery power of per unit cultivated area, EF1 | Reflecting the need for energy in agriculture | KW/ha | - | ||
| The proportion of the energy consumption of primary production, EF2 | Pressure of agriculture on energy supplies | % | - | |||
| The proportion of biomass power generation, EF3 | Support of agriculture to the energy supply | % | + | |||
| Sustainability, T | Economic system, JT | Per capita GDP, J1 | Economic development level | 10,000 yuan/person | + | |
| GDP growth rate, J2 | Vitality of economic growth | % | + | |||
| The proportion of the added value of tertiary industry production, J3 | Industrial structure level | % | + | |||
| Social system, HT | Population growth rate, H1 | Population growth pressure | ‰ | - | ||
| Urbanization rate, H2 | Social development level | % | + | |||
| Population density, H3 | Population pressure | people/km2 | - | |||
| Natural system, ZT | Wastewater recycling efficiency, Z1 | Water saving and pollution control level | % | + | ||
| Forest coverage rate, Z2 | Ecological equilibrium state | % | + | |||
| Fertilizer application amount per unit cultivated area, Z3 | Pressure of agriculture on the environment | t/ha | - | |||
| 10,000 yuan GDP greenhouse gas emissions, Z4 | Economic pressure on the environment | kg/10,000 yuan | - |
Table 3.
Weights of indicators.
| Index | Weight | Index | Weight | Index | Weight | Criterion | Weight |
|---|---|---|---|---|---|---|---|
| W1 | 0.097 | WE1 | 0.183 | J1 | 0.157 | S | 0.37 |
| W2 | 0.23 | WE2 | 0.124 | J2 | 0.058 | C | 0.407 |
| W3 | 0.112 | WE3 | 0.062 | J3 | 0.088 | T | 0.224 |
| W4 | 0.027 | WF1 | 0.14 | H1 | 0.039 | ||
| W5 | 0.052 | WF2 | 0.072 | H2 | 0.095 | ||
| E1 | 0.036 | WF3 | 0.047 | H3 | 0.074 | ||
| E2 | 0.034 | WF4 | 0.274 | Z1 | 0.127 | ||
| E3 | 0.019 | EF1 | 0.024 | Z2 | 0.045 | ||
| E4 | 0.077 | EF2 | 0.063 | Z3 | 0.075 | ||
| F1 | 0.048 | EF3 | 0.012 | Z4 | 0.243 | ||
| F2 | 0.092 | ||||||
| F3 | 0.025 | ||||||
| F4 | 0.151 |
Table 4.
System security rating.
| Evaluation Grade | Lower | Low | Middle | High | Higher |
|---|---|---|---|---|---|
| Stability | <2.3 | 2.3~2.7 | 2.7~3.1 | 3.1~3.5 | >3.5 |
| Coordination | <2.8 | 2.8~3.2 | 3.2~3.6 | 3.6~4.0 | >4.0 |
| Sustainability | <2.8 | 2.8~3.1 | 3.1~3.4 | 3.4~3.6 | >3.6 |
| Collaborative | <2.7 | 2.7~2.9 | 2.9~3.2 | 3.2~3.5 | >3.5 |
Publisher’s Note: MDPI stays neutral with regard to jurisdictional claims in published maps and institutional affiliations. |
© 2021 by the authors. Licensee MDPI, Basel, Switzerland. This article is an open access article distributed under the terms and conditions of the Creative Commons Attribution (CC BY) license (https://creativecommons.org/licenses/by/4.0/).
Share and Cite
MDPI and ACS Style
Li, X.; Liu, C.; Wang, G.; Bao, Z.; Diao, Y.; Liu, J. Evaluating the Collaborative Security of Water–Energy–Food in China on the Basis of Symbiotic System Theory. Water 2021, 13, 1112. https://doi.org/10.3390/w13081112
AMA Style
Li X, Liu C, Wang G, Bao Z, Diao Y, Liu J. Evaluating the Collaborative Security of Water–Energy–Food in China on the Basis of Symbiotic System Theory. Water. 2021; 13(8):1112. https://doi.org/10.3390/w13081112
Chicago/Turabian StyleLi, Xiao, Cuishan Liu, Guoqing Wang, Zhenxin Bao, Yanfang Diao, and Jing Liu. 2021. "Evaluating the Collaborative Security of Water–Energy–Food in China on the Basis of Symbiotic System Theory" Water 13, no. 8: 1112. https://doi.org/10.3390/w13081112
Note that from the first issue of 2016, this journal uses article numbers instead of page numbers. See further details here.