Article

Erythromycin Abatement from Water by Electro-Fenton and Peroxyelectrocoagulation Treatments

1
Eurecat, Centre Tecnològic de Catalunya, Water, Air and Soil Unit, Plaça de la Ciència 2, 08242 Manresa, Spain
2
Eurecat, Centre Tecnològic de Catalunya, Centre for Omic Sciences (Joint Unit Eurecat-Universitat Rovira i Virgili), Unique Scientific and Technical Infrastructure (ICTS), 43204 Reus, Spain
*
Author to whom correspondence should be addressed.
Water 2021, 13(8), 1129; https://doi.org/10.3390/w13081129
Submission received: 30 March 2021 / Revised: 16 April 2021 / Accepted: 16 April 2021 / Published: 20 April 2021
(This article belongs to the Special Issue Advanced Oxidation Processes for Water and Wastewater Treatment)

Abstract

:
Electro-Fenton (EF) and peroxyelectrocoagulation (PEC) processes were investigated to mineralize 10 mg L−1 erythromycin from ultrapure water, evaluating the influence of the anode material (BDD and Fe), current density (janode) (5 mA cm−2 and 10 mA cm−2), oxygen flowrate injected to the cathode (0.8 L min−1 O2 and 2.0 L min−1 O2) and pH (2.8, 5.0 and 7.0) on the process efficiency and the electricity costs. 70% mineralization was reached after applying 0.32 A h L−1 under the best operational conditions: PEC treatment at 5 mA cm−2, 2.0 L min−1 O2 and pH 2.8. The electricity consumption of the electrochemical cell under these conditions was approximately 0.3 kWh m−3. Early-stage intermediates produced from erythromycin degradation were identified and quantified throughout the treatment and a potential erythromycin degradation pathway was proposed. The most appropriate operational conditions tested with synthetic solutions were applied to treat a real effluent from the tertiary treatment of an urban wastewater treatment plant. All emerging compounds listed in the EU Decision 2018/840 (Watch List 2018) were determined before and after the PEC treatment. All listed pollutants were degraded below their quantification limit, except estrone and 17-α-ethinylestradiol which were 99% removed from water. Electricity consumption of the electrochemical cell was 0.4 kWh m−3. Whilst awaiting future results that demonstrate the innocuity of the generated byproducts, the results of this investigation (high removal yields for emerging pollutants together with the low electricity consumption of the cell) indicate the promising high potential of PEC treatment as a water treatment/remediation/regeneration technology.

1. Introduction

Over the last two decades there has been increasing concern regarding emerging contaminants due to the possible threats they pose to both the human population and the aquatic environment [1]. Wastewater reuse practices, together with more advanced analytical methods to detect substances at levels ranging from ng L−1 to µg L−1 [2], have resulted in more advanced and stringent regulations aiming at tackling this environmental problem [3]. At the European Union (EU) level, the first watch list of substances for tracking was published in 2015 [4] establishing 10 substances or groups of substances to be monitored. This watch list aimed to gather data for the future prioritisation of emerging compound regulation in the field of water policy. It was updated in 2018 by the EU Decision 2018/840 [5] (called in this paper, Watch List 2018) and just the last year (EU Decision 2020/1161) it was again modified since “according to Article 8b(2) of Directive 2008/105/EC, the duration of a continuous watch list monitoring period for any individual substance shall not exceed four years” [6].
Three macrolide antibiotics (erythromycin, clarithromycin, azithromycin) were included in the EU Decision 2018/840 [5] although their monitoring ceased in 2019 [6]. Antibiotics are a class of pharmaceutical active compounds with high usage and consumption worldwide both for humans and animals [7]. They can enter to the environment via several pathways and can, therefore, contaminate different environmental compartments [8]. Their presence has been detected in surface water, groundwater and drinking water [9]. This fact has further increased concern due to their negative effect, including the spread of antibiotic resistance [10].
Among the macrolide antibiotics listed in the Watch List 2018, erythromycin was detected in diverse water matrices such as surface water (85,200 and 7100 ng L−1 [11]), hospital effluents (127–575 ng L−1 [12], maximum of 140 ng L−1 [13], 1000–27,000 ng L−1 [14]), livestock wastewater (139 ng L−1 [12]), and urban wastewater (179–185 [15]), among others.
The removal of this pollutant from water by various technologies has been studied. More than 88% and 93% erythromycin removals from a hospital effluent were obtained by powdered activated carbon and ozone, respectively, at pH 8.5–8.8 [13]. However, less than 35% erythromycin degradation was achieved by applying UV-C doses equal to or lower than 7200 J m−2 [13], indicating that it is not a photoactive compound at 254 nm. Its total degradation was achieved both by the EreB esterase enzymatic treatment [16] and solar-driven heterogeneous photocatalysis with immobilised TiO2 [15]. However, its degradation percentage diminished by 45% or 22% when solar light was simulated during immobilised [16] or suspended [17] TiO2 photocatalysis, respectively. The solar photo-Fenton process also resulted in 100% erythromycin removal [17].
The results of previous investigations demonstrate that advanced oxidation processes (AOPs) are highly efficient treatments to reach gradual oxidation of erythromycin [15,16,17] as well as other emerging contaminants [18,19,20,21], through the generation of highly reactive oxygen species (ROS) (mostly hydroxyl radical OH) with high oxidation potentials (e.g., E0NHE = 2.80 V in the case of OH) and low selectivity. Among the mechanisms to generate hydroxyl radical, the Fenton process [22] (caused by the decomposition of H2O2 mediated by catalytic quantities of Fe(II) under acidic and dark conditions (Equation (1)) has been widely investigated for wastewater treatment [23,24]:
H 2 O 2 ( aq ) + Fe 2 + ( aq ) Fe 3 + ( aq ) + OH ( aq ) + OH ( aq ) k = 41.7 79   M 1   s 1
However, the major drawback of this process is that the regeneration of Fe(II) takes place by Fenton-like reaction (Equation (2)), which presents a reaction rate much lower than the Fenton reaction:
Fe 3 + ( aq ) + H 2 O 2 ( aq ) Fe 2 + ( aq ) + HO 2 ( aq ) k = 9.1 × 10 7   M 1   s 1
It is for this reason that solar light is usually applied during the Fenton process so as to accelerate the Fe(II) regeneration and to improve process efficiency [16]. Alternatively, high quantities of iron should be added to the contaminated water, which implies an increase in the consumption of the iron reagent and the generation of an iron oxyhydroxide sludge at the end of the treatment that needs to be managed.
The upgraded version of the Fenton process is the electrochemical generation of H2O2 and Fe(II), where both reagents are in-situ generated in an electrochemical cell. Moreover, Fe(II) can be regenerated by Fe(III) reduction on the cathode (Equation (4)), ensuring the continuity of the Fenton reaction (Equation (1)). This process is known as peroxyelectrocoagulation (PEC) [25,26,27]. The main reactions occurring at the oxygen/air diffusion cathode (Equations (3) and (4)) and at the Fe anode (Equation (5)) are detailed below:
O 2 ( g ) + 2 H + ( aq ) + 2 e H 2 O 2 ( aq )
Fe 3 + ( aq ) + e Fe 2 + ( aq )
Fe ( s ) Fe 2 + ( aq ) + 2 e
When an inert material is used as an anode instead of iron, Fe(II) must be added to the system. In this case, other oxidation reactions occur at the anode, depending on its materials. Partial water oxidation to hydroxyl radical (Equation (6)) takes places at non-active boron-doped diamond (BDD) anodes [28]. This process is called electro-Fenton (EF) [29].
H 2 O ( l ) OH ( aq ) + H + ( aq ) + e
Although a dark electrochemical process to degrade erythromycin from water was studied, such as a microbial electro-Fenton system with an average removal efficiency of 89% in 48 h [30], oxidation of this compound using the EF and PEC processes has not yet been investigated. Again, solar light was chosen to increase the efficiency of the electrochemical treatment [31]. Approximately 69% of 165 mg L−1 erythromycin was mineralized by solar photo electro-Fenton process with Pt/Ti anode, graphite-felt cathode, and applying the following conditions: 27.7 mg L−1 Fe(II), pH 3, a current density on cathode (jcathode) of 0.16 mA cm−2 and a current density on anode (janode) of 32.8 mA cm−2 [31]. This study [31] also examined certain erythromycin transformation byproducts generated at intermediate (30 min) or elevated (120 min) treatment times of the solar photo electro-Fenton process.
Considering all this information, studying the removal of this emerging compound from water in Fenton-based processes in dark conditions was highly recommendable, given that they offer the opportunity of competitive industrial technologies with lower surface occupation and lower investment costs when compared to solar driven treatments [32].
The intention of this article is to describe how to answer this necessity, investigating the mineralization of erythromycin from ultrapure water by PEC and EF processes, comparing the influence of current density, oxygen flowrate injected into the cathode and pH on the process efficiency. The erythromycin concentration (10 mg L−1) used in the current work is higher than those potentially found in real effluents [11,12,13,14,15] in order to identify non-reported erythromycin degradation byproducts generated during the early stage of the treatment and to propose its degradation pathway. Finally, the most appropriate operational conditions detected in synthetic water were applied to treat a real effluent from the tertiary treatment of a municipal wastewater treatment plant (WWTP). The emerging compounds listed in the Watch List 2018 were quantified for this effluent and their degradation percentage, total mineralization, and the economic efficiency of the electrochemical process determined.

2. Materials and Methods

2.1. Chemicals

Erythromycin (purity > 99%) was of reagent grade and supplied by Sigma Aldrich (St. Louis, MO, USA). Anhydrous Na2SO4 (used as background electrolyte) and FeSO4·7H2O (used as catalyst during EF experiments) were of analytical grade and both were purchased from Scharlab S.L. (Sentmenat, Spain). Reagent grade 30% (w/w) H2O2 was also supplied by Scharlab S.L. Analytical grade 96% H2SO4 and NaOH pellets from Scharlab S.L. were used for the preparation of diluted solutions used for the pH adjustment. 1000 mg L−1 Ti standard solution (TiSO5 × H2SO4) from Sigma Aldrich and analytical grade 96% H2SO4 were used to determine the H2O2 concentration.
Solutions were prepared with high-purity water from a Milli-Q Academic (Merck Life Science S.L, Madrid, Spain) system (resistivity > 18 MΩ cm, at 25 °C).
Acetonitrile (ACN), methanol (MeOH) and water, all LC-MS grade, were purchased from Scharlab S.L. Formic acid (CH2O2) LC-MS grade were purchased from Fisher Scientific (Loughborough, Leicestershire, UK), and ammonium fluoride (NH4F), dimethylsulfoxide (DMSO) LC-MS grade, phosphate buffered saline (PBS) and ammonium formate (NH4HCO2) were supplied by Sigma-Aldrich.
The standards to determine the compounds described in the EU Decision 2018/840 [5] were supplied by various companies. 17-α-ethinylestradiol (EE2), 17-β-estradiol (E2) and metaflumizone were supplied by Dr. Ehrenstorfer GmbH (Augsburg, Germany); estrone (E1) and erythromycin were supplied by Sigma-Aldrich; clarithromycin, azithromycin, methiocarb, imidacloprid, thiacloprid, thiametoxam, chlothianidin, acetamiprid and ciprofloxacin-HCl were supplied by Neochema GmbH (Bodengeim, Germany) at a concentration of 10 mg L−1 with ACN; amoxicillin trihydrate was supplied by Toronto Research Chemicals (Toronto, ON, Canada).
Isotopically labelled compounds were used as internal standards (IS). 17-α-ethinylestradiol-2,4,16,16-d4, 17-β-estradiol-2,4,16,16,17-d5, erythromycin-d3, estrone-2,4-16,16-d4, clarithromycin-d3, imidacloprid-d4, methiocarb-d3 were supplied by Neochema GmbH at a concentration of 10 mg L−1 in ACN; thiamethoxam-d4 (oxadiazine-d4) and chlothianidin-d3 (N’-methyl-d3) were supplied by Dr. Ehrenstorfer GmbH; acetamiprid-d3 (N-methyl-d3) (mixture of isomers) was supplied by CDN isotopes (Pointe-Claire, QC, Canada); and amoxicillin–d4 (major) was supplied by Toronto Research Chemical. Standard solutions were prepared in MeOH LC-MS grade, with the exception of amoxicillin trihydrate that it was prepared with DMSO. Calibration mixtures were prepared in water:MeOH (1:1, v/v).

2.2. Instruments and Analytical Procedures

Dissolved organic carbon (DOC), total inorganic carbon (TIC) and total nitrogen (TN) was monitored by an Multi N/C 3100 analyser (Analytik Jena, Jena, Germany). Reproducible values, within ± 2% accuracy, were obtained by injecting 50 µL aliquots previously filtered by 0.45 µm polyvinylidene fluoride (PVDF) membranes. Total and dissolved iron was measured by the spectrophotometric method based on Standard Method 3500-Fe-B [33]. A UV/Vis UV-2450 spectrophotometer (Shimadzu, Kyoto, Japan) was used to determine H2O2 concentrations from absorption of the Ti-H2O2 coloured complex at λ = 410 nm [34], filtering previously 1 mL of samples by 0.45 µm PVDF filters. A sensiIONTM MM374 pH meter and electrical conductivity meter (Hach Lange Spain, S.L.U., Hospitalet de Llobregat, Barcelona, Spain) was used to follow the values of pH and the conductivity.
For the determination of erythromycin and its transformation products, 100 µL of water sample was mixed with 50 µL of internal standard solution (erythromycin-d3) at a concentration of 1 mg mL−1 prepared in ultrapure water. The samples were diluted with 850 µL of PBS to adjust the pH of the solution at 7.8 since erythromycin degradation is promoted at acidic pH. Then, samples were vortexed, centrifuged for 5 min at 4 °C and 15,000 rpm and transferred to a chromatographic vial for their analysis.
The chromatographic separation was performed on an UHPLC 1290 Infinity II Series coupled to a QTOF/MS 6550 Series, both from Agilent Technologies (Santa Clara, CA, USA). The chromatographic column was a Kinetex EVO C18 (100 × 2.1 mm) from Phenomenex (Torrance, CA, USA) and the mobile phase was 100% water with 0.1% formic acid (A) and 100% ACN (B). The gradient elution was as follows: 0–0.5 min (0% B isocratic); 0.5–1.0 (0–15% B); 1.0–10.0 (15–60% B); 10.0–11.0 (60–100% B); 11.0–13.0 (100% B isocratic). The flowrate was set at 0.6 mL min−1, the column temperature at 25 °C and the injection volume was 2 µL.
The mass spectrometer operated in positive electrospray ionization (ESI) mode and the source parameters were as follows: gas temperature (260 °C), gas flow (11 L min−1), sheath gas temperature (350 °C), sheath gas flow (12 L min−1), nebulizer (20 psi), capillary voltage (5100 V) and nozzle voltage (500 V). Data acquisition was carried out in full-scan over a mass-range of 100 to 1700 m/z at 2.5 spectra/s and MS/MS spectra were performed at 15, 30 and 45 eV.
The assignment of erythromycin was performed by direct comparison with the commercial standard, whereas the tentative identification of erythromycin degradation products was according to bibliography [16,35,36,37,38,39], exact mass, retention time and tandem mass spectra. These degradation products were semi-quantified using the erythromycin internal standard calibration curve. Additionally, erythromycin E and erythromycin F dehydrogenation TP-2 which have the same exact mass and retention time were semi-quantified by using their product ion spectra with the chromatographic peak of 748.4478→574.3605 and 748.4478→590.3554 transitions, respectively.
A solid phase extraction (SPE) procedure based on a previous publication [40] to analyze the compounds included in the Watch List 2018 was carried out. Oasis HLB SPE cartridges (3 mL, 400 mg) were supplied by Waters (Milford, MA, USA) and the extraction was performed on a Supelco Visiprep SPE Vacuum Manifold (Sigma Aldrich, Saint Louis, MI, USA). The cartridges were previously conditioned with successive volumes of 2 mL of MeOH and 2 mL of Milli-Q water. Then, 100 mL of wastewater samples, previously filtered through a 0.45 µm nylon filter from Millipore (Burlington, MA, USA), were spiked with 0.1 mL of internal standard mixture at a concentration of 1 µg mL−1 and loaded to the SPE cartridge. After this, the cartridges were washed with 2 mL of Milli-Q water and dried under vacuum system. The compounds were eluted with 1.5 mL of MeOH. The eluates were evaporated under a nitrogen flow and reconstituted with 200 µL of MeOH:water (80:20, v/v) and transferred to glass vials for LC-MS/MS analysis.
The chromatographic analysis of the compounds of the Watch List 2018 was performed on and UHPLC 1290 Series coupled to a triple quadrupole mass spectrometer (QqQ) 6490 Series, both from Agilent Technologies.
The compounds included in this study were determined in two different chromatographic methods depending on their ESI mode (positive or negative). In both cases, the chromatographic separation was performed using a Acquity UPLC BEH C18, 1.7 µm (100 × 2.1 mm) from Waters. The group of compounds determined on negative ESI mode (ESI-), corresponding to estrogens (detailed in Table 1), were separated using as a mobile phase of 100% water with 5 mmol L−1 of ammonium fluoride (A) and 100% MeOH (B). The gradient elution was as follows: 0–1 min (5% B isocratic); 1–2 min (5–50% B), 2–9 min (50–65% B), 9–10 min (65–98% B), 10–12 min (98% B isocratic). The flowrate was set at 0.3 mL min−1, the column temperature at 40 °C and the injection volume was 2 µL. The source parameters were gas temperature (250 °C), gas flow (16 L min−1), sheath gas temperature (375 °C), sheath gas flow (12 L min−1), nebulizer (40 psi), capillary voltage (3000 V) and nozzle voltage (1000 V). Quantification of compounds was performed by internal standard calibration using multiple reaction monitoring acquisition, as detailed in Table 1.
The other compounds described in the Watch List 2018 (detailed Table 1) were determined by positive ESI (ESI+). The compounds were separated using a mobile phase consisting on water:MeOH (98:2, v/v) with 0.1% of formic acid (A) and MeOH:water (99:1) with 0.1% of formic acid and 10 mmol L−1 of ammonium formate (B). The gradient elution was as follows: 0–1 min (0% B isocratic); 1–6 min (0–50% B), 6–8.5 min (50–55% B), 8.5–11.5 min (55–75% B), 11.5–13.5 min (75–85% B), 13.5–19.0 (85% B isocratic), 19.0–19.3 min (85–100% B), 19.3–21.3 min (100% B isocratic), 21.3–21.4 min (100–0% B), 21.4–23.4 min (0% B isocratic). The flowrate was set at 0.5 mL min−1, the column temperature at 40 °C and the injection volume was 2 µL. The source parameters were gas temperature (180 °C), gas flow (20 L min−1), sheath gas temperature (225 °C), sheath gas flow (11 L min−1), nebulizer (40 psi), capillary voltage (4500 V) and nozzle voltage (0 V). Quantification of compounds was performed by internal standard calibration using multiple reaction monitoring acquisition, as detailed in Table 1.

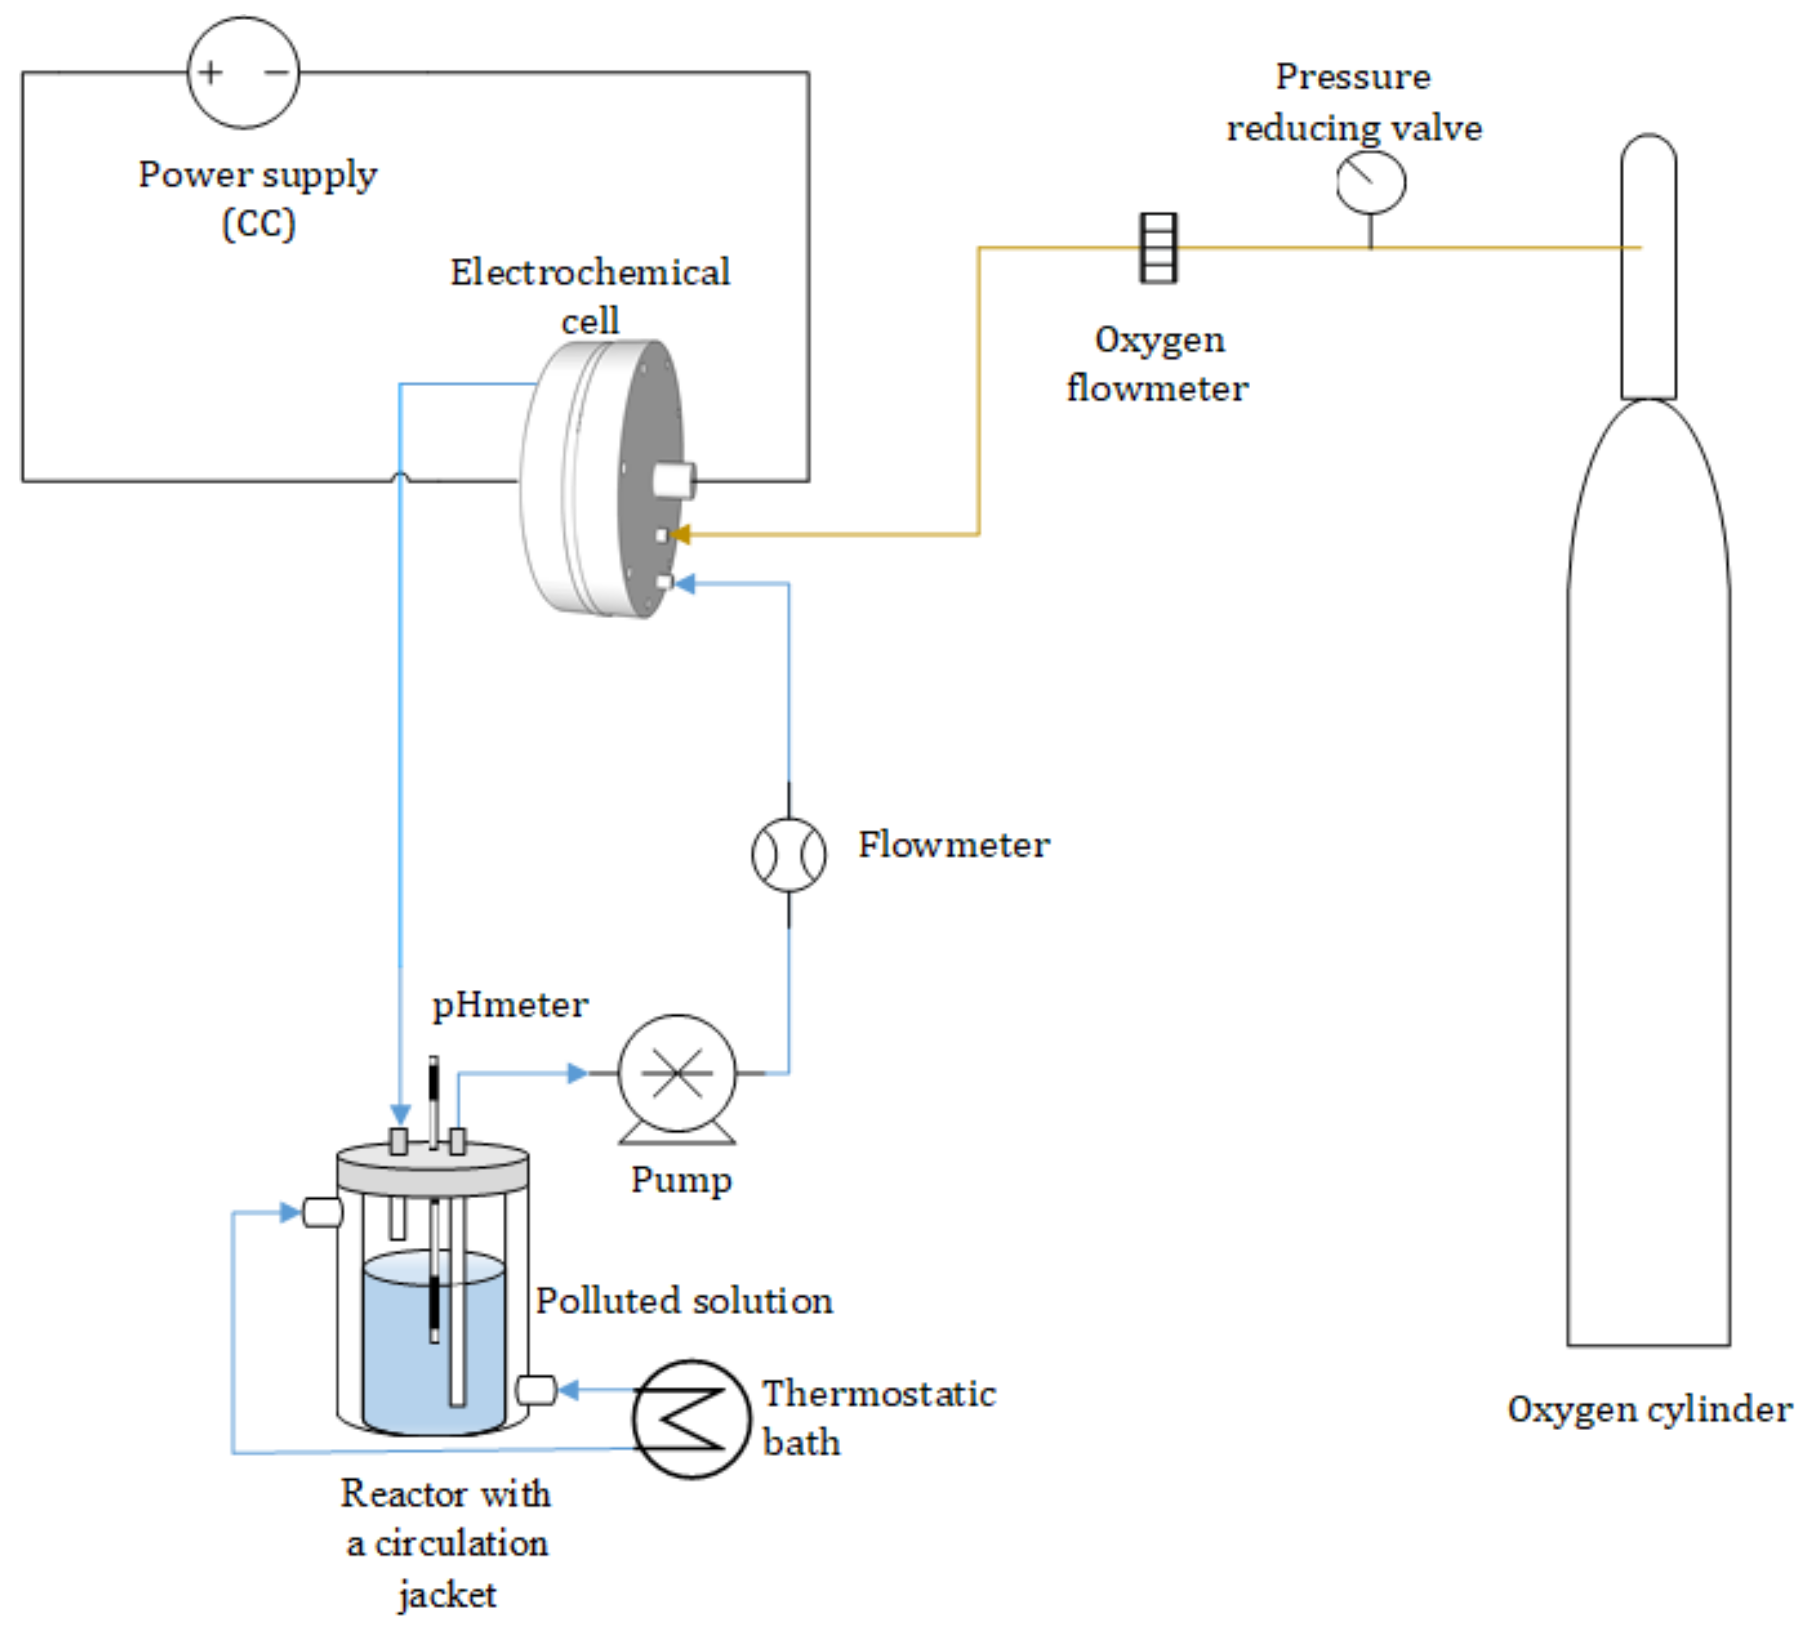
2.3. Experimental Setup and Operational Conditions

1 L of 10 mg L−1 erythromycin (Milli-Q water) and 0.05 M Na2SO4 (background electrolyte) was treated by EF and PEC processes by continuously recirculating the solution from a reservoir (cylindrical Pyrex glass reactor of 2 L and 100 mm of internal diameter) to a mono-compartment filter-press cell at 20 L h−1. Figure 1 shows a scheme of the experimental system.
The electrochemical cell was integrated by an anode and an oxygen-diffusion cathode, both of 100 mm of diameter, separated 5 mm. Two anode materials were tested: Fe and boron doped diamond coated on silicon (BDD/Si), the later with a resistivity of 100 mΩ·cm, and with a 2.5 µm BDD coating ([B] = 700 ppm) (NeoCoat®, Eplatures-Grise, La Chaux-de-Fonds, Switzerland). The oxygen-diffusion cathode was composed by a titanium diffuser, used as electrode collector, and an activated carbon cloth with polytetrafluoroethylene (PTFE) (Fuel Cells Etc, College Station, TX, USA) that promotes the reduction of oxygen to H2O2. Oxygen was fed to the cathode at an overpressure of 4.5 bar, testing two different flowrates: 0.8 L min−1 and 2.0 L min−1. The carbon cloth of the oxygen-diffusion cathode was previously activated by electrolyzing 1 L of 0.05 M Na2SO4 at 150 mA cm−2 and pH 2.8 during 1 h.
Experiments were carried out under galvanostatic conditions, using a power supply of Elektro-Automatik GmbH & Co (Viersen, Germany), and directly measuring the potential difference, assessing the influence of two current densities on anode (janode): 5 mA cm−2 and 10 mA cm−2. These current densities were chosen considering that the most suitable janode = 16.7 mA cm−2 for the EF treatment of a complex pharmaceutical mixture [41], therefore smaller current densities were selected to study the treatment of a synthetic water and an urban wastewater.
Solutions were maintained at 25 °C with a water circulation jacket connected to an external thermostat. The pH was also kept constant throughout the trials. Three different pHs were evaluated: 2.8 (optimal pH for the Fenton process [42,43]), near neutral pH (5.0) and neutral pH (7.0), the two last were studied to reduce the use of acid reagent to adjust the pH. During EF experiments, the initial concentration of the catalyst, added externally to the water, was 10 mg L−1 Fe(II). This value was chosen considering that the maximum iron concentration of wastewaters to be discharged in the sewer is 10 mg L−1 in Catalonia [44]. Therefore, no additional posttreatments to precipitate iron would be needed for treating a wastewater by the EF process at 10 mg L−1 Fe(II).
Finally, the electrochemical treatment was applied to a real effluent from a sand filter of the tertiary treatment of an urban WWTP using the optimal operational conditions identified for treating synthetic polluted water. All the experimental conditions are summarized in Table 2.

3. Results and Discussion

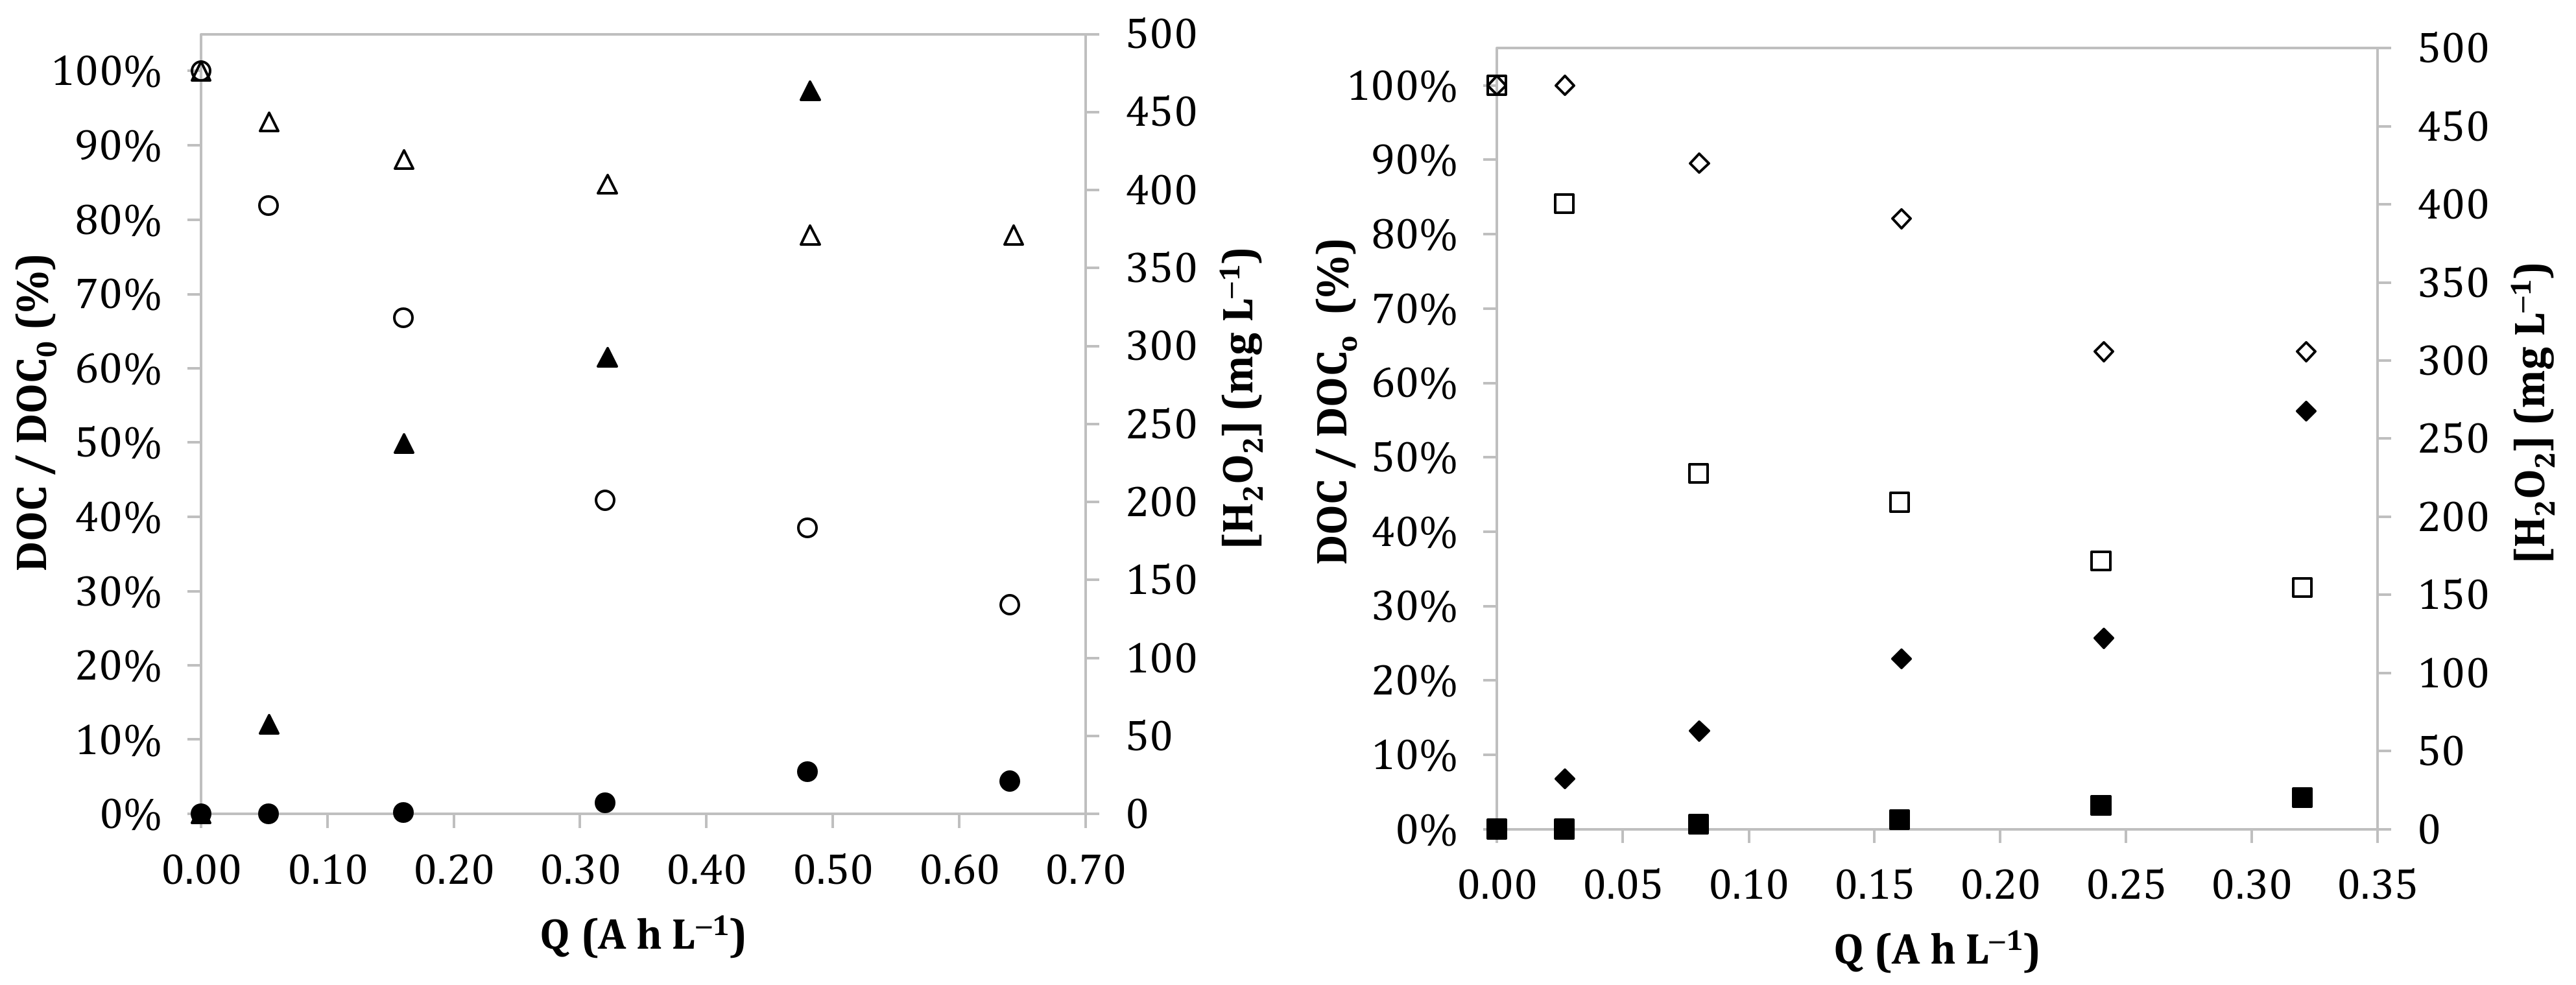
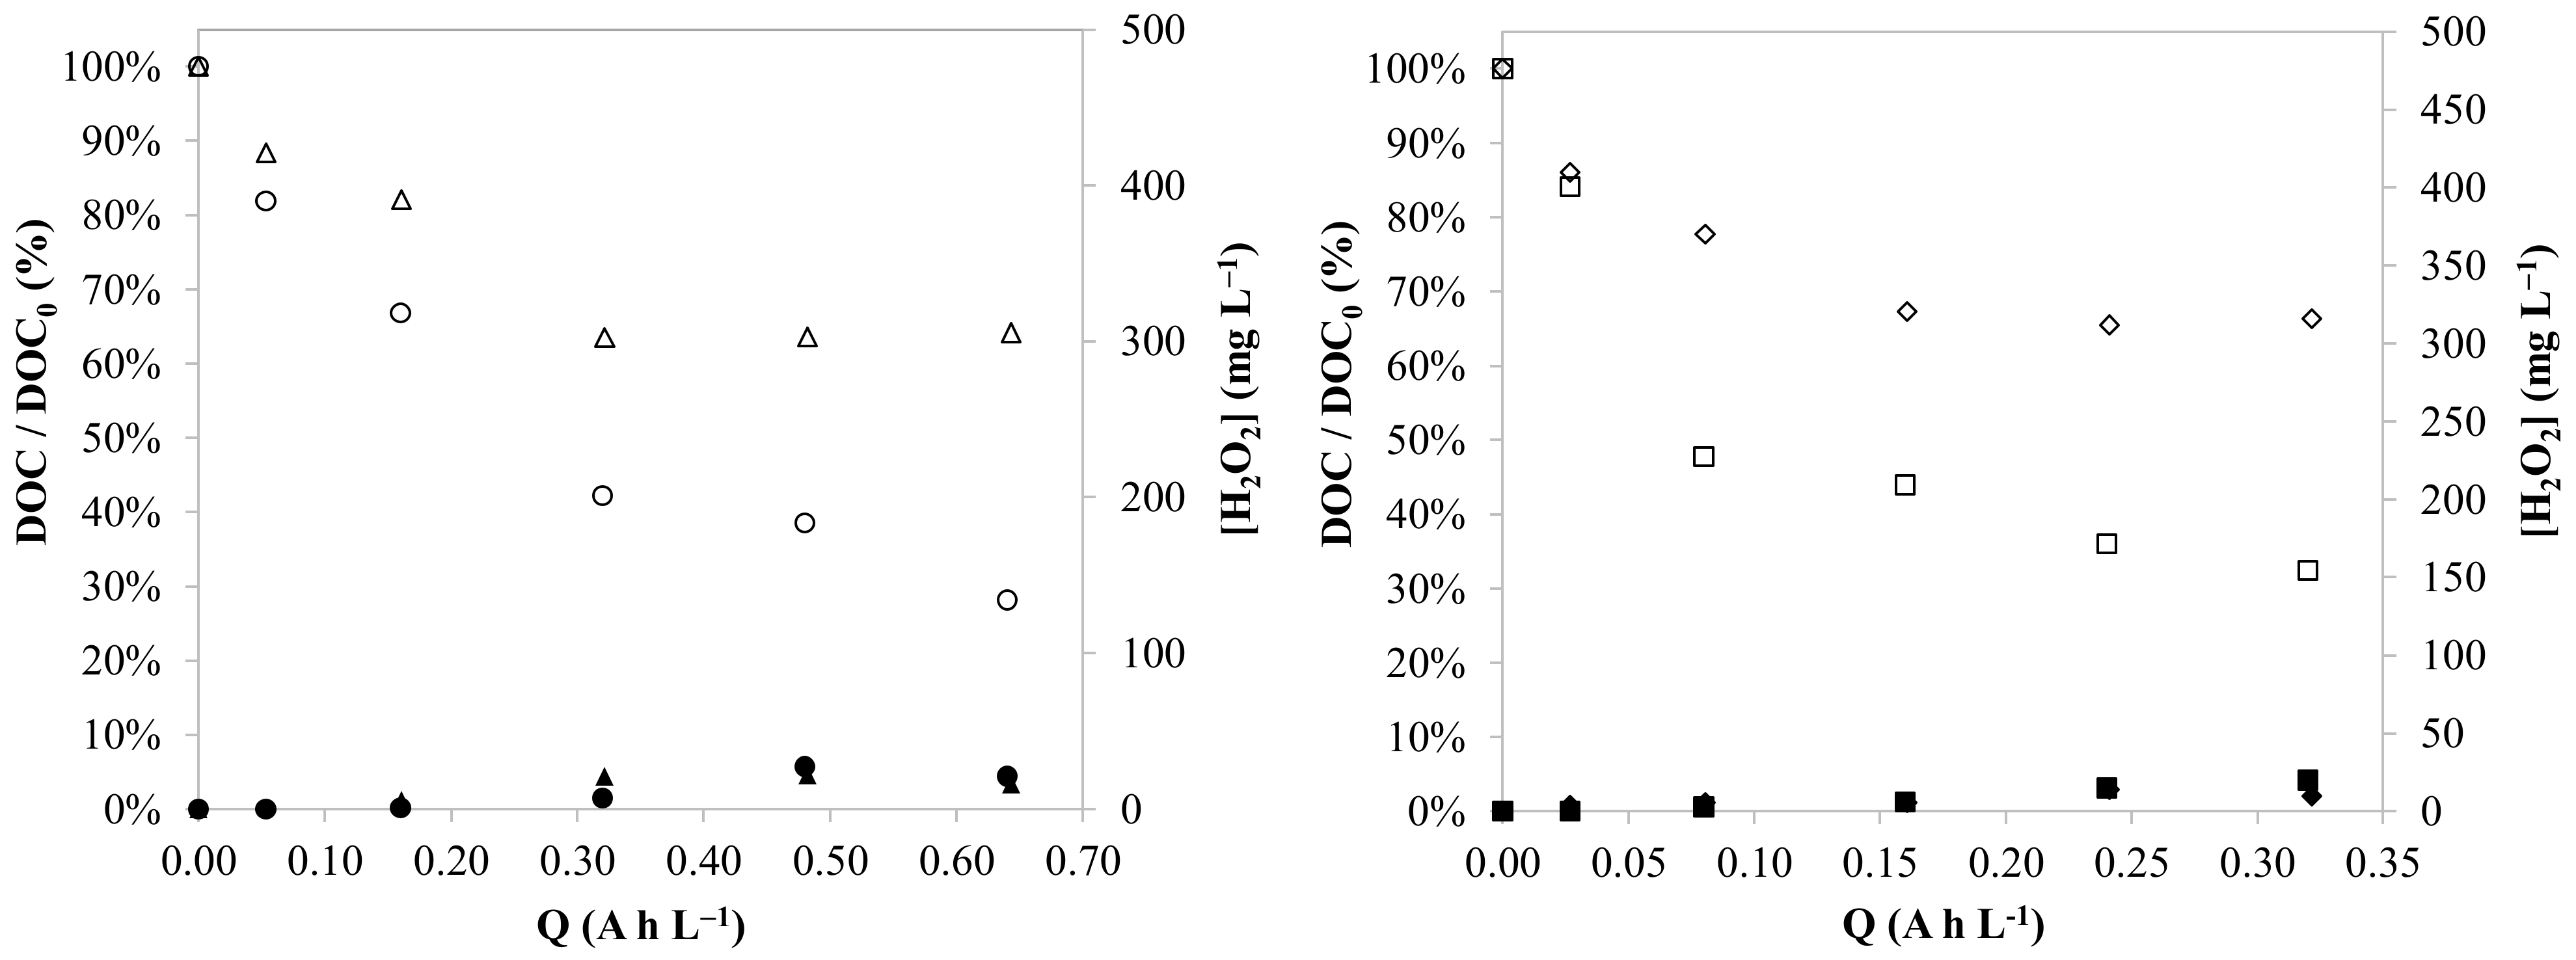
3.1. Effect of the Anode Material and the Current Density

Electro-Fenton (using a BDD anode) and PEC (using a Fe anode) were compared applying two different current densities (5 and 10 mA cm−2), at pH 2.8 and injecting 2.0 L min−1 O2 into the cathode. Figure 2 plots the evolution of the DOC and the [H2O2] as a function of the applied charge.
The mineralization of the organic matter was defined as the complete oxidation of the organic molecules into CO2, inorganic ions, and water, and it was determined by the analysis of the total dissolved organic carbon (DOC) throughout the treatment time.
The mineralization rates of the EF (kEF) and the PEC (kPEC) processes under studied conditions followed a pseudo-first order kinetics (Equation (7)):
ln(C/C0)/t = k
where C and C0 represent the final and initial erythromycin concentration, respectively, and t the treatment time.
Mineralization constant rates obtained by the EF process under the studied conditions were kEF1 (5 mA cm−2) = 0.008 s−1 and kEF2 (10 mA cm−2) = 0.004 s−1. These values were significantly lower than those achieved when iron is used as anode (PEC process), where constant rate increased to 0.020 s−1 for both current densities. The mineralization reached in EF process was approximately 35%, whereas it was increased at 70% during PEC treatment, after applying 0.32 A h L−1.
As depicted in the Figure 2, the remained H2O2 concentrations after 1 h of the EF treatment were around 260 mg L−1 and 460 mg L−1 at 5 and 10 mA cm−2 when 0.32 and 0.64 A h L−1 were applied, respectively.
These experimental H2O2 concentrations remained throughout the EF were similar than the theoretical ones generated. This fact indicates that only small quantities of H2O2 reacted with the 10 mg L−1 Fe(II). Moreover, it should be considered that an excessive H2O2 concentration acts as OH scavenger (Equation (8)) reducing the efficiency for organic matter oxidation:
OH ( aq ) + H 2 O 2 ( aq ) HO 2 ( aq ) + H 2 O ( l ) k = 1.7 4.5   ×   10 7   M 1   s 1
Although OH reacts with organic molecules with rate constants of 109–1010 M−1 s−1 [45], it reacts with H2O2 at a 100–1000 times lower rate constant (k = 1.7–4.5 × 10⁷ M−1 s−1 [24]) as the reaction rate depends on the initial concentration of organic matter and H2O2. Considering the initial erythromycin concentration (10 mg L−1) and the remained H2O2 concentrations of this work, the molar H2O2/erythromycin ratio was higher than 100 after the 15 min and 5 min of the EF treatment at 5 and 10 mA cm−2, respectively. Therefore, after these treatment times, hydroxyl radical is expected to react preferentially with H2O2 instead of organic matter. This fact can explain why the kEF2 (10 mA cm−2) = 0.004 s−1 was lower than kEF1 (5 mA cm−2) = 0.008 s−1.
In comparison, most H2O2 was consumed during PEC experiments, remaining around 20 mg L−1 at the end of the trials. This is a consequence of the higher Fe concentrations generated during PEC (theoretical concentrations of around 220 mg L−1 and 440 mg L−1 Fe(III) at 0.32 and 0.64 A h L−1, respectively) compared to that used during EF trials (10 mg L−1 Fe(II)). Indeed, in the PEC experimental conditions, the molar H2O2/Fe(III) ratios were around 1.7–2.0, indicating that higher iron concentration resulted in higher reactivity with the hydrogen peroxide. Consequently, higher theoretical concentration of hydroxyl radical (Equation (1)) and other reactive oxygen species that can attack organic compounds can be obtained. Nonetheless, elevated concentrations of Fe(II) or Fe(III) can also act as scavenger of OH, following Equations (9) and (10) [24]:
Fe 2 + ( aq ) + OH ( aq ) Fe 3 + ( aq ) + OH ( aq ) k = 2.5 5.1   ×   10 8   M 1   s 1
Fe 3 + ( aq ) + OH ( aq ) Fe 4 + ( aq ) + OH ( aq ) k = 7.9   ×   10 7   M 1   s 1
After 15 min and 8 min of PEC treatment at 5 and 10 mA cm−2, respectively, the molar ratio Fe(III)/erythromycin was higher than 100, therefore the OH starts to preferentially react with Fe(II) or Fe(III) instead of organic matter.
Moreover, it should be also considered that at elevated concentrations of Fe(III) (higher than 0.6 mg L−1) ferric oxyhydroxides start to precipitate at pH = 2.8 [46], whereas Fe(II) remains in solution at this pH. Related to this, the percentage of dissolved versus total iron was around 100–85% throughout the PEC treatment at 5 mA cm−2 whereas this value decreased to 75–40% at 10 mA cm−2. These results indicate that most iron was dissolved at 5 mA cm−2 and pH 2.8. The quantity of dissolved iron at both current densities were similar, thereby contributing in a similar way to the Fenton (Equation (1)) and Fenton-like (Equation (2)) reactions. Dissolved iron can be associated to ferrous cationic species, whereas ferric oxyhydroxides would be associated to iron precipitated.
All these reasons explain the no significant differences observed with the rate constants for both current densities (kPEC = 0.02 s−1) tested during PEC trials.
These results demonstrate that, in the studied conditions, the PEC is more recommendable than the EF process in terms of both mineralization rate and electricity consumption. After applying 0.32 and 0.64 A h L−1, the electricity consumptions for BDD electrodes (EF) were around 3.7 kWh m−3 and 7.9 kWh m−3, whereas they were reduced to 0.3 kWh m−3 and 0.6 kWh m−3 when Fe was used as anode (PEC), respectively. This means a reduction of almost 12-fold in the electricity costs by using Fe anodes.
Therefore, the PEC treatment was selected to study the influence of oxygen flowrate injected into the cathode.

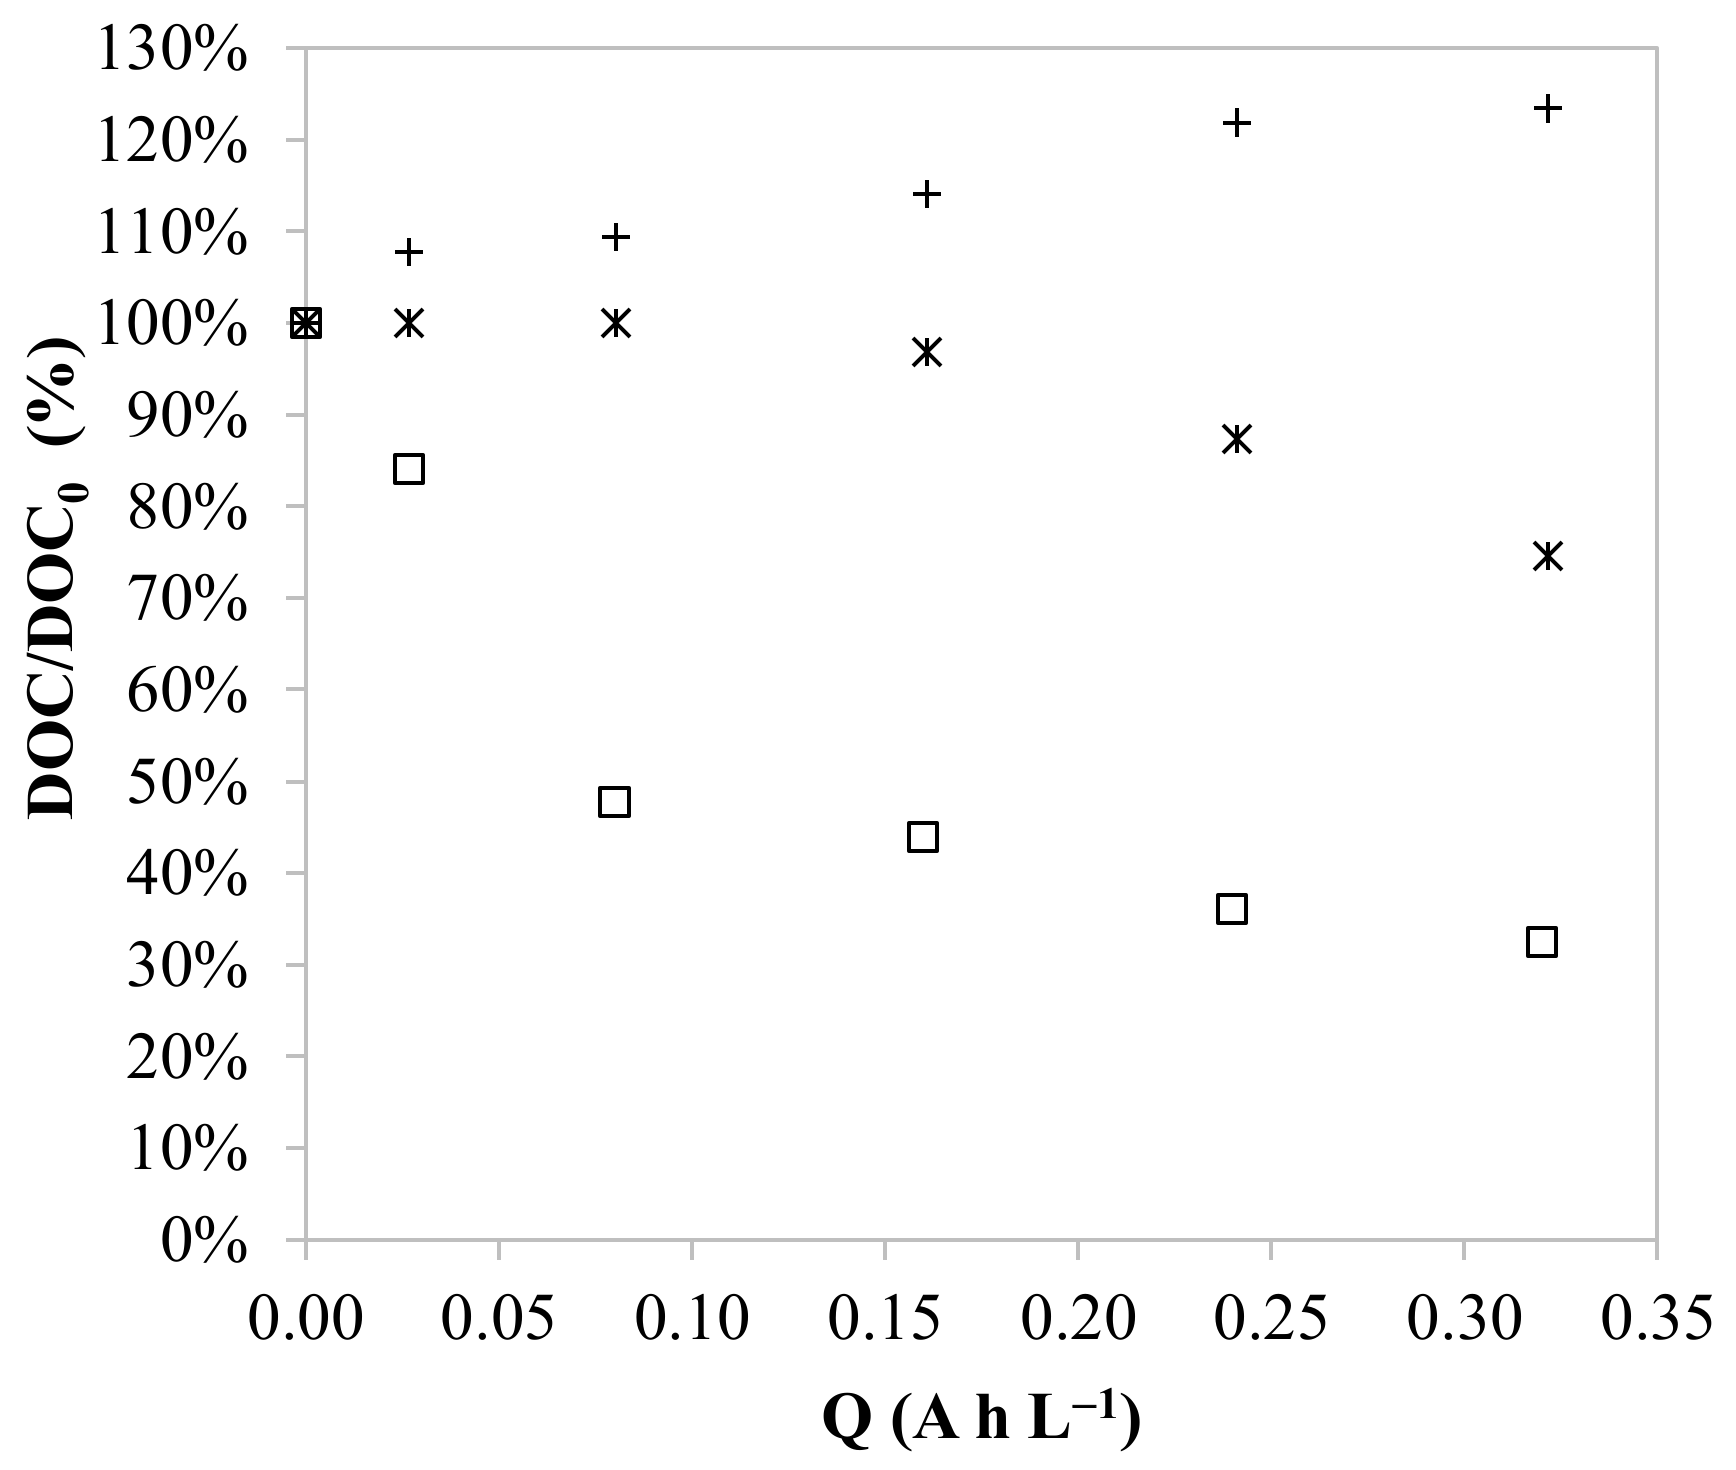
3.2. Effect of the Oxygen Flowrate

The influence of two different oxygen flowrates (0.8 L min−1 O2 and 2.0 L min−1 O2) to the mineralization efficiency was studied by carrying out the PEC treatment applying two different current densities (5 and 10 mA cm−2), at pH 2.8. Results are plotted in Figure 3.
When injecting 0.8 L min−1 O2, the mineralization kinetics followed a pseudo-first order constant during the first 30 min of treatment, being the constant rate of 0.013 s−1 for 5 and 10 mA/cm−2. The kinetics mineralization decreased at 0.8 L min−1 O2 (0.013 s−1) compared with the value obtained at 2.0 L min−1 O2 (0.020 s−1). This fact can be associated to the concentration of dissolved oxygen. With 2.0 L min−1 O2 injected into the cathode, continuous oxygen saturation in water can be obtained, resulting in more dissolved oxygen available to produce H2O2.
No significant differences on mineralization rates between the studied current densities (5 and 10 mA/cm−2) were found in any of the tested oxygen flowrates (0.8 and 2.0 L min−1 O2). The electricity consumption of the electrochemical cell also followed a similar pattern for both oxygen flowrates.
Therefore, the PEC process at 5 mA cm−2 applying 2.0 L min−1 O2 was chosen to study the influence of the pH on the process efficiency.

3.3. Effect of the pH

The influence of the pH on the efficiency of the PEC treatment was also studied. The results obtained are depicted in Figure 4.
The optimal pH for the PEC process was 2.8, the same as the most favourable pH found for Fenton process [42,43]. At pH values close to 2.8, the predominant ions of iron, ferrous and ferric, are dissolved in the form of aqua-complexes, highlighting as main compounds the [FeII(H2O)6]2+, [FeIII(OH)(H2O)5]2+, [FeIII(OH)2(H2O)4]+ and [FeIII(H2O)6]3+ and, to lesser extent, [Fe2(H2O)8(OH)2]4+ [47,48]. However, we determined that at pH 5.0, around 0.2–0.6% iron was dissolved (0.2–1.1 mg L−1), whereas at pH 7.0 all iron was precipitated. As observed by Serra-Clusellas et al. [49], minute concentrations of Fe(III) (0.6 mg L−1) were enough to promote the Fenton-like reaction and the mineralization of organic pollutants at pH 3.6. This fact was then confirmed in the current work at pH 5.0, where around 25% of DOC was removed after applying 0.32 A h L−1. Unlike pH 5.0, no mineralization was reached at pH 7.0; on the contrary, an increase of DOC throughout the treatment was observed. This rise can be associated to organic leaches from silicone tubs used for the peristaltic pump for recirculating the solution, which can be partially oxidized by hydrogen peroxide and other reactive oxygen species. This fact evidenced that mineralization percentage obtained in this article could be higher if other tubbing materials were used.
Despite this, the most suitable operating conditions found in this work are as follows: PEC treatment at 5 mA cm−2, injecting 2.0 L min−1 O2 at pH 2.8.

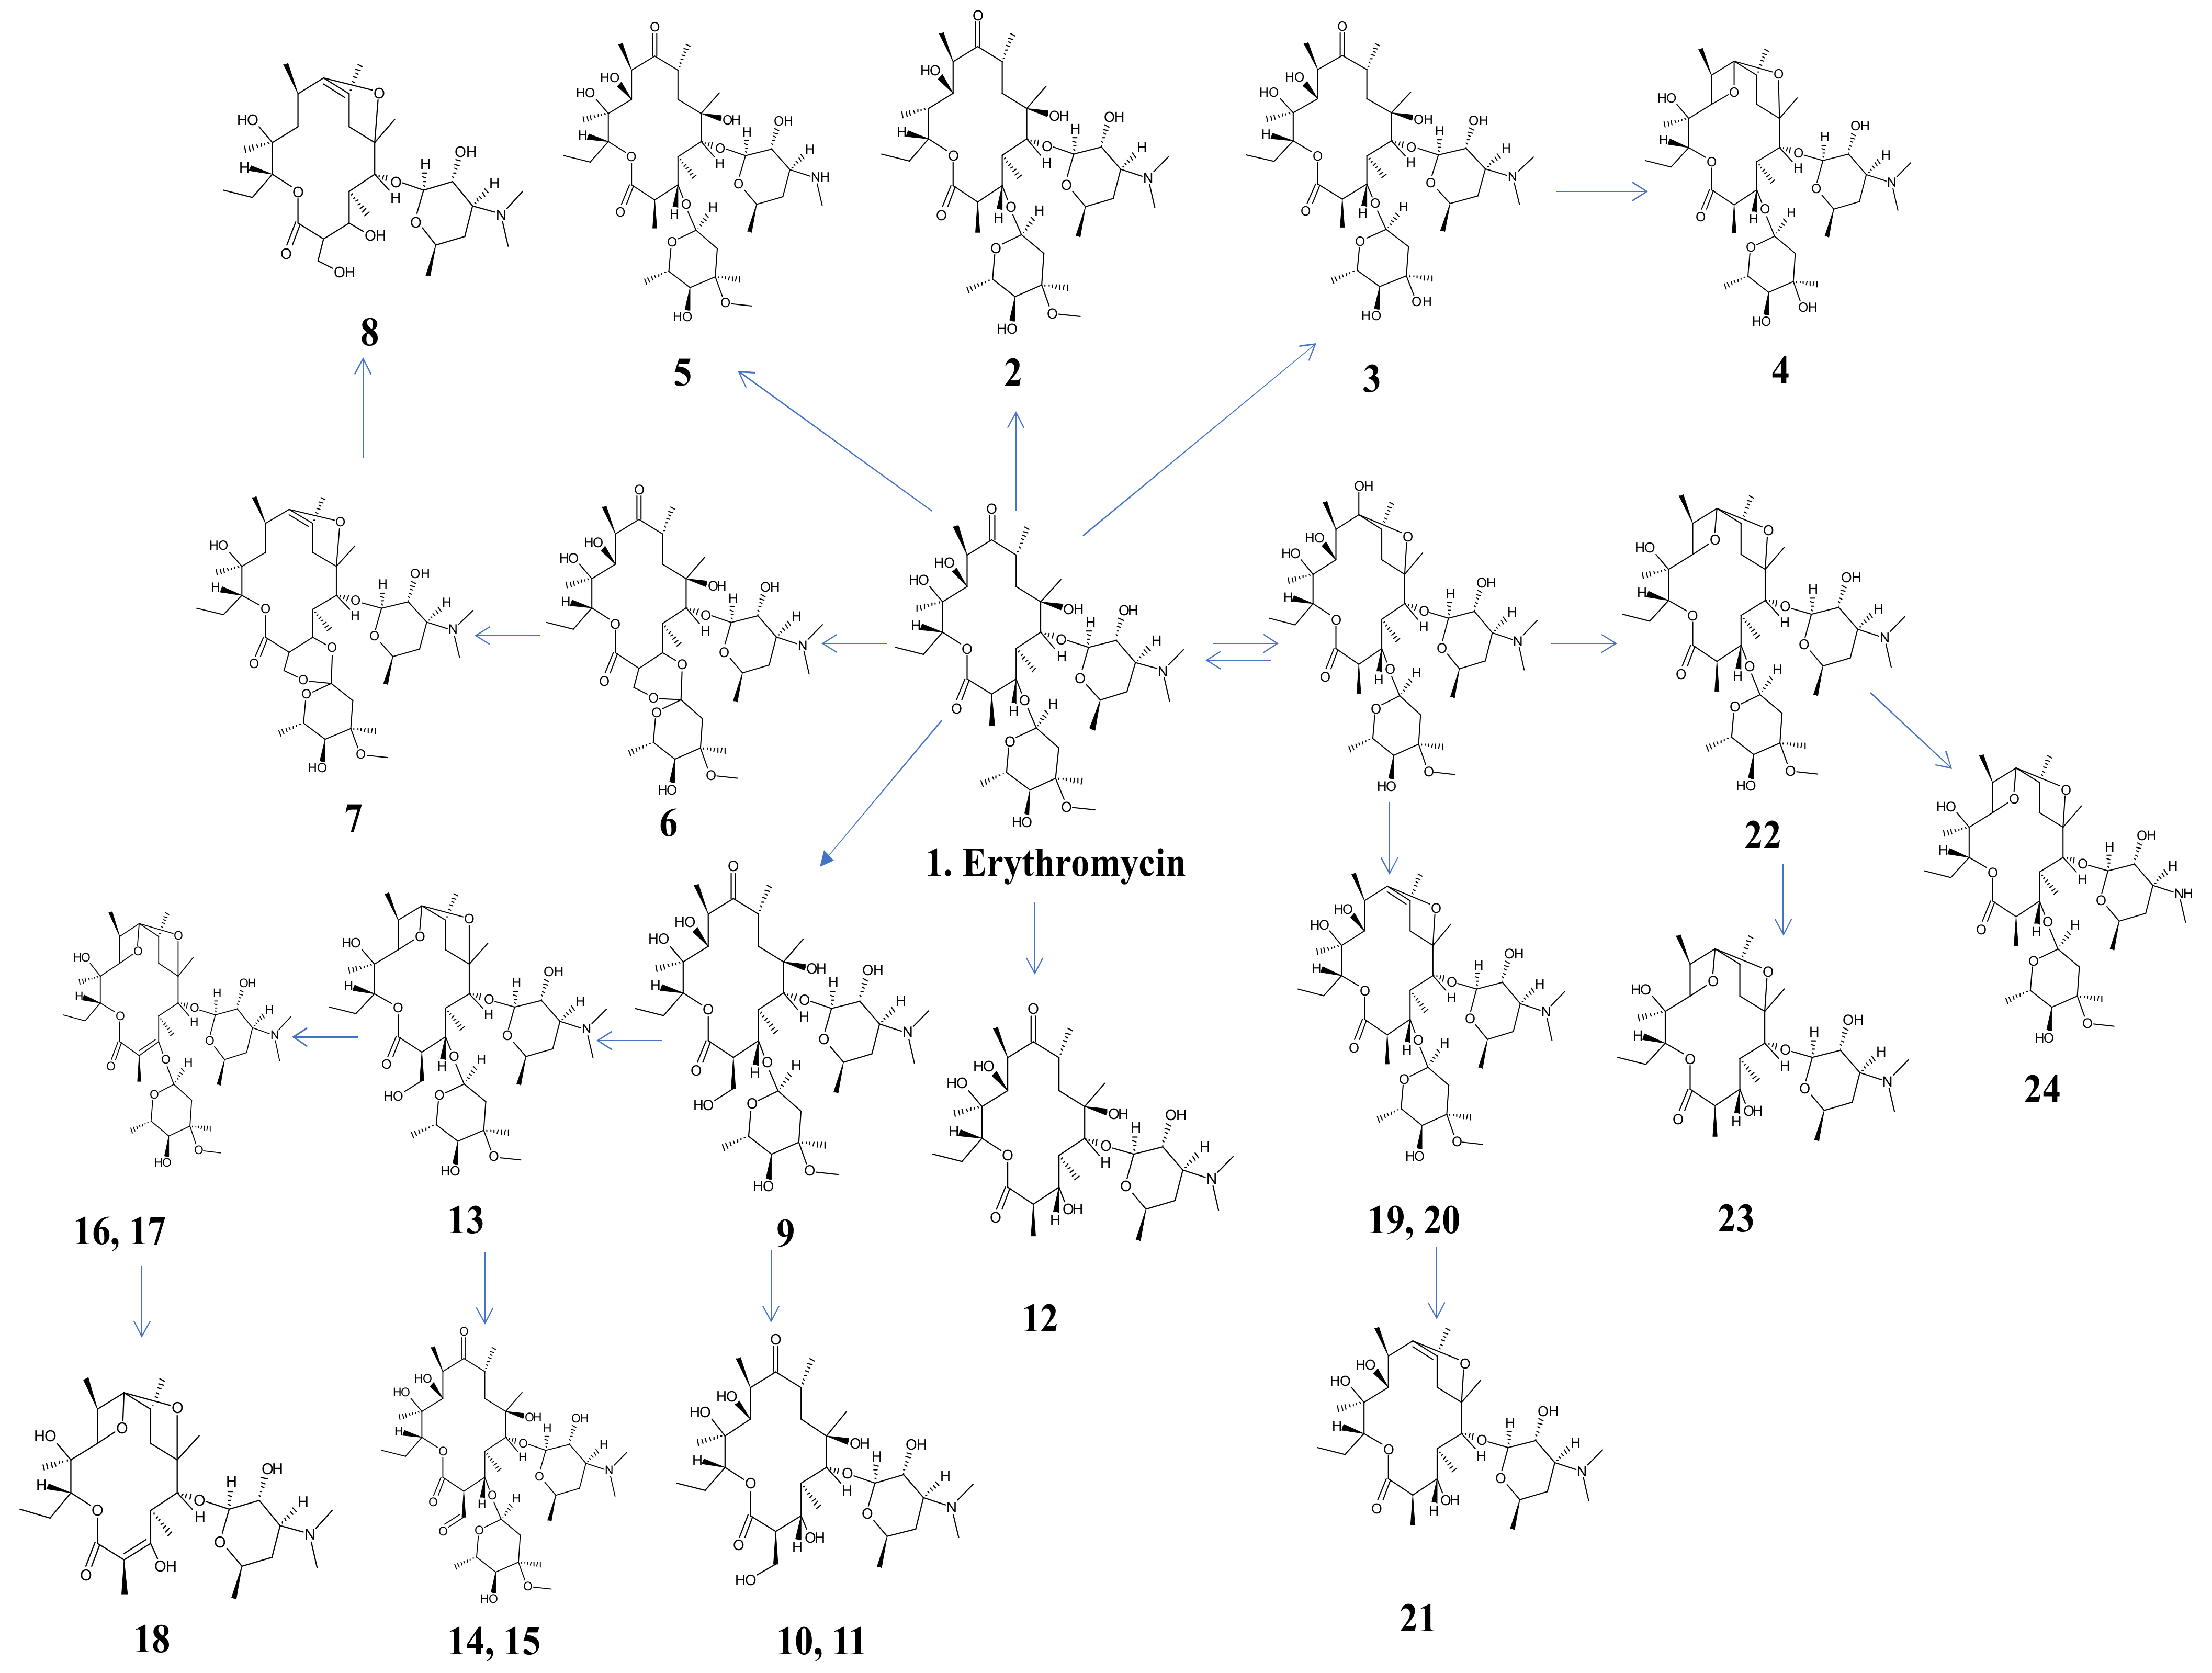
3.4. Identification of Aromatic Byproducts of Erythromycin and Degradation Pathway Proposed

Aromatic byproducts generated during the early stage of the erythromycin mineralization pathway were identified for the PEC process at the most suitable operational conditions, specified above.
Most of transformation products for erythromycin and its degradation pathways have already discussed in bibliography [16,35,36,37,38,39] under different conditions but it has not been investigated under PEC water remediation process. Pérez et al. [31] identified the intermediates formed at 30 and 120 min of the solar photo electro-Fenton process of a 165 mg L−1 erythromycin solution at pH 3 and jcathode = 0.16 mA cm−2, determined by GC-MS. However, no information was found about the first intermediates generated during the early stages of the erythromycin mineralization pathway by the electrochemical-Fenton based processes.
In this paper we used chromatographic separation behaviour and high-resolution tandem mass spectrometry HRMS2 for the identification and quantification of erythromycin transformation products. By using this approach, 23 erythromycin intermediates were putative identified by their theoretical exact mass, logical retention time (compared to bibliography) and diagnostic tandem mass ions. In addition, these compounds were quantified by using an erythromycin IS calibration curve and their concentration (erythromycin + 23 intermediates) throughout the PEC treatment time are presented on Table 3.
The erythromycin degradation pathway proposed for the early stage of the PEC process is represented in Figure 5.
As described in the literature, the decomposition of erythromycin A proceeds via the known intermediate erythromycin A-6,9-hemiketal. The monodehydroxylation or didehydroxylation of this intermediate produced the main compounds described in the literature, i.e., erythromycin A enol ether isomers (716.458 m/z) (compounds 19 and 20 of Figure 5) and anhydrous erythromycin A (716.458 m/z) (compound 22), respectively. Sequentially, the respective transformation products of the compounds 19, 20 and 22 from the cleavage of cladinose group were assigned (compounds 21 and 23) by their exact mass and the observation of unmodified desosamine fragment (158.1176 m/z) and cladinose neutral loss ([M+H-158.0937]+ m/z). These results indicated that the delta mass observed was produced on the lactone part of erythromycin A. The last two compounds were assigned on the basis of their similar fragmentation pattern in respect of their precursor compound (480–580 m/z range), where neutral losses of water from lactone part are observed. Thus, anhydrous erythromycin A (compound 22) either with or without a cladinose moiety had two consecutive losses of water from 558.3637 m/z ion, whereas erythromycin A enol ether (compound 19) either with or without cladinose moiety had only one losses of water from 558.3637 m/z ion. In addition, an isomer of erythromycin A enol ether was identified (compound 20) since their fragmentation pattern was equal between the two chromatographic peaks.
Moreover, erythromycin A without a cladinose sugar (compound 12) was identified based on the no observation of the neutral loos of cladinose and the observation of desosamine fragment, as well as other erythromycin isomers such as erythromycin B (compound 2), erythromycin C (compound 3), erythromycin E (compound 6) and erythromycin F (compound 9) and some of their transformation products concerning the cleavage of cladinose moiety (compound 8, 10, 11). Erythromycin isomers A, C, E and F dehydrate produced the compounds 22, 4, 13 and 7, respectively. For example, tandem mass spectrum of erythromycin C and erythromycin C anhydrous had the neutral loss of the modified cladinose (-OH instead of -OCH3). All this transformation products have already been described for different remediation processes and follow the proposed degradation pathway indicated in Figure 5. Nonetheless, we found other interesting signals (732, 714, and 555 m/z) that had a delta mass of −2 m/z of the main erythromycin A transformation products explained before. Thus, their tandem mass spectra were also carefully inspected and we hypothesize that a degradation of erythromycin-A is promoted by the formation of erythromycin F (750.4634 m/z) intermediate (compound 9) and its degradation to erythromycin F enol ether or anhydrous (732.4529 m/z) (compound 13) and its lactone dehydration (714.4423 m/z) (isomers 16 and 17) and successive cladinose cleavage (556.348 m/z) (compound 18), or compound 13 dehydrogenation (748.4478 m/z) producing two isomers (compounds 14 and 15). Finally, an N-demethylation of erythromycin A generated the intermediate 5.
The results of the Table 3 show that none of these compounds were detected after 30 min of treatment, all of them thus being early-stage intermediates.
Another aspect to highlight is that after adjusting the pH to 2.8, and before starting the PEC process (0 min), only 5% of the initial erythromycin (erythromycin A, compound 1) remained in solution. 28% of this substance was degraded to the 23 intermediates detected in this work, being the erythromycin A anhydrous (compound 22) the most detected by-product produced (approximately 15%). This means that 67% of the initial erythromycin was degraded to other byproducts not determined in this article just due to the acidification. This acid-catalysed water molecule loss from erythromycin occurs rapidly at pH < 4 [50,51]. Therefore, this is an important aspect to be considered in future works, especially when working or analysing the erythromycin in acid pH solutions.

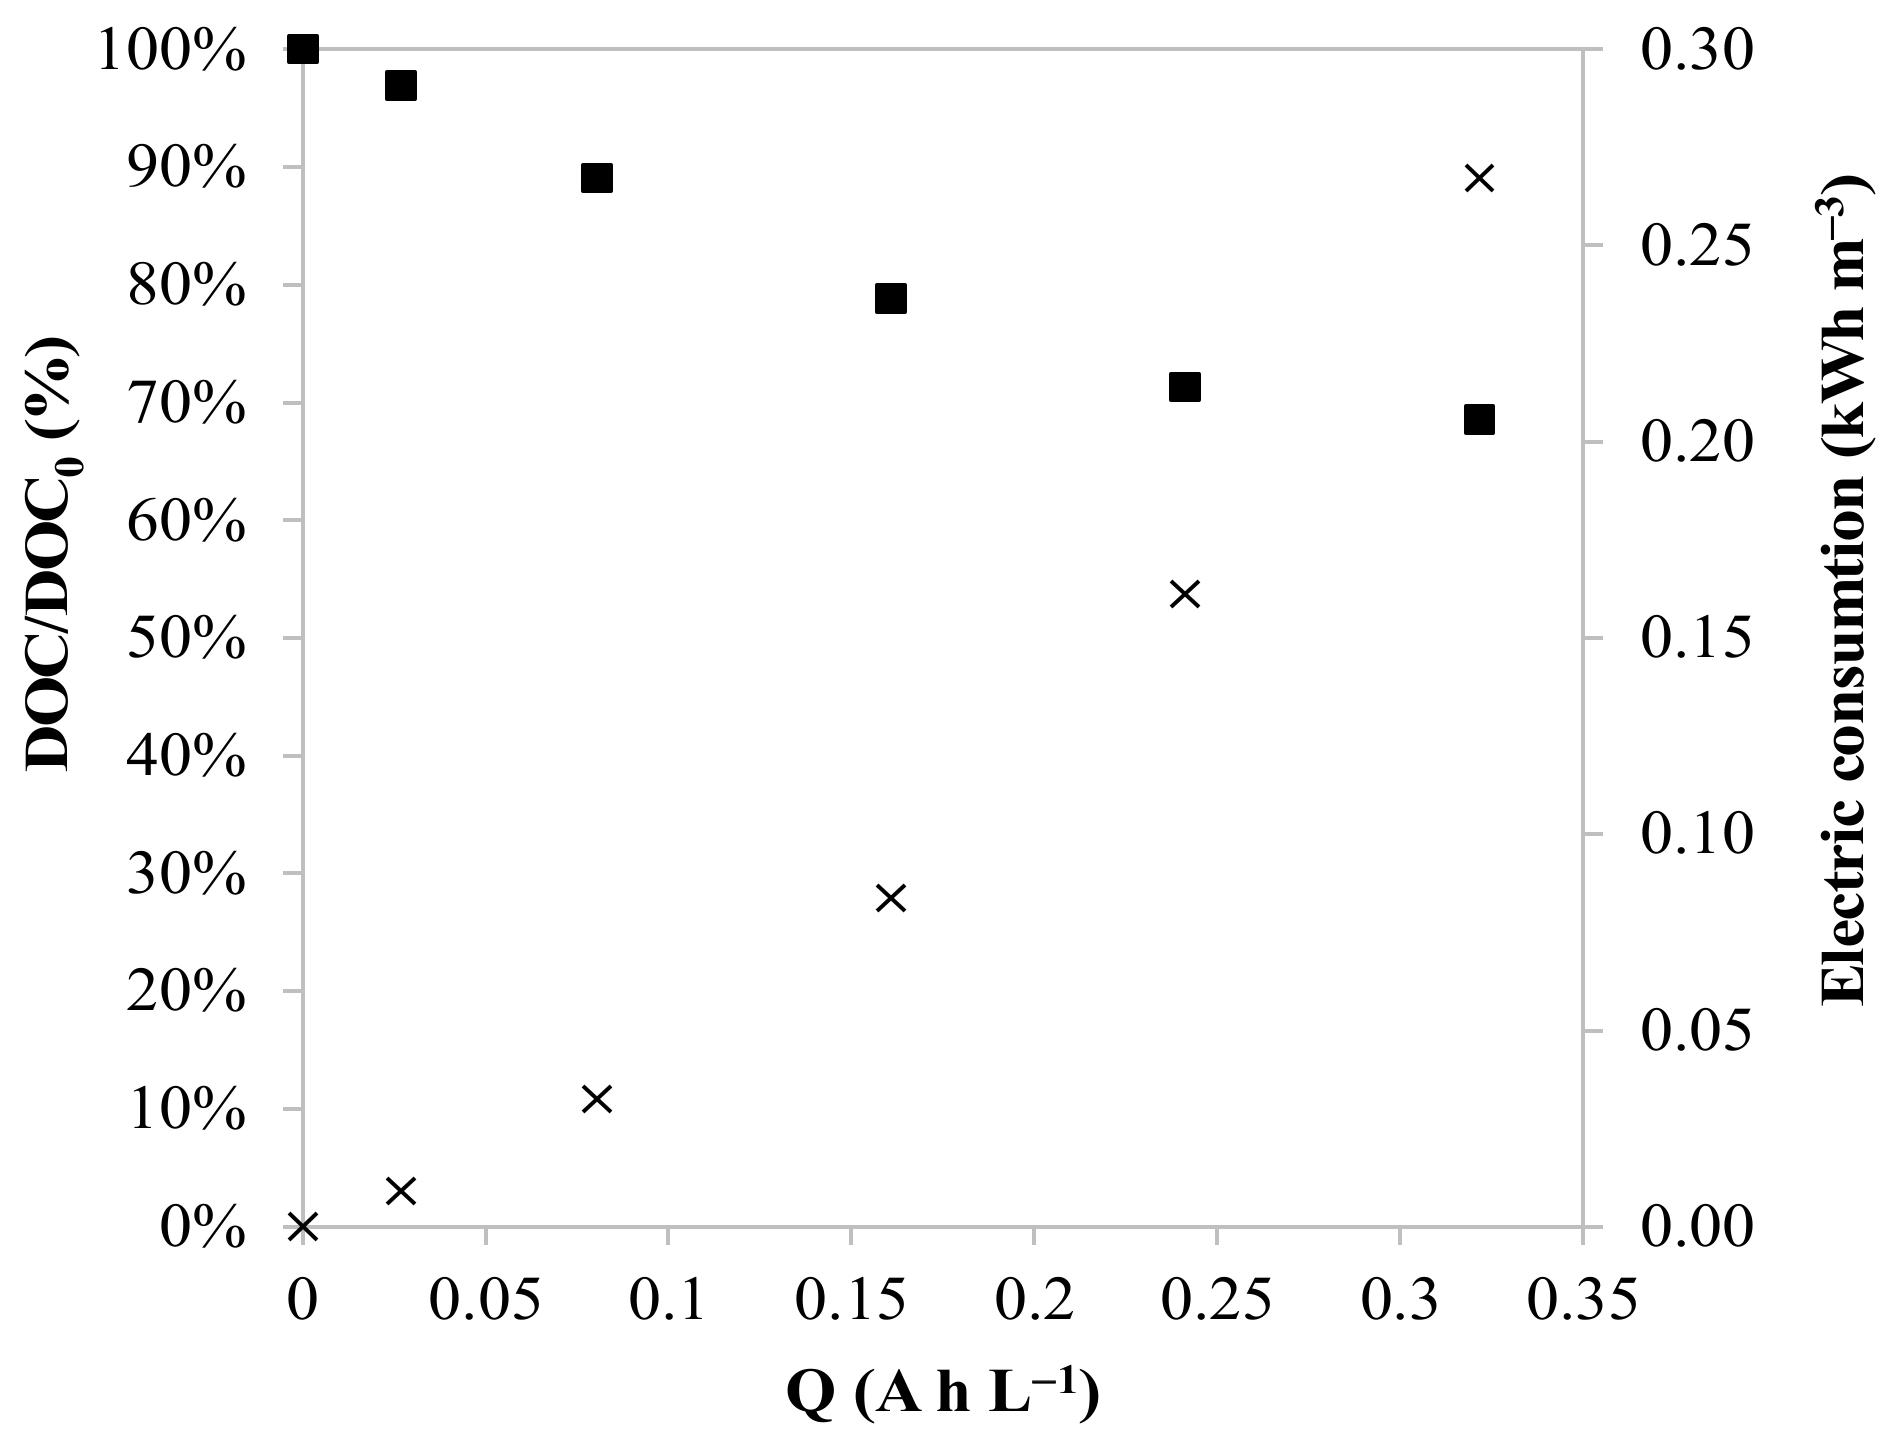
3.5. Extrapolation of the PEC Process to a Real Effluent

Finally, the PEC process under the most appropriate conditions (5 mA cm−2, injecting 2.0 L min−1 O2 into the cathode and pH 2.8) was validated by treating a real effluent obtained from the tertiary treatment (coagulation/flocculation and sand filtration) of an urban WWTP. Its composition is shown in Table 4.
No electrolyte was added to the water. The concentrations of the emerging compounds included in the Watch List 2018 in the influent and effluent of the electrochemical treatment are summarized in Table 5.
In general terms, the compounds found in the WWTP tertiary effluent (PEC influent) were not detected in the treated PEC effluent, except for E1 and EE2, although high degradation percentages were achieved (99% removal). As commented before, the determination of erythromycin, but also the amoxicillin, is significantly affected by the low pH in the treated water, since the internal standard is not stable in the acidic conditions. The initial DOC of the water was 9.9 mg L−1 and its evolution was plotted in Figure 6.
Approximately 30% DOC was removed at the end of the PEC treatment, applying 0.32 A h L−1. The electricity consumption associated to the electrochemical cell was around 0.4 kWh m−3, that means a cost of around 0.09 € m−3, considering the Spanish electricity price in first half 2020 was 0.2239 € kWh−1 [52]. This low electricity consumption with the high degradation efficiencies for all the compounds of the Watch List 2018, appoint the PEC as a potential technology to be applied for removing these types of emerging compounds from waters, preventing their arrival to the aquatic systems, and thus improving the water quality of the environment. Future studies should also include toxicity assays of the transformation byproducts generated during the PEC treatment to ensure a suitable final quality of water.
These results indeed suggested PEC as a promising technology to be implemented for water and wastewater remediation. For example, PEC can be applied to treat complex industrial wastewaters such as pharmaceutical or leachate effluents coupled before a biological treatment to increase water biodegradability. However, a neutralization step must be applied after the PEC process to send the effluent to a biological treatment. Also, this post-treatment would be required if the effluent was discharged to a municipal sewer in order to reduce the iron concentration below the limit sets by the legislation (10 mg L−1 Fe, in the case of Catalunya [44]).

4. Conclusions

The results of this investigation demonstrate the technical and economic feasibility of the peroxyelectrocoagulation (PEC) process to degrade contaminants of emerging concern present in water such as those included in the EU Decision 2018/840 (Watch List 2018). The article proves that PEC can degrade most of the compounds included in the Watch List 2018 below their quantification limit and mineralize the 25% DOC of a real WWTP tertiary effluent, applying an electrical charge of 0.32 A h L−1, a current density janode = 5 mA cm−2, injecting 2.0 L min−1 O2 into the cathode and keeping the pH at 2.8. The electricity consumption of the cell was 0.27 kWh m−3. These operational conditions were selected by previously studying the removal erythromycin from ultrapure water, obtaining 70% mineralization with an electricity consumption of 1.7 kWh m−3. The research also revealed the early-stage transformation byproducts generated during the erythromycin mineralization, by identifying and quantifying 23 erythromycin intermediates.

Author Contributions

EF and PEC experiments: A.S.-C., L.S., M.d.L.C.; erythromycin byproducts determination: P.H., A.D.-R.; determination of the emerging compounds of the Watch List 2018: M.R.; project proposal: A.S.-C. and A.C.; project management: A.S.-C., A.C., N.C., X.M.-L. All authors have read and agreed to the published version of the manuscript.

Funding

This work was financially supported by the Catalan Government through the funding grant ACCIÓ-Eurecat (Project PRIV2019-AVANÇ-H2O).

Institutional Review Board Statement

Not applicable.

Informed Consent Statement

Not applicable

Data Availability Statement

Data sharing not applicable. No new data were created or analyzed in this study. Data sharing is not applicable to this article.

Acknowledgments

The authors would like to acknowledge the Sustainability Laboratory of EURECAT—Manresa facilities for the analysis of DOC and iron of the generated samples.

Conflicts of Interest

The authors declare no conflict of interest.

References

  1. Carlsson, C.; Johansson, A.K.; Alvan, G.; Bergman, K.; Kühler, T. Are pharmaceuticals potent environmental pollutants? Part I: Environmental risk assessments of selected active pharmaceutical ingredients. Sci. Total Environ. 2006, 364, 67–87. [Google Scholar] [CrossRef]
  2. Sousa, J.C.G.; Ribeiro, A.R.; Barbosa, M.O.; Ribeiro, C.; Tiritan, M.E.; Pereira, M.F.R.; Silva, A.M.T. Monitoring of the 17 EU Watch List contaminants of emerging concern in the Ave and the Sousa Rivers. Sci. Total Environ. 2019, 649, 1083–1095. [Google Scholar] [CrossRef]
  3. Cunningham, V.L.; Binks, S.P.; Olson, M.J. Human health risk assessment from the presence of human pharmaceuticals in the aquatic environment. Regul. Toxicol. Pharmacol. 2009, 53, 39–45. [Google Scholar] [CrossRef]
  4. European Commission. Commission Implementing Decision (EU) 2015/495 of 20 March 2015 Establishing a Watch List of Substances for Union-Wide Monitoring in the Field of Water Policy Pursuant to Directive 2008/105/EC of the European Parliament and of the Council; Office for Official Publications of the European Communities: Luxembourg, 2015; Available online: https://eur-lex.europa.eu/legal-content/EN/TXT/PDF/?uri=CELEX:32015D0495&from=EN (accessed on 18 April 2021).
  5. European Commission. Commission Implementing Decision (EU) 2018/840 of 5 June 2018 Establishing a Watch List of Substances for Union-Wide Monitoring in the Field of Water Policy Pursuant to Directive 2008/105/EC of the European Parliament and of the Council and Repealing Commission Implementing Decision (EU) 2015/495; Office for Official Publications of the European Communities: Luxembourg, 2018; Available online: https://eur-lex.europa.eu/legal-content/EN/TXT/PDF/?uri=CELEX:32018D0840&from=EN (accessed on 18 April 2021).
  6. European Commission. Commission Implementing Decision (EU) 2020/1161 of 4 August 2020 Establishing a Watch List of Substances for Union-Wide Monitoring in the Field of Water Policy Pursuant to Directive 2008/105/EC of the European Parliament and of the Council; Office for Official Publications of the European Communities: Luxembourg, 2020; Available online: https://eur-lex.europa.eu/legal-content/EN/TXT/PDF/?uri=CELEX:32020D1161&from=EN (accessed on 18 April 2021).
  7. Rodriguez-Mozaz, S.; Vaz-Moreira, I.; Varela Della Giustina, S.; Llorca, M.; Barceló, D.; Schubert, S.; Berendonk, T.U.; Michael-Kordatou, I.; Fatta-Kassinos, D.; Martinez, J.L.; et al. Antibiotic residues in final effluents of European wastewater treatment plants and their impact on the aquatic environment. Environ. Int. 2020, 140, 105733. [Google Scholar] [CrossRef]
  8. Polianciuc, S.I.; Gurzău, A.E.; Kiss, B.; Georgia Ștefan, M.; Loghin, F. Antibiotics in the environment: Causes and consequences. Med. Pharm. Rep. 2020, 93, 231–240. [Google Scholar] [CrossRef]
  9. Hanna, N.; Sun, P.; Sun, Q.; Li, X.; Yang, X.; Ji, X.; Zou, H.; Ottoson, J.; Nilsson, L.E.; Berglund, B.; et al. Presence of antibiotic residues in various environmental compartments of Shandong province in eastern China: Its potential for resistance development and ecological and human risk. Environ. Int. 2018, 114, 131–142. [Google Scholar] [CrossRef] [PubMed]
  10. World Health Organization. Antibiotic Resistance. 21 July 2020. Available online: https://www.who.int/news-room/fact-sheets/detail/antibiotic-resistance (accessed on 18 April 2021).
  11. Veseli, A.; Mullallari, F.; Balidemaj, F.; Berisha, L.; Švorc, L.; Arbneshi, T. Electrochemical determination of erythromycin in drinking water resources by surface modified screen-printed carbon electrodes. Microchem. J. 2019, 148, 412–418. [Google Scholar] [CrossRef]
  12. Carraro, E.; Bonetta, S.; Bertino, C.; Lorenzi, E.; Bonetta, S.; Gilli, G. Hospital effluents management: Chemical, physical, microbiological risks and legislation in different countries. J. Environ. Manag. 2016, 168, 185–199. [Google Scholar] [CrossRef] [PubMed]
  13. Kovalova, L.; Siegrist, H.; von Gunten, U.; Eugster, J.; Hagenbuch, M.; Wittmer, A.; Moser, R.; McArdell, C.S. Elimination of micropollutants during post-treatment of hospital wastewater with powdered activated carbon, ozone, and UV. Environ. Sci. Technol. 2013, 47, 7899–7908. [Google Scholar] [CrossRef] [PubMed] [Green Version]
  14. Ohlsen, K.; Ternes, T.; Werner, G.; Wallner, U.; Löffler, D.; Ziebuhr, W.; Witte, W.; Hacker, J. Impact of antibiotics on conjugational resistance gene transfer in Staphylococcus aureus in sewage. Environ. Microbiol. 2003, 5, 711–716. [Google Scholar] [CrossRef] [Green Version]
  15. Rueda-Márquez, J.J.; Palacios-Villarreal, C.; Manzano, M.; Blanco, E.; Ramírez del Solar, M.; Levchuk, I. Photocatalytic degradation of pharmaceutically active compounds (PhACs) in urban wastewater treatment plants effluents under controlled and natural solar irradiation using immobilized TiO2. Sol. Energy 2020, 208, 480–492. [Google Scholar] [CrossRef]
  16. Llorca, M.; Rodríguez-Mozaz, S.; Couillerot, O.; Panigoni, K.; de Gunzburg, J.; Bayer, B.; Czaja, R.; Barceló, D. Identification of new transformation products during enzymatic treatment of tetracycline and erythromycin antibiotics at laboratory scale by an on-line turbulent flow liquid-chromatography coupled to a high resolution mass spectrometer LTQ-Orbitrap. Chemosphere 2015, 119, 90–98. [Google Scholar] [CrossRef] [PubMed] [Green Version]
  17. Moslah, B.; Hapeshi, E.; Jrad, A.; Fatta-Kassinos, D.; Hedhili., A. Simultaneous Decontamination of Seven Residual Antibiotics in Secondary Treated Effluents by Solar Photo-Fenton and Solar TiO2 Catalytic Processes. In Recent Advances in Environmental Science from the Euro-Mediterranean and Surrounding Regions. EMCEI 2017. Advances in Science, Technology & Innovation (IEREK Interdisciplinary Series for Sustainable Development); Kallel, A., Ksibi, M., Ben Dhia, H., Khélifi, N., Eds.; Springer: Cham, Switzerland, 2017. [Google Scholar] [CrossRef]
  18. Klavarioti, M.; Mantzavinos, D.; Kassinos, D. Removal of residual pharmaceuticals from aqueous systems by advanced oxidation processes. Environ. Int. 2009, 35, 402–417. [Google Scholar] [CrossRef] [PubMed]
  19. Brillas, E.; Martínez-Huitle, C.A. Decontamination of wastewaters containing synthetic organic dyes by electrochemical methods. An updated review. Appl. Catal. B Environ. 2015, 166–167, 603–643. [Google Scholar] [CrossRef]
  20. Lima, V.B.; Goulart, L.A.; Rocha, R.S.; Steter, J.R.; Lanza, M.R.V. Degradation of antibiotic ciprofloxacin by different AOP systems using electrochemically generated hydrogen peroxide. Chemosphere 2020, 247, 125807. [Google Scholar] [CrossRef]
  21. Liu, X.; Zhou, Y.; Zhang, J.; Luo, L.; Yang, Y.; Huang, H.; Peng, H.; Tang, L.; Mu, Y. Insight into electro-Fenton and photo-Fenton for the degradation of antibiotics: Mechanism study and research gaps. Chem. Eng. J. 2018, 347, 379–397. [Google Scholar] [CrossRef]
  22. Fenton, H.J.H. Oxidation of tartaric acid in the presence of iron. J. Chem. Soc. 1894, 65, 899–910. [Google Scholar] [CrossRef] [Green Version]
  23. Peres Ribeiro, J.; Nunes, M.I. Recent trends and developments in Fenton processes for industrial wastewater treatment—A critical review. Environ. Res. 2021, 197, 110957. [Google Scholar] [CrossRef] [PubMed]
  24. Sychev, A.Y.; Isak, V.G. Iron compounds and the mechanisms of the homogeneous catalysis of the activation of O2 and H2O2 and of the oxidation of organic substrates. Russ. Chem. Rev. 1995, 64, 1105–1129. [Google Scholar] [CrossRef]
  25. Vasudevan, S. An efficient removal of phenol from water by peroxi-electrocoagulation processes. J. Water Process Eng. 2014, 2, 53–57. [Google Scholar] [CrossRef]
  26. Sandhwar, V.K.; Prasad, B. Comparison of electrocoagulation, peroxi-electrocoagulation and peroxi-coagulation processes for treatment of simulated purified terephthalic acid wastewater: Optimization, sludge and kinetic analysis. Korean J. Chem. Eng. 2018, 35, 909–921. [Google Scholar] [CrossRef]
  27. Farhadi, S.; Aminzadeh, B.; Torabian, A.; Khatibikamal, V.; Alizadeh Fard, M. Comparison of COD removal from pharmaceutical wastewater by electrocoagulation, photoelectrocoagulation, peroxi-electrocoagulation and peroxi-photoelectrocoagulation processes. J. Hazard. Mater. 2012, 219–220, 35–42. [Google Scholar] [CrossRef] [PubMed]
  28. Marselli, B.; Garcia-Gomez, J.; Michaud, P.-A.; Rodrigo, M.A.; Comninellis, C. Electrogeneration of hydroxyl radical on boron-doped diamond electrodes. J. Environ. Sci. 2003, 150, D79–D83. [Google Scholar] [CrossRef]
  29. Oturan, N.; Oturan, M.A. Chapter 8—Electro-Fenton Process: Background, New Developments, and Applications. In Electrochemical Water and Wastewater Treatment; Martínez-Huitle, C.A., Rodrigo, M.A., Scialdone, O., Eds.; Butterworth-Heinemann: Oxford, UK, 2018; pp. 193–221. ISBN 9780128131602. [Google Scholar] [CrossRef]
  30. Li, S.; Liu, Y.; Ge, R.; Yang, S.; Zhai, Y.; Hua, T.; Ondon, B.S.; Zhou, Q.; Li, F. Microbial electro-Fenton: A promising system for antibiotics resistance genes degradation and energy generation. Sci. Total Environ. 2020, 699, 134160. [Google Scholar] [CrossRef] [PubMed]
  31. Pérez, T.; Sirés, I.; Brillas, E.; Nava, J.L. Solar photoelectro-Fenton flow plant modeling for the degradation of the antibiotic erythromycin in sulfate medium. Electrochim. Acta 2017, 228, 45–56. [Google Scholar] [CrossRef] [Green Version]
  32. Sánchez Ruíz, C. Fenton Reactions (FS-TER-003). Inditex. 2015. Available online: https://www.wateractionplan.com/documents/177327/558166/Fenton+reactions.pdf/087c01a6-7f9c-2f33-95e7-b8a5945b9162 (accessed on 12 April 2021).
  33. APHA. Method 3500-Fe B. ASTMD 1068-77, Iron in Water, Test Method. In Standard Methods Standard Methods for the Examination of Water and Wastewater, 22nd ed.; American Public Health Association: Washington, DC, USA, 2012. [Google Scholar]
  34. Welcher, F.J. Standard Methods of Chemical Analysis, 6th ed.; Huntington 2B; R.E. Krieger Publishing Company: Florida, FL, USA, 1975; pp. 1827–1828. [Google Scholar]
  35. Hassanzadeh, A.; Barber, J.; Morris, G.A.; Gorry, P.A. Mechanism for the degradation of erythromycin A and erythromycin A 2′-Ethyl succinate in acidic aqueous solution. J. Phys. Chem. A 2007, 111, 10098–10104. [Google Scholar] [CrossRef]
  36. Volmer, D.A.; Hui, J.P. Study of erythromycin A decomposition products in aqueous solution by solid-phase microextraction/liquid chromatography/tandem mass spectrometry. Rapid Commun. Mass Spectrom. 1998, 12, 123–129. [Google Scholar] [CrossRef]
  37. Chitneni, S.K.; Govaerts, C.; Adams, E.; Van Schepdael, A.; Hoogmartens, J. Identification of impurities in erythromycin by liquid chromatography–mass spectrometric detection. J. Chromatogr. A 2004, 1056, 111–120. [Google Scholar] [CrossRef]
  38. Deubel, A.; Fandino, A.S.; Sörgel, F.; Holzgrabe, U. Determination of erythromycin and related substances in commercial samples using liquid chromatography/ion trap mass spectrometry. J. Chromatogr. A 2006, 1136, 39–47. [Google Scholar] [CrossRef]
  39. Luiz, D.B.; Genena, A.K.; Virmond, E.; José, H.J.; Moreira, R.F.; Gebhardt, W.; Schröder, H.F. Identification of degradation products of erythromycin A arising from ozone and advanced oxidation process treatment. Water Environ. Res. 2010, 82, 797–805. [Google Scholar] [CrossRef]
  40. Malvar, J.L.; Abril, C.; Martín, J.; Santos, J.L.; Aparicio, I.; Escot, C.; Basanta, A.; Alonso, E. Development of an analytical method for the simultaneous determination of the 17 EU Watch List compounds in surface waters: A Spanish case study. Environ. Chem. 2018, 15, 493–505. [Google Scholar] [CrossRef]
  41. Ganzenko, O.; Trellu, C.; Oturan, N.; Huguenot, D.; Péchaud, Y.; van Hullebusch, E.D.; Oturan, M.A. Electro-Fenton treatment of a complex pharmaceutical mixture: Mineralization efficiency and biodegradability enhancement. Chemosphere 2020, 253, 126659. [Google Scholar] [CrossRef] [PubMed]
  42. Pignatello, J.J.; Liu, D.; Huston, P. Evidence for an additional oxidant in the photoassisted Fenton reaction. Environ. Sci. Technol. 1999, 33, 1832–1839. [Google Scholar] [CrossRef]
  43. Wu, K.; Xie, Y.; Zhao, J.; Hidaka, H. Photo-Fenton degradation of a dye under visible light irradiation. J. Mol. Catal. A Chem. 1999, 144, 77–84. [Google Scholar] [CrossRef]
  44. Diari Oficial de la Generalitat de Catalunya. DECRET 130/2003, de 13 de maig, pel qual s’aprova el Reglament dels serveis públics de sanejament. Diari Oficial de la Generalitat de Catalunya 2003, 3894, 11143–11158. [Google Scholar]
  45. Buxton, G.V.; Greenstock, C.L.; Helman, W.P.; Ross, A.B. Critical-Review of Rate Constants for Reactions of Hydrated Electrons, Hydrogen-Atoms and Hydroxyl Radicals(OH/O) in Aqueous-Solution. J. Phys. Chem. Ref. Data 1988, 17, 513–886. [Google Scholar] [CrossRef] [Green Version]
  46. Grundl, T.; Delwiche, J. Kinetics of ferric oxyhydroxide precipitation. J. Contam. Hydrol. 1993, 4, 71–87. [Google Scholar] [CrossRef]
  47. Faust, B.C.; Hoigné, J. Photolysis of Fe(III)-hydroxy complexes as source of OH radical in clouds, fog and rain. Atmos. Environ. 1990, 24, 79–89. [Google Scholar] [CrossRef]
  48. Gallard, H.; De Laat, J.; Legube, B. Spectrophotometric study of the formation of iron(III)-hydroperoxy complexes in homogeneous aqueous solutions. Water Res. 1999, 33, 2929–2936. [Google Scholar] [CrossRef]
  49. Serra-Clusellas, A.; De Angelis, L.; Lin, C.-H.; Vo, P.; Bayati, M.; Sumner, L.; Lei, Z.; Amaral, N.B.; Bertini, L.M.; Mazza, J.; et al. Abatement of 2,4-D by H2O2 solar photolysis and solar photo-Fenton-like process with minute Fe(III) concentrations. Water Res. 2018, 144, 572–580. [Google Scholar] [CrossRef]
  50. Hirsch, R.; Ternes, T.; Haberer, K.; Kratz, K.-L. Occurrence of antibiotics in the aquatic environment. Sci. Total Environ. 1999, 225, 109–118. [Google Scholar] [CrossRef]
  51. Zhang, Y.; Duan, L.; Wang, B.; Liu, C.S.; Jia, Y.; Zhai, N.; Blaney, L.; Yu, G. Efficient multiresidue determination method for 168 pharmaceuticals and metabolites: Optimization and application to raw wastewater, wastewater effluent, and surface water in Beijing, China. Environ. Pollut. 2020, 261, 114113. [Google Scholar] [CrossRef] [PubMed]
  52. Eurostat. Electricity Prices (Including Taxes) for Household Consumers, First Half 2020. Available online: https://ec.europa.eu/eurostat/statistics-explained/index.php/Electricity_price_statistics (accessed on 5 March 2021).
Figure 1. Scheme of the experimental system for the EF and PEC processes.
Water 13 01129 g001
Figure 2. Evolution of dissolved organic carbon (DOC) (△, ○, ◇, □) and [H2O2] remained in water (▲, ●, ◆, ■) through the applied charge in 1 L of 10 mg L−1 erythromycin and 0.05M Na2SO4 (ultrapure water) treated by the EF and PEC processes at 25 °C, 2 L min−1 O2 and pH = 2.8 under the following conditions: (△, ▲) BDD anode, 10 mA cm−2 (left graphic); (○, ●) Fe anode, 10 mA cm−2 (left graphic); (◇, ◆) BDD anode, 5 mA cm−2 (right graphic); (□, ■) Fe anode, 5 mA cm−2 (right graphic).
Water 13 01129 g002
Figure 3. Evolution of DOC (○, △, □, ◇) and [H2O2] remained in water (●, ▲, ■, ◆) through the applied charge in 1 L of 10 mg L−1 erythromycin and 0.05M Na2SO4 (ultrapure water) treated by the PEC process at 25 °C, pH = 2.8, under the following conditions: (○, ●) 10 mA cm−2 at 2 L min−1 O2 (left graphic); (△, ▲) 10 mA cm−2 at 0.8 L min−1 O2 (left graphic); (□, ■) 5 mA cm−2 at 2 L min−1 O2 (right graphic); and (◇, ◆) 5 mA cm−2 at 0.8 L min−1 O2 (right graphic).
Water 13 01129 g003
Figure 4. Evolution of DOC through the applied charge in 1 L of 10 mg L−1 erythromycin and 0.05 M Na2SO4 (ultrapure water) treated by the PEC process at 5 mA cm−2, 25 °C, 2 L min−1 O2, under the following pHs: (□) 2.8; (∗) 5.0; (+) 7.0.
Water 13 01129 g004
Figure 5. Proposed early-stage mineralization pathway for the removal of 10 mg L−1 erythromycin (ultrapure water) by the PEC process.
Water 13 01129 g005
Figure 6. Evolution of the DOC (■) and the electric consumption (x) through the applied charge in 1 L of an effluent from an urban WWTP treated by the PEC process at 5 mA cm−2, 25 °C, 2 L min−1 O2 at pH 2.8.
Water 13 01129 g006
Table 1. Detailed multiple reaction monitoring transitions and retention time for each analyte listed in the EU Decision 2018/840.
CompoundRetention Time (min)ESIQuantitative Transition (m/z)Qualitative Transition (m/z)Collision Energy (V)r2Quantification Limit (MLOQ) (ng L−1)Detection Limit (MLOD) (ng L−1)
17-β-Estradiol-d58.70ESI (−)276.2→147.1276.2→187.249/41
17-β-Estradiol (E2)8.75ESI (−)271.2→145.1271.2→183.145/490.9910.3
Estrone-d48.76ESI (−)273.1→147.1273.1→145.049/60
Estrone (E1)8.79ESI (−)269.1→145.1269.1→143.141/600.9910.3
17-α-Ethinylestradiol-d58.90ESI (−)299.2→147.1299.2→269.133/53
17-α-Ethinylestradiol (EE2)8.85ESI (−)295.2→145.2295.17→142.949/600.9910.03
Amoxicillin-d42.71ESI (+)370.1→114.0370.1→353.321/9
Amoxicillin2.73ESI (+)366.1→114.0366.1→349.218/40.9510.3
Thiamethoxam-d44.78ESI (+)296.1→215.0296.1→183.05/21
Thiamethoxam4.82ESI (+)292.0→210.9292.0→180.89/210.9910.3
Ciprofloxacin5.39ESI (+)332.1→231.0332.0→314.245/170.9910.3
Clothianidin-d34.47ESI (+)253.0→172.0253.0→131.89/21
Clothianidin4.48ESI (+)250.0→131.9250.0→169.113/90.9910.3
Imidacloprid-d45.49ESI (+)260.1→179.2260.1→213.113/9
Imidacloprid5.52ESI (+)256.1→175.0256.1→209.117210.99103
Acetamiprid-d35.94ESI (+)226.1→126.1226.1→59.221/13
Acetamiprid5.95ESI (+)223.1→126.1223.1→56.017/130.9910.3
Thiacloprid6.42ESI (+)253.0→125.9253.0→98.921/530.9910.3
Azithromycin7.25ESI (+)749.5→82.9749.5→591.360/330.9910.3
Erythromycin-d39.12ESI (+)737.5→161.0737.5→82.937/60
Erythromycin9.12ESI (+)734.4→158.1734.4→83.137/600.9961.8
Methiocarb-d310.36ESI (+)229.1→169.1229.1→121.09/17
Methiocarb10.38ESI (+)226.1→169.0226.1→121.117/90.99206
Clarithromycin-d310.84ESI (+)751.5→161.1751.5→83.125/57
Clarithromycin10.86ESI (+)748.5→158.2748.5→83.137/600.9910.3
Metaflumizone14.60ESI (+)507.1→178.2507.1→87.033/250.9961.8
Table 2. Summary of the experimental conditions.
Experiment ConditionsType of WaterAnode Typejanode (mA/cm2)Oxygen Flowrate (L/min)pH
EF-1Ultrapure water.
10 mg L−1 erythromycin and 0.05 M Na2SO4
BDD52.02.8
EF-2BDD102.02.8
PEC-1Fe52.02.8
PEC-2Fe102.02.8
PEC-3Fe50.82.8
PEC-4Fe100.82.8
PEC-5Fe52.05.0
PEC-6Fe52.07.0
PEC-7Effluent from a tertiary treatment of an urban WWTPFe52.02.8
Table 3. Erythromycin and aromatic intermediates detected during PEC of 10 mg L−1 erythromycin and 0.05M Na2SO4 (ultrapure water) at 5 mA cm−2, 25 °C, 2 L min−1 O2, pH = 2.8.
CompoundMolecular FormulaPseudo-Molecular Ion (m/z)Retention Time (min)Compound Concentration (µg L−1)
0 min
pH 2.8
5 min15 min30 min45 min60 min
1Erythromycin (Erythromycin A)C37H67NO13734.46854.0457.417.90.8Non detected (n.d.)n.d.n.d.
2Erythromycin BC37H67NO12718.47364.6204.147.00.5n.d.n.d.n.d.
3Erythromycin CC36H65NO13720.45293.55.2n.d.n.d.n.d.n.d.n.d.
4Erythromycin C anhydrousC36H63NO12702.44234.261.119.20.2n.d.n.d.n.d.
5Erythromycin A desosamine N-demethylationC36H65NO13720.45293.913.52.31.5n.d.n.d.n.d.
6Erythromycin EC37H65NO14748.44783.9301.371.02.9n.d.n.d.n.d.
7Erythromycin E dehydration + dehydroxylationC37H63NO12714.44235.222.199.31.2n.d.n.d.n.d.
8Erythromycin E dehydration + dehydroxylation—cladinoseC29H49NO9556.3484.3n.d.46.75.0n.d.n.d.n.d.
9Erythromycin FC37H67NO14750.46343.7241.714.5n.d.n.d.n.d.n.d.
10Erythromycin F—cladinose TP-1C29H53NO11592.36912.599.143.62.3n.d.n.d.n.d.
11Erythromycin F—cladinose TP-2C29H53NO11592.36912.61.264.33.2n.d.n.d.n.d.
12Erythromycin A—cladinoseC29H53NO10576.37423.068.1149.09.1n.d.n.d.n.d.
13Erythromycin F enol ether or anhydrousC37H65NO13732.45293.63.520.80.8n.d.n.d.n.d.
14Erythromycin F dehydrogenation TP-1C37H65NO14748.44783.50.731.40.8n.d.n.d.n.d.
15Erythromycin F dehydrogenation TP-2C37H65NO14748.44783.912.861.03.1n.d.n.d.n.d.
16Erythromycin F enol ether or anhydrous + lactone dehydration TP-1C37H63NO12714.44234.440.621.10.2n.d.n.d.n.d.
17Erythromycin F enol ether or anhydrous + lactone dehydration TP-2C37H63NO12714.44234.820.927.40.2n.d.n.d.n.d.
18Erythromycin F enol ether or anhydrous + lactone dehydration—cladinoseC29H49NO9556.3483.0n.d.5.60.4n.d.n.d.n.d.
19Erythromycin A enol ether TP-1C37H65NO12716.4584.85.14.4n.d.n.d.n.d.n.d.
20Erythromycin A enol ether TP-2C37H65NO12716.4585.21.88.60.1n.d.n.d.n.d.
21Erythromycin A enol ether—cladinoseC29H51NO9558.36374.220.57.2n.d.n.d.n.d.n.d.
22Erythromycin A anhydrousC37H65NO12716.4584.51533.5432.02.6n.d.n.d.n.d.
23Erythromycin A anhydrous desosamine N-demethylationC36H63NO12702.44234.456.23.5n.d.n.d.n.d.n.d.
24Erythromycin A anhydrous—cladinoseC29H51NO9558.36373.546.779.44.7n.d.n.d.n.d.
Table 4. Composition of the effluent from the tertiary treatment of an urban WWTP.
ParameterUnitsValue
pH-7.6
Electrical conductivityms cm−11.5
Total Inorganic Carbonmg L−172.8
DOCmg L−19.9
Total Nmg L−133.1
Table 5. Concentration of the compounds listed in the Watch List 2018 in the analysed effluents.
CompoundEffluent from the Tertiary Treatment of an Urban WWTP (ng L−1)Treated Effluent from the PEC Treatment (ng L−1)Removals (%)
E1858599%
E2127<MLOQ>99%
EE2117199%
Amoxicillin trihydrate<MLOQ<MLOQ-
Thiamethoxam7<MLOQ>86%
Ciprofloxacin1<MLOQ-
Clothianidin6<MLOQ>83%
Imidacloprid60<MLOQ>83%
Acetamiprid30<MLOQ>97%
Thiacloprid21<MLOQ>95%
Azythromycin365<MLOQ100%
Erythromycin23<MLOQ>74%
Methiocarb30<MLOQ>33%
Clarythromycin31<MLOQ>97%
Metaflumizone17<MLOQ>65%
Publisher’s Note: MDPI stays neutral with regard to jurisdictional claims in published maps and institutional affiliations.

