Article

Laboratory Physical Experiments on the Saltwater Upconing and Recovery of Island Freshwater Lenses: Case Study of a Coral Island, China

1
State Key Laboratory of Hydrology-Water Resources and Hydraulic Engineering, Hohai University, Nanjing 210098, China
2
College of Hydrology and Water Resources, Hohai University, Nanjing 210098, China
3
Northwest Electric Power Design Institute Co., Ltd. of China Power Engineering Consulting Group, Xi’an 710075, China
4
Jinan Rail Transit Group Co., Ltd., Jinan 250000, China
*
Author to whom correspondence should be addressed.
Water 2021, 13(9), 1137; https://doi.org/10.3390/w13091137
Submission received: 3 March 2021 / Revised: 19 April 2021 / Accepted: 20 April 2021 / Published: 21 April 2021
(This article belongs to the Special Issue Water Resources Modelling and Assessment for Small Oceanic Islands)

Abstract

:
The research of saltwater upconing is crucial for the development and utilization of island freshwater resources. In this paper, a laboratory physical experiment device was developed, and the saltwater upconing and recovery of island freshwater lenses were investigated using rainfall simulations and single-well and multi-well pumping tests with various pumping intensities. The results of the experiment revealed that: (1) The thickness of the freshwater lens increased continuously and linearly during the early stages of rainfall. As the rainfall continued, the upward trend slowed and eventually leveled off. (2) Under the same pumping duration, when the pumping intensity was less than the critical pumping intensity, the increasing height rate of the saltwater upconing increased linearly at a small gradient, and when the pumping intensity was greater than the critical value, the rising height rate of the saltwater upconing increased linearly at a large gradient. (3) Under the same pumping intensity conditions, the pumping duration of the multi-well was longer than that of the single-well pumping, and the pumping volume of the multi-well was also greater than that of the single-well pumping. The experiment results can provide support for the development and utilization of island freshwater lens.

1. Introduction

Freshwater lens, also named as the Ghyben–Herzberg lens, was discovered by Ghyben [1] and Herzberg [2] in the freshwater supply study of the coastal areas of Europe in 1889 and 1901, respectively. Freshwater lens refers to a lens-like freshwater body that floats on seawater because of the density difference between freshwater and saltwater, which is generally formed on coral islands far away from the mainland [3,4,5,6,7]. Freshwater lens is an extremely precious freshwater resource on islands [8,9,10]. Its development and utilization can greatly alleviate the difficulty of water supply on islands and has great economic, military, and social values [11].
To develop and utilize the groundwater resources of freshwater lens scientifically and rationally, in-depth research on the freshwater lens has been conducted by scholars at home and abroad. Duncan [12] conducted the first statistical study on the formation of freshwater in different islands, and the economic benefit of freshwater in Pacific islands and reefs was comprehensively evaluated. At the moment, freshwater lens research is primarily concerned with the formation and development of freshwater lenses. Lee [13] investigated the impact of different controls on the scale of the freshwater lens and the thickness of the mixing zone using a series of TOUGH 2 hydrology models. Schneider and Kruse [14] used SEAWAT tools to simulate the effect of rainfall spatial-temporal distribution, human activities, and coastal erosion on the thickness of the freshwater lens in two islands of Florida, the United States. The simulation results showed that coastal erosion and rainfall had the most important impact on the thickness of the freshwater lens. Muhammad [15] used MODFLOW and MT3D tools to simulate the movement of the saltwater–freshwater interface in Punjab Island, Pakistan, and the best mining scheme for the freshwater lens in Punjab Island was suggested. Zhou [16] used a mathematical model based on mass conservation and Darcy’s Law to simulate the evolution mechanism of a freshwater lens and measure the interface between freshwater and seawater. The position of saltwater upconing under the condition of homogeneous aquifer and steady flow was determined by Bower [17] using an analytical method and numerical analysis method. The analytical formula for the saltwater upconing at the interface between saltwater and freshwater was established by Dagan and Zeitoun [18] under the condition of considering the random distribution of hydraulic conductivity. The development and flow dynamics of freshwater lenses were investigated by Stoeckl and Houben [19] by physical experiments on a laboratory scale, and the results showed that a horizontal well caused less upconing of the interface and got a higher sustainable yield than a vertical well. The qualitative and quantitative analyses of the temporal changes in the two-dimensional patterns of the freshwater lens in strip islands were performed by Bedekar [20] in a laboratory sand tank, which are impacted by wet and dry recharge cycles.
The above-mentioned freshwater lens studies primarily employed numerical simulation and mathematical model methods; however, there are only a few studies on freshwater lenses that employ laboratory physical experiments. Furthermore, there are few valid studies on the effects of single-well and multi-well pumping on saltwater upconing and freshwater lens recovery in laboratory physical experiment research.
This paper describes the saltwater upconing and recovery of island freshwater lenses. A laboratory physical experiment system was developed, and single-well pumping and multi-well pumping tests on saltwater upconing and freshwater lens recovery were carried out in the laboratory. The objective of this paper is to serve as a resource for the development and utilization of island freshwater lenses, which have important practical applications.

2. Study Area

The coral island considered in this study, located to the southeast of Hainan Island, is the largest in the Xisha Archipelago, South China Sea with a total area of 2.1 km2. The coral island is surrounded by a sand barrier, which can be divided into reef flat, beach, sand barrier, sand sheet, and depression from the reef edge to the island center. The coral island has a tropical marine monsoon climate with an annual average temperature of 25~28 °C and annual average precipitation of 1505 mm. The precipitation is unevenly distributed temporally. In total, 86% of the annual precipitation is spread out between June to November, and the events of stormwater are frequent. However, the soil has high porosity and permeability. Only a thin freshwater lens can form above the saltwater, and the freshwater resources on the island are extremely scarce and fragile.

3. Materials and Methods

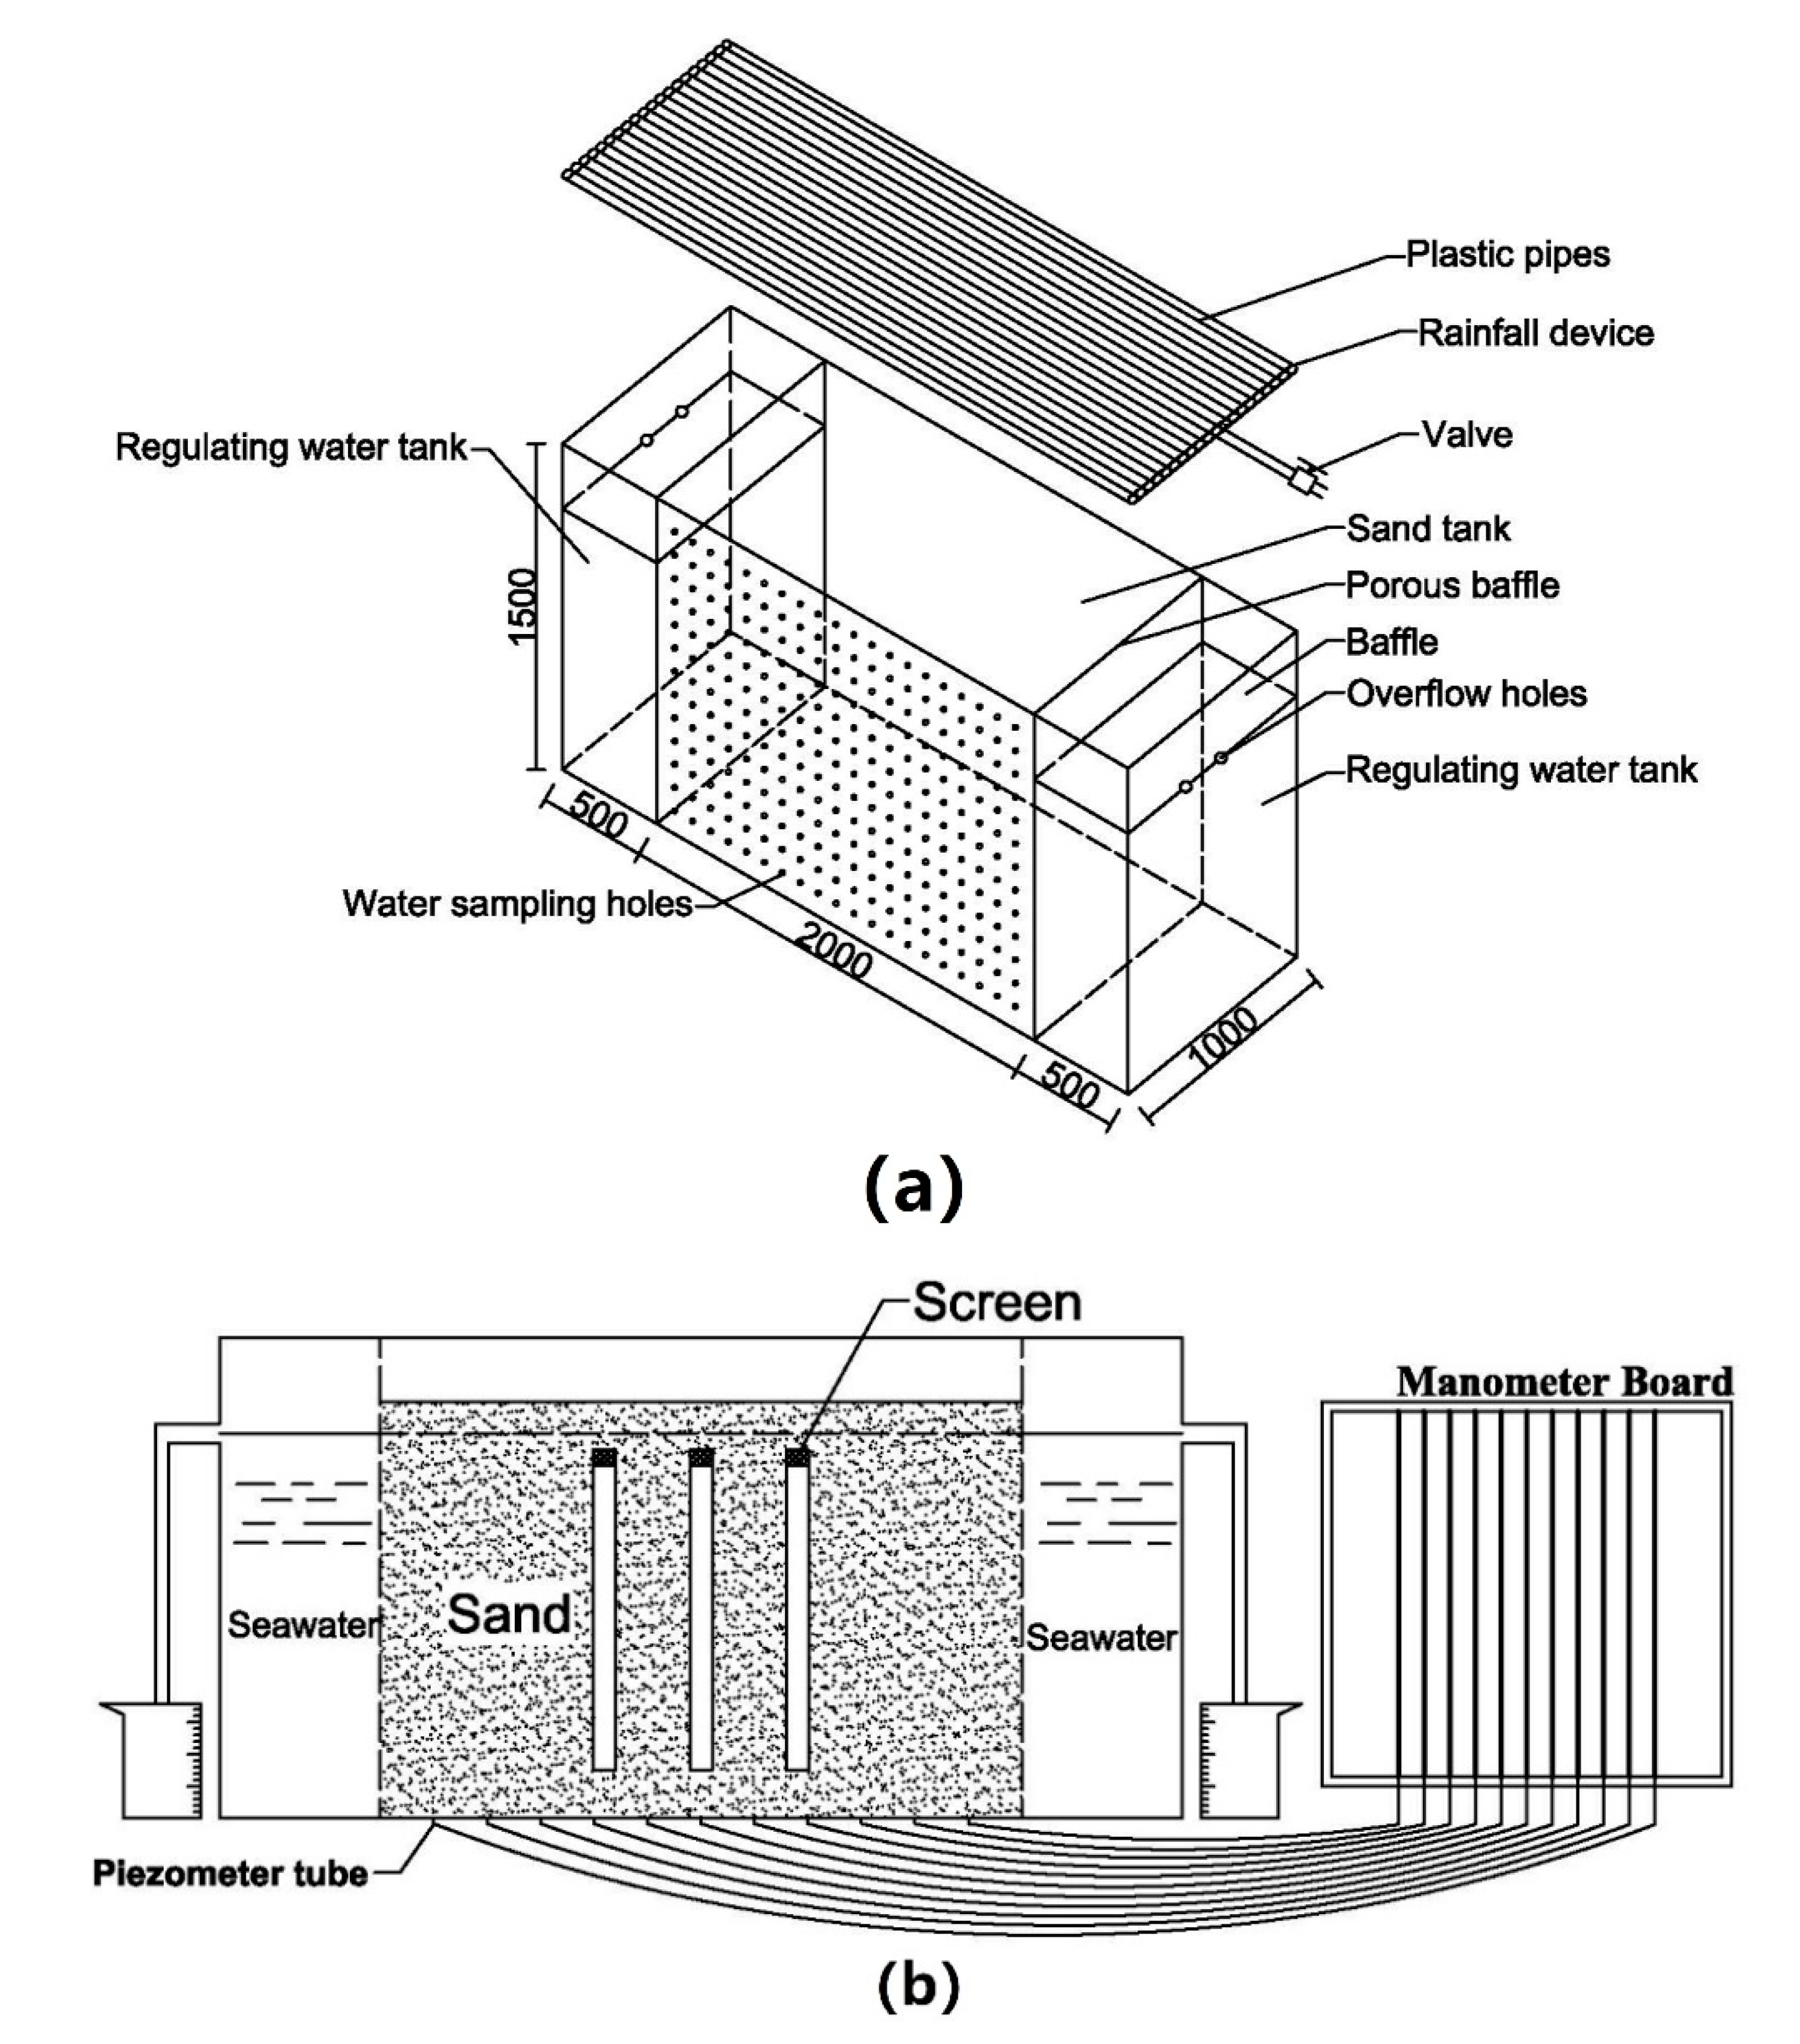
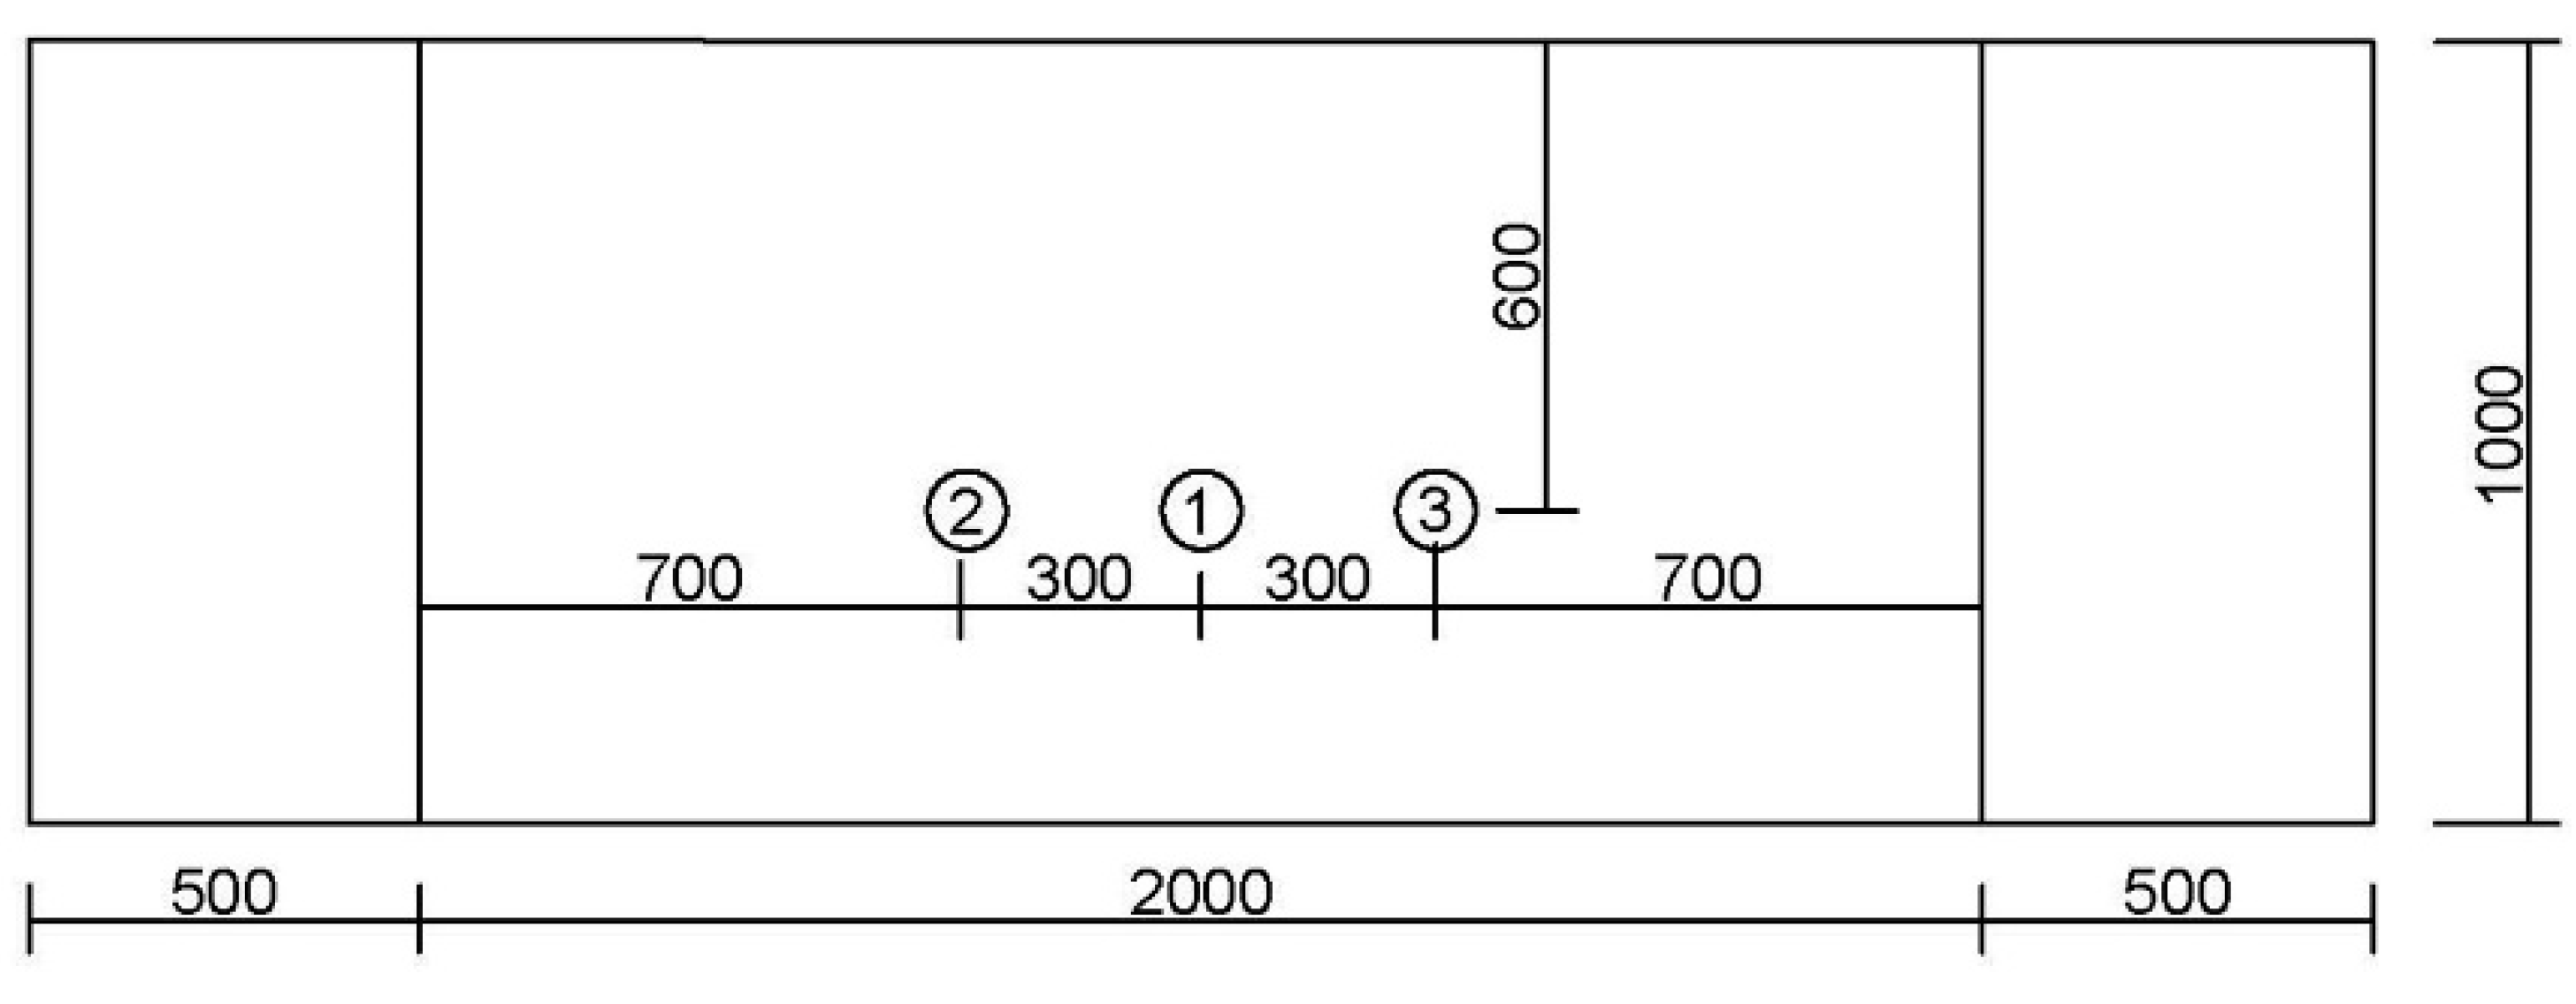
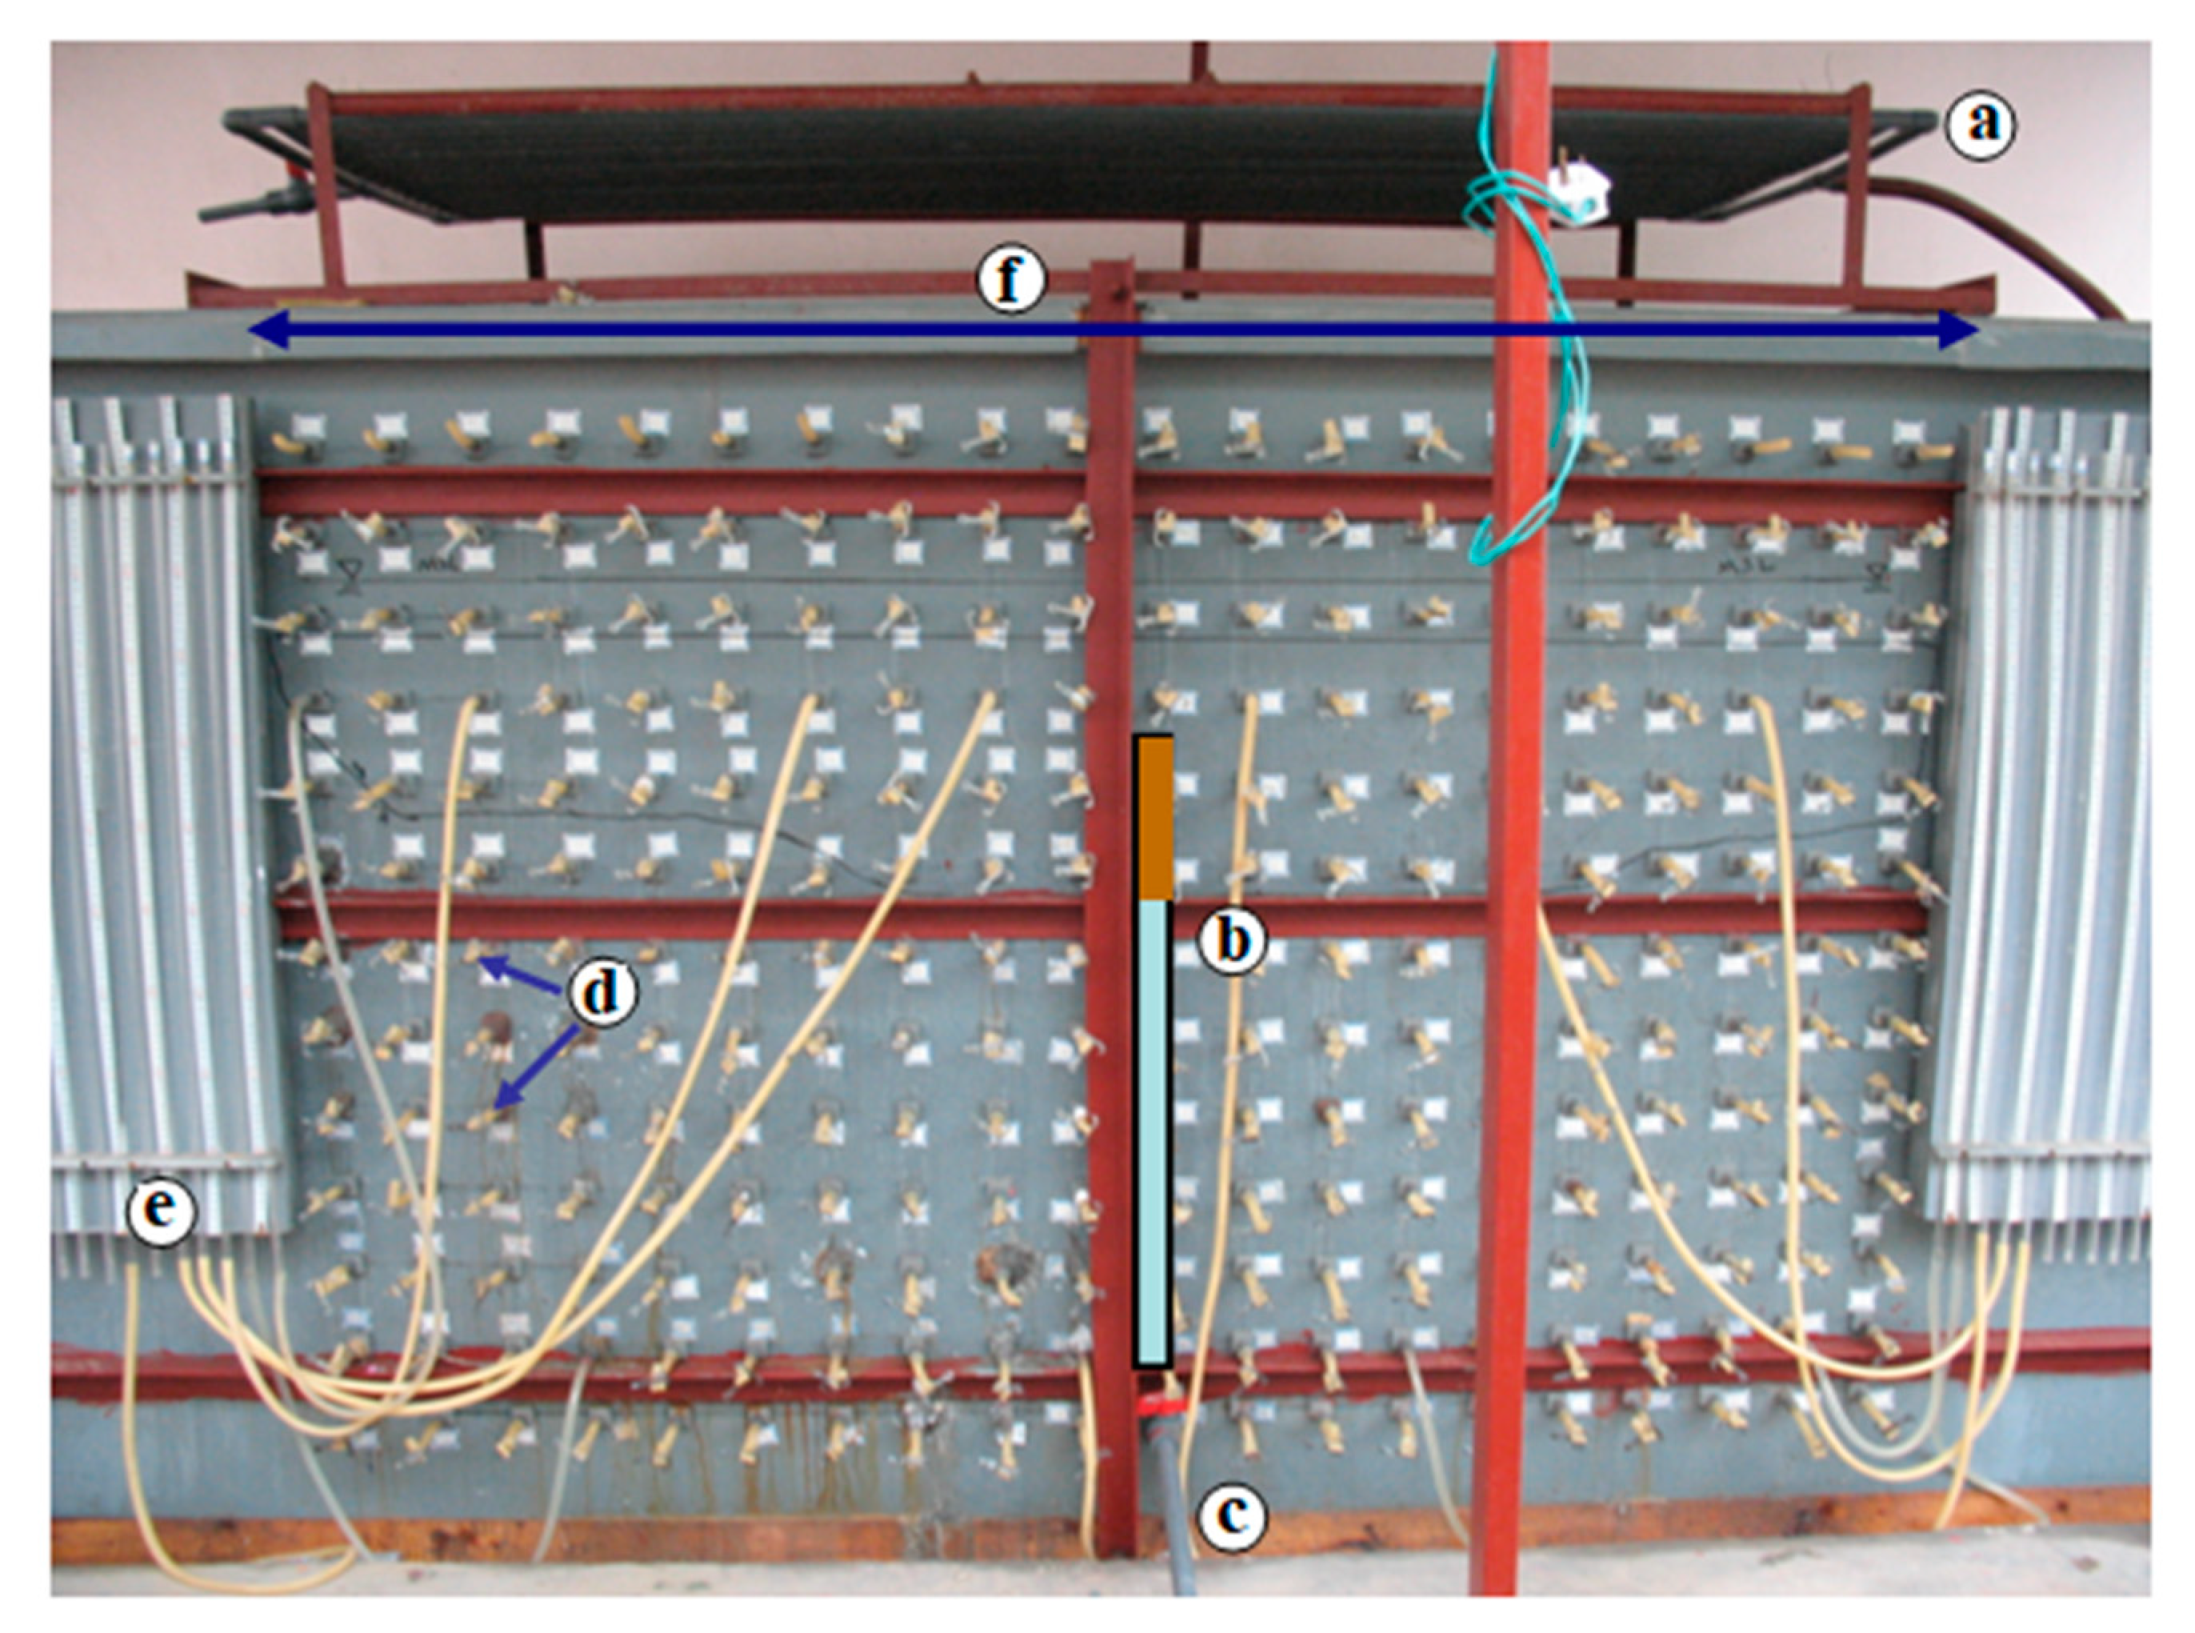
3.1. Experimental Design

The coral island is shaped like an ellipse and covers an area of 2.0 km2. For simulation, a two-dimensional physical model was proposed. Taking into account the size of the laboratory physical experiment, a rectangular sand tank with an area of 2.0 m2, a length of 2.0 m, and a width of 1.0 m was used. The ratio of the length and width of the sand tank to that of the prototype was about 1:1000. A laboratory physical experiment device was designed, as shown in Figure 1. the experiment device was made of plexiglass on each side measuring 3.0 m × 1.0 m × 1.5 m (length × width × height).
The laboratory experiment device was divided into four systems: a media system, a water supply system, a drainage system, and a measurement system.
The media system mainly consisted of a sand tank and two regulating water tanks. The sand tank was used to hold the sand medium that simulates the aquifer of the coral island, and the two regulating water tanks on both sides were used to store seawater. There was a porous baffle between the sand tank and the regulating water tank. The hole diameter of the porous baffle was 3 mm, and seawater could enter the sand tank through the small holes.
The water supply system consisted of 18 plastic pipes, on which small holes were evenly drilled, and the ends of the plastic pipes were connected to the water supply source. The water flowing from the small holes of the plastic pipes can be evenly sprayed onto the sand medium to simulate the natural rainfall, and a water meter was installed at the water supply pipe to record the rainfall volume.
The drainage system was composed of pumping wells and overflow holes. Three pumping wells, No.1, No.2, and No.3, were set in the sand tank. The pumping wells were all made of plastic pipe, each of which was 1.0 m high, 0.02 m in diameter, and 0.15 m away from the bottom of the sand tank. The screen was set within a length range of 0.05 m below the top of the pumping well, and the outlet hole of the pumping well was set at the bottom of the sidewall of the sand tank and equipped with a valve. The arrangement of pumping wells is shown in Figure 2. The regulating water tanks on both sides were covered by two baffle plates, which were placed at 0.3 m from the top of the regulating water tank, and two overflow holes were arranged above the baffle plate to prevent rain from entering the seawater, and other overflow holes were arranged under the baffles to maintain the seawater level constant.
The measurement system consisted of a flow and a water level measurement system. The flow measurement system was composed of the water sampling holes and a conductivity meter. The water level measurement system was composed of a water level scale attached to the sidewall of the sand tank. A total of 260 water sampling holes with diameters of 0.01 m were evenly arranged in 13 rows with 20 holes in each row in the sidewall of the sand tank, the hard plastic pipes of 25 cm in length were inserted into the water sampling holes, and 20 cm was inserted into the sand tank, while 5 cm was left outside to connect with the latex pipe. The water seal clamp was set at the end of the latex pipe, so as to monitor the electrical conductivity (hereinafter referred to as EC) of the water sample by the conductivity meter. The dynamic state of the freshwater lens was continuously monitored at any time by measuring the EC of the water sample and observing the water level in the water level scale.
Our team members completed the fieldwork on the coral island and collected some coral sand, after which the porosity, specific yield, hydraulic conductivity, and the dispersion coefficient of the coral sand collected were measured in the laboratory. Since the hydraulic conductivity of coral sand was so high (706.61 m/d), capturing the development and evolution of freshwater lenses in a small-scale laboratory experiment was difficult. In this paper, medium sand was chosen as the aquifer medium to study the formation and evolution of freshwater lenses. Table 1 shows the hydraulic properties of medium sand and coral sand. The sand medium had an average particle size of 0.36 mm, a dry density of 1.63 g/cm3, a porosity of 0.40, a longitudinal dispersion coefficient of 0.16 cm2/s, and a hydraulic conductivity of 21.70 m/d.
There is a sand layer within 22 m below the ground surface on the coral island, and limestone beneath the sand layer, according to borehole data. The thickness of the sand media placed in the sand tank was 1.3 m, taking into account the size of the physical experiment device and the ease of observing and monitoring the formation and evolution of freshwater lenses. Seawater with a chloride ion concentration of 18 g/L was injected into the regulating water tanks on both sides, and the water level of the regulating water tanks on both sides was maintained at 1.2 m.

3.2. Methods

Three scenarios of laboratory physical experiments were carried out: (1) a continuous rainfall process simulation, (2) a multi-intensity single-well pumping test simulation, and (3) a multi-well pumping test simulation. After the completion of each pumping test, rainfall recharge was carried out to restore the state of the freshwater lens before the pumping, and then the next group of pumping tests were carried out, and so on. The physical experiment’s basic procedure steps can be found in Appendix A.
Because of its approximate linear relationship with the chloride concentration and easiness to be quickly measured, the EC of the water sample was taken as the parameter to determine the interface between the saltwater and freshwater. In this experiment, the seawater with the chloride ion concentration of 18 g/L was injected into the regulating water tank. After the sand was saturated with seawater, the EC measured from the water sampling hole was 31.8 mS/cm. The chloride ion concentration contour of 600 mg/L was defined as the dividing interface between the freshwater and saltwater, that is, the geometric bottom boundary of the freshwater lens, and the measured EC of the water sample with the chloride ion concentration of 600 mg/L was 6.24 mS/cm. The EC of the transition zone was between 6.24 and 31.8 mS/cm. The distance between the lowest point of the bottom of freshwater lens and the seawater level was defined as the thickness of the freshwater lens in the experiment.
Since the experiment was completed outdoors, to avoid the influence of temperature change on the EC of the water sample, the ratio of the measured EC of the water sample to that of the seawater was used to delineate the shape of the freshwater lens in this experiment, where the ratio of 0.2 represented the bottom boundary of the freshwater lens, and the ratio of 1.0 represented the seawater.

4. Results and Discussion

4.1. Influence of Rainfall on the Thickness of the Freshwater Lens

During the experiment, the rainfall tests were conducted once every 24 h for 8 min. Through the 10 sets of rainfall test, the rainfall intensity increased progressively. The relationship between the times of rainfall and the thickness of the freshwater lens is shown in Figure 3.
In the initial stage of the test, the thickness of the freshwater lens was relatively thin. The thickness of the freshwater lens was only 7.6 cm after the first rainfall, accounting for 26.21% of the stable thickness of the freshwater lens after the 10 sets of rainfall. With the rainfall tests ongoing, the thickness of the freshwater lens continued to increase. After reaching a certain thickness, the increasing speed tended to slow down, and finally stabilized. The stable thickness of the freshwater lens was at 28.3 cm.

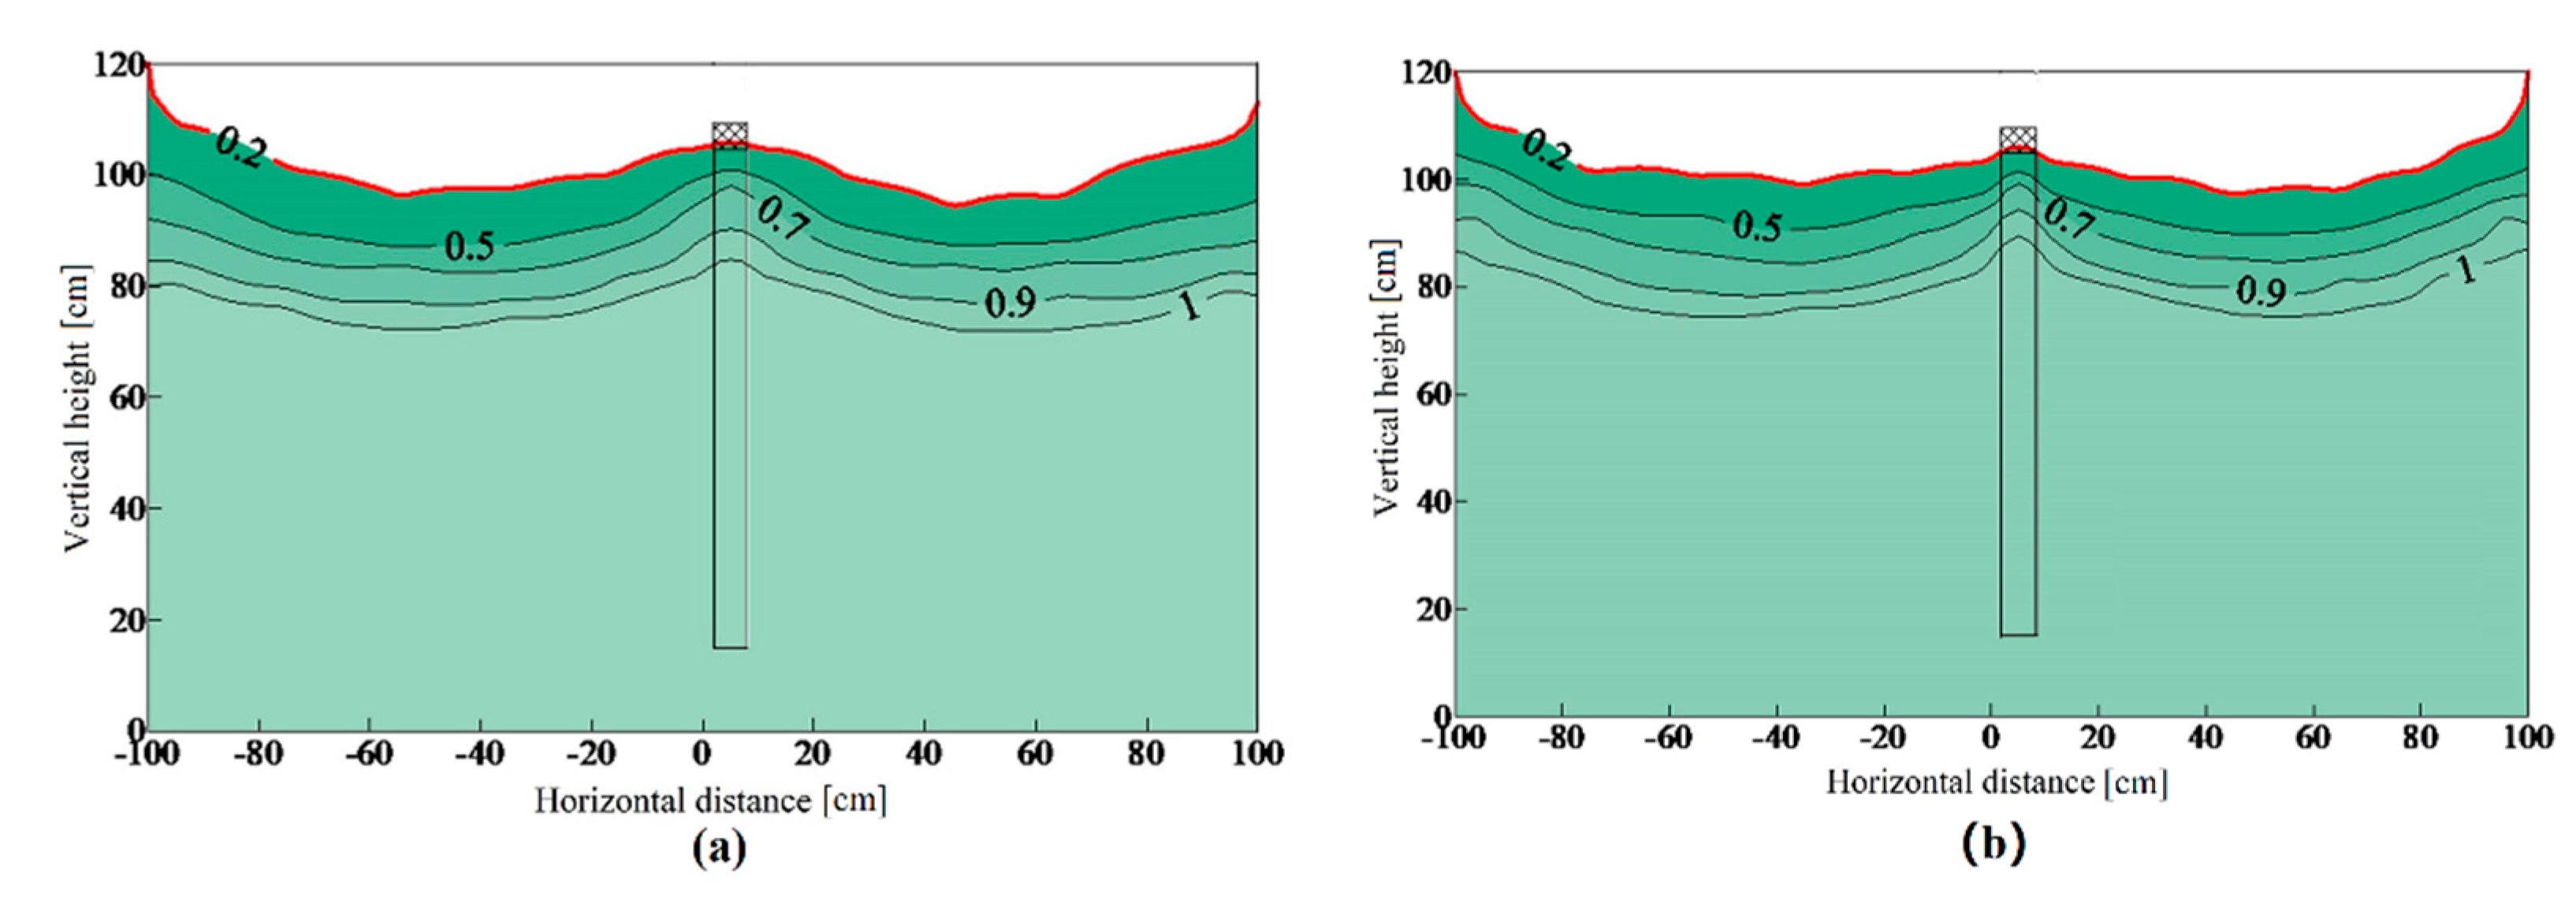
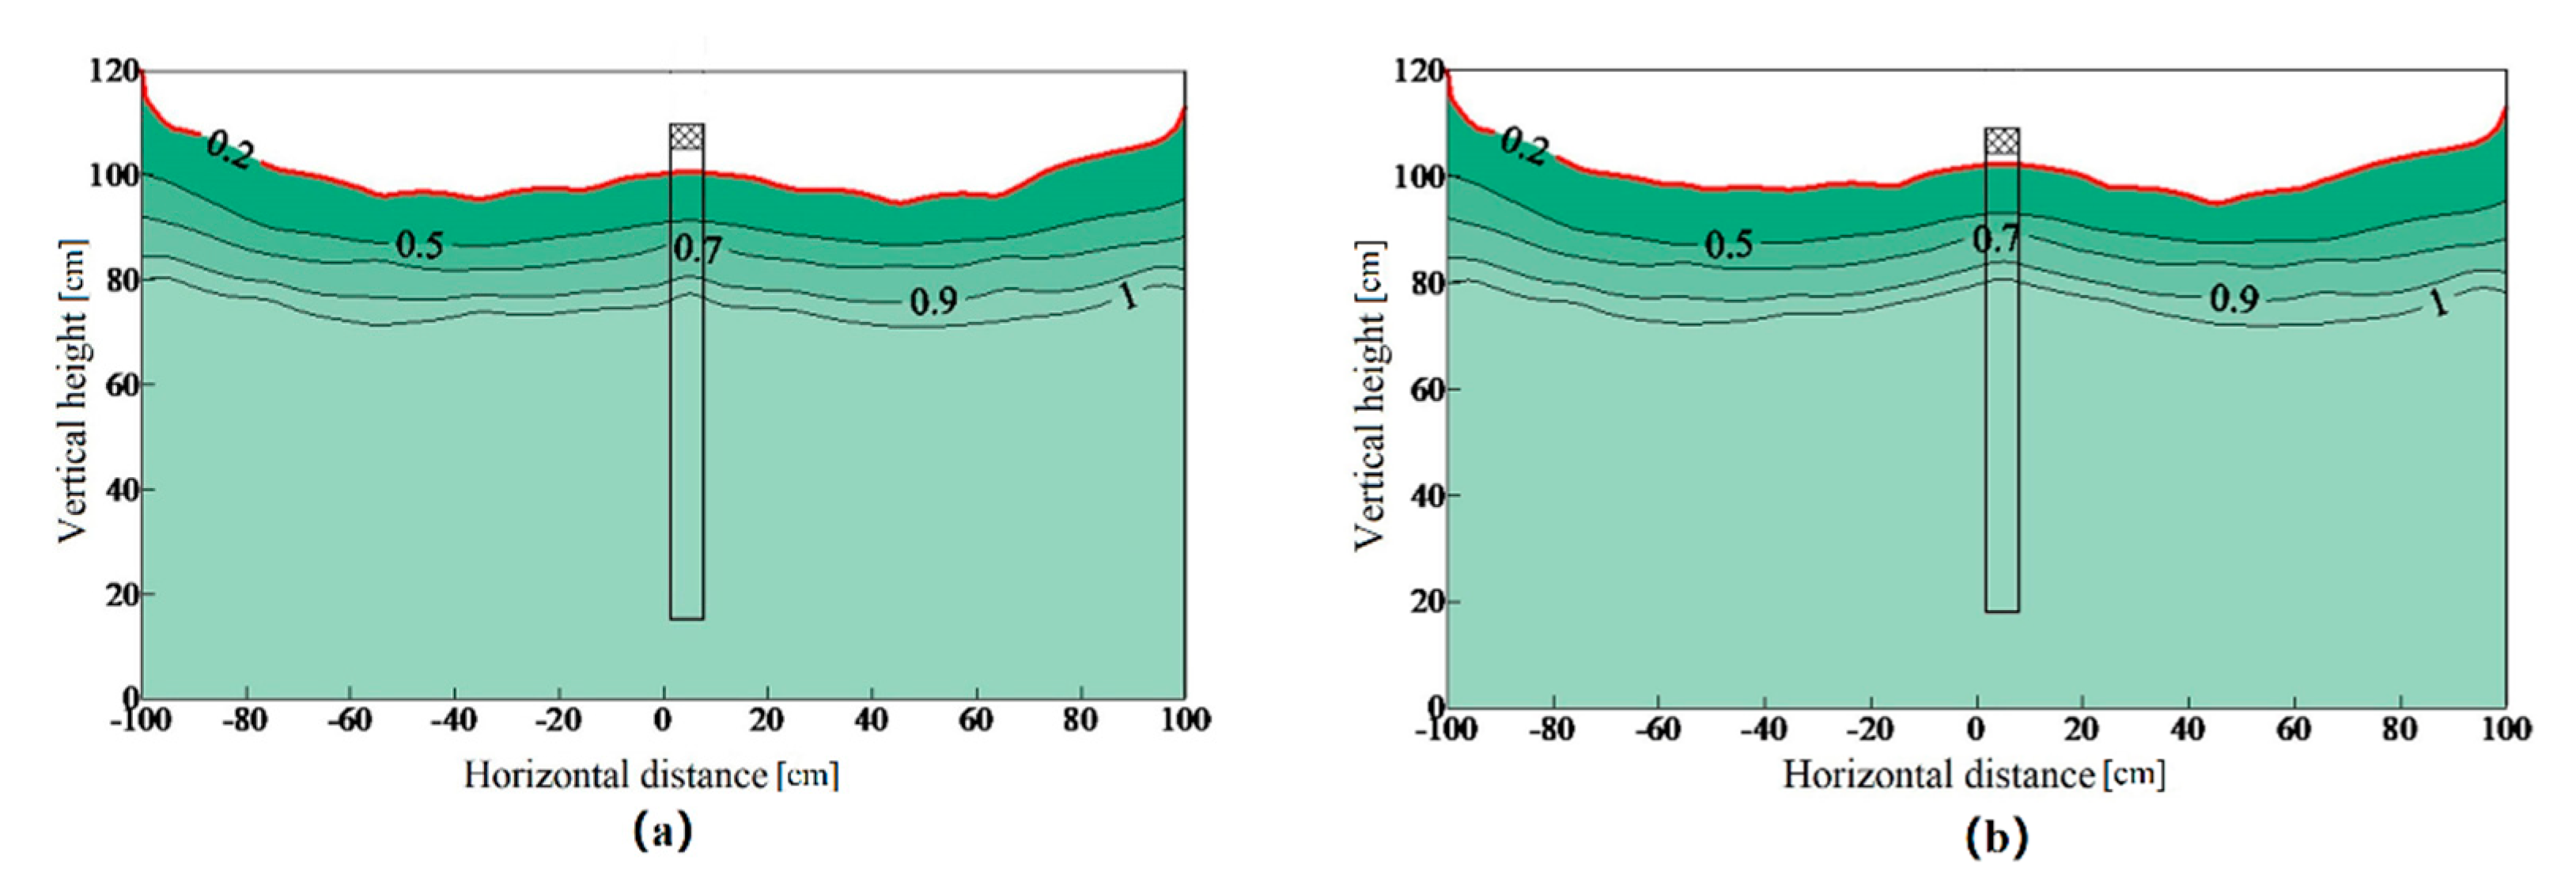
4.2. Influence of Different Pumping Intensity on the Recovery of the Freshwater Lens

After the freshwater lens was stabilized, the No.1 pumping well was used to simulate the exploitation of groundwater. Two group tests were conducted. The pumping intensity, pumping duration, and total pumping volume of each group were different. The test data of the two groups is shown in Table 2. During the pumping process, when the EC of the water from the pumping well was greater than that of the water with a chloride ion concentration of 600 mg/L, it was considered that the freshwater lens had been broken, and the pumping test was stopped immediately. The EC distribution is shown in Figure 4.
The pumping test of the previous group was stopped and recovered naturally for 16 h. Then, the EC of the water samples obtained from each water sampling hole was measured, and the natural recovery of the lens was observed. The EC distribution is shown in Figure 5. The thickness of the freshwater lens under different pumping intensities is shown in Table 3. Then, the sand tank was recharged by rainfall to recover to the initial state before the freshwater lens was pumped, and the next group of pumping tests followed.
The test results show that when the freshwater lens was broken, compared with the results of test No.1, the pumping volume in test No.2 was 17% higher, but the pumping duration in test No.2 was 50% lower, and the thickness of the freshwater lens after natural recovery in test No.2 was 7.69% thinner. It can be seen from the above data that the smaller the pumping intensity of the freshwater lens, the longer the sustainable pumping duration, and the better the natural recovery degree.

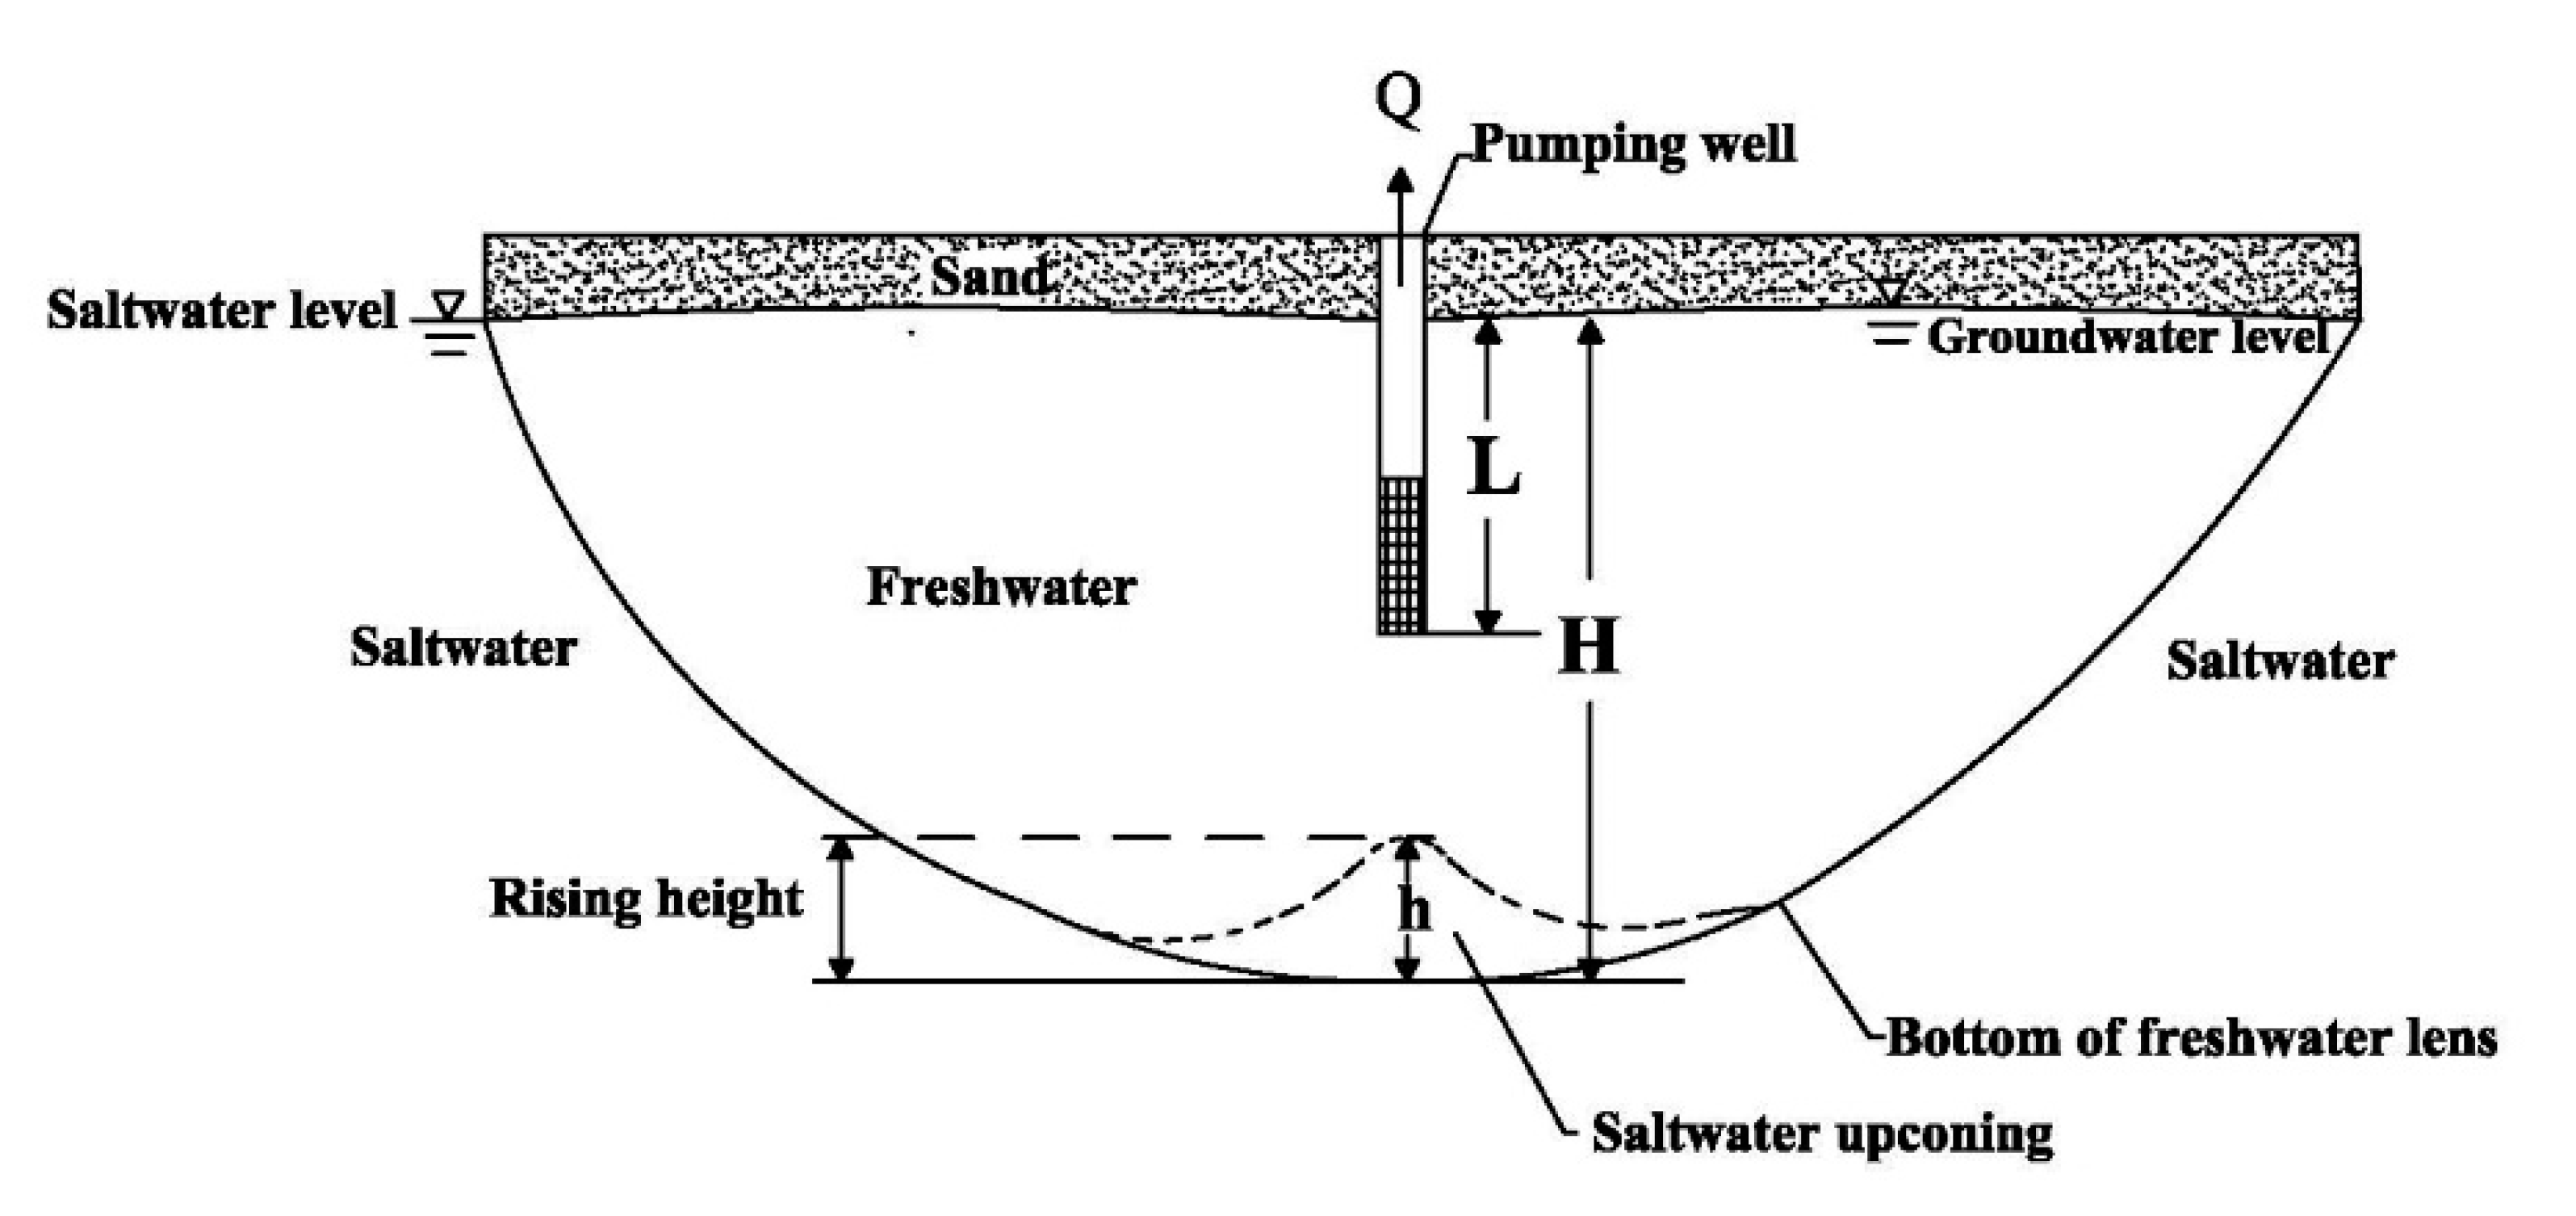
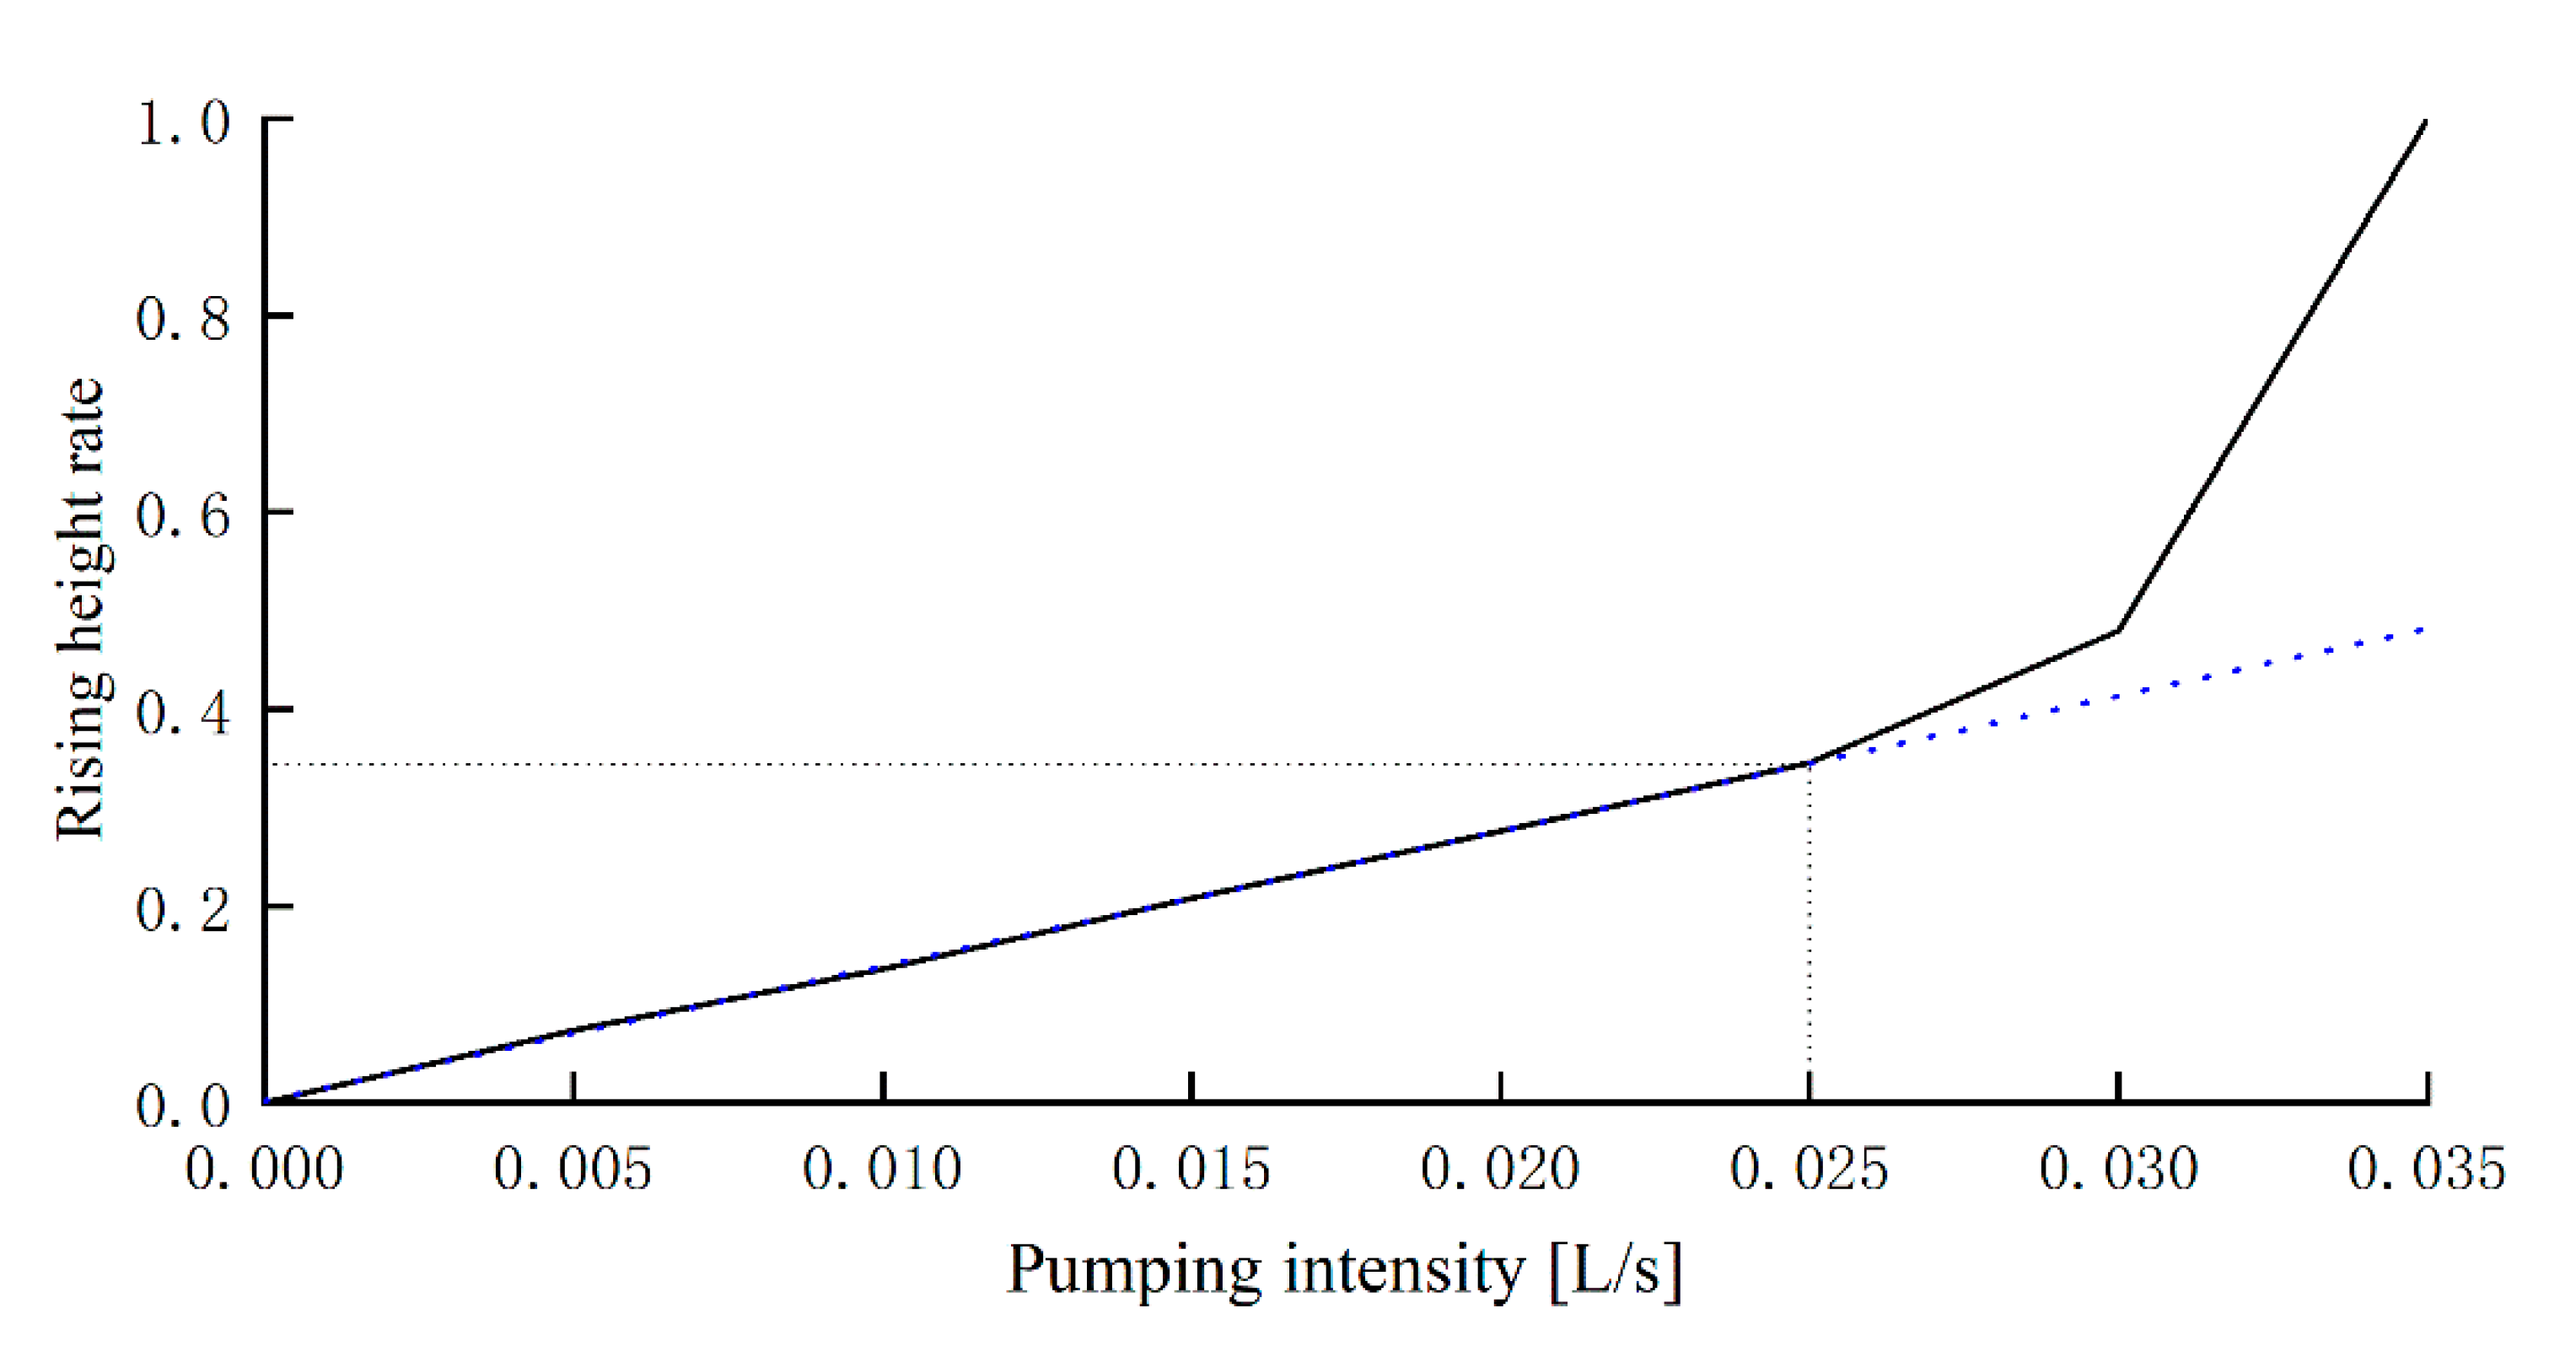
4.3. Influence of Pumping Intensity on the Rising Height Rate of Saltwater Upconing

Aquifer systems that contain freshwater and saltwater are usually stratified; the saltwater with the higher density is located under the freshwater. A groundwater well discharging from the freshwater lens can cause the saltwater to move upwards towards the well. This phenomenon is known as saltwater upconing [21,22]. For the exploitation of freshwater lenses in specific areas, people are mostly concerned about how much pumping intensity should be used for pumping within a certain pumping duration to obtain the largest pumping volume without causing saltwater upconing to invade or impact the pumping wells [23]. Therefore, the determination of the critical pumping intensity and the critical rising height rate Δ (hereinafter referred to as RHR) of the saltwater upconing play an extremely important role in the development and utilization of the freshwater lens. The schematic diagram of the saltwater upconing is shown in Figure 6.
The ratio of the rising height of saltwater upconing to the distance between the pumping well and the initial bottom of the freshwater lens is defined as the RHR of the saltwater upconing, which is expressed mathematically as:
Δ = h H L
where Δ is the RHR of the saltwater upconing, h is the rising height of the saltwater upconing, H is the distance between the seawater level and the initial bottom of the freshwater lens, and L is the distance between the groundwater level and the bottom of the pumping well. When Δ = 1, this means the freshwater lens was broken.
The No.1 pumping well was used for pumping, and a total of seven sets of pumping tests were carried out. Each pumping duration was 300 s, and the pumping intensity was gradually increased. After the completion of each group of tests, rainfall recharge was carried out to restore the initial state of the freshwater lens before the next pumping test was carried out. After each set of tests was completed, the corresponding RHR of the saltwater upconing was calculated, and the correlation between the RHR of the saltwater upconing and the pumping intensity was analyzed. The correlation between the RHR of the saltwater upconing and the pumping intensity is shown in Figure 7.
With a critical pumping intensity of 0.025 L/s, the critical pumping volume was 7.5 L, which accounted for 71.4% of the maximum pumping volume, and the critical RHR of the corresponding saltwater upconing was 0.35. When the pumping intensity was less than the critical pumping intensity, the RHR of the saltwater upconing increased linearly at a small gradient, and when the pumping intensity was greater than the critical pumping intensity, the rising height ratio of the saltwater upconing increased linearly at a great gradient.

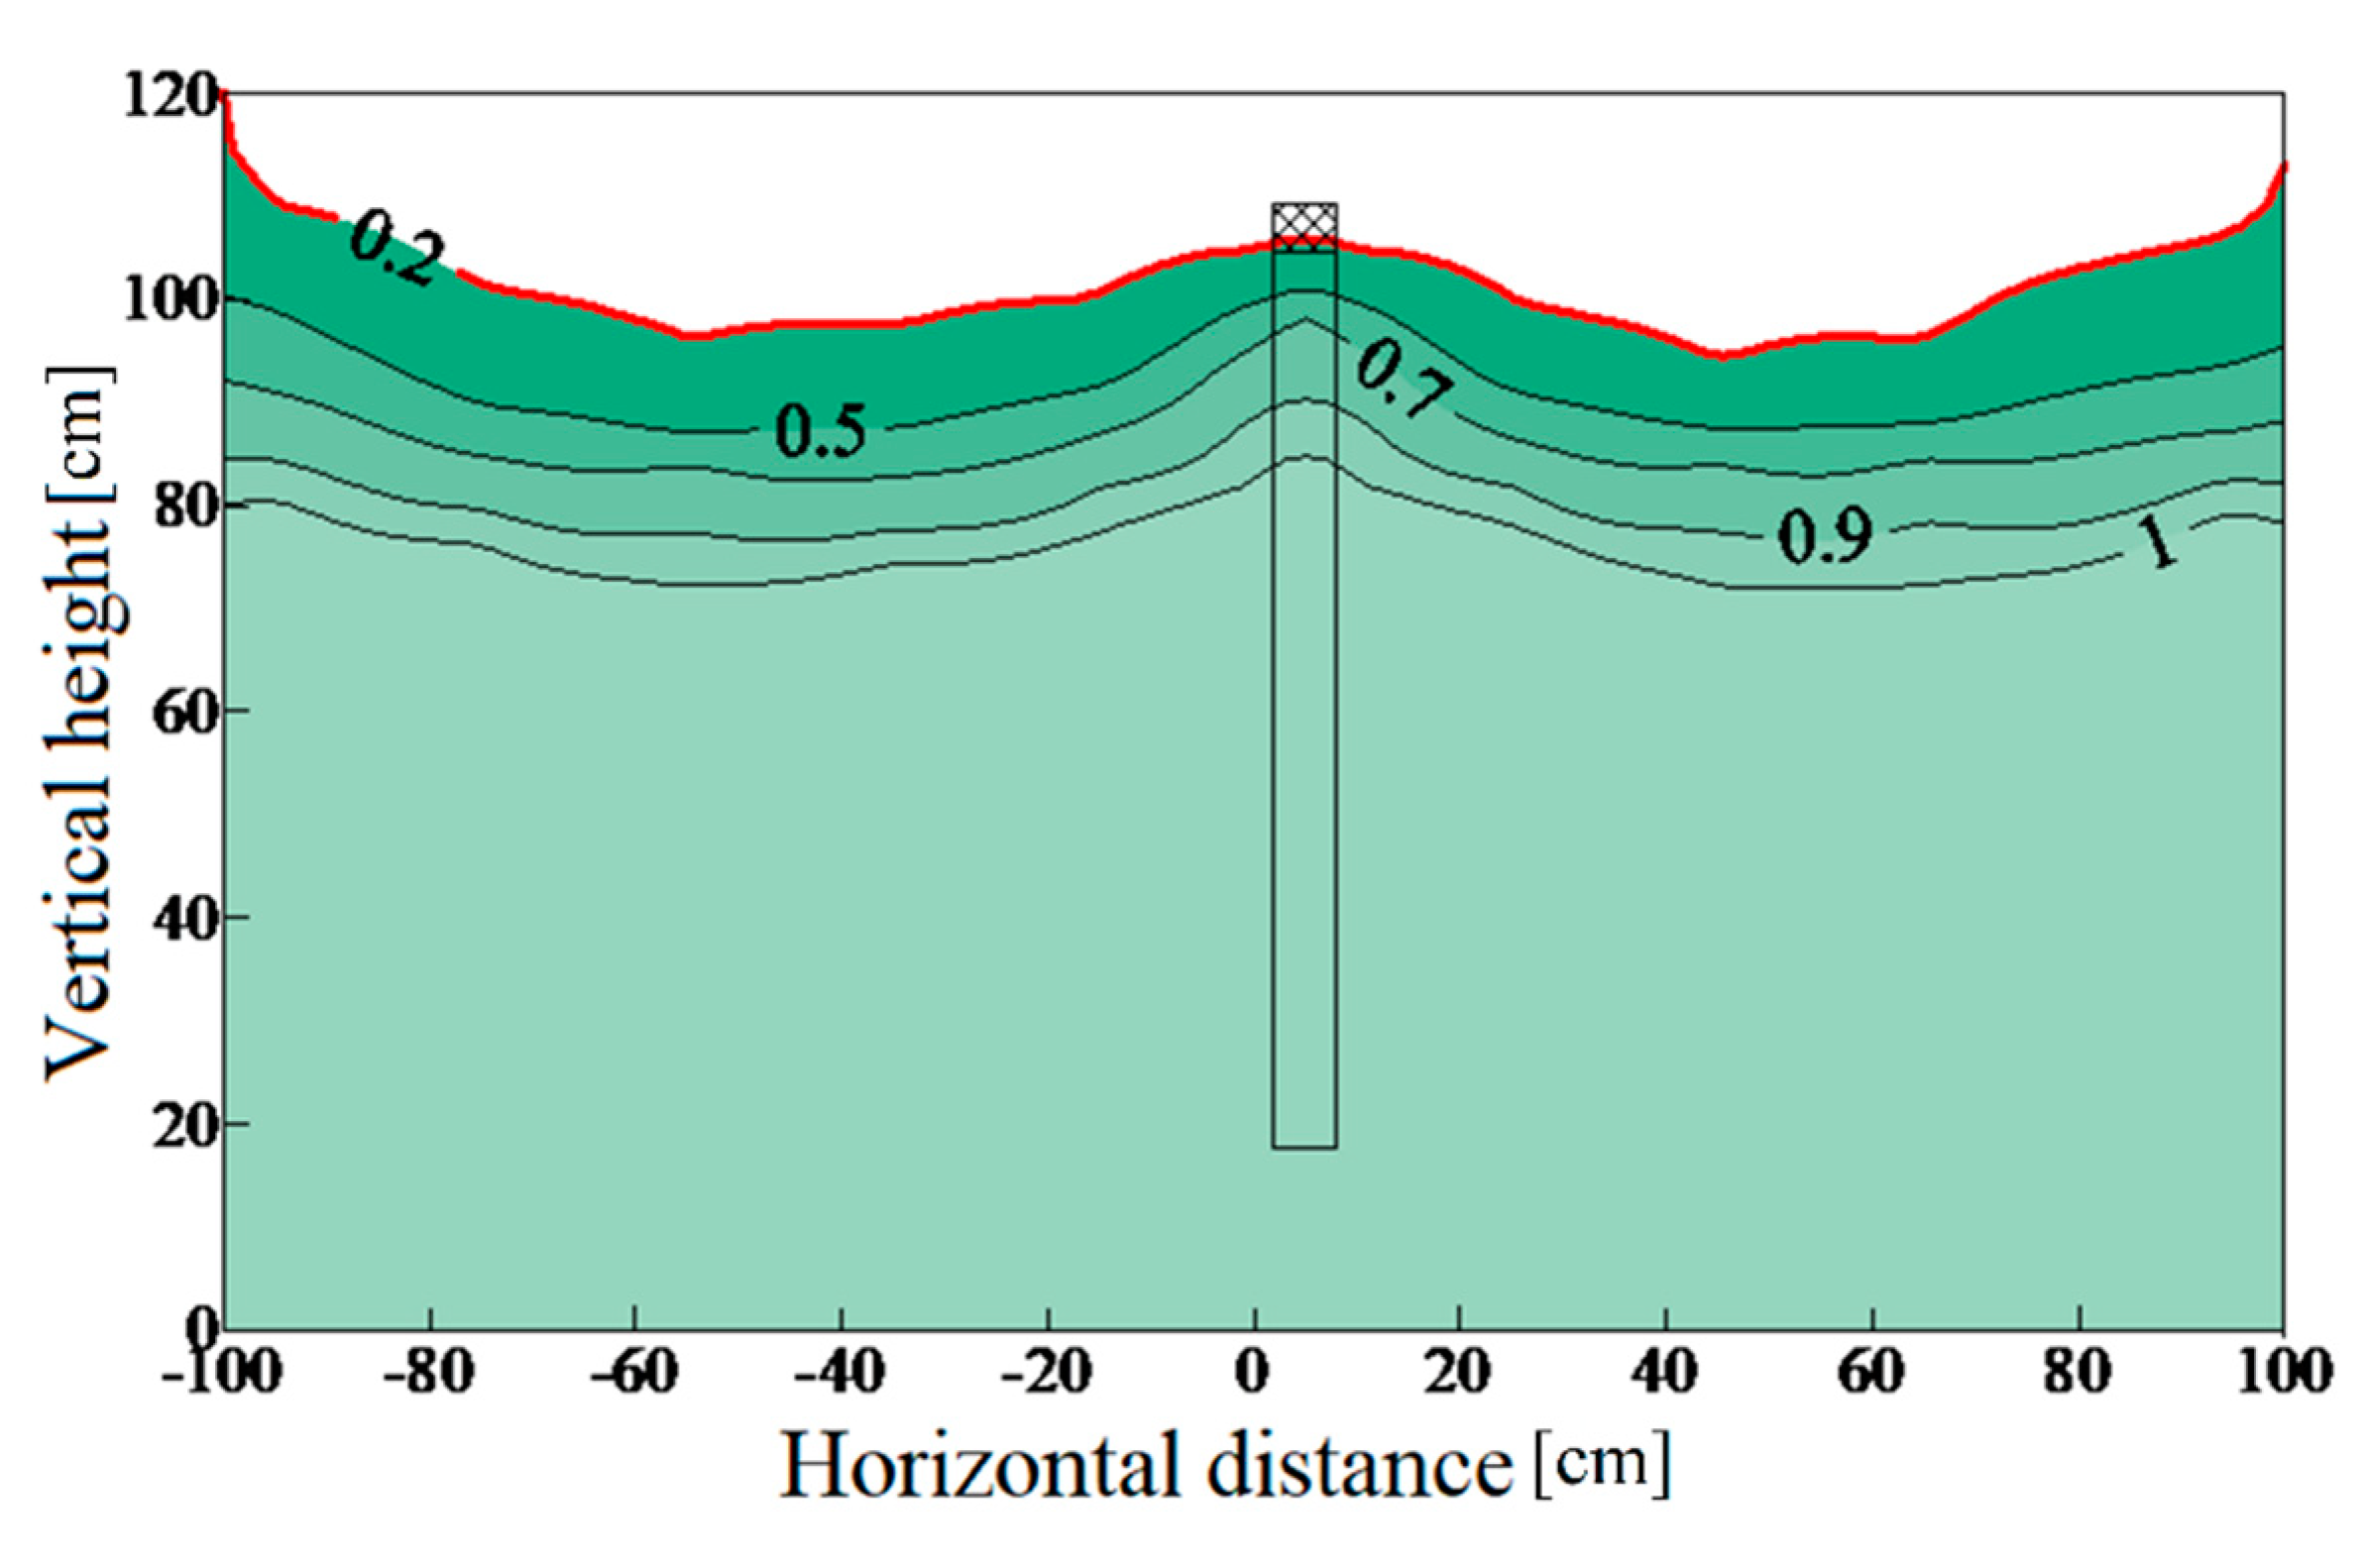
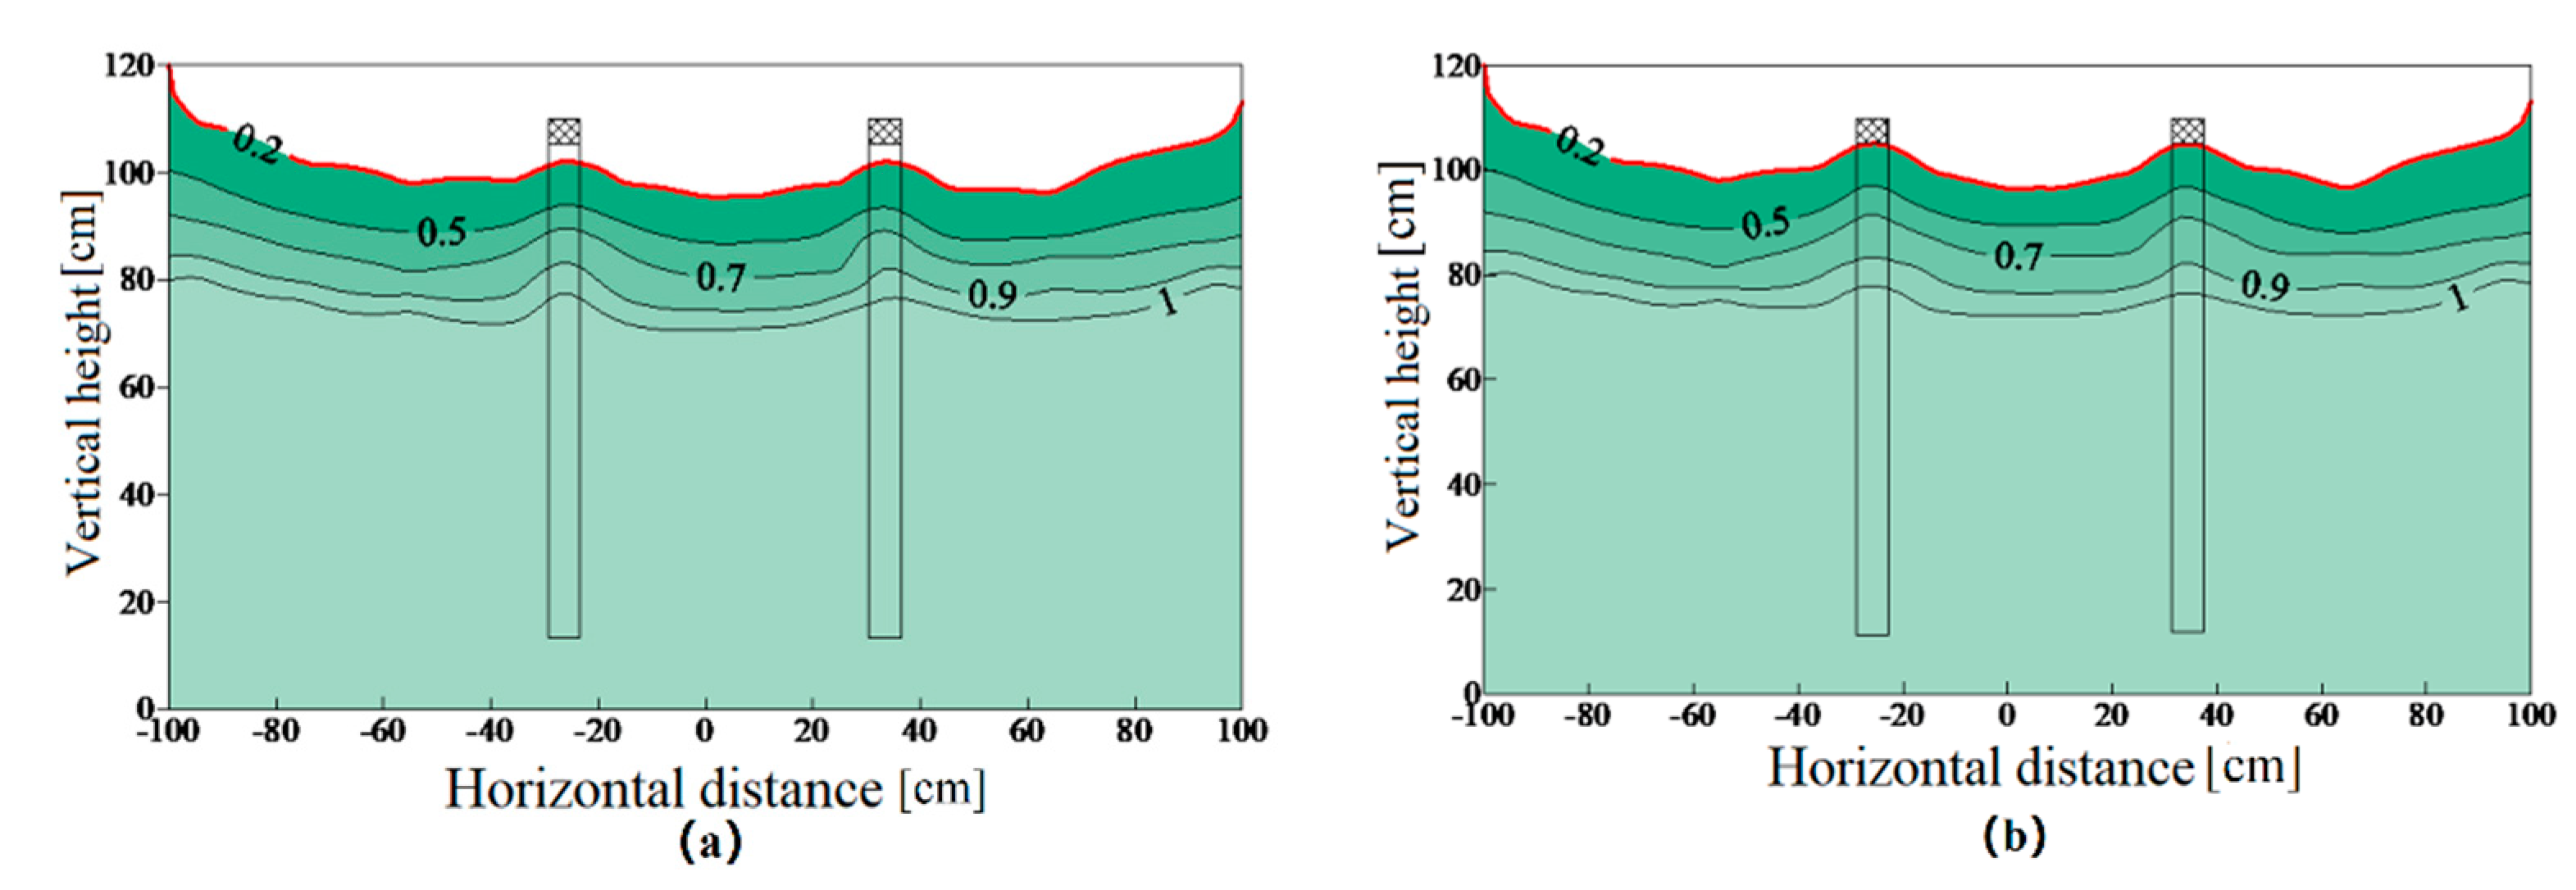
4.4. Influence of Single-Well and Multi-Well Pumping on Freshwater Lens

To analyze the influence of single-well and multi-well pumping on the freshwater lens, schemes of single-well pumping and multi-well pumping with the same pumping intensity were designed.
When the single-well scheme was used for pumping, the No.1 pumping well was used to pump freshwater with an intensity of 0.015 L/s. When the pumping duration reached 600 s, the seawater entered into the well, and the freshwater lens was broken. The maximum pumping volume at that time was 9.0 L, and the EC is shown in Figure 8.
When the multi-well scheme was used for pumping, the No.2 and No.3 pumping wells were used to pump freshwater at the same rate of 0.0075 L/s. When the pumping duration reached 600 s, the measurement showed that the seawater did not enter the pumping well at that time, which means that the freshwater lens was not broken and the pumping well still had supply capacity. The EC distribution is shown in Figure 9a. When the pumping duration reached 740 s, the seawater entered the pumping well and the freshwater lens was broken. At this time, the maximum pumping volume was 11.1 L, and the EC is shown in Figure 9b.
The data of the maximum pumping volume under different pumping methods are shown in Table 4. The test showed that under the same pumping intensity, the pumping duration of the multi-well scheme was longer than that of single-well scheme, and the pumping volume was 23.3% larger than that of single-well scheme, leading to a smaller drawdown in some areas. Single-well pumping was more likely to cause the upward movement of the saltwater upconing, and the freshwater lens was more likely to be broken. For the exploitation of the freshwater lens in the specified area, the multi-well pumping mode is more sustainable in exploitation of the freshwater lens.

5. Conclusions

According to the experiments and analysis in this paper, the following conclusions were drawn:
(1)
For the single-well pumping of freshwater lens, the lower the pumping intensity, the longer the pumping duration, and the better the recovery of the freshwater lens after pumping;
(2)
Under the same pumping duration, when the pumping intensity was less than the critical pumping intensity, the RHR of the saltwater upconing increased linearly at a small gradient, and when the pumping intensity was greater than the critical pumping intensity, the rising height rate of the saltwater upconing increased linearly at a great gradient;
(3)
Under the same pumping intensity, comparing the two pumping sets, the multi-well set had a longer pumping duration with a large volume of water pumped as compared with the single-well set, and the drawdown caused by the multi-well pumping set was smaller in some areas.
As the main, or even the only, freshwater resource in the island, the research on the formation and evolution of the freshwater lens is of great theoretical significance. The saltwater upconing and recovery of island freshwater lenses were studied in the laboratory physical experiment, and the research results can provide a reference for island freshwater exploitation.

Author Contributions

This paper was composed by collaboration among all authors. L.S. designed this study, provided the method, and revised the manuscript. Y.L. prepared the first draft of the manuscript. L.Z. carried out the laboratory test and data analysis. R.W. and P.A.O. participated in the revision of the manuscript. H.L. provided funding support. All authors have read and agreed to the published version of the manuscript.

Funding

This research was funded by the Central University Project “Risk Analysis of the Development and Utilization of Island Freshwater Lenses” (No. B200203046), the Major Innovation and Technology Projects of Shandong Province (No. 2019JZZY020105), Postgraduate Scientific Research and innovation Plan of Jiangsu Provence (No. kycx20_0461), the National Natural Science Foundation for Young Scholars of China (No. 41902261), and the National Natural Science Foundation of China (No. 41971027).

Institutional Review Board Statement

Not applicable.

Informed Consent Statement

Not applicable.

Data Availability Statement

Data is contained within the article.

Acknowledgments

All authors are very grateful to the editor and the anonymous reviewers for their valuable comments, which have greatly improved the paper.

Conflicts of Interest

The authors declare no conflict of interest.

Appendix A

The laboratory physical experiment device (as shown in Figure A1) is divided into four systems: a media system, a water supply system, a drainage system, and a measurement system. The composition of each system is described in Section 3.1. The steps of the physical experiment are as follows:
(1)
Filling the sand medium: The medium sand is put in layers in the sand tank and compacted layer by layer, ensuring that the porosity of the filled sand sample matches that measured in the laboratory. The sand medium has a filling height of 1.3 m.
(2)
Filling the seawater: On both sides, seawater with a chloride concentration of 18 g/L is poured into regulating water tanks. The seawater then flows into the sand tank through the hole in the porous baffle. The sand medium in the sand tank has been saturated by seawater when the water level of the regulating water tanks on both sides is stable at about 1.2 m. The electrical conductivity of a seawater sample collected from a sampling hole in the sand tank’s sidewall is measured. In addition, the electrical conductivity of a water sample with a chloride concentration of 600 mg/L is determined, and this value is used as the boundary value between the freshwater and seawater.
(3)
Rainfall test: When the water supply source switch is switched on, water enters 18 plastic pipes, flows out of the small holes in the plastic pipes, and enters the sand tank, simulating the natural rainfall process. The rainfall experiments consistof 10 sets, and they are repeated every 24 h for 8 min. The thickness of the freshwater lens is measured after each rainfall by measuring the electrical conductivity of the water sample flowing from the sampling hole and observing the height of the water head in a piezometer.
(4)
Pumping test: The process steps of a single-well pumping test and a multi-well pumping test are identical in this paper. Using the single-well pumping test as an example, the pumping intensity is regulated by turning on the pumping well’s switch. The electrical conductivity of the water sample flowing from the pumping well is measured during the pumping test to determine if the freshwater lens is destroyed by the saltwater upconing. When the electrical conductivity of water sample from the pumping well matches that of water sample with the chloride ion concentration of 600 mg/L, it indicates that the freshwater lens has been destroyed by the saltwater upconing. The pumping is turned off at this point, and the electrical conductivity of the water sample from the sampling hole and the waterhead of the piezometer is measured to determine the shape of the freshwater lens and the rising height of the saltwater upconing. Simultaneously, the pumping volume and duration are registered. The freshwater lens should be recharged by rainfall before the next round of pumping tests.
Figure A1. Photo of laboratory physical experiment devices: (a) rainfall device, (b) pumping well, (c) outlet hole of pumping well, (d) water sampling holes, (e) piezometer tube, and (f) sand tank.
Water 13 01137 g0a1

References

  1. Ghyben, B.W. Nota in Verband met de Voorgenomen Putboring nabij Amsterdam. Tijdschr. K. Inst. Ing. 1889, 8–22. [Google Scholar]
  2. Herzberg, A. Die Wasserversorgung einiger Nordseebader. J. Gasbeleucht. Wasserversorg. 1901, 44, 842–844. [Google Scholar]
  3. Zhou, C.Z. Simulation and Exploitation of the Freshwater Lens in Coral Island. J. Logist. Eng. Univ. 2016, 32, 1–10. (In Chinese) [Google Scholar]
  4. Stofberg, S.F.; Essink, G.H.P.O.; Pauw, P.S. Fresh Water Lens Persistence and Root Zone Salinization Hazard Under Temperate Climate. Water Resour. Manag. 2017, 31, 689–702. [Google Scholar] [CrossRef] [Green Version]
  5. Yoshimoto, S.; Ishida, S.; Kobayashi, T. Using hydrogeochemical indicators to interpret groundwater flow and geochemical evolution of a freshwater lens on Majuro Atoll, Republic of the Marshall Islands. Hydrogeol. J. 2020, 28, 1053–1075. [Google Scholar] [CrossRef] [Green Version]
  6. Vandenbohede, A.; Mollema, P.N.; Greggio, N. Seasonal dynamic of a shallow freshwater lens due to irrigation in the coastal plain of Ravenna, Italy. Hydrogeol. J. 2014, 22, 893–909. [Google Scholar] [CrossRef]
  7. Fetter, C.W. Position of the saline water interface beneath oceanic islands. Water Resour. Res. 1972, 8, 1307–1315. [Google Scholar] [CrossRef]
  8. Yang, H.; Shimada, J.; Shibata, T. Freshwater lens oscillation induced by sea tides and variable rainfall at the uplifted atoll island of Minami-Daito, Japan. Hydrogeol. J. 2014, 28, 2105–2114. [Google Scholar] [CrossRef]
  9. Pauw, P.S.; van Baaren, E.S.; Visser, M. Increasing a freshwater lens below a creek ridge using a controlled artificial recharge and drainage system: A case study in the Netherlands. Hydrogeol. J. 2015, 23, 1415–1430. [Google Scholar] [CrossRef] [Green Version]
  10. Houben, G.; Noell, U.; Vassolo, S. The freshwater lens of Benjamín Aceval, Chaco, Paraguay: A terrestrial analogue of an oceanic island lens. Hydrogeol. J. 2014, 22, 1935–1952. [Google Scholar] [CrossRef]
  11. Nativ, R.; Weisbrod, N. Management of a multilayered Coastal aquifer—An Israeli case study. Water Resour. Manag. 1994, 8, 297–311. [Google Scholar] [CrossRef]
  12. Duncan, D. Freshwater under Threat: Pacific Islands; The South Pacific Community Applied Geoscience and Technology Division: Fiji Islands, Suva, 2011. [Google Scholar]
  13. Lee, A.G. 3-D Numerical modeling of freshwater lens on atoll islands. In Proceedings of the Tough Symposium, Berkeley, CA, USA, 12–14 May 2003. [Google Scholar]
  14. Schneider, J.C.; Kruse, S.E. Assessing selected natural and anthropogenic impacts on freshwater lens morphology on small barrier islands: Dog islands and St. George island, Florida, USA. Hydrogeol. J. 2005, 14, 131–145. [Google Scholar] [CrossRef]
  15. Muhammad, N.A.; Prathapar, S.A.; Shafique, M.S. Extracting relatively-fresh groundwater from aquifers underlain by salty groundwater. Agric. Water Manag. 2002, 52, 119–137. [Google Scholar]
  16. Zhou, C.Z.; Fang, Z.D. Numerical simulation and development of the freshwater lens on a coral island. J. Hangzhou Inst. Appl. Eng. 1999, 11, 16–20. (In Chinese) [Google Scholar]
  17. Bower, J.W.; Motz, L.H. Analytical solution for determining the critical condition of saltwater upconing in a leaking artesian aquifer. J. Hydrol. 1999, 221, 43–54. [Google Scholar] [CrossRef]
  18. Dagan, G.; Zeitoun, D.G. Free-surface flow toward a well and interface upconing in stratified aquifers of random conductivity. Water Resour. Res. 1998, 34, 3191–3196. [Google Scholar] [CrossRef]
  19. Stoeckl, L.; Houben, G. Flow dynamics and age stratification of freshwater lenses: Experiments and modeling. J. Hydrol. 2012, 458, 9–15. [Google Scholar] [CrossRef]
  20. Bedekar, V.S.; Memari, S.S. Investigation of transient freshwater storage in island aquifers. J. Contam. Hydrol. 2019, 221, 98–107. [Google Scholar] [CrossRef]
  21. Reilly, T.E.; Goodman, A.S. Analysis of saltwater upconing beneath a pumping well. J. Hydrol. 1987, 89, 169–204. [Google Scholar] [CrossRef]
  22. Pauw, P.S.; van der Zee, S.E.; Leijnse, A.; Oude Essink, G.H. Saltwater Upconing Due to Cyclic Pumping by Horizontal Wells in Freshwater Lenses. Groundwater 2016, 54, 521–531. [Google Scholar] [CrossRef] [PubMed]
  23. Chui, T.F.M.; Terry, J.P. Modeling Fresh Water Lens Damage and Recovery on Atolls After Storm-Wave Washover. Groundwater 2012, 50, 412–420. [Google Scholar] [CrossRef] [PubMed]
Figure 1. Schematic diagram of laboratory physical experiment device. (a) Three-dimensional structure diagram of the experiment device; (b) front-view diagram of the experiment device.
Water 13 01137 g001
Figure 2. Arrangement diagram of pumping wells in sand tank from the top view.
Water 13 01137 g002
Figure 3. Relationship between times of rainfall and thickness of the freshwater lens.
Water 13 01137 g003
Figure 4. EC distribution diagram with different pumping intensity. (a) Pumping intensity is 0.015 L/s; (b) pumping intensity is 0.035 L/s.
Water 13 01137 g004
Figure 5. EC distribution diagram after natural recovery with different pumping intensity. (a) Pumping intensity is 0.015 L/s; (b) pumping intensity is 0.035 L/s.
Water 13 01137 g005
Figure 6. Schematic diagram of the saltwater upconing.
Water 13 01137 g006
Figure 7. The correlation between the RHR of the saltwater upconing and the pumping intensity.
Water 13 01137 g007
Figure 8. EC distribution with single-well pumping.
Water 13 01137 g008
Figure 9. EC distribution with multi-well pumping at different time. (a) EC distribution at 600 s; (b) EC distribution at 740 s.
Water 13 01137 g009
Table 1. The hydraulic property parameters of coral sand and medium sand.
Sand TypePorositySpecific YieldDispersion CoefficientHydraulic Conductivity (m/d)
Coral sand0.530.290.23706.61
Medium sand0.400.210.1621.70
Table 2. Data of the single-well pumping test.
Test NumberPumping Intensity (L/s)Pumping Duration (s)Pumping Volume
(L)
10.0156009.0
20.03530010.5
Table 3. Thickness of freshwater lens under different pumping intensity.
Test NumberPumping Intensity (L/s)Thickness of Freshwater Lens (cm)Thickness of Freshwater Lens after Natural Recovery (cm)
10.01514.719.5
20.03514.518.0
Table 4. The maximum pumping volume under different pumping methods.
Pumping MethodsPumping Intensity (L/s)Pumping Duration (s)Pumping Volume (L)
Single-well pumping0.0156009.0
Multi-well pumping0.01574011.1
Publisher’s Note: MDPI stays neutral with regard to jurisdictional claims in published maps and institutional affiliations.

