Article

Comparative Assessment of Fecal Contamination in Piped-to-Plot Communal Source and Point-of-Drinking Water

by
Jannatul Ferdous
1,2,*,
Rebeca Sultana
2,3,4,
Ridwan Bin Rashid
1,
Sabera Saima
1,
Anowara Begum
1 and
Peter Kjær Mackie Jensen
2
1
Department of Microbiology, University of Dhaka, Dhaka 1000, Bangladesh
2
Copenhagen Center for Disaster Research, Section for Global Health, Department of Public Health, University of Copenhagen, 1014 Copenhagen, Denmark
3
icddr,b, Dhaka 1212, Bangladesh
4
Institute of Health Economics, University of Dhaka, Dhaka 1000, Bangladesh
*
Author to whom correspondence should be addressed.
Water 2021, 13(9), 1139; https://doi.org/10.3390/w13091139
Submission received: 28 December 2020 / Revised: 8 April 2021 / Accepted: 14 April 2021 / Published: 21 April 2021
(This article belongs to the Special Issue Role of Water in the Metabolism and Life of Living Organisms)

Abstract

:
The aim of this study was to compare the water quality of piped-to-plot source water with point-of-drinking water in the households of a low-income urban area in Bangladesh. A total of 430 low-income households and 78 communal sources connected to these households were selected from the East Arichpur area of Dhaka. The water samples were collected from point-of-drinking vessels (household members’ preferred drinking vessels i.e., a mug, glass, or bottle) in households and from linked sources at six-week intervals between September 2014 and December 2015. Water samples were processed using standard membrane filtration and culture methods to quantify E. coli. Analysis of paired data from source and point-of-drinking water collected on the same day showed that fecal contamination increased from source to point-of-drinking water in the households in 51% (626/1236) of samples. Comparison between bottles vs. other wide-mouth vessels (i.e., glasses, mugs, jugs) showed significantly lower odds (p = 0.000, OR = 0.58, (0.43–0.78)) of fecal contamination compared to other drinking vessels. The findings suggest that recontamination and post-treatment contamination at the point of drinking play a significant role in water contamination in households. Hygiene education efforts in the future should target the promotion of narrow-mouth drinking vessels to reduce contamination.

1. Introduction

Diarrheal diseases remained the fifth leading cause of disability-adjusted life-years (DALYs) globally [1]. The Global Burden of Disease (GBD) study in 2019 placed unsafe water as the thirteenth highest risk to health in all ages, fifth in 0–9 year olds, and fourth in 10–24 year olds [2]. Globally, 1.8 billion people lack microbiologically safe drinking water supplies, with the majority (88%) living in low- and middle-income countries (LMICs) [3]. Among the water, sanitation, and hygiene (WASH)-related risks, unsafe water ranks first, leaving unsafe sanitation and handwashing behind [2]. Unsafe drinking water was responsible for 2.6% of DALYs in all age groups, including 7.7% of DALYs in 0–9 year olds [2].
Bangladesh is a low-income country where diarrheal diseases are endemic. The United Nations International Children’s Emergency Fund (UNICEF) reported in 2017 that 71 million people in Bangladesh lack access to safely managed water [4,5]. According to the World Health Organization/UNICEF (WHO/UNICEF) Joint Monitoring Programme, safely managed drinking water is defined as the use of an improved drinking water source that is located on the premises, available when needed, and free from fecal contamination [6]. Furthermore, improved drinking water comes from a source that has some basic infrastructure (piped-to-plot water supply, boreholes, protected dug wells, protected springs, and rainwater) [7]. The Multiple Indicator Cluster Survey conducted in 2019 reported that the services of improved drinking water made the highest (98%) progress compared to sanitation (64%) and handwashing (75%) in Bangladesh [8]. This survey also reported that 48% of households in Bangladesh used safely managed drinking water services [8]. However, this report did not provide specific information on low-income urban communities. Thus, the information on fecal contamination in drinking water for low-income urban communities (classified as slums) remained obscure, except for some sporadic research studies on water quality in rural [9,10] and urban areas [11]. The systematic analysis for GBD on the comparative risk assessment of 84 behavioral, environmental, and occupational risks [12] found that unsafe drinking water, a risk factor for diarrheal diseases, was inversely related to the socio-demographic context. Populations living in low-income urban communities receive much attention in the public health arena due to the rapid growth of low-income urban communities and their vulnerability to diseases. The Sustainable Development Goals (SDGs), also known as Global Goals, adopted by the United Nations member states are a set of recommendations and action plans to end poverty, protect the planet, and ensure that all people enjoy peace and prosperity by 2030 [13]. The SDGs have 17 goals and targets, Target 11.1 being: “by 2030, ensure access for all to adequate, safe and affordable housing and basic services, and upgrade slums” [13]. In Bangladesh, 47% of the urban population lives in slums [14]. In Dhaka City, Bangladesh, 76% of residents have piped-to-plot water connections: 8% with in-house connections and 68% within the yard or plot [15]. However, information on drinking water quality among low-income urban residents who use piped-to-plot water connections remains limited.
In a recent review, Clasen et al. (2015) stated that controlling microbial contamination of in-house drinking water might be an important interim strategy until a safe, reliable piped-in water connection is provided to the household [16]. Researchers have repeatedly observed that the microbiological quality of water can change over the course of collection, transport, home storage, and consumption [17,18,19]. However, there have been very few attempts globally to measure the effect of piped-to-plot water sources on in-house drinking water immediately before consumption. Further research investigating the microbiological quality of drinking water in low-income urban communities will be useful for the SDG database and for this country’s policymakers for disease preventive intervention for the low-income urban residents. Therefore, this study aimed to assess the water quality of a piped-to-plot communal source and point-of-drinking water (i.e., in-house drinking water immediately before consumption using preferred drinking vessels) in a low-income urban community of Bangladesh.

2. Methods and Materials

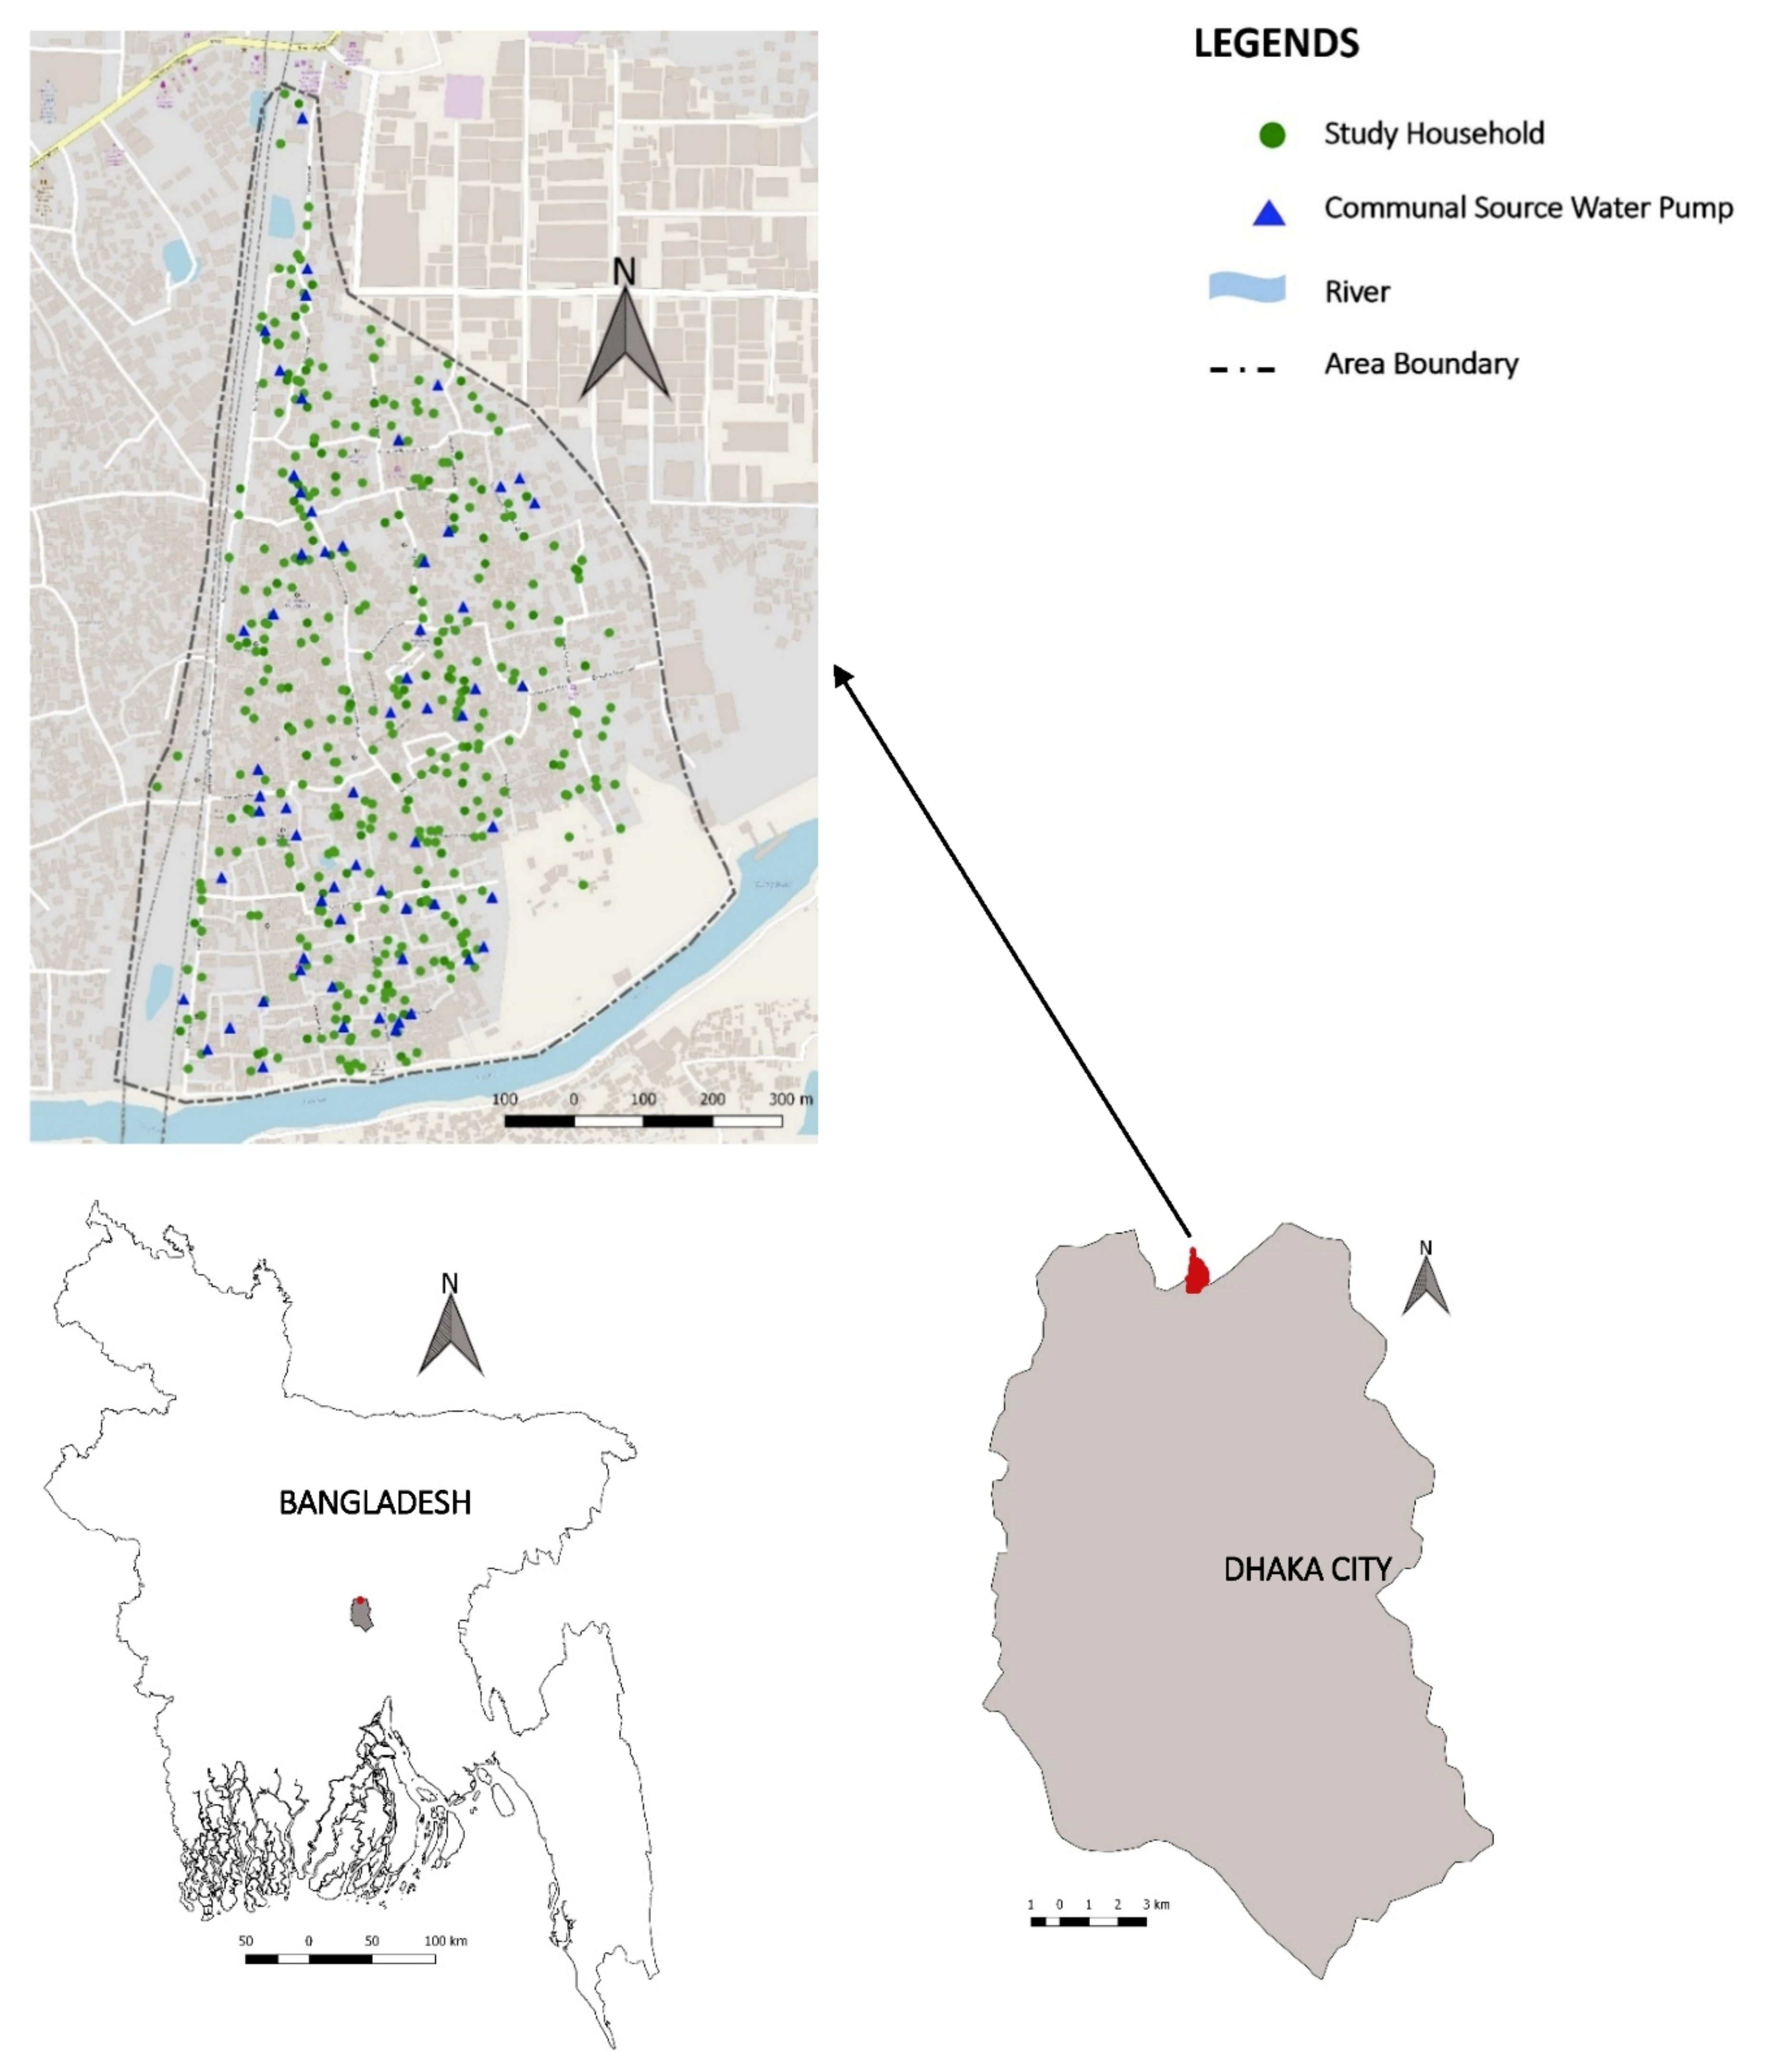
2.1. Study Site and Population

We conducted this study in East Arichpur, located in the Tongi Township of Dhaka City, in Bangladesh (Figure 1). The population density of Arichpur is high (>100,000 residents per km2) [20], and 13,876 households with an approximate population of 55,504 live within a half km2 area [21]. East Arichpur has a history of outbreaks of waterborne diseases, including cholera [20,22]. The Bangladesh Bureau of Statistics defined this community as a low-income urban community [23,24]. Most of the population live in semi-pacca houses (concrete walls and a roof made of tin or wood), sharing water sources and kitchen and toilet facilities that are located in a compound (a cluster of households sharing the same yard and other facilities) setting [21]. The community is surrounded by garment factories, the Bangladesh Small and Cottage Industries Corporation (BSCIC), electronic goods and fan manufacturing factories, and the heavily polluted Turag River (Figure 1).

2.2. Types of Water Sources in Arichpur

Municipal government submersible pumps and private submersible pumps are the primary (99%) piped-to-plot connected communal sources of water for the Arichpur community [21]. The municipal government pump is locally known as WASA, and the private supply is locally known as the submersible pump. The government installed the WASA, and the individual owner/s installed the private submersible pump. Most (90%) of the compounds have piped-to-plot water connections in the yard [21]. The average water collection trip is 1–2 min from the yard to the houses, and the average distance from the tap to the houses is 5–20 m. WASA water is supplied to the households through underground networks of pipes. Submersible pump water is distributed to the households using above-ground networks of pipes. All of the communal sources of our studied households extract groundwater from a depth of >85 m. The areas around the pumps are not usually protected with a wall, and the floor is made of concrete.

2.3. Data Collection

A research team collected water samples from communal sources and point-of-drinking from September 2014 to December 2015 during routine visits at six-week intervals as a part of a longitudinal study of diarrhea incidence and water use [25]. Data collection from December 2014 to February 2015 was interrupted due to political unrest in the country. After baseline data collection, the research team visited each study household to identify its corresponding communal water source. A total of 430 households were enrolled, which were connected to 78 communal sources (Figure 1). The term point-of-drinking was specified for in-house drinking water, instead of the commonly used term point-of-consumption, which broadly refers to water used for various purposes, such as bathing, cooking, hand washing, and drinking. Point-of-drinking water samples were taken from the household members’ preferred drinking vessels (i.e., a mug, glass, bottle, jug, or pitcher), which they filled with drinking water in their accustomed way. The water samples from communal sources were taken directly from taps attached to the communal pumps. In the absence of a direct tap, samples were collected from taps attached to the nearest above-ground reservoir connected to the pump. The households usually collected water from the piped-to-plot taps in temporary storage vessels. Those who used water treatment stored water after treatment. From these temporary vessels, the point-of-drinking vessels were filled with water immediately before consumption. Information on home-based water treatment (i.e., boiling, filtration, adding alum, etc.) was collected from the participants during water sample collection from the point of drinking. The coordinates of sample collection sites (households and communal sources) were obtained using a global positioning system (GPS). Q-GIS software was used to locate the sites on a Google map (Figure 1).

2.4. Microbiological Procedures for Sample Collection and Sample Processing

Water samples (150–200 mL) were collected both at source and point-of-drinking locations. Water samples were collected using pre-sterilized wide-mouth sampling bottles (SPL Life Sciences, Gyeonggi-do, Korea) and transported to the Environmental Microbiology Laboratory, University of Dhaka, maintaining a low temperature in a sample box containing gel ice packs. The water samples were collected in the early morning and transported to the laboratory by a technician within 1–2 h (the laboratory was 15–20 km away from the field site). Microbiological water quality was assessed using standard membrane filtration and culture methods for the detection of Escherichia coli (E. coli). Laboratory technicians filtered 100 mL aliquots of the water samples through white gridded, 0.45 µm pore sized, 47 mm diameter membrane filters (S-Pak, Merck Millipore, Darmstadt, Germany). Membranes were placed on plates of modified Thermotolerant E. coli agar (m-TEC agar, Oxoid, London, UK) and incubated at 44.5 ± 0.5 °C for 18–24 h. Typical reddish-purple or magenta colonies of E. coli were enumerated and recorded as colony forming units (CFUs) per 100 mL of water [26].

2.5. Data Analysis

Water samples were considered uncontaminated if no E. coli were detected (E. coli CFU/100 mL < 1) and contaminated if any E. coli were detected. Sample results were divided into four risk categories using WHO guidelines: low risk/safe (<1 E. coli/100 mL), intermediate risk (1–10 E. coli/100 mL), high risk (11–100 E. coli/100 mL), and very high risk (>100 E. coli/100 mL) for human consumption [7]. Means and medians were calculated for the E. coli concentration. Several univariate logistic regressions were performed to estimate the odds ratios (ORs) and to measure the association of household characteristics (treatment and drinking vessel types) with the presence of E. coli. ORs were also calculated to compare the relative odds of falling into a particular WHO risk group given a particular household characteristic (treatment, household drinking vessel types) [27], where the low risk category was used as the referent. The difference in E. coli concentration between communal source water and point-of-drinking water was calculated to determine changes in water quality on the same day. The difference was calculated by deducting the E. coli concentration of communal sources from the point-of-drinking water E. coli concentration. A positive value indicated in-house contamination, a zero value indicated no-change, and a negative value indicated die-off.

3. Results

A total of 2514 point-of-drinking water samples and 1494 communal source water samples were collected. E. coli was detected in 77% (1926/2514) of the point-of-drinking water samples and 58% (866/1494) of the source water samples (Table 1). Of the point-of-drinking water samples, 13% (340/2514) were treated water samples collected throughout the study period from 27% (115/430) of the study households. The study households used mugs, glasses, bottles, jugs, pitchers, and bodnas (similar to pitcher) as point-of-drinking water vessels. Of the point-of-drinking vessel samples, a mug was the most common vessel (53% (1335/2514)) used to drink water (Table 1).

3.1. Water Quality Assessment by Same-Day Paired Data

In-house contamination was observed in 51% (626/1236) of the same-day paired samples (Table 2). Twenty-six percent (314/1236) of in-house contaminated samples had no detectable E. coli at the communal source; the increase of E. coli varied from intermediate to very high risk (Table 2). In 33% of paired water samples, point-of-drinking had less E. coli (CFU/100 mL) than communal source water (Table 2).

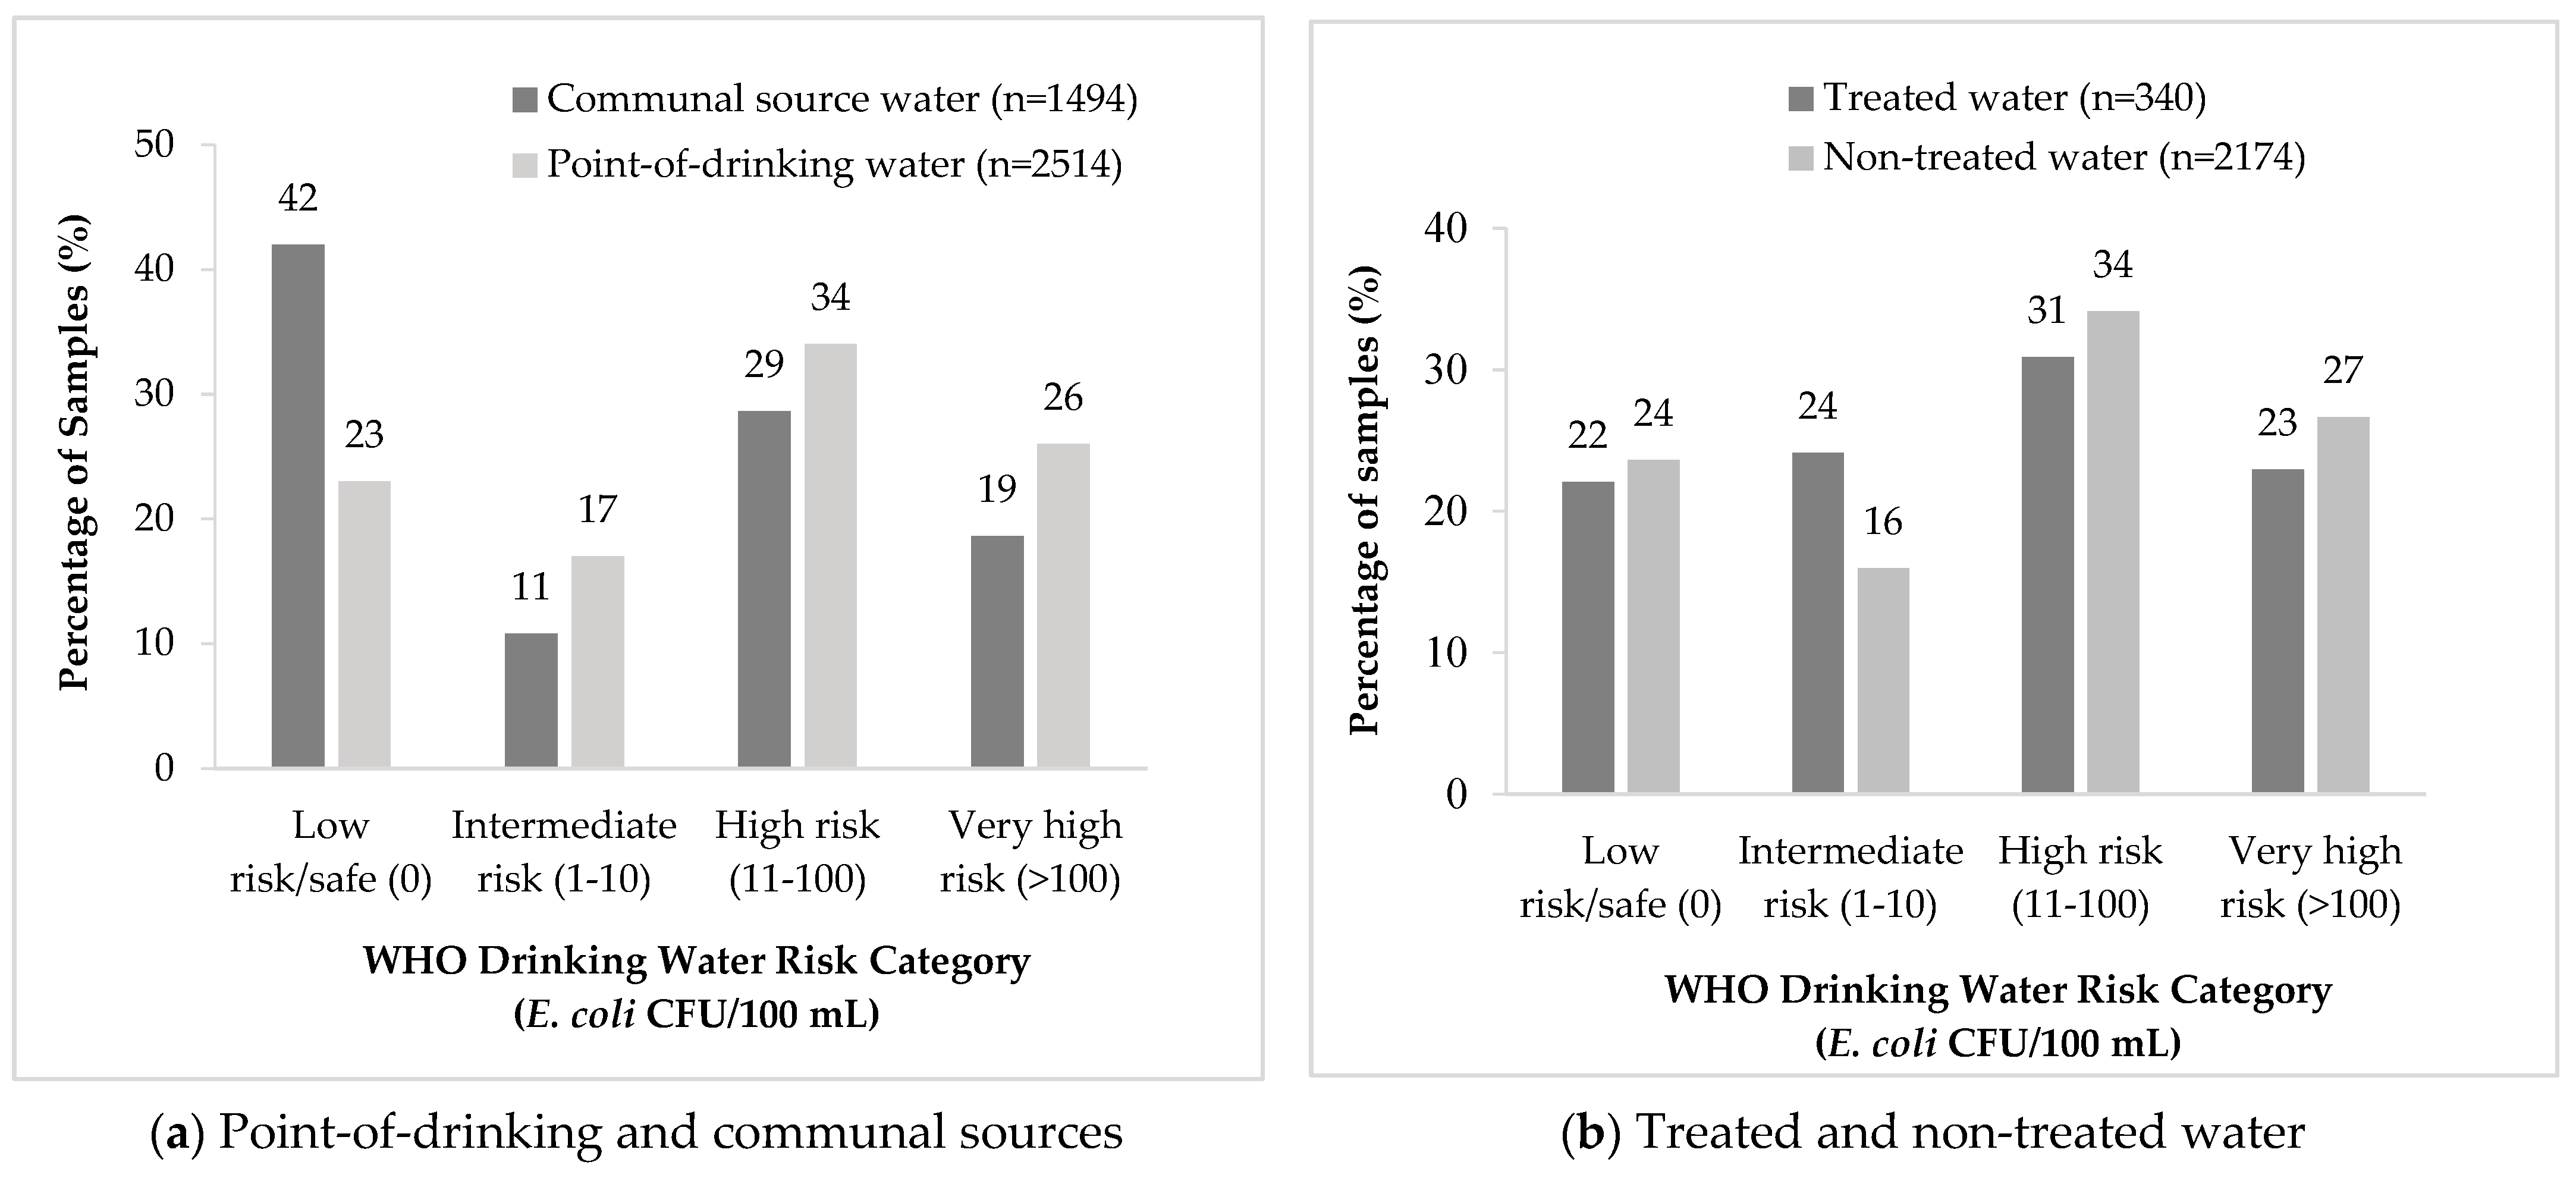
3.2. Water Quality Assessment by WHO Risk Categories

Forty-two percent of the communal source samples had no detectable E. coli or were of low risk, whereas 23% of the point-of-drinking water samples were of similar low risk (Figure 2a). Point-of-drinking water samples made up a higher percentage of samples for the remaining risk categories. The mean and median of the high and very high risk groups for point-of-drinking water were comparatively greater than those of the communal source water (Table 3). The percentage of treated water was higher in intermediate risk groups than non-treated water (Figure 2b). There was no noticeable difference in the mean and median range of E. coli in the treated and non-treated water (Table 3).
Several univariate logistic regressions revealed that, overall, there was no significant change in the odds of contamination between treated and non-treated samples (p = 0.597, OR = 1.08, 95% CI = (0.80–1.46)). When controlling for drinking vessels, there were significantly lower odds of contamination for bottles compared to other vessels (p = 0.000, OR = 0.58, 95% CI = (0.43–0.78)). The odds of falling into risk groups were also significantly lower for bottles compared to other vessels, using the low risk/safe group as the referent (Table 4).

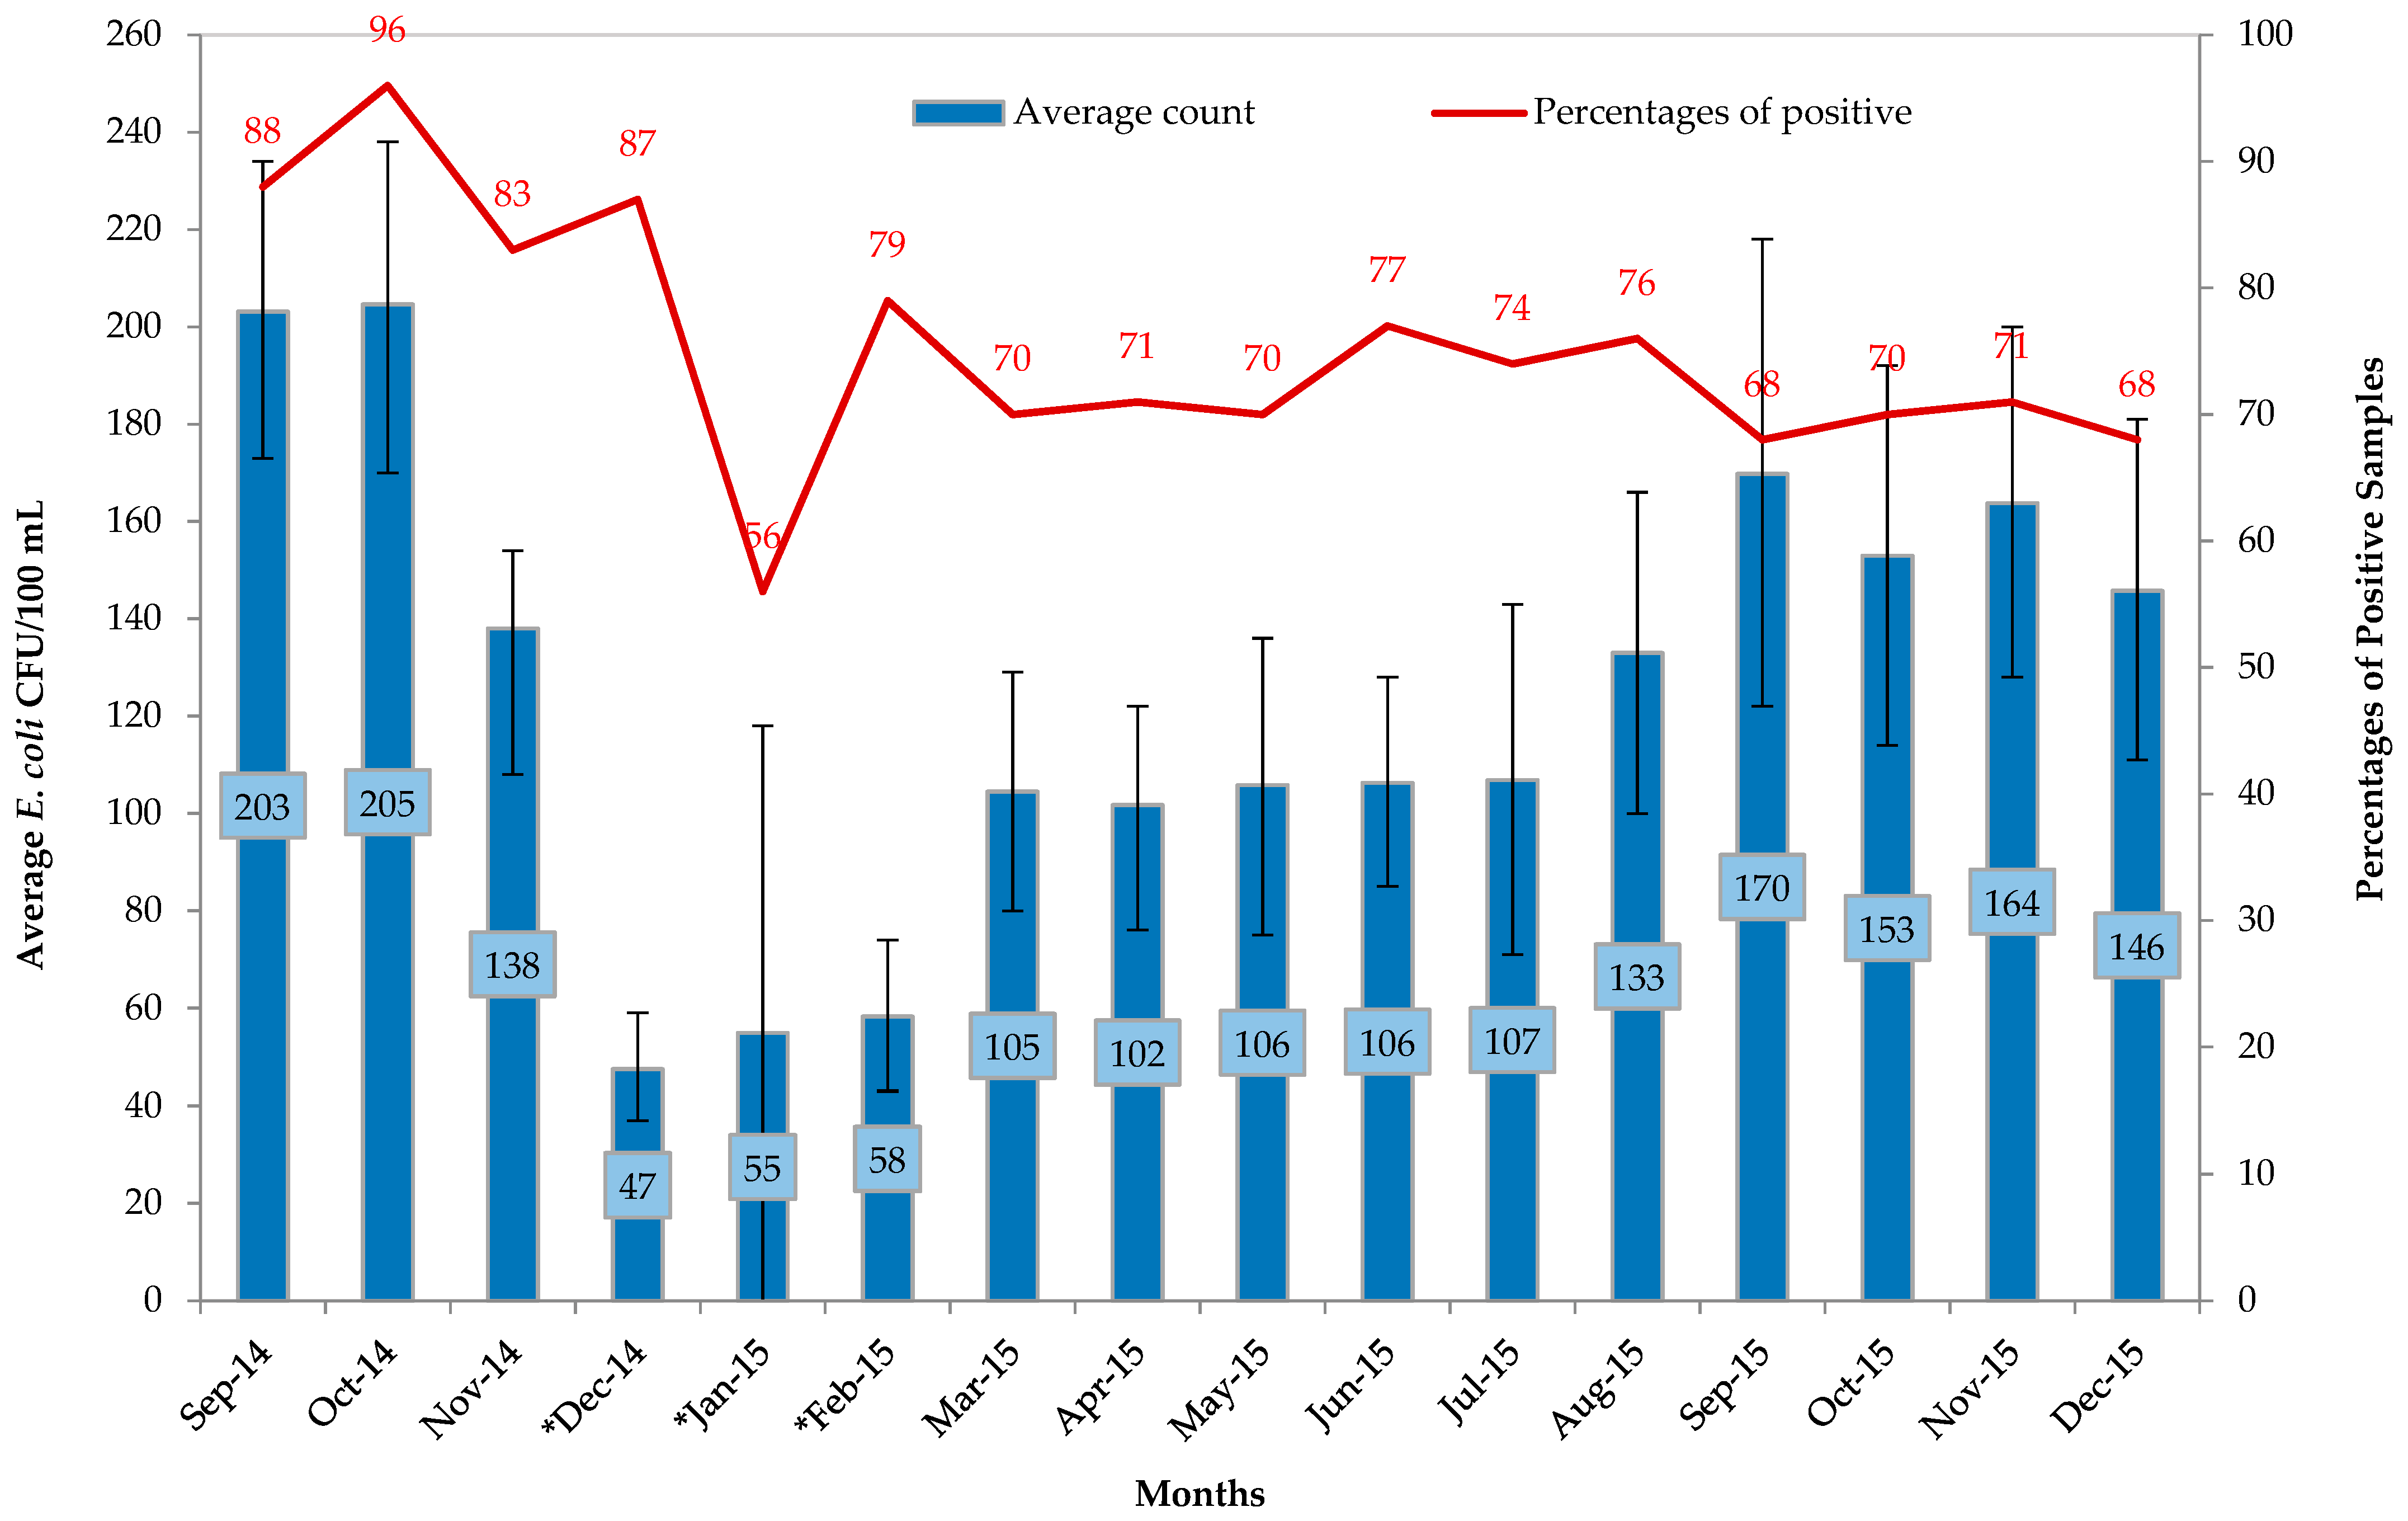
3.3. Temporal Variability of E. coli

Average E. coli count concentrations remained both consistent and elevated from March to July (~100 CFU/100 mL), followed by a rise in concentrations in August through December of 2015. (Figure 3). However, the percentage of positive samples did not increase during this same time period.

4. Discussion

E. coli contamination was higher in the point-of-drinking water samples than communal source water in the study households. The presence of E. coli in point-of-drinking water after treatment suggests that post-treatment contamination has occurred. Bottles, the narrow mouth point-of-drinking vessels, were most likely to protect drinking water from E. coli contamination. The average concentration of E. coli in point-of-drinking remained in the very high risk group for most of the year. While the scientific literature on residents of low-income urban communities was underdeveloped compared to that of urban residents [28], this study may have educed useful knowledge on the drinking water quality of residents of low-income urban communities.
Similar to this study, other studies [17,29,30] have reported higher contamination of water in the household (i.e., point-of-drinking) compared to public sources (i.e., communal source). The absence of E. coli in the communal source and the presence of E. coli within the connected household in same-day water samples revealed that communal source water might not have influenced household drinking water contamination. The higher increase of E. coli count in the point-of-drinking water than in the communal source water in the same-day samples implied that in-house contamination and/or recontamination was possibly responsible for elevated water contamination in households. Poor hygiene practices might have contributed to the contamination of drinking water in the households through several pathways e.g., dirty hands [29,30], dirty drinking vessels [31,32], and flies [33,34,35].
The presence of E. coli in the majority (78%) of drinking water samples after treatment at home, particularly after boiling, also signifies that post-treatment contamination within households might be an important attributing factor of point-of-drinking water contamination. The fecal contamination within kitchen environments might have contributed to drinking water through hands, kitchen utensils [36,37], cutting boards [38], dish washing places [39], and floors [40]. Improving hygiene practices, including kitchen hygiene (e.g., hand hygiene, covering kitchen pans, washing dirty vessels), might help reducing post-contamination [41]. Careful management of post-treated water is an important behavior that the household should adopt to prevent contamination of point-of-drinking water.
In this study, more than half of the positive samples belonged to the high risk and very high risk groups, according to the WHO categories. In terms of temporal trends, average E. coli concentrations of household drinking water quality were elevated year-round, except for a narrow window from December 2014 to March 2015, which was the cold and dry season in Bangladesh. This trend coincides with a household-level study conducted in the urban slums of Dhaka and an adjacent rural site, which reported that the seasonal peaks of diarrhea are during March–May (pre-monsoon) and September–November (post-monsoon) [42]. Seasonal peaks of cholera in Dhaka also coincide with this peak during March–May (pre-monsoon) and September–November (post-monsoon) [43]. Cholera [20] and other waterborne diseases [22] are known to be endemic in Arichpur, including our study area. The elevated concentration of E. coli in household drinking water suggests that remedial action for fecal contamination to improve the water quality throughout the seasons is an urgent priority.
Our study found that the widely used vessels in the households were mugs, glasses, and bottles. The lower odds of fecal contamination for bottles compared to other drinking vessels imply that fecal contamination occurred less frequently in bottles. Thus, bottles might be safer to use for drinking water than other mugs and glasses. Our study finding was asserted by Jensen et al. (2002), who provided a five-week intervention using narrow-necked water pitchers to avoid water recontamination (e.g., through utensils or hands from retrieving water) within the households and found that in-house water quality improved significantly [44]. The formative study findings of the mother study [21] found that, when household members used a bottle, they usually collected water directly from the tap and then drank from the bottle, and when they used a glass or mug for drinking, they usually collected water from an intermediate storage vessel (Rebeca Sultana, unpublished data). These practices might have led to less fecal contamination in bottled water.
This study’s findings on water quality and fecal contamination could be useful for the other low-income communities (classified as slums) of Bangladesh, since these communities of this country have similar infrastructural arrangements [23,24]. The findings also revealed a critical insight, namely that, despite the government and international organizations’ numerous improvement efforts in water, sanitation, and hygiene infrastructure, the achievement of water quality improvement in low-income urban communities remains sub-optimal. Hence, the findings of this study could be useful for defining strategies to achieve (SDG) Target 11.1: “by 2030 ensure access for all to adequate, safe and affordable housing and basic services, and upgrade slums”.
One of our study’s limitations is that we found the majority (>70%) of treated drinking water to be contaminated. This might be the result of self-reporting bias, as our study did not cross-check the provided information with observation. However, our study findings were consistent with those from a study in Peru, which found that the effect of specific types of treatment (boiling or filtration) did not sufficiently change the water quality in drinking cups [34].

5. Conclusions

From our study, we can conclude that the provision of piped-to-plot water sources did not ensure safe drinking water at the point of drinking in the household. Fecal contamination remains a common source of water quality deterioration in households, particularly at the point of drinking. Additionally, the treatment of drinking water proved ineffective, possibly due to compromised kitchen hygiene practices. Future studies should include formative research to explore the reasons and motivation behind different hygiene practices, including kitchen hygiene. Thus, to reduce domestic transmission of fecal–oral pathogens, hygiene education efforts should aim to encourage improved kitchen hygiene practices, including repeated cleaning of drinking vessels, safe handling of drinking water after treatment, and promotion of narrow-mouth drinking vessels.

Author Contributions

J.F. contributed in Conceptualization, Data curation, Formal analysis, Investigation, Methodology, Visualization, and Writing—original draft; R.S. in Formal analysis, Writing—Review & Editing, Visualization, and Funding acquisition; R.B.R. in Conceptualization and Writing—Review & Editing; S.S. in Writing—Review & Editing; A.B. in Resources, Supervision, Project administration, and Writing—Review & Editing; and P.K.M.J. in Writing—Review & Editing, Resources, Supervision, Project administration, and Funding acquisition. All authors have read and agreed to the published version of the manuscript.

Funding

This study was supported by the project entitled Combating Cholera Caused by Climate Change in Bangladesh, C5 (Grant no. 12-040KU) of the Danish International Development Agency (DANIDA).

Institutional Review Board Statement

The Ethical Review Committee of icddr,b approved the study protocol (PR-14006, approved on: 19 February 2014).

Informed Consent Statement

The data collection team obtained written informed consent from participants included in this study.

Data Availability Statement

Data is contained within the article.

Acknowledgments

We specially thank Christina Christensen for statistical help. We thank the research assistants Akhtarujjaman and Sheikh Shariful Islam of icddr,b who conducted the field work for this study and helped in field data clarification. We thank the laboratory assistants Mashud Parvez and Rajib Hossain of the Environmental Microbiology Laboratory, University of Dhaka, for their continuous support. Rebeca Sultana from icddr,b is a co-author, and icddr,b acknowledges the governments of Bangladesh, Canada, Sweden, and the UK for providing core/unrestricted support to icddr,b.

Conflicts of Interest

The authors declare no conflict of interest. The funders had no role in the design of the study; in the collection, analyses, or interpretation of data; in the writing of the manuscript, or in the decision to publish the results.

References

  1. Vos, T.; Lim, S.S.; Abbafati, C.; Abbas, K.M.; Abbasi, M.; Abbasifard, M.; Abbasi-Kangevari, M.; Abbastabar, H.; Abd-Allah, F.; Abdelalim, A. Global burden of 369 diseases and injuries in 204 countries and territories, 1990–2019: A systematic analysis for the Global Burden of Disease Study 2019. Lancet 2020, 396, 1204–1222. [Google Scholar] [CrossRef]
  2. Murray, C.J.; Aravkin, A.Y.; Zheng, P.; Abbafati, C.; Abbas, K.M.; Abbasi-Kangevari, M.; Abd-Allah, F.; Abdelalim, A.; Abdollahi, M.; Abdollahpour, I. Global burden of 87 risk factors in 204 countries and territories, 1990–2019: A systematic analysis for the Global Burden of Disease Study 2019. Lancet 2020, 396, 1223–1249. [Google Scholar] [CrossRef]
  3. Bain, R.; Cronk, R.; Hossain, R.; Bonjour, S.; Onda, K.; Wright, J.; Yang, H.; Slaymaker, T.; Hunter, P.; Pruss-Ustun, A.; et al. Global assessment of exposure to faecal contamination through drinking water based on a systematic review. Trop. Med. Int. Health 2014, 19, 917–927. [Google Scholar] [CrossRef] [PubMed] [Green Version]
  4. UNICEF. Progress on Drinking Water, Sanitation and Hygiene. Available online: https://www.unicef.org/publications/files/Progress_on_Drinking_Water_Sanitation_and_Hygiene_2017.pdf (accessed on 12 June 2020).
  5. WHO; Unicef. Progress on Drinking Water Sanitation and Hygiene: 2017 Update and SDG Baselines. Available online: https://www.who.int/mediacentre/news/releases/2017/launch-version-report-jmp-water-sanitation-hygiene.pdf (accessed on 10 December 2020).
  6. World Health Organization. Safely Managed Drinking Water: Thematic Report on Drinking Water 2017. Available online: https://apps.who.int/iris/bitstream/handle/10665/325897/9789241565424-eng.pdf (accessed on 28 December 2020).
  7. WHO. Guidelines for Drinking-Water Quality. Available online: http://www.who.int/water_sanitation_health/publications/2011/9789241548151_toc.pdf (accessed on 14 January 2020).
  8. Bangladesh Bureau of Statistics. Progotir Pathey Bangladesh, Multiple Indicator Cluster Survey. 2019. Available online: https://www.unicef.org/bangladesh/en/reports/progotir-pathey-bangladesh (accessed on 17 February 2020).
  9. Hoque, B.A.; Hallman, K.; Levy, J.; Bouis, H.; Ali, N.; Khan, F.; Khanam, S.; Kabir, M.; Hossain, S.; Alam, M.S. Rural drinking water at supply and household levels: Quality and management. Int. J. Hyg. Environ. Health 2006, 209, 451–460. [Google Scholar] [CrossRef]
  10. Wardrop, N.A.; Hill, A.G.; Dzodzomenyo, M.; Aryeetey, G.; Wright, J.A. Livestock ownership and microbial contamination of drinking-water: Evidence from nationally representative household surveys in Ghana, Nepal and Bangladesh. Int. J. Hyg. Environ. Health 2018, 221, 33–40. [Google Scholar] [CrossRef]
  11. Talukdar, P.K.; Rahman, M.; Rahman, M.; Nabi, A.; Islam, Z.; Hoque, M.M.; Endtz, H.P.; Islam, M.A. Antimicrobial resistance, virulence factors and genetic diversity of Escherichia coli isolates from household water supply in Dhaka, Bangladesh. PLoS ONE 2013, 8, e61090. [Google Scholar] [CrossRef] [Green Version]
  12. Gakidou, E.; Afshin, A.; Abajobir, A.A.; Abate, K.H.; Abbafati, C.; Abbas, K.M.; Abd-Allah, F.; Abdulle, A.M.; Abera, S.F.; Aboyans, V. Global, regional, and national comparative risk assessment of 84 behavioural, environmental and occupational, and metabolic risks or clusters of risks, 1990–2016: A systematic analysis for the Global Burden of Disease Study 2016. Lancet 2017, 390, 1345–1422. [Google Scholar] [CrossRef] [Green Version]
  13. Sustainable Development Goals-Goal 11: Sustainable Cities and Communities. Available online: https://www.undp.org/content/undp/en/home/sustainable-development-goals/goal-11-sustainable-cities-and-communities.html (accessed on 24 December 2020).
  14. Trading Economics. Bangladesh-Population Living In Slums. Available online: https://tradingeconomics.com/bangladesh/population-living-in-slums-percent-of-urban-population-wb-data.html (accessed on 17 February 2020).
  15. Haque, S.S.; Yanez-Pagans, M.; Arias-Granada, Y.; Joseph, G. Water and sanitation in Dhaka slums: Access, quality, and informality in service provision. Water Int. 2020, 45, 791–811. [Google Scholar] [CrossRef]
  16. Clasen, T.F.; Alexander, K.T.; Sinclair, D.; Boisson, S.; Peletz, R.; Chang, H.H.; Majorin, F.; Cairncross, S. Interventions to improve water quality for preventing diarrhoea. Cochrane Database Syst. Rev. 2015. [Google Scholar] [CrossRef]
  17. Han, A.M.; Oo, K.N.; Midorikawa, Y.; Shwe, S. Contamination of drinking water during collection and storage. Trop. Geogr. Med. 1989, 41, 138–140. [Google Scholar]
  18. Wright, J.; Gundry, S.; Conroy, R. Household drinking water in developing countries: A systematic review of microbiological contamination between source and point-of-use. Trop. Med. Int. Health 2004, 9, 106–117. [Google Scholar] [CrossRef] [Green Version]
  19. Gundry, S.W.; Wright, J.A.; Conroy, R.; Du Preez, M.; Genthe, B.; Moyo, S.; Mutisi, C.; Ndamba, J.; Potgieter, N. Contamination of drinking water between source and point-of-use in rural households of South Africa and Zimbabwe: Implications for monitoring the Millennium Development Goal for water. Water Pract. Technol. 2006, 1, wpt2006032. [Google Scholar] [CrossRef]
  20. Azman, A.S.; Lessler, J.; Satter, S.M.; Mckay, M.V.; Khan, A.; Ahmed, D.; Gurley, E.S. Tracking cholera through surveillance of oral rehydration solution sales at pharmacies: Insights from urban Bangladesh. PLoS Negl. Trop. Dis. 2015, 9, e0004230. [Google Scholar] [CrossRef]
  21. Sultana, R.; Tamason, C.C.; Carstensen, L.S.; Ferdous, J.; Hossain, Z.Z.; Begum, A.; Jensen, P.K.M. Water usage, hygiene and diarrhea in low-income urban communities—A mixed method prospective longitudinal study. MethodsX 2019, 6, 2822–2837. [Google Scholar] [CrossRef]
  22. Gurley, E.S.; Hossain, M.J.; Paul, R.C.; Sazzad, H.M.; Islam, M.S.; Parveen, S.; Faruque, L.I.; Husain, M.; Ara, K.; Jahan, Y.; et al. Outbreak of hepatitis E in urban Bangladesh resulting in maternal and perinatal mortality. Clin. Infect. Dis. 2014, 59, 658–665. [Google Scholar] [CrossRef] [Green Version]
  23. Angeles, G.; Lance, P.; Barden-O’Fallon, J.; Islam, N.; Mahbub, A.Q.M.; Nazem, N.I. The 2005 census and mapping of slums in Bangladesh: Design, select results and application. Int. J. Health Geogr. 2009, 8, 32. [Google Scholar] [CrossRef] [Green Version]
  24. Islam, N. Slums of Urban Bangladesh: Mapping and Census, 2005; United States Agency for International Development: Dhaka, Bangladesh, 2006.
  25. Carstensen, L.S.; Tamason, C.C.; Sultana, R.; Tulsiani, S.M.; Phelps, M.D.; Gurley, E.S.; Mackie Jensen, P.K. The Cholera Phone: Diarrheal Disease Surveillance by Mobile Phone in Bangladesh. Am. J. Trop. Med. Hyg. 2019, 100, 510–516. [Google Scholar] [CrossRef] [Green Version]
  26. United States Environmental Protection Agency. Method 1603: Escherichia coli (E. coli) in Water by Membrane Filtration Using Modified membrane-Thermotolerant Escherichia coli Agar (Modified mTEC). Available online: https://www.epa.gov/sites/production/files/2015-08/documents/method_1603_2009.pdf (accessed on 27 August 2020).
  27. Szumilas, M. Explaining odds ratios. J. Can. Acad. Child Adolesc. Psychiatry 2010, 19, 227. [Google Scholar]
  28. Ezeh, A.; Oyebode, O.; Satterthwaite, D.; Chen, Y.F.; Ndugwa, R.; Sartori, J.; Mberu, B.; Melendez-Torres, G.J.; Haregu, T.; Watson, S.I.; et al. The history, geography, and sociology of slums and the health problems of people who live in slums. Lancet 2017, 389, 547–558. [Google Scholar] [CrossRef]
  29. Schmidt, W.-P.; Cairncross, S. Household water treatment in poor populations: Is there enough evidence for scaling up now? Environ. Sci. Technol. 2009, 43, 986–992. [Google Scholar] [CrossRef]
  30. Cairncross, S.; Blumenthal, U.; Kolsky, P.; Moraes, L.; Tayeh, A. The public and domestic domains in the transmission of disease. Trop. Med. Int. Health 1996, 1, 27–34. [Google Scholar] [CrossRef] [Green Version]
  31. Roberts, L.; Chartier, Y.; Chartier, O.; Malenga, G.; Toole, M.; Rodka, H. Keeping clean water clean in a Malawi refugee camp: A randomized intervention trial. Bull. World Health Organ. 2001, 79, 280–287. [Google Scholar]
  32. Heitzinger, K.; Rocha, C.A.; Quick, R.E.; Montano, S.M.; Tilley, D.H., Jr.; Mock, C.N.; Carrasco, A.J.; Cabrera, R.M.; Hawes, S.E. “Improved” But Not Necessarily Safe: An Assessment of Fecal Contamination of Household Drinking Water in Rural Peru. Am. J. Trop. Med. Hyg. 2015, 93, 501–508. [Google Scholar] [CrossRef] [Green Version]
  33. Khalil, K.; Lindblom, G.-B.; Mazhar, K.; Kaijser, B. Flies and water as reservoirs for bacterial enteropathogens in urban and rural areas in and around Lahore, Pakistan. Epidemiol. Infect. 1994, 113, 435–444. [Google Scholar] [CrossRef] [Green Version]
  34. Oswald, W.E.; Lescano, A.G.; Bern, C.; Calderon, M.M.; Cabrera, L.; Gilman, R.H. Fecal contamination of drinking water within peri-urban households, Lima, Peru. Am. J. Trop. Med. Hyg. 2007, 77, 699–704. [Google Scholar] [CrossRef] [Green Version]
  35. Lindeberg, Y.L.; Egedal, K.; Hossain, Z.Z.; Phelps, M.; Tulsiani, S.; Farhana, I.; Begum, A.; Jensen, P.K.M. Can Escherichia coli fly? The role of flies as transmitters of E. coli to food in an urban slum in Bangladesh. Trop. Med. Int. Health 2018, 23, 2–9. [Google Scholar] [CrossRef] [Green Version]
  36. Black, R.E.; Lopez de Roma, G.O.; Brown, K.H.; Bravo, N.; Grados Bazalar, O.; Creed Kanashtro, H. Incidence and etiology of infantile diarrhea and major routes of transmission in Huascar, Peru. Am. J. Epidemiol. 1989, 129, 785–799. [Google Scholar] [CrossRef] [Green Version]
  37. Gil, A.I.; Lanata, C.F.; Hartinger, S.M.; Mäusezahl, D.; Padilla, B.; Ochoa, T.J.; Lozada, M.; Pineda, I.; Verastegui, H. Fecal contamination of food, water, hands, and kitchen utensils at the household level in rural areas of Peru. J. Environ. Health 2014, 76, 102–107. [Google Scholar]
  38. Sinclair, R.; Gerba, C. Microbial contamination in kitchens and bathrooms of rural Cambodian village households. Lett. Appl. Microbiol. 2011, 52, 144–149. [Google Scholar] [CrossRef] [PubMed]
  39. Capone, D.; Adriano, Z.; Berendes, D.; Cumming, O.; Dreibelbis, R.; Holcomb, D.A.; Knee, J.; Ross, I.; Brown, J. A localized sanitation status index as a proxy for fecal contamination in urban Maputo, Mozambique. PLoS ONE 2019, 14, e0224333. [Google Scholar] [CrossRef]
  40. Flores, G.E.; Bates, S.T.; Caporaso, J.G.; Lauber, C.L.; Leff, J.W.; Knight, R.; Fierer, N. Diversity, distribution and sources of bacteria in residential kitchens. Environ. Microbiol. 2013, 15, 588–596. [Google Scholar] [CrossRef] [PubMed]
  41. Trevett, A.F.; Carter, R.C.; Tyrrel, S.F. The importance of domestic water quality management in the context of faecal–oral disease transmission. J. Water Health 2005, 3, 259–270. [Google Scholar] [CrossRef] [PubMed]
  42. Khan, M.; Zanuzdana, A.; Burkart, K.; Krämer, A. Determinants of diarrhoea in ‘Urban’slums of dhaka and adjacent rural areas: A household-level analysis. Popul. Space Place 2014, 20, 498–511. [Google Scholar] [CrossRef]
  43. Alam, M.; Islam, A.; Bhuiyan, N.; Rahim, N.; Hossain, A.; Khan, G.Y.; Ahmed, D.; Watanabe, H.; Izumiya, H.; Faruque, A.G. Clonal transmission, dual peak, and off-season cholera in Bangladesh. Infect. Ecol. Epidemiol. 2011, 1, 7273. [Google Scholar] [CrossRef] [Green Version]
  44. Jensen, P.K.; Ensink, J.H.; Jayasinghe, G.; van der Hoek, W.; Cairncross, S.; Dalsgaard, A. Domestic transmission routes of pathogens: The problem of in-house contamination of drinking water during storage in developing countries. Trop. Med. Int. Health 2002, 7, 604–609. [Google Scholar] [CrossRef]
Figure 1. Map of the study area. The distribution of study households and communal source water pumps in the Arichpur area.
Water 13 01139 g001
Figure 2. Fecal contamination of drinking water according to WHO risk category.
Water 13 01139 g002
Figure 3. The proportion of E. coli positive samples and distribution of average E. coli counts in point-of-drinking water by different months from September 2014 to December 2015. Data collection between December 2014 and February 2015 was interrupted, and laboratory testing of samples was delayed due to political unrest in the country.
Water 13 01139 g003
Table 1. The presence of E. coli in point-of-drinking water and communal source water of the study households, stratified by various characteristics.
CharacteristicsNo. of SamplesContaminated with E. coli, n (%)
Point-of-drinking water25141926 (77)
Water treatment
Yes340265 (78)
No 21741661 (76)
Modes of water treatment *
Boiling254197 (78)
Filtration8365 (78)
Types of drinking vessels *
Mugs13351035 (78)
Glasses726568 (78)
Bottles344232 (67)
Jugs7462 (84)
Communal source water1494866 (58)
Types of communal water sources
WASA pump12273 (60)
Submersible pump1372793 (58)
Collection points
Taps attached to the communal pumps440208 (47)
Taps attached to the reservoir connected to the pumps1054658 (62)
* For 1% of the samples of treated water, respondents reported using both boiling and filtration, and 1% of the samples of drinking vessels consisted of both pitchers and bodnas, and thus were not included.
Table 2. Difference in E. coli CFU/100 mL of water between the paired samples of communal source water and point-of-drinking water collected on the same day.
Difference in E. coli CFU/100 mL between Communal Source and Point-of-Drinking WaterTotal No. of Samples (n = 1236)Mean Changes
n (%)
No net change (point-of-drinking = communal source)204 (16)
In-house contamination (point-of-drinking > communal source)626 (51)125
In-house contamination: Ranging low to very high314 (26)108
  Low risk (0) → Intermediate risk (1–10) 66 (11)5
  Low risk (0) → High risk (11–100)156 (25)39
  Low risk (0) → Very high risk (>100)92 (15)300
In-house contamination: Ranging intermediate to very high 170 (14)188
  Intermediate risk (1–10) → High risk (11–100)34 (5)33
  Intermediate risk (1–10) → Very high risk (>100)36 (6)242
  High risk (11–100) → Very high risk (>100)100 (16)221
In-house contamination: no change of risk group142 (11)85
  Intermediate risk (1–10) → Intermediate risk (1–10) 6 (1)4
  High risk (11–100) → High risk (11–100)75 (12)33
  Very high risk (>100) → Very high risk (>100)61 (10)157
Die-off (point-of-drinking < communal source)406 (33)96
Die-off: Ranging very high to low177 (14)83
  Intermediate risk (1–10) → Low risk (0)47 (12)6
  High risk (11–100) → Low risk (0)81 (20)37
  Very high risk (>100) → Low risk (0)49 (12)231
Die-off: Ranging very high to intermediate124 (10)132
  High risk (11–100) → Intermediate risk (1–10)40 (10)29
  Very high risk (>100) → Intermediate risk (1–10)15 (4)276
  Very high risk (>100) → High risk (11–100)69 (17)161
Die off: no change of risk group105 (8)76
  Intermediate risk (1–10) → Intermediate risk (1–10) 2 (0.5)4
  High risk (11–100) → High risk (11–100) 65 (16)22
  Very high risk (>100) → Very high risk (>100) 38 (9)172
Table 3. Median and mean concentration of E. coli of communal source and point-of-drinking water, and treated and non-treated point-of-drinking water.
Intermediate Risk (1–10 CFU/100 mL)High Risk (11–100 CFU/100 mL)Very High Risk (>100 CFU/100 mL)
Communal source and point-of-drinking water
Communal sourcen = 161n = 428n = 278
Median (IQR)4 (4, 8)32 (20, 56)196 (136, 313)
Mean (95%CI)6 (5, 6)40 (38, 43)250 (231, 269)
Point-of-drinkingn = 428n = 844n = 655
Median (IQR)4 (3, 8)36 (20, 62)272 (152, 428)
Mean (95%CI)5 (5, 5)42 (41, 44)306 (293, 319)
Treated and non-treated point-of-drinking water
Treatedn = 84n = 106n = 79
Median (IQR)4 (2, 6)37 (22, 60)264 (175, 428)
Mean (95% CI)4 (4, 5)42 (37, 46)299 (331, 267)
Non-treatedn = 348n = 741n = 579
Median (IQR)4 (3, 8)36 (20, 64)276 (152, 428)
Mean (95% CI)5 (5, 5) 43 (41, 44) 307 (321, 293)
IQR: Interquartile range indicates the first and third quartiles in parentheses; 95% CI: The 95% confidence interval indicates the lower and upper limits in parentheses.
Table 4. Results of logistic regression analysis for the odds of belonging to one of the WHO drinking water risk categories (using the low risk group as the referent).
CharacteristicsLow Risk/SafeIntermediate RiskHigh RiskVery High Risk
E. coli CFU/100 mL(<1)(1–10)(11–100)(>100)
Treatment
Treated, n (%) (n = 340)75 (22)82 (24)105 (31)78 (23)
OR (CI) Ref1.62 (1.11–2.34)0.96 (0.69–1.33)0.92 (0.62–1.35)
p-value 0.011 *0.8240.660
Boiling, n (%) (n = 254)57 (24)68 (27)76 (30)53 (21)
OR (CI) Ref1.61 (0.57–4.55)0.87 (0.41–1.84)0.73 (0.26–2.08)
p-value 0.3610.7220.565
Filtration, n (%) (n = 83)18 (22)14 (17)28 (34)23 (28)
OR (CI) Ref0.66 (0.22–1.95)1.17 (0.54–2.53)1.37 (0.46–4.06)
p-value 0.4580.6870.568
Drinking Vessels
Mugs, n (%) (n = 1335)300 (22)214 (16)459 (34)362 (27)
OR (CI) Ref0.96 (0.72–1.26)1.14 (0.90–1.44)1.19 (0.91–1.54)
p-value 0.7730.2510.191
Glasses, n (%) (n = 726)158 (22)129 (18)247 (34)192 (26)
OR (CI) Ref1.17 (0.81–1.68)1.12 (0.85–1.48)1.12 (0.82–1.54)
p-value 0.3870.4120.454
Bottles, n (%) (n = 344)112 (33)56 (16)107 (31)69 (20)
OR (CI) Ref0.63 (0.44–0.92)0.62 (0.43–0.87)0.50 (0.34–0.73)
p-value 0.019 *0.007 *0.000 *
Jugs, n (%) (n = 74)12 (16)18 (24)21 (28)23 (31)
OR (CI) Ref2.10 (0.94–4.70)1.22 (0.58–2.59)1.75 (0.87–3.52)
p-value 0.0690.5910.114
* Indicates significance, p < 0.01 for OR in risk groups.
Publisher’s Note: MDPI stays neutral with regard to jurisdictional claims in published maps and institutional affiliations.

