
Impact of the Pumping Regime on Electricity Cost Savings in Urban Water Supply System


1
Khavaran Institute of Higher Education, Mashhad 9184168619, Iran
2
Department of Civil Engineering, University North, 42000 Varaždin, Croatia
3
Faculty of Geotechnical Engineering, University of Zagreb, 42000 Varaždin, Croatia
*
Author to whom correspondence should be addressed.
Water 2021, 13(9), 1141; https://doi.org/10.3390/w13091141
Submission received: 9 February 2021
/
Revised: 14 April 2021
/
Accepted: 19 April 2021
/
Published: 21 April 2021
(This article belongs to the Section Hydraulics and Hydrodynamics)
Abstract
:The main purpose of the presented research is to raise the efficiency of pumping stations’ operational work by developing a model for reducing energy costs in urban water supply systems. Pumping systems are responsible for a significant portion of the total electrical energy use. Significant opportunities exist to reduce the pumping energy through smart design, retrofitting, and operating practices. Today, considering the increase in pumping energy prices in water conveyance systems, the problem of optimal operation of pumping stations is very actual. The optimal operation of pumping stations was determined using a Genetic Algorithm Optimization (GAO) to achieve the minimum energy cost. The paper presents a novel management model for the optimal design and operation of water pumping systems on a real case study for the town of Gonabad in Iran. To achieve this goal, three days in a year were selected randomly. The results indicate that the proposed mode in conjunction with a GAO is a versatile management model for the design and operation of the real pumping station. Modeling results show that optimization with a GAO reduces power consumption by about 15–20%.
1. Introduction
The optimization of Urban Water Supply System (UWSS) operational work is a quite common task. Many tools based on mathematical programming have been proposed. Large hydro-technical facilities, despite their massiveness and usurpation of space, have justifications for their construction, in a spirit of the academic and engineering manners, as well as in an order of providing the balance between small- and large-scale analysis. The application of the GAO tends to be compromise solution for increasing the energy and hydraulic efficiency of the water supply [1]. In other words, water supply systems need to be designed efficiently, accounting for both construction costs and operational energy expenditures when pumping is required. Since water demand varies depending on the moment’s necessities, especially when it comes to agricultural purposes, water supply systems should also be designed to adequately handle this [2].
Reports show that the electrical energy used to pump water comprises a high portion of the total operational costs of the system [3]. About 20% of the world’s energy is consumed in pumping systems [4]. Various measures are taken to save energy in water supply systems. In general, these preparations are divided into two general categories. These are actions related to motor pump design and measures related to motor pump operation. The problem of scarcity of resources in the economy and proper selection of projects requires detailed analysis. This is an example where the important financial and economic evaluations of development plans in the national economy are required [5].
Many researchers have taken various steps over the past few decades to minimize operating costs. Various optimization methods have been used for operational optimization problems such as linear or nonlinear programming [6,7], dynamic programming [8], nonlinear heuristic optimization [9], genetic algorithms [10], particle swarm optimization [11], ant colony optimization [12,13], and many others.
Finding optimal schedules for pumps in a water distribution network is a difficult task for researchers, as well as managers, designers, and operative engineers. Changing the time of using the pumps and determining a specific program that leads to more use of the pump in cheap electricity tariffs can help to reduce energy consumption. However, since it is not possible to determine the maintenance cost of the pump due to the pump operation, alternative measures should be used to determine and estimate it. An increase in the pressure on the network refers to the increase in maintenance costs in the future [14].
The main purpose of this study was to investigate the potential of power consumption efficiency and evaluate the impact of the optimization algorithm and its performance on pumping systems and then prepare a plan for pump performance to minimize energy consumption and prepare a model to reduce energy costs in the water supply system of the city. Therefore, according to the parameters determining the cost of electricity and pump, a new proposed formula is proposed. Then, considering the limitations, MATLAB programming and genetic algorithm optimization (GAO) are performed for each pump.
2. Review of Literature
Water and energy are vital resources, and their integrated management can provide significant economic and environmental benefits in both sectors [15]. From time immemorial, many measures, including economic and political factors, have been considered to control energy consumption. Over the past few decades, water organizations have been challenged by new stringent regulatory requirements, increased costs and energy demand, and reduced availability of high-quality water resources [16].
An example of this is the influence of lobbies and political leanings of particular interest groups on water supply issues over Israeli–Palestinian disputes. Despite regional decisions on the amount and regime of water supply, water availability will depend on energy consumption. This means optimizing the pumping and distribution of water [17]. Today, groundwater is mainly extracted using piped wells using electric pumps or diesel to raise water to the ground. The relationship between energy and water is two-way: water can be used to produce energy and energy is used to pump groundwater.
Excessive groundwater use is a threat to the sustainable development of rural and urban areas, especially in arid and semi-arid regions. In Iran, estimates show that more than 70% of the water resources in the last case have been exploited for 15 years and a lot of investment has been made to enrich and relocate the wells [18]. Increasing groundwater abstraction is contrary to the announced policies of the government. However, the reluctance to enforce agricultural water use regulations, which has led to over-harvesting for agriculture, thwarts this goal, not only in direct competition with urban consumers but also in increasing costs [19]. Although rising energy prices can be an economically viable way to manage groundwater consumption, they cannot be easily implemented. The results of the subsidy reform show that, even if these reforms are successful in reducing energy subsidies in the non-agricultural sector, the program has not achieved the desired results in the agricultural sector.
Although energy price management can control the sustainable management of groundwater resources, an alternative option should be given to farmers to reduce their potential mutual dissatisfaction. The energy management system is based on the energy flow analysis method based on the conceptual model of the energy reference system and energy balance sheet and energy indicators to explain the status of energy flow and evaluate the potential for energy saving. The level of energy flow, which combines other factors of production (capital and labor) to minimize the total cost of production, is introduced as the optimal energy point. Pumping stations in the water and wastewater industry are one of the vital centers and main arteries of water transmission. They are one of the sources of water production to water distribution networks in cities. High energy consumption in pumping stations has made the optimization of consumption and thus reduce the energy consumption of particular importance [20,21].
Many factors affect the performance of pumping stations and the amount of energy consumed. These factors include high reliability in purchasing power points and as a result of high payment costs, failure to install capacitors and thus increase reactive power and cost, change of the hydraulic level of wells for various reasons, worn-out of the electric pumps as well as lack of coordination and planning to change the working hours of electric pumps from high to low or medium load [22]. The cost of electricity consumption has a major share in water supply and sewerage projects. This share in the wastewater treatment plant is estimated at 25 to 40% of the cost of operation and management of the treatment process [23].
Based on water and energy consumption curves, water and electricity consumption time are almost the same over a while. This fact doubles the need to change the electricity consumption hours to extract the water to reduce power consumption according to peak load schedules by the Ministry of Energy directives. On the other hand, the lack of fixed prices of electricity consumption at different hours of the day and dynamic pricing can play a positive role in changing the consumption pattern to transfer consumption from peak hours to non-peak hours and reduce costs [24]. Studies of per capita electricity consumption in Iran are several times higher than the international per capita, and this amount of consumption in the water and electricity industry is correct and higher than the global average so that high annual cost of electricity consumption is placed on responsible companies [25]. Energy consumption in water pumping stations is very important for urban and rural water and sewage companies as the custodian and executor of this matter.
In the past, the design of the Urban Water Supply System including pumps, pipelines, and storage tanks was not carried out sustainably. However, these systems were affected by many dynamic factors. Therefore, since the 1990s, researchers have used dynamical modeling for such systems to design and optimize energy consumption. Chase and Ormsbee [26], as well as Brion and Mays [27] linked network-simulation models with nonlinear optimization algorithms to determine optimal pump operations. None of these algorithms considers the number of pump switches as a criterion for making operational decisions. Little and McCrodden [28] solved a mixed-integer linear-programming problem for pipelines within the water supply system. Since the flow is pumped to a free outlet, a linear program was formulated. The integer portion had incorporated the discrete operations and a maximum power-usage constraint. Such analyses did not consider adding the pump-switching constraints. MalaJetmarova et al. [29] presented a systematic review of a large number of previous studies on the operational optimization of the water supply system, with emphasis on the optimal performance of the pump and valve control.
The performance for water quality purposes of urban and multi-regional drinking water distribution systems was presented by Puleo et al. [30]. The hybrid Discrete Dimensional Dynamics Search (HD-DDS) algorithm was used to optimize the pump operation schedule during the day, the continuous flow rate of the pump became a discrete program by considering the decision variables. León Celia et al. [31] analyzed the energy flow within the water network based on adjustment curves in two different modes of the theoretical network and the real network, which also considered the maximum energy flow constraints. They performed optimization in two ways. First was the discrete method, in which a predefined combination of flow distributions was evaluated. The second one was a solution by the Hooke–Jeeves and Nelder–Mead optimization algorithms. Wang et al. [32] examined the nonlinear economic model (EMPC) forecast control strategy for water networks. They used the shut-off function of turning on the parallel pumps at the pumping stations, the two-layer control design, the non-linear EMPC strategy by controlling the hourly spacing at the top layer, and finally the pump scheduling method with one minute sampling time in the bottom layer.
Zhuan and Xia [33] optimized the water pumping station using the reduced dynamic programming algorithm (RDPA). Zhuan et al. [34] investigated the performance of three pumps using the optimization problem formulation and the proposed optimization solution algorithm to reduce electricity costs concerning flow demand. The results showed that cost efficiency is due to two aspects. The first is the demand change from high intervals of electricity prices to low electricity prices. The second is the performance mode with high energy costs, intending to decrease consumption due to high costs. Wang et al. used the Storm Water Management (SWMM) and Particle Swarm Optimization (PSO) model to minimize pump start time and shutdown time. This was achieved by building an optimization model and optimizing the operating depth of the pumps [35]. Rasoulzadeh et al. [36] used the combined nonlinear programming and genetic algorithm (NLP-GA) to optimize the operational work of an irrigation pumping station. Mackle et al. [37], by using a genetic algorithm, conducted a procedure to optimize the cost of electricity consumption in pumping stations. They prepared time intervals and the schedule of the work for each pump. They considered a simple system with 3 different pumps for water pumping to the reservoir, while only constant speed pumps have been considered.
Moradi et al. [38] proposed a new model for designing and working agricultural pumping stations using genetic algorithms. With regards to the specifications of the pumps and considering the downstream demand curve, they examined the different combinations of pumping regimes for each combination that met the need and demand with a genetic algorithm. Finally, the model that had the lowest cost among the others was selected. Xuejun et al. [39] used a genetic algorithm to evaluate the optimal performance of a single stage pumping in a multi-stage pumping station with a small buffer. In this study, the capacity and the number of pumps were investigated.
As mentioned, in most of the analyzed cases, in many pumping stations there are no specific instructions for the operation work of the pumps. The high cost of electricity from water supply networks and to the depletion of natural resources are the motivations for studying this issue. By optimizing the volume of water storage tanks and presenting the operation plan of pumping stations, a decrease in energy costs could be finalized, which will be presented in this paper.
3. Modeling and Research Methodology
3.1. Study Area
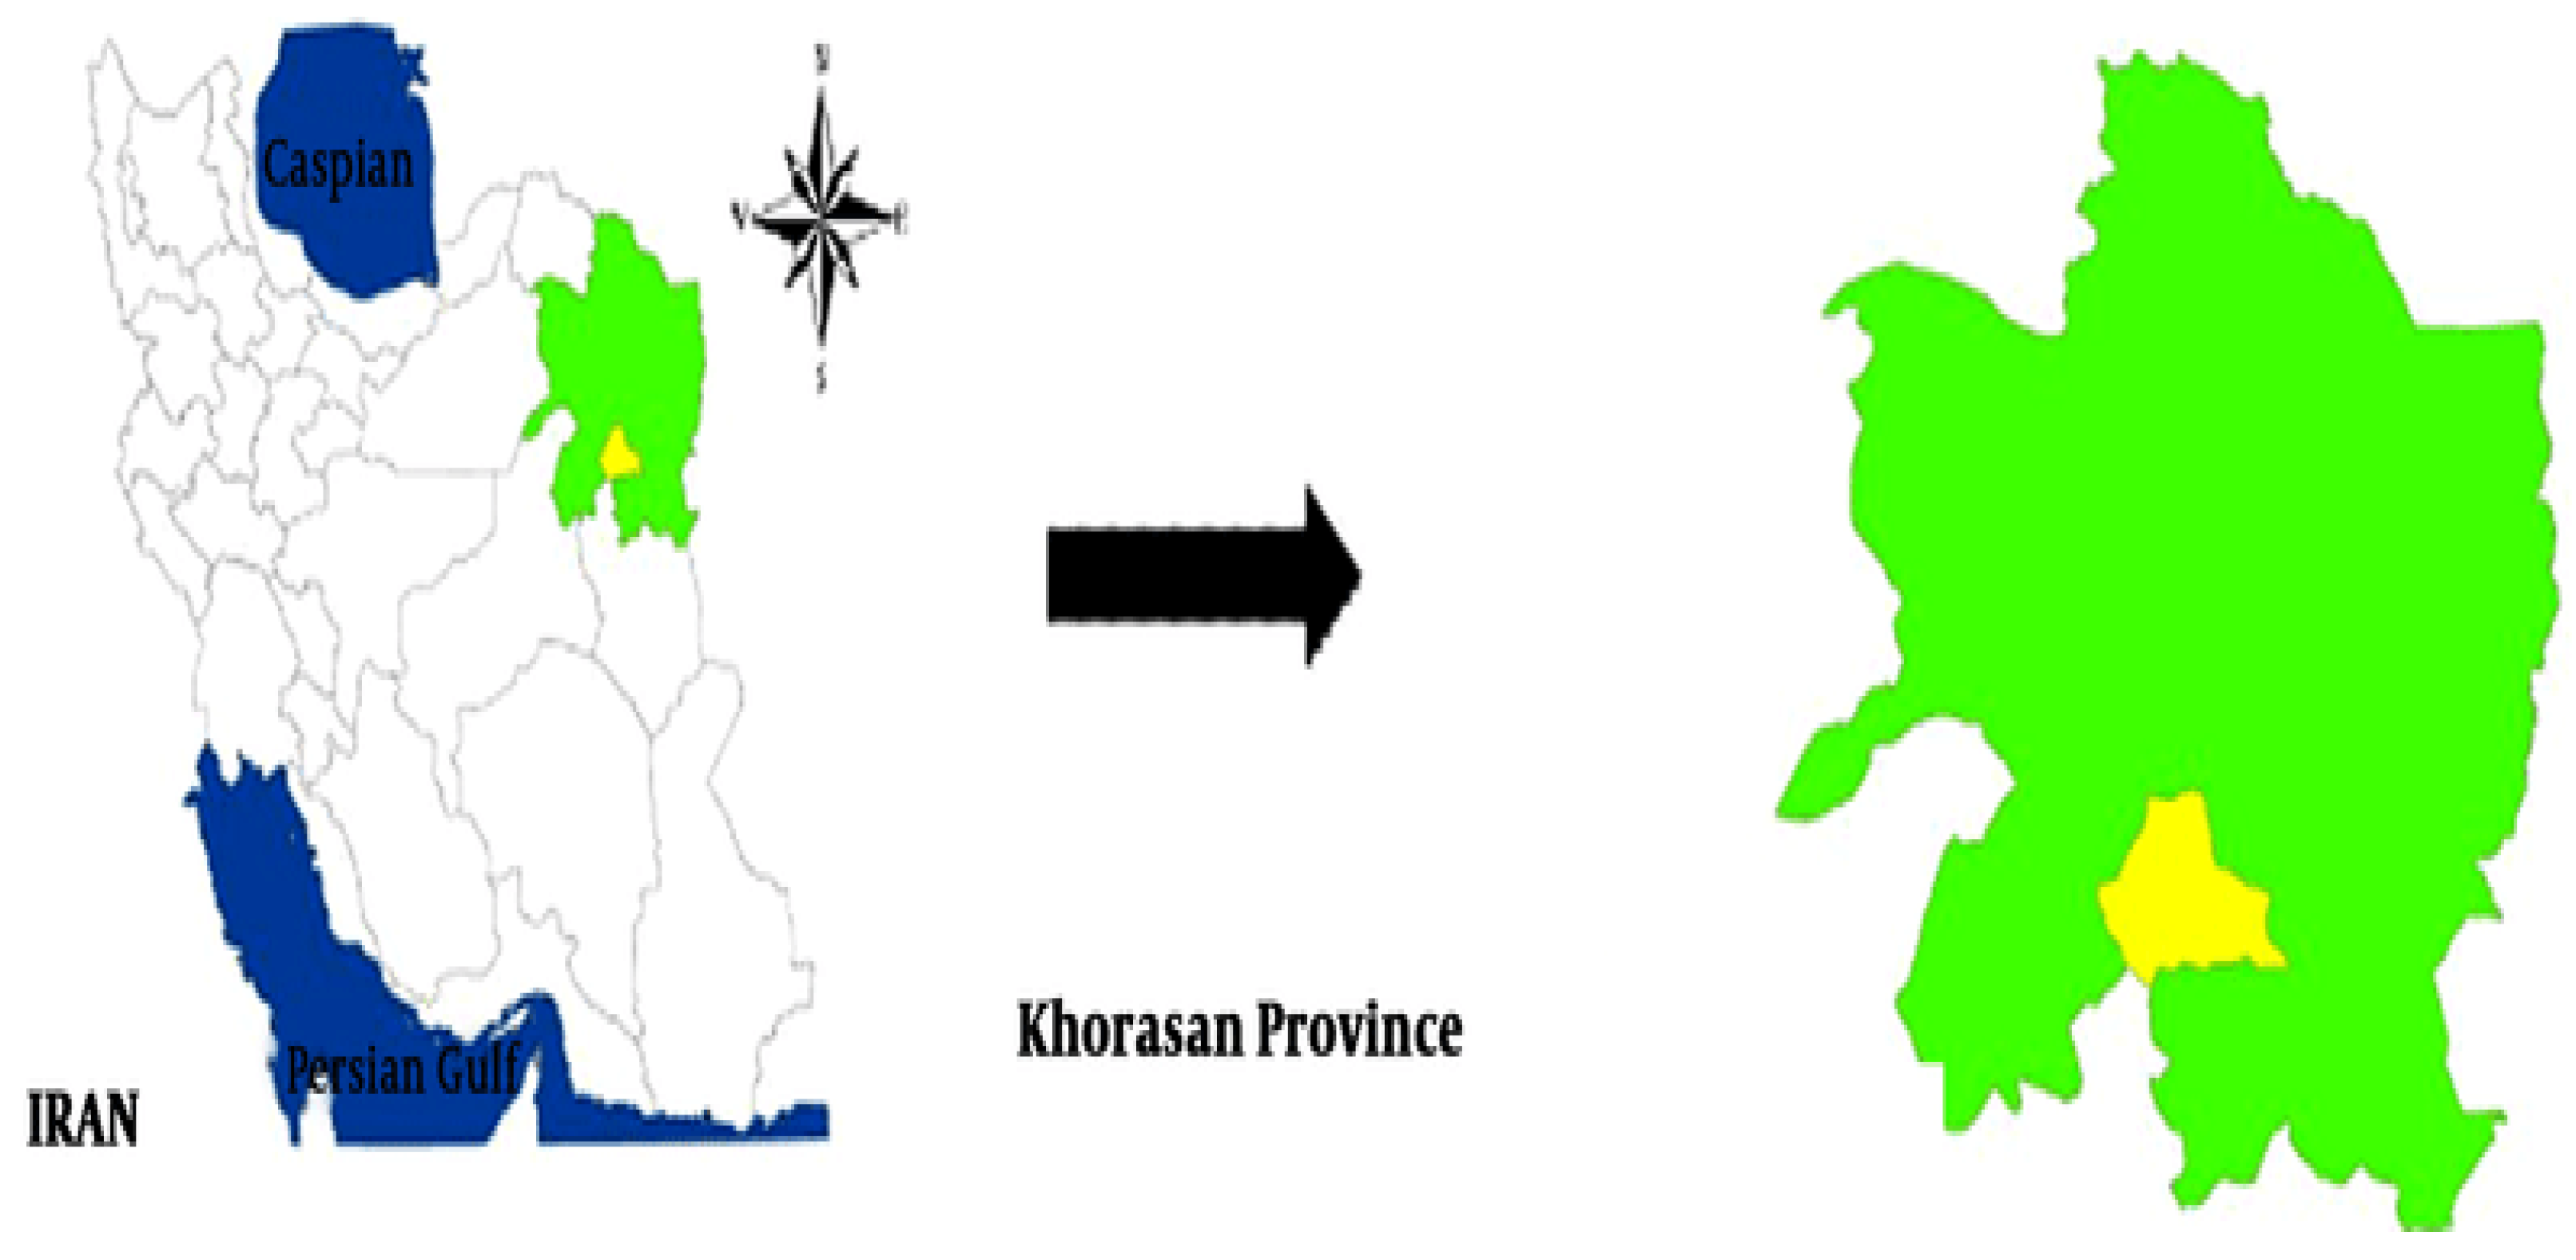
According to the latest national divisions lists carried out in 2005, the county of Gonabad has an area of 9584 km2 and the population of this city is 88,753 inhabitants. Currently, the county of Gonabad is located in Khorasan Razavi province in Iran, and the city of Gonabad is situated in the center of the mentioned county, Figure 1. The distance from Gonabad to Mashhad city is 270 km, while its distance to Tehran (capital of Iran) is 1091 km.
The reason for studying the city is that the observed location is in a very hot and dry area. Due to this, an extending usage of water, and especially energy was noticed. For many years, the people of this sector have always been looking for a way to conserve energy and secure a water supply. Qasbeh Gonabad aqueduct, which is registered in the UNESCO World Heritage List and is the longest in the world, is one of the masterpieces of this city to solve this problem.
3.2. Input Data
Usually, in UWSS, the water abstracted from the water resources first must be distributed to the water reservoirs [41]. Table 1 shows the physical and geographical characteristics of the existing water supply reservoir.
At the peak power consumption hours on 29 May 2017 (7–11 p.m.), 5 pumps were turned on simultaneously, Figure 2a. This had a significant effect in increasing the cost of electricity. In Figure 2b. it can be seen that 3 to 4 pumps were being used at peak consumption times, although the outflow discharge is lower than the warm months of the year. Figure 2c. also shows a similar trend, with the difference that the pump operating hours had been less, early in the morning.
3.3. Calculation of Energy Cost
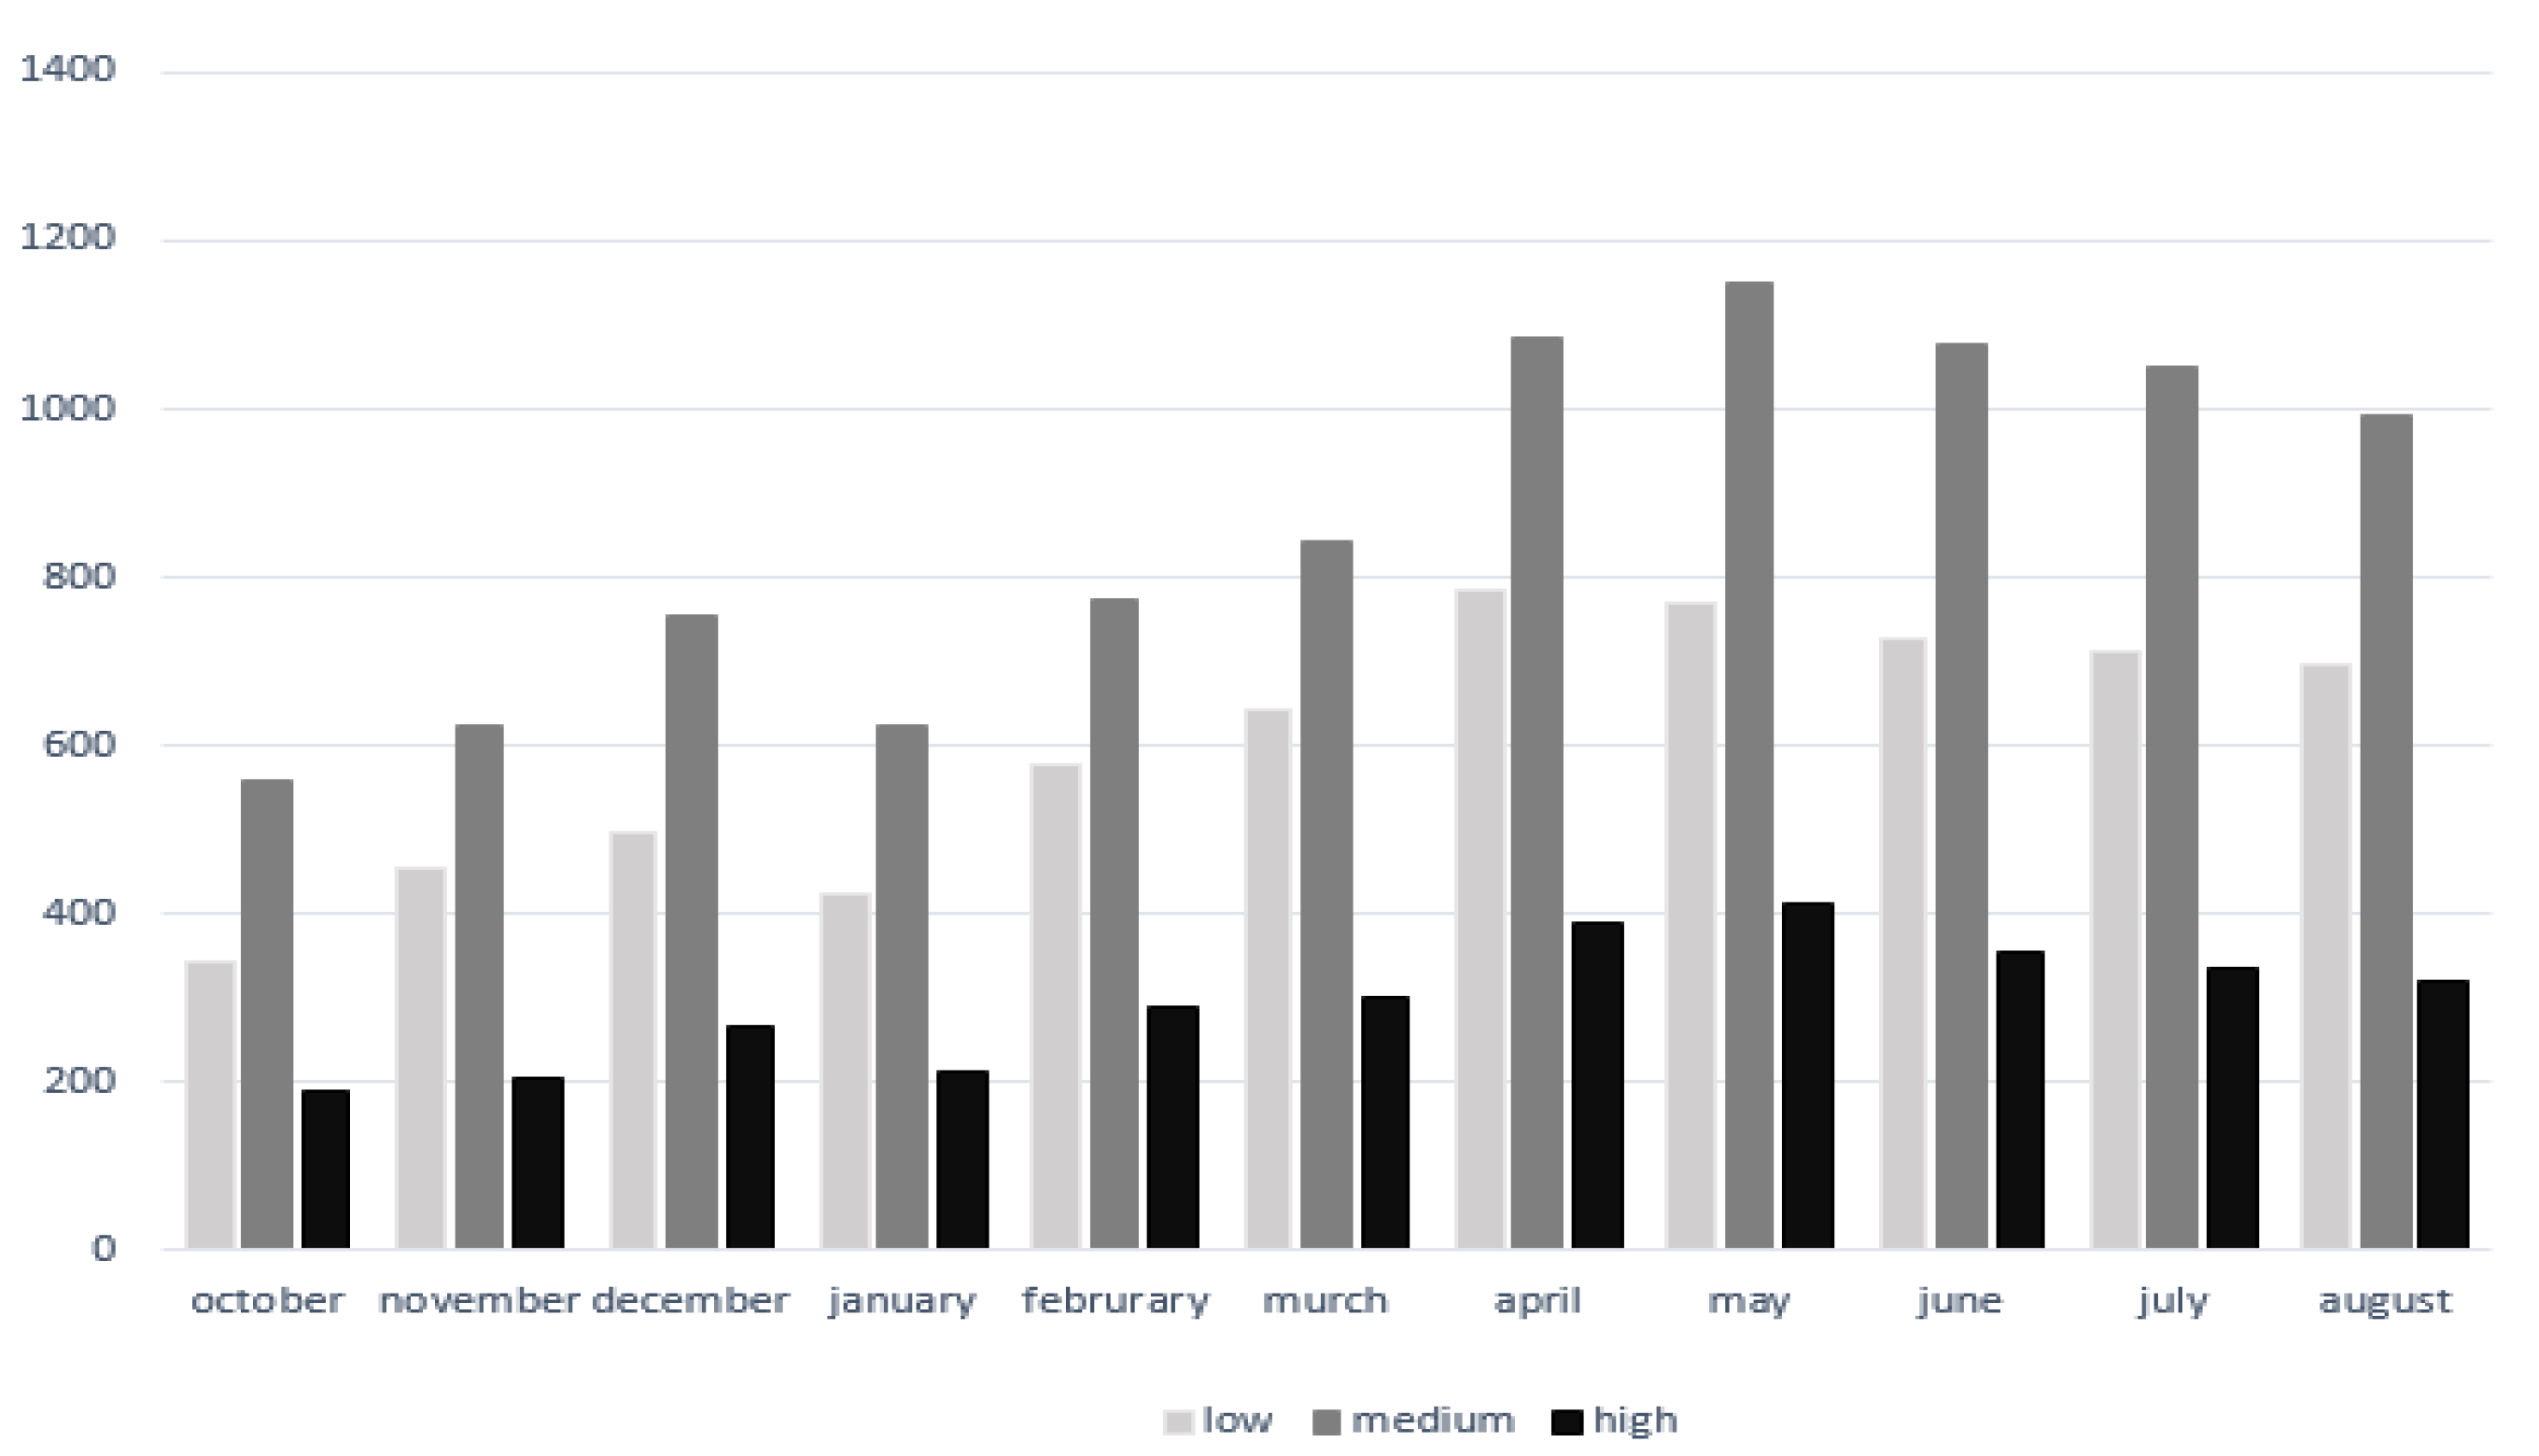
Generally, for 24 h a day, power consumption is divided into three-time sections. These are low-consumption, medium-consumption and high-consumption times [42]. Table 2 shows the divisions of hours and costs [41].
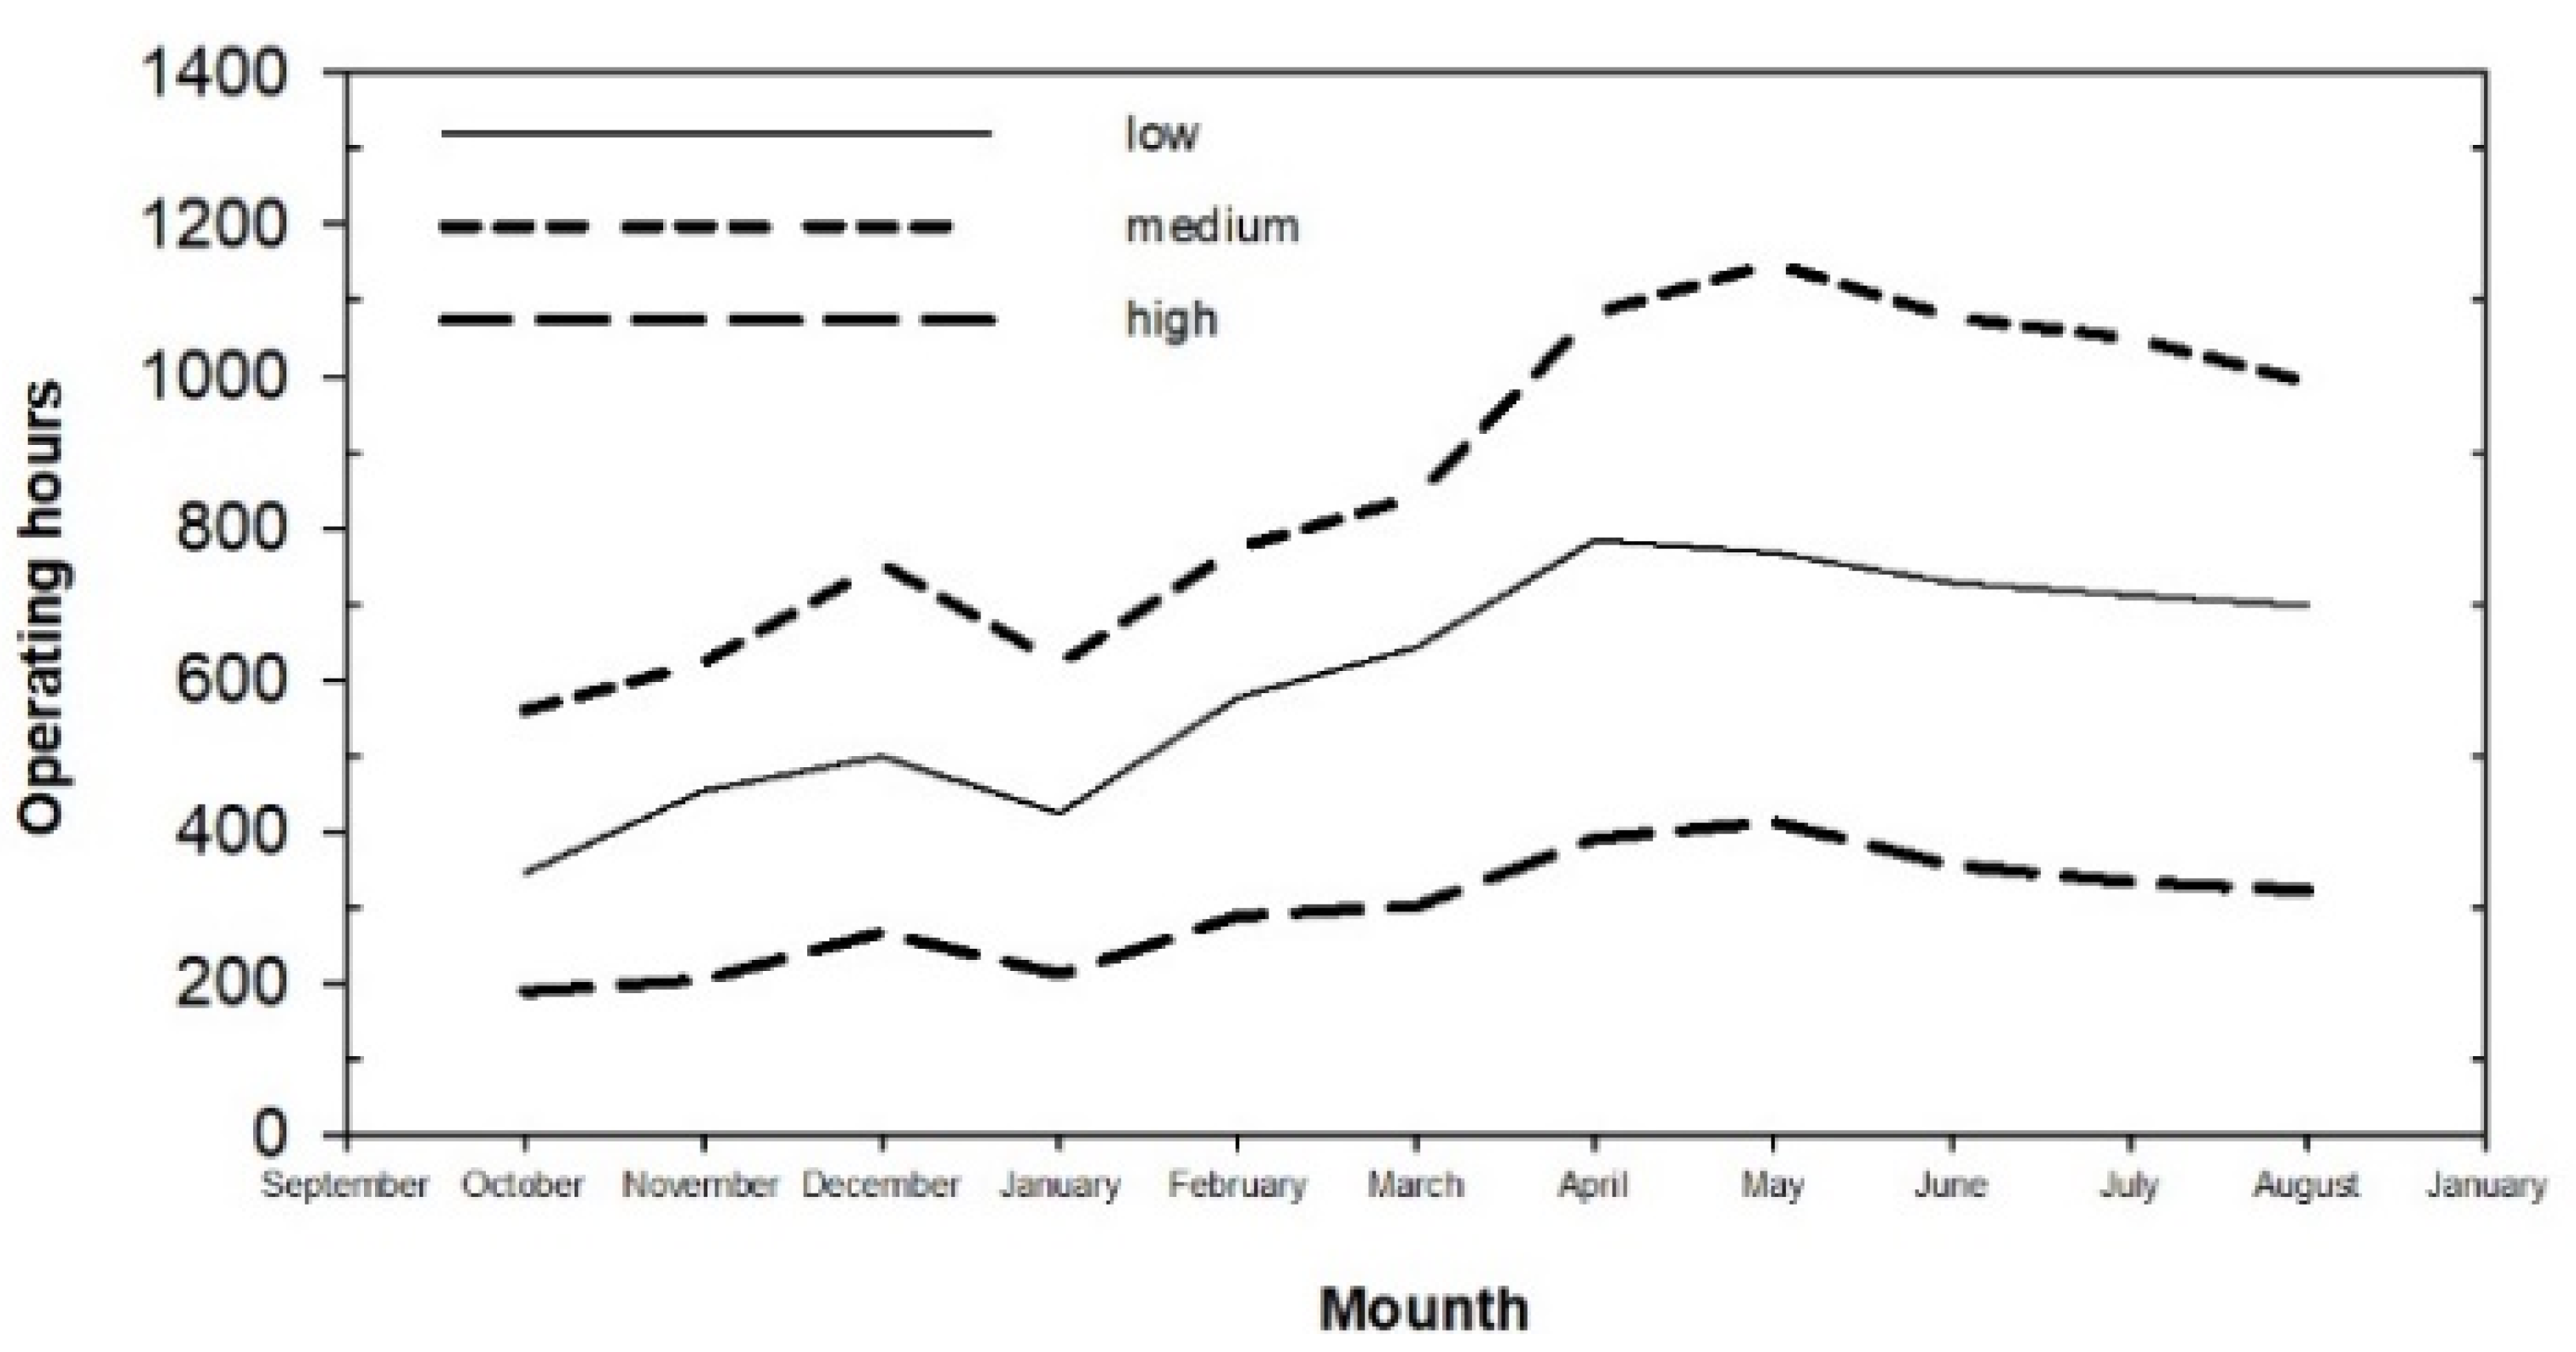
Accordingly, the pumps operating hours per month (on the yearly basis) based on the mentioned three divisions can be seen in Figure 3. According to Figure 3, during the summer period, the cost of electricity due to energy consumption of pumps was higher than the other seasons in the year, which can be explained by warm weather and high-water demand. The highest cost of electricity is during medium consumption hours (from 7 a.m. to 7 p.m.), as is shown in Figure 4.
Figure 4 shows the total operating hours of pumps at low consumption, medium consumption, and high consumption hours from October 2016 to August 2017. It can be seen that a total pump operation during a year is at its highest value during medium consumption hours.
To obtain the consumed energy, Equation (1) is used:
where E represents energy consumption on kW per hour; P is the consumed power (W); h denotes the number of hours of operation of the pump(s). By multiplying E by the cost per kWh of low consumption, medium consumption, and high consumption hours shown in Table 1, Table 2 and Table 3, the cost of electricity consumed is obtained. Accordingly, the cost of electricity consumed on 29 May, according to Equation (1) is equal to 2,280,000 Riyals (45.95€), on 27 January is equal to 1,600,000 Riyals (32.25€) and on 29 October is equal to 1,715,000 Riyals (34.56€).
3.4. Genetic Algorithm Optimization (GAO)
Genetic Algorithms (GA) are biologically inspired methods for optimization, which start with three main operators of mutation, crossover, and selection to achieve the desired result [43]. The sum of the above three stages is called a generation. Each chromosome has a proportion that is obtained by a particular equation. This equation contains the principal function and penalty functions. Penalty functions are the functions that include considered limitations and restrict the analyzed problem.
In this research, by using MATLAB software, special codes for this algorithm are written, and with the help of the defined target function and inserting the available data in the mentioned codes, the algorithm starts a cycle. In this cycle, the algorithm eliminates inappropriate and non-ideal responses from the cycle and repeats this process again and again until the most optimal and cost-effective response is finally obtained.
3.5. Target Function
The target function in the considered problem is to minimize the amount of energy consumed for 24 h during a day. Generally, in a UWSS, the cost of energy consumption in a pump depends on the amount of pumped discharge, the manometric head required to pump, the pump’s operating time, and the unit cost of electricity [44]. Considering these factors and observing dimension, the following formula is suggested:
where i is the index related to the pump, t is the index related to time, ρ is water density in , g is gravity in , m is the number of pumps, k is 24 h of a day, Q is discharged in , (H) means pumping height in m, η is pump efficiency, () means a cost of electricity at low consumption, medium consumption, and high consumption in Riyals, and f is the water pressure in pipes in .
There are also some limitations in doing this research:
- Limitation of the available pumps and downstream demand: This limitation means that sums of the pumped discharges by each pump must be equal to total discharge on that day. This limitation is shown in Equation (3):where is the discharge through pump number (i) at the hour (t) at the station () and is total discharge for 24 h a day.
- Limitation related to reservoirs: Given the permissible level of water in the reservoir, the water level in the reservoir is within a certain range. This range has been expressed in Equations (4) and (5).where is the height of water in the reservoir per hour in meters, and , respectively, are the maximum and minimum permissible height of the water inside the reservoir in meters. The mentioned limitation has been defined in a genetic algorithm as penalty functions to achieve the most optimal possible state.
This penalty is the cost that is considered for the failure of the considered option to achieve the maximum and minimum permissible balance of the reservoirs. The amount of this penalty is calculated according to Equation (6).
Also, to prevent the creation of depth deficiency the next day, another penalty has been defined. In other words, Equation (7) is the penalty considered for the creation of depth deficiency (depth deficiency of the storage reservoir at the end of the period relative to its depth at the beginning of the period):
where hT is reservoir water depth at the end of the period in meters and hIN is the water depth of the reservoir at the beginning of the period in meters.
and β are the coefficients in a Genetic Algorithm. They have been obtained through trial and error as 103 and 105.314, respectively. It should be noted that in a target function formula, these 2 penalties are also added.
In addition to the above limitations, due to the tolerance and capacity of power in the pumping station, only 5 pumps per hour can be switched on simultaneously.
4. Results and Discussion
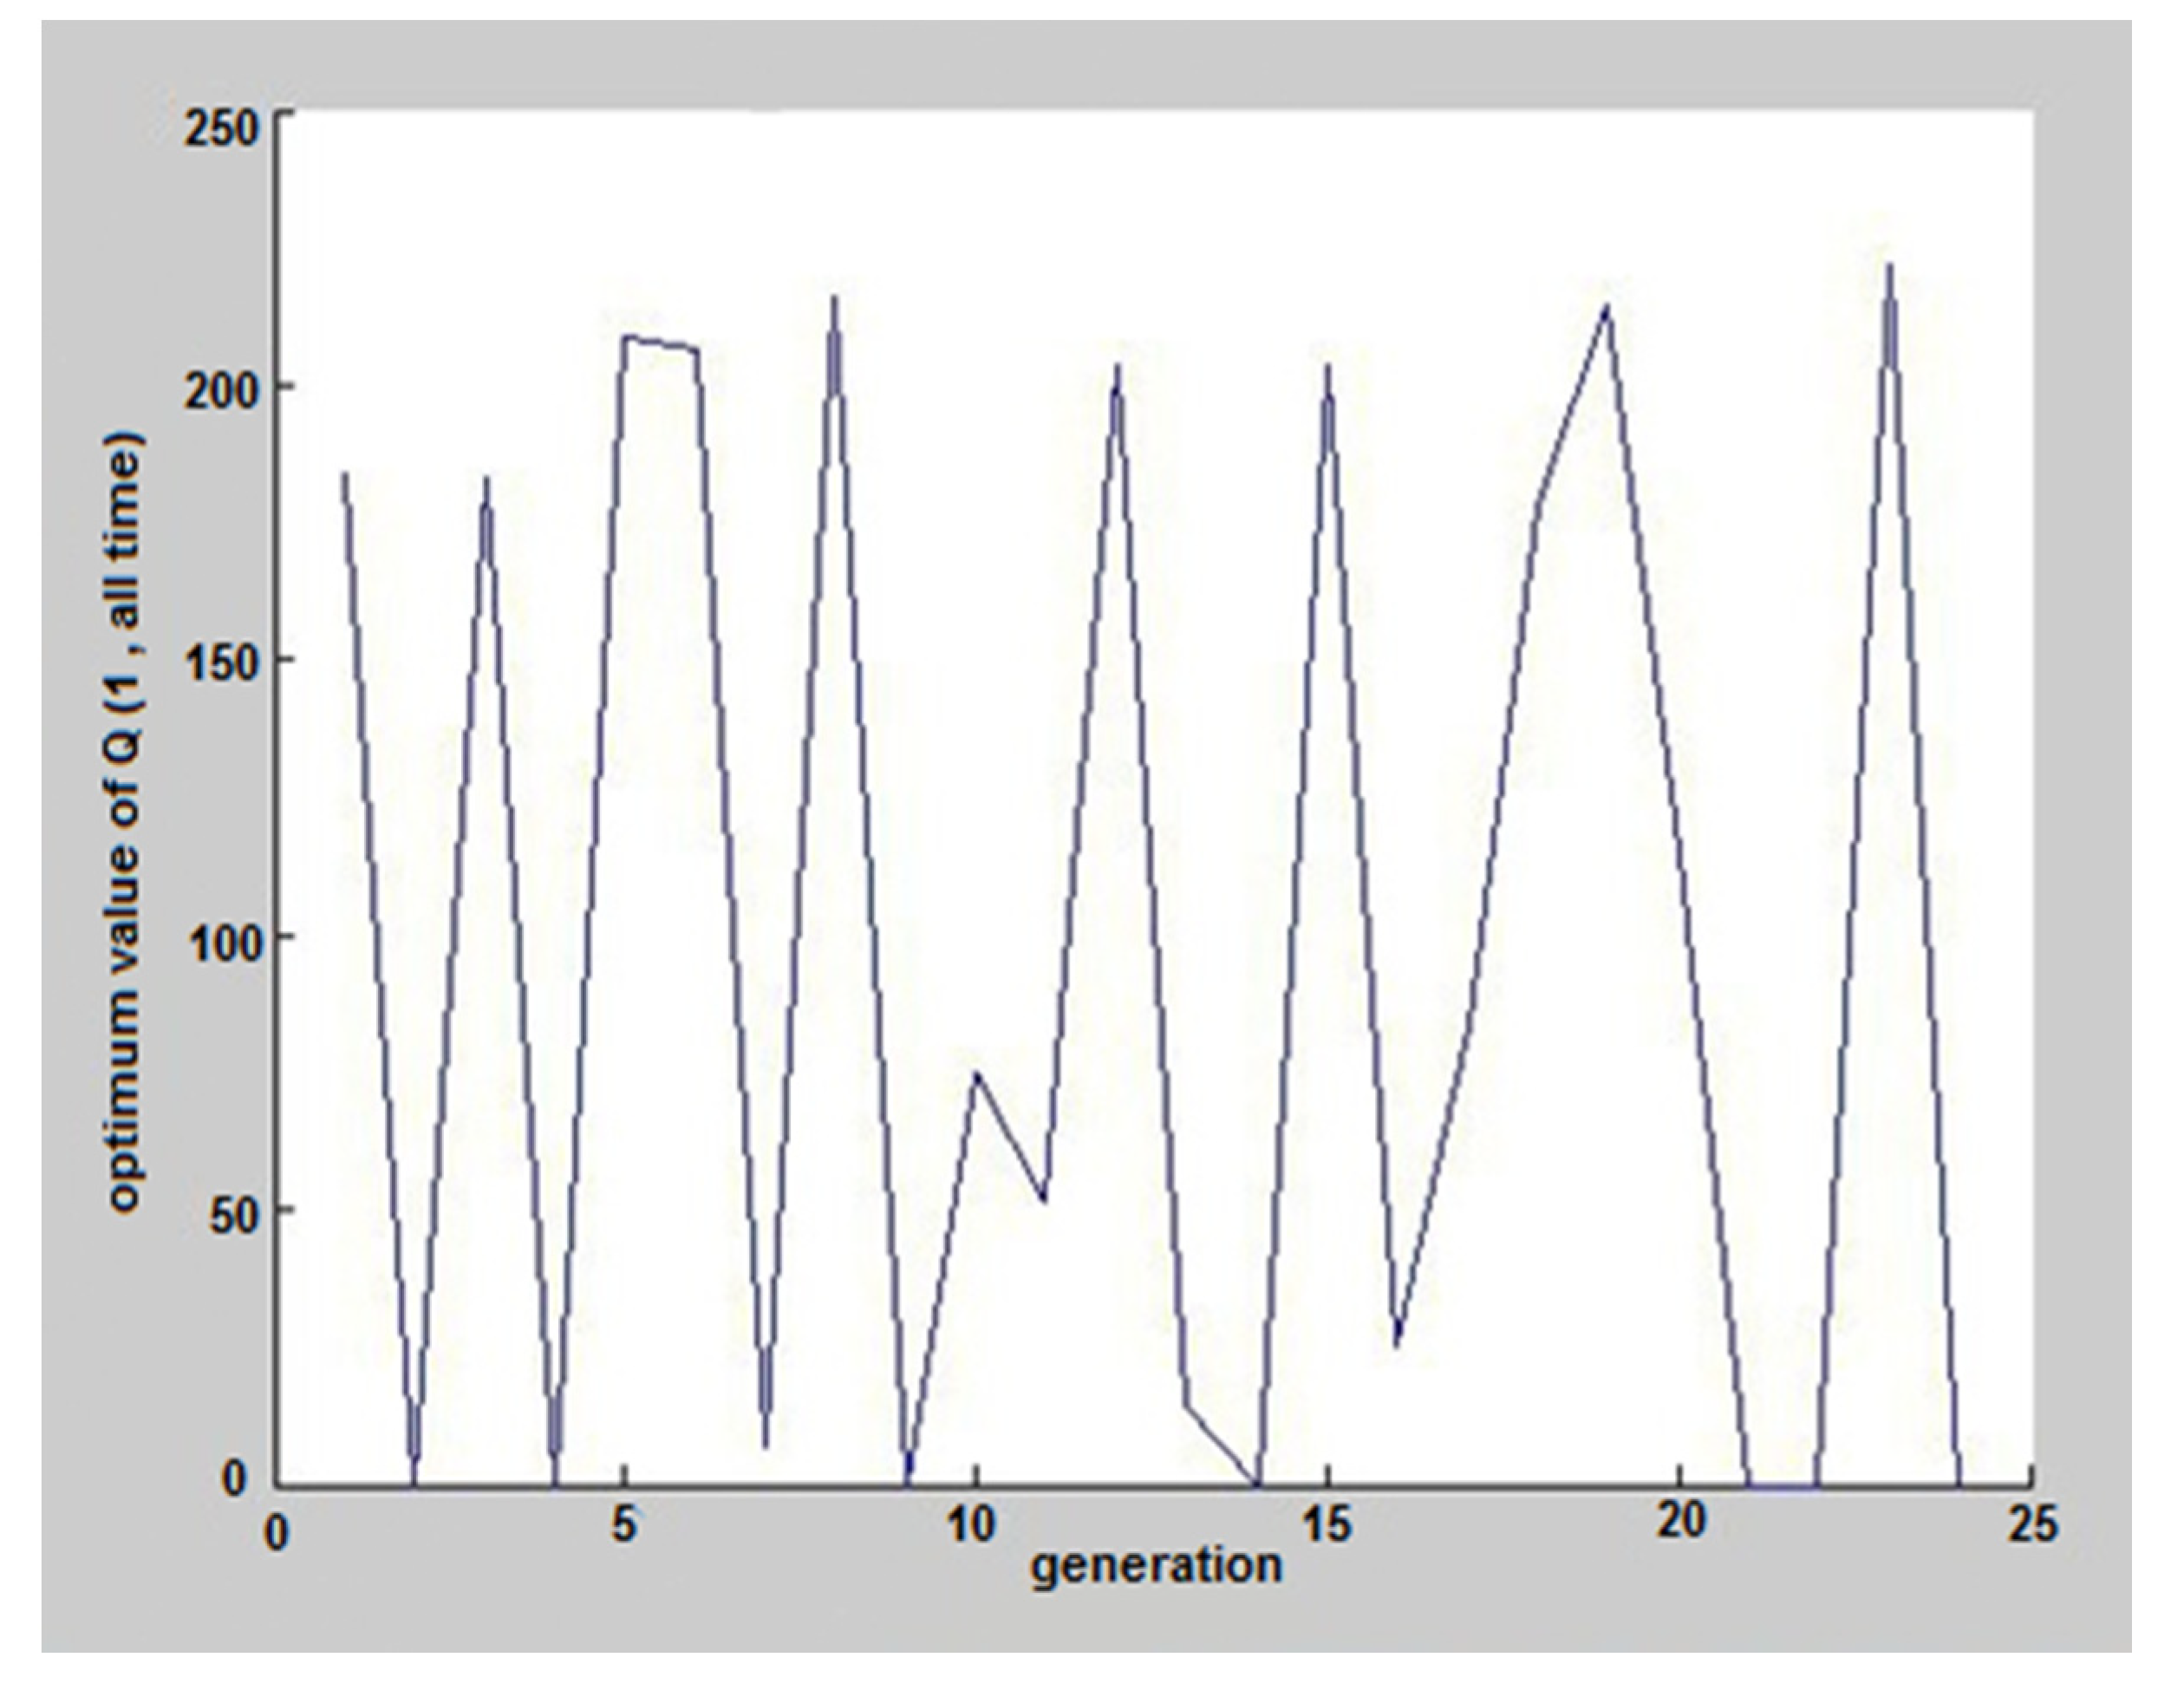
The results of coding in MATLAB software and running of genetic algorithm for an ordinary day, 29 May 2017, can be seen in Figure 5, Figure 6, Figure 7, Figure 8, Figure 9, Figure 10, Figure 11 and Figure 12. Again, according to the MATLAB selector program, this day was selected among these three days. These figures show the hours and the amount of pumped discharge by each pump. When the pumped discharge by the pump was zero, it indicated that the pump was off at that time. The estimated cost by the software is shown in Figure 5, which was equivalent to 1,899,000 Riyals (38.02€), that given its value before applying the algorithm (2,280,000 Riyals), about 15% savings have occurred. Also, on 29 October and 27 January, the costs before applying the scenario were 1,715,000 Riyals (34.34€) and 1,600,000 Riyals (32.04€), respectively, which reached 1,423,450 Riyals (28.50€) and 1,353,600 Riyals (27.11€) with the help of GAO. These results were equal to 17% and 15.4% savings.
Figure 5 shows the cost achieved by the software on 29 May 2017, after 50 generations. The algorithm shows the most optimal case depending on the type and function and efficiency of the pumps available at this station.
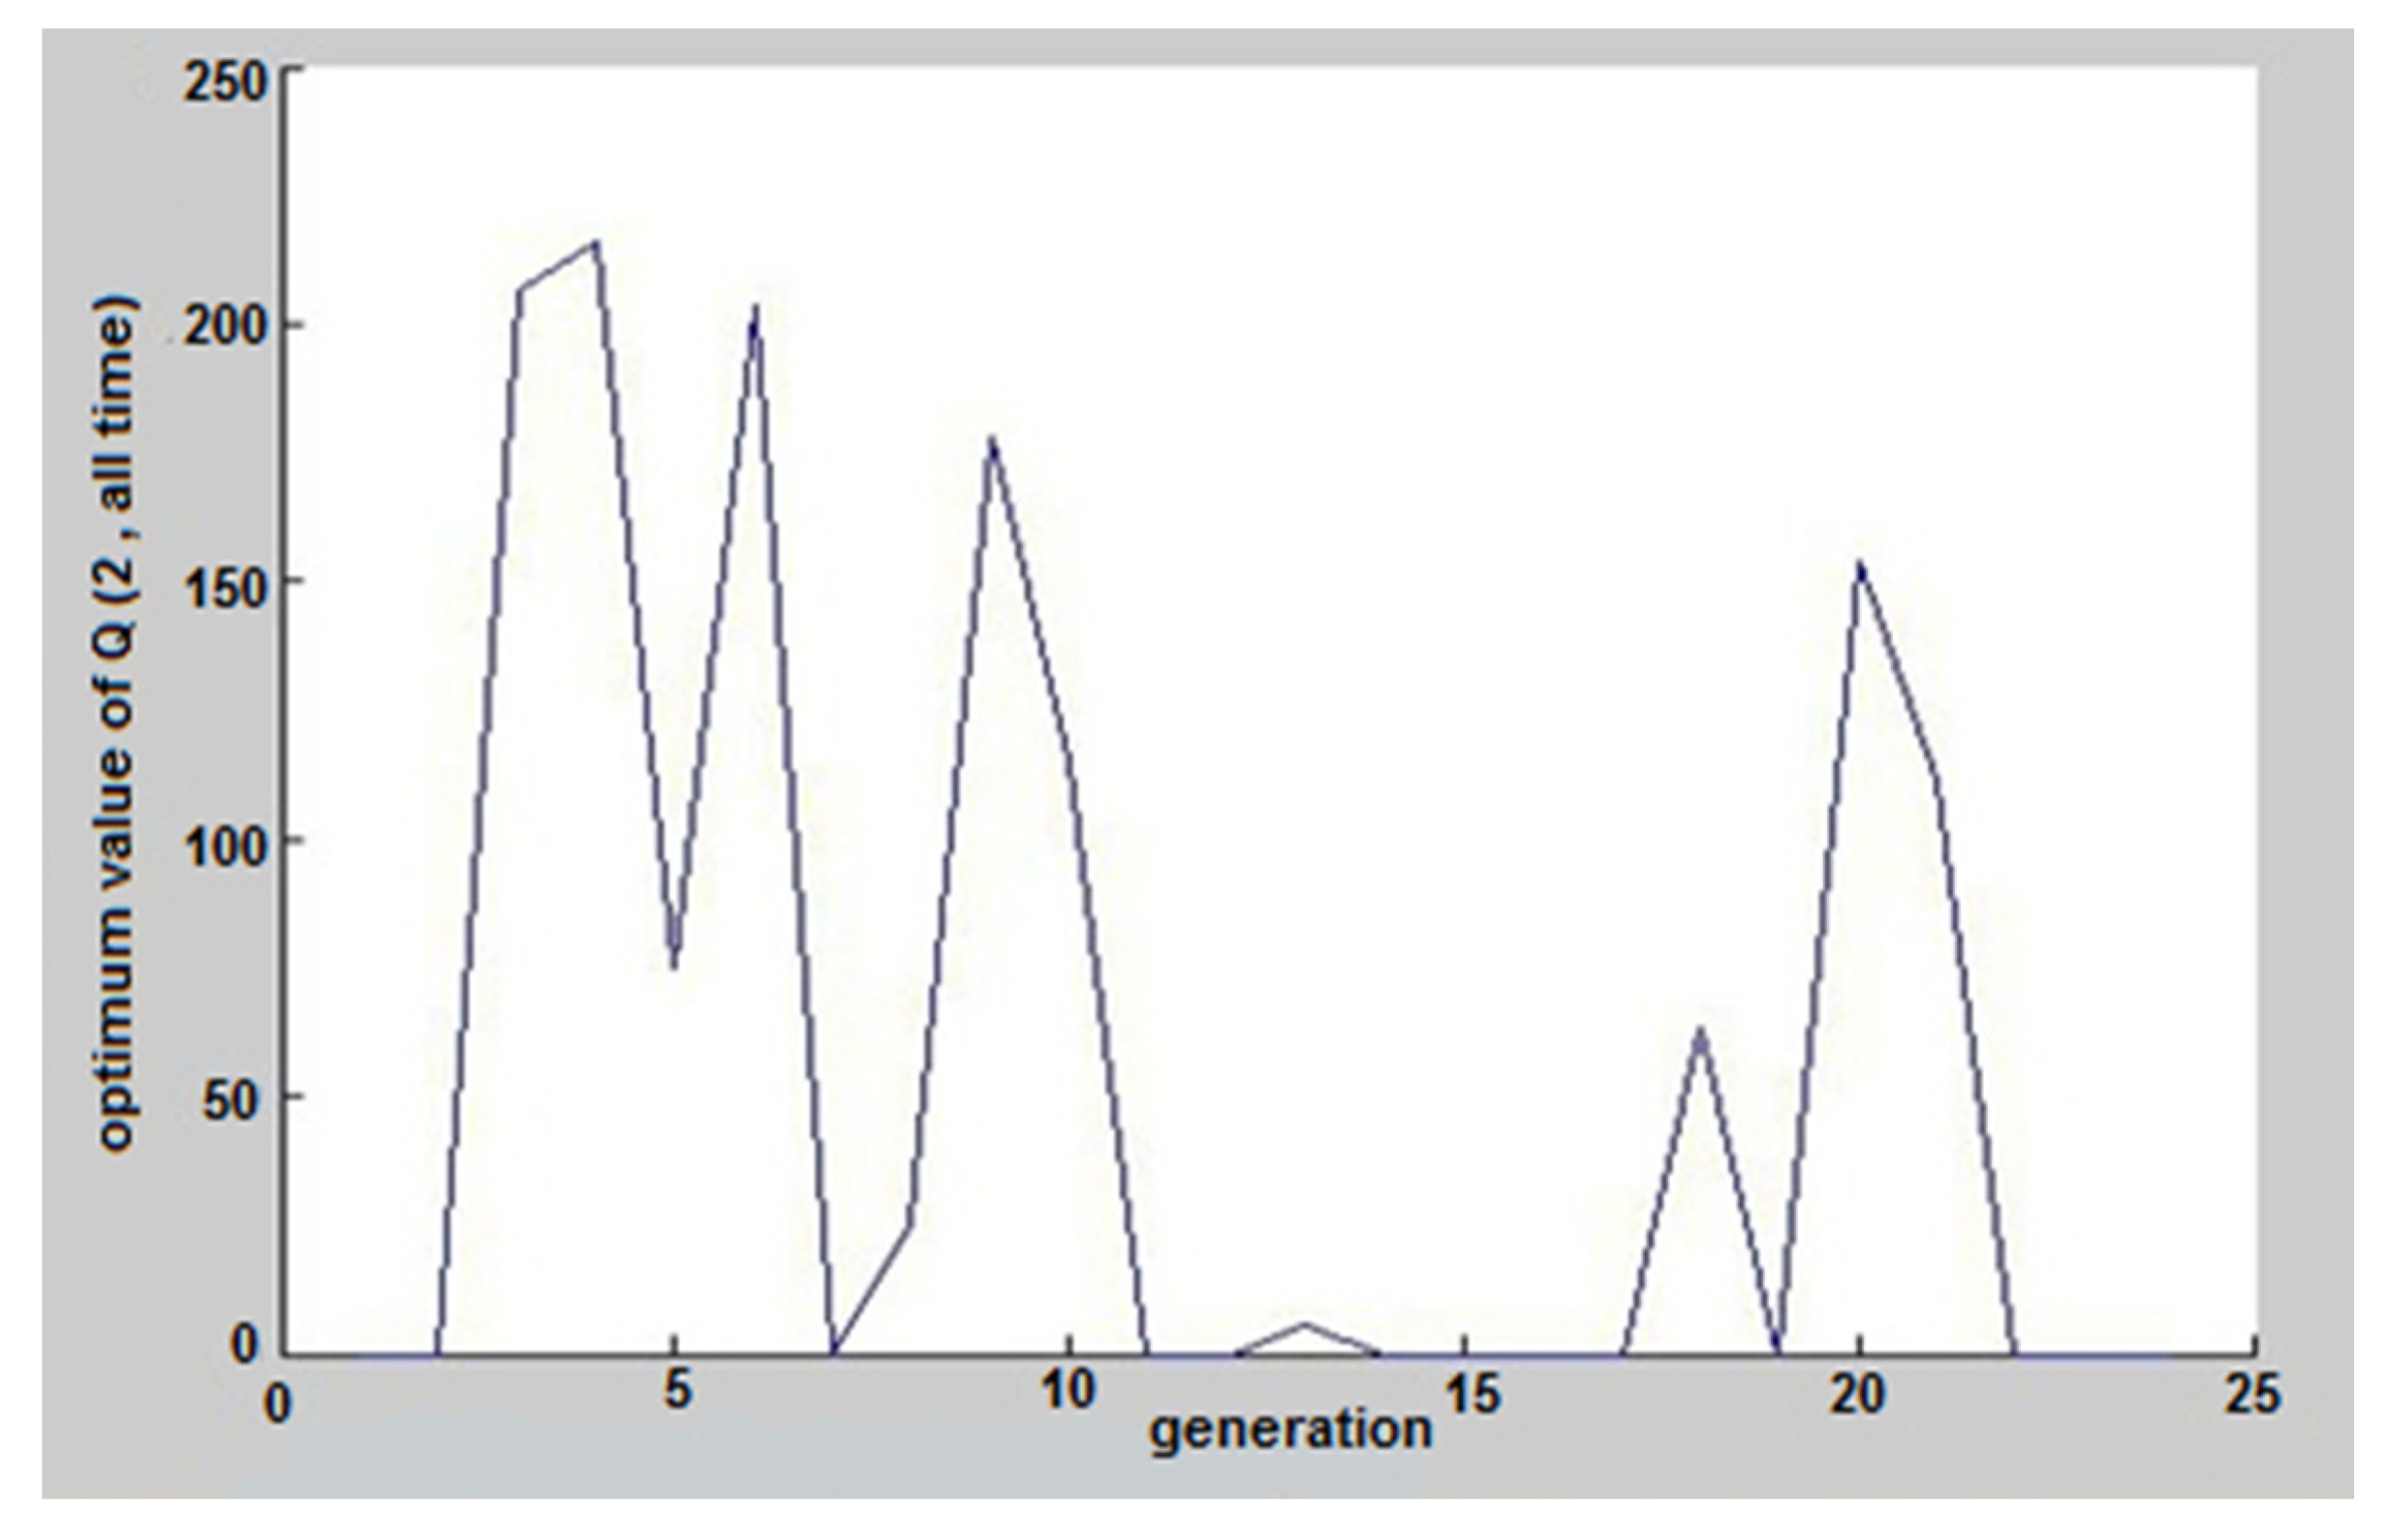
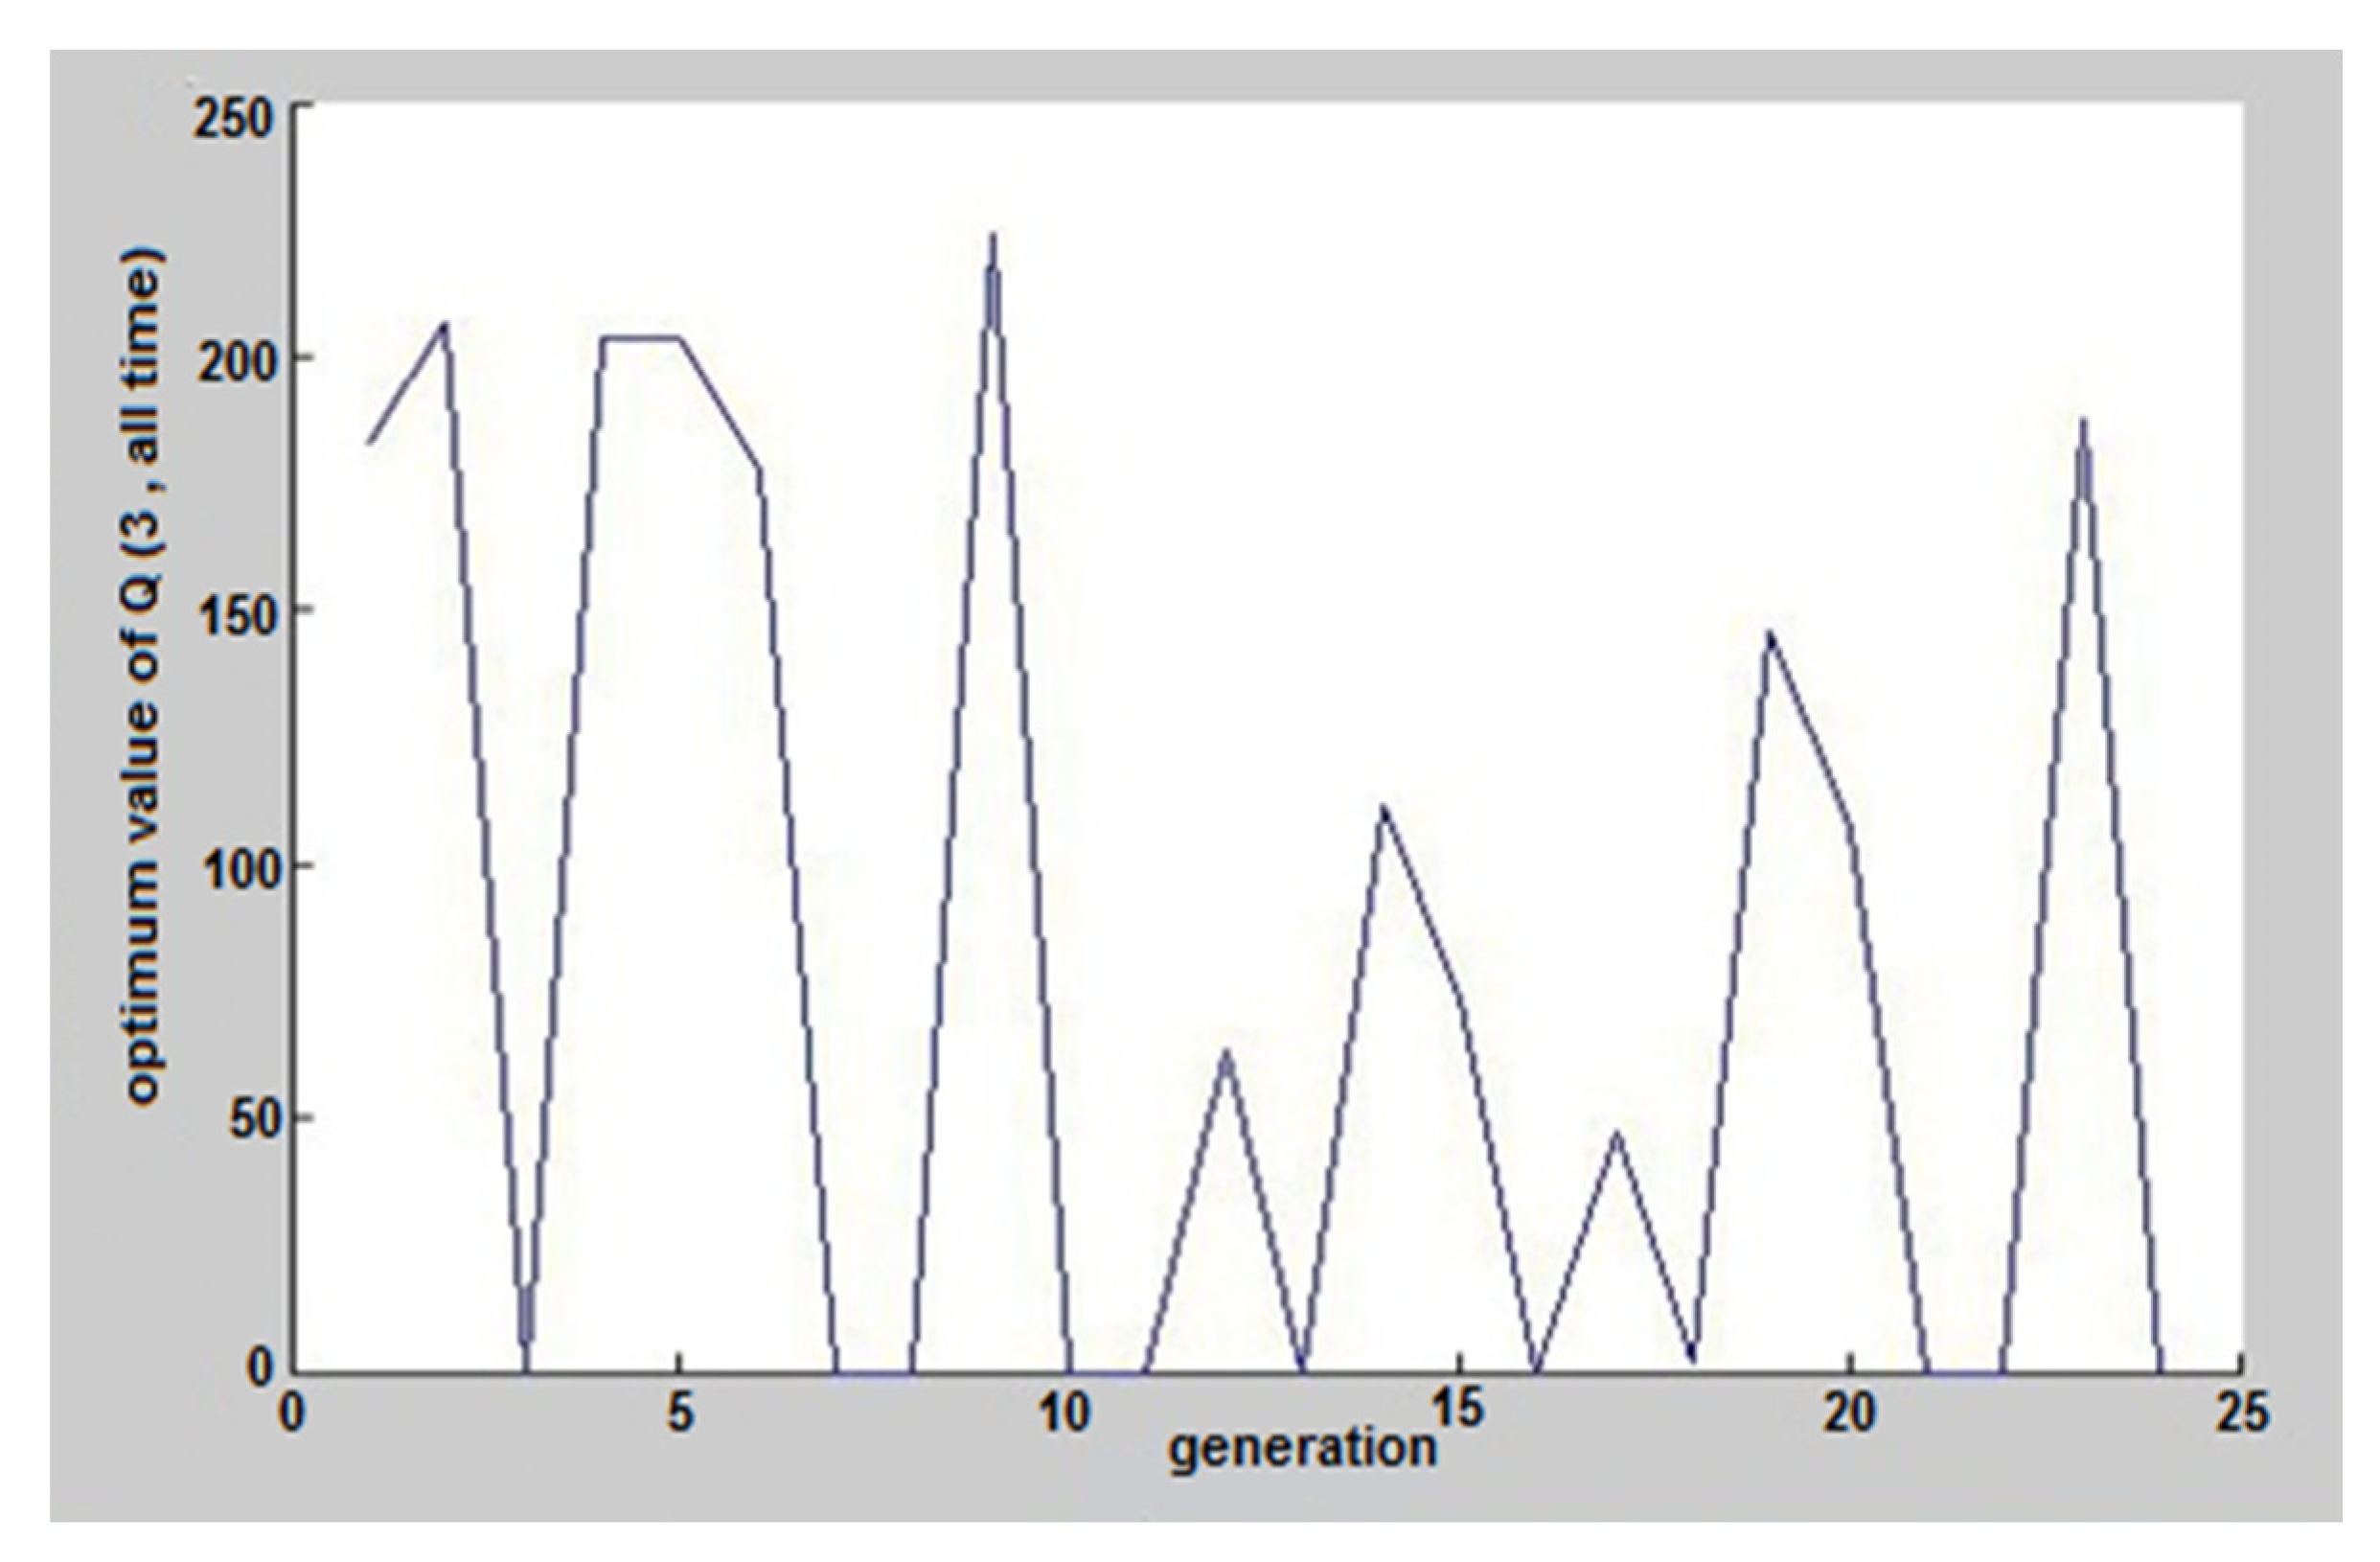
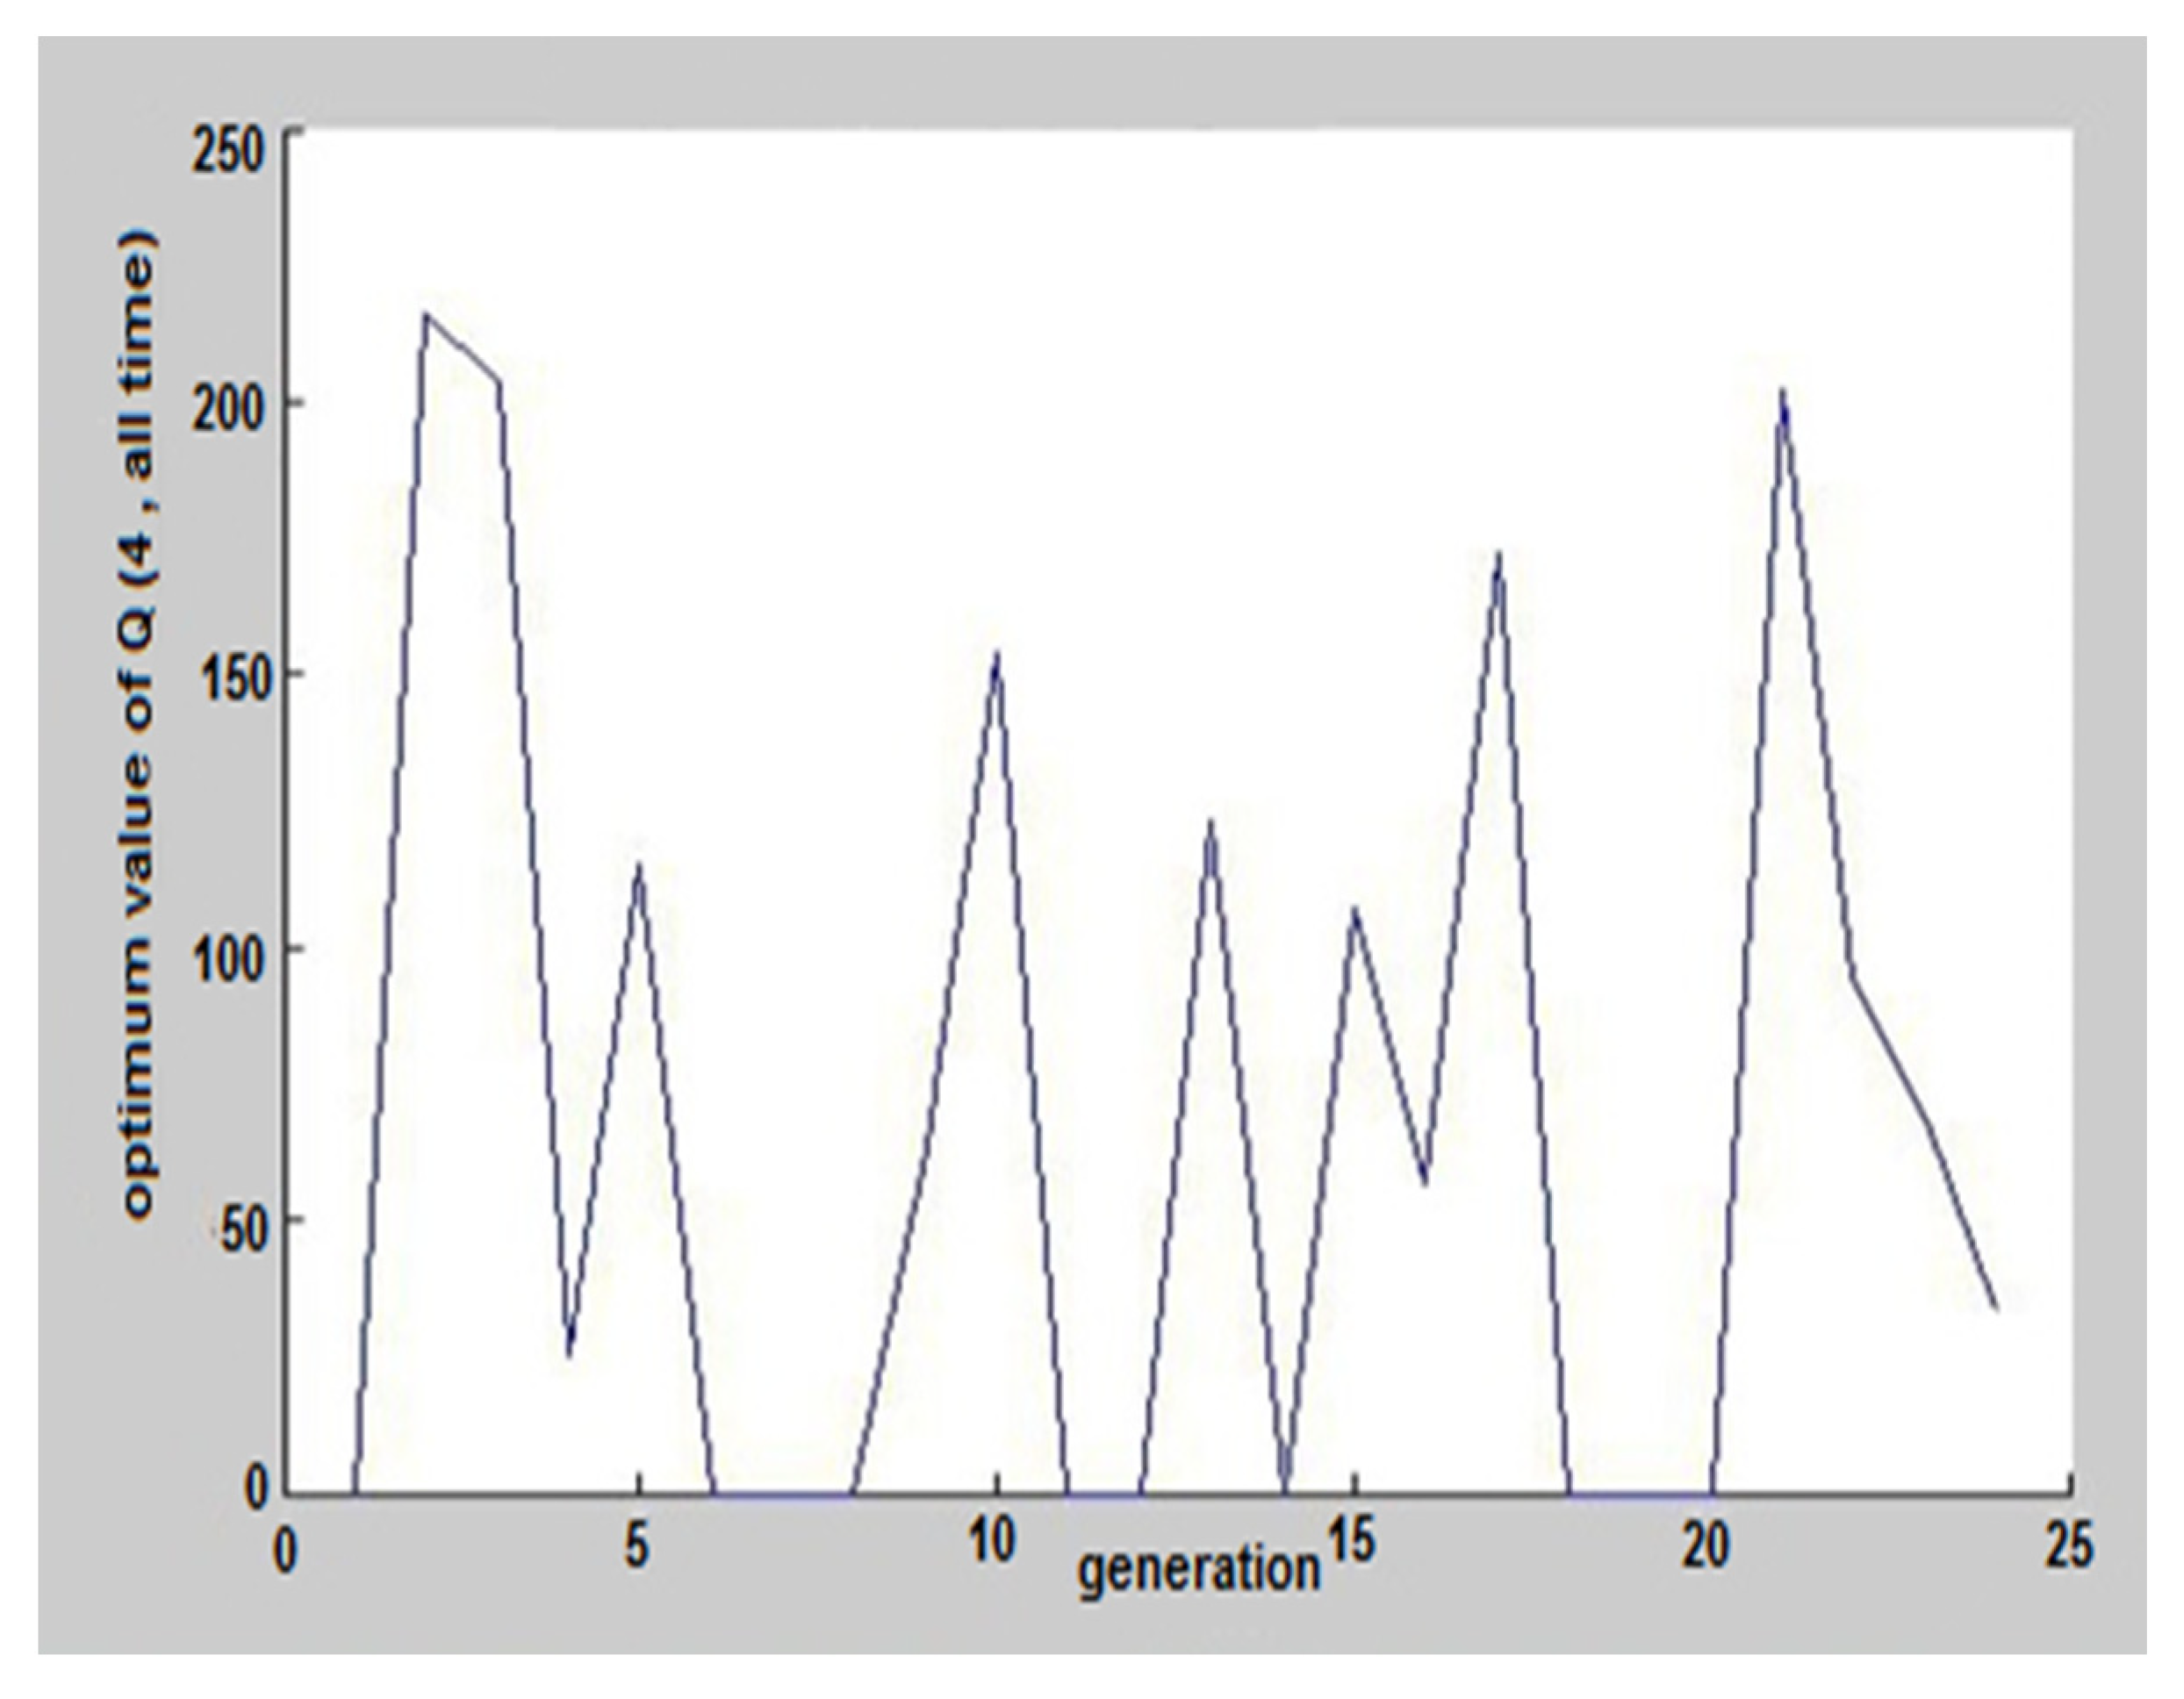
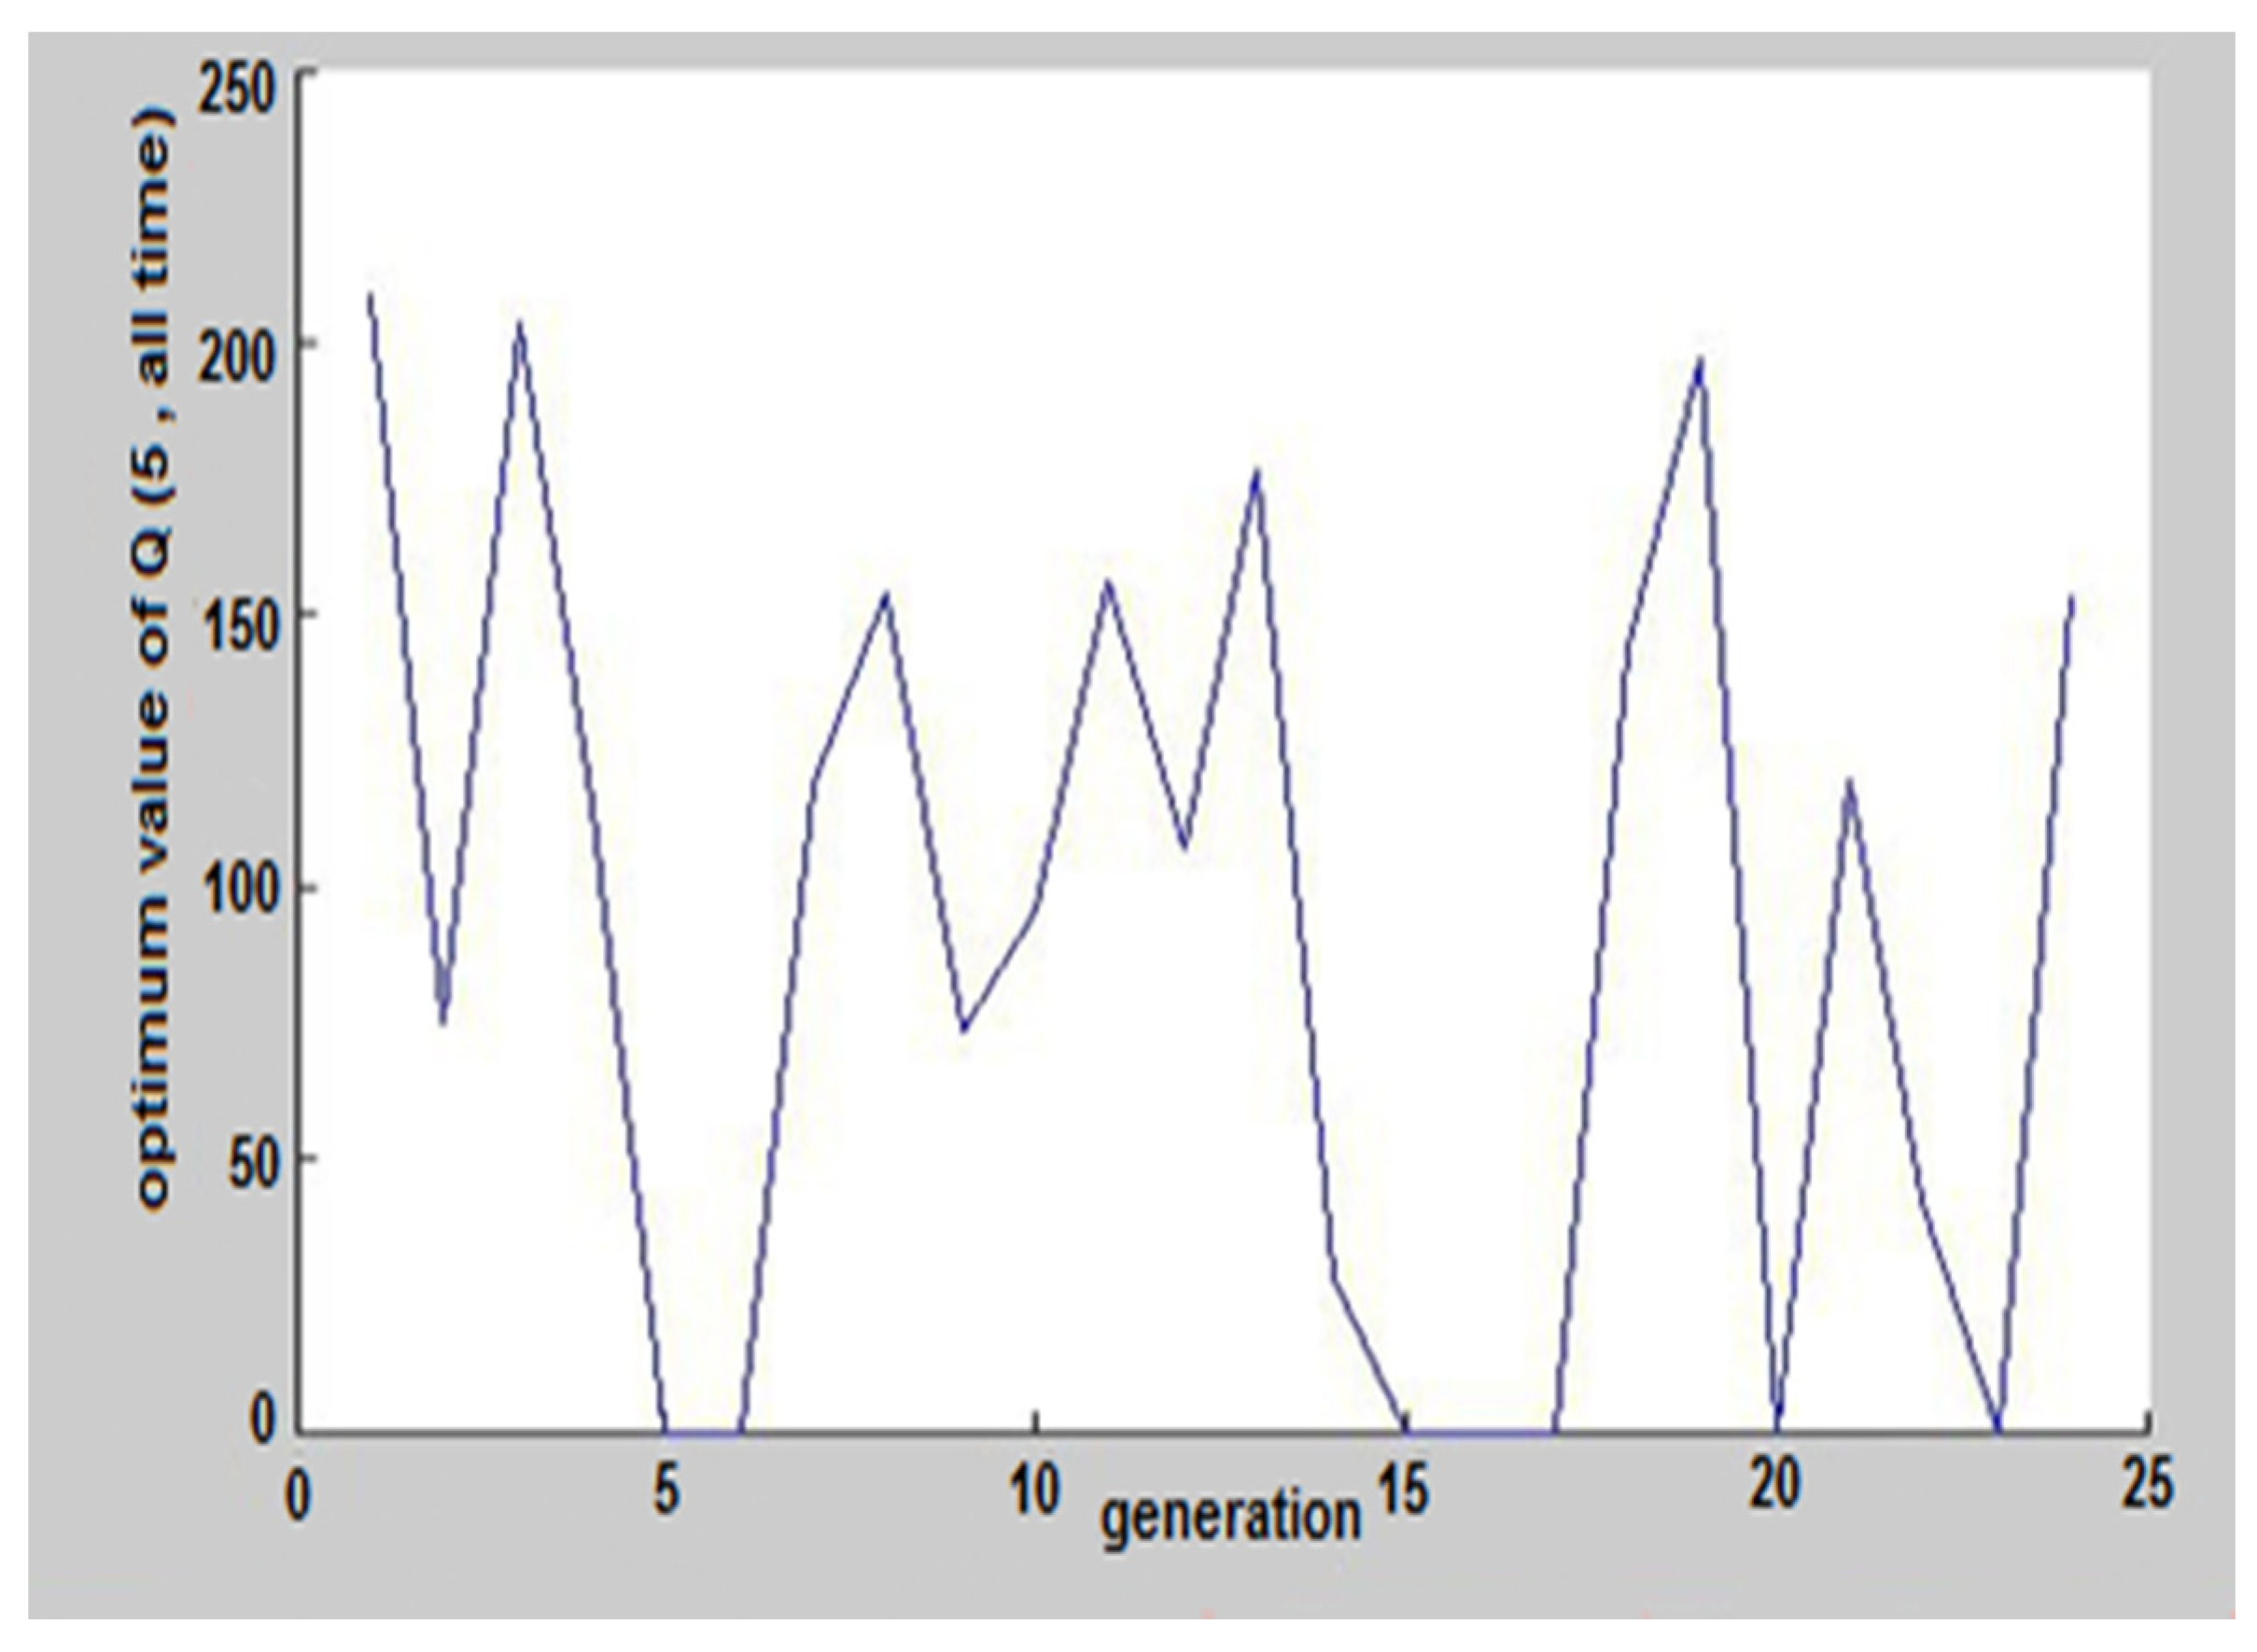
The consumption and operating hours of each pump can be seen in Figure 6, Figure 7, Figure 8, Figure 9, Figure 10, Figure 11 and Figure 12. By using the results and figures below, a regular schedule for the operation of the pumps over 24 h was provided.
As can be seen from Figure 6, pump number 1 has pumped the highest discharge at 11 p.m. This pump had been switched off on 29 May for 7 h, two hours of which had been on peak consumption time. The average flow rate of this pump according to the output of the algorithm was equal to 94.7 cubic meters per second.
It can be seen from Figure 7, that a maximum pumped discharge from pump 2 was from 3 a.m. to 5 a.m. This pump has also been switched off for 11 h on this day.
According to Figure 8, the highest use of pump number 3 was before 10 a.m. This pump had been switched off for 10 h on 29 May.
According to Figure 9, pump 4 has pumped the highest discharge from 3 a.m. to 5 a.m. This pump had been switched off for a total of 10 h on this day.
The pump 5, according to Figure 10, had been switched off on 29 May 2017, for 7 h. This pump has pumped the highest discharge early in the morning.
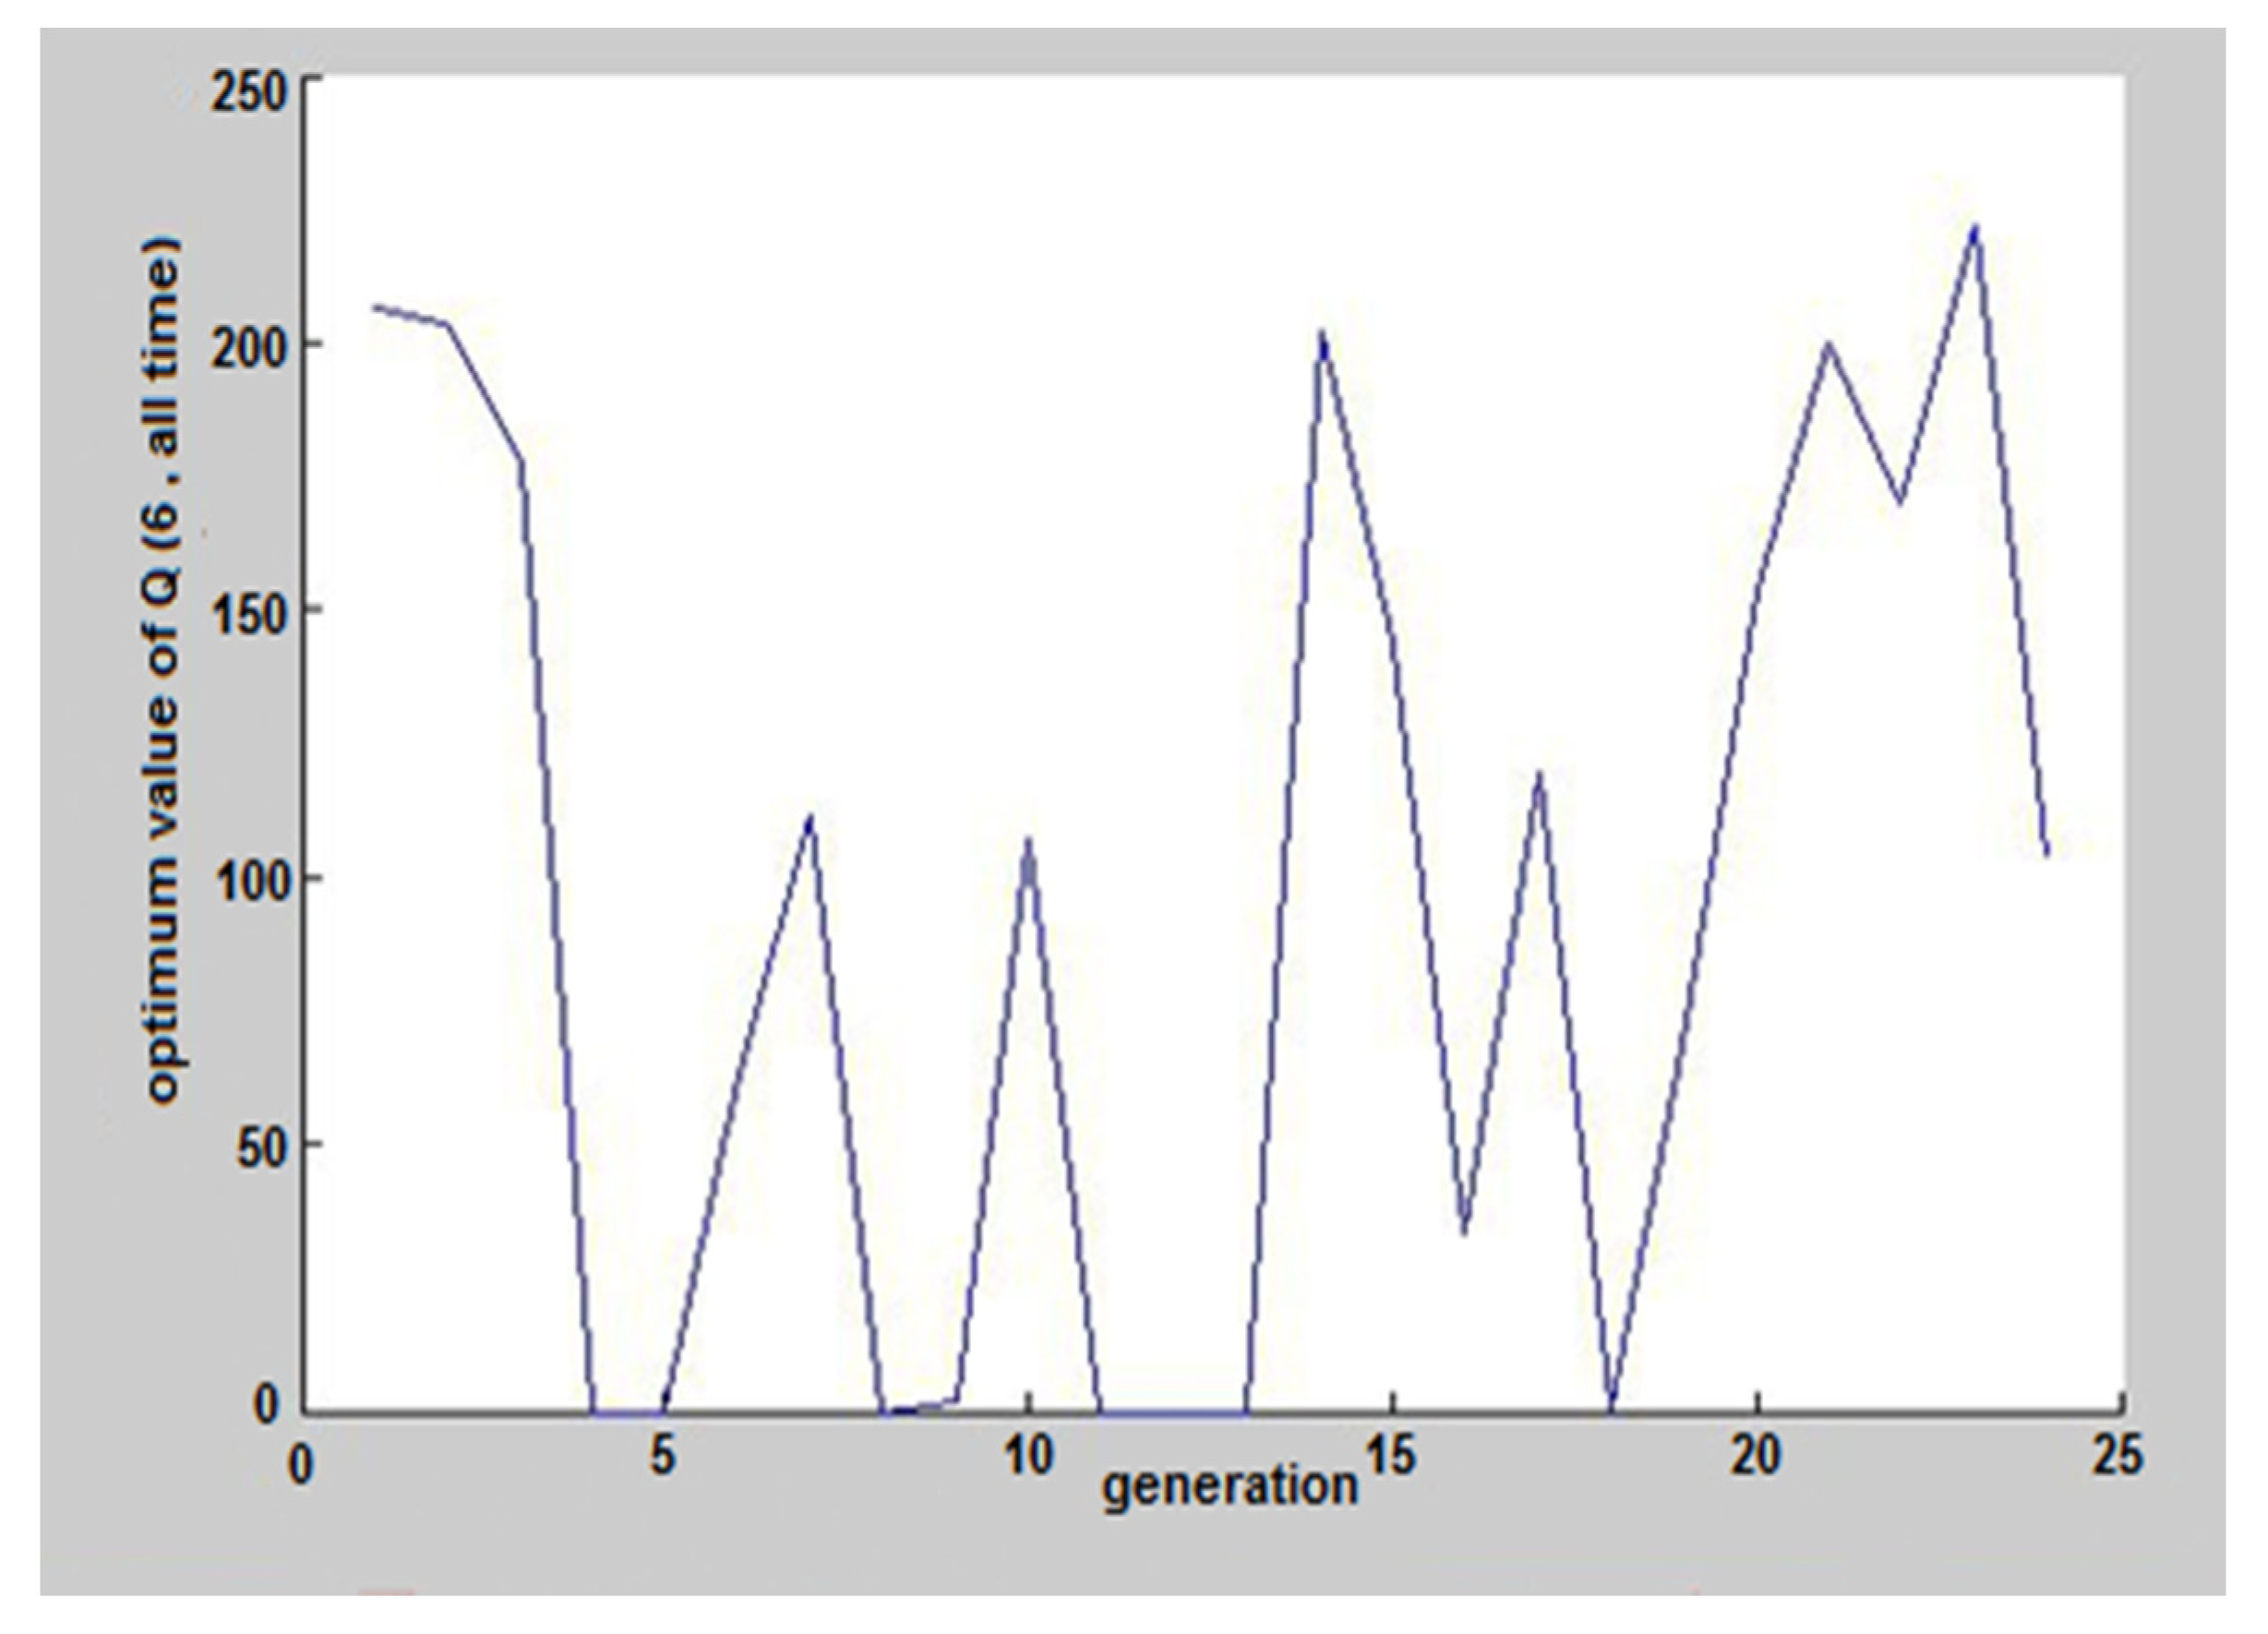
As shown in Figure 11, pump number 6 had been switched off for 7 h on 29 May. The maximum pumped discharge by this pump was at 11 p.m.
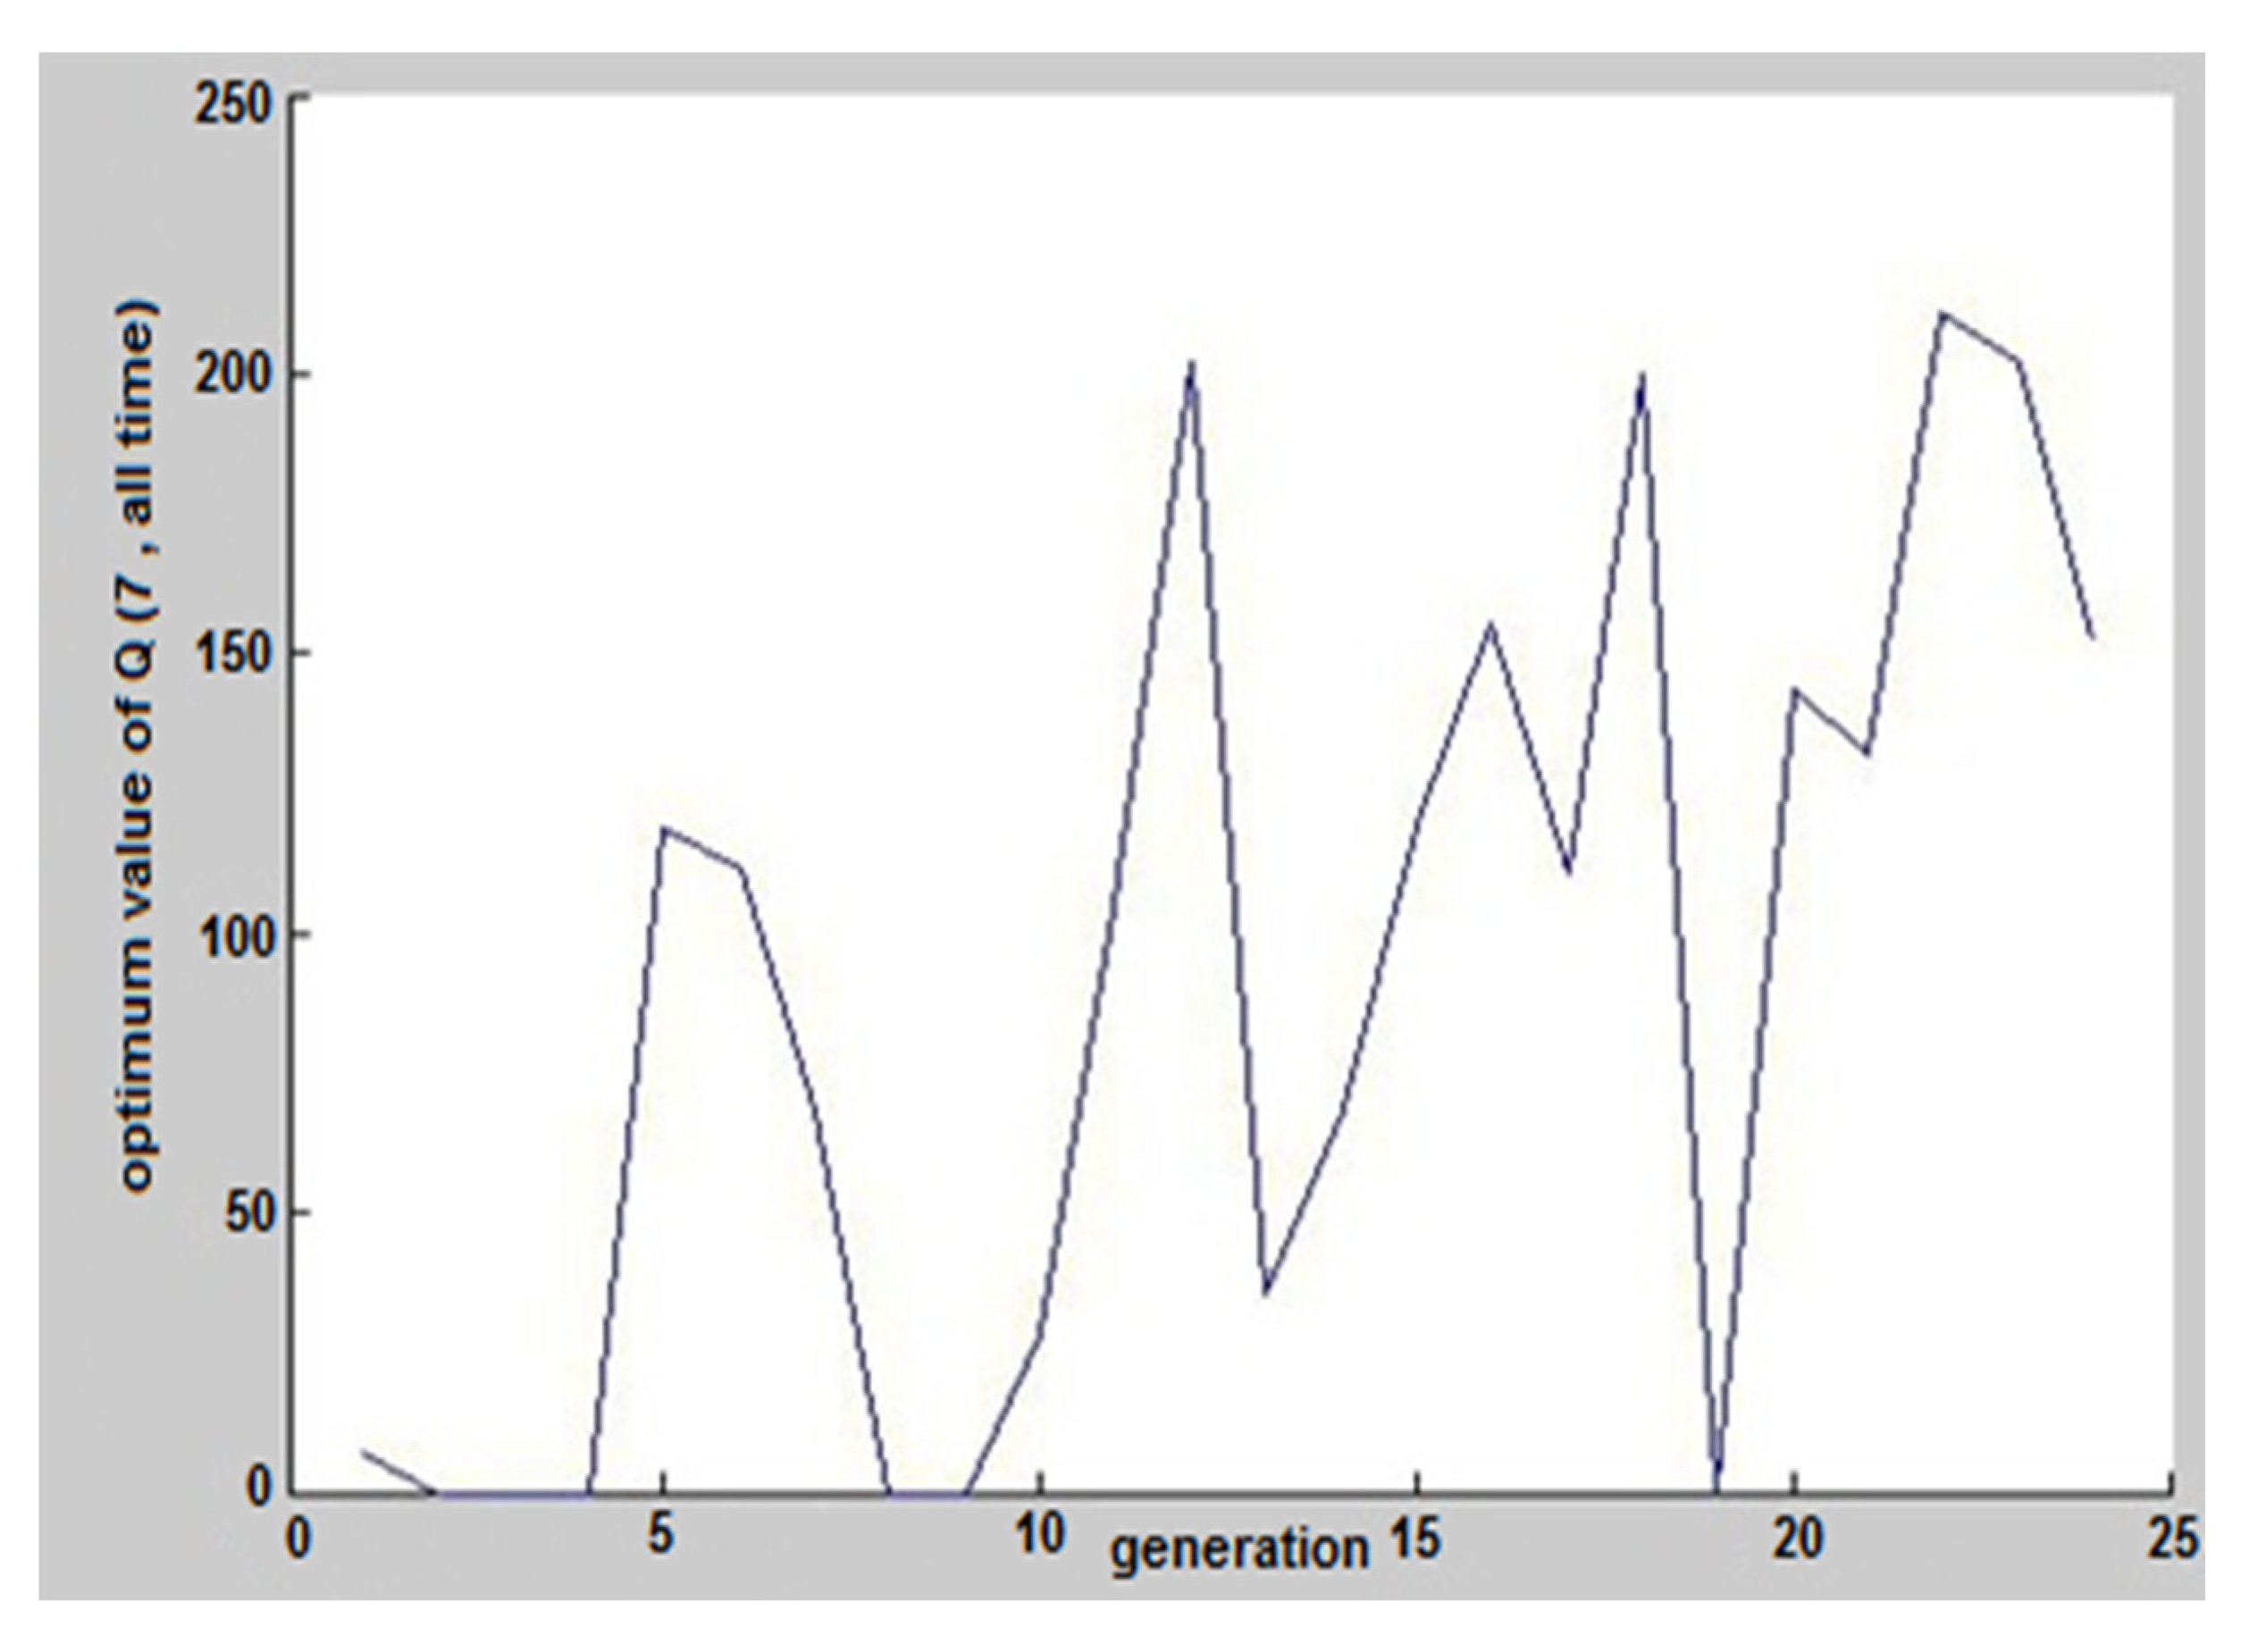
As can be seen in Figure 12, pump number 7 had been switched off only for 6 h during this day. This pump has mostly been used during medium consumption hours. Also, this pump had been switched on at all peak power consumption hours. The results from this section are shown as binary model timing schedule in Table 3.
In Table 3, zero means the pump is off and number 1 means the pump is switched on at any given hour. It allows the tanks to be filled and then switches off the pumps, allowing water to be supplied from the water reservoir. The pumps corresponding to the water reservoir are then switched on once the corresponding tank level reaches a minimum level. This large-scale nonlinear optimization model simultaneously captures the design and performance of the system. It also allows the designer as well as the operator to provide the best possible combination of design variables and performance parameters.
5. Conclusions
Energy saving is one of the most important challenging issues of urban water management and GA is critical to reducing energy costs while guaranteeing a satisfactory water supply service in urban areas. The main purpose of this study was to investigate the efficient use of pumping stations for the water supply of Gonabad city in Iran. The outflow discharges per month, as well as the working hours of each pump, were examined based on energy cost. There were also significant limitations to the project, including pumping depreciation and incomplete information. However, with the help of MATLAB software and the Genetic Optimization Algorithm (GAO), optimal energy costs in 3 random days and operating hours of each pump along with their discharge were investigated. The obtained results showed that by applying this scenario, costs can be reduced by up to 15% to 17% per day. If there were only an average of 10% reduction in cost per day, a cost of 83,220,000 Riyals (1666.46€) would be saved over a year. Also, using this model and selecting suitable pumps for the building of the new pumping stations provides a great impact on increasing efficiency and side costs. A major portion of the cost reduction results from energy savings by employing a better operation rule.
Author Contributions
Conceptualization, S.D., B.Đ. and L.P.; Data curation, S.D.; Formal analysis, B.Đ.; Investigation, S.D.; Methodology, S.D.; Software, S.D.; Supervision, E.A.; Validation, E.A.; Visualization, S.D.; Writing–original draft, S.D.; Writing–review & editing, B.Đ., and L.P. All authors have read and agreed to the published version of the manuscript.
Funding
This research received no external funding.
Institutional Review Board Statement
Not applicable.
Informed Consent Statement
Not applicable.
Data Availability Statement
Data supporting reported results can be found at “Khorasan Razavi Water and Wastewater Organization”.
Acknowledgments
This research was partially supported by the Khorasan Razavi Water and Wastewater Organization. We thank Hasani and Saeed Mokhtari employees of Gonabad Water and Wastewater Organization for their assistance with a complete description of the filtration system, operating procedures, pumping station, and pump specifications, and Alireza Jahed, Electrical Engineer, for comments on the Electricity System that greatly improved the manuscript. We are also immensely grateful to Siamak Gol Nargesi Professor of Khavaran University for his comments on an earlier version of the manuscript, although any errors are our own and should not tarnish the reputations of these esteemed persons.
Conflicts of Interest
The authors declare no conflict of interest.
References
- Hussein, H.; Conker, A.; Grandi, M. Small is beautiful but not trendy: Understanding the allure of big hydraulic works in the Euphrates-Tigris and Nile waterscapes. Mediterr. Politics 2020, 1–24. [Google Scholar] [CrossRef]
- Martin-Candilejo, A.; Santillán, D.; Iglesias, A.; Garrote, L. Optimization of the Design of Water Distribution Systems for Variable Pumping Flow Rates. Water 2020, 12, 359. [Google Scholar] [CrossRef] [Green Version]
- Bene, J.G.; Selek, I.; Hős, C. Neutral Search Technique for Short-Term Pump Schedule Optimization. J. Water Resour. Plan. Manag. 2010, 136, 133–137. [Google Scholar] [CrossRef]
- Oikonomou, K.; Parvania, M.; Khatami, R. Optimal Demand Response Scheduling for Water Distribution Systems. IEEE Trans. Ind. Inform. 2018, 14, 5112–5122. [Google Scholar] [CrossRef]
- Filipe, J.; Bessa, R.J.; Reis, M.; Alves, R.; Póvoa, P. Data-driven predictive energy optimization in a wastewater pumping station. Appl. Energy 2019, 252, 113423. [Google Scholar] [CrossRef] [Green Version]
- Jowitt, P.W.; Germanopoulos, G. Optimal Pump Scheduling in Water-Supply Networks. J. Water Resour. Plan. Manag. 1992, 118, 406–422. [Google Scholar] [CrossRef]
- Yu, G.; Powell, R.S.; Sterling, M.J.H. Optimized pump scheduling in water distribution systems. J. Optim. Theory Appl. 1994, 83, 463–488. [Google Scholar] [CrossRef]
- Lansey, K.E.; Awumah, K. Optimal Pump Operations Considering Pump Switches. J. Water Resour. Plan. Manag. 1994, 120, 17–35. [Google Scholar] [CrossRef]
- Ormsbee, L.E.; Reddy, S.L. Nonlinear Heuristic for Pump Operations. J. Water Resour. Plan. Manag. 1995, 121, 302–309. [Google Scholar] [CrossRef]
- Savić, D.A.; Walters, G.A.; Schwab, M. Multiobjective genetic algorithms for pump scheduling in water supply. Comput. Vis. 1997, 227–235. [Google Scholar] [CrossRef]
- Baltar, A.M.; Fontane, D.G. Use of Multiobjective Particle Swarm Optimization in Water Resources Management. J. Water Resour. Plan. Manag. 2008, 134, 257–265. [Google Scholar] [CrossRef]
- Ostfeld, A.; Tubaltzev, A. Ant Colony Optimization for Least-Cost Design and Operation of Pumping Water Distribution Systems. J. Water Resour. Plan. Manag. 2008, 134, 107–118. [Google Scholar] [CrossRef]
- Maghdoori, A.; Khodashenas, S.R.; Pezeshki, A.; Dadar, S. Optimization of Tailraces by Ant Colony Algorithm. Int. J. Adv. Sci. Technol. 2020, 29, 5384–5407. [Google Scholar]
- López-Ibáñez, M.; Prasad, T.D.; Paechter, B. Representations and Evolutionary Operators for the Scheduling of Pump Operations in Water Distribution Networks. Evol. Comput. 2011, 19, 429–467. [Google Scholar] [CrossRef]
- Raucher, R.S.; Cromwell, J.E., III; Cooney, K.; Thompson, P.; Sullivan, L.; Carrico, B.; MacPhee, M.; Wilkinson, R. Risks and Benefits of Energy Management for Drinking Water Utilities; Report; AWWA Research Foundation: Denver, CO, USA; California Energy Commission: Sacramento, CA, USA, 2008; ISBN 978-1-60573-000-4. [Google Scholar]
- Zeitoun, M.; Messerschmid, C.; Attili, S. Asymmetric Abstraction and Allocation: The Israeli-Palestinian Water Pumping Record. Ground Water 2009, 47, 146–160. [Google Scholar] [CrossRef] [PubMed]
- Jamali Jaghdani, T.; Kvartiuk, V. The Energy-Water Nexus in Iran: The Political Economy of Energy Subsidies for Groundwater Pumping. In A Nexus Approach for Sustainable Development; Hülsmann, S., Jampani, M., Eds.; Springer: Cham, Switzerland, 2021. [Google Scholar]
- Liptrot, L.; Hussein, H. Between regulation and targeted expropriation: Rural-to-urban groundwater reallocation in Jordan. Water Altern. 2020, 13, 864–885. [Google Scholar]
- Sovacool, B.K.; Sovacool, K.E. Identifying future electricity–water tradeoffs in the United States. Energy Policy 2009, 37, 2763–2773. [Google Scholar] [CrossRef]
- Mohammadi, M. Optimization of Energy Consumption at Water Pumping Stations. Fourth National Power Promotion Network with the Approach to Removing Production Barriers under Sanctions; Sharif University of Technology Studies Center: Tehran, Iran, 2012; pp. 3–9. (In Persian) [Google Scholar]
- Rajabi, G.H.; Mobini, B.A. Management of Energy Consumption in the Water and Sewage System. In Proceedings of the Third International Energy Conference, Tehran, Iran, 1 May 2002; Available online: https://civilica.com/doc/17924/ (accessed on 10 January 2021). (In Persian).
- Vahedian, J.; Abdollahi, A.; RashidiNejad, M. Investigation of Optimization of Pumping Wells in Kerman Province in Power Consumption Management. In Proceedings of the 30th International Conference of Electricity, Tehran, Iran, 2 November 2015; Available online: https://www.sid.ir/fa/seminar/ViewPaper.aspx?ID=79180 (accessed on 10 January 2021). (In Persian).
- Saghafi, S.; Mehrdadi, N.; Nabi Bidhendi, G.; AminiRad, H. Determine the electric energy consumed in different processes of the Nasir Abad industrial city’s refinery with COD removal approach. J. Ecol. 2014, 1, 19–31. [Google Scholar]
- Dutta, G.; Mitra, K. A literature review on dynamic pricing of electricity. J. Oper. Res. Soc. 2017, 68, 1131–1145. [Google Scholar] [CrossRef] [Green Version]
- Garrick, D.; De Stefano, L.; Yu, W.; Jorgensen, I.; O’Donnell, E.; Turley, L.; Aguilar-Barajas, I.; Dai, X.; Leão, R.D.S.; Punjabi, B.; et al. Rural water for thirsty cities: A systematic review of water reallocation from rural to urban regions. Environ. Res. Lett. 2019, 14, 043003. [Google Scholar] [CrossRef]
- Zydney, J.M.; Hai-Jew, S.; Renninger, K.A.; List, A.; Hardy, I.; Koerber, S.; Lattal, K.A.; Farrell, J.M.; Fretwell, H.; Reiss, N.; et al. Simulation Model. Encycl. Sci. Learn. 2012, 3075. [Google Scholar] [CrossRef]
- Brion, L.M.; Mays, L.W. Methodology for Optimal Operation of Pumping Stations in Water Distribution Systems. J. Hydraul. Eng. 1991, 117, 1551–1569. [Google Scholar] [CrossRef]
- Little, K.W.; McCrodden, B.J. Minimization of Raw Water Pumping Costs Using MILP. J. Water Resour. Plan. Manag. 1989, 115, 511–522. [Google Scholar] [CrossRef]
- Mala-Jetmarova, H.; Sultanova, N.; Savic, D. Lost in optimisation of water distribution systems? A literature review of system operation. Environ. Model. Softw. 2017, 93, 209–254. [Google Scholar] [CrossRef] [Green Version]
- Puleo, V.; Morley, M.; Freni, G.; Savic, D. Multi-stage Linear Programming Optimization for Pump Scheduling. Procedia Eng. 2014, 70, 1378–1385. [Google Scholar] [CrossRef] [Green Version]
- Celi, C.L.; Iglesias-Rey, P.; Solano, F.M. Energy Optimization of Supplied Flows from Multiple Pumping Stations in Water Distributions Networks. Procedia Eng. 2017, 186, 93–100. [Google Scholar] [CrossRef]
- Wang, Y.; Puig, V.; Cembrano, G. Non-linear economic model predictive control of water distribution networks. J. Process Control 2017, 56, 23–34. [Google Scholar] [CrossRef] [Green Version]
- Zhuan, X.; Xia, X. Optimal operation scheduling of a pumping station with multiple pumps. Appl. Energy 2013, 104, 250–257. [Google Scholar] [CrossRef]
- Zhuan, X.; Li, W.; Yang, F. Optimal Operation Scheduling of a Pumping Station in East Route of South-to-north Water Diversion Project. Energy Procedia 2017, 105, 3031–3037. [Google Scholar] [CrossRef]
- Wang, H.; Lei, X.; Khu, S.-T.; Song, L. Optimization of Pump Start-Up Depth in Drainage Pumping Station Based on SWMM and PSO. Water 2019, 11, 1002. [Google Scholar] [CrossRef] [Green Version]
- Rasoulzadeh-Gharibdousti, S.; Haddad, O.B.; Mariño, M.A. Optimal design and operation of pumping stations using NLP-GA. Proc. Inst. Civ. Eng. Water Manag. 2011, 164, 163–171. [Google Scholar] [CrossRef]
- Mackle, G. Application of genetic algorithms to pump scheduling for water supply. In Proceedings of the 1st International Conference on Genetic Algorithms in Engineering Systems: Innovations and Applications (GALESIA), Sheffield, UK, 12–14 September 1995; Institution of Engineering and Technology (IET): Edinburgh, UK, 1995; Volume 1995, pp. 400–405. [Google Scholar]
- Moradi-Jalal, M.; Karney, B.W. Optimal design and operation of irrigation pumping stations using mathematical programming and Genetic Algorithm (GA). J. Hydraul. Res. 2008, 46, 237–246. [Google Scholar] [CrossRef]
- Xu, X.; Yan, Y.; Ma, Q. Study on Operation Control Strategy of Adjacent Pump Stations in Long Distance Multistage Pumping Station Control System; IEEE: Piscataway, NJ, USA, 2018; Volume 170, pp. 382–387. [Google Scholar]
- Sajjadi, S.A.; Ebrahimi, A.; Kianmehr, M.; Salari, S.; Hashemi, M.; Zanganeh, S.H.; Chavoshani, A. Modeling Environmental UV and Gamma Radiations for Health Protection; Health Scope: Teheran, Iran; IEEE: Piscataway, NJ, USA, 2018; Volume 7, p. 14061. [Google Scholar] [CrossRef]
- Dadar, S.; Alamatian, E. Investigating the Impact of Reservoir Volume Change on Reduction of Electricity Consumption Cost in Gonabad Pumping Stations. World J. Environ. Biosci. 2020, 9, 21–32. [Google Scholar]
- Kramer, O. Studies in Computational Intelligence. Genetic Algorithm Essentials; IEEE: Piscataway, NJ, USA, 2017; p. 679. ISBN 978-3-319-52155-8. [Google Scholar]
- Hashemi, S.S.; Tabesh, M.; Ataeekia, B. Ant-colony optimization of pumping schedule to minimize the energy cost using variable-speed pumps in water distribution networks. Urban Water J. 2013, 11, 335–347. [Google Scholar] [CrossRef]
- Capodaglio, A.; Olsson, G. Energy Issues in Sustainable Urban Wastewater Management: Use, Demand Reduction and Recovery in the Urban Water Cycle. Sustainability 2019, 12, 266. [Google Scholar] [CrossRef] [Green Version]
Figure 1.
Location of Gonabad city in Iran [40].
Figure 1.
Location of Gonabad city in Iran [40].

Figure 2.
(a) Pumps operating hours on 29 May 2017, (b) Pumps operating hours on 27 January 2017, (c) Pumps operating hours on 29 October 2016.
Figure 2.
(a) Pumps operating hours on 29 May 2017, (b) Pumps operating hours on 27 January 2017, (c) Pumps operating hours on 29 October 2016.

Figure 3.
Hours of pump operation at low consumption, medium consumption, and high consumption hours in each month.
Figure 3.
Hours of pump operation at low consumption, medium consumption, and high consumption hours in each month.

Figure 4.
Total operating hours at low consumption, medium consumption, and high consumption hours from October 2016 to August 2017.
Figure 4.
Total operating hours at low consumption, medium consumption, and high consumption hours from October 2016 to August 2017.

Figure 5.
The cost obtained from software output after 50 generations on 29 May 2017.

Figure 6.
Pumped discharge from pump 1 on 29 May 2017.

Figure 7.
Pumped discharge from pump number 2 on 29 May 2017.

Figure 8.
Pumped discharge from pump number 3 on 29 May 2017.

Figure 9.
Pumped discharge from pump number 4 on 29 May 2017.

Figure 10.
Pumped discharge from pump number 5 on 29 May 2017.

Figure 11.
Pumped discharge from pump number 6 on 29 May 2017.

Figure 12.
Pumped discharge from pump number 7 on 29 May 2017.


Table 1.
Geographical and physical characteristics of the water supply reservoir in Gonabad city [41].
Table 1.
Geographical and physical characteristics of the water supply reservoir in Gonabad city [41].
| Place of Establishment | UTM | Height (m) | Type of Reservoir | Function |
|---|---|---|---|---|
| Twin reservoir | 653345 300230 | 1128 | Ground reservoir | Storage |
Table 2.
Power consumption price at the pumping station.
| Low Consumption | High Consumption | Medium Consumption | Low Consumption | |
|---|---|---|---|---|
| 11 p.m. to 7 a.m. | 7 p.m. to 11 p.m. | 7 a.m. to 7 p.m. | 11 p.m. to 7 a.m. | First 6 months of the year |
| 10 p.m. to 6 a.m. | 6 p.m. to 10 p.m. | 6 a.m. to 6 p.m. | 10 p.m. to 6 a.m. | Second 6 months of the year |
| 106.5 | 426 | 213 | 106.5 | Price per 1 kWh in Rials |
Table 3.
Schedule of pumps (on/off) for a full day.
| Hours Pumps | 1 | 2 | 3 | 4 | 5 | 6 | 7 | 8 | 9 | 10 | 11 | 12 | 13 | 14 | 15 | 16 | 17 | 18 | 19 | 20 | 21 | 22 | 23 | 24 |
|---|---|---|---|---|---|---|---|---|---|---|---|---|---|---|---|---|---|---|---|---|---|---|---|---|
| Num1 | 1 | 0 | 1 | 1 | 1 | 1 | 0 | 0 | 1 | 0 | 0 | 1 | 0 | 1 | 1 | 0 | 1 | 1 | 1 | 1 | 0 | 0 | 1 | 0 |
| Num2 | 0 | 0 | 1 | 1 | 1 | 1 | 0 | 1 | 1 | 1 | 0 | 0 | 1 | 0 | 0 | 0 | 0 | 1 | 0 | 1 | 1 | 1 | 0 | 0 |
| Num3 | 1 | 0 | 0 | 0 | 1 | 1 | 1 | 1 | 0 | 0 | 1 | 1 | 1 | 0 | 1 | 1 | 1 | 1 | 1 | 1 | 0 | 0 | 1 | 0 |
| Num4 | 0 | 1 | 1 | 1 | 1 | 0 | 0 | 0 | 1 | 1 | 0 | 0 | 1 | 0 | 1 | 1 | 1 | 0 | 0 | 0 | 1 | 1 | 1 | 1 |
| Num5 | 1 | 1 | 1 | 1 | 0 | 0 | 1 | 1 | 1 | 1 | 1 | 1 | 1 | 1 | 0 | 0 | 0 | 1 | 1 | 0 | 1 | 1 | 0 | 1 |
| Num6 | 1 | 1 | 1 | 0 | 0 | 1 | 0 | 1 | 1 | 1 | 0 | 0 | 0 | 1 | 1 | 1 | 1 | 0 | 1 | 1 | 1 | 1 | 1 | 1 |
| Num7 | 1 | 0 | 0 | 0 | 1 | 1 | 1 | 0 | 0 | 1 | 1 | 1 | 1 | 1 | 1 | 1 | 1 | 1 | 0 | 1 | 1 | 1 | 1 | 1 |
Publisher’s Note: MDPI stays neutral with regard to jurisdictional claims in published maps and institutional affiliations. |
© 2021 by the authors. Licensee MDPI, Basel, Switzerland. This article is an open access article distributed under the terms and conditions of the Creative Commons Attribution (CC BY) license (https://creativecommons.org/licenses/by/4.0/).
Share and Cite
MDPI and ACS Style
Dadar, S.; Đurin, B.; Alamatian, E.; Plantak, L. Impact of the Pumping Regime on Electricity Cost Savings in Urban Water Supply System. Water 2021, 13, 1141. https://doi.org/10.3390/w13091141
AMA Style
Dadar S, Đurin B, Alamatian E, Plantak L. Impact of the Pumping Regime on Electricity Cost Savings in Urban Water Supply System. Water. 2021; 13(9):1141. https://doi.org/10.3390/w13091141
Chicago/Turabian StyleDadar, Sara, Bojan Đurin, Ebrahim Alamatian, and Lucija Plantak. 2021. "Impact of the Pumping Regime on Electricity Cost Savings in Urban Water Supply System" Water 13, no. 9: 1141. https://doi.org/10.3390/w13091141
Note that from the first issue of 2016, this journal uses article numbers instead of page numbers. See further details here.