Article

Evaluating the Impacts of Rice-Based Protection Dykes on Floodwater Dynamics in the Vietnamese Mekong Delta Using Geographical Impact Factor (GIF)

1
Karlsruhe Institute of Technology, Kaiserstraße 12, 76131 Karlsruhe, Germany
2
Mekong Water Technology Innovation Institute, 72 Tran Van Danh, Ward 13, Tan Binh dist., Ho Chi Minh City 700000, Vietnam
3
Center of Water Management and Climate Change, Institute for Environment and Resources, Vietnam National University Ho Chi Minh City (VNU-HCM), Ho Chi Minh City 700000, Vietnam
4
Institute of Environmental Sciences, Nguyen Tat Thanh University, Ho Chi Minh City 700000, Vietnam
*
Author to whom correspondence should be addressed.
Water 2021, 13(9), 1144; https://doi.org/10.3390/w13091144
Submission received: 31 March 2021 / Revised: 16 April 2021 / Accepted: 19 April 2021 / Published: 21 April 2021
(This article belongs to the Section Hydrology)

Abstract

:
This study aims at evaluating the geographical influences of rice-based protection dykes on floodwater regimes along the main rivers, namely the Mekong and the Bassac, in the Vietnamese Mekong Delta (VMD). Specifically, numerous low dykes and high dykes have been constructed particularly in the upper delta’s floodplains to protect the double and triple rice cropping against the annual flooding. For the whole deltaic domain, a 1D-quasi-2D hydrodynamic model setup was used to simulate seventy-two (72) scenarios of dyke construction development in the context of low, medium, and high floods that occurred in the VMD to examine the effects of different flood magnitudes on a certain dyke construction area. Based on the model simulation results, we established an evaluation indicator, the so-called Geographical Impact Factor (GIF), to evaluate the impacts of zone-based dyke compartments on the floodwater regimes along the main rivers for different kinds of floods. Our findings revealed different rates of influences on the floodwater levels along the Mekong and Bassac Rivers under different scenarios of zone-based high-dyke developments. GIF is a useful index for scientists and decision-makers in land use planning, especially in rice intensification, in conjunction with flood management for the VMD and for similar deltas worldwide.

1. Introduction

Being home to over 17 million people, the Vietnamese Mekong Delta (VMD) is the agriculturally most productive region of the nation. It contributes approximately 50% of the national rice production with 90% of the rice exports, produces 70% of the fresh tropical fruits and 60% of the aquaculture and fisheries, and accounts for 34% of the poultry for the country [1,2]. However, the delta has been facing several natural challenges due to river-bed mining and dyke construction [3], coastal erosion [4], land subsidence [5], salinity intrusion [6,7], hydropower dam developments [8], and especially flooding [3,9,10]. In addition, the VMD is one of the deltas most vulnerable to increased flooding with climate change [8,11] and sea level rise [12,13,14].
As shown in Figure 1, the VMD is located in the lower part of the Mekong River with an area of about 3.9 million hectares accounting for 5% of the Mekong River basin [6]. Due to the physical conditions of low-lying topography with a large proportion of areas below +2 m above mean sea level, it is annually impacted by flooding from the upstream areas. Floods usually start in June/July and end in November/December, causing an inundated depth of 0.5 to 4.0 m to an area of 1.9 million hectares of the delta [15,16]. Flooding is a normal phenomenon in the VMD, and the local people refer to it as “floating season”. Typically, annual floods are essential to conserve the floodplain biodiversity and to supply natural fishes as well as fertile sediments for farm production in the delta [2]. The people in the delta therefore have a traditional alternative, the so-called “living with floods”, to make floodwaters indispensable to the agricultural production in the VMD [17,18]. However, extreme flood events pose a threat to people and properties [10,19,20].
Flood magnitude in the VMD is classified by the water levels measured at Tan Chau station, see Figure 2. Based on the conventional observations, when the water level at Tan Chau is below 4.0 m, the magnitude is defined as a low flood. When the water level is between 4.0 m to 4.5 m, it is referred to as regular or normal flood; and when the water level is above 4.5 m, it is considered a high flood [21]. According to Kuenzer et al. [22], the flood regime in the Mekong Delta is defined by a combination of four influences, including (i) the flood inflow mainly induced by the flood flow on the Mekong River and transborder flow; (ii) flood due to high local rainfall intensity; (iii) the tidal flood primarily during spring tide and in particular with a storm surge condition; and (iv) man-made flood due to development activities in the delta. Flood occurrences are triggered by a combination of several of these factors. As a result, the potential flood risk in VMD is not only caused by the natural conditions but also the impacts of human activities with hydropower plants upstream and the land use strategy in the delta [11,22,23,24,25].
Since the adaptation of the innovative policy “Đổi Mới” by the Government of Vietnam in 1986, the Vietnam’s economy has transformed from a centrally-planned model to the market oriented one [27]. As a result, in the field of agriculture, the development of intensive rice cropping has been rapidly expanding in the VMD [28]. Therefore, the delta is popularly known as the largest “rice bowl” of Vietnam. Notably, the shift to triple rice cropping from double rice cropping has made Vietnam one of the top rice-exporting countries in the rice market worldwide [29]. However, the construction of dyking system in the deep-flooded zones, such as the Plain of Reeds (PoR) and the Long Xuyen Quadrangle (LXQ), may cause negative impacts on the water regimes in downstream areas. Figure 3 presents some pictures of low dyke and high dyke performance during the flood season as well as a map of spatial distribution of dykes in the VMD surveyed by the Southern Institute of Water Resources Research (SIWRR) in 2011, herein the dyke is classified based on the crest elevation. When the crest of dyke is below +4.0 m, it is considered as low dyke, whereas the crest is equal or higher than +4.0 m, it is defined as high dyke. Whereas low dykes aim to protect the two rice crops against floodwater until the middle of August, high dykes are intended to protect the triple rice fields from the flood completely.
Several researches about flooding have been implemented in the VMD to support authorities and administrators in land use management in conjunction with flood management based on the rapid development of technologies and computer sciences. By simulating the floods of 1996, 2000, and 2007, the studies by Hoa et al. [15,16] concluded the impacts of human-made dyke systems on floods. Besides, Van et al. [30] revealed the impacts of dykes on the flooding regimes in the Long Xuyen Quadrangle in 2011 and the boundary conditions in 2000. In addition, the relation of land use patterns in the last decade with flooding regimes in the VMD was studied by combining hydraulic modelling with satellite technology. Duong et al. [20] analysed the impacts of high dykes on the change of flood water levels along the Mekong and Bassac Rivers based on the boundary conditions of two historical flood events in 2000 and 2011 using the numerical model MIKE11. Similarly, Triet et al. [9] used the MIKE11 model to simulate the projections also for the two high floods in 2000 and 2011 to identify the reasons for the change in flood level along the Mekong Rivers. In their research, they expressed the reasons for this change mainly due to (i) high dyke development for triple rice cropping in upstream provinces, (ii) the effects of tidal levels due to sea level rise and land subsidence, and (iii) the temporal coincidence of high water levels and spring tides. Additionally, Tran et al. [10] expanded the research done by Van et al. [30] to assess the impacts of dyke construction in the LXQ on the flood dynamics along the Bassac River by using the numerical model MIKE11 to evaluate the impact of different projections of dyke construction in the LXQ based on the boundary conditions of two high floods in 2011 and a medium flood in 2013. Recently, Thanh et al. [31] introduced a new approach of using DELFT3D Flexible Mesh to analyse the flood distribution in the VMD due to the construction of high dyke. They evaluated the impacts of high dykes in the LXQ and PoR with the boundary conditions of high floods in 1981, 1991, and 2000. Last but not least, Triet et al. [13] examined the projections in flooding hazard and agricultural production due to different scenarios of human activities between two periods of baseline (1971–2000) and future (2036–2065). The study found that sea level rise and land subsidence are the major factors for the changes in flood hazard and influenced on rice cropping, the secondary factors relating to the development of hydropower in upstream countries as well as the impact of climate change.
Satellite remote sensing is a valuable tool for objectively detecting inundated areas. Therefore, several studies have been undertaken for flood monitoring in the VMD. For instance, Kunzer et al. [22] monitored the impacts of artificial dyke to flooding situation in the VMD based on radar satellite products from 2007 to 2011. Besides, Sakamoto et al. [32,33] analysed the spatial changes in the annual flooding extent and farming system in the VMD by MODIS satellite from 2000 to 2007. In addition, Duong et al. [20] analysed the correlation of land use pattern and flooding in the VMD by MODIS satellite from 2000 to 2012. Therewith, the impact of high dyke system within the floodplains was examined by Duong et al. [34] based on MODIS satellite for the two extreme floods in 2000 and 2011, see Figure 4.
To the authors’ knowledge, the impacts of zone-based high-dyke compartments on the floodwater dynamics and flood water levels in the VMD have not yet been studied comprehensively. Particularly, all previous studies focused on the assessment of the impacts of high dykes on the flooding situation along the Mekong Rivers based on high-flood conditions. Only Tran et al. [10] examined high floods and medium floods as boundary conditions, however in their study, they focused only on the scenarios of dyke construction in the LXQ and their influences on the Bassac River. Until now, the high dykes for triple rice production have been developed extensively across the upper floodplains of the VMD. The development has raised the question as to whether flood risk will increase downstream also under the conditions of medium- and low-floods if a particular part of the delta will be provided with dyke compartments in the future. This study aims to fill the knowledge gap by using a 1D-quasi-2D hydrodynamic model to run various zone-based high-dyke compartment scenarios to establish a Geographical Impact Factor (GIF). The GIF is expected to serve as a new index that helps the local authorities and decision-makers to immediately identify the impacts of dyke developments on flooding levels along the Mekong Rivers in any kind of flood discharge at any geographical location and area of the compartments. The findings in terms of water level dynamics are useful to provide administrators and decision-makers with a proper strategy for land use plans in conjunction with flood management.

2. Materials and Methods
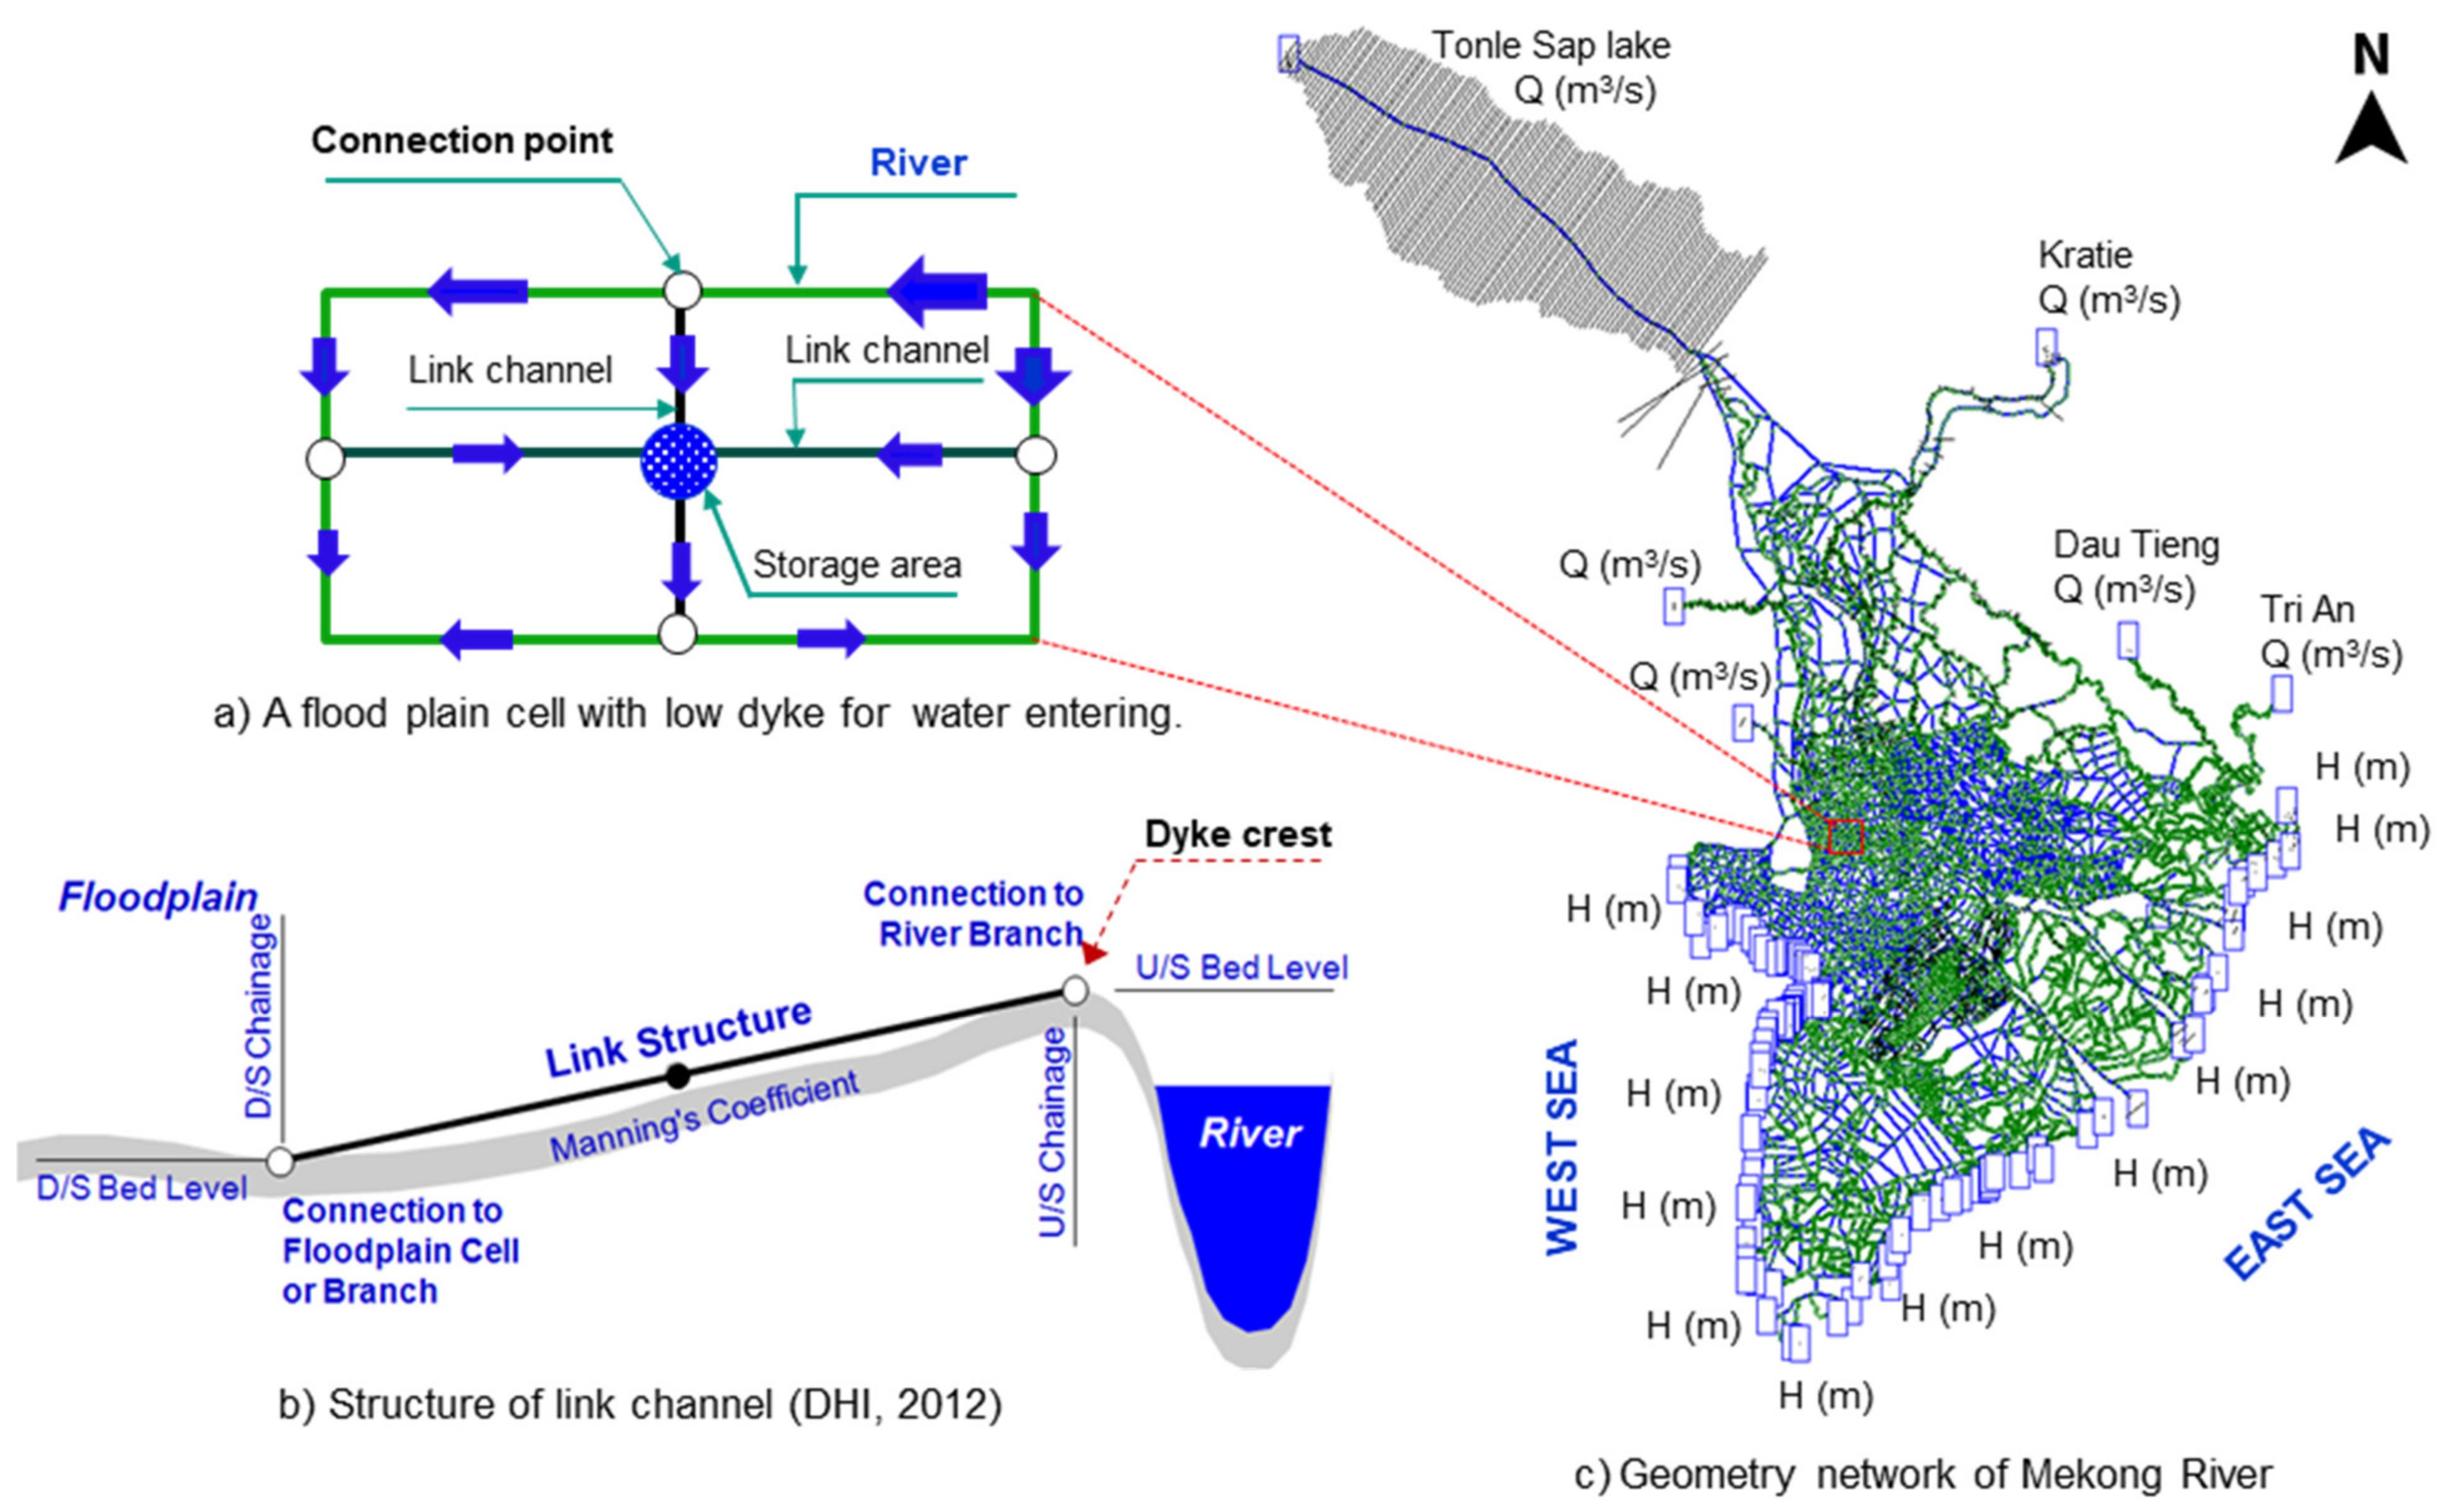
2.1. Model Setup

In this study, the Mike 11 hydrodynamic module (1D) is applied to represent the river network in the Mekong Delta which has one of the largest estuaries in the world with a highly complex hydraulic system [35]. The MIKE 11 model developed by Denmark Hydraulic Institute (DHI) uses an implicit finite difference scheme for the computation of unsteady flows in rivers and estuaries. It applies a dynamic wave description to solve the vertically integrated equations of the conservation of continuity and momentum referred to as Saint Venant equations [36]. This has been described in previous studies to serve modelling of water levels and floods for the whole VMD and its floodplains [9,10,13,20,35,37,38].
The Mekong River network’s geometry was rebuilt and improved based on the old river networks, which were kindly provided by the Institute for Water and Environment Research (IWER) and the Southern Institute for Water Resources Research (SIWRR), Vietnam. As shown in Figure 5, the network contains 3270 regular branches, 425 floodplains, and 358 weirs at the canals along the coast to control salinity intrusion in the dry season. In the flood season, these salinity control structures are freely open to discharge the floodwater to the sea. The upstream boundaries include the discharges at Kratie, Tonle Sap Lake on Cambodian territory, Tri An, and Dau Tieng reservoirs. In contrast, the downstream boundaries are the time series of water levels in the East Sea and the West Sea estuaries. Boundary conditions and descriptions are discussed in previous studies, i.e. [9,10,20,34,35].
The hydrological data used as inputs for the boundary condition and model calibration process were collected from several sources. Specifically, the water levels, rainfall, and discharge in 2000 and 2011 were collected from the IWER and SIWRR; the Digital Elevation Map (DEM) with a resolution of 90 m was kindly provided also by SIWRR. The water levels and discharge and rainfall in 2012 and 2013 were provided by the National Centre for Hydro-Meteorological Forecasting (NCHMF). Daily rainfall data were collected from seven meteorological stations in Cambodia and 20 stations in Vietnam. The surface water contributed to rivers and canals was described by the Thiessen polygons. Specifically, the rainfall run-off links include 326 sub-regions with data from rainfall gauges for each. The rainfall discharge was calibrated using the RR module in the Mike11 NAM.
Floodplain is the vital domain installed in the model to demonstrate the flooding situation in the VMD. The Mike 11 model has a capability to account in a realistic way for floodplain storage during flood events although a two-dimensional (2D) model is usually required to simulate the flood dynamics of a floodplain. Specifically, two approaches that have often been applied in previous studies could be considered for VMD floodplain simulation by use of MIKE 11. In the study by Dung et al. [35], most of the compartments represent a closed system surrounded by dykes and channels, hence flood cells are modelled by artificial branches with low and wide cross sections linked to the channels by control structures. Here, weirs were used to represent dykes and dyke overflow, and sluice gates were used whenever information on existing sluice gates was available. In this study, the link channel geometry conceptualized by DHI [36] was introduced to typically comprise the definition of a longitudinal geometry of the embankment along the river (Figure 5a). By using the method, we set up numerous water storage areas represented for the floodplains and determine specific elevations of dyke crests that prevent floodwater from entering into the floodplains to complement the floodplains into the 1D model, it is namely 1D-quasi2D hydrodynamic model.
Link channels are used to simulate the floodplains components in the MIKE11 as shown in Figure 4, the link channels connect to the branches or rivers and keep an important function as additional flooding storage areas. For detailed information about the link channels, please see the MIKE 11 User manual [36].
The floodplains were set up with the exact crest elevations of low dykes and high dykes based on the surveyed data provided by SIWRR as shown in the Figure 3. However, the surveyed data was available only for the An Giang, Dong Thap, Long An, and Kien Giang provinces. For other provinces, such as Can Tho, Vinh Long, and Tien Giang, we used the MODIS water mask to identify the “dried areas” to put into the hydraulic model as high-dyke protection areas during the calibration and validation process for the floods under the dyke conditions in 2011, 2012, and 2013.
In the process of running each separate scenario of high-dyke compartment to prevent the floodwater from entering into the floodplains due to the construction of high-dykes, we put the crest of the link channel to up to +6.00 m. In view of the fact that the peaks of the high floods in 2000 and 2011 were only +5.06 m and +4.89 m, respectively, the floods thus could not overflow into the floodplains studied. Although both approaches show good results after calibration, the approach adopted in this study is faster (around 45 min each scenario) and more valuable to flood simulation in comparison to the approach by [9,10,35] that requires more work for preparation of the input data and more time for simulation (around 4–5 h) due to the operation of numerous weirs and artificial branches for the floodplains.

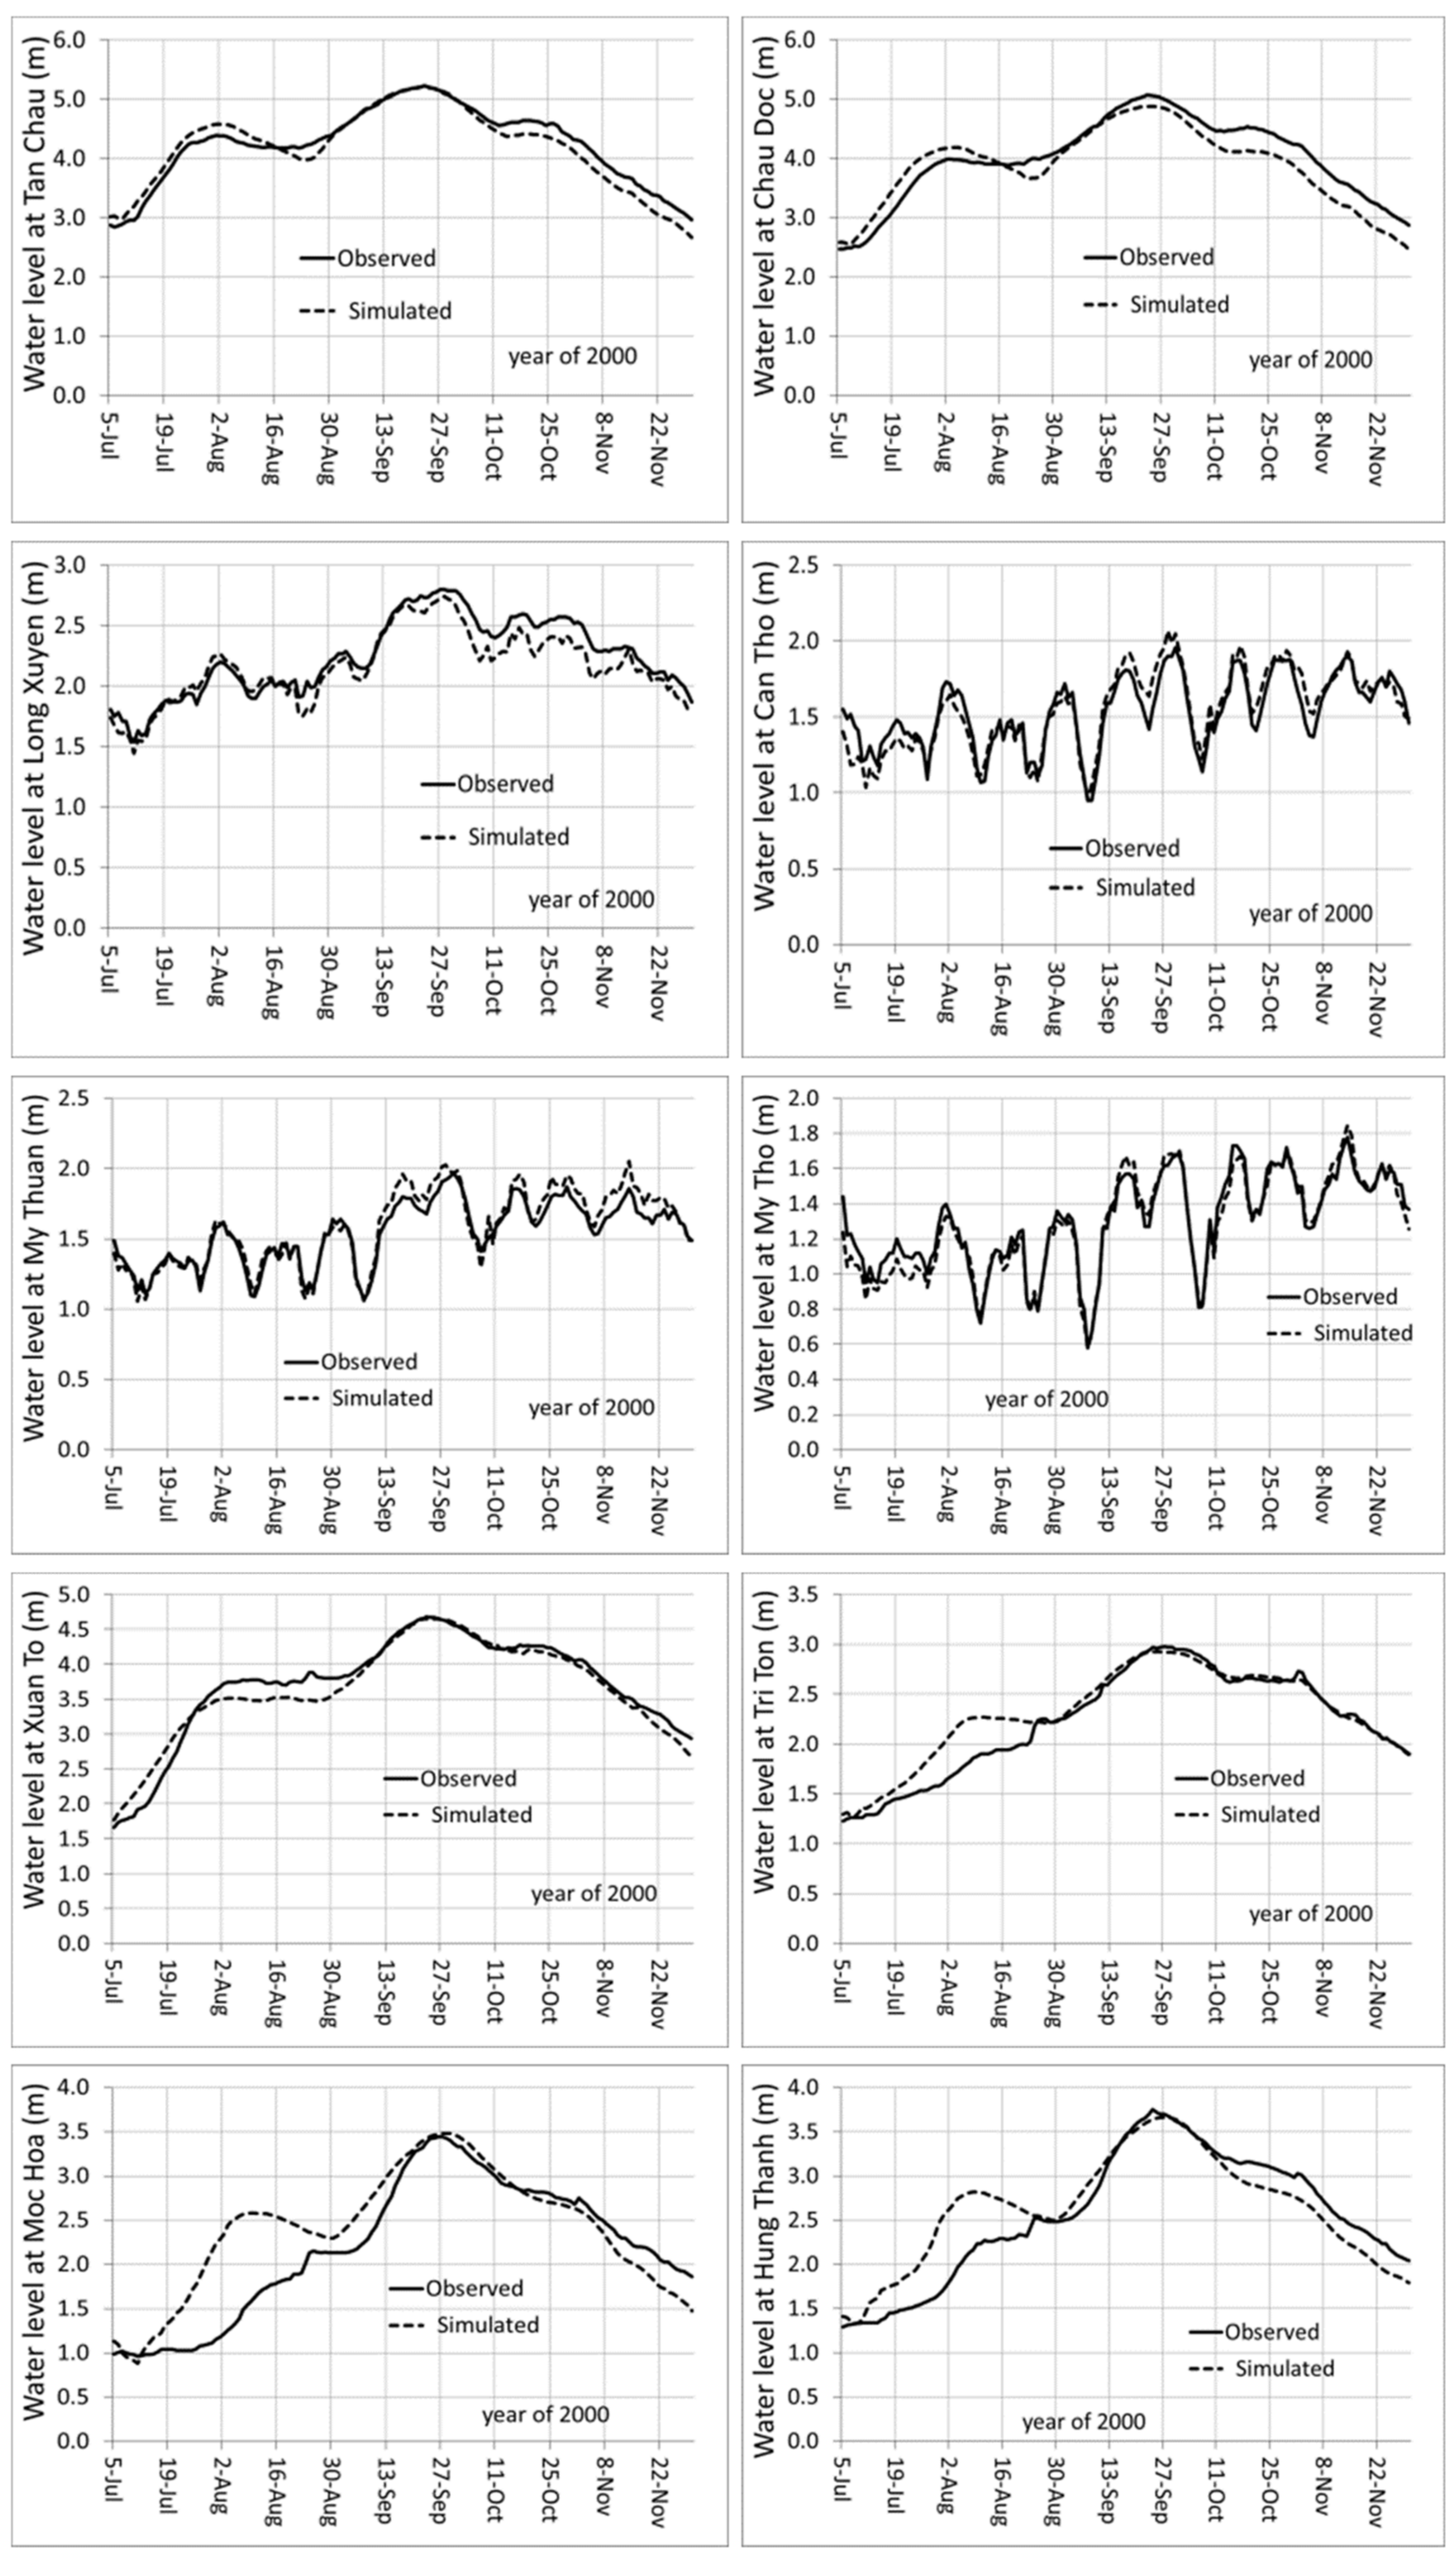
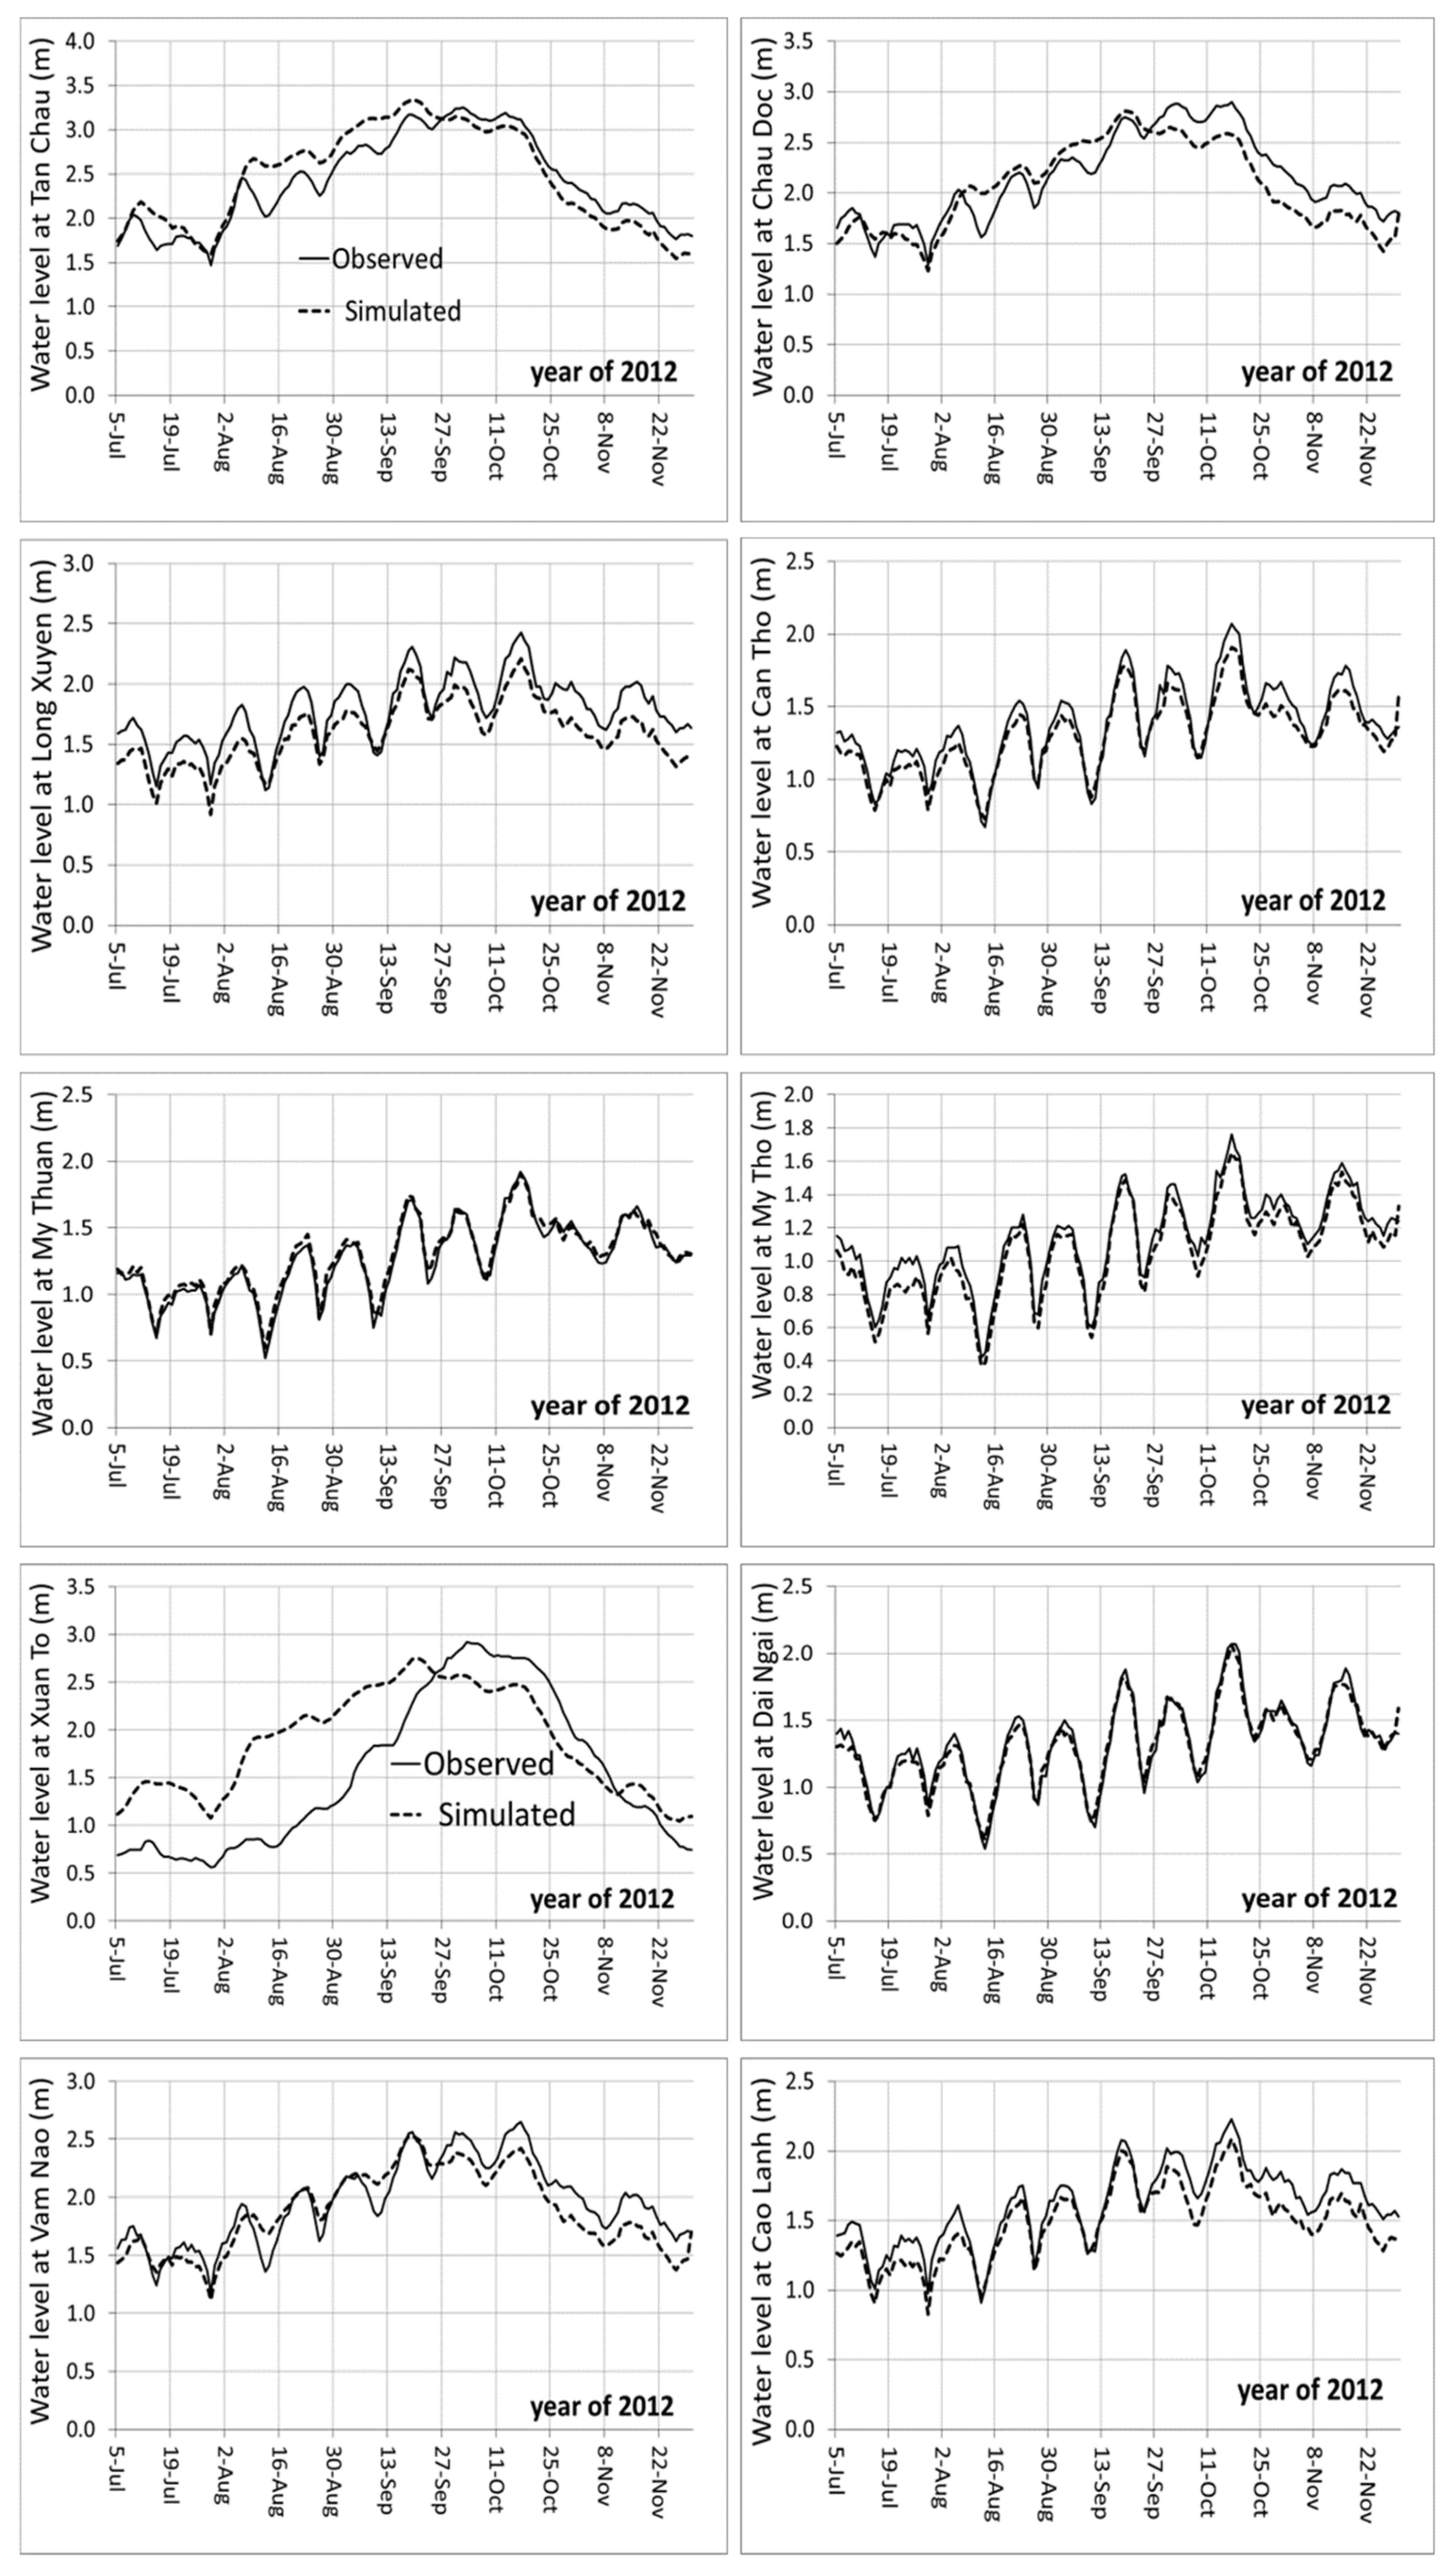
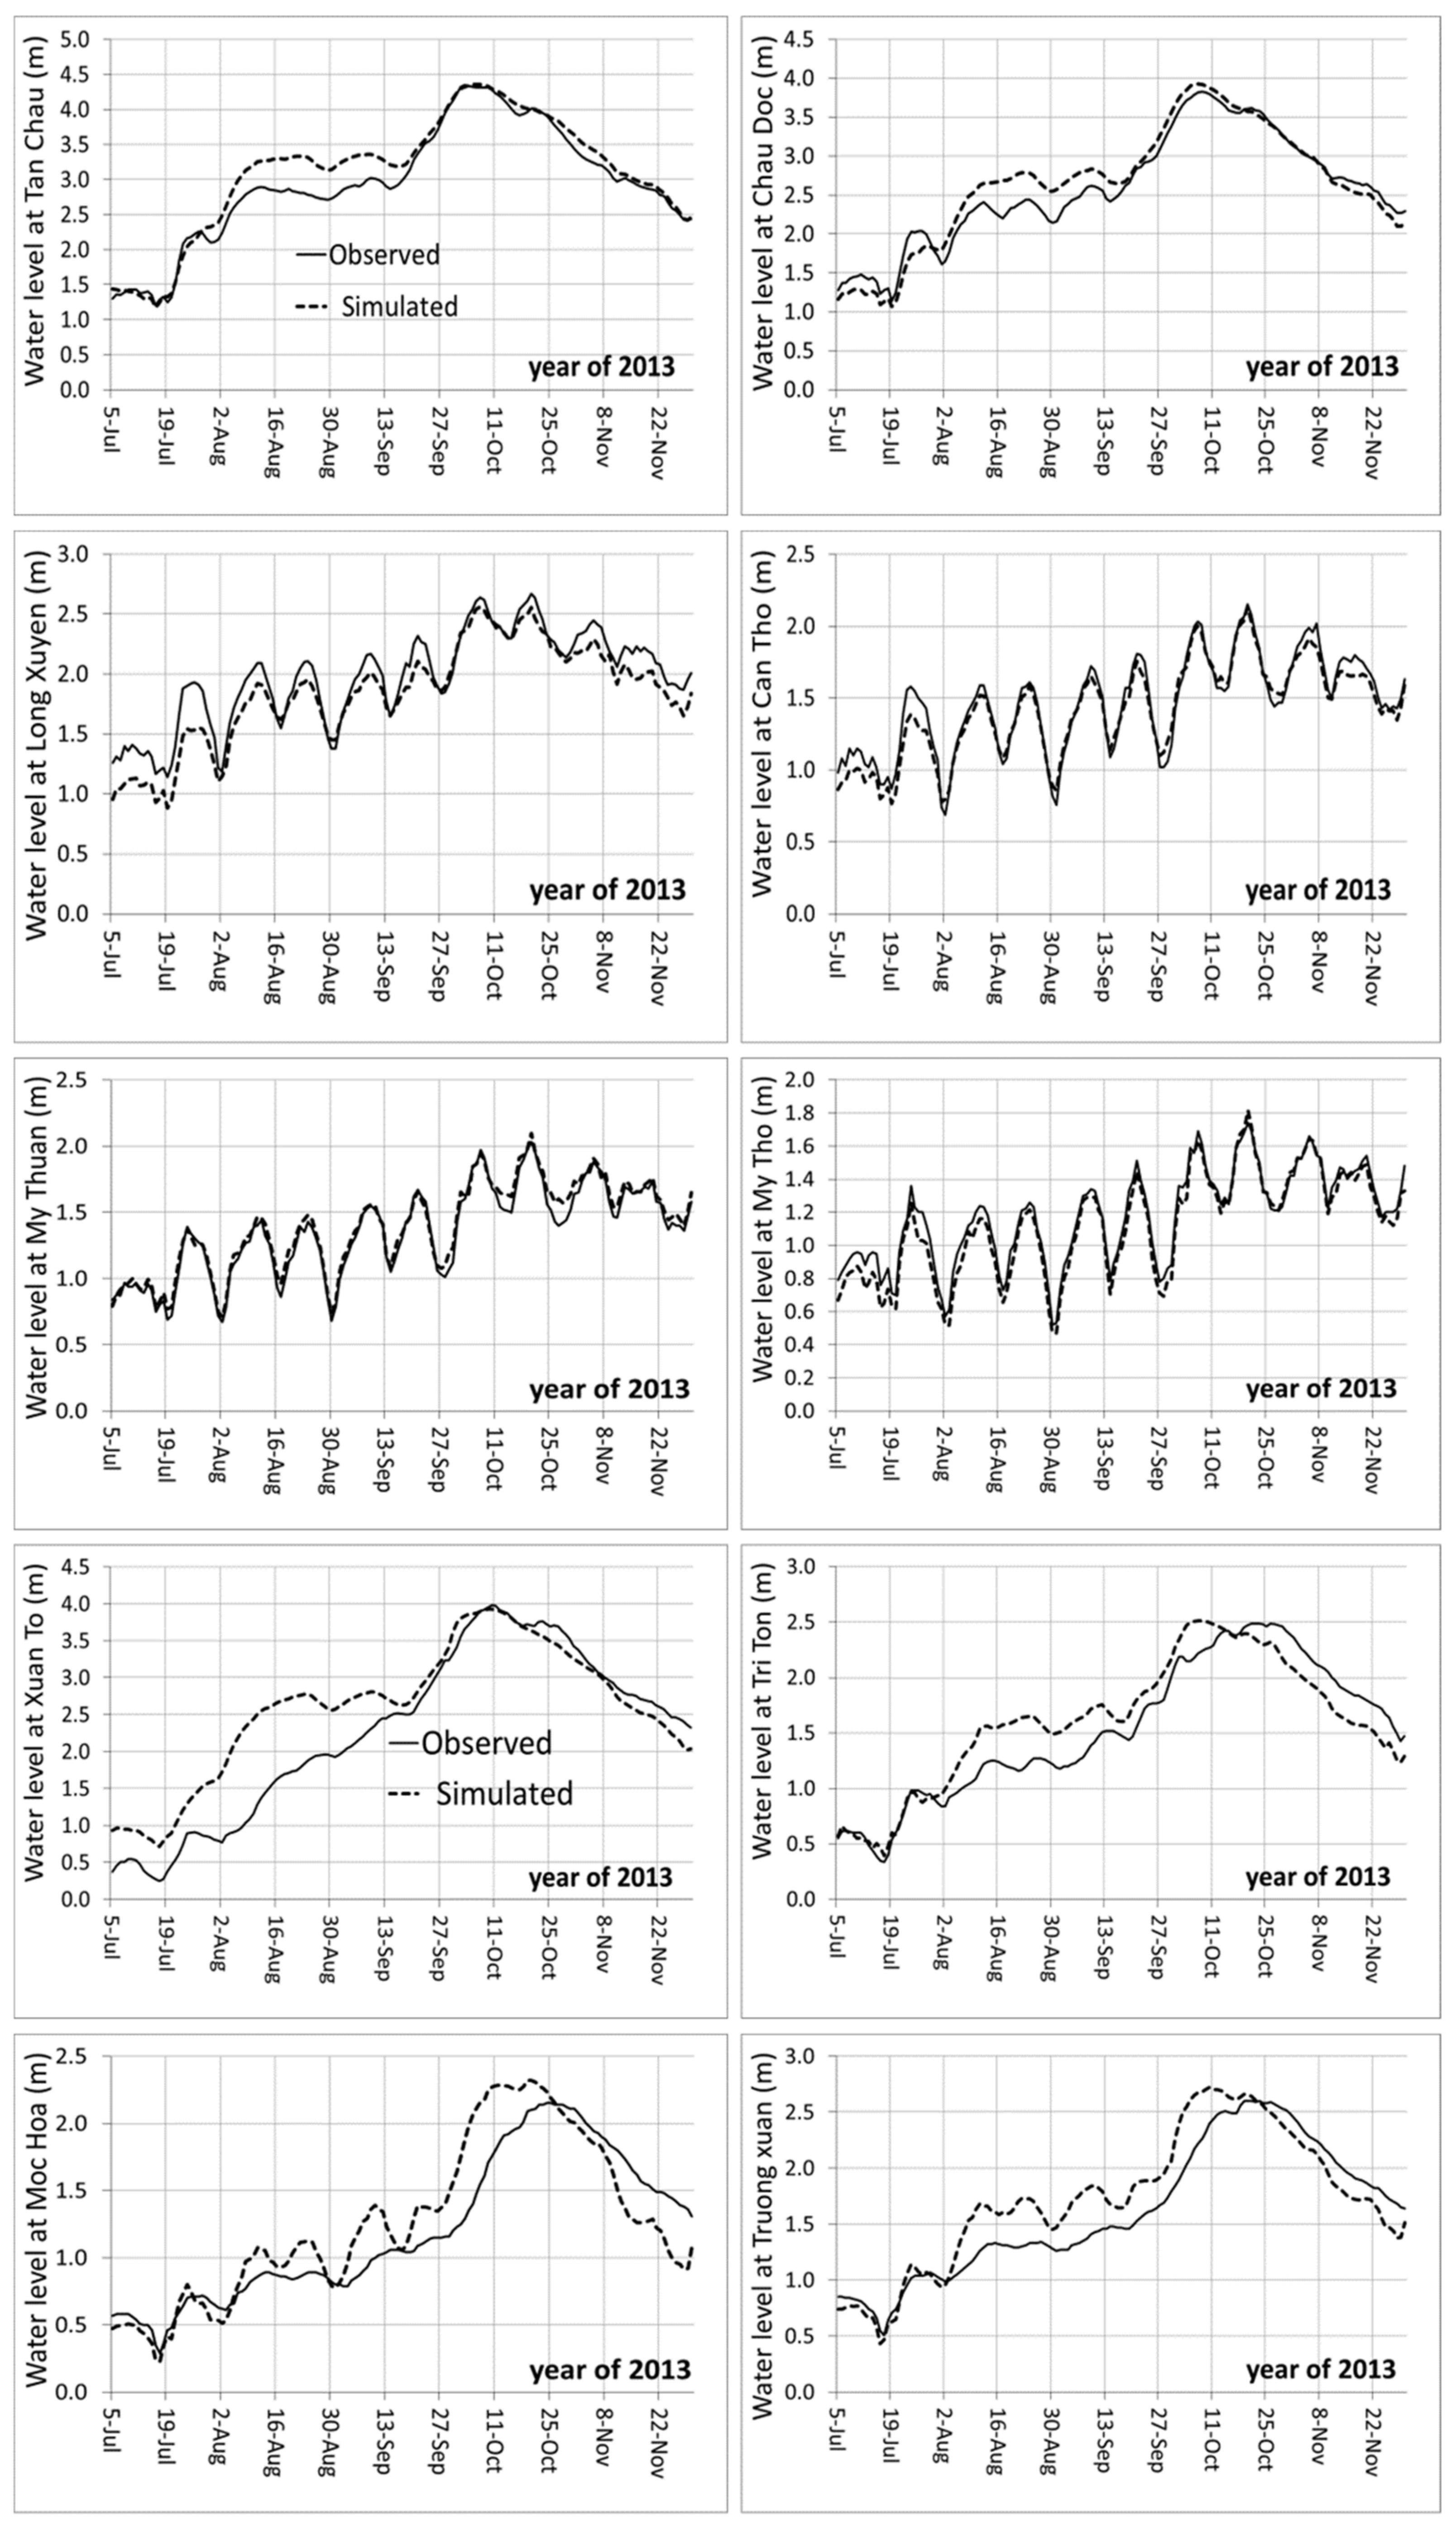
2.2. Model Calibration and Validation

The model needs to be calibrated and validated with the observed discharge and water level at the gauge stations. This is done by comparing calculated and measured water levels or discharges and correspondingly adapting the model generally by adjusting Manning’s hydraulic roughness coefficients [10,12]. Considering the unsteady nature of the flow, the roughness coefficient was applied in the branches and link channels in the MIKE 11 model where the flow is uniform or quasi-uniform. In this study, the calibration of the channel/floodplain roughness coefficients for the Mike 11 model was used to compensate the uncertainty of river cross-sectional geometries, river morphology, bed elevation approximation, and inflow boundary conditions.
A trial and error method was applied to adjust the floodplain roughness to best fit the observed stage and discharge measurements at multiple measured sites. For a dense and complex river system as Mekong river, the first important step is to calibrate the discharge and water level along the main rivers, the values of hydraulic roughness range from 0.014 to 2022 near the coast and from 0.028 to 0.030 for the upstream section, after all stations on the main rivers were well calibrated with the observed data, we calibrated further for the inland stations by adjusting the roughness coefficient for canals and the floodplains. The inland canals have the roughness coefficient from 0.028 to 0.030, while the floodplains are mainly vegetation and rice fields, therefore they have highest flow resistance due to emergent rigid and flexible vegetation [39], hence the Manning coefficient range from 0.033 to 0.035 [40]. The ranges of Manning’s coefficient for different sections of channels and rivers were presented in Table 1.
Figure 6 shows the locations of hydraulic gauges placed on the main rivers and inland canals used for the calibration and validation in this study. To be more precise, the Mike 11 was calibrated and validated according to the following gauges:
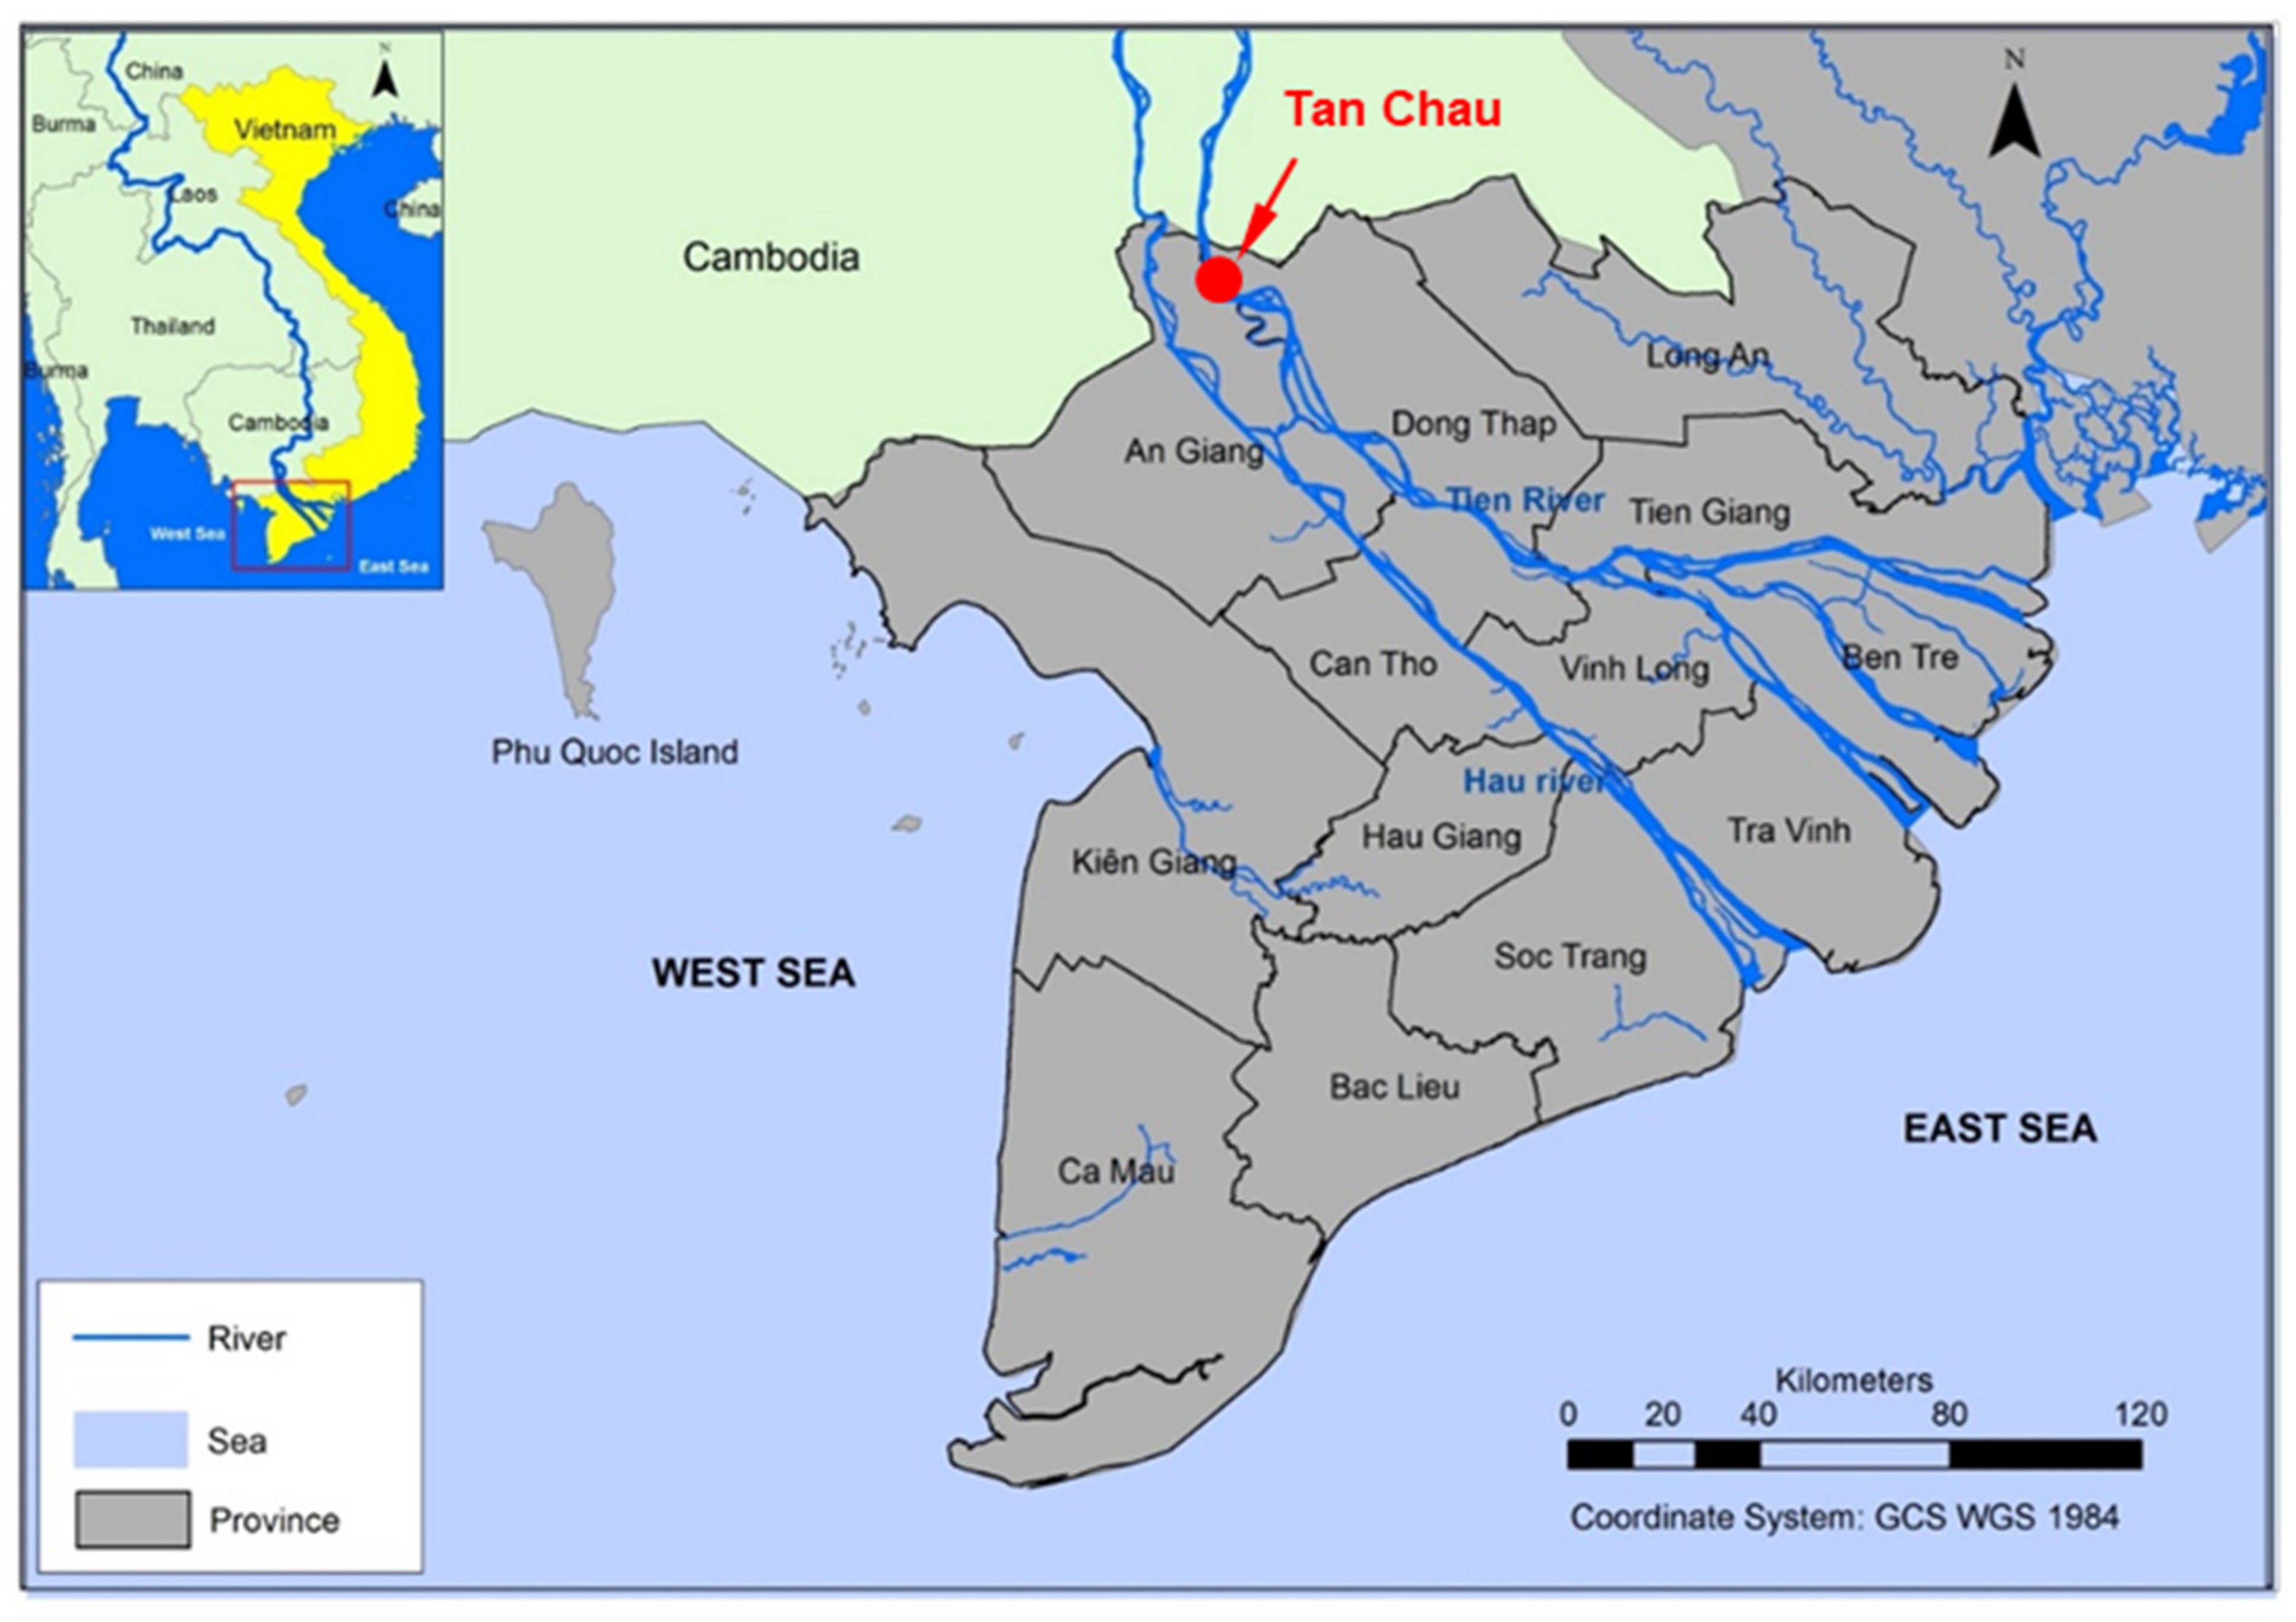
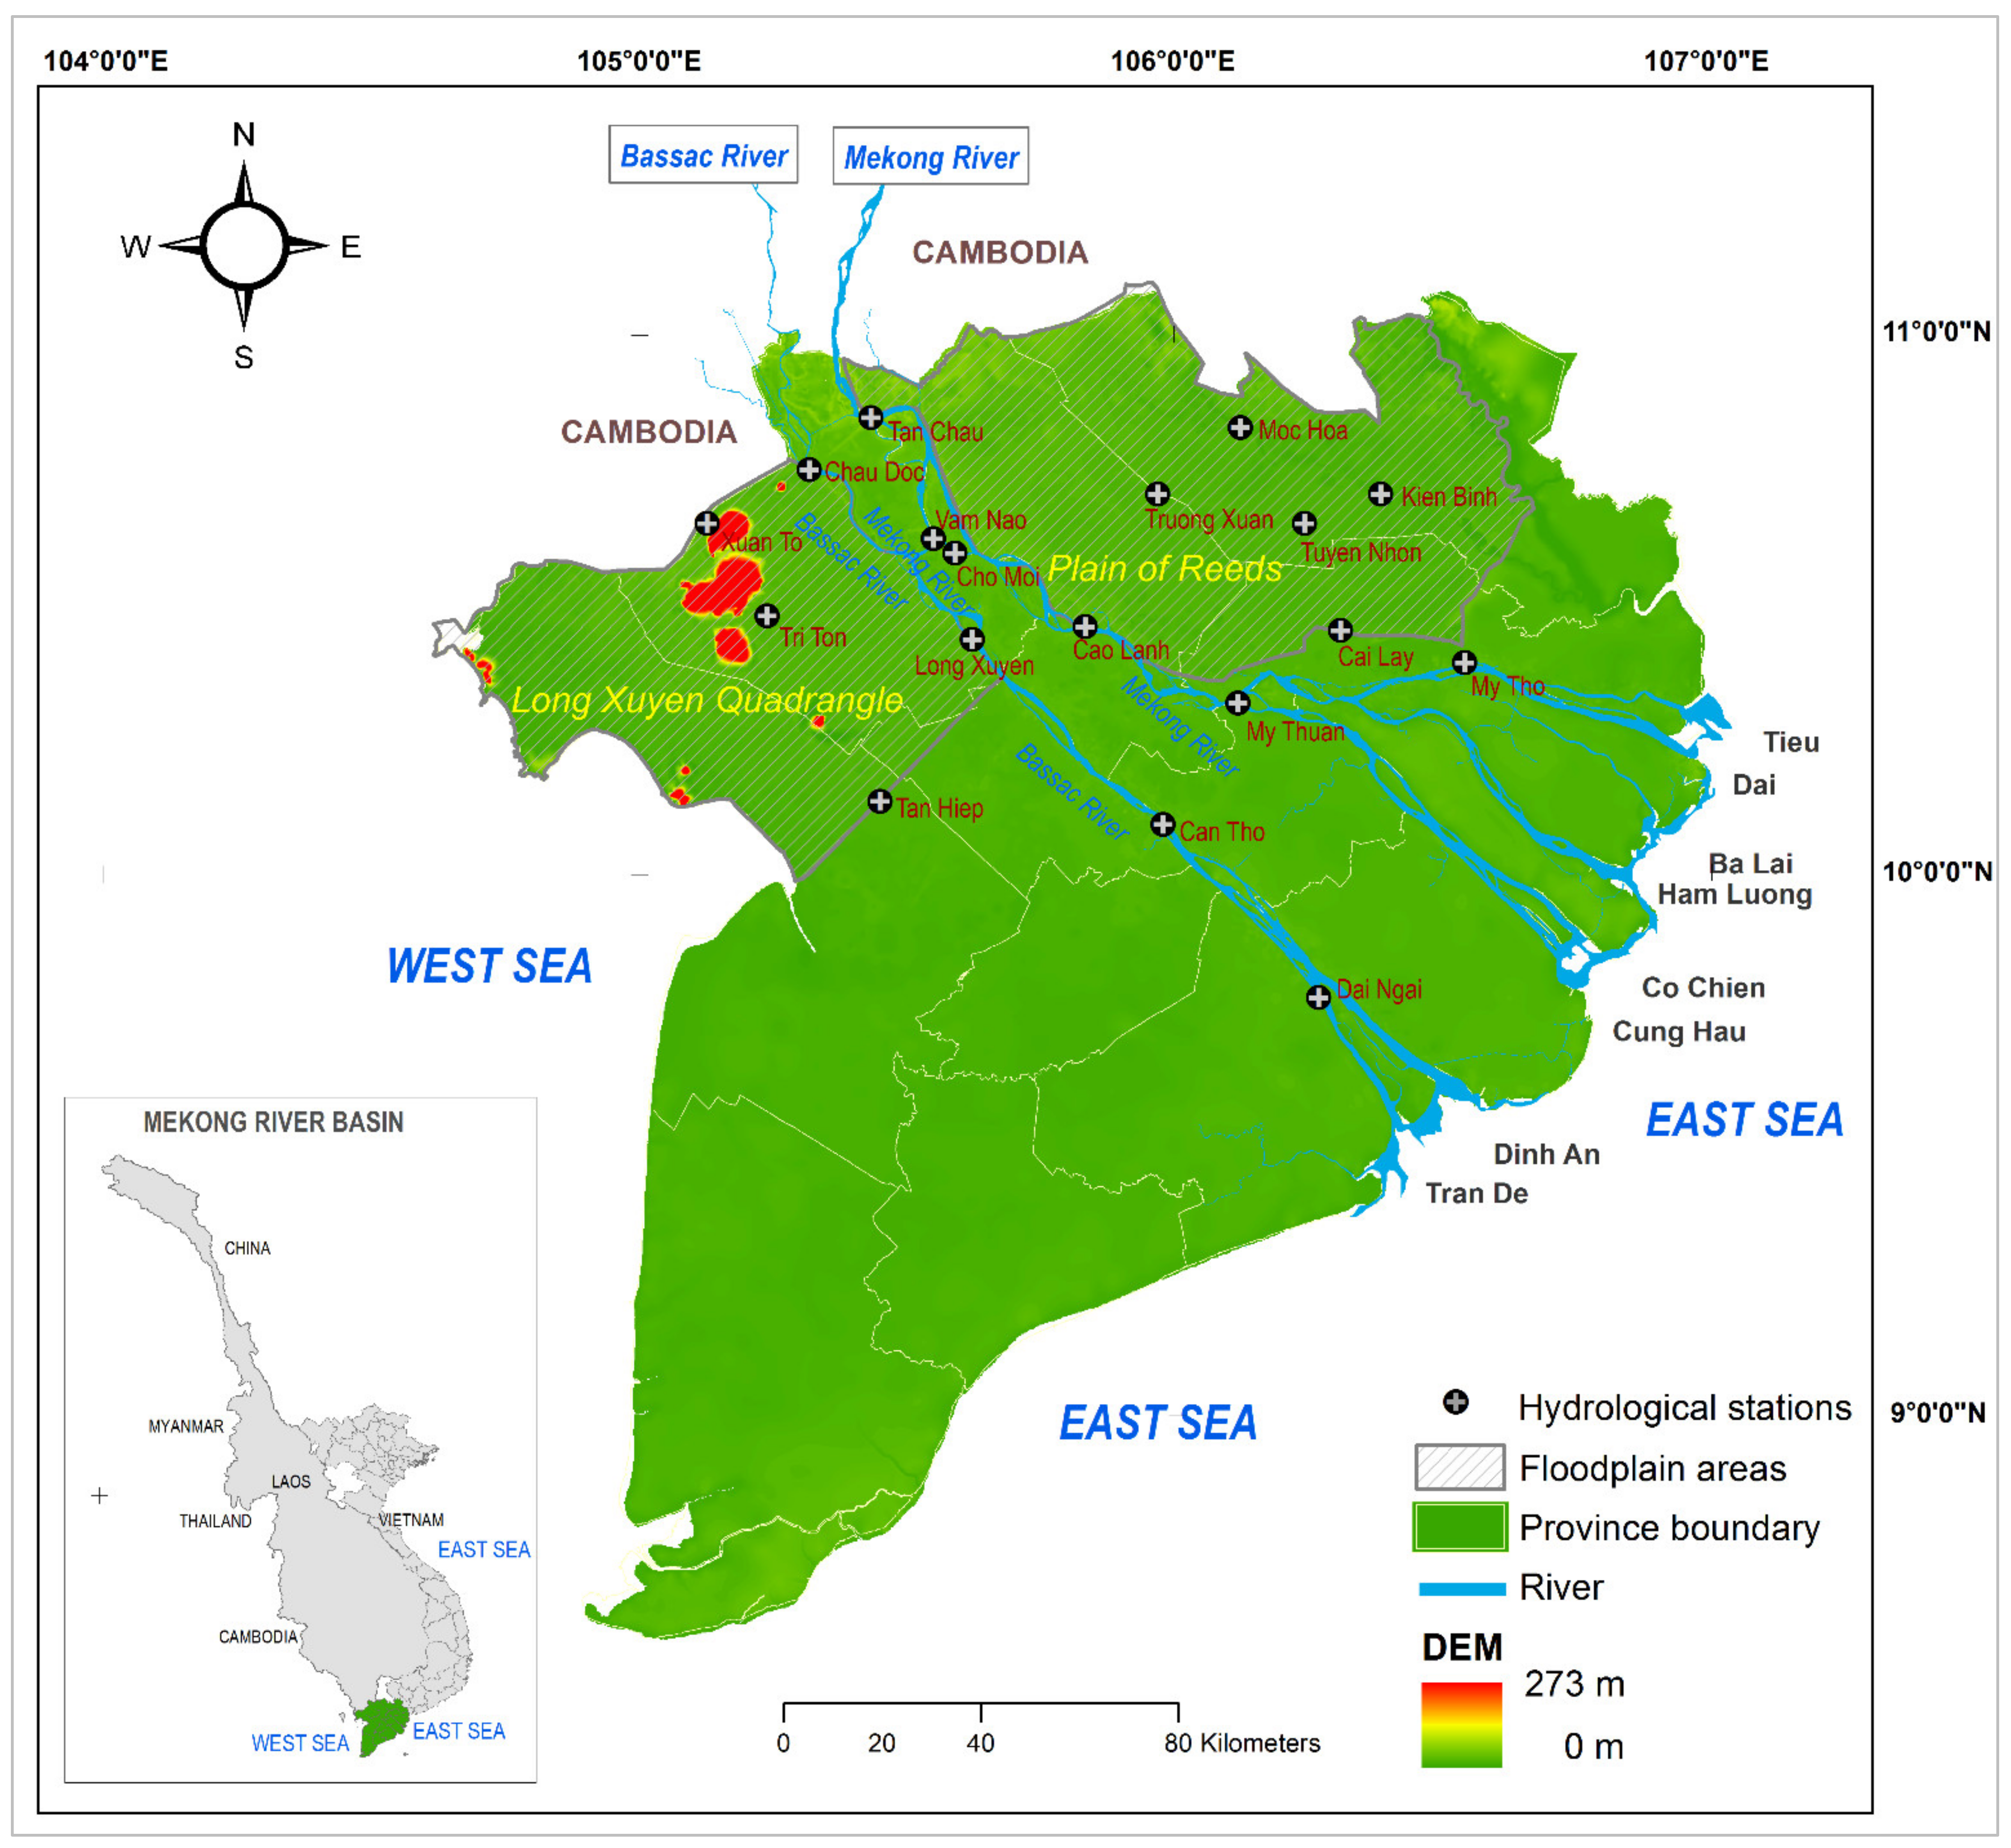
  • On Mekong Rivers: Tan Chau (water level and discharge), Vam Nao (water level), Cao Lanh (water level), My Thuan (water level and discharge), and My Tho (water level).
  • On Bassac Rivers: Chau Doc (water level and discharge), Long Xuyen (water level), Can Tho (water level and discharge), and Dai Ngai (water level).
  • In the Plain of Reeds (PoR): the only available data of water level for calibration and validation occurred at the gauges of Truong Xuan, Moc Hoa, Kien Binh, and Tuyen Nhon.
  • In the Long Xuyen Quadrangle (LXQ): the only available data of water level for calibration and validation occurred at the gauges of Xuan To, Tri To, and Tan Hiep.
Figure 6. Locations of eighteen (18) gauging stations used in the present study for model calibration and validation.
Water 13 01144 g006
According to the observed water levels at Tan Chau location from 1961 to 2014 (Figure 1), the recent floods in 2011, 2012, and 2013 were selected as three typical events with the maximum water levels of 4.86 m, 3.15 m, and 4.33 m, respectively. We calibrated the model in terms of water levels and discharges, using the high floods of 2000 and 2011. Afterwards, the model was evaluated appropriately regarding its accuracy for medium flood (2013) and low flood (2012).
In the calibration and validation process, the Nash-Sutcliffe index value (E) was used to evaluate the model accuracy [10,35]. When the E index is from 0.60 to 0.75, the model performance is considered as low accuracy, in case the E index is between 0.75 to 0.85, the model is examined as medium accuracy; when the E index is in the range from 0.85 to 0.95, it is defined as high accuracy; and when the E index meets the requirement of from 0.95 to nearly 1, the model performance is evaluated at very high accuracy.
The Nash–Sutcliffe index (E) is calculated based on the following formula:
E = 1 t = 1 T Q 0 t Q m t 2 t = 1 T Q 0 t Q 0 ¯ 2
where Q ¯ 0   is the mean of the observed data, Q m t   is the modelled data, and Q 0 t   is the observed data at time t.

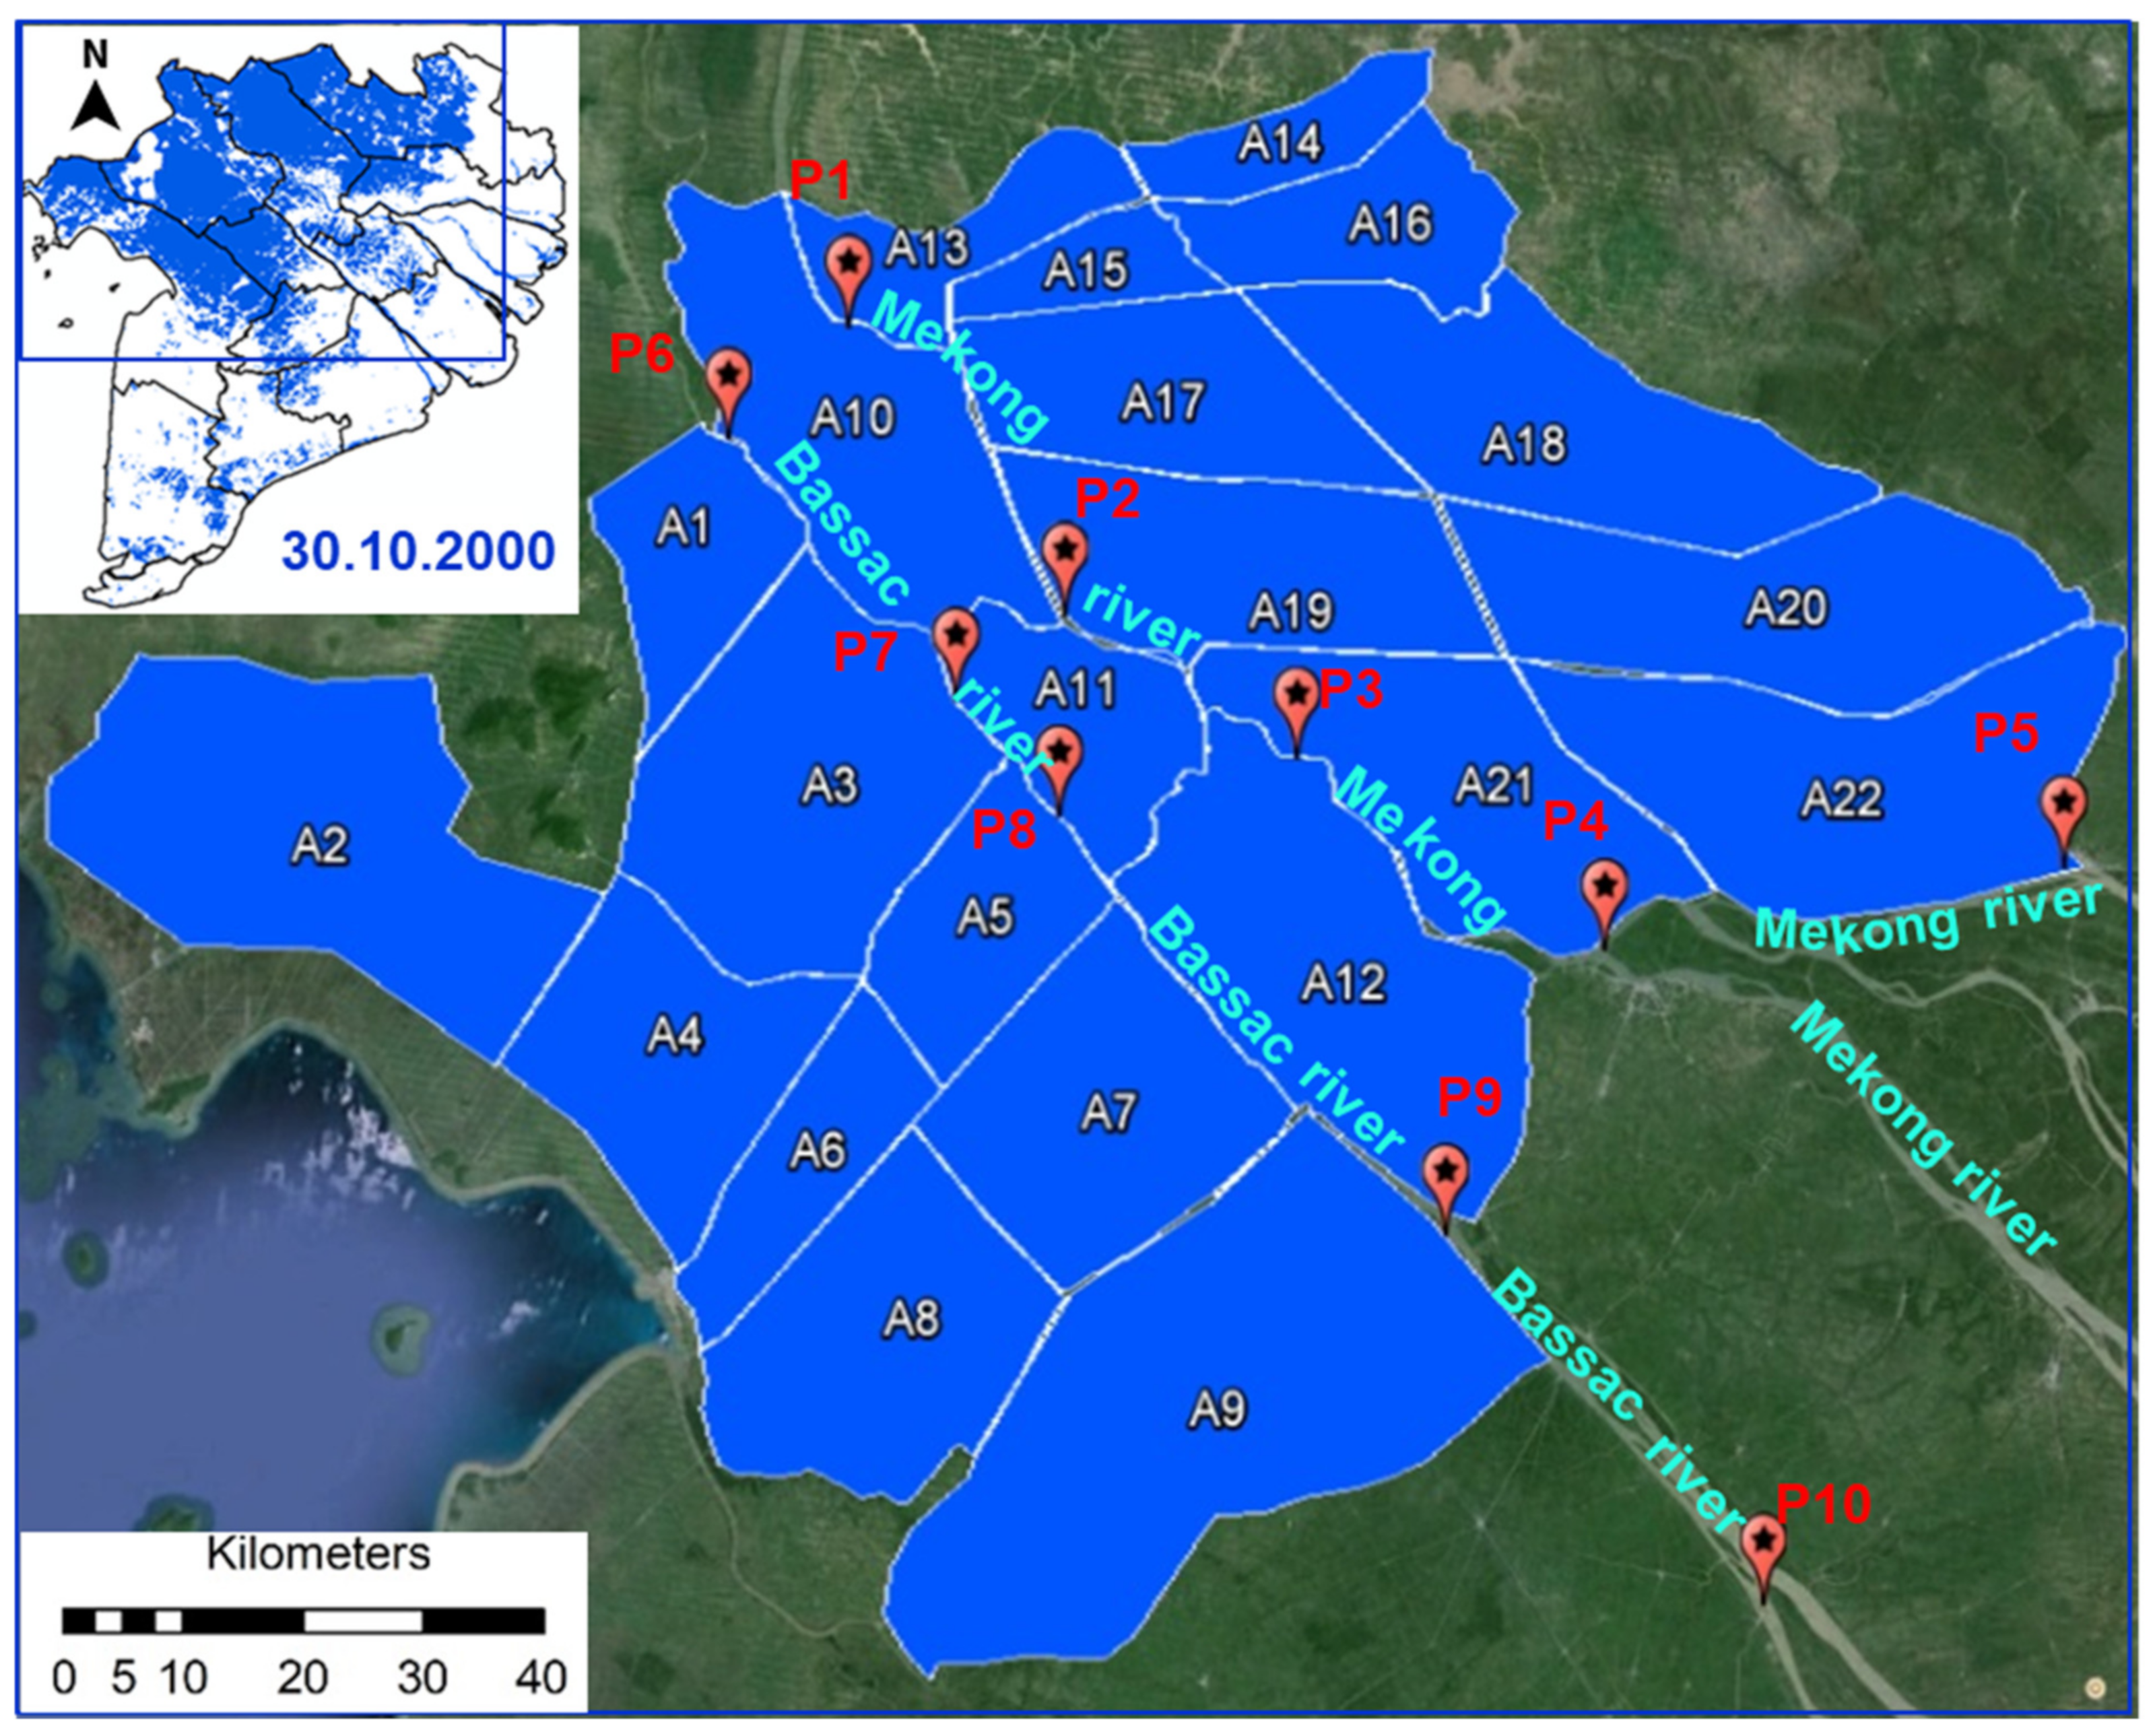
2.3. Assumption of Dyke Compartment Development in the VMD Floodplains

Based on the maximum flood extent of 30.10.2000 presented in Figure 4, we separated the flood extent in the upper VMD into 22 key compartments, each of which is certainly bounded by main canals or rivers (see Figure 7 and Table 2). These compartments belong to four zones based on the hydrological characteristics of the watershed. First, Long Xuyen Quadrangle (LXQ) includes six (06) compartments (A1 to A6) along the main canals of Tri Ton, Mac Can Dung, Rach Gia-Long Xuyen, Cai San, and Bassac River. Second, the Western of Bassac River (WBR) consists of three (03) compartments (A7 to A9) following KH6, Thi Doi canals, and the Omon-Xano system. Third, three compartments (A10 to A12) are parts of the middle zone between the Mekong and the Bassac Rivers (MID), based on Vam Nao, Cai Tau Thuong, and Nha Man-Tu Tai Rivers. Finally, the Plain of Reed (PoR) comprises ten (10) compartments (A13 to A22) which are bounded by the main canals of Cai Co—Long Khot, Tan Thanh—Lo Gach, Cai Cai, Hong Ngu, Phuoc Xuyen, Thay Cai, Dong Tien, Nguyen Van Tiep, Mekong River, and Vam Co Tay River.
Currently, there are no indices for evaluating flood management in conjunction with land use in the Mekong Delta to set up a scientific basis and helpful index to support the administrators and planners in establishing land use development strategies in the VMD. Therefore. we defined an indicator, i.e. the Geographical Impact Factor (GIF) to quantify the impact of high-dyke measurement on rice cultivation at each compartment. It is defined as follows:
G I F i = Z i Z b a s e l i n e Z t o t a l Z b a s e l i n e 1 A i     ( 1 / ha )
where GIFi is the geographical impact factor at compartment i; Zbaseline is the water level at a considered point on the Mekong and Bassac Rivers with no-dyke systems at 22 compartments (cm); Zi is the water level at a considered point with high-dyke systems at compartment i (cm); Ztotal is the water level at a considered position due to high-dyke systems at 22 compartments (cm); and Ai is the area of compartment i (in hectares).
Table 3 shows 72 dyke scenarios carried out in this study. The scenarios were classified into three (03) model sets under the small, medium, and high floods. The first set included three scenarios corresponding the three floods, which were defined as being without any dyke system for all 22 compartments. The second set consisted of 66 scenarios, each of which was set up as one individual compartment under high-dyke protection and 21 compartments without dykes. The third set has three (03) scenarios, each of which covered the whole 22 high-dyke compartments.
Ten (10) positions were examined to analyse the influences of high-dyke measurements on the water levels along the main rivers (Figure 7). These positions are located on the Mekong River (P1 to P5) and the Bassac River (P6 to P10).

3. Results and Discussion

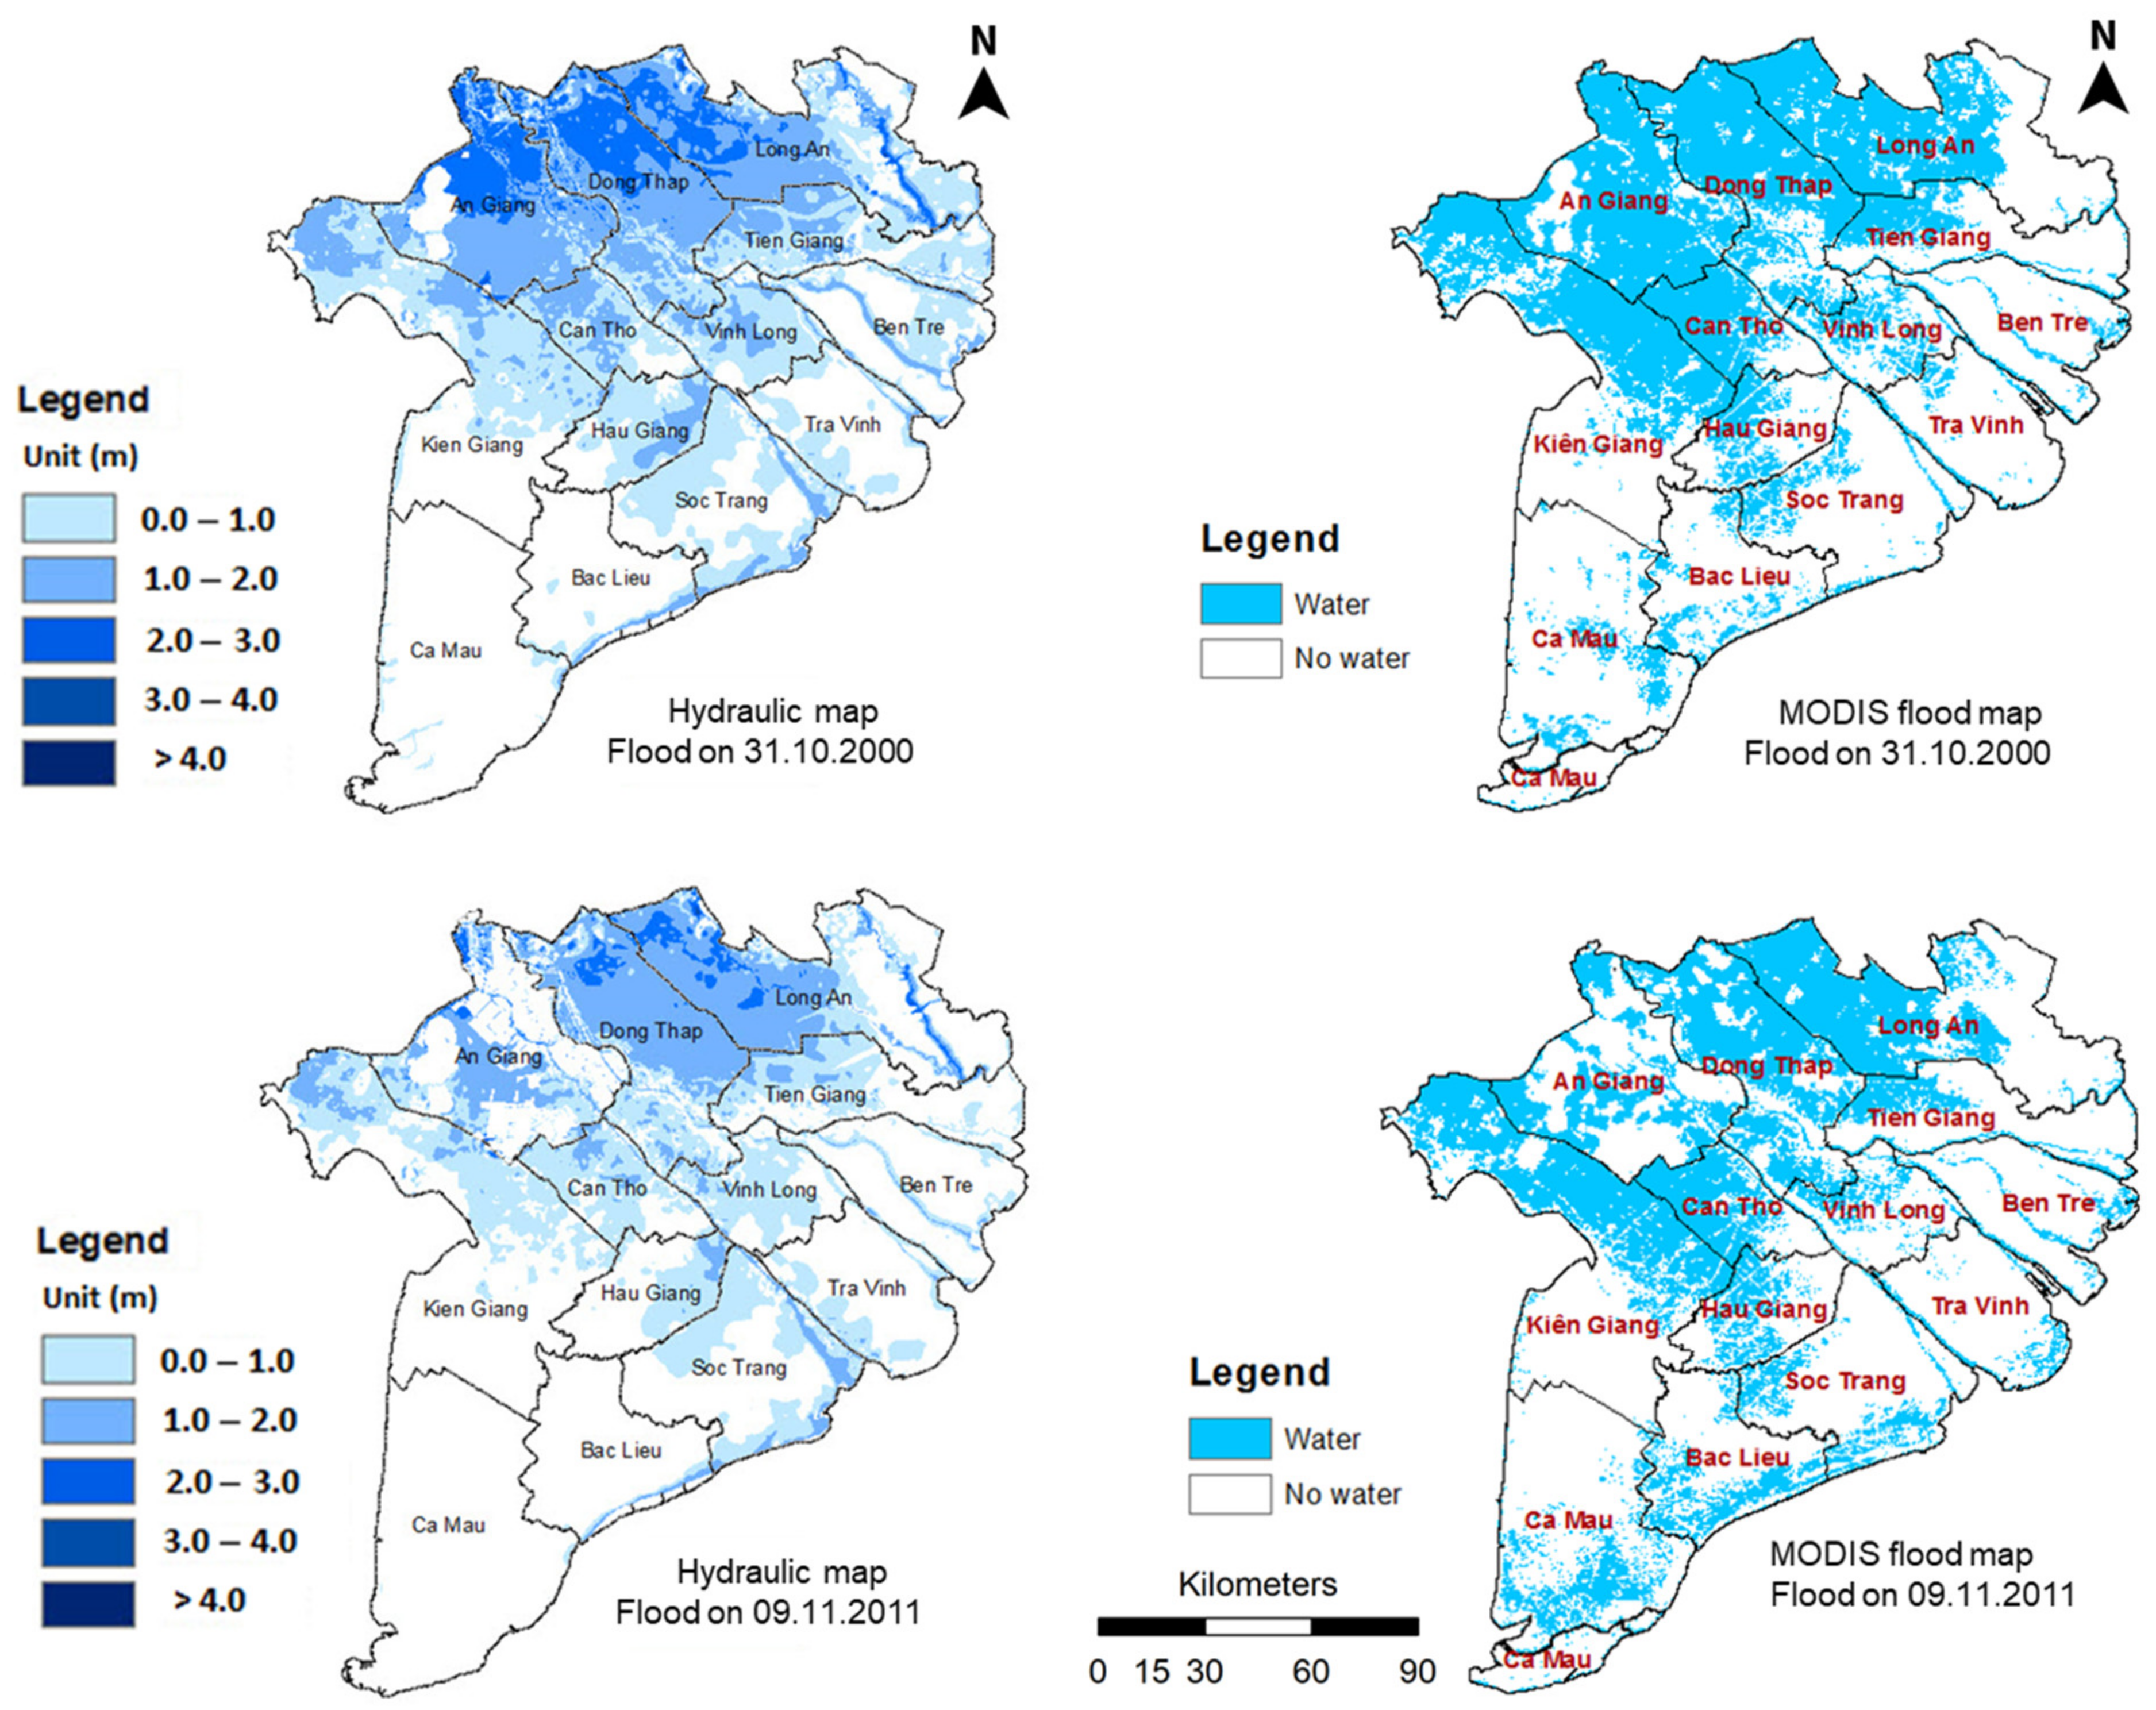
3.1. Results of Model Calibration and Validation

The model calibrations were carried out for the high floods in 2000 and 2011, whereas the validations were carried out for the medium flood (2013) and the low flood (2012). The accuracy and agreement have been evaluated through the Nash-Sutcliffe index ranges between 0.98 to 0.65 and compared with flood maps of MODIS satellite. Table 4 illustrates the accuracy in the calibration of the water levels (WL) and discharges (Q) at the gauging stations located on the Mekong River, such as Tan Chau and Chau Doc, Vam Nao, Long Xuyen, Cho Moi, and Can Tho. In general, the values of E vary in a range of 0.75 to 0.98. The calibration and validation of the water levels in the inland canals are lower with E indexes ranging from 0.63 to 0.98 depending on the types of flood. Model calibration and validation were more accurate for high floods (in 2000 and 2011) and medium floods (in 2013), whereas the E indexes have lower values with the low flood in 2012. The results of the model calibration and validation process are also shown in Figure A1 and Figure A2 in the Appendix A. In general, the calibration and validation worked well, therefore Mike 11 showed acceptable results on the main rivers. However, at the inland gauges in the PoR and the LXQ, the results had a high level of accuracy with high floods in 2000 and 2011, whereas the accuracy decreased for validation with the medium flood in 2013 and the low flood in 2012. The E index values for the flood 2012 has lowest values from 0.6 to 0.72 in the inland canals in comparison with medium and high floods due to the effect of the flow resistance of floodplain vegetation [39,40]. Due to lower flooding level in the flood 2012, the submerged flexible vegetation takes into account that changes the hydraulic flow, while the higher flood levels in 2011 and 2013 could avoid the vegetation resistance [41].
The flood distribution was analysed using hydraulic models and remote sensing for two high-flood years in the years of 2000 and 2011 with good agreements as illustrated in Figure 8. In the satellite products, the coastal areas also appeared as flooded due to the impact of the tides, not the impact of flooding from the upstream Mekong River. Flood extension in the satellite products was interpreted based on the algorithms by [32] for the MODIS satellite. The accuracy of the MODIS flood maps was found to be in good agreement with the ground truth and the results from the radar satellites [26]. The flood maps from the hydraulic model of Mike 11 present both the flood extension and water depth while flood maps from the MODIS satellite can display only the flood extension. The flood maps from a 1D model were processed based on the Triangulated Irregular Network (TIN) method to build a surface of water map from a set of irregularity spaced points which is processed in the GIS program. The flood maps were implemented by subtracting the water map with the topographical map. If the pixel value is positive, the water is higher than the ground. Therefore, these pixels are considered to represent flood. When the pixel values are zero or negative, the water level is equal to or lower than the ground, and hence there is no flooding.
Based on the simulation and validation results, the 1D-quasi2D hydraulic model of Mike 11 is considered as an appropriate tool to simulate the flood hazards of a large and complex river network dominated by numerous hydraulic control structures such as the VMD. It demonstrated acceptable levels of accuracy for hydraulic gauges and flood distributions as compared to flood mappings of satellite products.

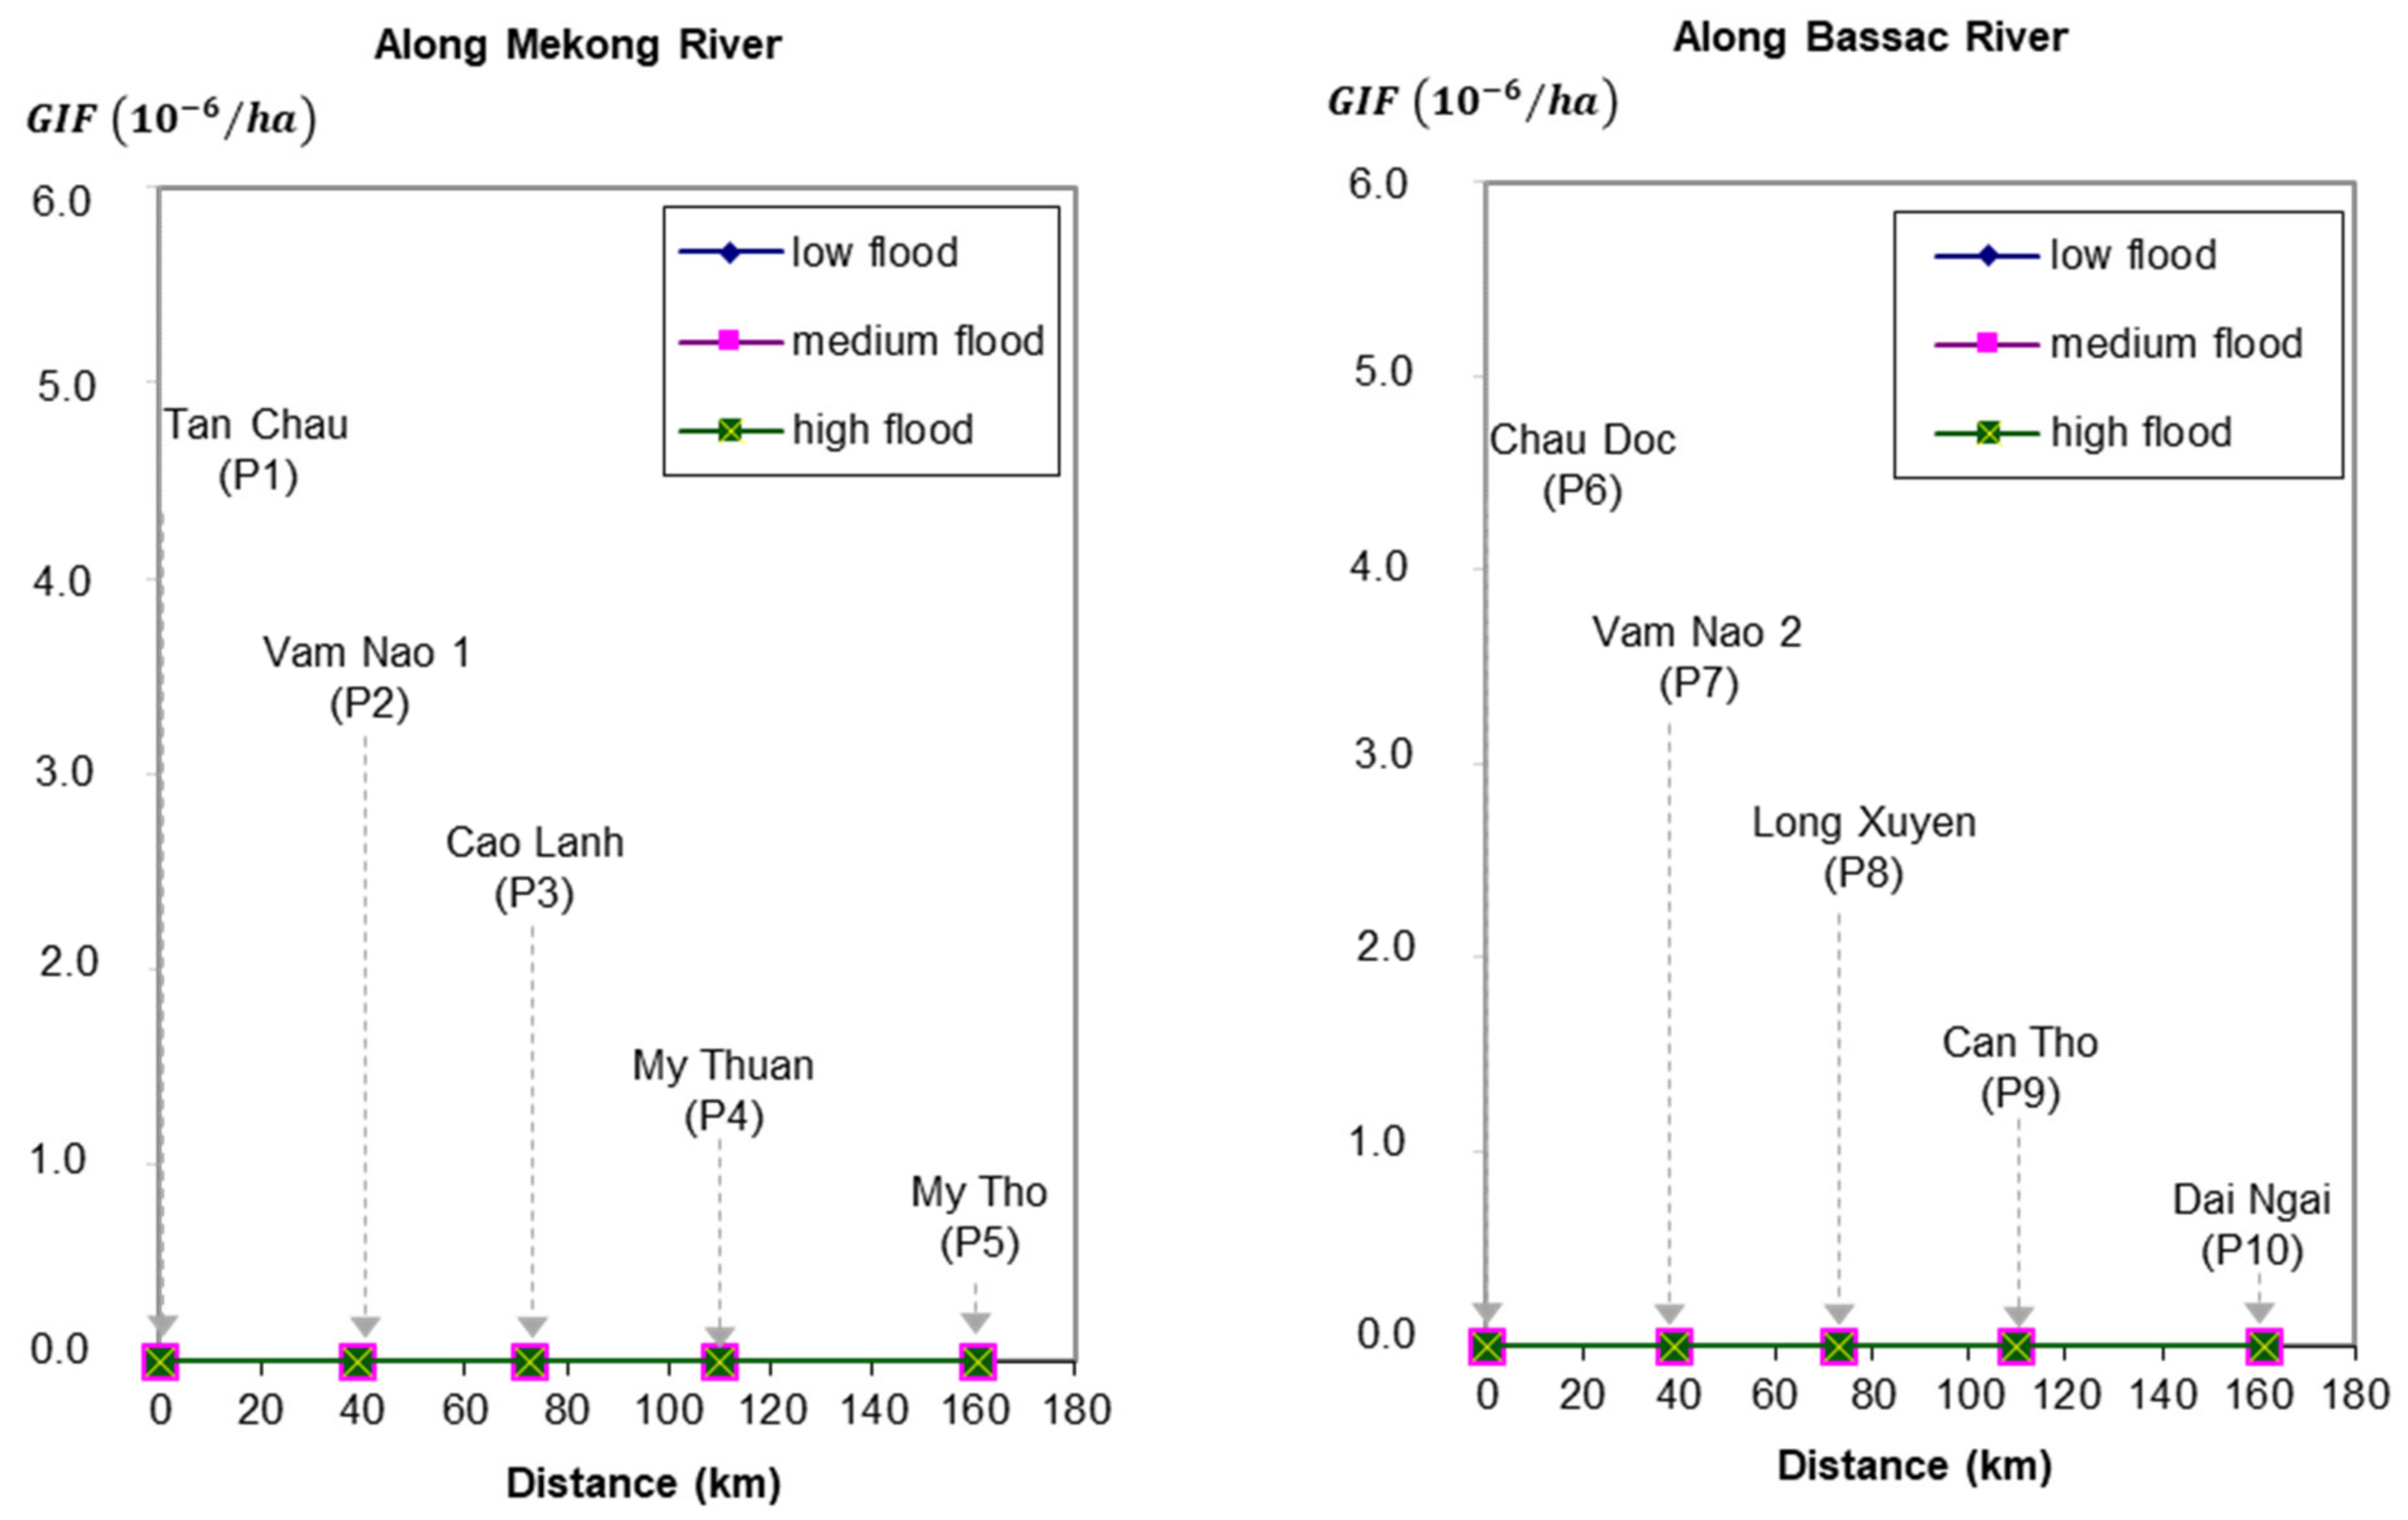
3.2. GIF-Based Influences of Dyke Compartment Scenarios on the Water Levels along the Main Rivers and in Terms of Flood Magnitudes

Figure 9 shows the geographical influence of high-dyke construction scenarios on the river water levels based on the GIF analysis. Overall, the closer to the main rivers the high-dyke constructions, the greater the impacts. The scenarios of upper high-dyke constructions between the two main rivers (A10, A11, and A12) cause the highest influence on the increase in river water levels, whereas the lower impacts are found with the dyke constructions along the right banks of the Bassac River (A1, A3, A5, A7, and A9) and the left banks of the Mekong River (A15, A17, A19, and A21). The construction of dyke compartments at A2, A4, A6, and A8 in Kien Giang province cause no influence on the water levels due to their far distance from the main rivers. The floods therefore will discharge mainly along the main Mekong and Bassac Rivers and partly overflow the PoR and LXQ. This is similar at A14, A16, A18, A20, and A22 in Long An Province. In these areas, The influence of dyke construction on the flood water level is very small.
The high-dyke construction in the A10 compartment is sensitive to the water level changes in the Mekong and Bassac Rivers, and these changes depend on the magnitude of floods (Figure 10). This compartment is the Bac Vam Nao area of An Giang province, which is the first area of the VMD that receives flood water from upstream of the Mekong River, hence the high-dyke systems have prevented the floodwater from delivering from the Mekong River to the Bassac River. As a result, even though the compartment increases the water level at Tan Chau (P1), a decrease in the river stage at Chau Doc (P6) is found. The same pattern of the water level changes is identified at Vam Nao 1 (P2), but this no longer exists after Cao Lanh (P3). However, along the Bassac River, the water level changes remain until Dai Ngai (P10). Although the government does not promote dyke construction in this region and encourages to use a 3-3-2 cycle in Bac Vam Nao [21], there is still an effect when the gate is closed because the A10 is very sensitive to the dyke system.
Regarding the small floods, the GIF10 indicates a strong impact of the A10 on the water level along the Mekong River. However, this tendency is reduced with medium and high floods. On the Bassac River, the influence of A10 on the water level at Chau Doc (P6) is relatively high with high floods, but decreases with medium and small floods. This impact has the same characteristics at the locations of Vam Nao 2 (P7), Long Xuyen (P8), and Can Tho (P9) with very small values along the river.
Figure 11 below presents the influence of compartment A20 on the main river water levels. For different kinds of floods, the construction of a dyke compartment at A20 causes no impact on the flood levels in the Mekong and Bassac Rivers due to the compartment’s geographical location far away from the main rivers.

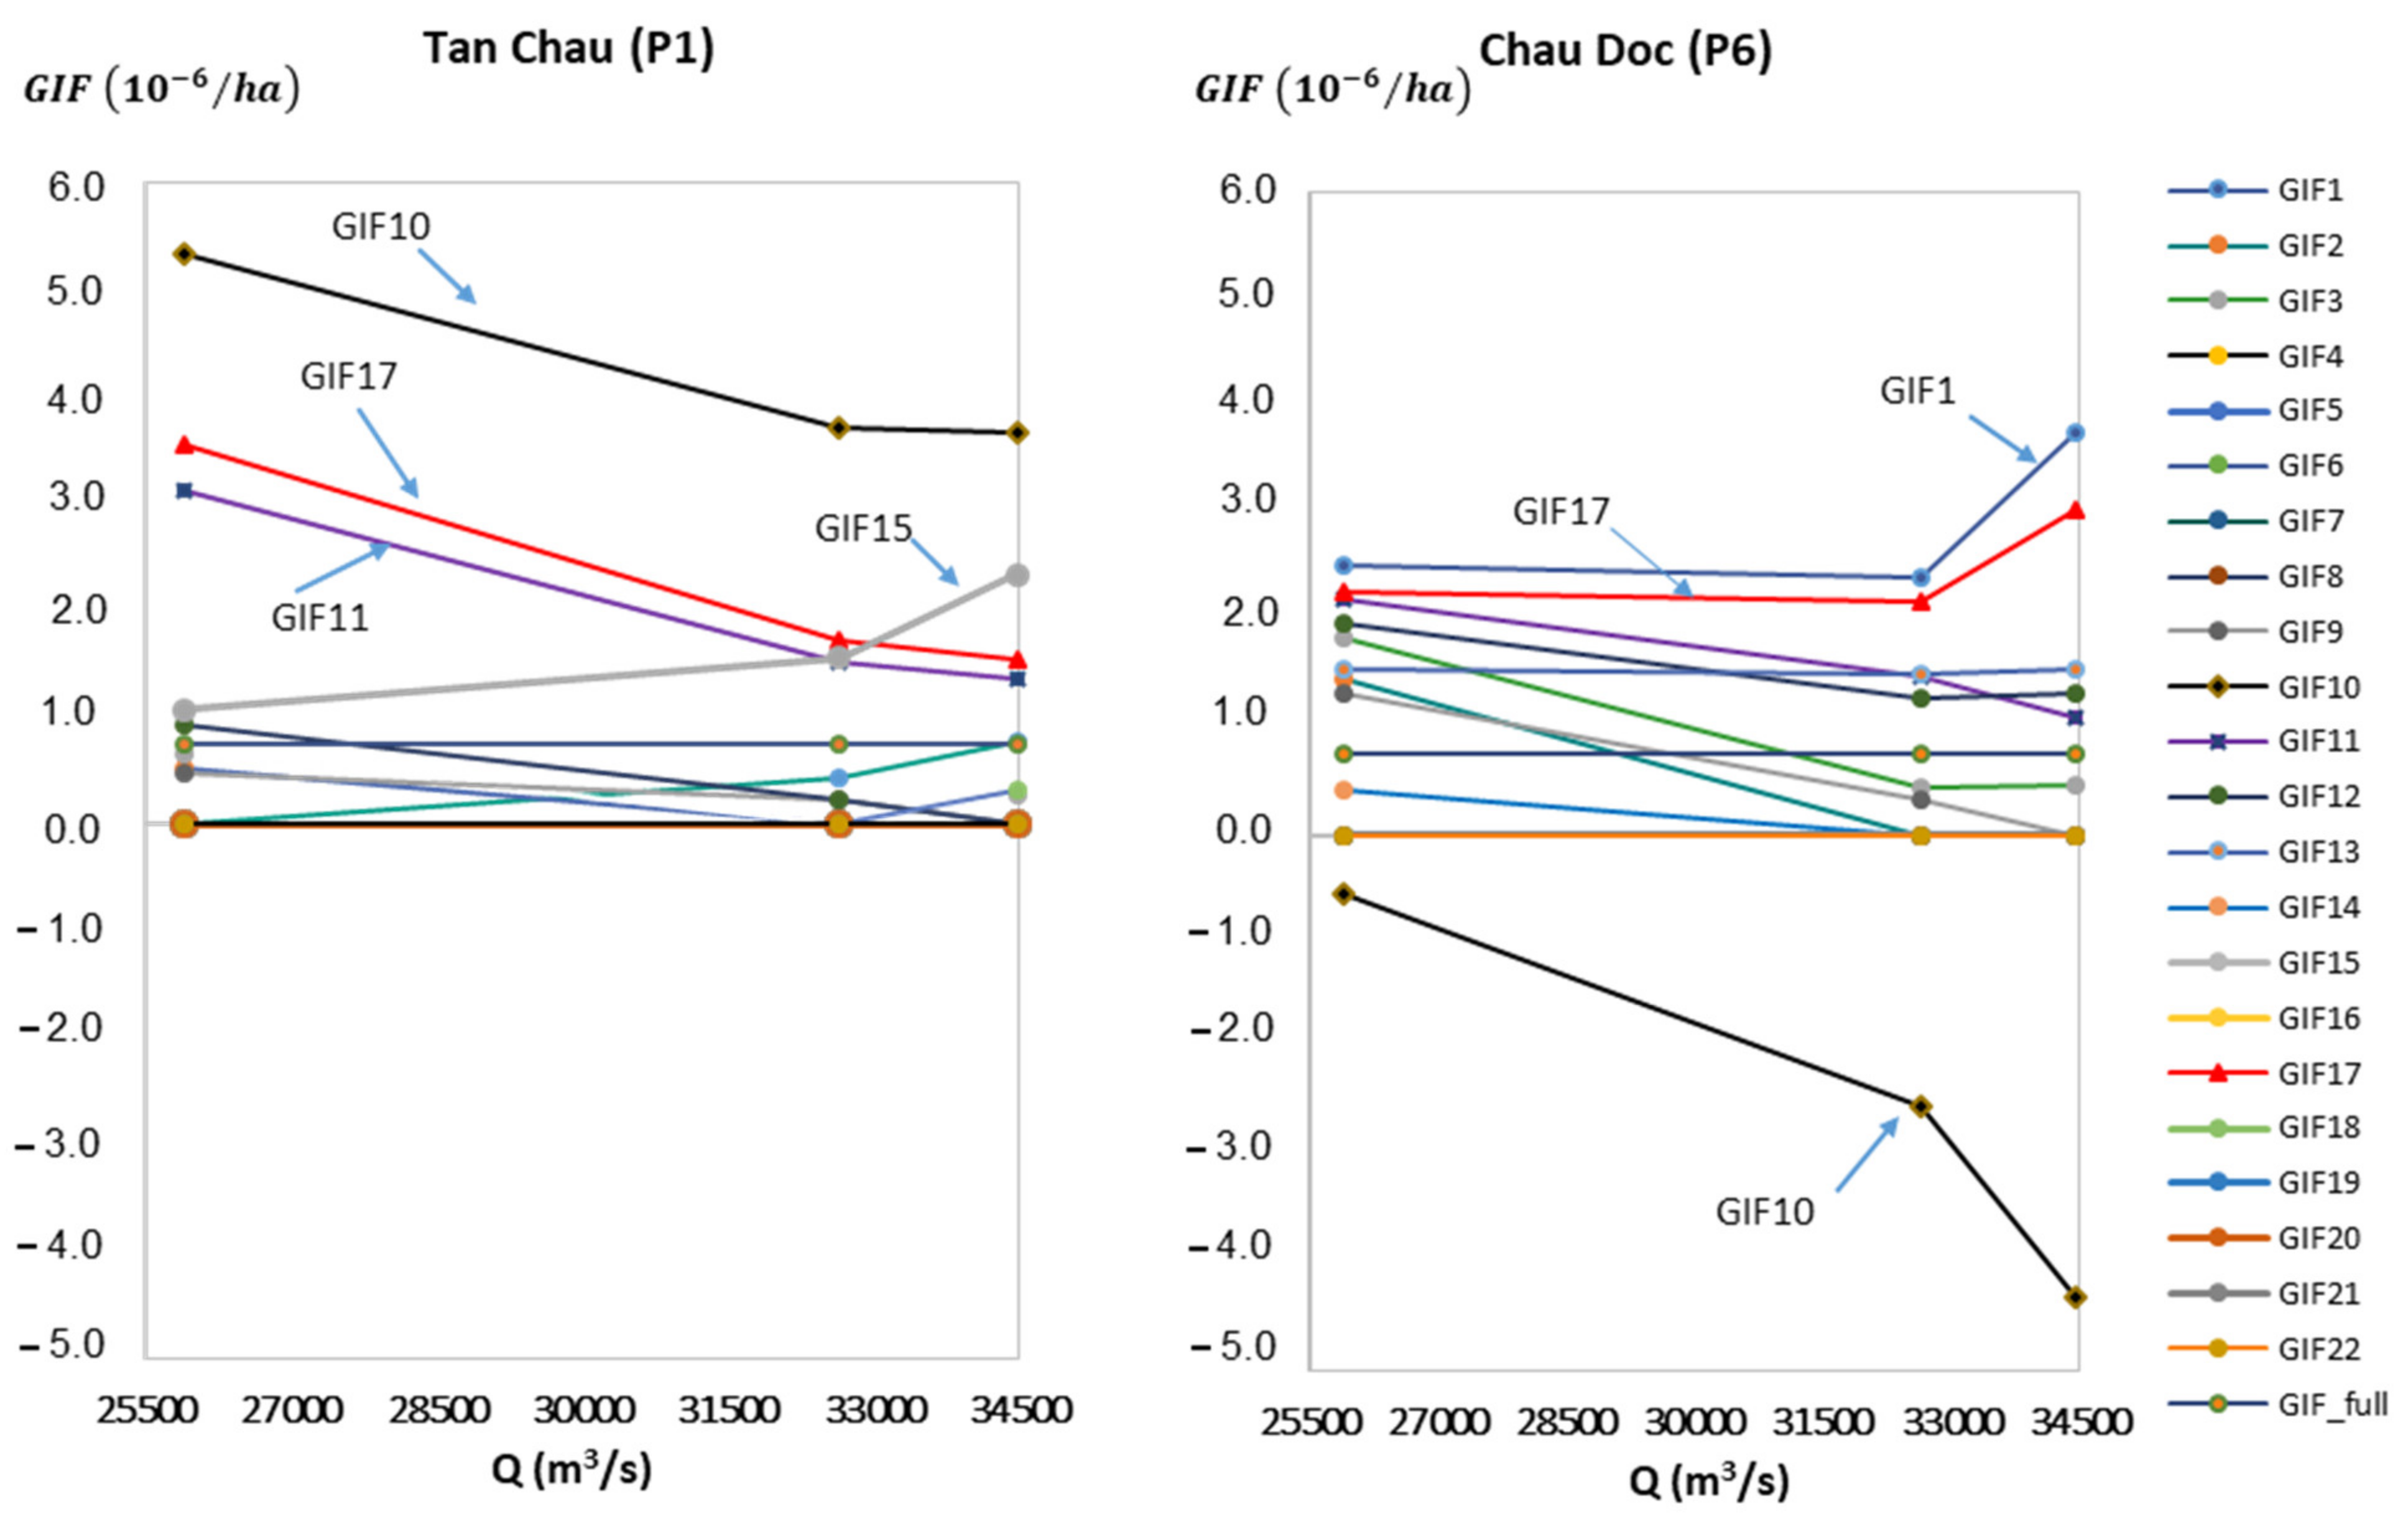
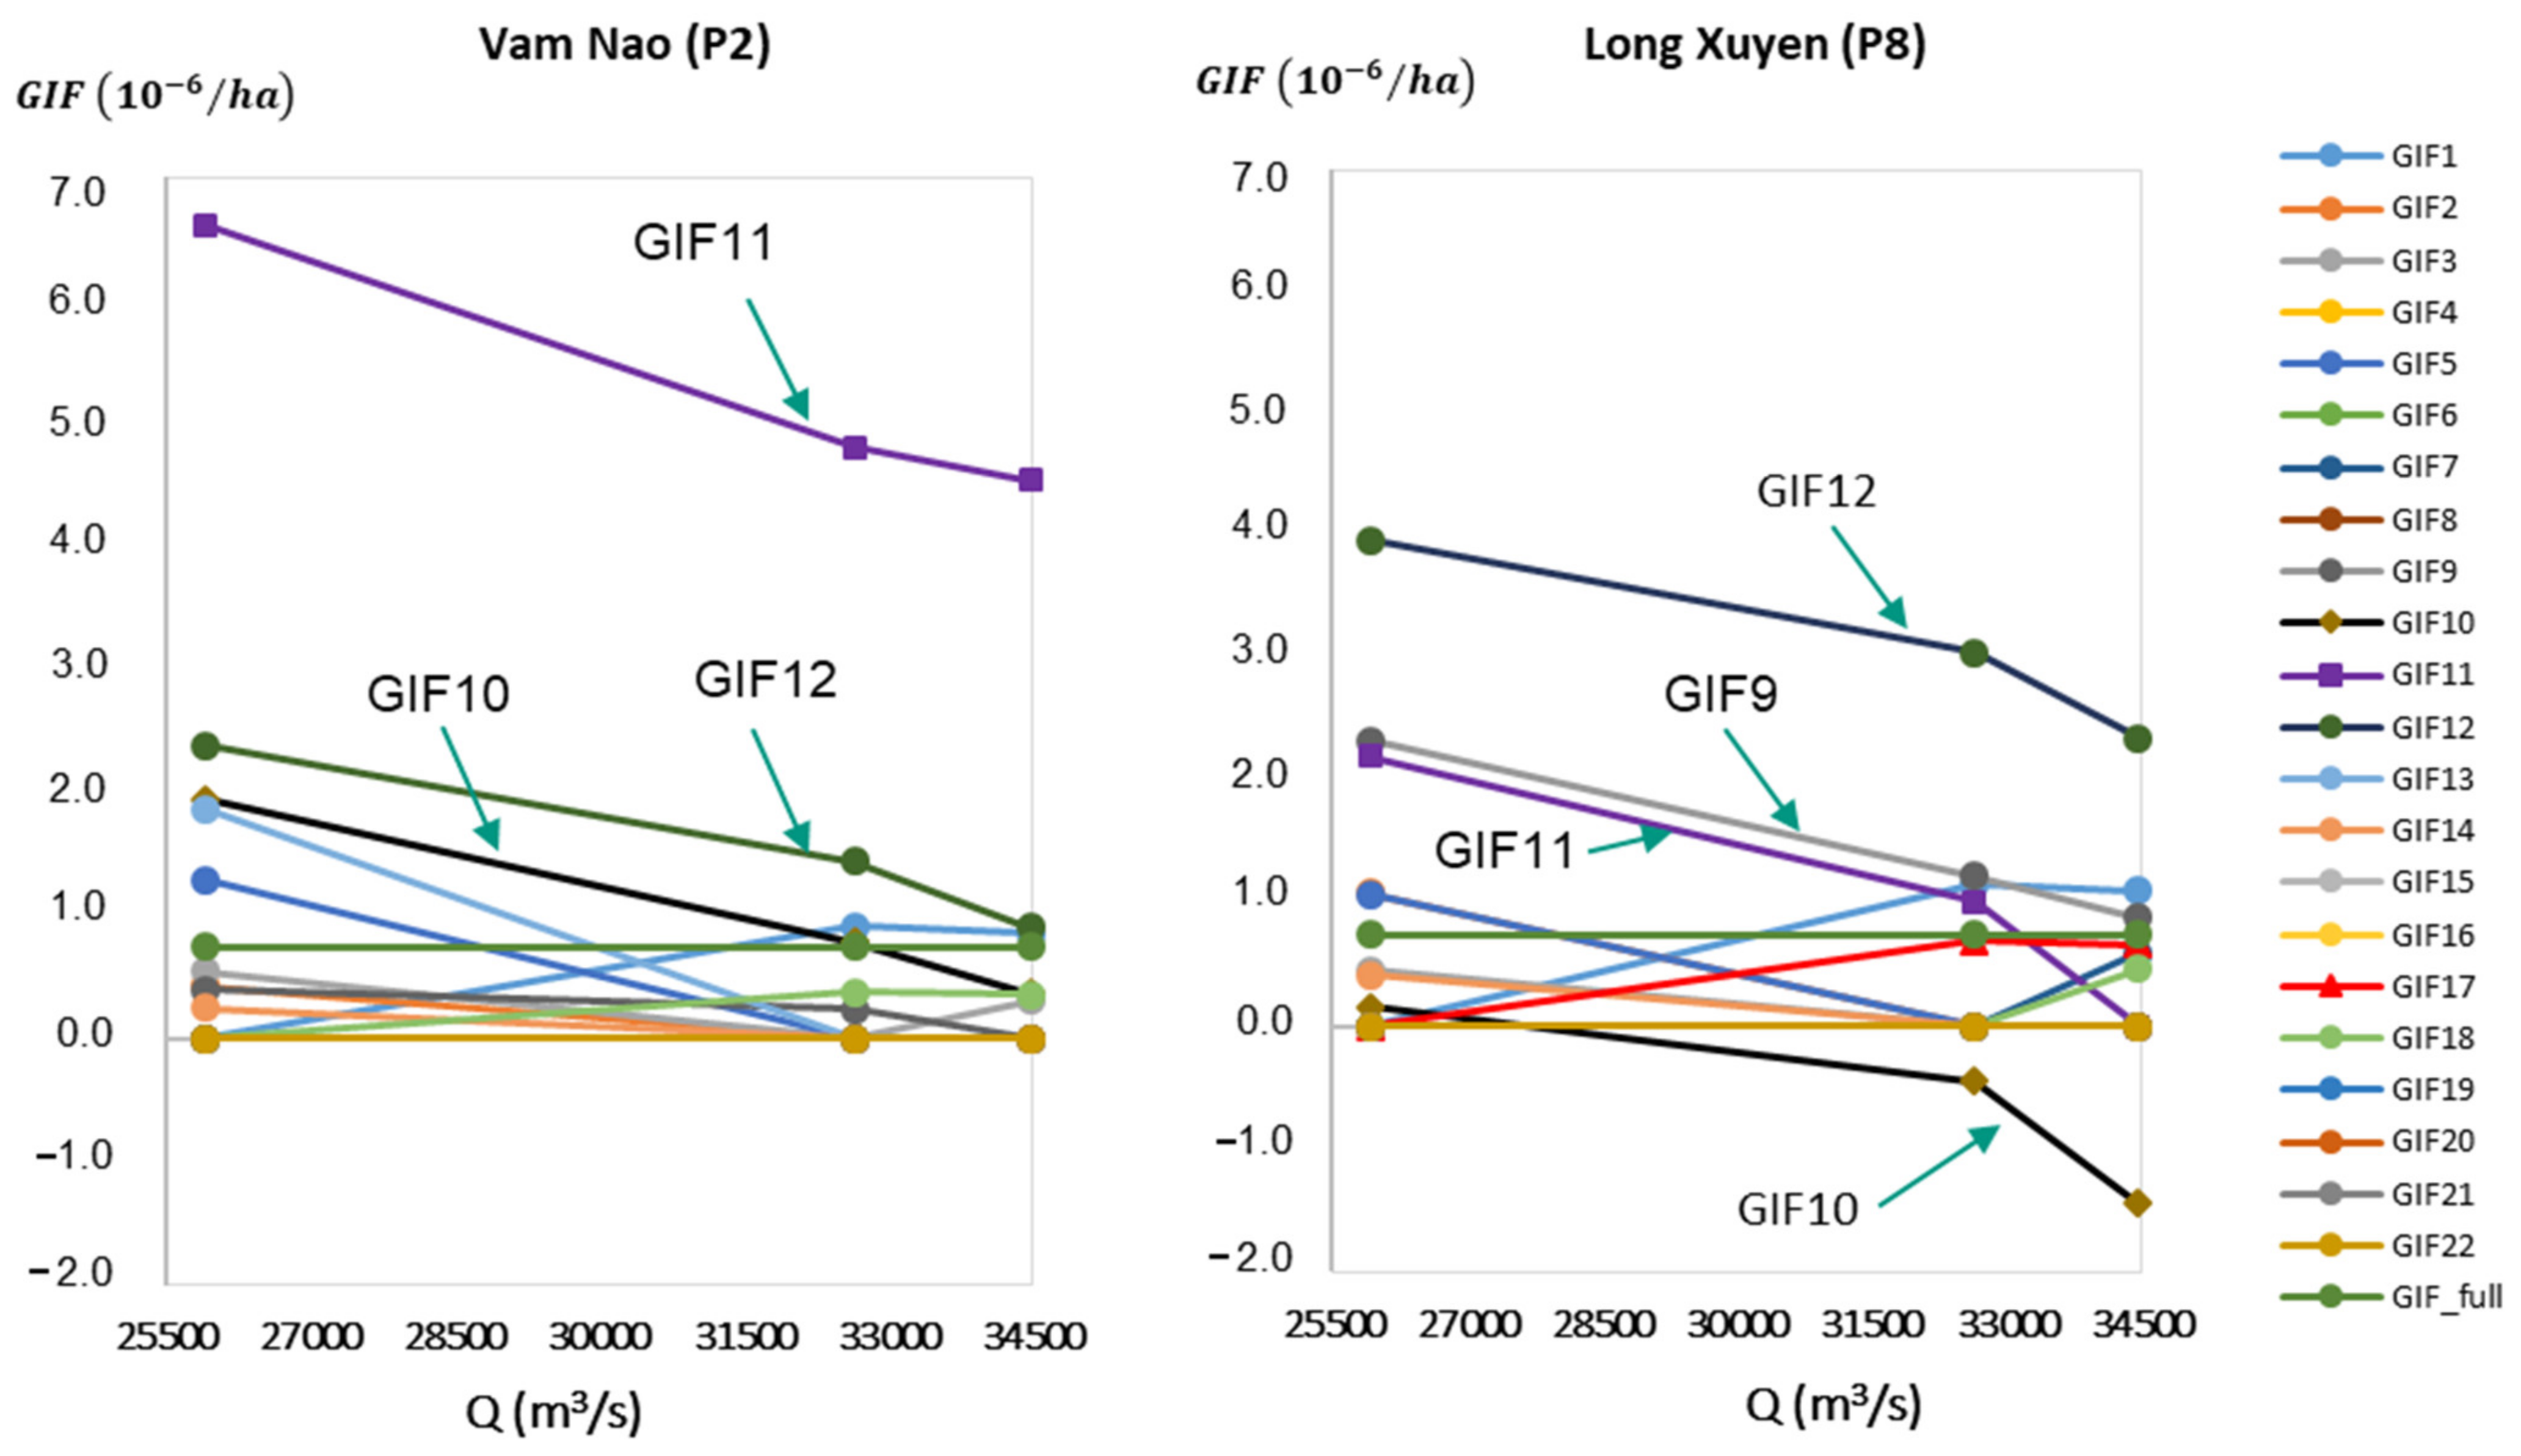
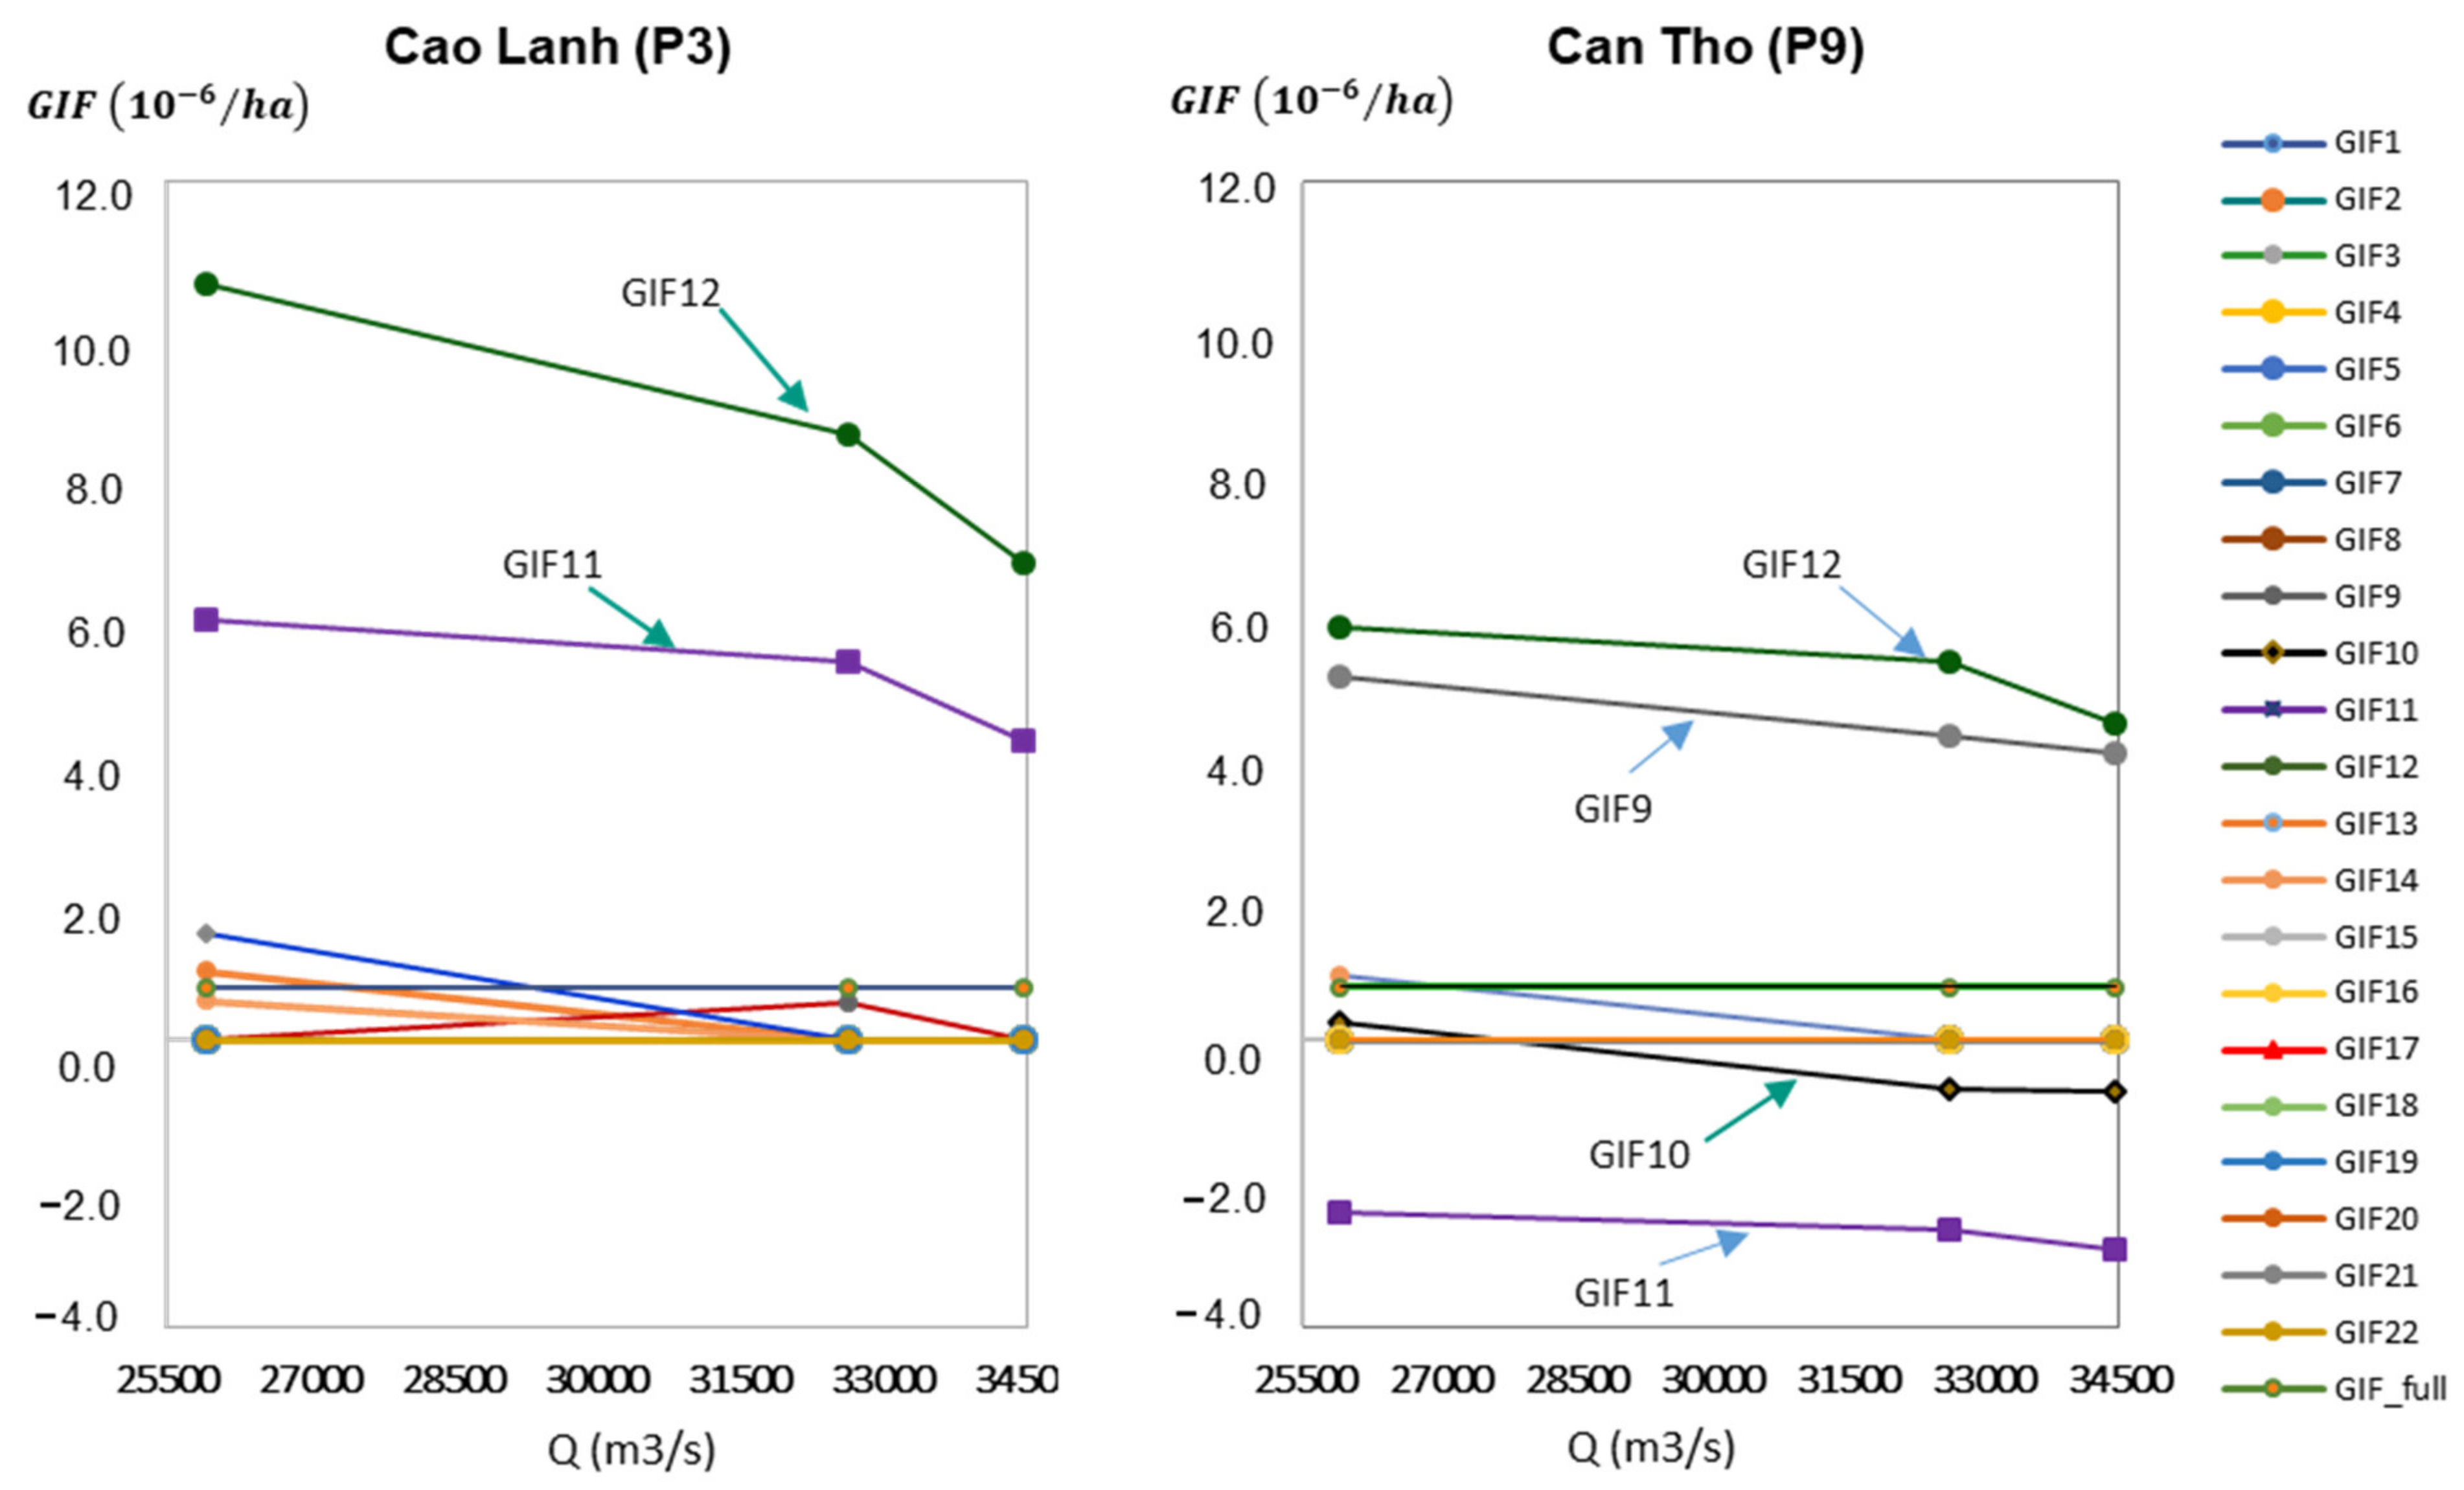
3.3. GIF-Based Sensitivities of the Influences of Geographical Dyke Compartment Scenarios on Flood Water Levels in Terms of Flood Magnitudes

The geographical location of high-dyke compartments and the magnitude of floods had different levels of impact on the water level at Tan Chau (P1), see Figure 12. With low floods, the construction of high-dyke at almost compartments cause small impact on the water level at Tan Chau, except at the compartments of A10, A11, and A15, relatively high. The impacts decrease significantly from low to medium floods but reduce slightly from medium to high floods. In contrast, the A17 compartment has quite a small effect with low floods, whereas the influence increases slightly with medium flood and rapidly with the high flood. The findings imply consideration on the part of the authorities before implementing land use changes for rice production based on high-dyke protections.
The high-dyke compartments also have various influences on the water level at Chau Doc (P6) (also see Figure 12). Generally, most of the compartments with a high-dyke system cause relatively low impacts on the water level at this point. Exceptionally, the A1 compartment causes a relatively high effect on the water level. This tendency is stable for small and medium floods but increases sharply in the case of high floods. In contrast, the A10 compartment increases the water level at Tan Chau (P1). It decreases the water level at Chau Doc (P6) because the high-dyke construction in this compartment prevents the flood water from entering from the Mekong River to the Bassac River. This tendency is more apparent with medium and high floods.
As shown in Figure 13, dyke measurements at the compartment of A11 are very sensitive to the change in water level at Vam Nao (P2) on the Mekong River. The A12 compartment causes a relatively high impact on both main rivers, Cao Lanh (P3) and Long Xuyen (P8), in high floods. Afterwards, the impact decreases in medium and low floods. Besides, the A10 compartment slightly raises the water level at Vam Nao (P3) and reduces the water level at Long Xuyên (P8) due to preventing floodwater from overflowing from the Mekong River to the Bassac River. Surprisingly, the A9 compartment associated with the Omon-Xano infrastructure system causes a high impact on the water level at Long Xuyen (P8). The impact is slightly higher than the influence of compartment A11, although A9 is located further downstream the Bassac River.
Dyke measurements at the compartments of A11 and A12 are sensitive to the changes in water levels at Cao Lanh (P3), whereas those at A9 and A11 have a great influence on the water levels at Can Tho (P9), see Figure 14. The A12 compartment has a relatively high impact on Cao Lanh (P3) and Can Tho (P9) in low floods, but the impact decreases in medium and high floods. Besides, the A11 compartment raises the water level at Cao Lanh (P3). It reduces the water level at Can Tho (P9) due to preventing floodwater from overflowing from the Mekong River to the Bassac River.
It is also shown in Figure 14 that the influence of the A11 compartment on the water level decreases with medium and high floods. Remarkably, the A9 compartment indicates a high impact on the water level at Can Tho (P9). The tendency of high-dyke effects on these compartments decreases gradually with medium and high floods. However, the high-dyke impacts are insignificant for other compartments.
The construction of high dykes for the whole Mekong River causes highest impact in terms of water level change along the main rivers, however GIF_full is smallest for all types of floods at any location along the Mekong and Bassac Rivers, because the total area of dyke construction in the region is the largest with 1.337.000 ha, see GIF_full in Figure 12, Figure 13 and Figure 14 above.

4. Conclusions

The extensive construction of low dykes and high dykes within the floodplains of the Vietnamese Mekong Delta (VMD) to protect the rice cropping against flooding has caused impacts on the flooding levels along the Mekong Rivers. This study used the 1D-quasi-2D hydrodynamic model setup for the whole deltaic domain to simulate scenarios of dyke construction development in the context of low, medium, and high floods after the high performance of calibration and validation processes with hydrological data and satellite products. Notably, we applied a link-channel method to perform flood dynamics overflowing into the floodplains that helped the model run faster and more stable than previous studies using artificial dyke cells. Based on the numerical simulation results, we established the Geographical Impact Factor (GIF) to reveal the geographical influences of rice-based land use scenarios in the upper floodplains of the VMD under high-dyke protections on the river water levels. The research findings lead to the following conclusions:
  • Overall, the high-dyke developments for land use purposes cause relatively minor impacts on the water levels in the Mekong and Bassac Rivers. However, the high-dyke measurements at multiple compartments in the middle zone indicate higher effects on the water levels at Tan Chau, Chau Doc, Cao Lanh, and Can Tho. Besides, the compartment of A9 (Omon-Xano system) would be susceptible to the increase in water level at Can Tho in the case of the high-dyke system built in this area.
  • Different flooding magnitudes such as high-, medium-, and low-floods cause different influences on flood water along the Mekong Rivers if the compartment is located in the middle zone (A10, A11, A12) or near the main rivers (A1, A3, A5, A7, A9, A13, A15, A17, A19, A21), when the dyke compartment locates outside the middle zone and far from the main rivers (A2, A4, A6, A8, A14, A16, A18, A20, and A22), the impact of different flood magnitudes is negligible.
  • The GIF has been established to help scientists and planners in various aspects. It could anticipate a possible impact of the dyke-based measures on the water level along the main rivers. Therefore, any construction of high dykes at any location in the Mekong Delta would be quickly assessed under all kinds of flood conditions. The GIF would also be a scientific basis for developing a flood level estimation method (FLEM) for flood water level prediction along the Mekong Rivers [42].
  • Agricultural production plans under high-dyke protections could be assessed and optimised according to the rivers’ accepted flood water levels. The smaller the GIF identified for any high-dyke compartment, the better the triple rice production cultivated in that compartment.

Author Contributions

Conceptualization, H.T.D.V., V.C.T., P.O., S.H. and F.N.; methodology, H.T.D.V., V.C.T., P.O. and F.N.; software, H.T.D.V.; validation, H.T.D.V.; writing—original draft preparation, H.T.D.V.; writing—review and editing, D.D.T., V.C.T., P.O.; visualization, H.T.D.V. and D.D.T.; supervision, V.C.T., F.N., S.H., and P.O.; project administration, P.O. and F.N.; funding acquisition, F.N. and P.O. All authors have read and agreed to the published version of the manuscript.

Funding

This research was funded by the Catholic Academic Exchange Service (KAAD) fellowship program for the period from 2012 to 2016. The APC was funded by the Open Access Publishing Fund of the Karlsruhe Institute of Technology (KIT), Germany.

Institutional Review Board Statement

Not applicable.

Informed Consent Statement

Not applicable.

Data Availability Statement

Data used for this study are available from the corresponding author upon request.

Acknowledgments

The authors acknowledge the support by the Open Access Publishing Fund of the Karlsruhe Institute of Technology (KIT), Germany. We would like to thank Heinrich Geiger, Head of KAAD Asian Department, for his continuous support during the research time. We also offer special thanks to the Danish Hydraulic Institute (DHI) for kindly providing the license for the hydraulic model MIKE11 to implement this study.

Conflicts of Interest

The authors declare no conflict of interest.

Appendix A

Figure A1. Model calibration of water level with the high flood in 2000.
Water 13 01144 g0a1
Figure A2. Model calibration of water level with the high flood in 2011.
Water 13 01144 g0a2
Figure A3. Model validation of water level with the low flood in 2012.
Water 13 01144 g0a3
Figure A4. Model validation of water level with the medium flood in 2013.
Water 13 01144 g0a4

References

  1. Dao, T.A.; Thai, V.T.; Nguyen, N.V. (Eds.) The Domestic Rice Value Chain in the Mekong Delta; Springer: Singapore, 2020. [Google Scholar]
  2. Käkönen, M. Mekong delta at the crossroads: More control or adaptation? AMBIO J. Hum. Environ. 2008, 37, 205–212. [Google Scholar] [CrossRef]
  3. Park, E.; Ho, H.L.; Tran, D.D.; Yang, X.; Alcantara, E.; Merino, E.; Son, V.H. Dramatic decrease of flood frequency in the Mekong delta due to river-bed mining and dyke construction. Sci. Total Environ. 2020, 723, 138066. [Google Scholar] [CrossRef]
  4. Chu, V.C.; Brown, S.; To, H.H.; Hockings, M. Using Melaleuca fences as soft coastal engineering for mangrove restoration in Kien Giang, Vietnam. Ecol. Eng. 2015, 81, 256–265. [Google Scholar] [CrossRef]
  5. Minderhoud, P.S.J.; Erkens, G.; Pham, V.H.; Vuong, B.T.; Stouthamer, E. Assessing the potential of the multi-aquifer subsurface of the Mekong delta (Vietnam) for land subsidence due to groundwater extraction. Proc. Int. Assoc. Hydrol. Sci. 2015, 372, 73–76. [Google Scholar] [CrossRef] [Green Version]
  6. Khong, T.D.; Young, M.D.; Loch, A.; Thennakoon, J. Mekong river delta farm-household willingness to pay for salinity intrusion risk reduction. Agric. Water Manag. 2018, 200, 80–89. [Google Scholar] [CrossRef]
  7. Eslami, S.; Hoekstra, P.; Trung, N.N.; Kantoush, S.A.; Van Binh, D.; Quang, T.T.; Van der Vegt, M. Tidal amplification and salt intrusion in the Mekong delta driven by anthropogenic sediment starvation. Sci. Rep. 2019, 9, 18746. [Google Scholar] [CrossRef]
  8. Hoang, L.P.; Lauri, H.; Kummu, M.; Koponen, J.; Van Vliet, M.T.; Supit, I.; Leemans, R.; Kabat, P.; Ludwig, F. Mekong River flow and hydrological extremes under climate change. Hydrol. Earth Syst. Sci. 2016, 20, 3027–3041. [Google Scholar] [CrossRef] [Green Version]
  9. Triet, N.V.K.; Dung, N.V.; Fujii, H.; Kummu, M.; Merz, B.; Apel, H. Has dyke development in the Vietnamese Mekong delta shifted flood hazard downstream? Hydrol. Earth Syst. Sci. 2017, 21, 3991–4010. [Google Scholar] [CrossRef] [Green Version]
  10. Tran, D.D.; Van Halsema, G.; Hellegers, P.J.G.J.; Hoang, P.L.; Tran, Q.T.; Kummu, M.; Ludwig, F. Assessing impacts of dike construction on the flood dynamics of the Mekong delta. Hydrol. Earth Syst. Sci. 2018, 22, 1875–1896. [Google Scholar] [CrossRef] [Green Version]
  11. Beilfuss, R.; Tran, T. A Scoping Study on Climate Change and Hydropower in the Mekong River Basin: A Synthesis of Research; Deutsche Gesellschaft für International Zusammenarbeit (GIZ) GmbH: Bonn, Germany, 2014. [Google Scholar]
  12. Duong, T.A.; Hoang, L.P.; Bui, M.D.; Rutschmann, P. Modelling seasonal flows alteration in the Vietnamese Mekong delta under upstream discharge changes, rainfall changes and sea level rise. Int. J. River Basin Manag. 2019, 17, 435–449. [Google Scholar] [CrossRef]
  13. Triet, N.V.K.; Dung, N.V.; Hoang, L.P.; Duy, L.N.; Tran, D.D.; Anh, T.T.; Kummu, M.; Merz, B.; Apel, H. Future projections of flood dynamics in the Vietnamese Mekong delta. Sci. Total Environ. 2020, 742, 140596. [Google Scholar] [CrossRef]
  14. Triet, N.K.V.; Dung, N.V.; Merz, B.; Apel, H. Towards risk-based flood management in highly productive paddy rice cultivation—Concept development and application to the Mekong delta. Nat. Hazards Earth Syst. Sci. 2018, 18, 2859–2876. [Google Scholar] [CrossRef] [Green Version]
  15. Hoa, L.T.V.; Nguyen, H.N.; Wolanski, E.; Tran, T.C.; Haruyama, S. The combined impact on the flooding in Vietnam’s Mekong river delta of local man-made structures, sea level rise, and dams upstream in the river catchment. Sedimentological and ecohydrological processes of Asian deltas: The Yangtze and the Mekong. Estuar. Coast. Shelf Sci. 2007, 71, 110–116. [Google Scholar] [CrossRef]
  16. Hoa, L.T.V.; Shigeko, H.; Nhan, N.H.; Cong, T.T. Infrastructure effects on floods in the Mekong river delta in Vietnam. Hydrol. Process. 2008, 22, 1359–1372. [Google Scholar] [CrossRef]
  17. Danh, V.; Mushtaq, S. Living with Floods: An Evaluation of the Resettlement Program of the Mekong Delta of Vietnam. In Environmental Change and Agricultural Sustainability in the Mekong Delta; Stewart, M.A., Coclanis, P.A., Eds.; Springer: Dordrecht, Netherlands, 2011. [Google Scholar]
  18. Le, A.T. Flood Risk Reduction and Climate Change Responses to Rice Production in the Mekong River Delta of Vietnam. 2013. Available online: https://www.researchgate.net/publication/259005604_Flood_risk_reduction_and_climate_change_reponses_to_rice_production_in_the_mekong_river_delta_of_vietnam (accessed on 16 April 2021).
  19. Van, T.C. Impacts of rising sea level on the Mekong Delta. Int. J. Hydropower Dams 2010, 17, 73. [Google Scholar]
  20. Duong, V.H.T.; Van, T.C.; Franz, N.; Peter, O.; Trung, N.N. Land Use Base Flood Hazards Analysis for the Mekong Delta. In Proceedings of the 19th IAHR–APD Congress 2014, Hanoi, Vietnam, 21–24 September 2014. [Google Scholar] [CrossRef]
  21. Tran, D.D.; Weger, J. Barriers to implementing irrigation and drainage policies in an Giang province, Mekong delta, Vietnam. Irrig. Drain 2018, 67, 81–95. [Google Scholar] [CrossRef] [Green Version]
  22. Kuenzer, C.; Guo, H.; Huth, J.; Leinenkugel, P.; Li, X.; Dech, S. Flood mapping and flood dynamics of the Mekong delta: ENVISAT-ASAR-WSM based time series analyses. Remote Sens. 2013, 5, 687–715. [Google Scholar] [CrossRef] [Green Version]
  23. Hoang, L.P.; Michelle, T.H.; Van Vlieth, M.T.; Kummu, M.; Lauri, H.; Koponen, J.; Supit, I.; Leemans, R.; Kabat, P.; Ludwig, F. The Mekong’s future flows under multiple drivers: How climate change, hydropower developments and irrigation expansions drive hydrological changes. Sci. Total Environ. 2019, 649, 601–609. [Google Scholar] [CrossRef]
  24. Li, X.; Liu, P.J.; Saito, Y.; Nguyen, V.L. Recent evolution of the Mekong delta and the impacts of dams. Earth Sci. Rev. 2017, 175, 1–17. [Google Scholar] [CrossRef]
  25. Pearse-Smith, S.W. The impact of continued Mekong basin hydropower development on local livelihoods. Consilience 2012, 7, 73–86. [Google Scholar]
  26. Duong, V.H.T. Land Used Based Flood Hazard Analysis for the Mekong Delta. Doctoral Dissertation, Karlsruhe Institute of Technology, Karlsruhe, Germany, 2019. [Google Scholar] [CrossRef]
  27. Vuong, Q.H. Vietnam’s political economy: A discussion on the 1986–2016 period. CEB-ULB WP 2014. [Google Scholar] [CrossRef] [Green Version]
  28. Benedikter, S. The Vietnamese Hydrocracy and the Mekong Delta: Water Resources Development from State Socialism to Bureaucratic Capitalism; University of Bonn: Bonn, Germany, 2013; ISBN 978-3-643-90437-9. [Google Scholar]
  29. Nhut, Q.M. Efficiency Analysis of Selected Farming Patterns: The Case of Irrigated Systems in the Mekong Delta of Vietnam. In Environmental Change and Agricultural Sustainability in the Mekong Delta; Stewart, M., Coclanis, P., Eds.; Springer: Dordrecht, The Netherland, 2011; Volume 45. [Google Scholar]
  30. Van, P.D.T.; Trung, N.H.; Tuu, N.T. Flow dynamics in the Long Xuyen Quadrangle under the impacts of full-dyke systems and sea level rise. VNU J. Sci. Earth 2012, 28, 205–214. [Google Scholar]
  31. Thanh, V.Q.; Roelvink, D.; Van der Wegen, M.; Reyns, J.; Kernkamp, H.; Vinh, G.V.; Thi, P.L.V. Flooding in the Mekong delta: The impact of dyke systems on downstream hydrodynamics. Hydrol. Earth Syst. Sci. 2020, 24, 189–212. [Google Scholar] [CrossRef] [Green Version]
  32. Sakamoto, T.; Nguyen, V.N.; Kotera, A.; Ohno, H.; Ishitsuka, N.; Yokozawa, M. Detecting temporal changes in the extent of annual flooding within the Cambodia and the Vietnamese Mekong delta from MODIS time-series imagery. Remote Sens. Environ. 2007, 109, 295–313. [Google Scholar] [CrossRef]
  33. Sakamoto, T.; Van Phung, C.; Kotera, A.; Duy, K.N.; Yokozawa, M. Detection of yearly change in farming systems in the Vietnamese Mekong delta from MODIS time-series imagery. Jpn. Agric. Res. Q. JARQ 2009, 43, 173–185. [Google Scholar] [CrossRef] [Green Version]
  34. Duong, V.H.T.; Nestmann, F.; Van, T.C.; Oberle, P.; Geiger, H. Geographical Impact of Dyke Measurement for Land Use on Flood Water in the Mekong Delta. In Proceedings of the WA 8th Eastern European Young Water Professionals Conference, Gdansk, Poland, 12–14 May 2016; pp. 308–317. [Google Scholar]
  35. Dung, N.V.; Merz, B.; Bárdossy, A.; Thang, T.D.; Apel, H. Multi-objective automatic calibration of hydrodynamic models utilizing inundation maps and gauge data. Hydrol. Earth Syst. Sci. 2011, 15, 1339–1354. [Google Scholar] [CrossRef] [Green Version]
  36. DHI. A Modelling System for Rivers and Channels: User Guide. 2012. Available online: https://www.mikepoweredbydhi.com/products/mike-11 (accessed on 16 April 2021).
  37. Dang, T.D.; Cochrane, T.A.; Arias, M.E.; Van, P.D.T.; Vries, D.T.T. Hydrological alterations from water infrastructure development in the Mekong floodplains. Hydrol. Process. 2016, 30, 3824–3838. [Google Scholar] [CrossRef]
  38. Dang, D.T.; Cochrane, T.A.; Arias, M.E. Future hydrological alterations in the Mekong delta under the impact of water resources development, land subsidence and sea level rise. J. Hydrol. Reg. Stud. 2018, 15, 119–133. [Google Scholar] [CrossRef]
  39. Aberle, J.; Järvelä, J. Flow resistance of emergent rigid and flexible floodplain vegetation. J. Hydraul. Res. 2013, 51, 33–45. [Google Scholar] [CrossRef]
  40. Nepf, H.M. Hydrodynamics of vegetated channels. J. Hydraul. Res. 2012, 50, 262–279. [Google Scholar] [CrossRef] [Green Version]
  41. Pasquino, V.; Gualtieri, P.; Doria, G.P. On Evaluating Flow Resistance of Rigid Vegetation Using Classic Hydraulic Roughness at High Submergence Levels: An Experimental Work. In Hydrodynamic and Mass Transport at Freshwater Aquatic Interfaces; Springer: Cham, Switzerland, 2016; pp. 269–277. [Google Scholar]
  42. Duong, V.H.T.; Nestmann, F.; Van, T.C.; Hinz, S.; Oberle, P. Introduction about the flood level estimation method (FLEM) for prediction water level along the Mekong rivers. In Proceedings of the 10th Eastern European Young Water Professionals Conference IWA-YWP, Zagreb, Croatia, 7–12 May 2018; Available online: https://www.researchgate.net/publication/325228600_Introduction_about_the_Flood_Level_Estimation_Method_FLEM_for_prediction_water_level_along_the_Mekong_Rivers (accessed on 16 April 2021).
Figure 1. Map of the Vietnamese Mekong Delta and the location of Tan Chau gauge [26].
Water 13 01144 g001
Figure 2. Maximum water levels measured at Tan Chau hydrological gauge.
Water 13 01144 g002
Figure 3. Images of low dykes and high dykes in the Mekong Delta (left and middle; Xuan, 2012); Dyke system in the upstream region of the Vietnamese Mekong Delta (right; SIWRR, 2011).
Water 13 01144 g003
Figure 4. Maximum flood extents in 2000 and 2011 in the Vietnamese Mekong Delta [34].
Water 13 01144 g004
Figure 5. Geometry of Mekong River network in the numerical model MIKE 11.
Water 13 01144 g005
Figure 7. The flooding zone of the VMD with 22 compartments (A) and ten examined locations (P, including P1-Tan Chau, P2-Vam Nao 1, P3-Cao Lanh, P4-My Thuan, P5-My Tho on the Mekong River, and P6-Chau Doc, P7-Vam Nao 2, P8-Long Xuyen, P9-Can Tho, P10-Dai Ngai on the Bassac River).
Water 13 01144 g007
Figure 8. Agreement of flood maps in 2000 and 2011 simulated by the Mike 11 hydraulic models and satellite products.
Water 13 01144 g008
Figure 9. GIF-based influences of high-dyke construction scenarios for triple rice production on the river water levels in the VMD.
Water 13 01144 g009
Figure 10. GIF of compartment A10 on the flood water levels along the Mekong and Bassac Rivers.
Water 13 01144 g010
Figure 11. GIF of compartment A20 on the flood water levels along the Mekong and Bassac Rivers.
Water 13 01144 g011
Figure 12. Geographical impact factors at Tan Chau (left) and Chau Doc (right) versus total flood discharge into the Mekong Delta measured at the Tan Chau and Chau Doc gauging stations.
Water 13 01144 g012
Figure 13. Geographical impact factors at Vam Nao (left) and Long Xuyen (right) versus total flood discharge into the Vietnamese Mekong Delta measured at the Tan Chau and Chau Doc gauging stations.
Water 13 01144 g013
Figure 14. Geographical impact factors at Cao Lanh (left) and Can Tho (right) versus total flood discharge into the Vietnamese Mekong Delta measured at the Tan Chau and Chau Doc gauging stations.
Water 13 01144 g014
Table 1. The calibrated Manning’s coefficients in different sections of the Mekong River system.
DescriptionsManning’s Coefficient Range
(s/m1/3)
Remark
1. Mekong and Bassac Riversn = 0.014 to 0.030
  • Upstream rivers
n = 0.028 to 0.030Cambodian territory: from Kratie to Tan Chau, Chau Doc
  • Upper delta
n = 0.026 to 0.028On Mekong River
(MK): from Tan Chau to Vam Nao
On Bassac River (BS): from Chau Doc to Long Xuyen
  • Middle delta
n = 0.022 to 0.026MK: Vam Nao to My Thuan
BS: Long Xuyen to Can Tho
  • Near the coast
n = 0.014 to 0.022MK: My Thuan to Cua Dai
BS: Dai Ngai to Tran De
2. Main channelsn = 0.022 to 0.030
3. Inland channelsn = 0.028 to 0.030
4. Floodplainsn = 0.033 to 0.035
Table 2. Areas of the compartments, in hectares (ha).
No.CodeNameArea (ha)No.CodeNameArea (ha)
1A1LXQ133,20213A13PoR126,803
2A2LXQ2115,11614A14PoR219,963
3A3LXQ390,83715A15PoR316,593
4A4LXQ459,39516A16PoR436,115
5A5LXQ538,53117A17PoR555,050
6A6LXQ632,95718A18PoR679,306
7A7WBR161,47419A19PoR767,797
8A8WBR248,03520A20PoR882,596
9A9WBR3125,00021A21PoR974,841
10A10MID177,10222A22PoR1095,553
11A11MID237,79723TotalTotal1,337,000
12A12MID362,937
Table 3. Scenarios of dyke measurement locations in the VMD (in hectares).
Flood TypeScenariosDischarge Water Level RainfallDyke System
(m3·s−1)(m)(m)
High floodBaselineQ_2011H_2011R_2011No dyke at all compartments
High-dykeQ_2011H_2011R_2011High-dyke at all compartments
AiQ_2011H_2011R_2011High-dyke at Ai, no-dyke system
(with i = 1÷22) at other 21 compartments
Medium floodBaselineQ_2013H_2013R_2013No dyke at all compartments
High-dykeQ_2013H_2013R_2013Highdyke at all compartments
AiQ_2013H_2013R_2013High-dyke at Ai, no-dyke system
(with i = 1÷22) at other 21 compartments
Low floodBaselineQ_2012H_2012R_2012No dyke at all compartments
High-dykeQ_2012H_2012R_2012High-dyke at all compartments
AiQ_2012H_2012R_2012High-dyke at Ai, no-dyke system
(with i = 1÷22) at other 21 compartments
Table 4. Results of calibration and validation in the floods of 2000, 2011, 2012, and 2013.
No. StationHigh Flood (2000)High Flood (2011)Medium Flood (2013)Low Flood (2012)
DescriptionEEEEEEEE
Q (m3/s)WL (cm)Q (m3/s)WL (cm)Q (m3/s)WL (cm)Q (m3/s)WL (cm)
1On the main riversTan Chau0.800.910.850.980.860.920.730.80
2Chau Doc0.820.820.920.980.930.920.760.75
3Vam Nao0.86-0.810.980.730.940.750.78
4Cho Moi---0.96- -- -
5Long Xuyen---0.79-0.8-0.65
6Can Tho0.750.940.900.930.700.940.800.88
7Dai Ngai---0.94-0.96-0.96
8Cao Lanh---0.96-0.94-0.76
9My Thuan-0.88-0.95-0.97-0.97
10My Tho-0.97-0.93-0.93-0.9
11On the inland canalsXuan To-0.94-0.88-0.76-0.60
12Tri Ton-0.9-0.92-0.71-0.72
13Tan Hiep-0.65-0.65-0.85-0.66
14Moc Hoa-0.69-0.94-0.76-0.63
15Truong Xuan-0.80-0.91-0.81--
16Kien Binh---0.82-0.66--
17Tuyen Nhon---0.73-0.67--
18 Cai Lay---0.66-0.68--
Note: “-” means no valuable data for calibration and validation.
Publisher’s Note: MDPI stays neutral with regard to jurisdictional claims in published maps and institutional affiliations.

