Article

Interpersonal Conflict over Water Is Associated with Household Demographics, Domains of Water Insecurity, and Regional Conflict: Evidence from Nine Sites across Eight Sub-Saharan African Countries

by
Amber L. Pearson
1,*,
Elizabeth A. Mack
1,
Amanda Ross
2,
Richard Marcantonio
3,
Andrew Zimmer
4,
Erin L. Bunting
1,
Audrey C. Smith
5,
Joshua D. Miller
6,
Tom Evans
4 and
The HWISE Research Coordination Network
1
Department of Geography, Environment and Spatial Sciences, Michigan State University, East Lansing, MI 48824, USA
2
Department of Economics, Finance and Legal Studies, University of Alabama, Tuscaloosa, AL 35487, USA
3
Kroc Institute for International Peace Studies, University of Notre Dame, Notre Dame, IN 46566, USA
4
School of Geography, University of Arizona, Tucson, AZ 85719, USA
5
Department of Geography, University of Florida, Gainesville, FL 32611, USA
6
Department of Anthropology, Northwestern University, Evanston, IL 60208, USA
*
Author to whom correspondence should be addressed.
HWISE Research Coordination Network authors: Shalean M. Collins, Northwestern University; Mobolanle Balogun, University of Lagos; Ellis Adams, University of Notre Dame; Justin Stoler, University of Miami; Desire Tshala-Katumbay, Oregon Health & Science University; Michael J. Boivin, Michigan State University; Marianne V. Santoso, Northwestern University; Sera L. Young, Northwestern University; Patrick Mbullo, Northwestern University; Kenneth Maes, Oregon State University; Yihenew Tesfaye, Oregon State University; Alex Trowell, University of Amsterdam; Matthew C. Freeman, Emory University; Raymond Tutu, Delaware State University; Gershim Asiki, African Population and Health Research Center.
Water 2021, 13(9), 1150; https://doi.org/10.3390/w13091150
Submission received: 22 December 2020 / Revised: 29 March 2021 / Accepted: 17 April 2021 / Published: 22 April 2021
(This article belongs to the Special Issue The New Normal: Water Use Conflicts in the 21st Century)

Abstract

:
Water insecurity may precipitate interpersonal conflict, although no studies to date have rigorously examined these relationships. We examined relationships between household demographics, water insecurity, regional conflict, and interpersonal conflict over water. Using survey data from eight sub-Saharan African countries, we found that interpersonal conflict within and outside the home is associated with multiple domains of water insecurity, particularly accessibility. Furthermore, we found that higher levels of remote violence and protests are associated with greater within household conflict, whereas riots and violent armed conflict are associated with greater conflict between neighbors. Our findings expand upon the current literature by examining factors affecting interpersonal conflict over water, which may become increasingly important as precipitation patterns and land temperatures change in this region.

1. Introduction

Sustainable access to adequate quantities of acceptable quality water (i.e., water security) [1] is fundamental for human health and societal well-being. Yet, an estimated four billion people around the world live in regions with water scarcity for at least one month of the year [2]. Disparities in water access are related to geographic, economic, and social divisions [3] and are anticipated to be exacerbated by increases in extreme weather events and changing rainfall patterns caused by climate change [2]. These changes and disparities are compounded by water-intensive behaviors, such as excess freshwater withdrawal, related to increasing rates of urbanization and economic development [4]. Macroeconomic changes and political upheaval further undermine equitable water availability, accessibility, affordability, quality, and reliability [5,6].
The increasing interconnectedness and transboundary nature of water flows and transactions render water governance a global issue [3,7,8]. Consequently, conflict occurrence over water resources is multiscalar [9,10,11] and highly contextual [12], ranging from physical conflicts (e.g., water wars) to contested power relations [13]. At the nation–state level, transboundary water agreements are a common strategy for grappling with the governance challenges associated with the uneven distribution of water and the transboundary nature of waterways [13]. A critical hydro political perspective on these agreements suggests they are shortsighted stopgaps to conflict that ignore or fail to consider the socio–ecological dynamics driving conflict over water resources [13,14,15]. From this perspective, transboundary agreements are a good example of hydro-hegemony [16,17] because they suffer from asymmetric power-relations that better position the powerful party to leverage a variety of tactics and strategies to move towards consolidated control over water resources [18].
While transboundary agreements between nation–states are certainly visible, high-profile examples of conflict and cooperation related to water resources, a growing body of work is beginning to analyze conflict and power dynamics at a more localized, sub-national level. For example, Garrick et al. [12] reviewed work on water reallocation from rural to urban areas, which is increasing due to rising levels of urbanization in the Global South. In regard to water and conflict directly, a preponderance of research has focused on regional scale conflict at the country and sub-national level with varied results [19,20,21,22,23,24]. Mack et al. [25] categorize this body of work into four groups. One group of studies found no linkage between water and conflict [26,27] and suggests this linkage may operate through other pathways (e.g., human health, food security). A second group found drier conditions or lower than average rainfall is associated with conflict [22,28,29]. These studies support the idea that scarce conditions produce conflict [30,31,32]. A third group found that wetter conditions are associated with conflict [19,33,34], arguing that during times of above-average rainfall, there is an abundance of resources, and, therefore, conflict is more productive than in times of scarcity [35,36]. Lastly, the fourth group of studies found that any deviation from normal leads to conflict [37,38,39]. This diversity of findings may be related to the type of conflict in question [20,39]. For example, Hendrix and Salehyan [20] found that violent conflicts, such as battles and riots, were more likely in wetter years while non-violent conflicts, such as protests and strikes, were more likely in drier years.
Within the growing body of work on water and conflict at finer spatial scales [19,27,28,34,38,40], there are few studies analyzing the link between interpersonal conflict and water where interpersonal conflict can be considered as conflict between individuals typically within a familial or social network relationship. Examples of this type of conflict include domestic intra-household disputes and violence [41,42], disputes over land tenure [43,44], and robbery. We hypothesize that water would impact the incidence of interpersonal conflict (including domestic violence) because of stress produced by coping with water insecurity directly or concomitant economic conditions and food insecurity [45,46]. Violent conflict between neighbors within the same community may also be possible due to climate-related migration [47]. Evidence from prior work also provides support for linkages between water and conflict. A study in rural Tanzania, for example, found that rainfall deviations (both positive and negative) led to the increased murder of ‘witches’, who are often elderly women [48]. Sekhri and Stoneygard [49] also found lower rainfall was associated with increased domestic violence and dowry deaths in India.
Prior research highlights that specific water insecurity domains may influence conflict. In particular, spending large amounts of time collecting water has been associated with greater conflict [50]. Evidence from East Africa suggests that when women are unable to provide or fetch adequate water or do not complete housework due to time spent fetching water, they are at risk of intimate partner abuse [51]. Unreliability and inaccessibility of water have also been shown to increase conflict between neighbors in Uganda [52]. At the regional scale, conflict (both armed and unarmed) may cause higher stress and tension within households, thereby precipitating interpersonal conflict. Likewise, areas with higher population density may experience higher levels of stress over limited water resources, thus resulting in conflict both within the household and possibly between neighbors.
To this point in time, however, fine-grained studies about violence between neighbors within the same community (e.g., village, city block) are scarce. This is particularly true for studies on water security and conflict, given the focus of prior work on rainfall patterns [48,49]. We, therefore, examined the relationship between demographics, water insecurity, and interpersonal conflict over water both within households and with neighbors using household-level data (n = 2728) from nine sites across eight countries in sub-Saharan Africa. First, we hypothesized that interpersonal conflict over water within and outside the home would be associated with larger household size, female household head, lower relative socioeconomic position, and lower income and age. Second, interpersonal conflict over water within and outside the home would be associated with at least one water insecurity domain: (i) quantity, (ii) quality, (iii) reliability, (iv) accessibility, or (v) cost, even when adjusting for food insecurity and demographic characteristics. Third, interpersonal conflict over water both within and outside the home would be more frequently affirmed in sites with higher levels of local conflict (both armed and unarmed) and/or higher population densities.

2. Materials and Methods

2.1. Sample

The data used in this study were from the Household Water Insecurity Experiences (HWISE) study, which was conducted between 2017 and 2018 [53]. We restricted the current analyses to only sites within sub-Saharan Africa (nine sites from eight countries; n = 2728 households). At all sites, informed consent was obtained prior to data collection by a trained field member with Internal Review Board oversight (from a variety of institutions) and administered in an appropriate local language (for details, see [53]). The survey was conducted with one eligible adult per household who self-identified as being knowledgeable about the household’s water situation. We further restricted the analyses to households for which we had complete data on all variables used in analyses (n = 2163), yielding our final analytical dataset (Figure 1).

2.2. Interpersonal Conflict over Water

The survey questions related to conflict over water were, “In the last 4 weeks, how frequently did you or anyone in your household have problems with water that caused difficulties with neighbors or others in the community?” and “In the last 4 weeks, how frequently did you or anyone in your household have problems with water that caused difficulties within your household?” Enumerator training for these questions focused on our intention to capture conflicts related to problems with water [54]. Training at each site involved at least one formally appointed lead investigator responsible for consistent training of all enumerators over 1–2 days. The first portion of the training curriculum was didactic, relying on a survey manual. The remainder was interactive and tactile, involving piloting and troubleshooting issues. Responses were in the form of frequency rankings from “never” (0 times) to “always” (more than 20 times in the last four weeks). For descriptive statistics, we generated a binary variable for each, representing any conflict versus no conflict in the prior four weeks.

2.3. Demographic Characteristics

Information on respondent age, sex of household head, and the number of children in the household was collected. Monthly cash income was measured through a survey question: “What is the primary monthly income for your household?” This was converted into USD using conversion rates at the time that data collection was completed at each site. We then calculated site-specific z-scores of monthly income. Because income was not adjusted for purchasing power, z-scores offer a way of comparing relative cash income within a study site, as done in previous work [55].
Participants were shown a picture of a ladder and asked, “Please think of this ladder as representing the socioeconomic standing of people in your community. At the top of the ladder are those who are best off; they have the most money, the most education, the most respected jobs. At the bottom are people who have the least money, least education, and least respected jobs. Where would you place yourself on this ladder?” to measure the relative socioeconomic position (SEP). This MacArthur Scale of Subjective Social Status [56] has values, which we coded to range from high status (10) to low status (1).
Food insecurity scores were generated using the 9-item Household Food Access Insecurity Scale (HFIAS) (0 = low, 27 = high) [57], using Likert-type responses and a 4-week recall period. Field staff recorded the cluster/site’s urban versus rural category and the season in which data were collected (wet, dry, or neither wet nor dry).

2.4. Domains of Water Insecurity

We used five questions to represent different domains of water insecurity (Table 1). Responses to all items, except those that related to accessibility, were in the form of frequency rankings from “never” (0 times) to “always” (more than 20 times in the last four weeks). Accessibility was recorded as roundtrip time, in minutes, to a household’s primary water source.

2.5. Regional Scale Conflict

To estimate proximity to regional conflict among survey participants, we used the latitude and longitude coordinates of the center of the sampling cluster. We then extracted the number (point data) and type of conflict event occurring between 2016 and 2018 within 500 km of this location using the Armed Conflict Location and Event Database (ACLED) [58]. A distance of 500 km was used because this was deemed a reasonable distance of regional conflict affecting neighboring areas. These values were then assigned as a cluster-level measure of conflict (mean = 1674.5, sd = 1525.5, range: 341 to 5266). We also conducted a sensitivity analysis examining differing buffer sizes (100 km, 1000 km) and by type of conflict (battles, riots, protests, strategic development, remote violence, violence against civilians) (see Table S10 for descriptive statistics).

2.6. Population Density

To assign population density to participants in the survey, we used 1 km resolution population data [59] and the coordinates of the sampling cluster to extract the population density of each cell within 10 km of each cluster location for the year 2015 (most recent year preceding the survey data period). A distance of 10 km was used as a reasonable distance to characterize a village and surrounding areas in a rural setting or the density of a city, based on previous village survey work [60]. We averaged these values (population/km2) and assigned the average population density to each household (mean = 3183.2, sd = 6868.1, range: 53.7 to 24,062.0).

2.7. Statistical Analyses

We first generated descriptive statistics for the demographic characteristics and each domain of water insecurity, stratified by whether or not the household experienced conflict within the past four weeks. We then evaluated differences for each using unequal variances t-tests for continuous variables, Wilcoxon rank-sum tests for ordinal variables, and chi-square tests for count data.
Before addressing the hypotheses, we first evaluated potential multicollinearity between our independent variables of interest. We did so by creating a correlation matrix (Table S1) and determined that multicollinearity was unlikely an issue (no correlations exceeded 0.55). To address our first hypothesis, we used multi-level ordinal logistic regression models with frequency of either conflict with neighbors or within the household as the dependent variable. We included demographic variables as independent variables (female head of household, age, number of children, relative SEP, and monthly cash income z-score). We also included whether the survey was conducted in the dry season and accounted for clustering within sampling clusters (e.g., neighborhood) and within each study site.
To address our second hypothesis, we estimated similar regression models, with the addition of five independent variables representing separate domains of water insecurity (quantity, quality, accessibility, reliability, and cost) as independent variables. We also included the food insecurity score as a potential confounder.
To address our third hypothesis, we estimated regression models (similar to those used for hypothesis 2), with the addition of two cluster-level variables: conflict within 500 km and average population density within 10 km. To further ensure that multicollinearity was not an issue in our regression modeling, we estimated the variance inflation factor (VIF) for each model. All models had VIFs < 1.5, indicating no issues. Due to concerns over the differences in water insecurity contexts across rural and urban settings, we also fitted stratified models for our most complex models (with all independent variables). All statistical analyses were conducted using Stata v16 (StataCorp, College Station, TX, USA).

3. Results

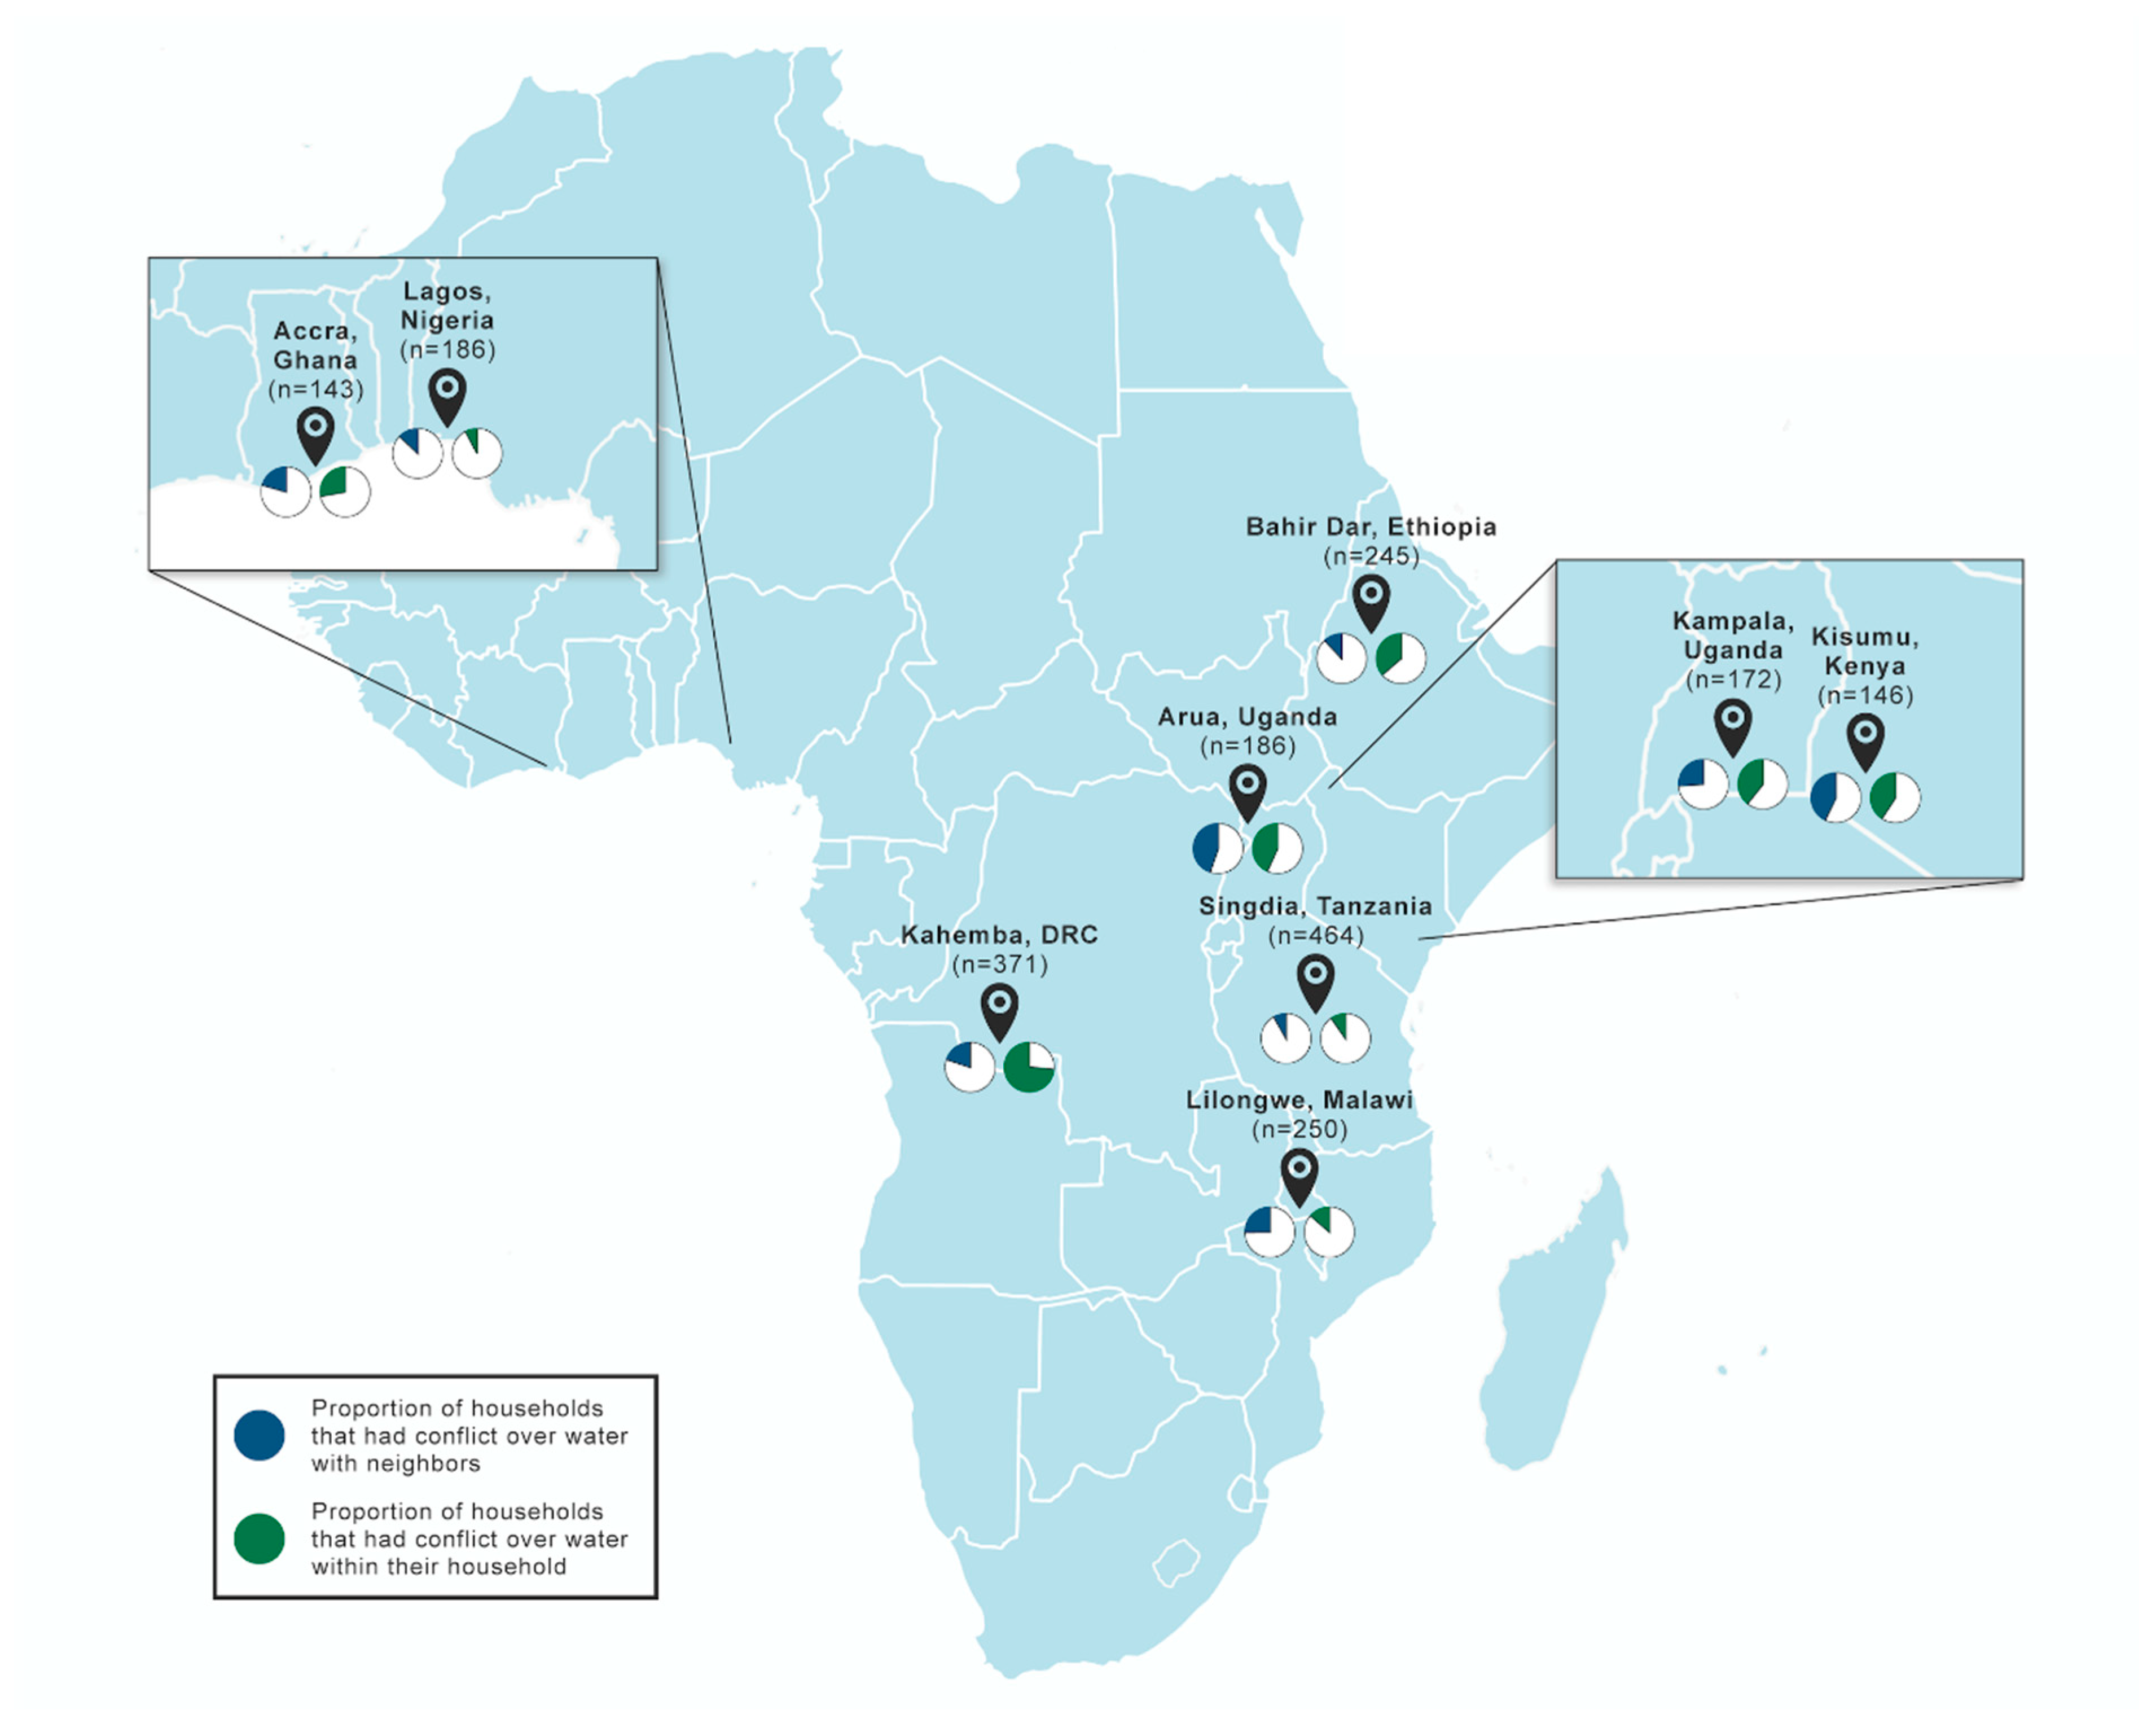
Among all study sites, Arua, Uganda had the highest (44.7%), and Singida, Tanzania had the lowest (8.2%) proportion of households experiencing conflict with neighbors over water (data not shown in tabular form; Figure 1). Kahemba, Democratic Republic of Congo (DRC) had the highest (73.5%) and Lagos, Nigeria, the lowest (7.7%) proportion of households experiencing conflict within the household over water. Kampala, Uganda had the highest level of regional conflict (n = 5266; mostly violent armed conflict or battles), and Kahemba, DRC had the lowest (n = 341), followed closely by Lilongwe, Malawi (n = 347). Population density was highest in Lagos, Nigeria (n = 24,061.99) and lowest in Singida, Tanzania (n = 53.75).
We found that households with conflict with neighbors over water had more children (3.1 versus 2.8, p = 0.040), higher food insecurity scores (11.3 versus 7.4, p < 0.001), and a smaller proportion experiencing a dry season during the survey (33% versus 49%, p < 0.001) (Table 2). These households also had a lower self-reported relative SEP (4.1 versus 5.1, p < 0.001), but no difference was detected for the site-specific z-scores of relative SEP. Likewise, these households had lower monthly cash income ($75.90 versus $157.50, p < 0.001), but no difference was detected for the site-specific z-scores of monthly cash income. Respondents in rural settings reported lower levels of conflict compared to those residing in urban areas, and in both settings, conflict with neighbors was lower than conflict within the home. For every domain of water insecurity, conditions were worse in households experiencing conflict with neighbors over water in the past four weeks.
In comparison, households that experienced conflict within the household over water also had more children, higher food insecurity scores, lower relative SEP, lower cash income, and higher water insecurity scores for every domain (Table 3). There were, however, some notable differences. Households experiencing internal conflict over water had older respondents, lower z-scores of relative SEP, larger proportions experiencing a dry season during the survey, lived in urban areas, and had a female head of household. Strikingly, the average walking time to collect water for households with internal conflict was double that of households without internal conflict (66 min vs. 30 min, p < 0.001)
None of the demographic characteristics were independently associated with the frequency of conflict with neighbors over water (Table 4, Model A). However, number of children, relative SEP, and monthly cash income z-scores were all associated with conflict over water within the household (Table 4, Model B).
We found that the dry season, food insecurity, and water quality and reliability were each independently associated with conflict with neighbors (Table 5, Model C). For households experiencing a dry season during the survey, we expect a 0.96 decrease in the log odds of being in a higher level of conflict with neighbors. In contrast, drinking unsafe water, interruptions due to water, and food insecurity were associated with a higher level of conflict with neighbors. When assessing the level of conflict within the household (Table 5, Model D), we detected positive associations with the number of children, food insecurity, and each domain of water insecurity, except cost (p = 0.054). However, the magnitudes of association were small for food insecurity and accessibility. The most pronounced association of these domains was reliability (β = 0.64, p < 0.001). We also detected a negative association with relative SEP.
Regional conflict was positively associated with conflict with neighbors, but the magnitude of the association was small (Table 6). In sensitivity analyses (see Supplementary Materials Tables S1–S9), buffer size did not appear to be important, as regional conflict within 100 km and 1000 km yielded similar results to 500 km. When examining associations by types of conflict, many results were similar to those for all types combined, with a few exceptions. Conflict within the home was associated with remote violence and protests and with population density in those models (Models S9 and S13).
In our rural/urban sensitivity analyses, we found that in urban areas, the number of children, dry season, food insecurity, reliability, population density, and broader conflict were all associated with conflict with neighbors (Table 7, Model G). Results are similar to our overall findings (Table 6, Model E), with the addition of population density and number of children and the attenuation of the quality–conflict association. We also found that conflict within the home was associated with number of children, relative SEP, income, quality, reliability, accessibility, and cost (Table 7, Model H). In comparison to our overall results (Table 6, Model F), we saw the addition of income and cost as predictors and the attenuation of the associations for food insecurity and quantity. In rural areas, we found that conflict was associated with water insecurity measures only (quantity, quality, and reliability for conflict with neighbors and quantity, quality, and accessibility for conflict within the household) (Table 8, Models I and J).

4. Discussion

There is a robust body of literature examining the relationship between water (in) security, climate trends, and conflict broadly defined [19,20,61,62]. However, far less is known about water insecurity and interpersonal conflict over water. Our study is one of the first to examine the relationship between demographics, water insecurity, and regional conflict using household-level data. The analysis moves beyond a consideration of water availability to empirically consider other domains of water insecurity that may be related to interpersonal conflict (quality, reliability/sustainability, accessibility, and cost). Our results showcase the nuances of household and community vulnerability to water insecurity and provide insights into factors that are associated with conflict related to water.
Overall, our results indicate that households that experienced internal conflict and those that experienced conflict with neighbors differed from households that did not experience these types of conflict. In support of our first hypothesis, we found that conflict over water within the home was associated with household size, relative SEP, and income but not age or female-headed households. Specifically, households with more children were more likely to experience conflict within the household, suggesting that conflict is more likely when there are more individuals present. These results are consistent with prior work which found below poverty level income [63] and the presence of children in the household [64,65,66] increased the risk of interpersonal violence. They are also consistent with studies of water collection in sub-Saharan Africa which found that women and children spend a disproportionate amount of time fetching water [67,68] and that the amount of time spent fetching water is associated with a higher risk of spousal abuse for women within households [51]. But we note that income may be correlated with the availability and accessibility of different forms of water infrastructure. Residential areas with a high proportion of low-income households are more likely to have poorer water infrastructure than residential areas with high-income households, so it is important to acknowledge that the relationship between income and water insecurity may be associated with factors beyond the household context.
Here, it is important to note some differences in results with regard to the specification of income. We found higher levels of within-household conflict were associated with higher income and lower relative SEP. These contradicting results may be explained by issues associated with self-reported income in survey work [69,70,71,72]. Studies note, for example, that high-income respondents report lower-than-actual earnings while low-income respondents report higher-than-actual earnings [70,71,73]. But in the absence of publicly available income tax or pension data, survey data are the only means of collecting income information, albeit imperfect [72]. To attenuate reporting problems associated with income, we included other measures of socioeconomic status (e.g., relative socioeconomic position). Interestingly, none of the demographic characteristics were associated with conflict with neighbors. Although our findings do not indicate causal effects, the significant differences between households that experienced within and between household conflict and those who did not support our predictions that demographic characteristics are associated with interpersonal conflict.
In support of our second hypothesis, we found that interpersonal conflict both within and outside the home was associated with at least one water insecurity domain. This is consistent with the argument that strain and stress related to water insecurity could result in household-level conflict. The most common domain of water insecurity—lack of accessibility—was evidenced most acutely in households that experienced within-household conflict. Compared to households that did not report conflict within the home, these households traveled, on average, twice the distance to a water source. This finding echoes other research showing that greater distance from a water source is associated with poorer health outcomes [74] and increased domestic violence in the home [75]. In examining demographic and water insecurity variables in tandem, we found that higher food insecurity, water quality and quantity issues, reliability issues, and access were all positively associated with higher levels of conflict within the household. Interestingly, cost was not associated with conflict. These findings suggest that when members of the household struggle to access this key resource, internal strife may be more likely. Most importantly, for each domain of water insecurity except cost, conditions were worse in households experiencing conflict within the household. This suggests that water-insecure situations may lead to micro-level aggressions within the household. Again, our findings are cross-sectional;future longitudinal studies may provide causal insights.
We also found that higher food insecurity, water quality issues, and reliability issues were associated with higher frequency of conflict with neighbors when the survey was conducted outside of the dry season. Since water quality and reliability were both associated with higher conflict with neighbors, this suggests that improving infrastructure for water provision or treatment may help to reduce conflict and strife at the community level. Since this is one of the first studies to consider water quality and conflict, additional comparative research and longitudinal studies are needed.
Our finding that there was less conflict with neighbors during the dry season provides evidence in favor of prior work indicating a link between dry conditions and less conflict [58]. One explanation for this association is that there may be less demand for water in agricultural households during the dry season because water is used primarily for consumption; water is also needed for planting, growing, and harvesting during the wet season. Another key finding related to seasonal changes in rainfall is that water unreliability was associated with increased conflict between households. In many countries of sub-Saharan Africa, water security during the ‘wet’ or rainy season(s) can be less predictable/more variable than the dry season(s), in part due to climate change and increasing rainfall variability. This means that water scarcity is more consistent during the dry season, and water is less reliable during the wet/rainy season, particularly in the context of climate change.
Finally, we hypothesized that interpersonal conflict over water both within the home and between neighbors would be more likely in sites with higher levels of regional conflict (both armed and unarmed) or higher population densities. When looking at the possibility that micro-level interpersonal conflicts may relate to larger scale conflict, we found that regional conflict was positively associated with conflict between neighbors. Determining the specific causal link is not possible with our cross-sectional data; it is plausible that conflict with neighbors leads to more serious conflicts and vice versa. We did find that this regional form of conflict was important at multiple scales (100 km, 500 km, and 1000 km) and for different types of conflict (riots, violent armed conflict). In contrast, protests and remote violence were associated with conflict within the home. These findings are consistent with prior work that suggests that conflict types vary within and between states [9]. This implies that steps to reduce disagreements and conflict at the community level could lead to a reduction in more serious, national-level types of conflict (e.g., riots).
In our sensitivity analyses, we observed that in urban areas, demographic, water insecurity, and contextual variables were all associated with conflict. In contrast, in rural areas, only water insecurity measures were associated with conflict. This suggests that strains on households may be heightened in urban environments, which are comparatively more costly than rural environments. The opportunity cost of time in fetching water may also be a stressor for households, which raises the frequency of conflict. In urban areas, formal and informal work opportunities are likely to be more available than rural areas, so time spent fetching water is more costly than in rural areas.

4.1. Strengths and Limitations

In this study, we leveraged fine-grained household survey data in a large sample across multiple countries to understand correlates of interpersonal conflict, including demographics, household water insecurity domains, larger scale conflict, and population density. To achieve this, we combined the strength of statistical methods used in prior cross-country analyses with the detail of high-resolution household data to provide finer-grained information about this relationship. In doing so, we made several contributions to the literature. First, this study is one of the first to examine conflict over water using fine-scale household data across multiple countries. Second, we move beyond water availability to consider other domains of water insecurity that may be related to conflict, including reliability, quality, and cost, which have not been considered in other studies. Third, our results point to important household characteristics as contextual factors in the link between water insecurity and interpersonal conflict.
Still, this study has limitations that should be noted. Although we controlled for households surveyed during the dry season, we did not include climate or rainfall data in our analyses. Second, these results were based on cross-sectional survey data. Given the limited sample size of these data, we are only able to comment on correlations and are unable to establish a clear causal link between water insecurity and interpersonal conflict. Other limitations include (i) our use of the same buffer sizes (100 km, 500 km, 1000 km) regardless of site urban/rural status; (ii) potential recall bias over the past four-week period by participants; and (iii) the lack of information about the exact nature of the conflict.

4.2. Future Research and Policy Implications

This paper is one of the first to examine the relationship between water and conflict, considering multiple dimensions of water insecurity. Our novel line of inquiry ushers in new avenues of additional investigation. Importantly, future work could further define within household conflict to distinguish between sibling conflict, intimate partner violence, and other forms of conflict. Likewise, conflict between neighbors could be expanded beyond frequency to incorporate aspects of the severity of conflict. Additional work could employ direct measures of rainfall to assess the findings of this paper further and obtain more fine-grained results related to variations in the wet and dry season across sub-Saharan Africa. Here, deviations from the long-term mean are recommended to assess whether interpersonal conflict is more likely during the wet season, dry season, or is related to deviations from average as prior studies have concluded [48,49]. Future work could employ other study designs, such as field experiments, to try to establish a causal link between specific domains of water insecurity and interpersonal conflict in order to contribute to conflict prevention efforts. An examination of differences in the correlates of interpersonal conflict by livelihood/occupation or primary water source type could also provide useful insights. This would provide information about the people exposed to conflict and the types of water sources (ground or surface) that are associated with conflict. In addition, future work could examine legacies in water governance or social conflict as a context for water insecurity and conflict today. This line of inquiry would provide information about the institutional and historical underpinnings of interpersonal conflict.
Community and/or policy initiatives designed to mitigate water insecurity for vulnerable households could also reduce interpersonal conflict within and between households. In doing so, these initiatives should incorporate elements of water availability, quality, accessibility, and reliability both as technical but also as political and economic issues. Addressing these local-level water issues may also involve a consideration of the link between community-level events as well as local cooperation, leadership, and governance quality since local decision-making and cooperation will continue to be important aspects of the resolution of conflict over water.

5. Conclusions

As climate, political, and economic conditions evolve across the world, so too will the distribution of natural resources and potential conflict. Water is vital to life, and water security is becoming increasingly variable, particularly in sub-Saharan Africa. There remains a paucity of research about relationships between demographics, water insecurity, and interpersonal conflict. This study found that some groups and households experiencing water insecurity were more prone to conflicts over water within the household and between neighbors, providing evidence that increasing water problems due to urbanization and climate change may yield more conflicts at this scale. Our results also indicate a nuanced picture of the relationship between interpersonal conflict over water and larger scale, regional conflict. Without adaption and increased resilience at the local level, the impacts of climate change and dynamic economic and political conditions, including water and food insecurity, may make some households more vulnerable to conflict than others.

Supplementary Materials

The following are available online at https://www.mdpi.com/article/10.3390/w13091150/s1, Table S1: Correlation matrix, Table S2: Regression modeling results for associations with conflict within the home (Model S1) and with neighbors (Model S2)—regional conflict within 100 km, Table S3: Regression modeling results for associations with conflict within the home (Model S3) and with neighbors (Model S4)—regional conflict within 1000 km; Table S4: Regression modeling results for associations with conflict within the home (Model S5) and with neighbors (Model S6)—battles, Table S5: Regression modeling results for associations with conflict within the home (Model S7) and with neighbors (Model S8)—riots, Table S6: Regression modeling results for associations with conflict within the home (Model S9) and with neighbors (Model S10)—protests, Table S7: Regression modeling results for associations with conflict within the home (Model S11) and with neighbors (Model S12)—strategic development, Table S8: Regression modeling results for associations with conflict within the home (Model S13) and with neighbors (Model S14)—remote violence, Table S9: Regression modeling results for associations with conflict within the home (Model S15) and with neighbors (Model S16)—violent armed conflict, Table S10: Descriptive statistics for the conflict variables in the above models.

Author Contributions

A.L.P. conceived of the current study. A.L.P., E.A.M., A.R., A.Z., R.M., E.L.B., A.C.S., and T.E. contributed to the analytical strategy, and conceptual development. E.L.B. extracted spatial data for analyses. A.L.P. conducted the statistical analyses. A.L.P., E.A.M., A.R., A.Z., R.M., E.L.B., A.C.S., and T.E. drafted the manuscript. All authors revised the manuscript. J.D.M. assisted with figure creation. All authors have read and agreed to the published version of the manuscript.

Funding

This research received funding from the National Socio-Environmental Synthesis Center (SESYNC) under funding received from the National Science Foundation DBI-1639145. The Household Water Insecurity Experiences Research Coordination Network (HWISE RCN) was funded by NSF (BCS 1759972). Additional funding was from the Competitive Research Grants to Develop Innovative Methods and Metrics for Agriculture and Nutrition Actions (IMMANA Grants). IMMANA is funded with UK Aid from the UK government. This project was also supported by the Buffett Institute for Global Studies and the Center for Water Research at Northwestern University; Arizona State University’s Center for Global Health at the School of Human Evolution and Social Change and Decision Center for a Desert City (National Science Foundation SES-1462086); the Office of the Vice Provost for Research of the University of Miami. Sera Young was supported by the National Institutes of Health (NIMH R21 MH108444; NIMH K01 MH098902).

Institutional Review Board Statement

At all sites, informed consent was obtained prior to data collection by a trained field member with Internal Review Board oversight (from a variety of institutions) and administered in an appropriate local language (for details, see [57]).

Informed Consent Statement

Informed consent was obtained from all subjects involved in the study.

Data Availability Statement

Data presented in this study are available on request from the corresponding author. Data are not publicly available due to ownership within the HWISE Consortium.

Acknowledgments

We wish to acknowledge study participants, without whom this research would not be possible.

HWISE Research Coordination Network

Shalean M. Collins, Northwestern University; Mobolanle Balogun, University of Lagos; Ellis Adams, University of Notre Dame; Justin Stoler, University of Miami; Desire Tshala-Katumbay, Oregon Health & Science University; Michael J. Boivin, Michigan State University; Marianne V. Santoso, Northwestern University; Sera L. Young, Northwestern University; Patrick Mbullo Owuor, Northwestern University; Kenneth Maes, Oregon State University; Yihenew Tesfaye, Oregon State University; Alex Trowell, University of Amsterdam; Matthew C. Freeman, Emory University; Raymond Tutu, Delaware State University; Gershim Asiki, African Population and Health Research Center.

Conflicts of Interest

The authors declare no conflict of interest.

References

  1. U.N. Water Analytical Brief on Water Security and Global Water Agenda; United Nations: Geneva, Switzerland, 2013. [Google Scholar]
  2. Mekonnen, M.M.; Hoekstra, A.Y. Four billion people facing severe water scarcity. Sci. Adv. 2016, 2, e1500323. [Google Scholar] [CrossRef] [Green Version]
  3. Mehta, L.; Movik, S. Liquid dynamics: Challenges for sustainability in the water domain. Wiley Interdiscip. Rev. Water 2014, 1, 369–384. [Google Scholar] [CrossRef]
  4. Rockström, J. The unfolding water drama in the anthropocene: Towards a resilience-based perspective on water for global sustainability. Ecohydrology 2014, 7, 1249–1261. [Google Scholar] [CrossRef]
  5. IPCC. Global Warming of 1.5 °C; An IPCC Special Report on the Impacts of Global Warming of 1.5 °C above Pre-Industrial Levels and Related Global Greenhouse Gas Emission Pathways, in the Context of Strengthening the Global Response to the Threat of Climate Change, Sustainable Development; Intergovernmental Panel on Climate Change (IPCC): Geneva, Switzerland, 2018. [Google Scholar]
  6. Delpla, I. Impacts of climate change on surface water quality in relation to drinking water production. Environ. Int. 2009, 35, 1225–1233. [Google Scholar] [CrossRef]
  7. Cooley, H. Global Water Governance in the 21st Century; Pacific Institute: Oakland, CA, USA, 2013. [Google Scholar]
  8. Kabat, P.; Pahl-Wostl, C. Adaptive and Integrated Water Management: Coping with Complexity and Uncertainty; Pahl-Wostl, C., Kabat, P., Möltgen, J., Eds.; Springer: Berlin, Germany, 2010. [Google Scholar]
  9. Carius, A.; Dabelko, G.D.; Wolf, A.T. Water, conflict, and cooperation. In Environmental Change and Security Project Report; ECSP Report Issue 10; Woodrow Wilson Center: Washington, DC, USA, 2004; pp. 60–66. Available online: https://www.wilsoncenter.org/sites/default/files/media/documents/publication/ecspr10_unf-caribelko.pdf (accessed on 20 April 2021).
  10. Burke, M.; Hsiang, S.M.; Miguel, E. Climate and conflict. Annu. Rev. Econ. 2015, 7, 577–617. [Google Scholar] [CrossRef]
  11. da Silva, L.P.B.; Hussein, H. Production of scale in regional hydropolitics: An analysis of La Plata River basin and the Guarani aquifer system in South America. Geoforum 2019, 99, 42–53. [Google Scholar] [CrossRef]
  12. Garrick, D. Rural water for thirsty cities: A systematic review of water reallocation from rural to urban regions. Environ. Res. Lett. 2019, 14, 043003. [Google Scholar] [CrossRef]
  13. Zeitoun, M. analysis for water conflict transformation. Water Int. 2020, 45, 365–384. [Google Scholar] [CrossRef]
  14. Warner, J. Transboundary ‘Hydro-hegemony’: 10 Years Later. Wiley Interdiscip. Rev. Water 2017, 4, 1242. [Google Scholar] [CrossRef] [Green Version]
  15. Hussein, H.; Menga, F.; Greco, F. Monitoring transboundary water cooperation in SDG 6.5.2: How a critical hydropolitics approach can spot inequitable outcomes. Sustainability 2018, 10, 3640. [Google Scholar] [CrossRef] [Green Version]
  16. Warner, J. The Politics of Diversion–Bridging Troubled Water in the Middle East. Master’s Thesis, University of Amsterdam, Amsterdam, The Netherlands, 1992. [Google Scholar]
  17. Williams, P. Nile Cooperation through hydro-realpolitik? (Review of Taffesse 2001 and Waterbury 2001). Third World Q. 2002, 6, 1189–1196. [Google Scholar] [CrossRef] [Green Version]
  18. Zeitoun, M.; Warner, J. Hydro-Hegemony–a framework for analysis of trans-boundary water conflicts. Water Policy 2006, 8, 435–460. [Google Scholar] [CrossRef] [Green Version]
  19. O’Loughlin, J. Climate variability and conflict risk in East Africa, 1990–2009. Proc. Natl. Acad. Sci. USA 2012, 109, 18344–18349. [Google Scholar] [CrossRef] [Green Version]
  20. Hendrix, C.S.; Salehyan, I. Climate change, rainfall, and social conflict in Africa. J. Peace Res. 2012, 49, 35–50. [Google Scholar] [CrossRef]
  21. Buhaug, H. Climate variability, food production shocks, and violent conflict in Sub-Saharan Africa. Environ. Res. Lett. 2015, 10, 125015. [Google Scholar] [CrossRef]
  22. Jones, B.T.; Mattiacci, E.; Braumoeller, B.F. Food scarcity and state vulnerability: Unpacking the link between climate variability and violent unrest. J. Peace Res. 2017, 54, 335–350. [Google Scholar] [CrossRef]
  23. Detges, A. Local conditions of drought-related violence in Sub-Saharan Africa: The role of road and water infrastructures. J. Peace Res. 2016, 53, 696–710. [Google Scholar] [CrossRef]
  24. van Weezel, S. On climate and conflict: Precipitation decline and communal conflict in Ethiopia and Kenya. J. Peace Res. 2019, 56, 514–528. [Google Scholar] [CrossRef]
  25. Mack, E.A.; Bunting, E.; Herndon, J.; Marcantonio, R.A.; Ross, A.; Zimmer, A. Conflict and its relationship to climate variability in Sub-Saharan Africa. Sci. Total Environ. 2021, 775, 145646. [Google Scholar] [CrossRef]
  26. Buhaug, H. Climate change and conflict: Taking stock. Peace Econ. Peace Sci. Public Policy 2016, 22, 331–338. [Google Scholar] [CrossRef] [Green Version]
  27. Witmer, F.D. Subnational violent conflict forecasts for Sub-Saharan Africa, 2015–2065, Using Climate-Sensitive Models. J. Peace Res. 2017, 54, 175–192. [Google Scholar] [CrossRef]
  28. Almer, C.; Laurent-Lucchetti, J.; Oechslin, M. Water scarcity and rioting: Disaggregated evidence from Sub-Saharan Africa. J. Environ. Econ. Manag. 2017, 86, 193–209. [Google Scholar] [CrossRef] [Green Version]
  29. Price, G.N.; Elu, J.U. Climate change and cross-state islamist terrorism in Nigeria. Peace Econ. Peace Sci. Public Policy 2017, 23. [Google Scholar] [CrossRef]
  30. Homer-Dixon, T.F. Environmental scarcities and violent conflict: Evidence from cases. Int. Secur. 1994, 19, 5–40. [Google Scholar] [CrossRef] [Green Version]
  31. Hsiang, S.M.; Burke, M.; Miguel, E. Quantifying the influence of climate on human conflict. Science 2013, 341, 1235367. [Google Scholar] [CrossRef] [PubMed] [Green Version]
  32. Hsiang, S.M.; Meng, K.C.; Cane, M.A. Civil conflicts are associated with the global climate. Nature 2011, 476, 438–441. [Google Scholar] [CrossRef] [PubMed]
  33. Salehyan, I.; Hendrix, C.S. Climate shocks and political violence. Glob. Environ. Chang. 2014, 28, 239–250. [Google Scholar] [CrossRef]
  34. Theisen, O.M. Climate clashes? Weather variability, land pressure, and organized violence in Kenya, 1989–2004. J. Peace Res. 2012, 49, 81–96. [Google Scholar] [CrossRef]
  35. Klomp, J.; Bulte, E. Climate change, weather shocks, and violent conflict: A critical look at the evidence. Agric. Econ. 2013, 44, 63–78. [Google Scholar] [CrossRef]
  36. Witsenburg, K.M.; Adano, W.R. Of rain and raids: Violent livestock raiding in Northern Kenya. Civ. Wars 2009, 11, 514–538. [Google Scholar] [CrossRef]
  37. Papaioannou, K.J. Climate shocks and conflict: Evidence from colonial Nigeria. Polit. Geogr. 2016, 50, 33–47. [Google Scholar] [CrossRef] [Green Version]
  38. Harari, M.; Ferrara, E.L. Conflict, climate, and cells: A disaggregated analysis. Rev. Econ. Stat. 2018, 100, 594–608. [Google Scholar] [CrossRef]
  39. Raleigh, C.; Kniveton, D. Come rain or shine: An analysis of conflict and climate variability in East Africa. J. Peace Res. 2012, 49, 51–64. [Google Scholar] [CrossRef]
  40. Landis, S.T. Fording differences? Conditions mitigating water insecurity in the Niger River basin. Polit. Geogr. 2017, 56, 77–90. [Google Scholar] [CrossRef]
  41. Meth, P. Rethinking the ‘Domus’ in domestic violence: Homelessness, space and domestic violence in South Africa. Geoforum 2003, 34, 317–327. [Google Scholar] [CrossRef]
  42. Vetten, L. Adressing domestic violence in South Africa: Reflections on strategy and practice. In Proceedings of the Expert Group Meeting on Violence against Women: Good Practices in Combating and Eliminating Violence against Women, Vienna, Austria, 17–20 May 2005. [Google Scholar]
  43. Derman, B.; Odgaard, R.; Sjaastad, E. Conflicts over Land & Water in Africa; Michigan State University Press: East Lansing, MI, USA, 2007. [Google Scholar]
  44. Meinzen-Dick, R.S.; Nkonya, L.K. Understanding Legal Pluralism in Water and Land Rights: Lessons from Africa and Asia; CABI: London, UK, 2007. [Google Scholar]
  45. Collins, S.M. “I Know How Stressful It Is to Lack Water!” exploring the lived experiences of household water insecurity among pregnant and postpartum women in Western Kenya. Glob. Public Health 2019, 14, 649–662. [Google Scholar] [CrossRef]
  46. Stevenson, E.G. Water insecurity in 3 dimensions: An anthropological perspective on water and women’s psychosocial distress in Ethiopia. Soc. Sci. Med. 2012, 75, 392–400. [Google Scholar] [CrossRef] [Green Version]
  47. Abel, G.J. Climate, conflict and forced migration. Glob. Environ. Chang. 2019, 54, 239–249. [Google Scholar] [CrossRef]
  48. Miguel, E. Poverty and witch killing. Rev. Econ. Stud. 2005, 72, 1153–1172. [Google Scholar] [CrossRef] [Green Version]
  49. Sekhri, S.; Storeygard, A. Dowry Deaths: Consumption Smoothing in Response to Climate Variability in India; Virginia Economics Online Papers 407; University of Virginia, Department of Economics: 2013. Available online: https://econpapers.repec.org/paper/virvirpap/407.htm (accessed on 20 April 2021).
  50. Sultana, F. Suffering for water, suffering from water: Emotional geographies of resource access, control and conflict. Geoforum 2011, 42, 163–172. [Google Scholar] [CrossRef]
  51. Pommells, M. Gender violence as a water, sanitation, and hygiene risk: Uncovering violence against women and girls as it pertains to poor WaSH access. Violence Women 2018, 24, 1851–1862. [Google Scholar] [CrossRef]
  52. Pearson, A.L.; Mayer, J.D.; Bradley, D.J. Coping with household water scarcity in the Savannah today: Implications for health and climate change into the future. Earth Interact. 2015, 19, 1–14. [Google Scholar] [CrossRef]
  53. Young, S. Development and validation protocol for an instrument to measure household water insecurity across cultures and ecologies: The Household Water InSecurity Experiences (HWISE) scale. BMJ Open 2019, 9, 023558. [Google Scholar] [CrossRef] [PubMed]
  54. Young, S. The Household Water Insecurity Experiences (HWISE) Scale Study Manual; 2018. Available online: https://sites.northwestern.edu/hwise/study-forms-manual/ (accessed on 20 April 2021).
  55. Stoler, J. Cash water expenditures are associated with household water insecurity, food insecurity, and perceived stress in study sites across 20 low- and middle-income countries. Sci. Total Environ. 2020, 716, 135881. [Google Scholar] [CrossRef] [PubMed]
  56. Adler, N.; Stewart, J. The MacArthur Scale of Subjective Social Status. MacArthur Research Network on SES & Health. Available online: https://macses.ucsf.edu/research/psychosocial/subjective.php (accessed on 20 April 2021).
  57. Coates, J.; Swindale, A.; Bilinsky, P. Household Food Insecurity Access Scale (HFIAS) for Measurement of Food Access: Indicator Guide; Food and Nutrition Technical Assistance (FANTA): 2007. Available online: https://www.fantaproject.org/monitoring-and-evaluation/household-food-insecurity-access-scale-hfias (accessed on 20 April 2021).
  58. Raleigh, C. Introducing ACLED: An armed conflict location and event dataset. J. Peace Res. 2010, 47, 651–660. [Google Scholar] [CrossRef]
  59. Linard, C. Population distribution, settlement patterns and accessibility across Africa in 2010. PLoS ONE 2012, 7, 31743. [Google Scholar] [CrossRef] [PubMed] [Green Version]
  60. Marcantonio, R.A.; Attari, S.Z.; Evans, T. Farmer perceptions of conflict related to water in Zambia. Sustainability 2018, 10, 313. [Google Scholar] [CrossRef] [Green Version]
  61. Muller, M.; Schreiner, B.; Smith, L.; van Koppen, B.; Sally, H.; Aliber, M.; Cousins, B. Water Security in South Africa; Development Bank of South Africa, Development Planning Division: Johannesburg, South Africa, 2009. [Google Scholar]
  62. Niasse, M. Climate-Induced Water Conflict Risks in West Africa: Recognizing and Coping with Increasing Climate Impacts on Shared Watercourses. Human Security and Climate Change; PRIO; CICERO; GECHS: Asker, Norway, 2005; pp. 21–23. [Google Scholar]
  63. Byrne, C.A. The socioeconomic impact of interpersonal violence on women. J. Consult. Clin. Psychol. 1999, 67, 362. [Google Scholar] [CrossRef]
  64. Dearwater, S.R. Prevalence of intimate partner abuse in women treated at community hospital emergency departments. JAMA 1998, 280, 433–438. [Google Scholar] [CrossRef] [Green Version]
  65. Vest, J.R. Multistate analysis of factors associated with intimate partner violence. Am. J. Prev. Med. 2002, 22, 156–164. [Google Scholar] [CrossRef]
  66. Romans, S. Who is most at risk for intimate partner violence? A Canadian population-based study. J. Interpers. Violence 2007, 22, 1495–1514. [Google Scholar] [CrossRef]
  67. Graham, J.P.; Hirai, M.; Kim, S.S. An analysis of water collection labor among women and children in 24 Sub-Saharan African countries. PLoS ONE 2016, 11, 015598. [Google Scholar] [CrossRef] [Green Version]
  68. Geere, J.A.; Cortobius, M. Who carries the weight of water? Fetching water in rural and urban areas and the implications for water security. Water Altern. 2017, 10, 513–540. [Google Scholar]
  69. Duncan, G.J.; Hill, D.H. An investigation of the extent and consequences of measurement error in labor-economic survey data. J. Labor Econ. 1985, 3, 508–532. [Google Scholar] [CrossRef]
  70. Bound, J.; Krueger, A.B. The extent of measurement error in longitudinal earnings data: Do two wrongs make a right? J. Labor Econ. 1991, 9, 1–24. [Google Scholar] [CrossRef]
  71. Bricker, J.; Engelhardt, G.V. Measurement error in earnings data in the health and retirement study. J. Econ. Soc. Meas. 2008, 33, 39–61. [Google Scholar] [CrossRef] [Green Version]
  72. Zinn, S.; Würbach, A. A statistical approach to address the problem of heaping in self-reported income data. J. Appl. Stat. 2016, 43, 682–703. [Google Scholar] [CrossRef]
  73. Antoni, M.; Bela, D.; Vicari, B. Validating earnings in the German national educational panel study: Determinants of measurement accuracy of survey questions on earnings. Methods Data Anal. J. Quant. Methods Surv. Methodol. MDA 2019, 13, 59–90. [Google Scholar]
  74. Bradley, D.J.; Bartram, J.K. Domestic water and sanitation as water security: Monitoring, concepts and strategy. Philos. Trans. Math. Phys. Eng. Sci. 2013, 371, 20120420. [Google Scholar] [CrossRef] [PubMed] [Green Version]
  75. Beland, L.-P.; Brent, D.A. Traffic and crime. J. Public Econ. 2018, 160, 96–116. [Google Scholar] [CrossRef]
Figure 1. Map of study sites and proportions of households reporting conflict over water within the household or with neighbors.
Water 13 01150 g001
Table 1. Water insecurity domains and survey questions.
Water Insecurity DomainQuestion
Quantity“In the last 4 weeks, how frequently did you or anyone in your household worry you would not have enough water for all of your household needs?”
Quality“In the last 4 weeks, how frequently have you or anyone in your household actually drunk water that you thought was unsafe?”
Reliability“In the last 4 weeks, how frequently have you or anyone in your household’s day been interrupted by your water situation, including getting or distributing water within the household?”
Accessibility“How long (in minutes) does it take to go to the water source, get water, and come back (including wait time)?”
Cost“In the past 4 weeks, approximately how much money did you spend on getting water for your household?”
Table 2. Descriptive statistics for demographics and water insecurity domains by whether or not the household experienced conflict with neighbors in the past four weeks. p-values are for group difference tests.
No Conflict with Neighbors in the Past 4 WeeksAny Conflict with Neighbors in Past 4 WeeksTotalp-Value
Age, mean (sd) §35.9(12.3)37.6(13.6)36.3(12.6)0.080
Number children, mean (sd) §2.8(1.9)3.1(2.1)2.9(1.9)0.040
Relative socioeconomic position, mean (sd) ‡5.1(2.5)4.1(2.3)4.9(2.5)<0.001
Relative socioeconomic position z-scores by site, mean (sd) §0.0(1.0)0.0(1.0)0.0(1.0)0.251
Monthly income in USD, mean (sd) §157.5(363.5)75.9(139.6)140.3(330.8)<0.001
Monthly income z-scores by site, mean (sd) §0.0(1.0)0.0(1.0)0.0(1.0)0.740
Food insecurity score, mean (sd)ǂ7.4(6.9)11.3(6.4)8.2(7.0)<0.001
Dry season, % Φ48.533.345.3<0.001
Urban, % Φ38.321.756.9<0.001
Rural, % Φ24.619.343.1
Female hh, % Φ24.026.124.40.357
Water insecurity domainsQuantity: Worried about not having enough water, mean (sd) ‡1.0(1.2)1.6(1.2)1.2(1.2)<0.001
Quality: Drank water you thought was unsafe, mean (sd) ‡0.8(1.2)1.3(1.3)0.9(1.2)<0.001
Reliability: Day been interrupted due to water, mean (sd) ‡0.6(1.0)1.3(1.0)0.8(1.0)<0.001
Accessibility: Minutes return trip to collect water, mean (sd) ‡39.9(46.4)48.3(48.1)41.7(46.9)0.001
Cost: % hh income spent on water/month, mean (sd) §7.0(14.6)9.1(15.6)7.5(14.8)0.012
§ = t-test allowing for unequal variance between groups; ‡ = Wilcoxon rank sum test; Φ = Chi-squared test; Bolded values p ≤ 0.05.
Table 3. Descriptive statistics for demographics and water insecurity domains by whether or not the household experienced internal conflict in the past four weeks. p-values are for group difference tests.
No Conflict within Household in the Past 4 WeeksAny Conflict within Household in Past 4 WeeksTotalp-Value
Age, mean (sd) §35.612.037.513.236.212.50.001
Number children, mean (sd) §2.71.93.12.02.91.9<0.001
Relative socioeconomic position, mean (sd) ‡5.42.43.82.34.92.5<0.001
Relative socioeconomic position z-scores by site, mean (sd) §0.11.0−0.11.00.01.0<0.001
Monthly income in USD, mean (sd) §176.6390.774.4139.7143.5334.3<0.001
Monthly income z-scores by site, mean (sd) §0.01.00.01.00.01.00.491
Food insecurity score, mean (sd) ‡6.26.112.07.18.17.0<0.001
Dry season, % Φ42.154.446.1<0.001
Urban, % Φ52.067.256.9<0.001
Female hh, % Φ21.131.824.6<0.001
Water security domainsQuantity: Worried about not having enough water, mean (sd) ‡0.81.11.81.31.11.2<0.001
Quality: Drank water you thought was unsafe, mean (sd) ‡0.61.11.51.30.91.2<0.001
Reliability: Day been interrupted due to water, mean (sd) ‡0.50.81.41.10.81.0<0.001
Accessibility: Minutes return trip to collect water, mean (sd) ‡29.936.666.155.741.646.8<0.001
Cost: % hh income spent on water/month, mean (sd) §6.914.08.616.47.514.80.015
§ = t-test allowing for unequal variance between groups; ‡ = Wilcoxon rank sum test; Φ = Chi-squared test; Bolded values p ≤ 0.05.
Table 4. Ordinal logistic regression modeling results for associations between demographic characteristics and conflict with neighbors (Model A) or within the household (Model B).
Model A: Frequency of Conflict with NeighborsModel B: Frequency of Conflict within the Household
βsep-Value95% Conf.Intervalβsep-Value95% Conf.Interval
Female head of household−0.090.140.499−0.360.170.140.120.209−0.080.37
Number kids0.050.030.091−0.010.110.080.030.0040.030.13
Relative socioeconomic position−0.050.030.094−0.110.01−0.180.03<0.001−0.24−0.12
Monthly income z-score (USD)−0.010.060.932−0.120.110.110.050.0290.010.21
Age0.000.000.587−0.010.010.000.000.945−0.010.01
Dry season−0.600.580.305−1.740.540.710.680.298−0.632.05
Bolded values p ≤ 0.05.
Table 5. Ordinal logistic regression modeling results for associations between demographic characteristics, water insecurity domains, and conflict with neighbors (Model C) or within the household (Model D).
Model C: Frequency of Conflict with NeighborsModel D: Frequency of Conflict within the Household
βsep-Value95% Conf.Intervalβsep-Value95% Conf.Interval
Female head of household−0.130.140.341−0.410.140.130.120.265−0.100.37
Number kids0.040.030.216−0.020.100.070.030.0080.020.13
Relative socioeconomic position0.030.030.448−0.040.09−0.110.03<0.001−0.17−0.05
Monthly income z-score (USD)−0.040.060.579−0.160.090.090.050.080−0.010.20
Age0.000.000.860−0.010.010.000.000.401−0.010.00
Dry season−0.960.430.027−1.80−0.110.400.470.395−0.521.33
Food insecurity0.050.01<0.0010.020.070.030.010.0060.010.05
Quantity: Worried about not having enough water0.110.060.0520.000.220.140.050.0040.050.24
Quality: Drank water you thought was unsafe0.220.06<0.0010.110.330.180.05<0.0010.090.27
Reliability: Day been interrupted due to water0.550.07<0.0010.420.680.640.06<0.0010.520.76
Accessibility: Minutes return trip to collect water0.000.000.0930.000.010.010.00<0.0010.000.01
Cost: % hh income spent on water/month0.000.000.251−0.010.000.010.000.0540.000.01
Bolded values p ≤ 0.05.
Table 6. Ordinal logistic regression modeling results for associations between demographic characteristics, water insecurity domains, regional conflict, population density, and conflict with neighbors (Model E) or within the household (Model F).
Model E: Frequency of Conflict with NeighborsModel F: Frequency of Conflict within the Household
βsep-Value95% Conf.Intervalβsep-Value95% Conf.Interval
Female head of household−0.140.140.325−0.420.140.130.120.268−0.100.37
Number kids0.040.030.241−0.020.090.070.030.0100.020.12
Relative socioeconomic position0.030.030.384−0.040.09−0.110.03<0.001−0.17−0.05
Monthly income z-score (USD)−0.040.060.579−0.160.090.090.050.087−0.010.19
Age0.000.000.859−0.010.010.000.000.427−0.010.00
Dry season−0.840.360.021−1.55−0.130.320.400.421−0.461.11
Food insecurity0.050.01<0.0010.020.070.030.010.0090.010.05
Quantity: Worried about not having enough water0.110.060.0530.000.220.140.050.0040.050.24
Quality: Drank water you thought was unsafe0.210.06<0.0010.100.320.180.05<0.0010.080.27
Reliability: Day been interrupted due to water0.550.07<0.0010.410.680.640.06<0.0010.520.76
Accessibility: Minutes return trip to collect water0.000.000.1090.000.010.010.000.0010.000.01
Cost: % hh income spent on water/month0.000.000.332−0.010.000.010.000.0540.000.01
Mean population density of cluster0.000.000.7740.000.000.000.000.0590.000.00
Regional conflict 2016–2018 within 500 km of cluster0.000.000.0320.000.000.000.000.2500.000.00
Bolded values p ≤ 0.05.
Table 7. Ordinal logistic regression modeling results for associations between demographic characteristics, water insecurity domains, regional conflict, population density, and conflict with neighbors (Model G) or within the household (Model H) in urban areas only.
Model G: Frequency of Conflict with NeighborsModel H: Frequency of Conflict within the Household
βsep-Value95% Conf.Intervalβsep-Value95% Conf.Interval]
Female head of household−0.120.170.472−0.460.210.200.140.157−0.080.48
Number kids0.070.040.0590.000.150.080.030.0310.010.14
Relative socioeconomic position0.050.040.251−0.040.14−0.170.04<0.001−0.26−0.09
Monthly income z-score (USD)−0.030.080.723−0.180.120.140.070.0310.010.27
Age0.000.010.401−0.020.010.000.010.940−0.010.01
Dry season−0.970.21<0.001−1.38−0.560.700.460.127−0.201.60
Food insecurity0.060.01<0.0010.030.090.020.010.0940.000.05
Quantity: Worried about not having enough water−0.060.070.333−0.190.060.020.060.680−0.090.14
Quality: Drank water you thought was unsafe0.080.070.242−0.050.220.150.060.0090.040.27
Reliability: Day been interrupted due to water0.570.08<0.0010.420.730.740.07<0.0010.590.88
Accessibility: Minutes return trip to collect water0.000.000.536−0.010.000.010.000.0130.000.01
Cost: % hh income spent on water/month0.000.000.805−0.010.010.010.000.0170.000.02
Mean population density of cluster0.000.000.0160.000.000.000.000.0610.000.00
Regional conflict 2016–2018 within 500 km of cluster0.000.00<0.0010.000.000.000.000.5360.000.00
Bolded values p ≤ 0.05.
Table 8. Ordinal logistic regression modeling results for associations between demographic characteristics, water insecurity domains, regional conflict, population density, and conflict with neighbors (Model I) or within the household (Model J) in rural areas only.
Model I: Frequency of Conflict with NeighborsModel J: Frequency of Conflict within the Household
βsep-Value95% Conf.Intervalβsep-Value95% Conf.Interval
Female head of household−0.180.260.505−0.690.34−0.250.230.282−0.690.20
Number kids−0.040.050.386−0.140.050.050.050.257−0.040.14
Relative socioeconomic position0.020.050.677−0.080.13−0.040.050.379−0.130.05
Monthly income z-score (USD)0.060.130.661−0.190.300.060.100.577−0.140.26
Age0.000.010.628−0.010.02−0.010.010.161−0.020.00
Dry season0.010.830.995−1.631.64−0.840.730.252−2.280.60
Food insecurity0.030.020.143−0.010.070.030.020.140−0.010.07
Quantity: Worried about not having enough water0.540.11<0.0010.320.750.530.09<0.0010.350.71
Quality: Drank water you thought was unsafe0.300.090.0020.110.480.220.080.0050.060.37
Reliability: Day been interrupted due to water0.450.130.0010.180.710.230.120.0530.000.47
Accessibility: Minutes return trip to collect water0.000.000.3160.000.010.000.000.0480.000.01
Cost: % hh income spent on water/month−0.010.010.189−0.020.000.000.010.999−0.010.01
Mean population density of cluster0.000.000.1660.000.000.000.000.9900.000.00
Regional conflict 2016–2018 within 500 km of cluster0.000.000.2140.000.000.000.000.4970.000.00
Bolded values p ≤ 0.05.
Publisher’s Note: MDPI stays neutral with regard to jurisdictional claims in published maps and institutional affiliations.

