Evaluation of Climate Change Impact on Groundwater Recharge in Groundwater Regions in Taiwan


1
Graduate Institute of Applied Geology, National Central University, 300 Zhongda Road, Zhongli District, Taoyuan 32001, Taiwan
2
Department of Resources Engineering, National Cheng Kung University, Tainan 70101, Taiwan
3
Aptiskills, 92300 Levallois-Perret, France
4
Department of Hydraulic and Ocean Engineering, National Cheng Kung University, Tainan 70101, Taiwan
*
Author to whom correspondence should be addressed.
Water 2021, 13(9), 1153; https://doi.org/10.3390/w13091153
Submission received: 9 March 2021
/
Revised: 20 April 2021
/
Accepted: 20 April 2021
/
Published: 22 April 2021
(This article belongs to the Special Issue Climate Change Impacts on Hydrological Processes and Water Resources of Local Watersheds)
Abstract
:Climate change can directly or indirectly influence groundwater resources. The mechanisms of this influence are complex and not easily quantified. Understanding the effect of climate change on groundwater systems can help governments adopt suitable strategies for water resources. The baseflow concept can be used to relate climate conditions to groundwater systems for assessing the climate change impact on groundwater resources. This study applies the stable baseflow concept to the estimation of the groundwater recharge in ten groundwater regions in Taiwan, under historical and climate scenario conditions. The recharge rates at the main river gauge stations in the groundwater regions were assessed using historical data. Regression equations between rainfall and groundwater recharge quantities were developed for the ten groundwater regions. The assessment results can be used for recharge evaluation in Taiwan. The climate change estimation results show that climate change would increase groundwater recharge by 32.6% or decrease it by 28.9% on average under the climate scenarios, with respect to the baseline quantity in Taiwan. The impact of climate change on groundwater systems may be positive. This study proposes a method for assessing the impact of climate change on groundwater systems. The assessment results provide important information for strategy development in groundwater resources management.
1. Introduction
Taiwan has had a problem with water resources for several decades [1]. This problem has become much worse in recent years, due to climate change [2]. Insufficient water resources have resulted in an increase in groundwater consumption, which has induced land subsidence [3,4]. The effects of climate change on water resources have been extensively studied worldwide (e.g., [5,6,7,8,9,10]) including in Taiwan (e.g., [11,12,13,14,15,16]). However, fewer studies have been conducted on the impact of climate change on groundwater resources [7,17,18,19,20,21], especially in Taiwan [22]. According to a literature review [9], four methods are commonly used to study the impact of climate change on groundwater, namely the empirical approach, analytical modeling, the application of climate change factors to numerical flow models, and top-down linked modeling. It is difficult to accurately estimate the impact of climate change on groundwater systems, because it could be direct or indirect [9]. For example, an increase in air temperature increases evapotranspiration, which in turn decreases the groundwater recharge quantity, whereas an increase in rainfall directly increases the groundwater recharge quantity. Anthropogenic factors, such as an increase in groundwater use due to a lack of surface water supply, must also be considered. Therefore, even if all the mechanisms of climate change that influence a groundwater system are known, it is still difficult to accurately quantify the impact of climate change on the groundwater system. Uncertainty also results from the projections of future climate scenarios, which are commonly used in the assessment of climate change impact [23]. Therefore, a method for relating the conditions of climate change to a groundwater system should be developed and an uncertainty assessment should be conducted.
Baseflow is the sustained low flow in a river; it includes contributions from interflow and groundwater flow discharge [24]. Over a long period of time, the inflow equals the outflow in a groundwater system (i.e., the system is in a steady state), and thus the storage effect can be ignored [25]. Baseflow at a river gauge station is the main contribution to groundwater recharge in the catchment area above that river gauge station. Therefore, baseflow can be used to estimate the groundwater recharge quantity [26,27,28,29,30]. The baseflow concept can be related to climate conditions by using a simulated river discharge in a hydrological model with climate data. The baseflow separation method was thus adopted in this study to evaluate the groundwater recharge with, and without, climate change effects to estimate the impact of climate change. However, given the influence of the high topographic variations, large rainfall quantity and intensity, and humid climate conditions in Taiwan, the groundwater recharge quantity evaluated using baseflow recession will be overestimated [27]. A stable baseflow concept is thus adopted.
This study uses the method of stable baseflow analysis to connect climate and groundwater systems and assesses the impact of climate change on groundwater recharge in ten groundwater regions in Taiwan. The proposed method for estimating the groundwater recharge rate, recharge quantity, recharge–rainfall relationship, and the impact of climate change on a groundwater system can be used in studies that require groundwater recharge and climate change effect estimation.
2. Methodology
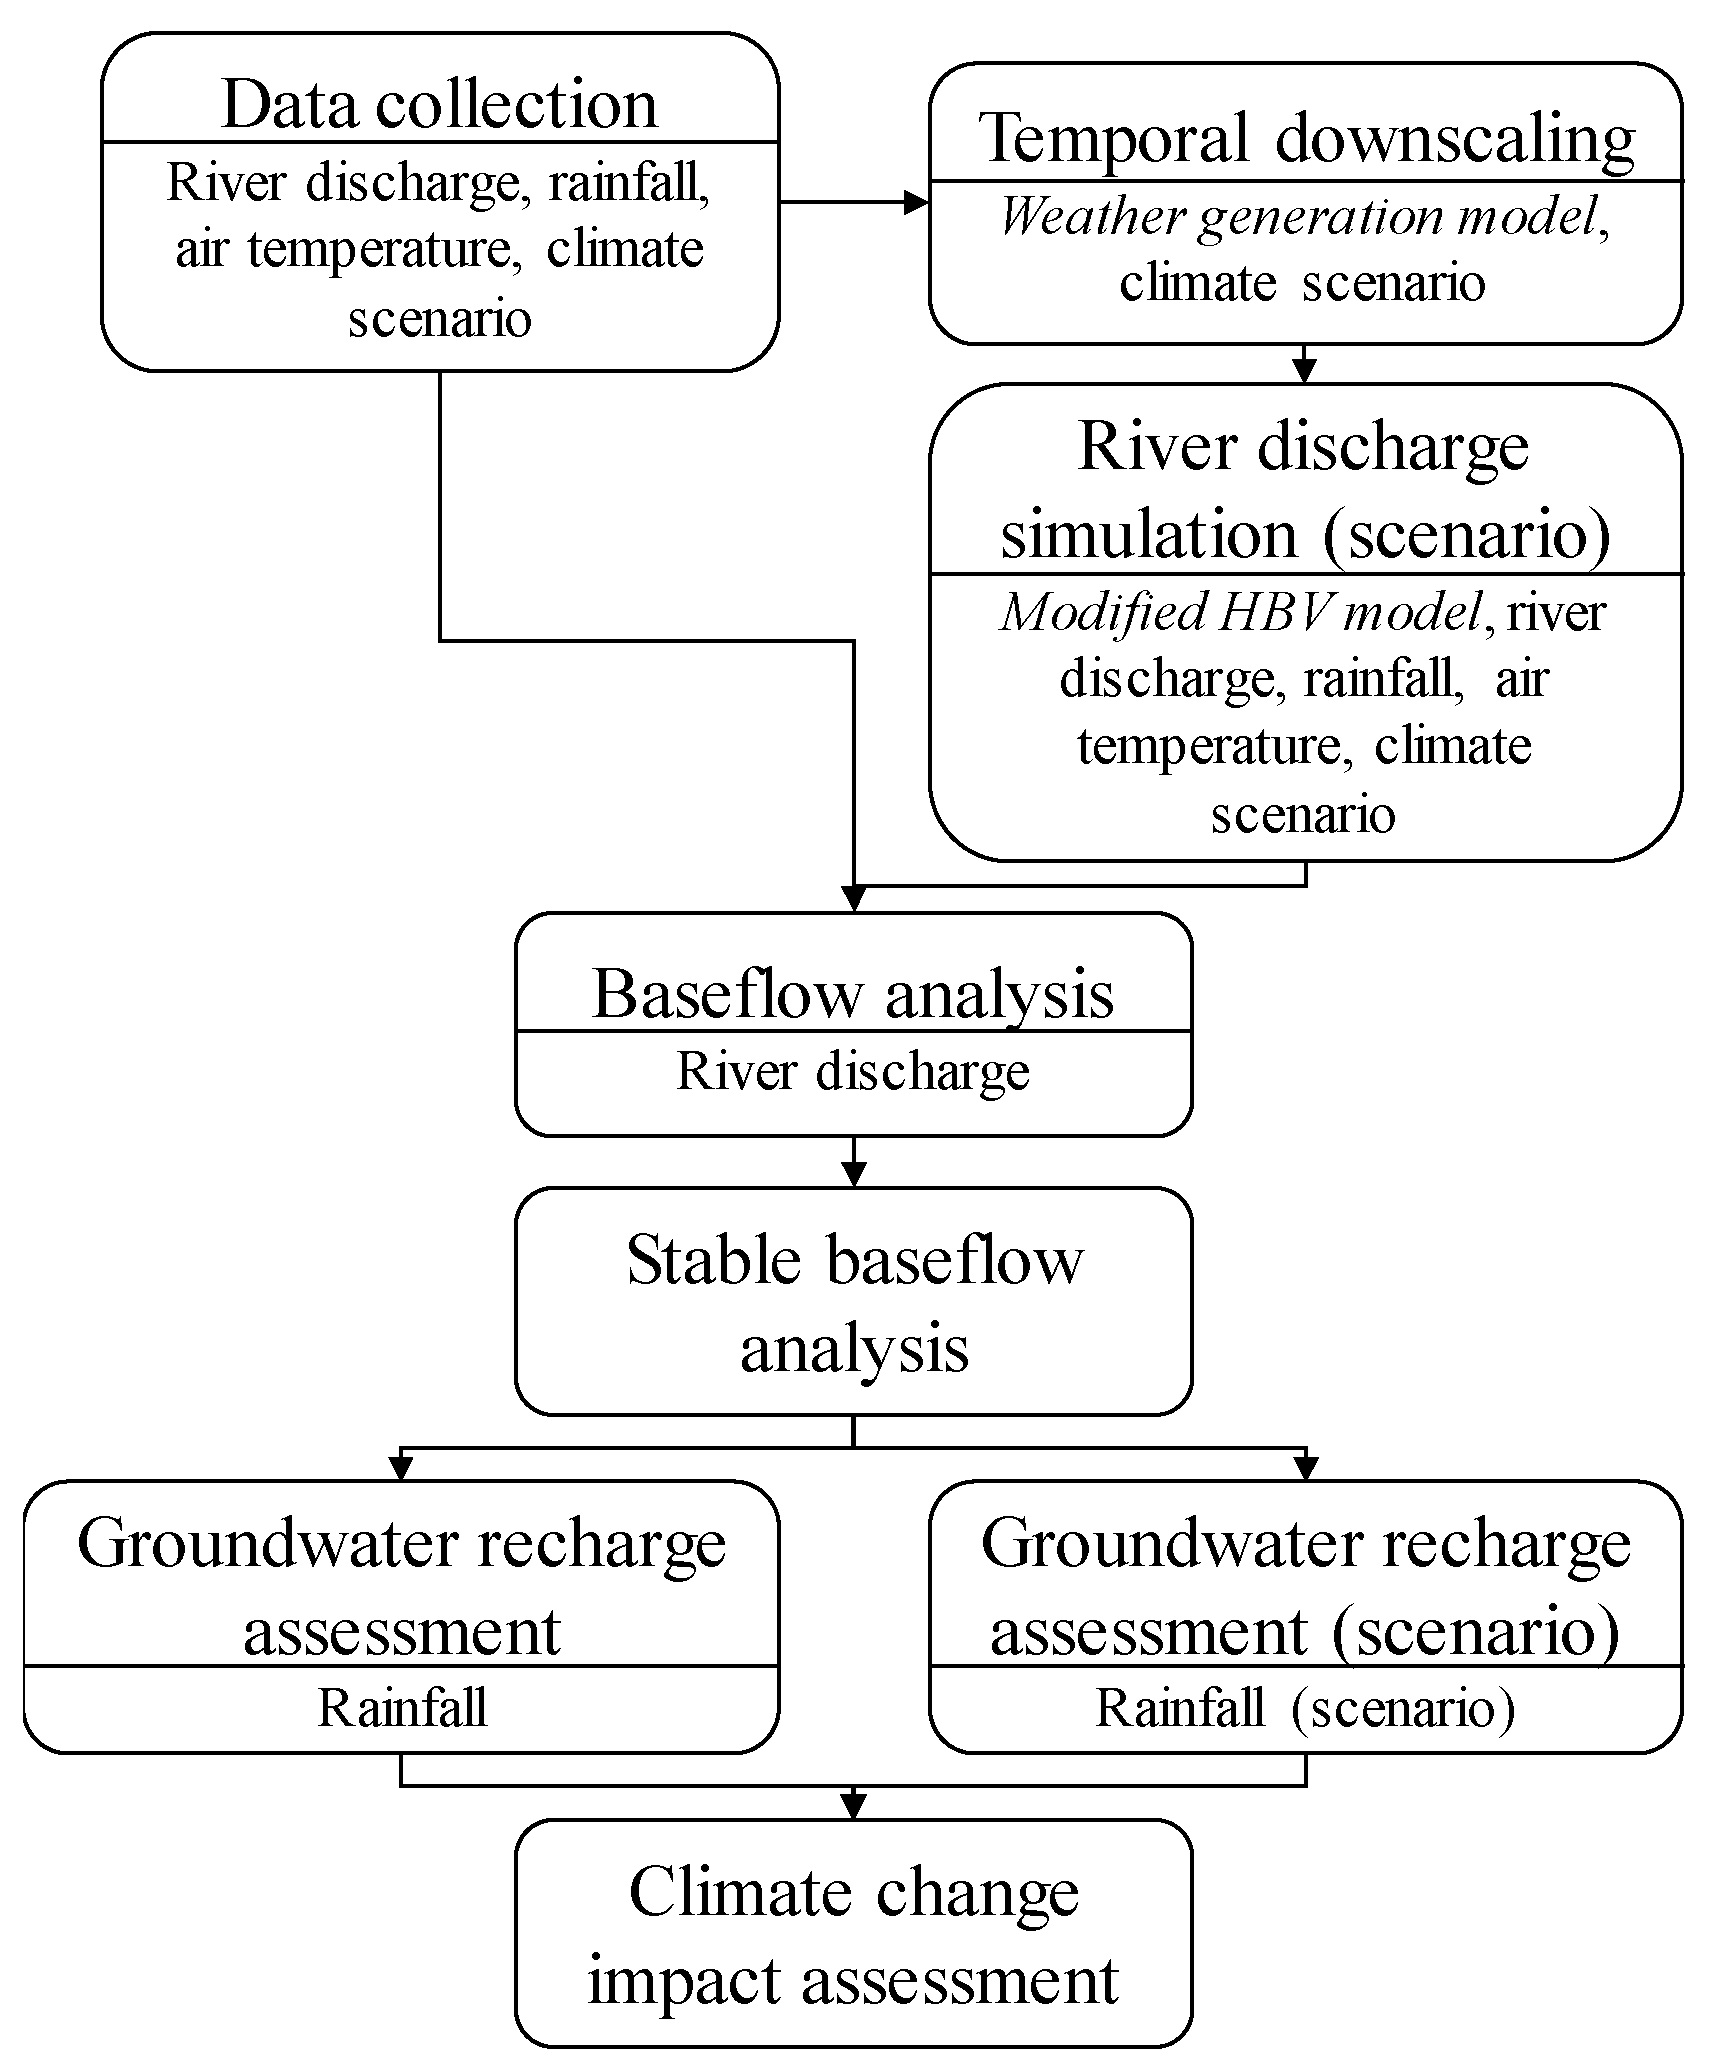
Figure 1 shows the flowchart of this study. The stable baseflow method with historical data for at least ten years, from the period 1980–1999, was used to estimate the historical groundwater recharge. Climate scenario data, namely rainfall and air temperature data for the period 2020–2039, were spatiotemporally downscaled and then used to simulate the river discharge quantities and estimate the groundwater recharge under the climate change effects, using the same method. Accordingly, the climate change impact on groundwater recharge, calculated between groundwater recharge for the baseline and climate scenarios, were estimated to show the climate change influence in different regions. Ten groundwater regions in Taiwan, with largely different climate and hydrological conditions, were selected as the study area to assess the impact of climate change on groundwater recharge.
2.1. Stable Baseflow Analysis and Groundwater Recharge Assessment
The groundwater balance in a watershed can be generally written as:
where R is the recharge, ET is the evapotranspiration, qb is the baseflow (groundwater discharge to surface water), qN is the net flux of any other groundwater entering or leaving the system, and ΔS is the change in storage. The units of the terms in Equation (1) are all LT−1. In a groundwater system, the evapotranspiration quantity is small. The net flux can be human-induced extraction and injection, or the interflow and groundwater flow out of the groundwater system in a watershed. Over a long period of time, the human-induced effects and the change in storage in a groundwater system can be ignored due to a steady state situation [31]. If the interflow and groundwater flow out of the groundwater system are assumed to be relatively small values, corresponding to the quantities of groundwater recharge and baseflow, respectively, then the groundwater balance equation can be simplified to:
R = ET + qb + qN + ΔS
R ≈ qb
This equation indicates that the quantity of baseflow is approximately equal to that of groundwater recharge over the long term [25]. This concept has been widely applied in groundwater recharge studies, with results showing good agreement compared with those obtained using other recharge estimation methods (e.g., [26,27,28,29,30]). As baseflow can be easily related to climate and hydrological conditions, it was adopted in this study to assess the climate change impact on groundwater recharge.
The quantity of baseflow was evaluated using the baseflow separation technique, which estimates a continuous or daily record of baseflow under the streamflow hydrograph [32,33]. For baseflow separation [27] daily data of river discharge are required and linear interpolation is used to estimate groundwater discharge during the period of surface runoff. The steps of baseflow separation are as follows [27]. A one-dimensional array of the daily mean river discharge data is created. From this array, days that fit the requirement of the antecedent recession are found. On each of these days, baseflow is assumed to be equal to the river discharge, as long as it is not followed by a daily decline of more than 0.1 log cycle [34]. A daily decline of more than 0.1 log cycle of river discharge could indicate interflow or surface flow. Linear interpolation of the groundwater discharge on the remaining days is used to estimate the baseflow. In some record periods, the interpolation might make the calculated baseflow exceed the river discharge. Thus, the last step is to correct for this error by reassigning the baseflow to river discharge.
The variation of river discharge under no hydrological events depends on the interaction of river water and groundwater, and its pattern resembles that of baseflow. The variation of baseflow under hydrological events is mainly due to the variation of groundwater recharge from rainfall. Therefore, heavy rainfall in a short period of time might not be able to induce effective groundwater recharge, but instead might increase the river discharge quantity, and thus will not have a significant influence on baseflow [35]. Long-term hydrological events give sufficient time for groundwater recharge and can induce a significant increase in baseflow. That is, the patterns of river discharge and baseflow might not match under hydrological events.
Based on the assumption of water balance, this study used the observed river discharge data of the main rivers in different groundwater regions in Taiwan to estimate the groundwater recharge, using the baseflow recession method proposed by the United States Geological Survey (USGS) [36]. The code for baseflow assessment proposed by the USGS was adopted in the analysis. The baseflow quantities of the catchment were estimated at each river gauge station and the baseflow index was calculated. The procedure of baseflow separation is as follows:
- prepare the daily river discharge data,
- separate the baseflow from the river discharge history,
- calculate the recharge length from the catchment area, and
- obtain the baseflow index using Equation (3).
Baseflow index = (baseflow/river discharge) × 100%
To prevent overestimation caused by heavy rainfall events, Rutledge [37] (1993) suggested using the baseflow in the winter time to represent the behavior of groundwater recharge. Zektser [38] (2002) suggested using the baseflow in the two months with the lowest rainfall as the average value for the year. Therefore, the concept of stable baseflow was used in this study to obtain reliable results [27]. In the stable baseflow analysis, the cumulative monthly baseflow is rearranged to obtain a data trend based on the grey theory concept [27]. The stable baseflow analysis can be used to estimate the trend of the low, stable, and high flow from the rearranged cumulative baseflow [27]. Then, the stable baseflow can be obtained via a linear extrapolation of the stable-flow trend. This trend can be different at different locations on a river. The low-flow trend is not obvious near the estuary of a river, and obvious upstream. The procedure of the stable baseflow analysis is as follows [27]:
- obtain monthly baseflow from the baseflow record estimation,
- obtain long-term mean monthly baseflow,
- perform data processing by sorting and accumulating the long-term mean monthly baseflow to obtain a new series of long-term mean monthly accumulated baseflows,
- choose the most stable (near-linear) segment, and obtain the slope of the stable baseflow, and
- apply linear interpolation to the remaining months to obtain the mean annual baseflow.
This study used different segments for the stable baseflow extrapolation to estimate the groundwater recharge under various climate conditions for groundwater regions in Taiwan. The estimation for Choushui River alluvial fan was set as the standard reference of the stable baseflow. The rearranged cumulative monthly baseflows from the third to the fifth lowest were chosen as the annual averages of stable baseflow. Then, a linear line is extrapolated to the 12th month to obtain the recharge depth of baseflow. In the northern region of Taiwan, the months for the stable baseflow estimation were chosen from the second to the fourth months of the rearranged cumulative monthly baseflow, due to the continuous rainfall conditions in the winter (November to April). The regions in the northern region are the Taipei Basin, Taoyuan-Zhongli Tableland, Hsin-Miao Region, Taichung Region, and Lanyang Plain. In the southern region of Taiwan, the months for the stable baseflow estimation were chosen from the fourth to the sixth month of the rearranged cumulative monthly baseflow, due to the very dry conditions in the winter. The regions in the southern region are the Chianan Plain, Pingtung Plain, Hengchun Plains, and Hua-Tung Longitudinal Valley Area.
After the recharge depth of the stable baseflow is obtained at a river gauge station, the average recharge rate of groundwater in the catchment of that river gauge station can be calculated by dividing the recharge depth by the total rainfall as:
Recharge rate = Annual recharge depth/Annual rainfall
Then, the recharge rate can be used to estimate the quantity of groundwater recharge with a given rainfall and a control area as:
where the control area is the area of the representative watershed of a river gauge station. If a groundwater region includes several main rivers and river gauge stations, the total recharge quantity can be calculated by summing the results for the separate areas.
Recharge quantity = Rainfall × Recharge rate × Control area
2.2. River Discharge Estimation under Climate Scenarios
The Intergovernmental Panel on Climate Change (IPCC) developed general circulation models (GCMs) for projecting climate variations through the prescribed CO2 emission scenarios [39]. The original GCMs have a coarse resolution in the spatial domain, making them unsuitable for studies on the catchment scale. The Taiwan Climate Change Projection Information and Adaptation Knowledge Platform (TCCIP) (official website: https://tccip.ncdr.nat.gov.tw/ (accessed on 15 April 2021)) uses spatial statistical downscaling methods based on CMIP3 experiments (the experiments in the Coupled Model Intercomparison Project Phase 3) to downscale the monthly rainfall and air temperature from GCMs to the catchment scale [40,41]. In the temporal domain, the changes of monthly rainfall and air temperature were downscaled using a weather generator [16] to produce daily data. The first-order autoregressive equation proposed in [42] Pickering et al., (1988) was used to calculate the daily air temperatures. A Markov chain was used to determine the occurrence of wet and dry days, to generate daily rainfall data. Daily rainfall on wet days was then determined by sampling from the Weibull distribution [43]. This study used the monthly variations of rainfall and air temperature data generated by the TCCIP and used the baseline data (1980–1999) as the input data of the weather generation model. The daily data of rainfall and air temperature were then generated based on the climate scenarios (2020–2039). Detailed descriptions of the climate scenarios are given in a later section.
After the daily rainfall and air temperature were obtained from the downscaling calculations, a hydrological model was used to simulate the river discharge under climate scenarios. The hydrological model was based on the Hydrologiska Byråns Vattenbalansavdelning (HBV) model [44,45]. Yu and Yang [46] (2000) modified the HBV model to estimate the daily river discharge in the catchments of Taiwan. This model can consider the rainfall and air temperature variations due to climate change and estimate the river discharge for the baseflow analysis. In the HBV model, upper and lower tanks are used to simulate the rainfall–runoff behavior. The HBV model includes three parts [39]: (1) a soil moisture model, (2) a runoff response mechanism, and (3) water balance functions. This study used the modified HBV model to simulate rainfall–runoff and generate the river discharge under climate change scenarios for each catchment. The HBV model includes calibration and simulation steps. For the calibration step, historical observation data, e.g., rainfall, air temperature, and river discharge, are required. The flow duration can be calculated as the input data for the hydrological model. After the calibration process, the best-fit parameters are obtained and used to simulate the 200-year daily river discharge under the conditions of climate scenarios. The continuous daily river discharge results for the period 2020–2039 could be obtained by analyzing the 200-year daily data. Detailed descriptions and the procedures for calibration and validation of the modified HBV model can be found in [16,46].
Note that, although the period of the climate scenarios was 20 years (2020–2039), the time length of the climate data generated by the weather generating model should be longer than this period to maintain the statistical properties of rainfall and air temperature [16]. Therefore, this study produced 200 years of daily rainfall and air temperature data, to represent the climate conditions of the baseline and climate scenarios. The impact of climate change can be estimated from a comparison of the mean properties of the baseline and climate scenarios. For example, the groundwater recharge estimated using 200-year baseline climate data represents the baseline recharge and that estimated using the 200-year climate scenario represents the recharge under climate change. The impact of climate change on groundwater recharge can be obtained from the recharge difference between the baseline and climate change scenarios.
Four indices were used in this study to assess the performance of the results of the modified HBV model, namely the flow ratio (Rflow), correlation coefficient (CC), root–mean-squared error (RMSE), and coefficient of efficiency (CE). These indices are defined below.
where n is the total number of days, and are the observed and simulated river discharge, respectively, and and are the mean of observed and simulated river discharge in the nth day (mm/day), respectively.
3. Study Background
3.1. Study Area
Taiwan island has a length of 394 km in the north–south direction and a width of 144 km in the east–west direction. The total area is 36,188 km2. The topography varies from 0 to 3952 m (Mt. Jade) and two thirds of the island is mountainous. Therefore, the climate and hydrology in different regions have different patterns due to the high variations of topography and monsoon climate conditions. The average rainfall (from 1949–2018) was 2926, 2154, 2546, and 2554 mm/year in the northern, central, southern, and eastern regions of Taiwan, respectively. The annual rainfall quantity in Taiwan is 2508 mm/year [47] which is ~2.5 times the average global rainfall (986 mm/year in 2020) [48]. The rainfall quantities in different regions are not very different; however, the distributions of monthly rainfall are quite different. The rainfall distribution in the temporal domain shows large variations in the dry season (November to April) and wet season (May to October), especially in the southern region of Taiwan. Rainfall in the wet season accounted for 65%, 77%, 89%, and 78% of the total annual rainfall in the northern, central, southern, and eastern regions, respectively, based on the monthly average data for the period 1949 to 2018 [47]. The northern region has a nearly uniform distribution of monthly rainfall, whereas the southern region has large variations, which leads to a lack of water in the dry season.
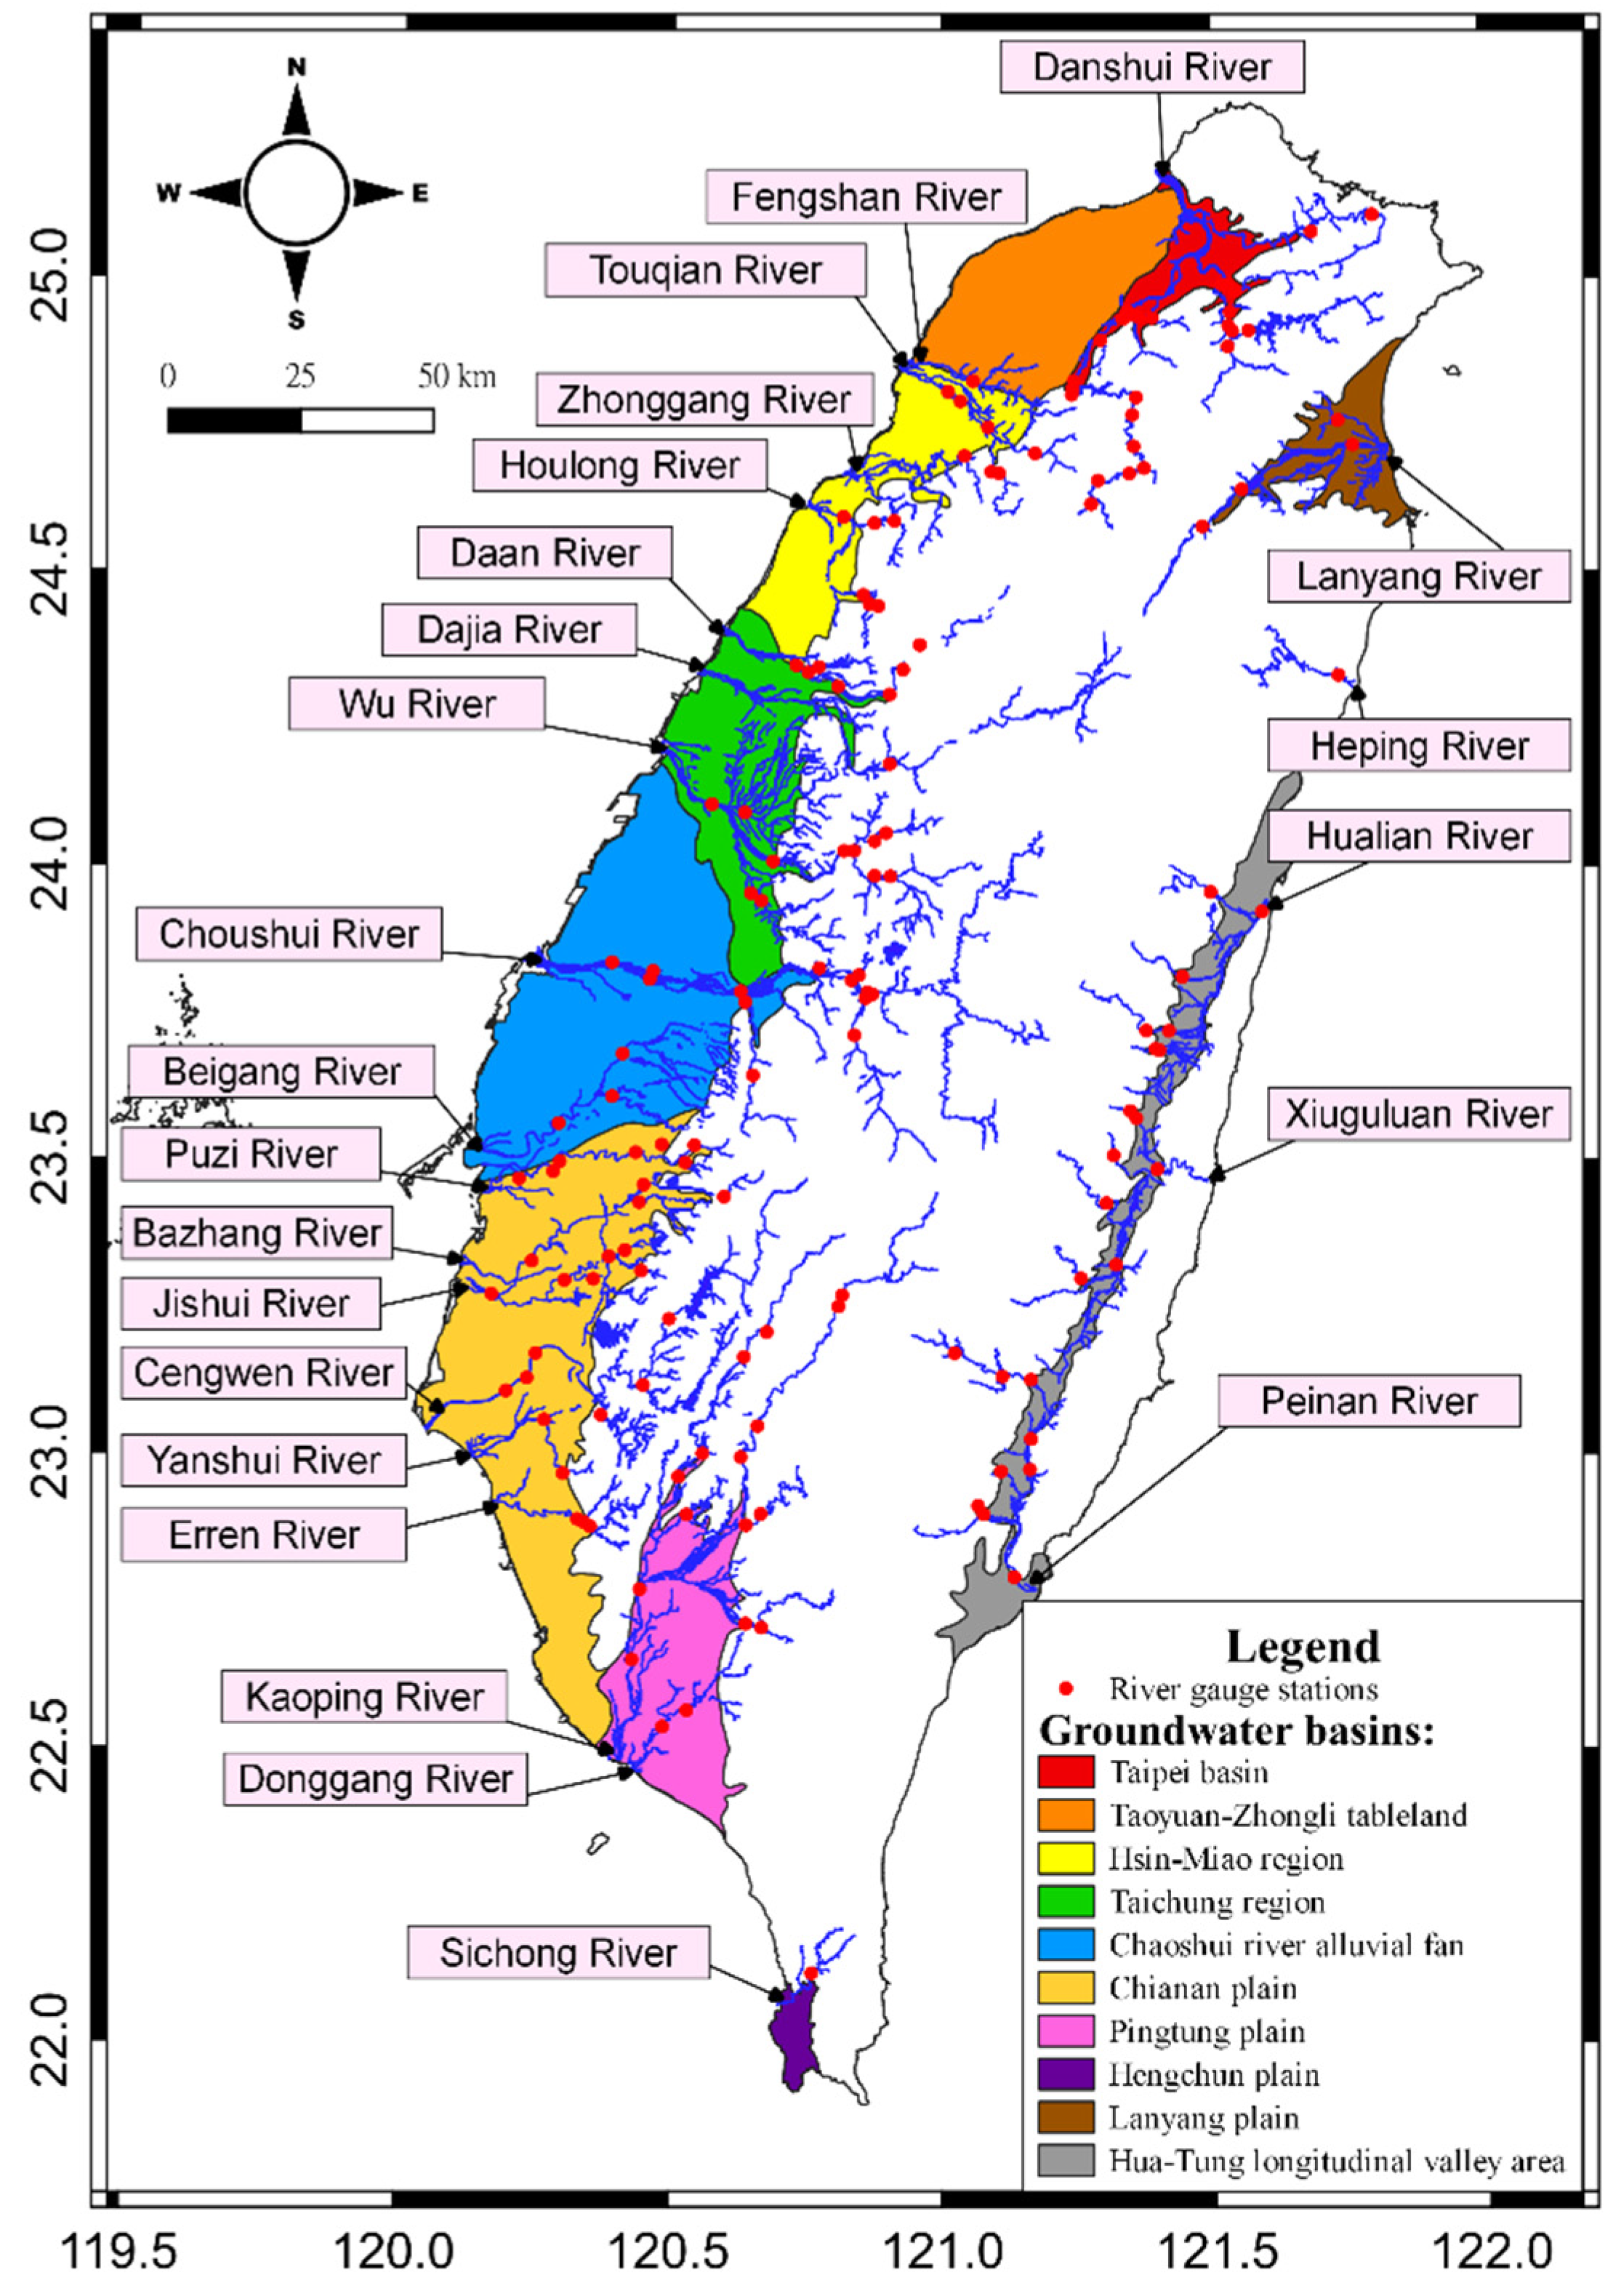
There are nine groundwater regions in Taiwan, namely the Taipei Basin, Taoyuan-Zhongli Tableland, Hsin-Miao Region, Taichung Region, Choushui River Alluvial Fan, Chianan Plain, Pingtung Plain (including Hengchun Plains), Lanyang Plain, and Hua-Tung Longitudinal Valley Area, as shown in Figure 2 and Table 1. For clarity, Hengchun Plains is listed independently in the following assessment, and thus the total number of groundwater regions in this study is ten. As these groundwater regions are located in different regions of Taiwan, the hydrological conditions are highly varied.
3.2. Historical Data Collection
This study collected climate and hydrological data from the Taiwan Water Resources Agency (WRA) and the Central Weather Bureau (CWB), including air temperature, rainfall, and river discharge. The distributions of the main rivers and river gauge stations are shown in Figure 2. The number of observation stations in each groundwater region is listed in Table 1. A main river is a river managed by the central government. This type of river is the target in this study. The total number of main rivers is 24. There are 152 river gauge stations. River discharge was the main data set used for groundwater recharge assessment based on the baseflow recession method.
The resolution of the adopted digital element model (DEM) was 40 m × 40 m. The spatial analysis and hydrology modules in ArcGIS software were used to analyze the river flow direction and flow path to construct the catchments of the rivers based on the DEM data and river gauge stations. For a given river gauge station, all climate stations in the catchment were used to calculate the mean rainfall and air temperature for the area. Mean rainfall was used to assess the average groundwater recharge rate using Equation (4). The total area of a groundwater region was used to assess the total amount of groundwater recharge based on the rainfall quantity multiplied by the obtained recharge rate. The mean rainfall and air temperature were used to develop the modified HBV model by calibrating the river discharge quantity. The catchment area for a river gauge station was also used to estimate the grids of the climate scenarios and calculate their mean rainfall and air temperature, which were then used in the modified HBV model to simulate the river discharge under climate scenarios.
3.3. Scenarios of Climate Change
The climate change scenarios were given by the IPCC as air temperature and rainfall ratios between a future period and the baseline period. For example, the scenarios of the near future were defined as the period 2020 to 2039, based on a baseline period of 1980 to 1999. GCMs are commonly used to assess the impact of climate change on water resources. Different scenarios of greenhouse gas emissions are used to simulate the conditions of the atmosphere and ocean. Future climate change scenarios are mainly given by the IPCC Special Report on Emissions Scenarios (SRES). The scenarios refer to the greenhouse gas emission scenarios set by the IPCC. Possible developments of the economy, population, industry, and environment are predicted to produce a possible trend of greenhouse gas emissions. GCMs are then used to simulate the associated climate variations. In this study, the adopted scenarios were from the Fourth Assessment Report (AR4), which uses four storylines to illustrate the greenhouse gas emission scenarios that may result from different developments in the future. The four storylines yield four family sets, named A1, A2, B1, and B2, respectively [49]. In this study, the main goal was to assess the climate change impact on groundwater resources and provide a reference for water resources management. Therefore, the adopted climate scenarios should represent the mean condition. Scenario A1B, a relatively average carbon emission scenario, was thus selected in this study.
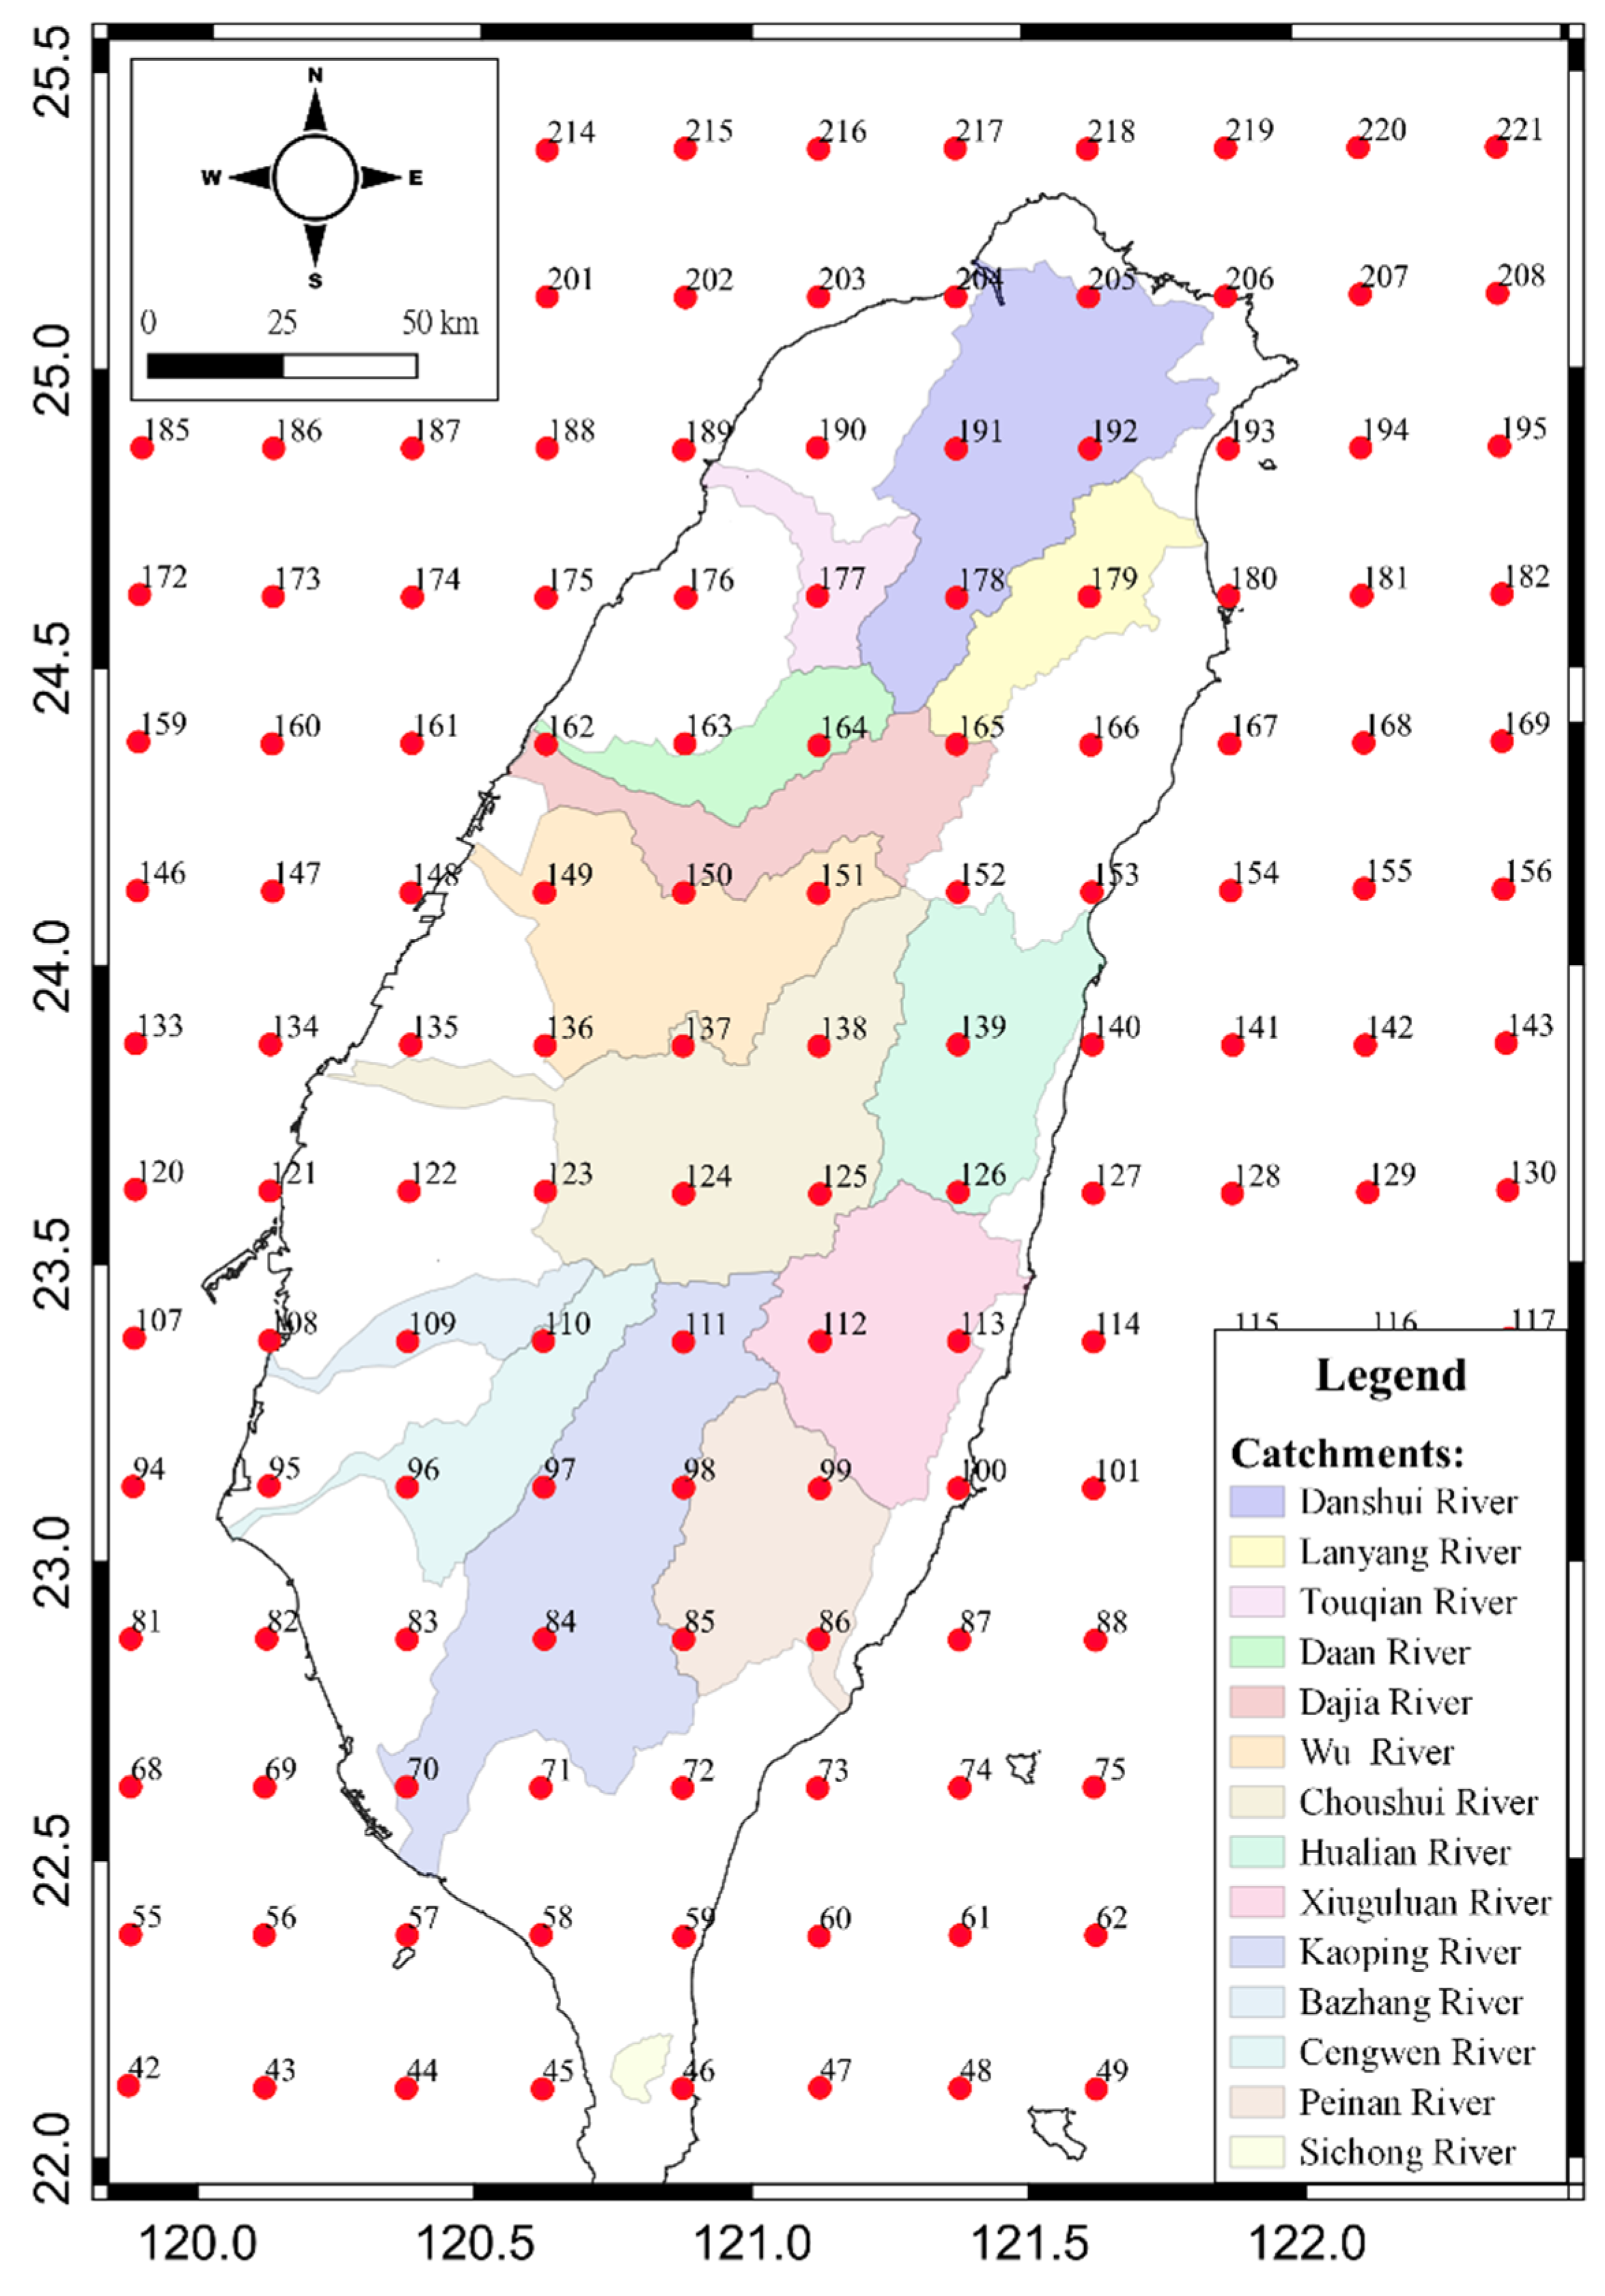
The climate change scenarios given by the IPCC have a grid resolution from 100 to 300 km. The resolution of the GCM grids is much larger than the normal scale of a watershed in Taiwan. The climate condition on a watershed scale cannot be captured by the original GCMs. The TCCIP thus used the GCM proposed by the IPCC to analyze the spatially downscaled climate change scenarios and then generated monthly rainfall and air temperature variations in Taiwan under the storylines of greenhouse gas emissions. The spatially downscaled resolution of the monthly rainfall and air temperature scenarios provided by the TCCIP for Taiwan is 25 km × 25 km, with 88 total grids (Figure 3). The grids that cover the catchment of a river gauge station were adopted to calculate the mean quantity of the scenario rainfall and air temperature, to represent the climate conditions of that catchment. Then, the climate conditions were used in the modified HBV model to generate the river discharge under these climate conditions.
The TCCIP provides the spatially downscaled climate scenarios in two periods, namely the near future (2020–2039) and the end of the century (2080–2099), respectively. The climate scenarios for the near future period (2020–2039), with the baseline period (1980–1999), were used in this study. The results for the downscaled rainfall are given as percentages and those for the downscaled air temperature are given as variations. The exact quantity of rainfall and air temperature can be generated using the historical data in the baseline period with the variations of climate scenarios. However, the spatially downscaled climate scenarios provided by the TCCIP are monthly variations, and thus the temporal resolution was insufficient for the hydrological model. A weather generation model was adopted for the temporal downscaling calculation. Daily resolution climate scenarios were thus obtained.
There were 19 to 24 assessment GCMs in each grid depending on the scenario settings. Figure 4a shows the monthly projections of all GCMs of rainfall in the A1B climate scenario as an example. The dashed line is the mean of the 24 GCMs in each month, and the solid lines in the top and bottom parts, corresponding to the mean line, are the mean plus/minus one standard deviation of the 24 GCMs, respectively. The data in each month show that the 24 GCMs have huge variations. For data from a single GCM for 12 months, the variation is still large. These large variations will induce a large uncertainty in the calculation of the modified HBV model. In addition, each GCM may be the climate condition in the near future, and thus it was impossible to choose one to represent the future climate condition in the study areas. Therefore, the research group at the TCCIP compared the historical climate data with those simulated by the GCMs and selected nine GCMs that can well simulate the monsoon climate characteristics in east Asia. This selection reduced the number of GCMs and maintains a good performance for the climate conditions in Taiwan. The selection procedure and detailed descriptions can be found in [50].
The condition of a climate scenario includes a lot of uncertainty. In addition, the difference between GCMs is obvious. The uncertainty was thus estimated using the mean and variance of GCMs. In addition to the mean condition of GCMs, their uncertainty was considered in the assessment of climate change impact on a groundwater system. This study used the mean and mean plus/minus one standard deviation of the rainfall and air temperature data from the nine GCMs as the conditions for the climate change scenarios. Figure 4b,c show an example of GCM projection of rainfall and air temperature at Ziqiang Bridge. If the climate scenarios obey the normal distribution, the statistical meaning of the mean plus/minus one standard deviation will include 68% of the GCM data. Therefore, the following four scenarios were adopted for assessment:
- Scenario—S0: Mean of the nine GCMs in the A1B storyline,
- Scenario—S1: Mean plus one standard deviation of the nine GCMs in the A1B storyline,
- Scenario—S2: Mean minus one standard deviation of the nine GCMs in the A1B storyline, and
- Scenario—Baseline: The historical scenario.
4. Results and Discussion
The study area includes ten groundwater regions in Taiwan. Choushui River alluvial fan is chosen as an example to demonstrate the assessment results. Then, the results of the ten groundwater regions are listed for comparison and discussion.
4.1. Groundwater Recharge Assessment
4.1.1. Baseflow Analysis
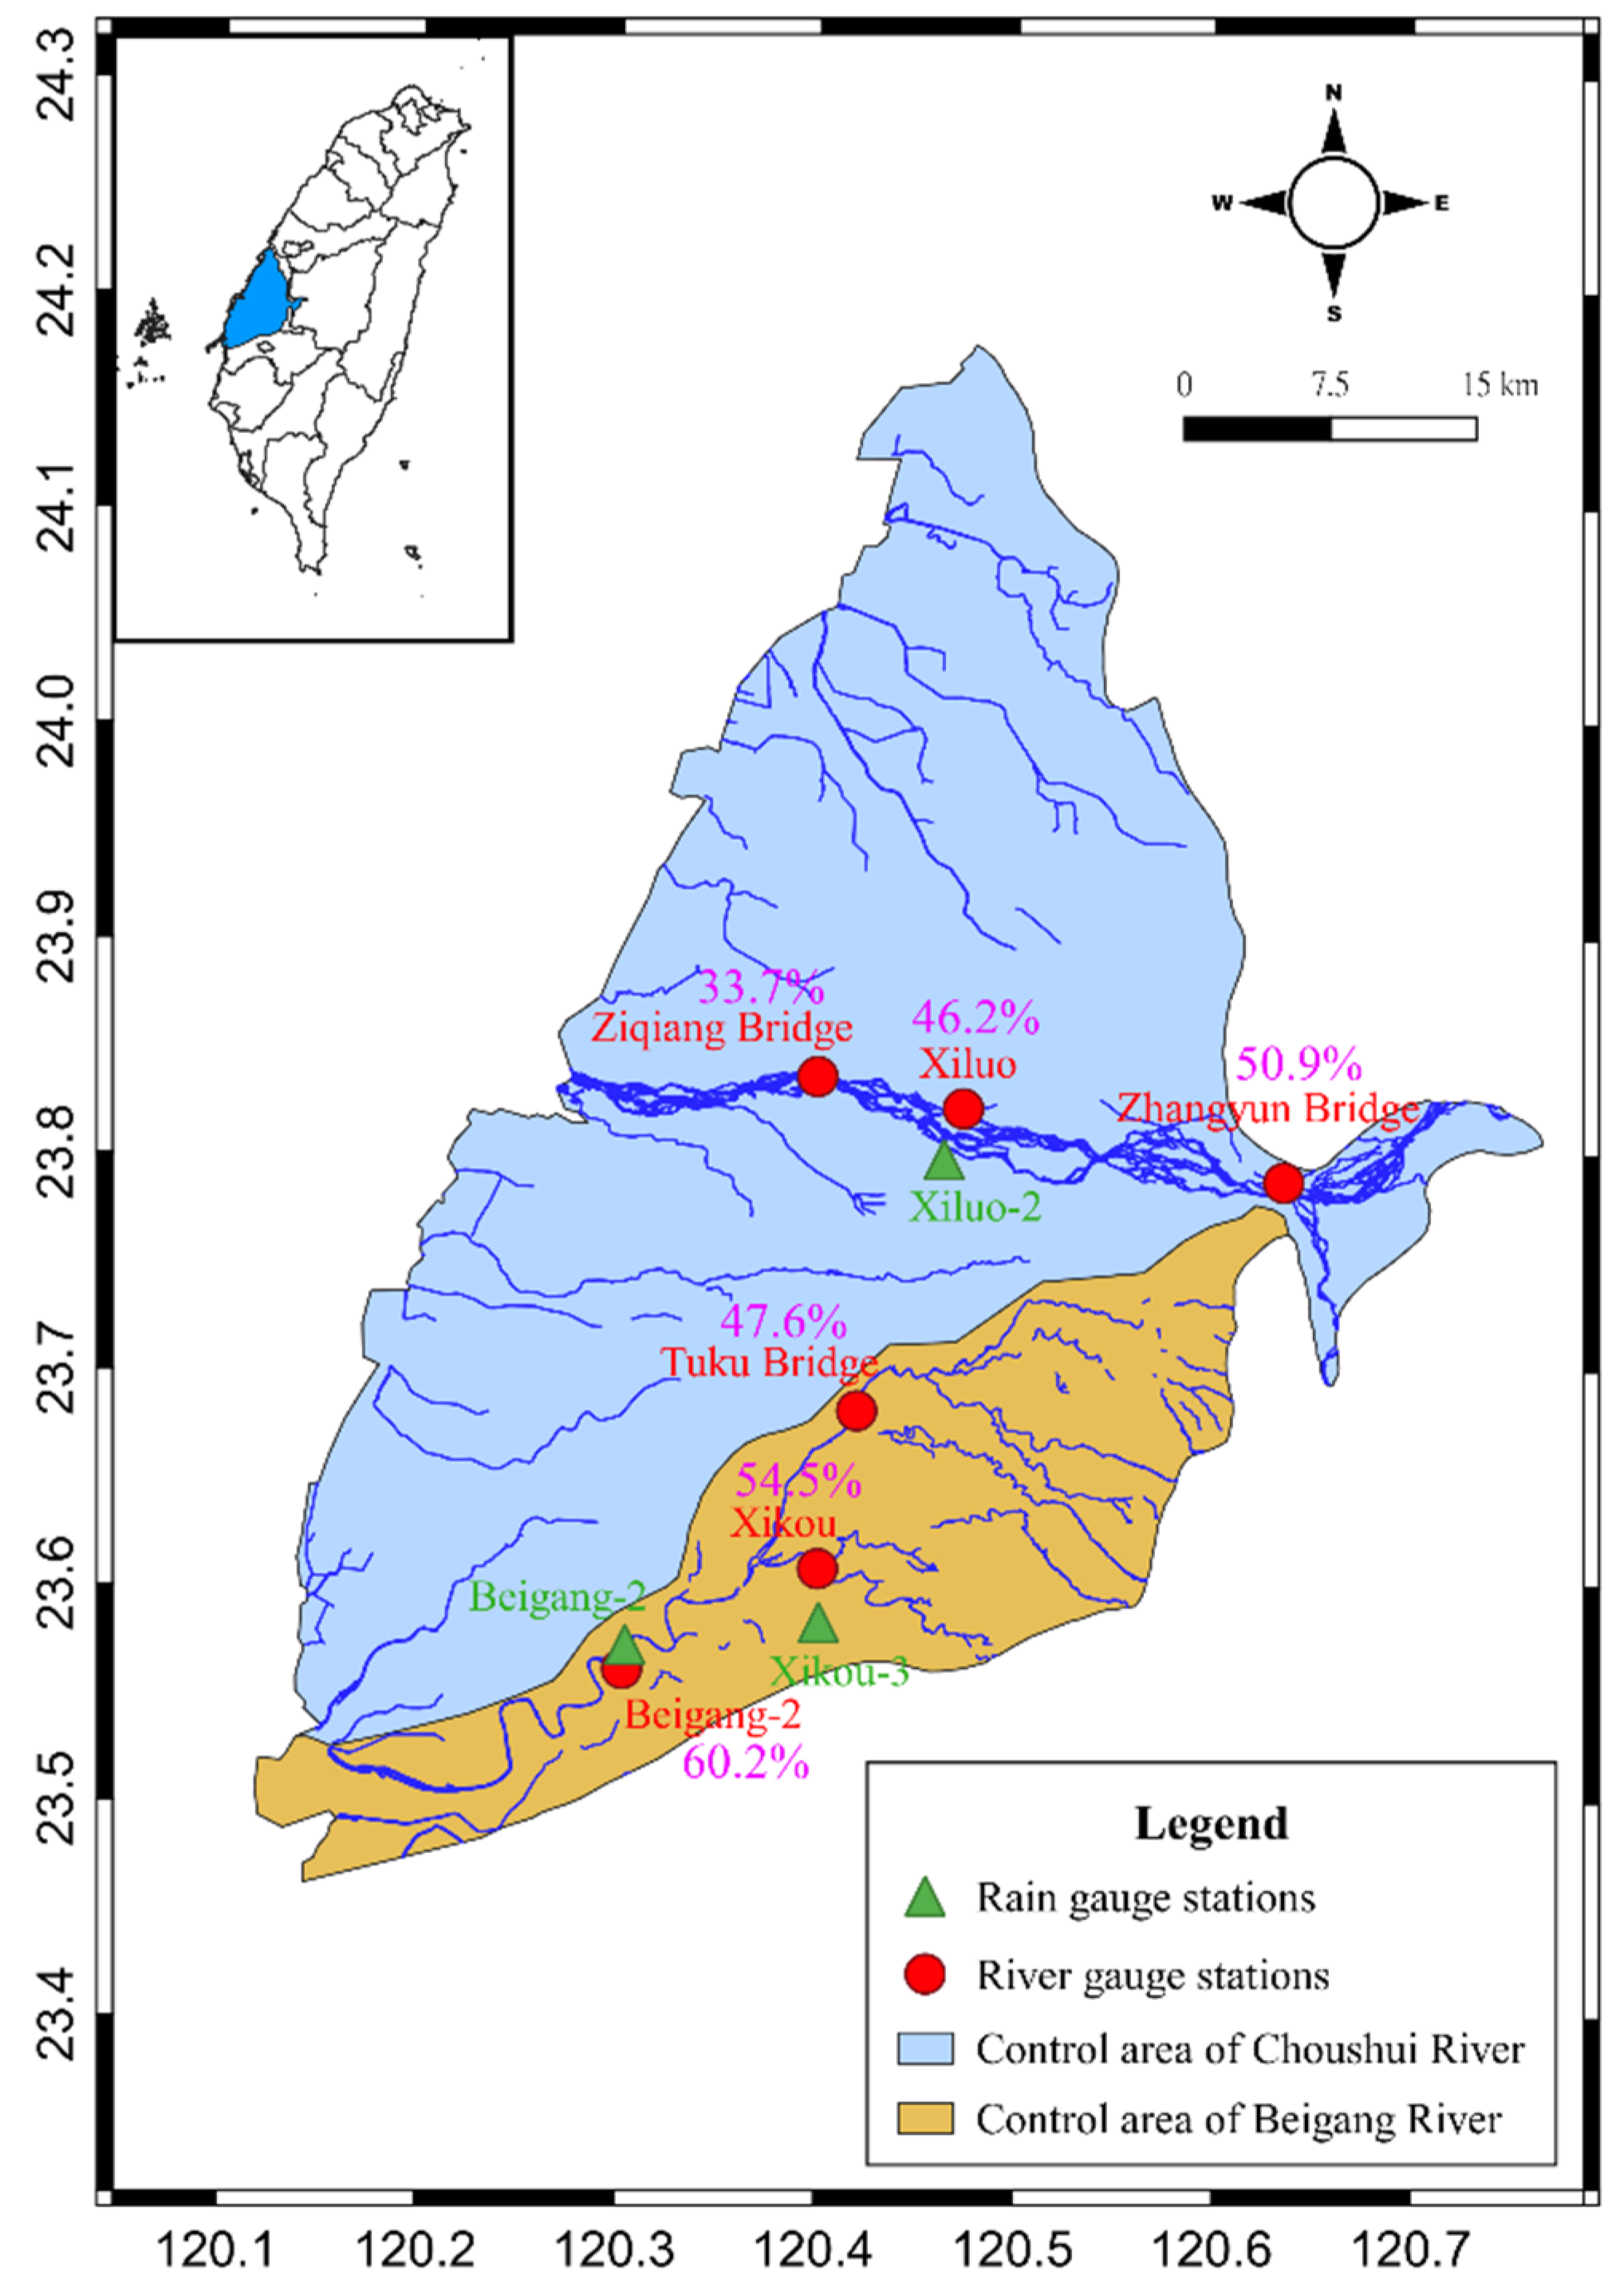
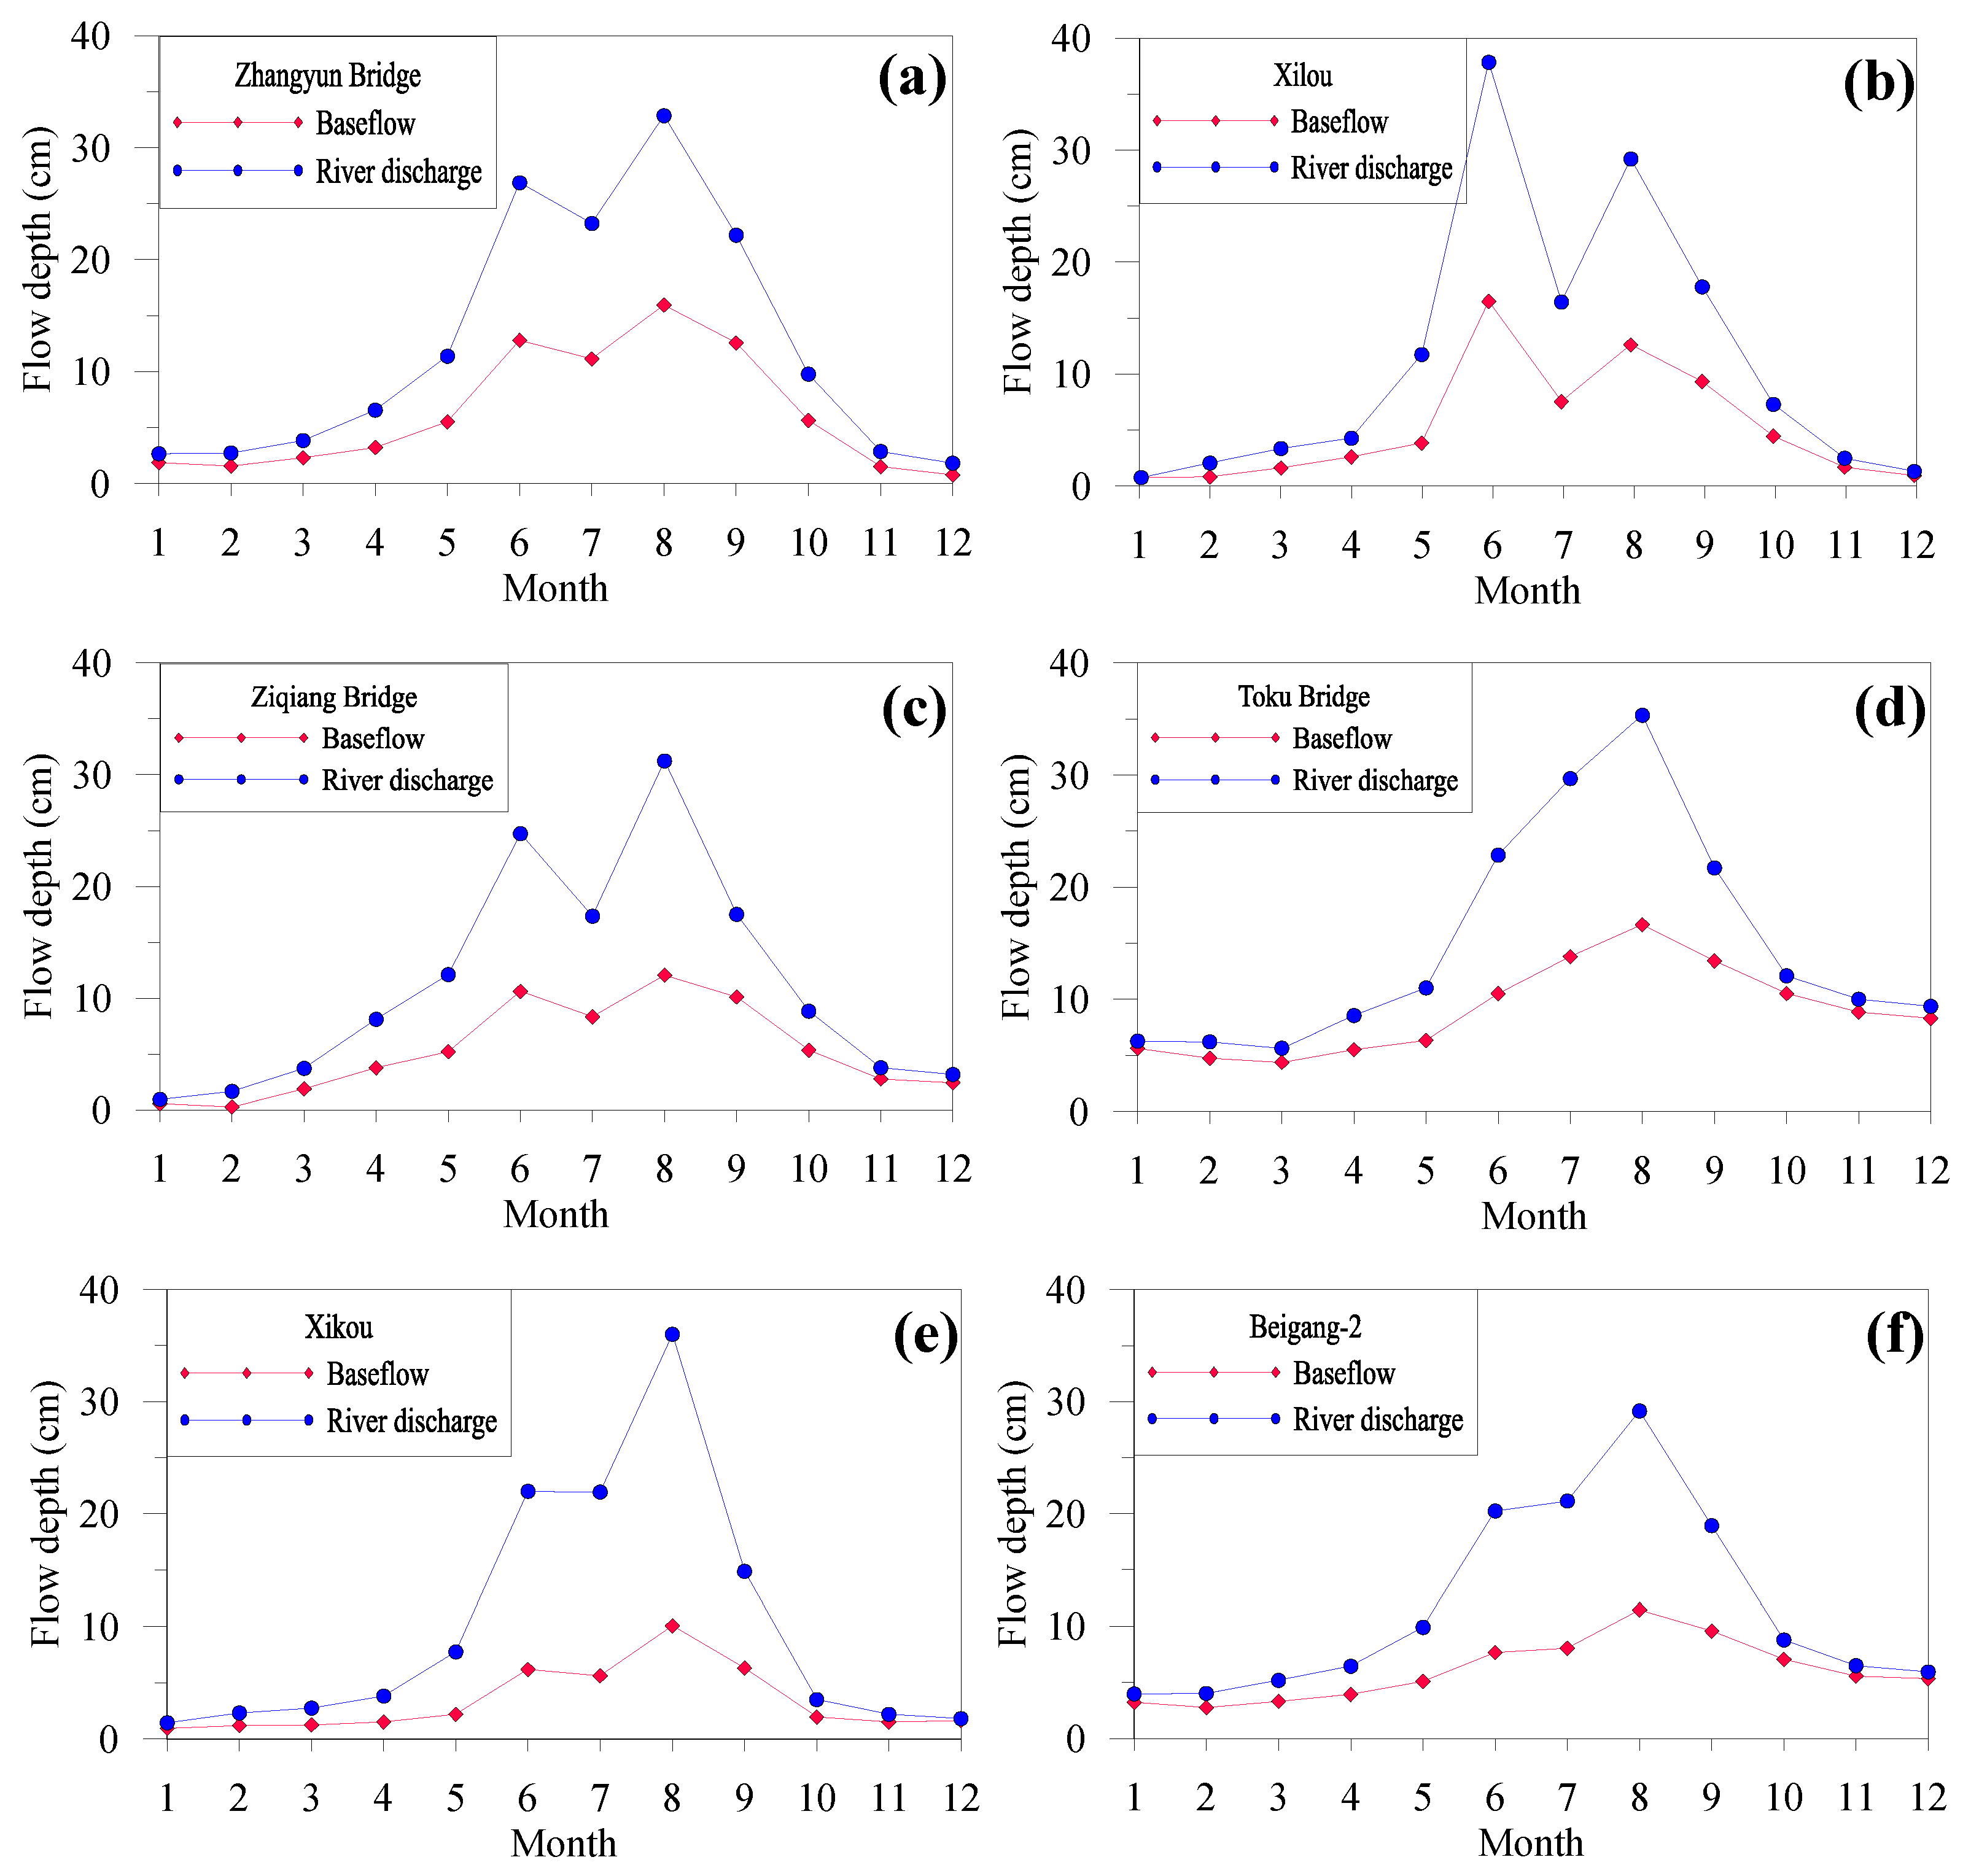
Based on the assumption that long-term baseflow can represent the groundwater recharge, a monitoring period of at least ten years was set for the river discharge. In the region of Choushui River alluvial fan, six river gauge stations were adopted, as shown in Figure 5 and listed in Table 2. A baseflow analysis was conducted as described in the previous section. The results are shown in Figure 6. From the baseflow separation results, baseflow varies with river discharge, and the quantity is large in the wet season and small in the dry season. The difference between river discharge and baseflow is small in the dry season, which means that river discharge in the dry season is mainly from groundwater discharge (baseflow). The ratio between baseflow and river discharge is the baseflow index, which ranges from 33.7% (Ziqiang Bridge) to 60.2% (Beigang-2) in Choushui River alluvial fan (Table 3 and Figure 5). The baseflow index decreases from upstream to downstream (from Zhangyun Bridge, Xiluo, to Ziqiang Bridge) in the Choushui River, which indicates that groundwater discharge in the downstream is less than that in the upstream. The baseflow in the dry season and the baseflow index are high in the Beigang River watershed and low in the Choushui River watershed, which indicates that the river discharge in the Beigang River is mainly from groundwater discharge.
4.1.2. Stable Baseflow Analysis
From the baseflow separation results, the baseflow is low in the dry season and high in the wet season. The stable baseflow concept was adopted for the separated baseflow results. The baseflow quantities were rearranged from low to high values and accumulated monthly. The concept described in the previous section was applied, and the third to fifth accumulated baseflow quantities were selected for the linear regression. The regression curve was extrapolated to the twelfth month to obtain the stable baseflow quantity (see Figure 7). The cumulative stable baseflow quantity is the annual recharge depth of the area in the upstream catchment of the station. The trends of the accumulated baseflow are steep in the Choushui River watershed and gentle in the Beigang River watershed. These trends reflect the different characteristics of the river systems. River discharge quantities in the dry and wet seasons have a larger difference in the Choushui River than in the Beigang River.
4.1.3. Groundwater Recharge Assessment
Using Equation (4), the average recharge rate can be obtained (Table 3), based on the assessed stable baseflow and the calculated catchment rainfall. To simplify the groundwater recharge calculation, the river gauge station in the downstream was adopted to represent the recharge condition in the groundwater region. Therefore, the recharge rates at Ziqiang Bridge and Beigang-2 stations, in the downstream area, were adopted to represent the average recharge rate for their control areas in their groundwater region. The recharge rates are 14.0% and 38.6% for the areas of the Choushui River and Beigang River, respectively.
Using the river catchment concept, the control areas of the Choushui River and Beigang River were estimated as 1725 and 576 km2, respectively (Figure 5). Based on the average rainfall quantity in the control area and the recharge rate, the average recharge quantity can be calculated using Equation (5). The recharge quantities for the areas of the Choushui River and Beigang River were 532.51 × 10⁶ and 394.42 × 10⁶ m3/year, respectively. Therefore, the total recharge quantity in the Choushui River alluvial fan is the sum of those for these two areas, namely 926.93 × 10⁶ m3/year.
In previous studies, the groundwater recharge quantities in the Choushui River alluvial fan, obtained with different methods, had large differences. The WRA [51] (2014) collected 21 assessment results of groundwater recharge from reports and papers (mainly in Chinese), and found that the recharge quantities varied from 525 × 106 to 2312 × 106 m3/year. The assessment results of this study are in the range of these values. Some of the results collected in by the WRA [51] (2014) were obtained using empirical equations (e.g., electricity usage or land usage), some were from a numerical model (MODFLOW), some were from a baseflow assessment, and some were obtained using groundwater recession inversion. The first two methods require a lot of data and manpower, and the latter two methods depend on observations and experimental data. The baseflow concept uses observation data and is easily related to climate data, and was thus adopted in this study.
4.1.4. Recharge in Dry and Wet Years
Since the rainfall quantity in Taiwan greatly varies from year to year, an average recharge quantity is not suitable for describing a single year. Considering the rainfall quantities in different years, dry, normal, and wet years are defined as:
where mean and σ are respectively the mean value and standard deviation of the rainfall quantities in the catchment area within the assessment period (>10 years). The recharge rate obtained in the previous section represents the recharge in a normal year. The recharge rate at Ziqiang Bridge and Beigang-2 stations in dry and wet years was calculated. The results are shown in Table 4. The recharge rate is highest in a dry year and lowest in a wet year. The recharge rates can be used to calculate the recharge quantity based on the rainfall quantity in a given year. For example, the rainfall quantities in 2011 and 2014 in the Choushui River alluvial fan were for a dry year; the corresponding recharge quantities are 825.5 × 10⁶ and 856.3 × 10⁶ m3/year, respectively. The rainfall quantities in 2012 and 2013 were for a wet year; the corresponding recharge quantities are 1116.7 × 106 and 1135.4 × 106 m3/year, respectively. The recharge rates in dry, normal, and wet years for the representative river gauge stations in the ten groundwater regions in Taiwan are listed in Table 4 for reference.
Dry year: rainfall quantity < mean − 1σ
Normal year: mean − 1σ ≤ rainfall quantity ≤ mean + 1σ
Wet year: rainfall quantity > mean + 1σ
4.1.5. Rainfall–Recharge Relationship
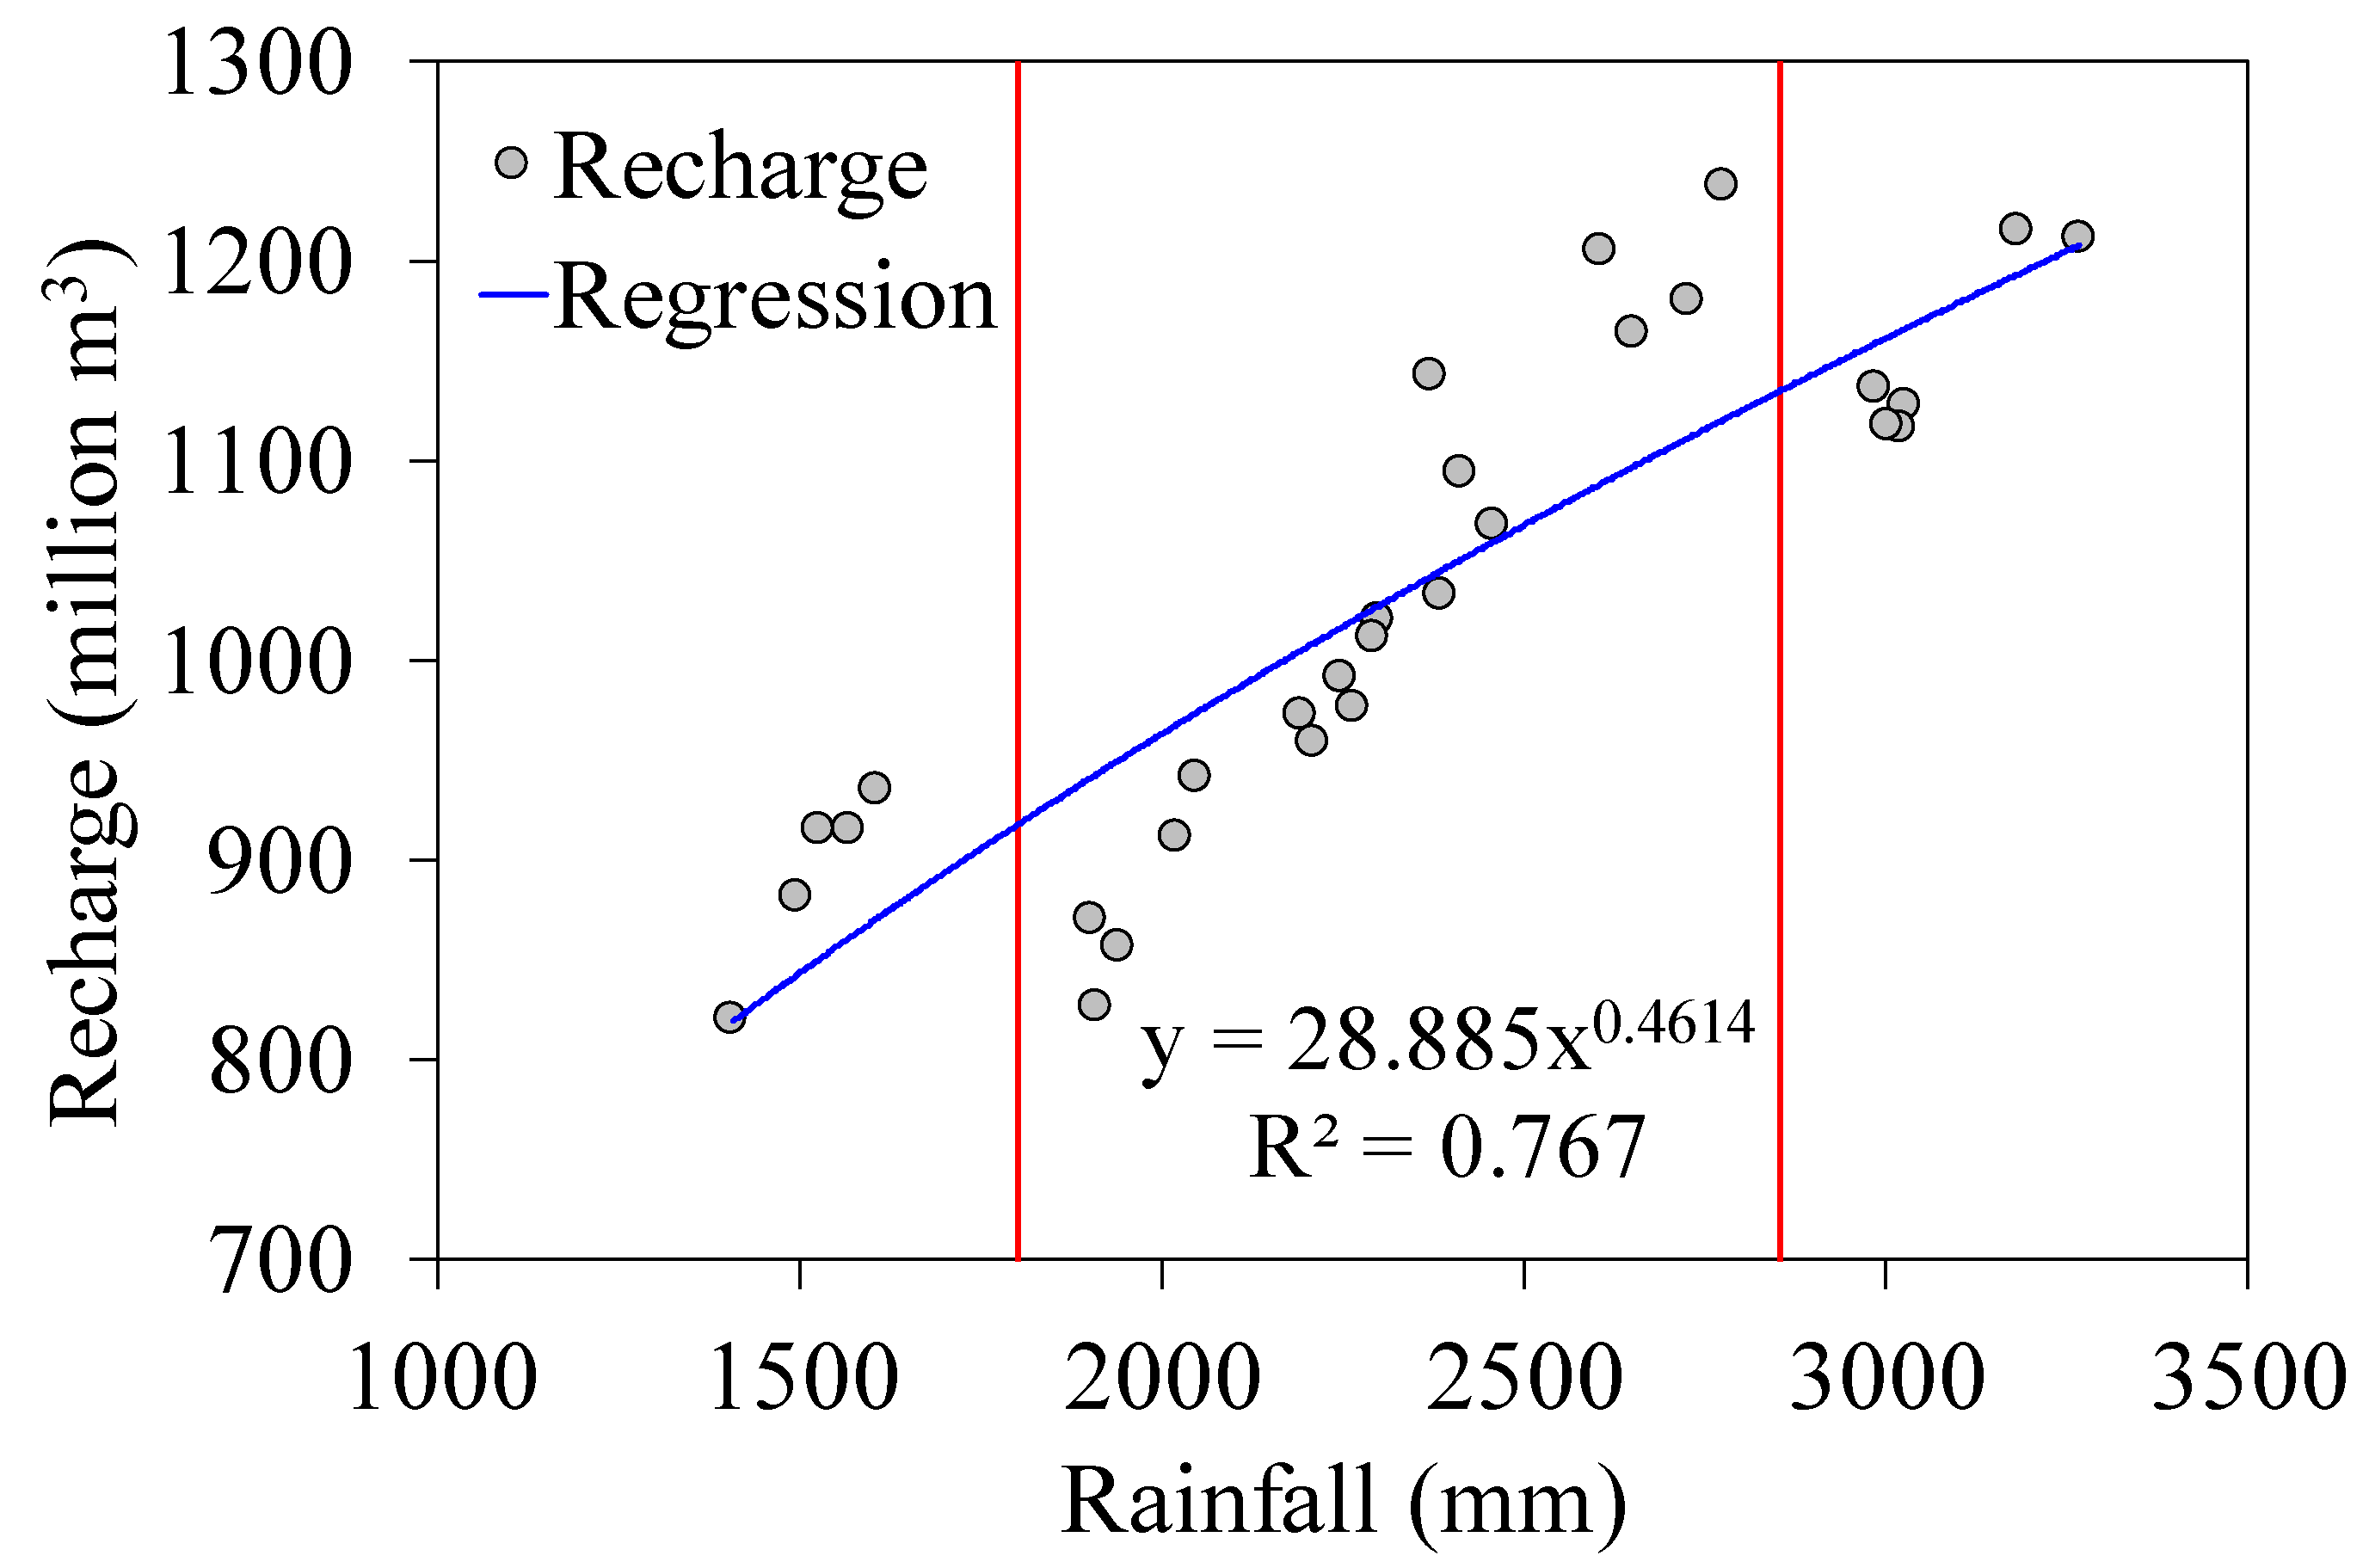
For convenient evaluation, the groundwater recharge quantities were calculated based on the rainfall quantity in each year in the assessment period. The results for the Choushui River alluvial fan are shown in Figure 8. The following regression equation can be used to evaluate the recharge quantity under a given rainfall quantity:
where CRAF indicates the Choushui River alluvial fan. The unit for groundwater recharge is million m3/year and that of rainfall quantity is mm/year. The recharge quantity increases with rainfall quantity, although the recharge rate is small in a wet year. This equation can be used to approximately evaluate the groundwater recharge for a given rainfall quantity for dry, normal, and wet years in the Choushui River alluvial fan.
Recharge quantity (CRAF) = 28.885 × Rainfall quantity0.4614
The same procedure was applied to the other groundwater regions in Taiwan. The following equations for groundwater recharge estimation were obtained:
where the abbreviations in brackets indicate the groundwater regions (see Table 1). These equations allow researchers to approximately calculate the groundwater recharge quantity for a given annual rainfall quantity in a specific region.
Recharge quantity (TPB) = 0.7766 × Rainfall quantity0.6556
Recharge quantity (TZT) = 1.3198 × Rainfall quantity0.7215
Recharge quantity (HMR) = 2.7923 × Rainfall quantity0.5876
Recharge quantity (TCR) = 1.6357 × Rainfall quantity0.7569
Recharge quantity (CNP) = 1.1782 × Rainfall quantity0.8128
Recharge quantity (PTP) = 9.0910 × Rainfall quantity0.5507
Recharge quantity (LYP) = 0.2973 × Rainfall quantity0.8769
Recharge quantity (HTLV) = 0.9427 × Rainfall quantity0.8282
Recharge quantity (HCP) = 0.0184 × Rainfall quantity0.9465
4.2. Groundwater Recharge under Climate Scenarios
To assess the groundwater recharge quantity under the effect of climate change using the stable baseflow method, the river discharge under the climate scenarios is required. The modified HBV model was adopted to simulate the river discharge under the climate scenarios. The climate data were generated using spatial and temporal downscaling techniques from GCMs, with variations in air temperature and rainfall quantity. The analysis results for the Choushui River alluvial fan are illustrated below as an example. The results for the ten groundwater regions are listed at the end for comparison and discussion.
4.2.1. Rainfall–Runoff Assessment
Nine GCMs in the A1B scenario were adopted in this study as climate scenarios. The number of grids for the area of the Choushui River alluvial fan was 122, 123, 124, 125, 135, 136, 137, 138, 151, and 152 (Figure 3). The grids were spatially downscaled by the TCCIP, with a resolution of 25 km × 25 km. The mean and standard deviation of air temperature and rainfall quantity in each month were calculated (e.g., Figure 4b,c). The climate scenarios were defined as baseline, A1B-S0, A1B-S1, and A1B-S2. Table 5 shows the monthly rainfall and air temperature with one standard deviation variations in the Choushui River watershed. The climate data were input into the weather generation model to assess the daily climate data, and then the results were input into the modified HBV model to estimate the daily river discharge. The hydrological model has data calibration and data simulation steps. The former adopts the observed historical data to calibrate the hydrological model and the latter uses the calibrated model to predict the river discharge quantities with the given climate scenarios.
Calibration of Modified HBV Model
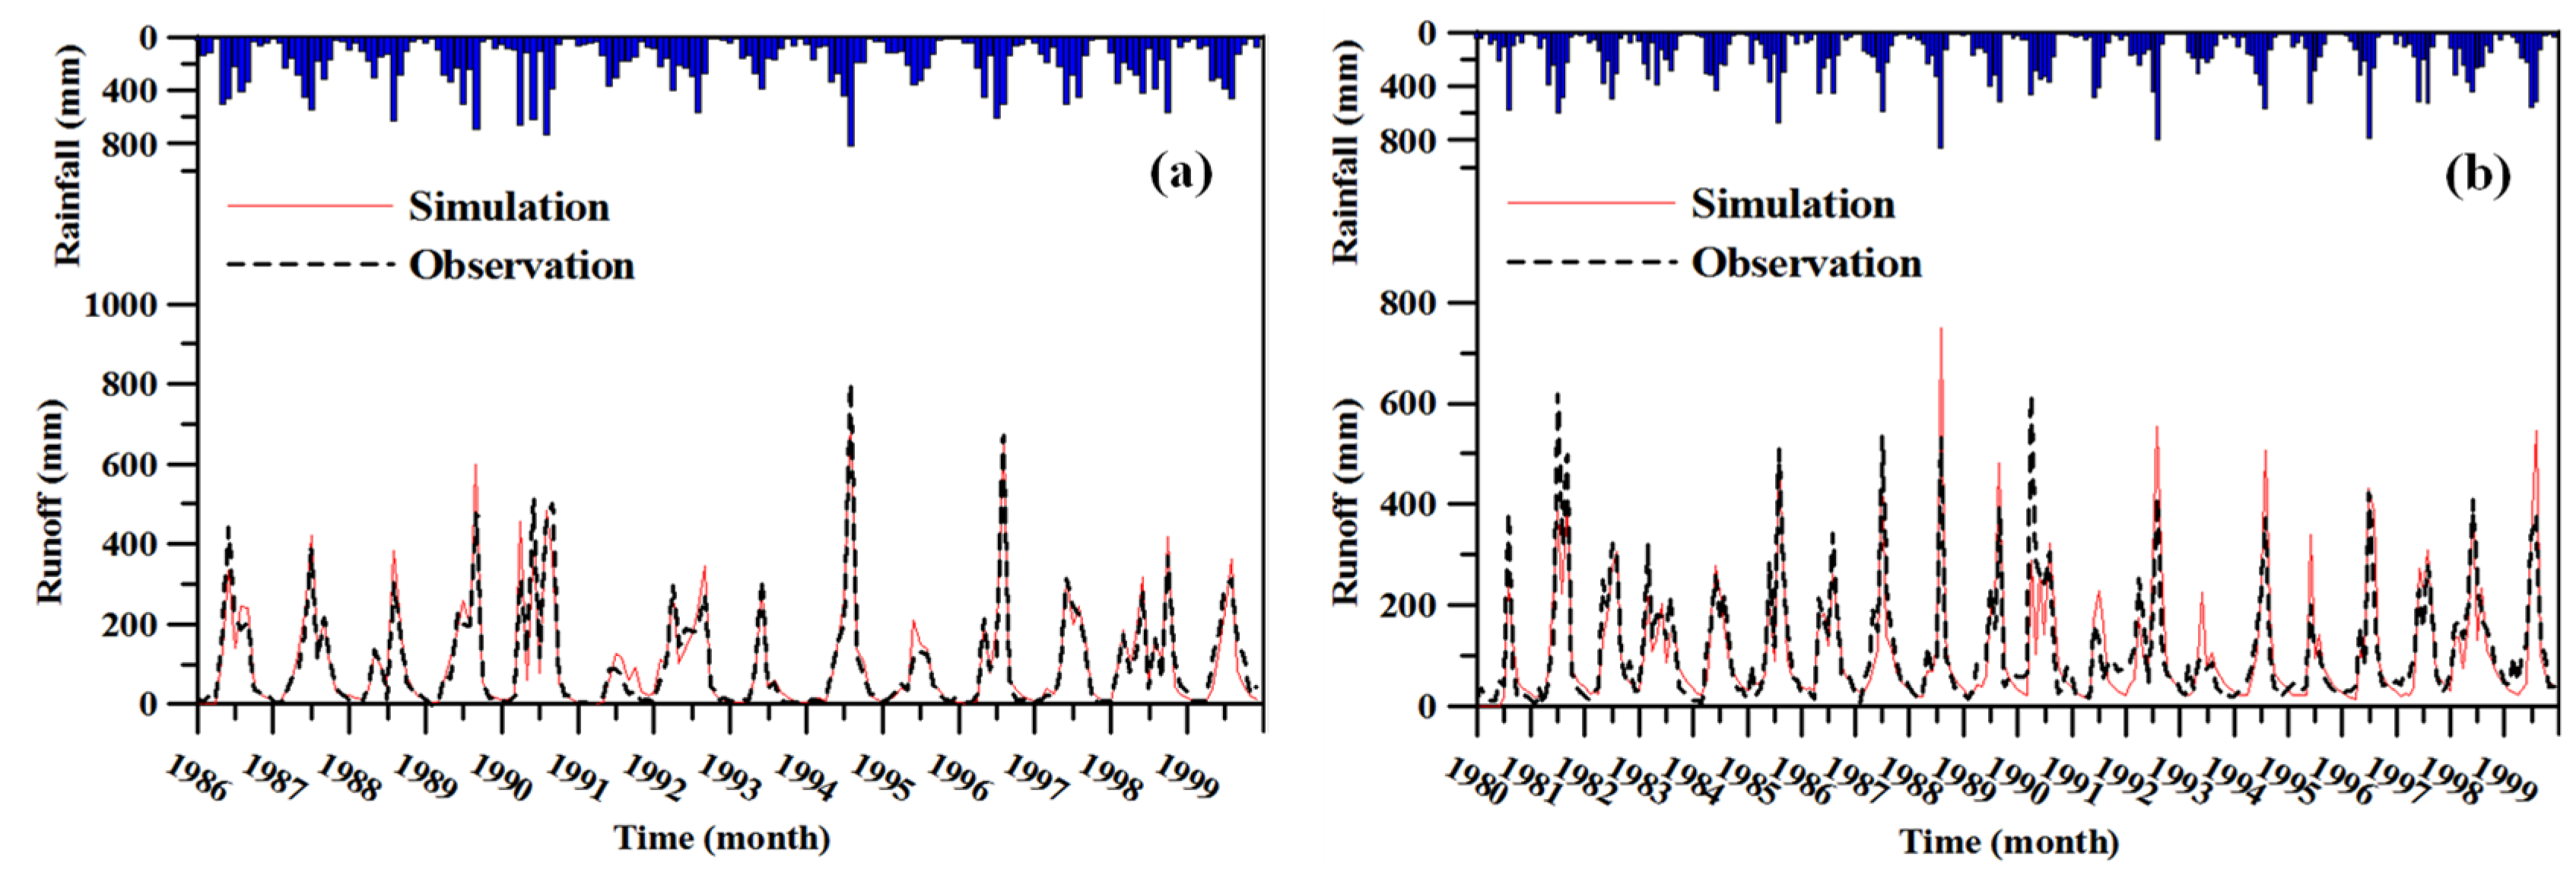
The calibration results of river discharge in the Choushui River and Beigang River are shown in Figure 9, with the calibrated parameters and model evaluation index listed in Table 6 and Table 7, respectively. The simulation results fit well with the observation data, especially in the Choushui River watershed. Both the peak and low quantities of the simulation results and observations perfectly match each other in the Choushui River watershed. In the Beigang River watershed, the peak quantities do not perfectly match at a later time. The simulation results are higher than the observation data.
Simulation of Modified HBV Model
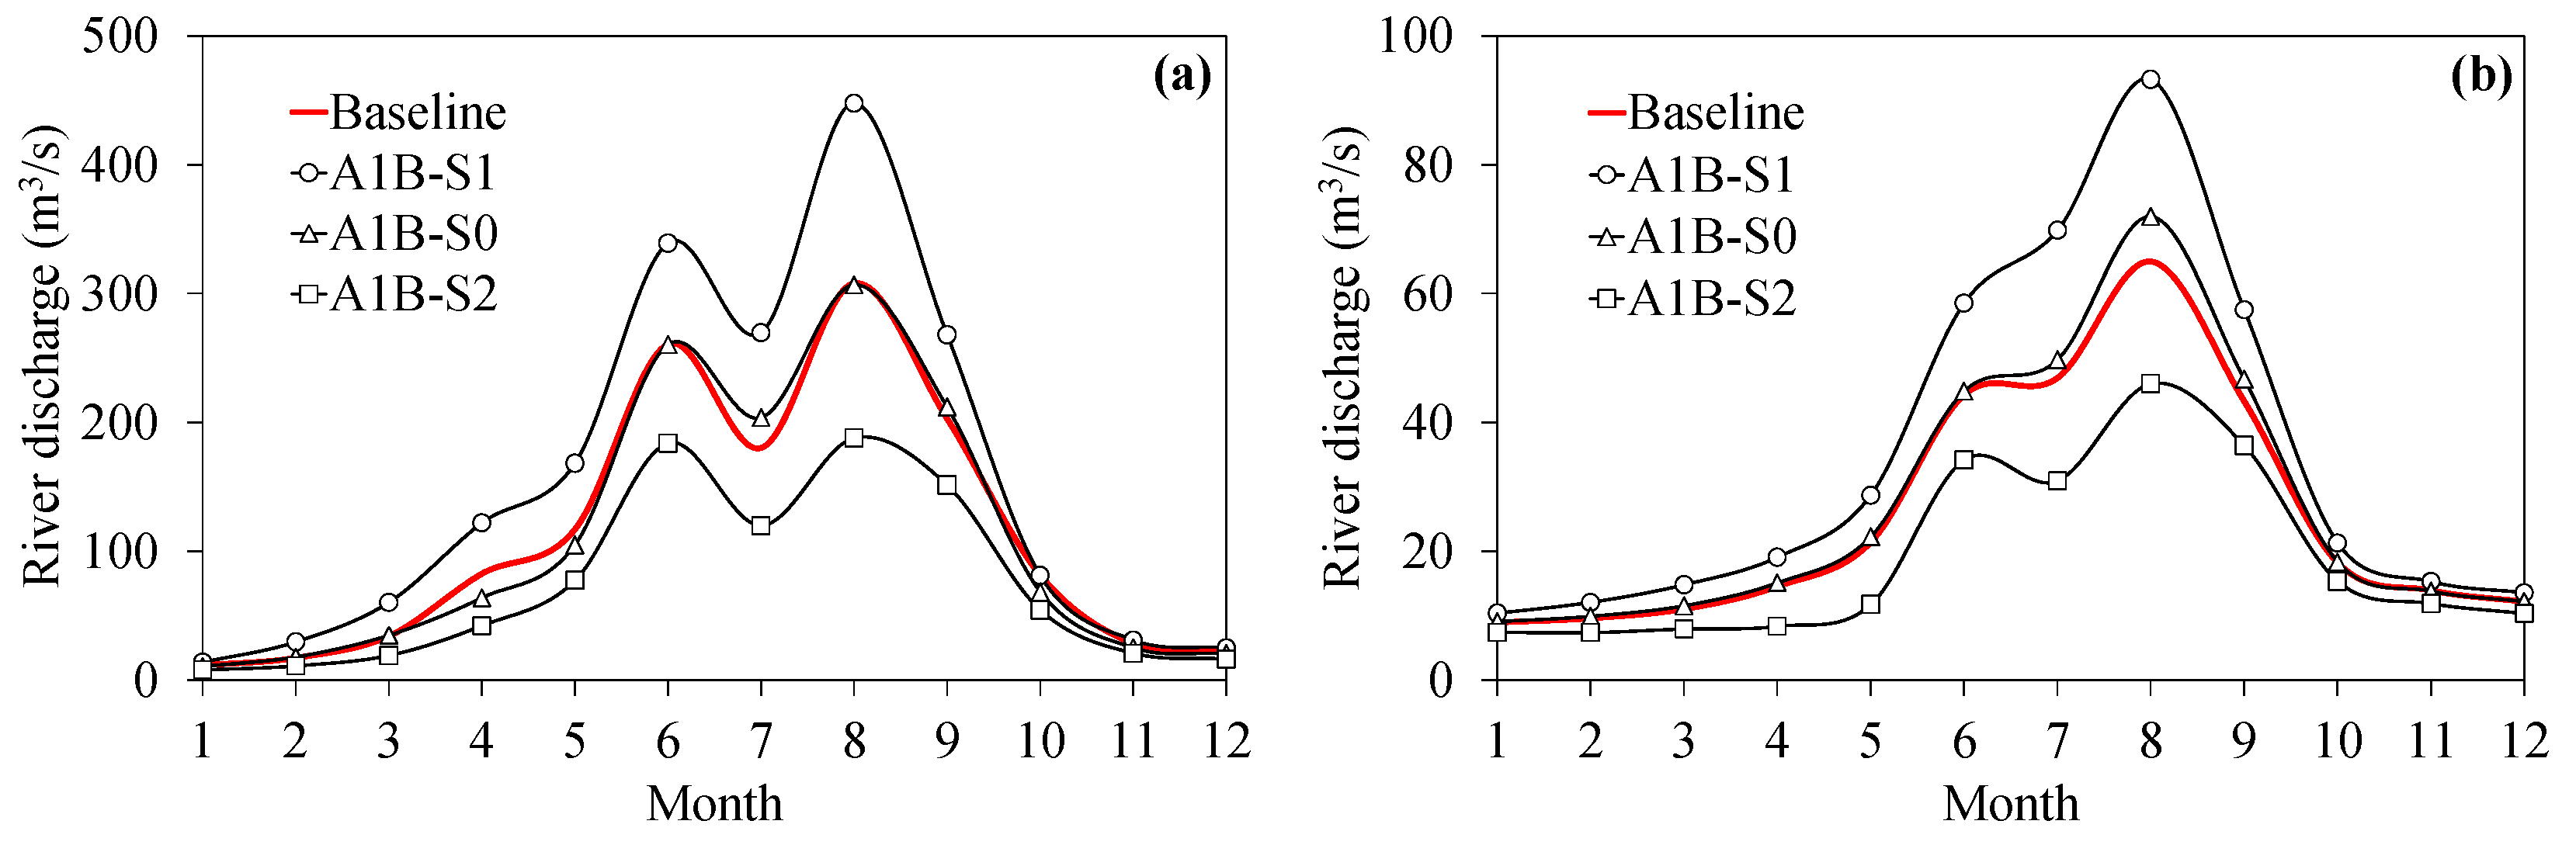
The parameters obtained from the calibration were input into the modified HBV model to simulate the river discharge quantities, with climate data generated by the downscaled model. The simulated river discharge included 200-year results to represent the climate situation in the period 2020–2039. Based on the observed historical data, the daily river discharge quantities could be calculated for the period 2020–2039. The statistical results for monthly baseline, A1B-S0, A1B-S1, and A1B-S2 for the Choushui River and Beigang River are shown in Figure 10.
4.2.2. Groundwater Recharge under Climate Change
Using the same procedure as that in the previous section, the baseflow separation, stable baseflow analysis, recharge rate assessment, and recharge quantity calculation were performed. The results for groundwater recharge assessment under climate effects in the Choushui River alluvial fan are listed in Table 8. The recharge rates under the climate scenarios were 9.8% to 14.1%, and 27.6% to 43.6% for the Choushui River and Beigang River, respectively. The changes of recharge rate between the climate scenarios and the baseline scenario were around 2% and 8%, respectively. The variations are large in the Beigang River and small in the Choushui River due to the river discharge quantities being more stable in the Choushui River than in the Beigang River. The recharge quantities under the climate scenarios in the Choushui River alluvial fan ranged from 548.96 × 10⁶ to 1189.33 × 106 m3/year. Note that the results of the baseline scenario are not the same as those of the historical data because the former were also obtained from the simulation results of 200 years in the hydrological model. To provide the same baseline for comparison, the results in Table 8 are used for the impact assessment in the following section. The effects of climate change on groundwater recharge in the ten groundwater regions in Taiwan are listed in Table 9.
4.2.3. Climate Change Impact
The climate change impact on groundwater recharge is defined as the change between the recharge quantity for the climate scenarios (under climate change conditions) and that for the baseline scenario (based on historical observed climate conditions). For example, the groundwater recharge quantity under the baseline scenario was 835.5 × 10⁶ m3/year in the Choushui River alluvial fan, and those under the A1B-S1 and A1B-S2 scenarios were 1189.3 and 549.0 × 10⁶ m3/year, respectively, as listed in Table 9. Therefore, the climate change impacts were 353.9 and −286.5 × 10⁶ m3/year, respectively. A positive (negative) value indicates an increased (decreased) quantity. The impact rate can be calculated as the impact quantity divided by the baseline quantity, and is presented as a percentage. Therefore, the impact rates of climate change on groundwater recharge in the Choushui River alluvial fan were 42.4% and −34.3%, respectively. These results indicate that climate change could increase groundwater recharge by 42.4% or decrease it by 34.3% in the Choushui River alluvial fan under the adopted climate scenarios. Using the same procedure, the climate change impact and impact rate were calculated for the ten groundwater regions in Taiwan. The results are listed in Table 9.
From the assessment results, the hydrological conditions under the climate scenarios could on average increase groundwater recharge in Taiwan by 32.6% or decrease it by 28.9%. However, the influences are different in different regions in Taiwan; they depend on the climate and hydrological conditions. For groundwater recharge, the decreased quantity is greater than the increased quantity in Taoyuan-Zhongli Tableland, Pingtung Plain, and Hengchun Plains, whereas these quantities are similar in the Hua-Tung Longitudinal Valley Area. The other regions have an increased quantity that is larger than the decreased quantity. There is no significant pattern for the distribution of climate change effects in Taiwan. Accordingly, climate scenarios can increase or decrease groundwater recharge in different regions in Taiwan. The effects are not always negative. This information can provide Taiwan’s government with a reference for water resource management.
5. Conclusions
The stable baseflow concept was applied in this study to assess the climate change impact on groundwater resources. Historical data and climate change scenarios in ten groundwater regions in Taiwan were used to assess the groundwater recharge based on the proposed method. The net recharge rates of rainfall in wet, normal, and dry years were calculated. Regression equations between rainfall and groundwater recharge were developed for the ten groundwater regions to allow recharge evaluation. Considering the climate change scenarios, groundwater recharge within the period 2020–2039 in the ten groundwater regions was estimated. Under the set conditions, the climate change effects in different groundwater regions in Taiwan were different. The percentage change of groundwater recharge ranged from an increase of 20.9% to a decrease of 54.6% and varied among regions, depending on the climate and hydrological conditions. Not all impacts of climate change were negative. This study proposed a method for quantifying groundwater recharge under climate scenarios. This method can be applied to different countries. The study results provide important information for strategic development in groundwater resource management.
Author Contributions
Conceptualization, S.-J.W. and C.-H.L.; methodology, S.-J.W.; software, H.-W.T.; validation, S.-J.W. and H.-W.T.; formal analysis, C.-F.Y. and Y.F.C.; investigation, C.-F.Y. and Y.F.C.; resources, C.-H.L.; data curation, C.-H.L.; writing—original draft preparation, S.-J.W.; writing—review and editing, S.-J.W.; visualization, S.-J.W.; supervision, S.-J.W. and C.-H.L.; project administration, C.-H.L.; funding acquisition, C.-H.L. and S.-J.W. All authors have read and agreed to the published version of the manuscript.
Funding
This research was funded by the Water Resources Agency, MOEA, Taiwan, under grants MOEAWRA 1030239 and MOEAWRA 1040059, and the Ministry of Science and Technology, Taiwan, under grants MOST 106-2116-M-008-023-MY3, MOST 108-2638-E-008-001-MY2, and MOST 109-2116-M-008-016.
Informed Consent Statement
Not applicable.
Data Availability Statement
Hydrological data (precipitation and river discharge) of the Taiwan WRA were collected from the website https://gweb.wra.gov.tw/Hydroinfo/ (accessed on 21/4/2021). Unfortunately, this website has no English version. The Taiwan WRA does not currently release raw data for public use. Users can only see time series graphs on the website. Weather data (precipitation and air temperature) of the Taiwan CWB were collected from the website https://e-service.cwb.gov.tw/HistoryDataQuery/ (accessed on 15 April 2021). Unfortunately, this website has no English version. The data can be searched and copied. The climate scenarios were collected from the website https://tccip.ncdr.nat.gov.tw/index_eng.aspx (accessed on 15 April 2021). Account registration is required to collect the data.
Acknowledgments
The authors would like to thank the Taiwan Climate Change Projection Information and Adaptation Knowledge Platform (TCCIP) (official website: https://tccip.ncdr.nat.gov.tw/ (accessed on 15 April 2021)) for providing downscaled projection data under various climate change scenarios, Pao-Shan Yu for guiding the operation of the hydrological and weather generation models, and Duc-Huy Tran and Minh-Quan Dang for helping redraw some of the figures.
Conflicts of Interest
The authors declare no conflict of interest.
References
- Hwang, J.-S. The development and management policy of water resources in Taiwan. Paddy Water Environ. 2003, 1, 115–120. [Google Scholar] [CrossRef]
- Yeh, H.-F.; Hsu, H.-L. Using the Markov Chain to Analyze Precipitation and Groundwater Drought Characteristics and Linkage with Atmospheric Circulation. Sustainability 2019, 11, 1817. [Google Scholar] [CrossRef] [Green Version]
- Wang, H.-W.; Lin, C.-W.; Yang, C.-Y.; Ding, C.-F.; Hwung, H.-H.; Hsiao, S.-C. Assessment of Land Subsidence and Climate Change Impacts on Inundation Hazard in Southwestern Taiwan. Irrig. Drain. 2018, 67, 26–37. [Google Scholar] [CrossRef]
- Wang, S.-J.; Lee, C.-H.; Chen, J.-W.; Hsu, K.-C. Combining gray system and poroelastic models to investigate subsidence problems in Tainan, Taiwan. Environ. Earth Sci. 2015, 73, 7237–7253. [Google Scholar] [CrossRef]
- Holman, I.P. Climate change impacts on groundwater recharge- uncertainty, shortcomings, and the way forward? Hydrogeol. J. 2005, 14, 637–647. [Google Scholar] [CrossRef] [Green Version]
- Li, F.; Zhang, G.; Xu, Y.J. Assessing Climate Change Impacts on Water Resources in the Songhua River Basin. Water 2016, 8, 420. [Google Scholar] [CrossRef] [Green Version]
- McCallum, J.L.; Crosbie, R.S.; Walker, G.R.; Dawes, W.R. Impacts of climate change on groundwater in Australia: A sensitivity analysis of recharge. Hydrogeol. J. 2010, 18, 1625–1638. [Google Scholar] [CrossRef]
- Petpongpan, C.; Ekkawatpanit, C.; Kositgittiwong, D. Climate Change Impact on Surface Water and Groundwater Recharge in Northern Thailand. Water 2020, 12, 1029. [Google Scholar] [CrossRef] [Green Version]
- Pitz, C.F. Predicted Impacts of Climate Change on Groundwater Resources of Washington State; Publication No. 16-03-006; Department of Ecology: Washington, DC, USA, 2016. [Google Scholar]
- Taye, M.T.; Dyer, E.; Hirpa, F.A.; Charles, K. Climate Change Impact on Water Resources in the Awash Basin, Ethiopia. Water 2018, 10, 1560. [Google Scholar] [CrossRef] [Green Version]
- Chiang, T.Y.; Perng, Y.H.; Liou, L.E. Impact and Adaptation Strategies in Response to Climate Change on Taiwan’s Water Resources. Appl. Mech. Mater. 2016, 858, 335–341. [Google Scholar] [CrossRef]
- Chu, T.-Y.; Lee, J.-L.; Huang, W.-C. Impact of climate change on Shihmen reservoir water supply. J. Mar. Sci. Technol. 2016, 24, 1093–1104. [Google Scholar] [CrossRef]
- Hsu, K.-C.; Wang, C.-H.; Chen, K.-C.; Chen, C.-T.; Ma, K.-W. Climate-induced hydrological impacts on the groundwater system of the Pingtung Plain, Taiwan. Hydrogeol. J. 2007, 15, 903–913. [Google Scholar] [CrossRef]
- Huang, W.-C.; Chiang, Y.; Wu, R.-Y.; Lee, J.-L.; Lin, S.-H. The Impact of Climate Change on Rainfall Frequency in Taiwan. Terr. Atmos. Ocean. Sci. 2011, 23, 553. [Google Scholar] [CrossRef] [Green Version]
- Tsai, A.-Y.; Huang, W.-C. Impact of Climate Change on Water Resources in Taiwan. Terr. Atmos. Ocean. Sci. 2011, 22, 507. [Google Scholar] [CrossRef] [Green Version]
- Yu, P.-S.; Yang, T.-C.; Wu, C.-K. Impact of climate change on water resources in southern Taiwan. J. Hydrol. 2002, 260, 161–175. [Google Scholar] [CrossRef]
- Allen, D.M.; Cannon, A.J.; Toews, M.W.; Scibek, J. Variability in simulated recharge using different GCMs. Water Resour. Res. 2010, 46, 3. [Google Scholar] [CrossRef]
- Crosbie, R.S.; Scanlon, B.R.; Mpelasoka, F.S.; Reedy, R.C.; Gates, J.B.; Zhang, L. Potential climate change effects on groundwater recharge in the High Plains Aquifer, USA. Water Resour. Res. 2013, 49, 3936–3951. [Google Scholar] [CrossRef] [Green Version]
- Portmann, F.T.; Döll, P.; Eisner, S.; Flörke, M. Impact of climate change on renewable groundwater resources: Assessing the benefits of avoided greenhouse gas emissions using selected CMIP5 climate projections. Environ. Res. Lett. 2013, 8, 024023. [Google Scholar] [CrossRef]
- Wada, Y.; Van Beek, L.P.H.; Van Kempen, C.M.; Reckman, J.W.T.M.; Vasak, S.; Bierkens, M.F.P. Global depletion of groundwater resources. Geophys. Res. Lett. 2010, 37, 37. [Google Scholar] [CrossRef] [Green Version]
- Wu, W.-Y.; Lo, M.-H.; Wada, Y.; Famiglietti, J.S.; Reager, J.T.; Yeh, P.J.-F.; Ducharne, A.; Yang, Z.-L. Divergent effects of climate change on future groundwater availability in key mid-latitude aquifers. Nat. Commun. 2020, 11, 1–9. [Google Scholar] [CrossRef]
- Ke, K.; Tung, C.; Tan, C.; Yu, P.-S. Climate Change Impact on Groundwater Recharge: A Case Study in Taiwan. In Proceedings of the 2008 American Geophysical Union (AGU) Fall Meeting, San Francisco, CA, USA, 15–19 December 2008. [Google Scholar]
- Crosbie, R.S.; Mpelasoka, F.S.; Barron, O.; Summerell, G.K.; Dawes, W.R.; Charles, S.P.; Aryal, S. Differences in future recharge estimates due to GCMs, downscaling methods and hydrological models. Geophys. Res. Lett. 2011, 38, 11406. [Google Scholar] [CrossRef]
- Le Maitre, D.C.; Colvin, C.A. Assessment of the contribution of groundwater discharges to rivers using monthly flow statistics and flow seasonality. Water SA 2018, 34, 549. [Google Scholar] [CrossRef] [Green Version]
- Chen, W.-P.; Lee, C.-H. Estimating ground-water recharge from streamflow records. Environ. Earth Sci. 2003, 44, 257–265. [Google Scholar] [CrossRef]
- Cartwright, I.; Gilfedder, B.S.; Hofmann, H. Contrasts between estimates of baseflow help discern multiple sources of water contributing to rivers. Hydrol. Earth Syst. Sci. 2014, 18, 15–30. [Google Scholar] [CrossRef] [Green Version]
- Lee, C.-H.; Chen, W.-P.; Lee, R.-H. Estimation of groundwater recharge using water balance coupled with base-flow-record estimation and stable-base-flow analysis. Environ. Earth Sci. 2006, 51, 73–82. [Google Scholar] [CrossRef]
- Lee, K.K.; Risley, J.C. Estimates of ground-water recharge, base flow, and stream reach gains and losses in the Willamette River basin, Oregon. Water Resour. Investig. Rep. 2002. [Google Scholar] [CrossRef]
- Risser, D.W.; Gburek, W.J.; Folmar, G.J. Comparison of methods for estimating ground-water recharge and base flow at a small watershed underlain by fractured bedrock in the Eastern United States. Sci. Investig. Rep. 2005, 31, 5038. [Google Scholar] [CrossRef]
- Zomlot, Z.; Verbeiren, B.; Huysmans, M.; Batelaan, O. Spatial distribution of groundwater recharge and base flow: Assessment of controlling factors. J. Hydrol. Reg. Stud. 2015, 4, 349–368. [Google Scholar] [CrossRef] [Green Version]
- Li, B.; Rodell, M.; Sheffield, J.; Wood, E.; Sutanudjaja, E. Long-term, non-anthropogenic groundwater storage changes simulated by three global-scale hydrological models. Sci. Rep. 2019, 9, 1–13. [Google Scholar] [CrossRef] [Green Version]
- Mau, D.P.; Winter, T.C. Estimating Ground-Water Recharge from Streamflow Hydrographs for a Small Mountain Watershed in a Temperate Humid Climate, New Hampshire, USA. Ground Water 1997, 35, 291–304. [Google Scholar] [CrossRef]
- Rutledge, A.T. Methods of using river discharge records for estimating total and effective recharge in the Appalachian Valley and Ridge, Piedmont, and Blue Ridge physiographic provinces. In Regional Aquifer Systems of the United States, Aquifers of the Southern and Eastern States; Hotchkiss, W.R., Johnson, A.I., Eds.; American Water Resources Association Monograph Series; American Water Resources Association: Middleburg, VA, USA, 1992; Volume 17, pp. 59–73. [Google Scholar]
- Barnes, B.S. The structure of discharge-recession curves. Trans. Am. Geophys. Union 1939, 20, 721–725. [Google Scholar] [CrossRef]
- Fan, Y.; Chen, Y.; Liu, Y.; Li, W. Variation of baseflows in the headstreams of the Tarim River Basin during 1960–2007. J. Hydrol. 2013, 487, 98–108. [Google Scholar] [CrossRef]
- Rutledge, A.T. Computer Programs for Describing the Recession of Ground-Water Discharge and for Estimating Mean Ground-Water Recharge and Discharge from Streamflow Data-Update; U.S. Geological Survey Water-Resources Investigations Report 98-4148; U.S. Geological Survey: Reston, VA, USA, 1998; p. 43. [Google Scholar]
- Rutledge, A.T. Computer Programs for Describing the Recession of Groundwater Discharge and for Estimating Mean Ground-Water recharge and Discharge from Streamflow Records; U.S. geological survey Water resources investigations report 93-4121; U.S. Geological Survey: Reston, VA, USA, 1993; p. 45. [Google Scholar]
- Zektser, I.S. Principles of regional assessment and mapping of natural groundwater resources. Environ. Earth Sci. 2002, 42, 270–274. [Google Scholar] [CrossRef]
- Yu, P.-S.; Yang, T.-C.; Kuo, C.-M.; Tseng, H.-W.; Chen, S.-T. Climate Change Impacts on Streamflow Drought: A Case Study in Tseng-Wen Reservoir Catchment in Southern Taiwan. Climate 2014, 3, 42–62. [Google Scholar] [CrossRef] [Green Version]
- Chu, J.-L.; Kang, H.; Tam, C.-Y.; Park, C.-K.; Chen, C.-T. Seasonal forecast for local precipitation over northern Taiwan using statistical downscaling. J. Geophys. Res. Space Phys. 2008, 113, 12118. [Google Scholar] [CrossRef] [Green Version]
- Lin, S.-H.; Liu, C.-M.; Huang, W.-C.; Lin, S.-S.; Yen, T.-H.; Wang, H.-R.; Kuo, J.-T.; Lee, Y. Developing a yearly warning index to assess the climatic impact on the water resources of Taiwan, a complex-terrain island. J. Hydrol. 2010, 390, 13–22. [Google Scholar] [CrossRef]
- Pickering, N.B.; Stedinger, J.R.; Haith, D.A. Weather Input for Nonpoint?Source Pollution Models. J. Irrig. Drain. Eng. 1988, 114, 674–690. [Google Scholar] [CrossRef]
- Selker, J.S.; Haith, D.A. Development and Testing of Single-Parameter Precipitation Distributions. Water Resour. Res. 1990, 26, 2733–2740. [Google Scholar] [CrossRef] [Green Version]
- Bergström, S. Development and Application of a Conceptual Runoff Model for Scandinavian Catchments; SMHI Norr-köping: Norrköping, Sweden, 1976. [Google Scholar]
- Bergström, S. The HBV Model—Its Structure and Applications; SMHI Norr-köping: Norrköping, Sweden, 1992. [Google Scholar]
- Yu, P.-S.; Yang, T.-C. Fuzzy multi-objective function for rainfall-runoff model calibration. J. Hydrol. 2000, 238, 1–14. [Google Scholar] [CrossRef]
- Water Resources Agency. Hydrological Year Book of Taiwan, Republic of China 2019; Part 1-Rainfall; Water Resources Agency: Taipei, Taiwan, 2020. (In Chinese) [Google Scholar]
- NOAA National Centers for Environmental Information, State of the Climate: Global Climate Report for Annual 2020, published online January 2021. Available online: https://www.ncdc.noaa.gov/sotc/global/202013 (accessed on 1 March 2021).
- Intergovernmental Panel on Climate Change (IPCC). Climate Change 2007—The Physical Science Basis; Fourth Assessment Report of the Intergovernmental Panel on Climate Change; Cambridge University Press: Cambridge, UK, 2007. [Google Scholar]
- National Science and Technology Center for Disaster Reduction (NCDR). Taiwan’s Climate Change Estimation and Information Platform Construction Plan (2/3); National Science Council Report; NCDR: Taipei, Taiwan, 2011. (In Chinese) [Google Scholar]
- Water Resources Agency. The Investigation of Groundwater Potential Variation under Climate Change in the Nine Groundwater Resources Regions of Taiwan (1/2); Project report; Water Resources Agency: Taipei, Taiwan, 2014. (In Chinese) [Google Scholar]
Figure 1.
Flowchart used for the assessment of climate change impact on groundwater recharge.

Figure 2.
Distribution of groundwater regions and adopted river gauge stations in Taiwan.

Figure 3.
Adopted river catchments and 25 km × 25 km grid distribution (red points) for the climate scenarios given by the TCCIP. The numbers beside the red dots are the data number provided by the TCCIP (data from National Science and Technology Center for Disaster Reduction, NCDR).
Figure 3.
Adopted river catchments and 25 km × 25 km grid distribution (red points) for the climate scenarios given by the TCCIP. The numbers beside the red dots are the data number provided by the TCCIP (data from National Science and Technology Center for Disaster Reduction, NCDR).

Figure 4.
(a) Monthly projections by 24 GCMs of rainfall. Monthly projections by nine GCMs of (b) rainfall, and (c) air temperature at Ziqiang Bridge in the A1B climate scenario.
Figure 4.
(a) Monthly projections by 24 GCMs of rainfall. Monthly projections by nine GCMs of (b) rainfall, and (c) air temperature at Ziqiang Bridge in the A1B climate scenario.

Figure 5.
Distribution of river gauge stations and watersheds in the Choushui River alluvial fan. The marked values indicate the baseflow index.
Figure 5.
Distribution of river gauge stations and watersheds in the Choushui River alluvial fan. The marked values indicate the baseflow index.

Figure 6.
Results of baseflow separation for (a) Zhangyun Bridge, (b) Xiluo, (c) Ziqiang Bridge, (d) Tuku Bridge, (e) Xikou, and (f) Beigang-2 in the Choushui River alluvial fan.
Figure 6.
Results of baseflow separation for (a) Zhangyun Bridge, (b) Xiluo, (c) Ziqiang Bridge, (d) Tuku Bridge, (e) Xikou, and (f) Beigang-2 in the Choushui River alluvial fan.

Figure 7.
Results of stable baseflow analysis for (a) Zhangyun Bridge, (b) Xiluo, (c) Ziqiang Bridge, (d) Tuku Bridge, (e) Xikou, and (f) Beigang-2 in the Choushui River alluvial fan.
Figure 7.
Results of stable baseflow analysis for (a) Zhangyun Bridge, (b) Xiluo, (c) Ziqiang Bridge, (d) Tuku Bridge, (e) Xikou, and (f) Beigang-2 in the Choushui River alluvial fan.

Figure 8.
Relationship between groundwater recharge and rainfall in the Choushui River alluvial fan.
Figure 8.
Relationship between groundwater recharge and rainfall in the Choushui River alluvial fan.

Figure 9.
Comparison of simulation and observation results of river discharge in (a) the Choushui River, and (b) Beigang River catchments.
Figure 9.
Comparison of simulation and observation results of river discharge in (a) the Choushui River, and (b) Beigang River catchments.

Figure 10.
Estimated monthly river discharge under various future climate conditions in (a) the Choushui River, and (b) Beigang River catchments.
Figure 10.
Estimated monthly river discharge under various future climate conditions in (a) the Choushui River, and (b) Beigang River catchments.


Table 1.
Number of observation stations in each groundwater region.
| Groundwater Region | Abbreviation | Climate Stations | Main Rivers | River Gauge Stations | Area (km2) |
|---|---|---|---|---|---|
| Taipei Basin | TPB | 9 | 1 | 27 | 395.5 |
| Taoyuan-Zhongli Tableland | TZT | 11 | 1 | 1 | 1074.3 |
| Hsin-Miao Region | HMR | 16 | 3 | 14 | 919.6 |
| Taichung Region | TCR | 14 | 3 | 19 | 1195.1 |
| Choushui River Alluvial Fan | CRAF | 9 | 2 | 16 | 2301.3 |
| Chianan Plain | CNP | 20 | 7 | 28 | 2527.7 |
| Pingtung Plain | PTP | 16 | 2 | 19 | 1059.5 |
| Lanyang Plain | LYP | 8 | 1 | 4 | 447.5 |
| Hua-Tung Longitudinal Valley | HTLV | 16 | 3 | 23 | 978.8 |
| Hengchun Plain | HCP | 4 | 1 | 1 | 113.4 |
| Total | 123 | 24 | 152 | 11,012.6 | |
Table 2.
Adopted river gauge stations in the Choushui River alluvial fan.
| Watershed | Station | TMX | YMY | Catchment Area (km2) | Monitoring Period |
|---|---|---|---|---|---|
| Choushui River | Zhangyun Bridge | 212,103.2 | 2,631,755 | 2906.32 | 1985–2012 |
| Xiluo | 195,616.5 | 2,635,602 | 2975.52 | 1968–2012 | |
| Ziqiang Bridge | 187,913.0 | 2,637,267 | 2988.88 | 1986–1999 | |
| Beigang River | Tuku Bridge | 189,892.4 | 2,620,065 | 253.22 | 1984–2012 |
| Xikou | 187,866.2 | 2,612,026 | 129.38 | 1972–2012 | |
| Beigang-2 | 177,833.8 | 2,606,983 | 597.46 | 1968–2012 |
Table 3.
Assessment results of baseflow index and recharge rate in the Choushui River alluvial fan.
| Watershed | Station | Baseflow Index (%) | Recharge Rate (%) |
|---|---|---|---|
| Choushui River | Zhangyun Bridge | 50.9 | 22.8 |
| Xiluo | 46.2 | 14.1 | |
| Ziqiang Bridge | 33.7 | 14.0 | |
| Beigang River | Tuku Bridge | 47.6 | 49.1 |
| Xikou | 54.5 | 12.8 | |
| Beigang-2 | 60.2 | 38.6 |
Table 4.
Catchment rainfall and recharge rate under various situations.
| Groundwater Region | River Gauge Station | Rainfall (mm)/Recharge Rate | ||
|---|---|---|---|---|
| Wet Year | Normal Year | Dry Year | ||
| Taipei Basin | >4317 | 2937–4317 | <2937 | |
| Wudu | 12.6% | 16.5% | 18.3% | |
| Xiulang | 11.9% | 12.5% | 12.7% | |
| Sanying Bridge | 2.6% | 3.5% | 3.9% | |
| Taoyuan-Zhongli Tableland | >2906 | 1838–2906 | <1838 | |
| Xinpu-2 | 16.9% | 19.5% | 22.3% | |
| Sanying Bridge | 3.1% | 3.4% | 4.1% | |
| Hsin-Miao Region | >2972 | 1814–2972 | < 1814 | |
| Jingguo Bridge | 11.1% | 13.6% | 16.2% | |
| Ping’an Bridge | 12.2% | 14.4% | 16.8% | |
| Beishi Bridge | 8.0% | 8.9% | 10.7% | |
| Taichung Region | >2947 | 1901–2947 | <1901 | |
| Yili | 6.1% | 7.8% | 13.5% | |
| Dadu Bridge | 24.1% | 25.7% | 26.8% | |
| Choushui River Alluvial Fan | >2852 | 1799–2852 | <1799 | |
| Ziqiang Bridge | 10.9% | 14.0% | 21.0% | |
| Beigang-2 | 36.2% | 38.6% | 40.6% | |
| Chianan Plain | >3132 | 1841–3132 | <1841 | |
| Suantou | 5.5% | 5.8% | 6.8% | |
| Yizhu | 16.6% | 17.3% | 19.4% | |
| Xinying | 9.2% | 9.3% | 10.3% | |
| Mashan Bridge | 2.2% | 2.7% | 4.1% | |
| Xinshi | 11.6% | 12.4% | 13.6% | |
| Nanxueng Bridge | 16.5% | 19.1% | 21.4% | |
| Pingtung Plain | >4088 | 2492–4088 | <2492 | |
| Jiuqutang | 17.0% | 23.0% | 26.3% | |
| Chaozhou | 23.5% | 29.4% | 36.4% | |
| Xinpi | 5.5% | 7.3% | 13.2% | |
| Lanyang Plain | >3613 | 2330–3613 | <2330 | |
| Lanyang Bridge | 23.9% | 24.7% | 26.7% | |
| Hua-Tung Longitudinal Valley | >3069 | 1979–3069 | <1979 | |
| Hualien Bridge | 30.5% | 31.7% | 32.9% | |
| Ruisui Bridge | 25.1% | 26.1% | 27.7% | |
| Taitung Bridge | 11.2% | 13.6% | 16.1% | |
| Hengchun Plain | >3326 | 2299–3326 | <2299 | |
| Shimen Bridge | 10.5% | 10.7% | 10.9% | |
Table 5.
Representative future climate variations of rainfall and air temperature in the Choushui River watershed.
Table 5.
Representative future climate variations of rainfall and air temperature in the Choushui River watershed.
| Month | Rainfall (%) | Air Temperature (°C) | ||||
|---|---|---|---|---|---|---|
| Mean | Mean + σ | Mean − σ | Mean | Mean + σ | Mean − σ | |
| 1 | 8.57 | 38.65 | −21.52 | 0.92 | 1.35 | 0.48 |
| 2 | 12.38 | 40.31 | −15.55 | 0.75 | 1.20 | 0.30 |
| 3 | −1.64 | 23.21 | −26.49 | 0.67 | 1.07 | 0.27 |
| 4 | −4.65 | 11.83 | −21.14 | 0.70 | 0.95 | 0.45 |
| 5 | 0.87 | 13.07 | −11.34 | 0.75 | 1.09 | 0.42 |
| 6 | 4.96 | 14.87 | −4.95 | 0.76 | 1.04 | 0.49 |
| 7 | 9.65 | 38.51 | −19.21 | 0.87 | 1.18 | 0.56 |
| 8 | 1.20 | 22.17 | −19.78 | 0.79 | 1.20 | 0.38 |
| 9 | 1.36 | 14.95 | −12.23 | 0.86 | 1.17 | 0.54 |
| 10 | −6.88 | 16.69 | −30.44 | 0.72 | 1.01 | 0.43 |
| 11 | −3.68 | 22.59 | −29.94 | 0.82 | 1.16 | 0.47 |
| 12 | 2.78 | 23.73 | −18.17 | 0.84 | 1.25 | 0.43 |
Table 6.
Parameter calibration results for the modified HBV model in the Choushui River alluvial fan.
Table 6.
Parameter calibration results for the modified HBV model in the Choushui River alluvial fan.
| Catchment | FC | β | LP/FC | PERC | UZL | K0 | K1 | K2 | Ce |
|---|---|---|---|---|---|---|---|---|---|
| mm | — | — | mm | mm | day−1 | day−1 | day−1 | — | |
| Choushui River | 259.094 | 1.242 | 0.003 | 1.267 | 200 | 0.337 | 0.294 | 0.012 | 1.570 |
| Beigang River | 210.084 | 9.999 | 0.005 | 3.222 | 85.42 | 0.152 | 0.026 | 0.008 | 0.501 |
Table 7.
Evaluation index of the modified HBV model in the Choushui River alluvial fan.
| Catchment | Flow Ratio | Correlation Coefficient | Root-Mean-Squared Error | Coefficient of Efficiency |
|---|---|---|---|---|
| Rflow | CC | RMSE | CE | |
| Choushui River | 0.93 | 0.90 | 3.53 | 0.81 |
| Beigang River | 0.94 | 0.71 | 5.77 | 0.51 |
Table 8.
Groundwater recharge calculation in the Choushui River alluvial fan under various climate scenarios.
Table 8.
Groundwater recharge calculation in the Choushui River alluvial fan under various climate scenarios.
| Scenario | River Watershed | Recharge Rate (%) | Rainfall (mm) | Control Area (km2) | Local Recharge (×106 m3/year) | Regional Recharge (×106 m3/year) |
|---|---|---|---|---|---|---|
| Baseline | Choushui River | 12.4 | 2205 | 1725 | 469.97 | 835.47 |
| Beigang River | 35.8 | 1774 | 576 | 365.50 | ||
| A1B-S0 | Choushui River | 11.1 | 2264 | 1725 | 434.73 | 808.28 |
| Beigang River | 35.5 | 1829 | 576 | 373.55 | ||
| A1B-S1 | Choushui River | 14.1 | 2683 | 1725 | 651.24 | 1189.33 |
| Beigang River | 43.6 | 2143 | 576 | 538.09 | ||
| A1B-S2 | Choushui River | 9.8 | 1844 | 1725 | 311.83 | 548.96 |
| Beigang River | 27.6 | 1490 | 576 | 237.13 |
Table 9.
Impact analysis of groundwater recharge under the effects of climate change in nine groundwater regions.
Table 9.
Impact analysis of groundwater recharge under the effects of climate change in nine groundwater regions.
| Groundwater Region | Baseline | Climate Scenario | Climate Impact | Impact Rate (%) | |||
|---|---|---|---|---|---|---|---|
| A1B-S1 | A1B-S2 | A1B-S1 | A1B-S2 | A1B-S1 | A1B-S2 | ||
| TPB | 124.4 | 167.2 | 100.0 | 42.8 | −24.4 | 34.4 | −19.6 |
| TZT | 327.0 | 395.3 | 225.0 | 68.3 | −102.0 | 20.9 | −31.2 |
| HMR | 249.3 | 362.4 | 152.8 | 113.2 | −96.4 | 45.4 | −38.7 |
| TCR | 546.4 | 695.3 | 409.1 | 148.9 | −137.3 | 27.3 | −25.1 |
| CRAF | 835.5 | 1189.3 | 549.0 | 353.9 | −286.5 | 42.4 | −34.3 |
| CNP | 634.6 | 827.8 | 508.2 | 193.2 | −126.4 | 30.4 | −19.9 |
| PTP | 678.8 | 849.9 | 487.0 | 171.1 | −191.8 | 25.2 | −28.3 |
| LYP | 325.5 | 431.8 | 251.1 | 106.3 | −74.4 | 32.7 | −22.9 |
| HTLV | 503.6 | 676.7 | 330.6 | 173.1 | −173.0 | 34.4 | −34.4 |
| HCP | 33.7 | 49.9 | 15.3 | 16.2 | −18.4 | 48.1 | −54.6 |
| Total | 4225.3 | 5601.2 | 3005.3 | 1376.0 | −1219.9 | 32.6 | −28.9 |
Note: Units in the table are × 106 m3/year, except for the impact rate. A1B-S1 is the scenario that considers the mean plus one standard deviation. A1B-S2 is the scenario that considers the mean minus one standard deviation. Climate impact is calculated as the results for climate scenario minus those for the baseline scenario. Impact rate is calculated as climate impact divided by the baseline and shown as a percentage.
Publisher’s Note: MDPI stays neutral with regard to jurisdictional claims in published maps and institutional affiliations. |
© 2021 by the authors. Licensee MDPI, Basel, Switzerland. This article is an open access article distributed under the terms and conditions of the Creative Commons Attribution (CC BY) license (https://creativecommons.org/licenses/by/4.0/).
Share and Cite
MDPI and ACS Style
Wang, S.-J.; Lee, C.-H.; Yeh, C.-F.; Choo, Y.F.; Tseng, H.-W. Evaluation of Climate Change Impact on Groundwater Recharge in Groundwater Regions in Taiwan. Water 2021, 13, 1153. https://doi.org/10.3390/w13091153
AMA Style
Wang S-J, Lee C-H, Yeh C-F, Choo YF, Tseng H-W. Evaluation of Climate Change Impact on Groundwater Recharge in Groundwater Regions in Taiwan. Water. 2021; 13(9):1153. https://doi.org/10.3390/w13091153
Chicago/Turabian StyleWang, Shih-Jung, Cheng-Haw Lee, Chen-Feng Yeh, Yong Fern Choo, and Hung-Wei Tseng. 2021. "Evaluation of Climate Change Impact on Groundwater Recharge in Groundwater Regions in Taiwan" Water 13, no. 9: 1153. https://doi.org/10.3390/w13091153
Note that from the first issue of 2016, this journal uses article numbers instead of page numbers. See further details here.