Article

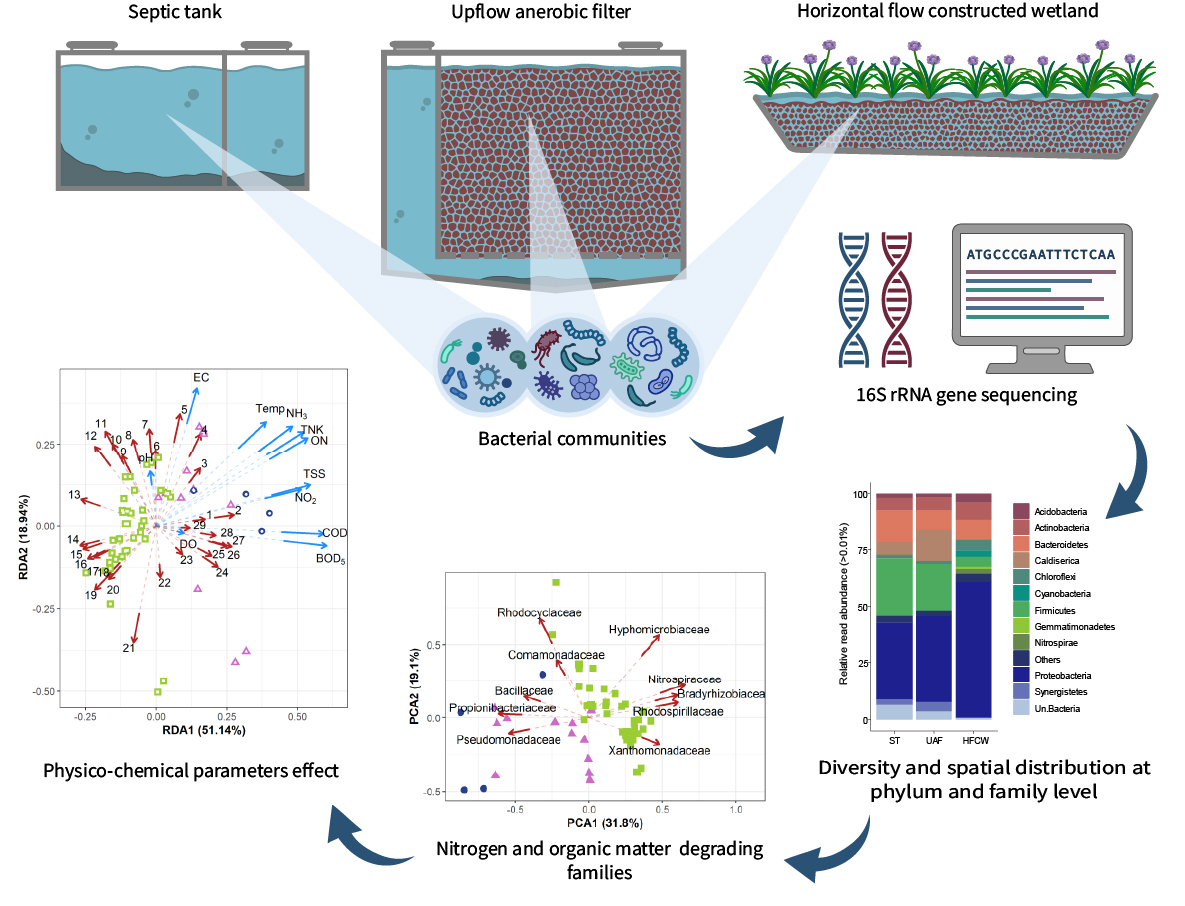
Characterization of the Spatial Variation of Microbial Communities in a Decentralized Subtropical Wastewater Treatment Plant Using Passive Methods

by
Marycarmen Verduzco Garibay
1,
Alberto Fernández del Castillo
1,
Osiris Díaz Torres
2,
José de Anda
3,
Carlos Yebra-Montes
4,
Carolina Senés-Guerrero
1,* and
Misael Sebastián Gradilla-Hernández
1,*
1
Tecnologico de Monterrey, Escuela de Ingenieria y Ciencias. Av. General Ramon Corona 2514, Nuevo México, Zapopan 45138, Jalisco, Mexico
2
Unidad de Servicios Analíticos y Metrológicos, Centro de Investigación y Asistencia en Tecnología y Diseño del Estado de Jalisco, A.C., Av. Normalistas 800, Colinas de la Normal, Guadalajara 44270, Jalisco, Mexico
3
Unidad de Tecnología Ambiental, Centro de Investigación y Asistencia en Tecnología y Diseño del Estado de Jalisco, A. C. Av. Normalistas 800 Colinas de la Normal, Guadalajara 44270, Jalisco, Mexico
4
ENES- León, Universidad Nacional Autónoma de México, Blvd. UNAM 2011, Predio el Saucillo y El Potrero León, Guanajuato 37684, Jalisco, Mexico
*
Authors to whom correspondence should be addressed.
Water 2021, 13(9), 1157; https://doi.org/10.3390/w13091157
Submission received: 10 March 2021 / Revised: 13 April 2021 / Accepted: 15 April 2021 / Published: 22 April 2021
(This article belongs to the Section Wastewater Treatment and Reuse)

Abstract

:
Septic tanks (STs), up-flow anaerobic filters (UAFs), and horizontal-flow constructed wetlands (HFCWs) are cost-effective wastewater treatment technologies especially efficient in tropical and sub-tropical regions. In this study, the bacterial communities within a decentralized wastewater treatment plant (WWTP) comprising a ST, a UAF, and a HFCW were analyzed using high-throughput sequencing of the V3–V4 region of the 16S rRNA gene. Bacterial diversity and its spatial variation were analyzed at the phylum and family level, and principal component analysis (PCA) was applied to nitrogen- and organic-matter-degrading families. The highest percentage of nitrogen removal was seen in the HFCW (28% of total Kjeldahl nitrogen, TKN, and 31% of NH3-N), and our results suggest that families such as Rhodocyclaceae (denitrifying bacteria), Nitrospiraceae (nitrifying bacteria), and Rhodospirillaceae (sulfur-oxidizing bacteria) contribute to such removal. The highest percentage of organic matter removal was seen in the UAF unit (40% of biological oxygen demand, BOD5, and 37% of chemical oxygen demand, COD), where organic-matter-degrading bacteria such as the Ruminococcaceae, Clostridiaceae, Lachnospiraceae, and Syntrophaceae families were identified. Redundancy analysis demonstrated that bacterial communities in the HFCW were more tolerant to physicochemical changes, while those in the ST and the UAF were highly influenced by dissolved oxygen and temperature. Also, pollutant removal pathways carried out by specific bacterial families and microbial interactions were elucidated. This study provides a detailed description of the bacterial communities present in a decentralized WWTP located in a subtropical region.

Graphical Abstract

1. Introduction

According to United Nations Sustainable Development Goal Number Six, a substantial increase in water treatment and reuse must be accomplished by 2030 to significantly reduce water scarcity worldwide and to protect the natural environment [1]. Centralized wastewater treatment plants (WWTPs) involve higher maintenance and operational costs than decentralized WWTPs, which are also easier to operate [2]. Anaerobic bioreactors (ARs) and constructed wetlands (CWs) are treatment stages that are commonly used in decentralized systems [3]; these units are classified as passive technologies, since they require low energy consumption and maintenance and operational costs [3,4]. Up-flow anaerobic filters (UAFs) and a septic tank (ST) are examples of ARs that can efficiently remove organic matter and suspended solids. However, the removal of nutrients in these units is often insufficient to comply with water quality regulations [5,6,7]. On the other hand, CWs are capable of removing nutrients, organic matter, and other pollutants from wastewater [8,9,10]. However, CWs may also have limitations, such as the possibility of clogging caused by the load of suspended solids in wastewater [11]. Systems consisting of ARs followed by CWs are known to be an efficient combination for wastewater treatment [3,12]. These configurations present advantages such as low energy requirements, low operational costs, and low sludge generation [13]. Furthermore, by incorporating an AR, such as a ST and UAF, as a pretreatment stage before wastewater is fed into a CW can significantly reduce the solid particles and organic matter levels [3,4], while the CW is useful in reducing nutrient loads in wastewater after anaerobic pre-treatment [14].
Microorganisms are a crucial component of both centralized and decentralized wastewater treatment systems because they remove nitrogenous compounds, phosphate, sulfur, and organic matter, among other pollutants [15]. For instance, nitrogen removal within CW is achieved by microbial processes such as nitrification, denitrification, anaerobic ammonium oxidation (anammox), and complete oxidation of ammonia (comammox) [16]. Through anaerobic digestion, organic matter is converted to methane (CH4) by the action of heterogeneous microbial communities that perform hydrolysis, acidogenesis, acetogenesis, and methanogenesis reactions [17].
The structure of microbial communities in CWs, and the occurrence of several pollutant removal pathways, strongly depend on the occurrence of aerobic and anaerobic microenvironments within them, as well as on many other operational and design factors, such as the presence of macrophytes, the type of substrate media, and hydraulic depth [17,18]. These communities are also affected by environmental conditions and variation (e.g., temperature, moisture, and pH) [19,20]. Spatial variation in the microbial communities within CWs have also been associated with proximity to the wastewater inlet. Higher organic matter and nutrient content occur near to the inlet therefore higher microbial activity has been found near the inlet, and a gradual decrease has been observed towards the outlet [21]. Moreover, differences have been reported in CW microbial diversity when comparing communities attached to plant roots to those attached to the substrate media [22]. Additionally, higher microbial diversity has been found in the upper layers of CWs than in the substrate of lower layers [22,23].
Microbial communities in WWTPs have been analyzed by molecular methods such as denaturing gradient gel electrophoresis (DGGE) [24], fluorescent in situ hybridization (FISH), and terminal-restriction fragment length polymorphism (TRFLP) [25]. The polymerase chain reaction (PCR) method has also been used to investigate the distribution of functional genes and microorganism diversity [22]. However, these methods may underestimate the microbial composition and diversity in these ecosystems because of a lack of sufficient sequences [26], and may fail to capture microbial community complexity [16]. Therefore, high-throughput sequencing is the most widely used method because it enables more extensive and systematic analysis of microbial communities in complex ecosystems [22,27]. More sequences can be obtained through this analysis and, thus, more information is provided, allowing bacterial diversity to be characterized more precisely [16,26].
Desta et al. [28] studied microbial communities of a multi-stage (anerobic/aerobic/VFCW) system treating tannery wastewater in Ethiopia. Bedoya et al. [17] sequenced samples of biosolids from a centralized WWTP treating municipal wastewater located in Colombia. Song et al. [29] studied bacterial diversity of six activated sludge WWTPs located in different climatic regions (tropical, subtropical, and temperate). However, to the best of our knowledge most studies focused on the characterization of microbial communities within wastewater treatment systems have reported predominantly on single treatment stages. Furthermore, very few studies have investigated the effect of physicochemical parameters on the structure of microbial communities within a multi-stage system.
The objective of this study was to characterize the spatial variation in microbial communities between and within the treatment stages of a decentralized WWTP combining a septic tank (ST), an up-flow anaerobic filter (UAF), and a horizontal-flow constructed wetland (HFCW). Additionally, we investigated the influence of physicochemical parameters on the microbial structure within all three treatment stages. As a contribution to the literature, this work is focused on the study of the microbial communities throughout a multi-stage decentralized treatment system composed of a ST, a UAF, and an HFCW that uses passive methods and has demonstrated to treat domestic wastewater efficiently. This study seeks to gain a greater understanding of the microbial structure and behavior in this WWTP located in a subtropical climate and the microbial response to physicochemical variations within the system. A thorough knowledge of the structure and behavior of microbial communities within the system under study contributes to the development of strategies to enhance microbial removal processes and improve the performance of decentralized WWTPs integrated with anaerobic reactors and constructed wetlands in tropical and subtropical countries. Furthermore, this is one of very few studies to provide a detailed description of the bacterial communities in decentralized treatment plants located in subtropical countries (such as Mexico), where climatic conditions play an essential role in the performance of treatment systems.

2. Materials and Methods

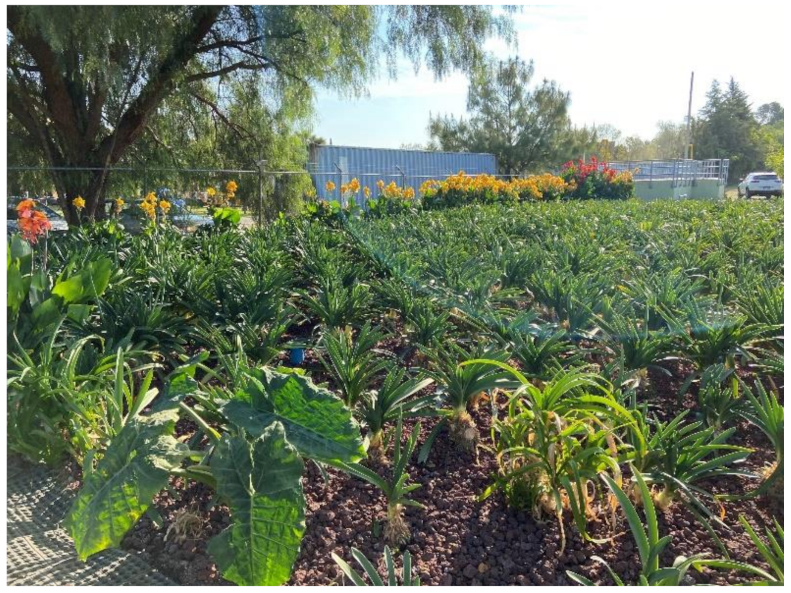
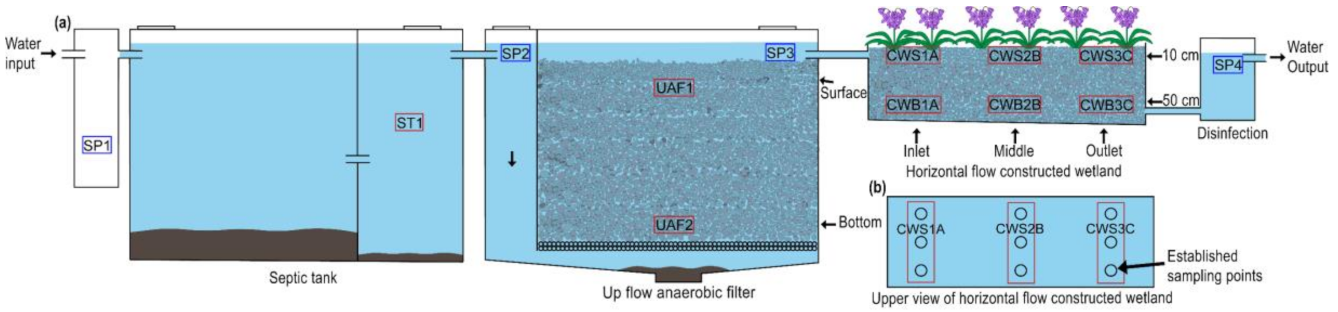
2.1. Site Description

The study site is a decentralized WWTP that combines an ST, a UAF, and an HFCW to treat high strength domestic wastewater generated at a public R&D center located in the municipality of Zapopan (Jalisco, Mexico). The study site is located in a subtropical region with an average annual temperature of 21.8 °C and annual precipitation of 926.4 mm [30]. The WWTP receives a wastewater load of approximately 7.5 m3/day. Untreated wastewater is received in the pump sump, where it is pumped to the ST. At this stage most particulate solids are removed by sedimentation, and anaerobic conditions promote the anaerobic digestion of organic matter [3,4]. The second treatment stage is the UAF, a tank filled with a porous volcanic rock called tezontle. In this anaerobic unit, wastewater flows from the bottom part of the chamber to the outlet at the top. The porous rocks act as attachment media for the bacteria involved in organic matter degradation. Finally, the wastewater flows to the HFCW (Figure 1), which is a shallow pond (with a hydraulic depth of 60 cm) that is also filled with tezontle which acts as a support medium for the root development of the ornamental plant Agapanthus africanus planted at a density of three plants/m2. The mean hydraulic retention times of the ST, the UAF, and the HFCW were reported as 2.45, 6.4, and 11.75 days, respectively [3,4]. The WWTP at the site has been described in detail by de Anda et al. [3] and mathematically modeled by Fernandez del Castillo et al. [4]. The configuration of the treatment system is shown in Figure 2.

2.2. Water Quality Analyses

Four sampling points were established for monitoring water quality (SP1: at the sump pump; SP2 at the UAF inlet; SP3 at the UAF outlet; SP4 at the HFCW outlet), indicated by the blue boxes in Figure 2. Water samples were taken fortnightly for three months (January to March of 2020) to determine biological oxygen demand (BOD5), chemical oxygen demand (COD), total Kjeldahl nitrogen (TKN), ammonia nitrogen (NH3-N), organic nitrogen (ON) and total suspended solids (TSS). These determinations were made by the Analytical and Metrological Services Unit (USAM) of the Centro de Investigación y Asistencia Tecnológica del Estado de Jalisco (CIATEJ), following the methods published by the Federation, W. E., and the American Public Health Association [31]. Samples were delivered to the laboratory less than one hour after they were taken. Nitrates (NO3) and nitrites (NO2) were measured by spectrophotometry using multiparametric kits TNT 835 and TNT 839, respectively (DR 5000, HACH, Loveland, CO, USA). System performance was evaluated by calculating the reduction in mass of each pollutant in each treatment stage and in the overall system. Temperature (Temp), pH, electrical conductivity (EC), and dissolved oxygen (DO) were measured at each sampling point using a multi-parameter probe (HI 9828, Hanna) to analyze the influence of physicochemical parameters on microbial communities.

2.3. Dna Extraction and High-Throughput Sequencing

Nine sampling points were established for DNA extraction and high-throughput sequencing (Figure 2) through the entire treatment system. One sampling point was located in the ST, two sampling points were located in the UAF, and six were located in the HFCW. In the ST and the UAF (the anaerobic stages), samples included water mixed with sediments, while samples taken from the HFCW contained water combined with plant roots, substrate, water, and sediments.
Two sampling campaigns were conducted during 2020, the first in January and the second in March, months which are both within the dry season in Jalisco, Mexico. At each sampling point, and for each sampling campaign, three grab samples, each with three biological replicates, were taken, generating a total of 54 grab samples. Thus, three grab samples (and replicates) were taken from the second chamber of the ST each month (Figure 2; indicated as ST1 inside a red square). In the case of the UAF (Figure 2a), three grab samples (and replicates) were taken at the surface (UAF1), and three grab samples (and replicates) were taken at the bottom (UAF2) each month (adding up to a total of 12 samples for the UAF) (Figure 2; indicated as UAF1 and UAF2 respectively, inside red squares). No composite samples were prepared for the UAF or the ST.
Regarding the HFCW (Figure 2a), samples were taken at a depth of 10 cm (Constructed Wetland Surface—CWS) and at a depth of 50 cm (CWB: Constructed Wetland Bottom) to assess variation associated with depth. Longitudinal distribution was also considered, as samples were taken at the inlet, in the middle, and at the outlet (at the two different depths previously described). The cross-sectional distribution of the microbial community was assessed by taking three grab samples at three points distributed cross-sectionally for each of the inlet, the middle, and the outlet (all at a depth of 10 cm) to prepare composite samples CWS1A, CWS1B, and CWS1C (Figure 2b). Likewise, three grab samples were taken at three points distributed cross-sectionally for each of the inlet, the middle, and the outlet (all at 50 cm depth) to prepare composite samples (CWB1A, CWB2B, and CWB3C) as shown in Figure 2b. The three grab samples taken at CWS1A were used to prepare a (cross-sectional) composite space sample and the same procedure was followed to prepare composite samples for CWS2B, CWS3C, CWB1A, CWB2B, and CWB3C. The resulting composite samples correspond to each depth (10 and 50 cm) and each longitudinal point (inlet, middle, and output). For the HFCW, a total of six composite space samples were prepared (as 18 grab samples were collected) each month (a total of 36 samples).
Samples were stored at 4 °C while they were transported to the laboratory for processing. Once in the laboratory, samples were centrifugated at 800× g for five minutes to form a sediment pellet and 500 mg of the pellets were placed on a matrix for DNA extraction. Following the manufacturer’s specifications, the DNA extraction procedure was performed using the FastDNA Spin Kit for Soil (MP Biomedicals, Solon, OH, USA). DNA extractions were stored at −80 °C until further analysis. High-throughput sequencing of the V3-V4 region of the 16S rRNA gene was performed by Novogene Corporation Inc. (Chaoyang District, Beijing, China) using an Illumina NovaSeq 6000 PE250 (paired-end to generate 250bp paired-end raw reads), obtaining 100k raw reads per sample employing the 341F (CCTAYGGGRBGCASCAG) and 806R (GGACTACNNGGGTATCTAAT) primers.

2.4. Bioinformatic Analyses

Bioinformatic analyses were performed using QIIME 2.0 (Quantitative Insights Into Microbial Ecology) software [32] following a standard bioinformatic pipeline. Demultiplexed sequences were denoised using DADA2 (p-trunc-len-f 0, p-trunc-len-r 0, p-trim-left-f 0, p-trim-left-r 0). After denoising, two characteristics tables (FeatureData[Sequence] and FeatureData[Taxonomy]) were constructed using 99% similarity with Greengenes 13_8 99% OTU full-length sequences [33,34]. Afterward, the classifier was trained using the length of the primers by the Naive Bayes classifier method. Finally, the taxonomic classification and the output of DADA2 (denoised sequences) with the trained classifier were aligned with classify-sklearn and the result was visualized as a taxa-barplot [35]. The sequencing run has been uploaded to the Sequence Read Archive of the NCBI with accession number PRJNA700667.

2.5. Statistical Analysis

The sequencing depth of the 16S rRNA gene was presented using a rarefaction curve performed in R using the rarefy function, which is based on Hurlbert’s formulation [36] and the standard errors proposed by Heck [37]. Barplots of relative read abundance were used to understand the composition of the bacterial community for the phylum and selected microbial families related to nitrogen and organic matter removal pathways. The DESeq2 R package was used to normalize read numbers [38]. Microbial groups with relative abundance <1% were grouped as “others” and unclassified families were denoted by “Un”.

2.5.1. Principal Component Analysis

Principal component analysis (PCA) was performed for the bacterial families degrading nitrogen and organic matter in each unit (ST, UAF, and HFCW) to evaluate differences between treatment units as well as vertical variation within the UAF and both vertical and longitudinal variation within the HFCW. The aim of this analysis was to transform the original variables (bacterial families) to a new set of variables, the principal components, that are linear combinations of the original variables, which are uncorrelated and are ordered so that the first few of them account for most of the variation within the bacterial families [39]. Correlation biplots were used to further interpret bacterial community variation using the first two principal components in each case (variations between and within treatment units). In a biplot: (i) a vector represents a variable (bacterial family) and its length is proportional to the variance of the corresponding variable, (ii) angles between vectors reflect the correlation between the corresponding variables; (iii) points (observations) can be projected perpendicularly onto vectors, and the projection is indicative of the abundances of the families represented in the corresponding observations. The origin represents the average value. Projections in the same direction of the vector indicate values above average while projections in the opposite direction represent values below average [40].

2.5.2. Redundancy Analysis

The distribution of nitrogen and organic matter degrading bacterial communities between and within treatment units, and the effect of physicochemical parameters on bacterial communities, were analyzed using redundancy analysis (RDA) and the same analysis was performed on the variation in their composition. RDA is an extension of PCA that explicitly models response variables (bacterial families in this case) as a function of explanatory variables (physicochemical parameters in this case) [40]. The components in RDA are not only a linear combination of the response variables, but also of the explanatory variables. Correlation triplots were used to extract further information from the RDA results. A correlation triplot consists of two superimposed biplots that include quantitative explanatory and response variables (represented by vectors) and observations (represented by points) [40]. The interpretation of correlation triplots is as follows [41]: (i) The angles between two response variable vectors, or between two explanatory variable vectors, or between a response variable vectors and an explanatory variable, reflect their correlations, (ii) Points (representing observations) can be projected perpendicularly onto the response and explanatory variable vectors and indicate their values in the corresponding samples (observations).

2.5.3. Principal Coordinates Analysis

Dissimilarities in the composition of microbial communities between treatment units (ST, UAF, and HFCW) and dissimilarities between these communities at different (longitudinal and vertical) regions within the treatment units (the UAF and HFCW units) were analyzed using principal coordinates analysis (PCoA) based on Bray-Curtis distances. Permutational multivariate analysis of variance (PERMANOVA) (P < 0.05) and analysis of similarity (ANOSIM), using the Bray-Curtis dissimilarity index, were applied to evaluate statistically significant differences in the composition of bacterial communities between and within units (including vertical and longitudinal variation within units) [42]. The ANOSIM statistic R (which compares the mean of ranked dissimilarities between groups to the mean of ranked dissimilarities within groups) lies in the interval [−1,1]. A value of 0 indicates a completely random grouping, while positive R values suggest dissimilarity between groups and values below 0 suggest that dissimilarities are greater within groups than between groups [43]. All statistical analyses (PCA, RDA, PCoA, PERMANOVA and ANOSIM) were performed using the R software version 4.0.2, and the scales [44] vegan [45] packages. Graphics were made using ggplot2 package [44].

3. Results and Discussion

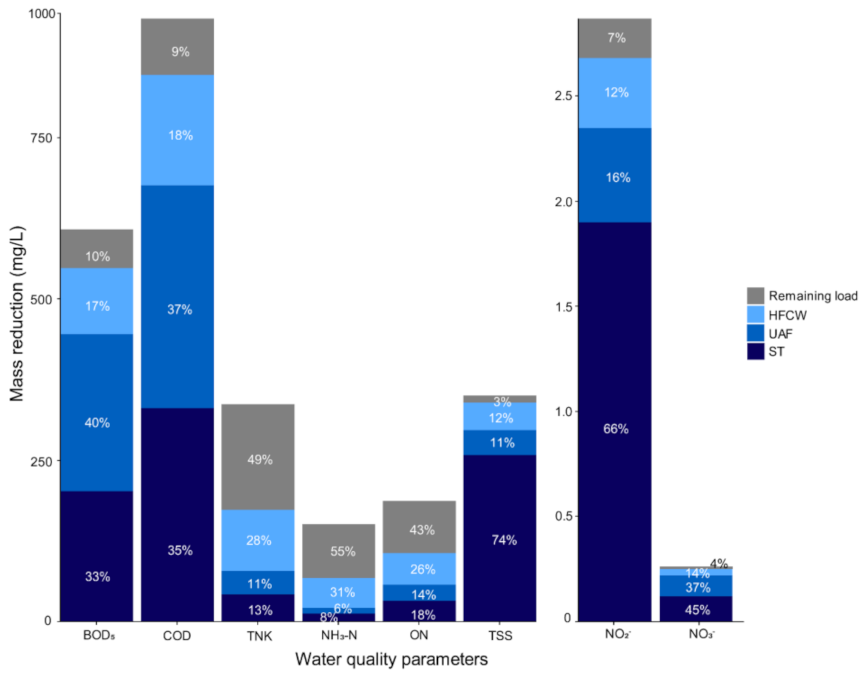
3.1. System Performance

The reduction in mass of each pollutant and the content remaining in the system effluent (BOD5, COD, TKN, NH3-N, ON, and TSS) are depicted in Figure 3. The system was found to be highly efficient in organic matter removal as it displayed significant mass reduction for both BOD5 and COD, with average overall values of 548 ± 117 mg/L and 847 ± 181 mg/L, respectively (Figure 3; Table S1), corresponding to average overall reductions of 90% of BOD5 and 91% of COD. Higher degradation of organic matter occurred in the ST and the UAF, representing a combined reduction of 73% of BOD5 and 72% of COD (mass reduction: 202 ± 60 mg/L of BOD5 and 331 ± 93 mg/L of COD in ST; 243 ± 105 mg/L of BOD5 and 345 ± 137 mg/L of COD in UAF). These results indicate that efficient anaerobic degradation occurs in the anaerobic stages (ST and UAF), in agreement with the DO and temperature levels measured in these stages (Table 1), which are optimal for anaerobic reactors [46]. Degradation of organic matter within the HFCW was also significant, with an average mass reduction of 171 ± 37 mg/L for COD, corresponding to a reduction of 18%. The DO concentrations measured in the HFCW were low but were higher than those observed for the anaerobic stages (Table 1).
TSS removal was high for the system overall, reaching 339 ± 73 mg/L, which represents a reduction of 97% of the inlet load. However, the ST was found to make the highest contribution in comparison to the other treatment stages, with an average mass reduction of 258 ± 65 mg/L (74%), which proved that the ST unit performs its function efficiently, preventing the accumulation of solid particles in the succeeding units (UAF and HFCW) and preventing clogging (obstruction). Regarding nitrogen removal, the overall mass reduction was 173 ± 20 and 67 ± 8 mg/L for TKN and NH3-N, respectively. These values correspond to overall reductions (the contributions of the three stages combined) of 51% of TKN and 45% of NH3 from inlet loads. This reduction is significant considering the initial concentration of TKN (337 ± 12 mg/L), as it is comparable to industrial loads; since the wastewater comes from an R&D industrial and biotechnology center, the effluent may have a higher concentration of nitrogen [47]. Similar results were reported by de Anda et al. [3] for this experimental system. As shown in Table S1, the highest reduction in nitrogen mass occurred in the HFCW, with values of 95 ± 26 mg/L (28%), 46 ± 13 mg/L (31%), and 48 ± 13 mg/L (26%) for TKN, NH3-N, and ON, respectively. Although the concentration of nitrates and nitrites entering the system was low (2.88 ± 1.69 mg/L for NO3 and 0.26 ± 0.06 for NO2), the removal efficiency was high, reaching 93% and 96% for NO2 and NO3, respectively. The performance of this experimental system has previously been characterized by Fernández del Castillo [4].

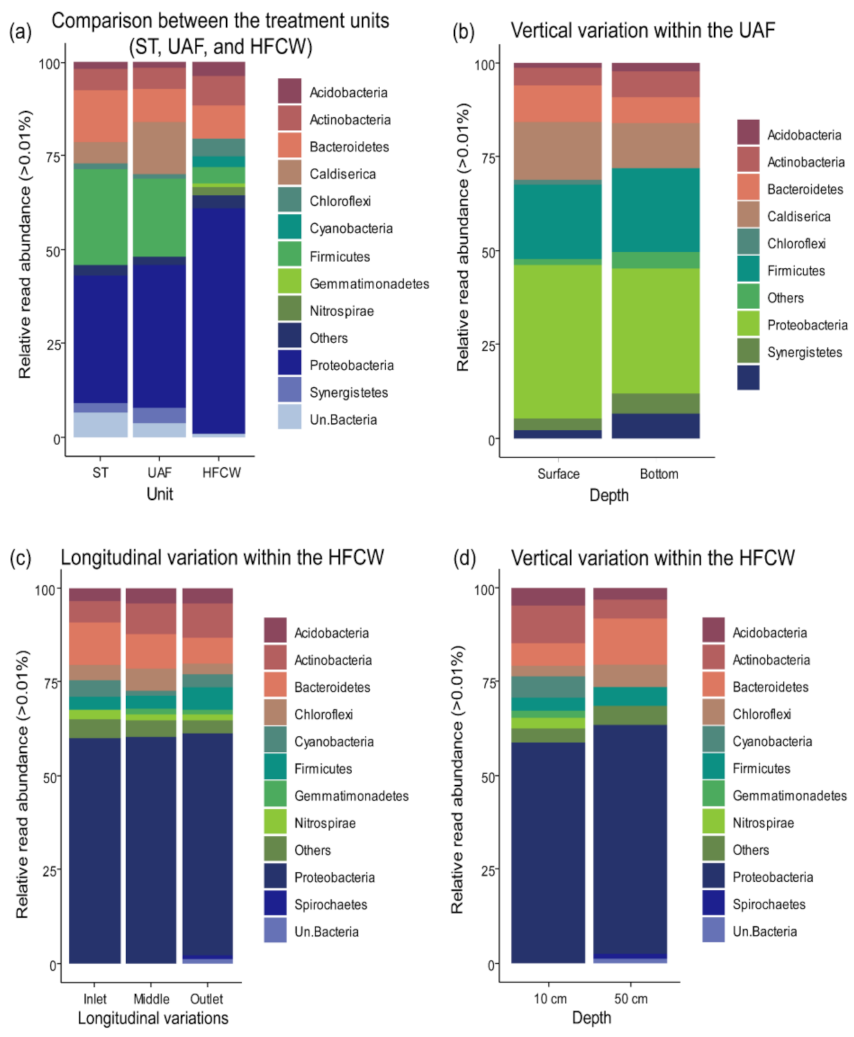
3.2. Diversity and Composition of the Bacterial Communities

High-throughput sequencing was performed on 52 samples (out of a total of 54 samples), from which 9,512,339 raw reads were obtained from the hypervariable region V3-V4 of the 16S rRNA gene, with a mean length of 420 bp. Sequencing depth was represented by a rarefaction curve of the 16S rRNA gene (Figure S1). Two samples corresponding to the ST (one for each month) were not processed further because the DNA did not meet quality requirements. A total of 5,799,224 (61%) (from the 52 samples) were classified as bacterial employing the Greengenes database, and 3,713,115 (39%) reads were described as unclassified.
Proteobacteria was the most abundant phylum in all the system stages and gradually increased in abundance from one treatment stage to the next (ST < UAF < HFCW), with abundances of 34% in the ST, 38% in the UAF, and 60% in the HFCW (Figure 4a; Table S2). The members of this phylum are involved in a variety of metabolic pathways related to the carbon and nitrogen cycles [48,49,50], which explains their dominance in the whole WWTP. Additionally, Proteobacteria are known to be enhanced by the presence of macrophytes in CWS [51], which explains why their highest relative abundance was in the HFCW and which may also be associated with the high nitrogen mass reduction accomplished in this unit (Figure 3). In addition to Proteobacteria, Firmicutes (26%), Bacteroidetes (14%), and Caldiserica (6%) were the most abundant phyla found in the ST. Firmicutes (21%), Caldiserica (14%), and Bacteroidetes (9%) were the phyla with the highest relative abundance in the UAF (besides Proteobacteria) while Bacteroidetes (9%), Actinobacteria (8%), and Chloroflexi (5%) presented the most significant abundances in the HFCW. As suggested by these results, the physicochemical conditions of each treatment stage affected its microbial composition. ST and UAF displayed a similar composition, as both are anaerobic units, while the bacterial composition within the HFCW, which contains macrophytes that provide exudates and dissolved organic matter, and transfer oxygen [52], presented more differences.
The higher abundance of Firmicutes found in the anaerobic units in this study, compared to the HFCW, can be explained, as this phylum is known to degrade complex organic molecules [26,28]. The ST is the first unit in the system and is thus expected to receive a higher load of complex organic molecules, which diminished in subsequent stages and, accordingly, the relative abundance of Firmicutes decreases after each stage. Consequently, this phylum may be closely associated with the high rates of BOD5 and COD mass removal reported for the first two units (the ST and UAF; Figure 3).
Besides Firmicutes and Proteobacteria, Acidobacteria, Actinobacteria, Bacteroidetes, and Chloroflexi phyla were present in all treatment units. These bacterial phyla have previously been reported in anaerobic bioreactors [24]. They are also known to conduct hydrolysis and acidification reactions in HFCW treating effluents with high organic loads, thereby playing an essential role in decomposing organic matter and nitrogen removal [53]. The phyla Gemmatimonadetes and Nitrospirae were only found in the HFCW, where higher levels of nitrogen and phosphate removal occurs. In consequence, previous studies have linked Gemmatimonadetes to nitrogen [54] and phosphate removal [50]. In this study, the phylum Gemmatimonadetes was only present at a depth of 10 cm in the HFCW and was completely absent in the first units (ST and UAF). Cheng et al. [26] reported that the Gemmatimonadetes prefer drier soils and disappear when the water content increases in a vertical subsurface flow CW, which explains why this phylum is present only in the upper layers of the HFCW of our experimental system, where the water content is lower because this is a CW with subsurface flow.
Only slight variations in abundance, in terms of phyla, were found in bacterial communities at different depths in the UAF (Figure 4b; Table S3). Regarding the effect of depth on the microbial communities found in the HFCW (Figure 4d; Table S4), the phyla Cyanobacteria, Gemmatimonadetes, and Nitrospirae were present only at 10 cm, which could indicate a dependency on higher oxygen concentrations [55,56]. However, it has been reported that the phylum Nitrospirae includes both aerobic and anaerobic microorganisms related to nitrification (nitrite oxidizers) [19] and methanogenesis [56], indicating that members of this phylum may be found in the upper and lower layers of diverse CW units. However, in the HFCW of our experimental system, bacteria of the phylum Nitrospirae were mainly present at a depth of 10 cm, possibly due to a limited accumulation of nitrite in the lower layers, since nitrite is known to be an unstable intermediate [57]. Significant longitudinal variation in the abundance of phyla was also found in the HFCW, where a decrease in Bacteroidetes and an increase in Actinobacteria were observed from inlet to outlet (Figure 4c; Table S5). The phylum Bacteroidetes is known to degrade complex organic compounds and includes members that can perform denitrification [58]. It is to be expected that the relative abundance of this phylum would decrease as substrate availability decreases from the inlet to the outlet of the HFCW. Furthermore, Gemmatimonadetes were present in the middle and the outlet sections but not near the inlet, which may be attributed to the low concentrations of DO found at the inlet. Some members of the Gemmatimonadetes have been regarded as aerobic heterotrophs capable of assimilating sugars [55,59].

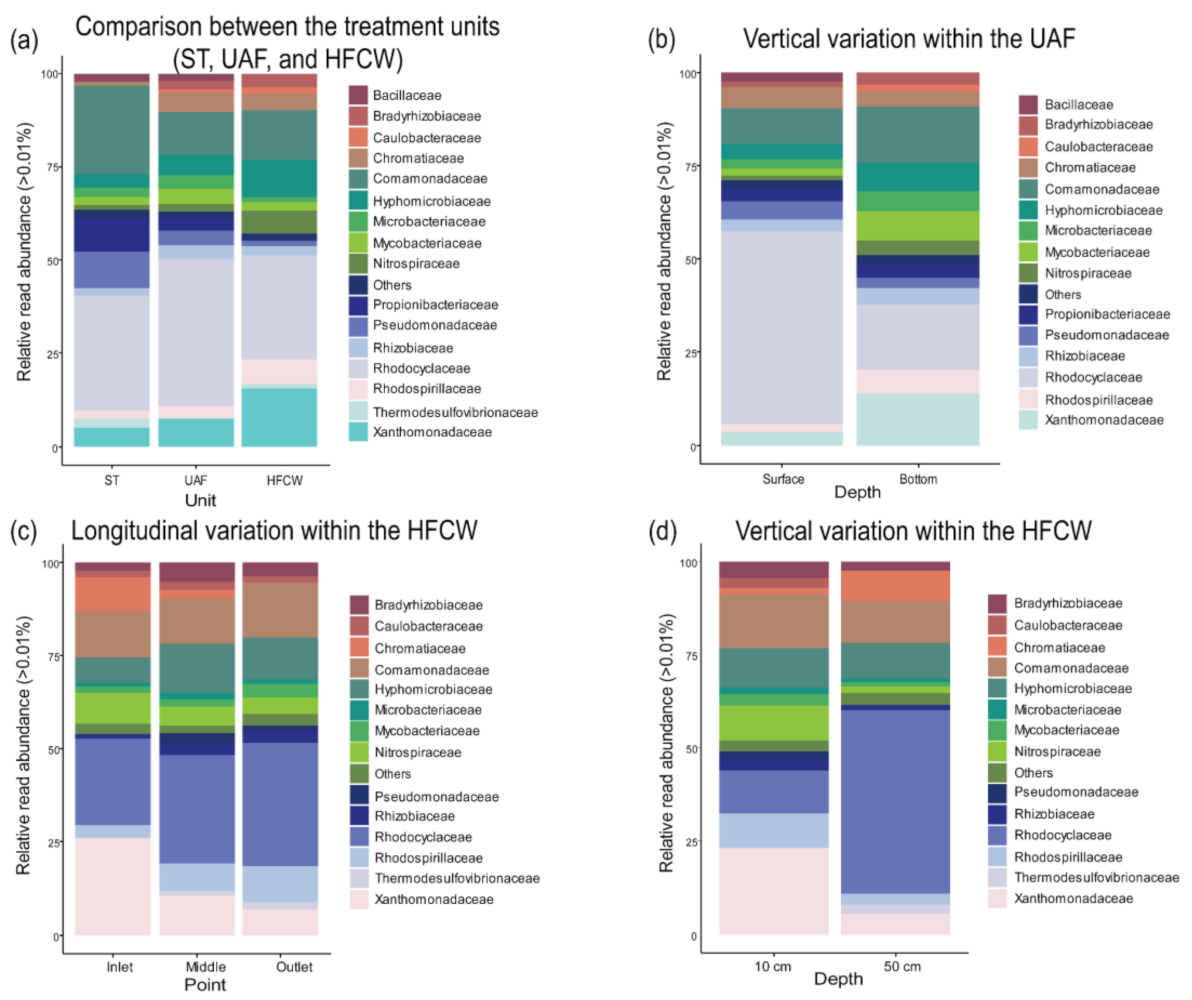
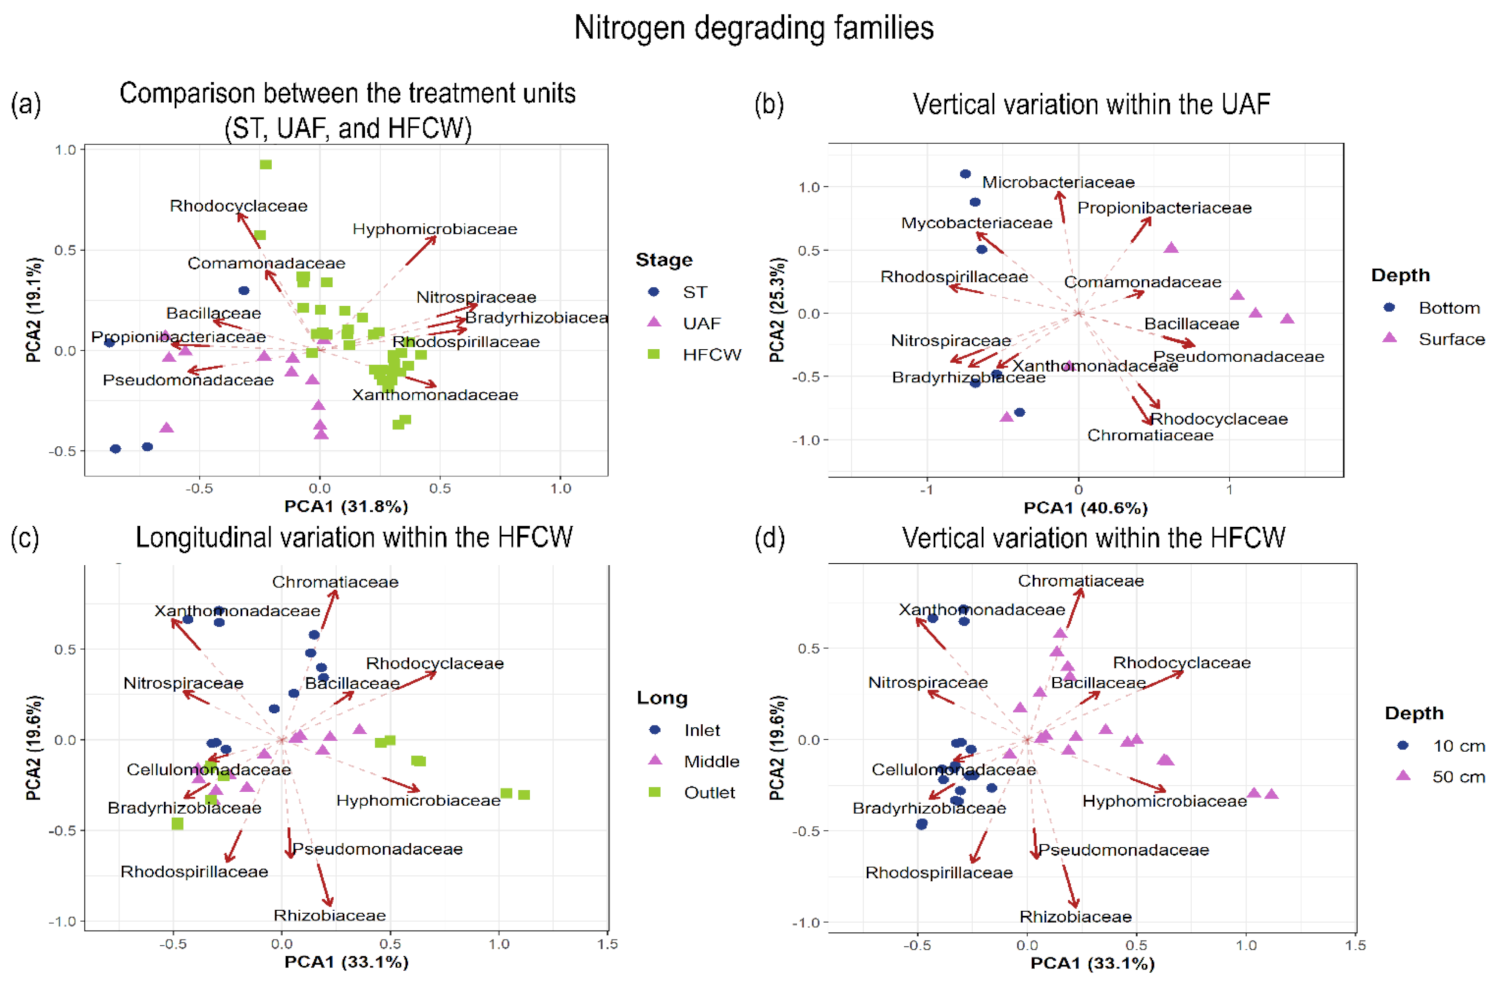
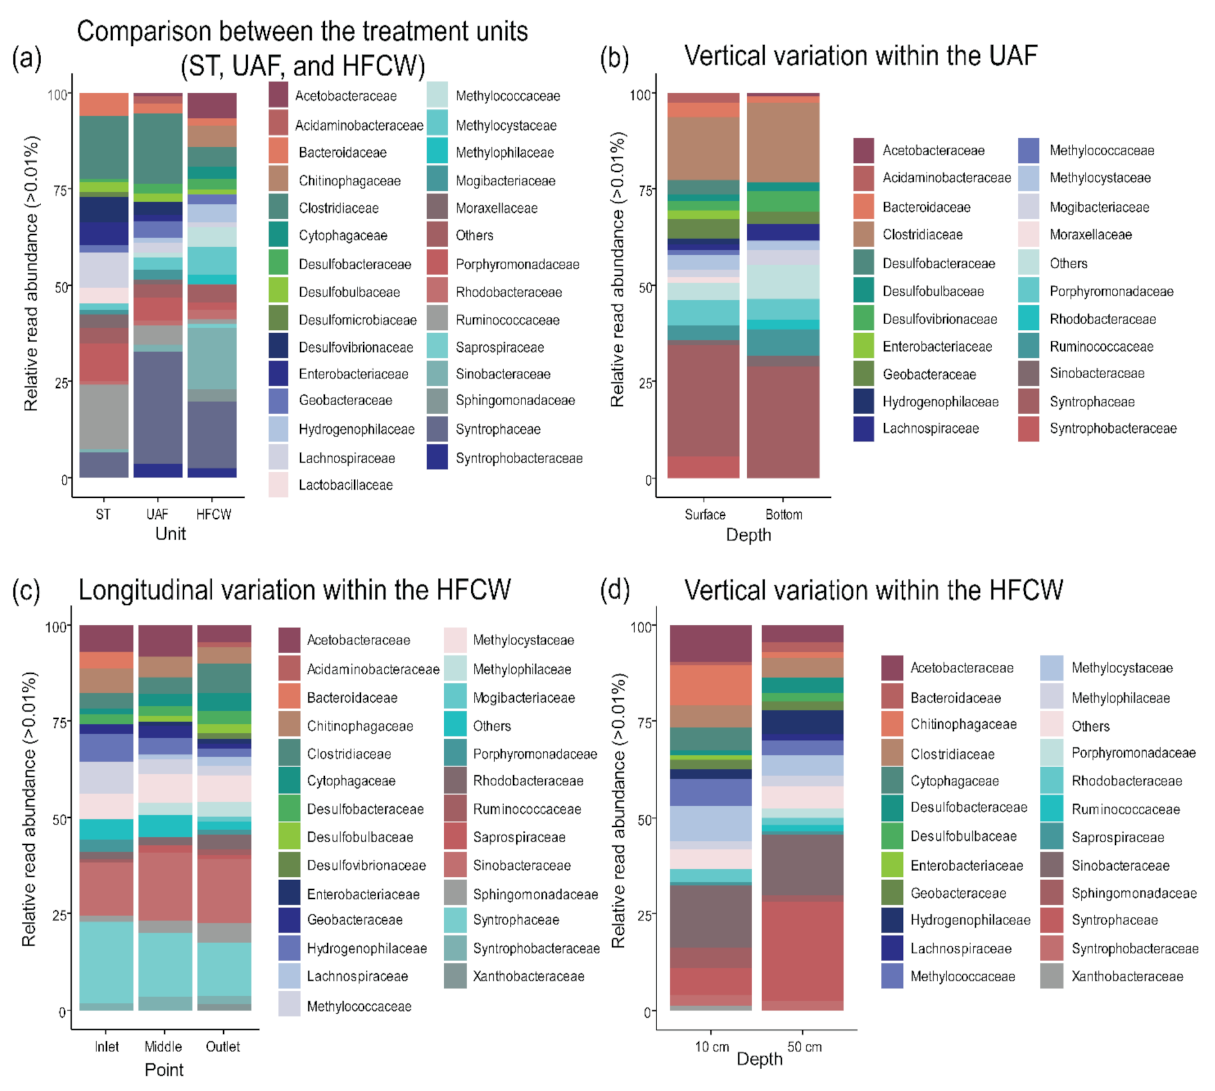
3.3. Spatial Variations of Nitrogen and Organic Matter Degrading Families

To evaluate the spatial distribution of bacterial communities within the treatment systems, 18 nitrogen degrading families and 29 families that degrade organic matter were selected (Figure 5, Figure 6, Figure 7 and Figure 8). PCA biplots were developed to analyze the spatial variation in their relative abundance (Figure 6 and Figure 8, only selected bacterial families vectors were plotted for illustration purposes) and a PCoA biplot (Figures S2 and S3) was developed to demonstrate dissimilarities between the treatment units and spatial variation within the system stages. ANOSIM was performed to determine if such dissimilarities were significant (Table S14). As also found at the phylum level, the bacterial communities of the anaerobic stages (ST and UAF) were similar (Figures S2a and S3a). The low levels of oxygen present in the ST and the UAF are necessary for anaerobic degradation and denitrification. In contrast, differences in the composition of the microbial communities between the HFCW and the anaerobic stages (ST and UAF) may be caused by the development of aerobic microenvironments and symbiotic interactions between bacteria and plants that occur in the HFCW [60].

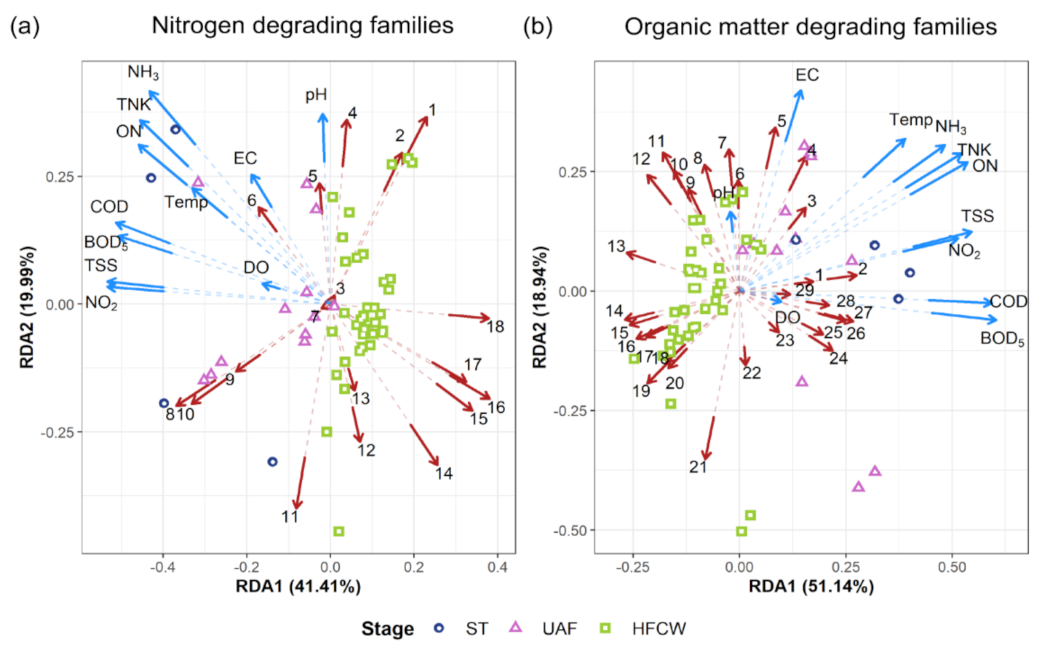
3.3.1. Nitrogen Degrading Bacterial Families

Rhodocyclaceae was the most abundant family in all treatment stages (Figure 5a and Figure 6a), suggesting that the oxygen concentrations found in all units (ST, UAF, and HFCW; Table 1; Table S6) were sufficiently low for their growth. This family has been reported to participate in denitrification, organic matter degradation, and biofilm formation in high strength wastewater treatment systems under anaerobic conditions [7,61,62]. Comamonadaceae, Propionibacteriaceae, and Pseudomonadaceae were present in greater abundances in the ST in comparison to the UAF and the HFCW (Figure 5a and Figure 6a).
Previous studies have suggested the participation of these families in denitrification is affected by higher concentrations of DO [63,64]. This condition of higher levels of DO can partially be found in the HFCW, since plant roots can infiltrate oxygen to this part of the system [65]. The output of the ST contained the lowest concentration of DO of all the sampling points (0.26 mg/L), which may explain the higher abundance of these families in this treatment stage. The primary function of ST is to separate the sludge, the effluent, and the scum layer from the wastewater, it removes suspended solids by retention and organic matter by anaerobic digestion [4,66], and reduces pathogen concentrations [3].
The Chromatiaceae were found to be present in the UAF at both depths (Figure 5b and Figure 6b). The Chromatiaceae are a group of purple sulfur bacteria, commonly found in WWTPs, that utilize sulfide as an electron donor [67] and oxidize it to sulfate under anoxic conditions [68]. Therefore, the presence of this family suggests that denitrification and sulfate removal occur at the bottom of the UAF, and nitrification may occur in the UAF unit’s upper layers.
The abundance of the family Bacillaceae was higher in the ST and the UAF than in HFCW (Table S7). This family is known to be involved in nitrification under aerobic conditions but under anaerobic conditions members are able to perform denitrification [26,69], suggesting that denitrification occurs in the ST, based on the low levels found in this unit.
In this study the families Hyphomicrobiaceae, Nitrospiraceae, Rhodospirillaceae, Bradyrhizobiaceae, and Xanthomonadaceae were present at higher abundance at all sampling points within the HFCW unit compared with those in the anaerobic reactors (ST and UAF; Figure 5a and Figure 6a). Aerobic microenvironments may influence this within the HFCW, these being attributed to activity in the plant rhizosphere. Figure 6d shows the vertical variation in the composition of bacterial communities (families) when comparing depths (Figure S2d, ANOSIM R = 0.4933, Significance = 0.001) within the HFCW. The presence of plant roots and the permeation of atmospheric oxygen to a depth of 10 cm enable aerobic bacteria (such as nitrifying bacteria) to grow [70]. In contrast, at a depth of 50 cm anaerobic conditions allow other families to grow, such as denitrifying bacteria [4]. Within the HFCW, the Nitrospiraceae, Rhizobiaceae, and Xanthomonadaceae were the most abundant families at a depth of 10 cm (Figure 5d and Figure 6d). These microorganisms have been regarded as nitrifiers, suggesting that nitrification occurs in the upper layers and near the plant roots, supporting microbial attachment, oxygen transfer to the rhizosphere, and root exudates [21]. At a depth of 50 cm, the Rhodocyclaceae, Chromatiaceae, and Bacillaceae occurred at a much higher abundance (in comparison to the upper layer, Figure 5d and Figure 6d). Similarly, the family Rhodocyclaceae was more abundant at the outlet of the HFCW (Figure 5c and Figure 6c).
The family Rhodospirillaceae displayed an increasing trend from the inlet to the outlet of the HFCW (Table S9) and was more abundant at a depth of 10 cm than at 50 cm (Figure 5c and Figure 6c). This sulfur oxidizing bacteria is capable of degrading organic compounds under anaerobic conditions and can act as a chemotroph under aerobic conditions [50]. However, Meyer et al. [68] reported a higher abundance of the family Rhodospirillaceae (16%) in environments with higher oxygen concentrations during wastewater treatment. These families may be affected when oxygen availability is low, which explains the increase in their abundance in the HFCW, where plants are known to create aerobic microenvironments [71]. Even if the Rhodospirillaceae includes anaerobes, our results suggest that aerobic conditions, partially found in the HFCW, are preferred by most family members.
Longitudinal spatial variation within the HFCW were assessed by comparing samples from the inlet, the middle, and the outlet regions of the treatment unit (Figure S2c; ANOSIM R = 0.2, Significance = 0.001). Variation was found in microbial family abundances from inlet to output, indicating that different metabolic pathways occur in each region of the HFCW. Families Xanthomonadaceae and Nitrospiraceae exhibited a decreasing trend from the inlet to the outlet (Figure 5c and Figure 6c). These families are known to be aerobic bacteria [72] involved in nitrification [73] in significant symbiotic interactions with plants [74]. This decreasing trend could be related to the ammonia concentration which also decreased along the HFCW. The families Bradyrhizobiaceae, Hyphomicrobiaceae, Pseudomonadaceae, Rhizobiaceae, and Rhodospirillaceae presented higher abundances in the middle section of the HFCW than in the inlet and outlet (Figure 5c and Figure 6c). The abundance of these bacterial groups may be related to substrate availability as they require carbon sources for growth and their abundance falls as carbon sources are consumed [68,75]. However, a preference for specific carbon sources could be suggested as the highest abundance of these families were observed in the middle part of the HFCW, where the decomposition of complex molecules may generate a significant amount of product, which can in turn be processed by these specific bacterial groups [76,77]. Characterization of the carbon sources along the HFCW could be useful in coming to understand the relationships between the abundance of bacterial families and the availability of specific carbon products and should be considered in future studies.

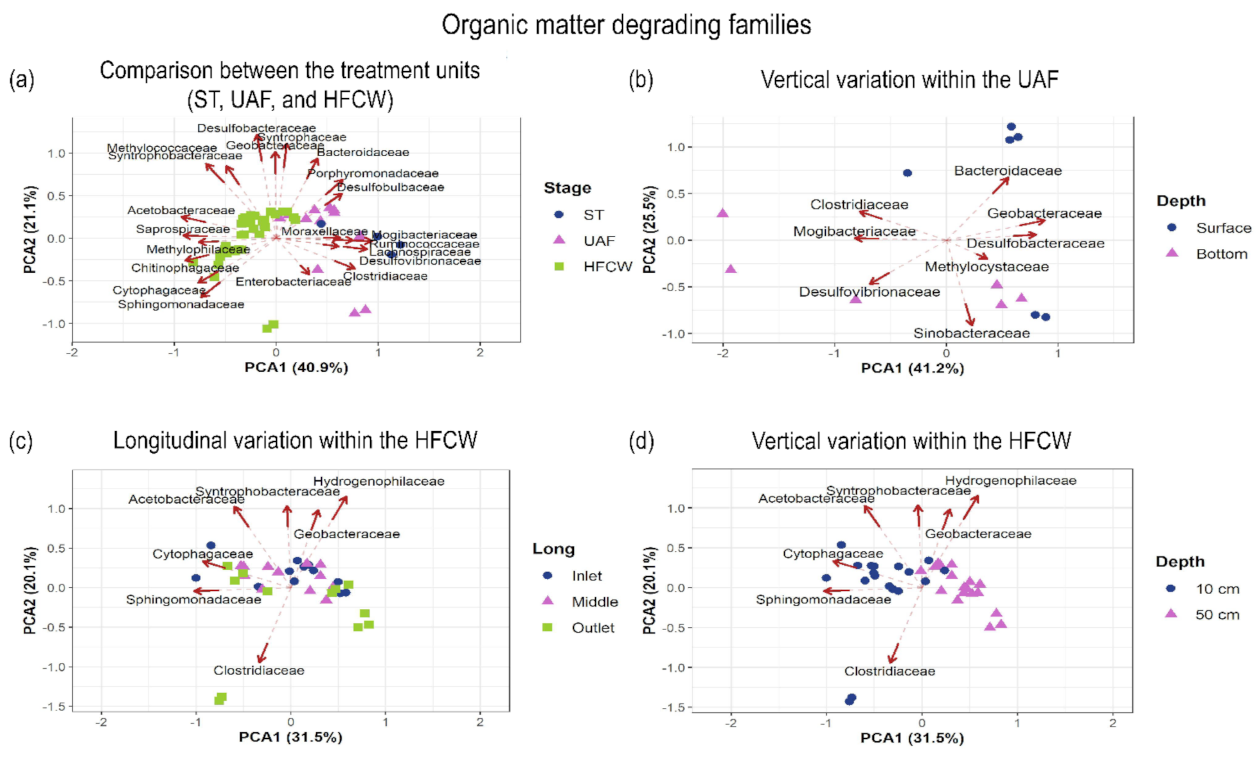
3.3.2. Families Degrading Organic Matter

The spatial variation of families that degrade organic matter within and between the treatment stages was analyzed (Figure 7 and Figure 8; Tables S10–S13). The Ruminococcaceae was the most abundant family in the ST, followed by the Bacteroidaceae, Lachnospiraceae, and Porphyromonadaceae (Figure 7a and Figure 8a). These families were also more abundant in the ST than in the UAF and HFCW. The most abundant family in the UAF was the Syntrophaceae, followed by the Clostridiaceae and Geobacteraceae. These families exhibited higher abundances in the UAF and were significantly less abundant in the HFCW. The families Ruminococcaceae and Lachnospiraceae have been related to the hydrolyzation of a variety of polysaccharides [78], acetogenesis [79], and fermentation [55], which are the first phases of degradation of the organic matter [80] present in raw wastewater. Thus, the higher abundance of these families found in the ST indicates that they degrade the more complex organic compounds present in the raw sewage into small molecules, later available for other microbial populations in the treatment units that follow. The Porphyromonadaceae has also been reported to be involved in the degradation of organic matter in anaerobic reactors [81,82]. The Clostridiaceae are commonly reported to be highly abundant in the effluent of anaerobic reactors such as the up flow anaerobic sludge blanket reactor [83,84].
Desulfovibrionaceae, Enterobacteriaceae, Mogibacteriaceae, and Moraxellaceae were present in both the ST and the UAF (the anaerobic stages). In contrast, Acetobacteraceae, Methylococcaceae, and Syntrophobacteraceae were only found in the UAF and the HFCW, and have been referred to as anaerobic fermentative bacteria [85] and have previously been found in other HFCW [86]. Similarly, the families Chitinophagaceae, Cytophagaceae, Methylophilaceae, Saprospiraceae, and Sphingomonadaceae were found exclusively in the HFCW (Figure 7a and Figure 8a).
Van Lier et al. [87] reported that hydrolysis is usually the first and limiting step in the removal of organic matter, as it converts complex substrates into monomeric and dimeric compounds that form the substrates fed to the reactors that follow, and thus hydrolysis determines the overall removal of organic matter in the WWTP [87]. Similarly, Rajagopal et al. [88] reported that a pre-treatment process, such as the ST, is necessary to carry out hydrolysis since the degradation of particulate organic matter is slow and affects the performance of the following processes. The results presented here suggest that the hydrolysis step is performed within the ST, producing substrates that are available for the treatment units that follow, where fermentative and methanogenic bacteria were found.
The presence of Betaproteobacteria class members, such as Desulfobacteraceae and Desulfobulbacteraceae, was observed in all three units, with similar abundance (Figure 7a and Figure 8a). Members of the phylum Proteobacteria, such as Betaproteobacteria and Deltaproteobacteria, have been reported to participate in the sulfur cycle in CW [22] and anaerobic digestion processes [68,89]. In addition, Meyer et al. [68] found that the presence of sulfur, potassium, manganese, total nitrogen, and total phosphorus in the wastewater contributed to variation in the structure and composition of families related to the sulfur cycle. The presence of these families in our experimental system indicates the occurrence of the sulfur cycle and the reduction of inorganic sulfur compounds [86].
The microbial composition differed between the upper (output) and the lower (input) layers of the UAF (Figure S3b; ANOSIM R = 0.3056, Significance = 0.003). Families of obligate anaerobes were found in the lower layers of the UAF and facultative anaerobic bacteria were found in the upper layers. The abundance of families affected by oxygen, such as Clostridiaceae, Desulfovibrionaceae, Mogibacteriaceae, and Sinobacteraceae, decreased from the bottom to the surface (input to output) (Figure 7b and Figure 8b). Other families, like the Bacteroidaceae, Desulfobacteraceae, Geobacteraceae, and Methylocystaceae, were more abundant at the surface (Figure 7b and Figure 8b), indicating that they may include some facultative anaerobic species, the abundance of this families can be enhanced by a slight increase in oxygen levels. In addition to oxygen availability, it has been suggested that substrate availability and competitive interactions between microbial populations shape the distribution of the bacterial communities from inlet to outlet in anaerobic treatment units such as up flow anaerobic sludge blanket reactors [90,91].
Regarding vertical variation within the HFCW (Figure 7d and Figure 8d), the families Acetobacteraceae, Geobacteraceae, Hydrogenophilaceae, and Syntrophobacteraceae presented a higher abundance at a depth of 10 cm than at a depth of 50 cm (Figure S3d, ANOSIM R = 0.4575, Significance = 0.001). In contrast, the families with a greater abundance at a depth of 50 cm were the Clostridiaceae, Cytophagaceae, and Sphingomonadaceae (Figure 8d). As previously mentioned, these changes may be related to the presence of root exudates and higher oxygen availability, which are more available at a depth of 10 cm. In the same vein, Krasnits et al. [92] reported that methanogenic bacteria and archaea were more strongly influenced by depth than by distance from the inlet in a study of the distribution of microbial communities in an HFCW. These authors attribute this tendency to the oxidation-reduction potential (ORP) within the HFCW. The ORP parameter was not considered in this study, but an examination of this parameter is suggested for further studies.
Liu et al. [93] reported an increasing trend for the family Sphingomonadaceae along the flow path of an HFCW and a decreasing trend along the flow path of a VFCW, attributing this behavior to the direction of water flow, and highlighted the influence that the type of CW exerts on the structure of the bacterial community. This fact is consistent with our results (Figure 7c and Figure 8c) where Sphingomonadaceae increased in abundance from inlet to outlet along the HFCW. However, in this study, few longitudinal differences were found in the HFCW with respect to the families related to organic matter removal (Figure S3c, ANOSIM R = 1996, Significance = 0.001).

3.4. Effect of Physicochemical Parameters on Bacterial Communities

An RDA was performed to analyze the correlation between microbial families and the physicochemical parameters measured in the treatment stages (BOD5, COD, TKN, NH3-N, ON, TSS, NO2, temperature, DO, pH, EC; NO3 was omitted to avoid redundance in the analysis as it presented collinearity with NO2). The two main redundancy components explained 61% of the total variability in the bacterial community of nitrogen degrading families (a set of 18 families), while the two main redundancy components explained 70% of the total variability in the case of the families degrading organic matter. Figure 9 shows the RDA correlation triplot that explains the correlation between the physicochemical parameters, and selected bacterial families represented by a number (Table 2).
As mentioned above, the angles between the vectors of the bacterial families represent correlations between the families and angles between the vectors of water quality parameters represent correlations between these parameters (Figure 9). Likewise, angles between the vectors of bacterial families and the vectors of water quality parameters represent correlations between them. Additionally, points representing each observation (sequenced sample) can be projected perpendicularly on the vectors of families or the vectors of the physicochemical parameters and give an indication of their corresponding values in such observations. The origin represents the mean value, projections in the same direction as the vector indicate values above average, and projections in the opposite direction represent values below average.
For both nitrogen and organic matter degrading bacterial families, DO, EC, and temperature displayed a higher influence on the bacterial communities in the ST and the UAF than on the communities present in the HFCW (Figure 9a,b). Organic matter removal is performed mainly by ammonification and methanogenesis in the ST and the UAF. The RDA results suggested that temperature affected the nitrogen removal related families within the ST and the UAF. It has been reported that nitrification processes can occur within a wide temperature range (16.5 to 32.5 °C) with an optimal range of 20 to 25 °C [73]. As shown in Table 1, the temperatures recorded at the output of the ST and the UAF were 21.06 ± 1.97 °C and 20.91 ± 2.31 °C, respectively. Although the temperature of the anaerobic stages is within the optimal range for denitrification, slight temperature changes may cause variations in the composition of the communities related to nitrogen removal. Temperature is also essential for anaerobic digestion, especially for the hydrolysis of complex organic compounds, whose breakdown is highly sensitive to temperature [87]. Methanogenic activity is reduced 10–20 times at low temperature (<15 °C) in comparison to activity at 35 °C [94]. Advantageously, wastewater treatment systems in tropical or subtropical regions are less affected by this issue, since wastewater temperature remains stable at above 25 °C throughout the year [95].
EC is used to measure the number of ions relative to salinity, a characteristic of wastewater that significantly affects bacterial communities in treatment systems [96]. Figure 9b shows how EC affects the bacterial families related to organic matter degradation in specific samples of the UAF. The most abundant families in the UAF (of those related to organic matter degradation) were the Syntrophaceae, Clostridiaceae, Sinobacteraceae, Geobacteraceae, and Ruminococcaceae (Figure 7a), suggesting that these bacteria are more sensitive to variation in the salinity of wastewater. All these families have been identified in high salinity environments. The families Syntrophaceae and Clostridiaceae have been found in an acclimated marine sediment-derived culture used for biomethane production under high salinity conditions [97]. The presence and overgrowth of Sinobacteraceae has been related to high salinity conditions in shrimp culture enclosure ecosystems [98]. Further, the member Glk. subterraneus of the family Geobacteraceae, is a halotolerant bacterium that has been associated with high current generation (>1 A m−2) in electroactive biofilms used for microbial fuel cell technology [99]. Finally, the relative abundance of Ruminococcaceae is known to increase in salt stress conditions in a UAF used to produce methane from molasses wastewater [100]. The results found here suggest that our experimental system is tolerant of high salinity conditions, increasing its viability and applicability for treating different wastewater types.
Buffer capacity has been reported in anaerobic digestion processes, which explains why pH does not significantly affect bacterial communities in the anaerobic phases [101]. Higher nitrification rates have been reported in CW with pH ranges of 7.0–7.5 [101,102], while denitrification processes are optimal at a pH of 7.5 [103]. The pH measured at the outflow of the HFCW was 7.4 ± 0.4, which is within the optimal range for nitrification and methanogenic bacteria. The results also suggest that pH has a higher influence on communities in the HFCW than on those in the anaerobic stages (Figure 9; Table 2; Tables S15 and S16). Variations in the pH of wastewater can cause stress in bacterial communities, as the intracellular pH of most microorganisms is close to neutral [104]. All the pH measurements recorded in this study (Table 1) were close to 7. However, variations in pH may occur inside the HFCW in specific regions (further pH measurements across the HFCW are required to prove this statement). Interestingly, bacterial communities at the inlet of the HFCW were the most sensitive to pH variation. The most abundant nitrogen degrading families were the Rhodocyclaceae, Xanthomonadaceae, Chromatiaceae and Comamonadaceae and the most abundant organic matter degrading families were Syntrophaceae, Methylococcaceae, Bacteroidaceae, and Sinobacteraceae. The Rhodocyclaceae and Comamonadaceae are denitrifying bacteria that use nitrate or oxygen as electron acceptors and short-fatty acids as electron donors [105], and these families have been reported to be the most abundant in other wetland systems [64,106]. Additionally, the Xanthomonadaceae is involved in forming microbial biofilm and granules as they participate in the production of extracellular polymeric substances [107]. Consequently, as these families are affected by pH variation, it is plausible that this parameter is a determining factor for nitrogen removal and the formation and stability of the wetland microenvironment.
It is reported that the Syntrophaceae family in syntrophic partnership with methanogens (Methylococcaceae) can degrade organics to H2 and CO2 to methane in methanogenic environments [108,109]. Therefore, manipulation of these families may prove useful in reducing the amount of methane produced by the system. However, further investigation is needed to determine the specific species involved in methane oxidation and the specific conditions required to favor their prevalence.
It can be observed in Figure 9 that vectors representing the concentrations of pollutants (BOD5, COD, TKN, NH3-N, ON, TSS, NO3, NO2) are grouped in one single quadrant (quadrant II for nitrogen degrading families and quadrant I for organic matter degrading families). The observations made in the ST can be projected perpendicularly onto the vectors of the physicochemical parameters and give an indication of their corresponding values in such observations. In this case, greater concentrations were always observed at the initial stage (ST) and lower concentrations are found the next two treatment stages (UAF and HFCW).
Temperature, closely linked to climatic variation, is located in the same quadrant as the vectors of the physicochemical parameters. Thus, the vectors of the bacterial families that point in the same direction or in the opposite direction to the vectors of the water quality parameters and temperature (forming small angles or close to plane angles) are highly influenced by the pollutant inlet concentrations and variations in climate. Conversely, the vectors of bacterial families that form perpendicular angles with the vectors of the water quality parameters indicate that these families are barely influenced by variations in the water quality parameters. The families related to nitrogen degradation that were barely influenced by the physicochemical parameters comprised the Pseudomonadaceae, Bacillaceae, Propionibacteriaceae, Xanthomonadaceae, Caulobacteraceae, and Chromatiaceae. Similarly, the Syntrophaceae, Geobacteraceae, Desulfobacteraceae, Acidaminobacteraceae, Syntrophobacteraceae, Hydrogenophilaceae, Methylococcaceae, Xanthobacteraceae and Desulfomicrobiaceae were the organic matter degrading families that were mostly unaffected by water quality. It is important to note this group of bacteria can be considered to provide robustness to the treatment system.
Finally, correlations between specific bacterial families can be analyzed using the data presented in Figure 9. For example, a correlation between the Sinobacteraceae and the Saprospiraceae can be observed in Figure 9b, as the angle between them is close to zero. Similarly, these families are negatively correlated to nitrogen concentration (TKN, ON, and NH3-N), suggesting the existence of a mutualistic interaction between them by which nitrogen degradation is enhanced, however, this type of interaction must be further investigated. Furthermore, the families Sinobacteraceae and Saprospiraceae have been reported to be consumers of organic matter.
In addition, it can be deduced from Figure 9a that the occurrence of the Hyphomicrobiaceae and the Bradyrhizobiaceae is positively correlated, and they are negatively correlated with COD and BOD5 concentrations. These correlations prove the interconnection between biological pathways for pollutant degradation. For instance, nitrogen and organic matter degradation are intimately related in the denitrification pathway, through which an electron is transferred from carbonaceous compounds to gaseous nitrogen [110]. Additionally, proteins contained in organic matter represent a significant amount of organic nitrogen. Protein degradation causes the accumulation of different nitrogenous compounds in wastewater [111]. Future studies should focus on the complex interconnections of pollutant removal pathways and microbial interaction networks.

3.5. Bacterial Communities in Multi-Stage Wwtps Located in Subtropical Regions

To the best of our knowledge, very few studies have focused on analyzing the structure and diversity of microbial communities in multi-stage decentralized WWTPs treating domestic wastewater in tropical and subtropical regions. Bedoya et al. [17] reported the microbial communities within the biosolids of a centralized WWTP treating municipal wastewater in Colombia. This plant uses an activated sludge system to treat wastewater generated by approximately 500,000 people (influent ~1.8 m3/s). The authors found that Proteobacteria (66%) was the major phylum, followed by Actinobacteria, Firmicutes and Bacteroidetes. Similar results were obtained in the present study, in which Proteobacteria were the most abundant in all three treatment units of the system (34% in the ST; 38% in the UAF; 60% in the HFCW). Bacteroidetes and Firmicutes were also some of the most abundant phyla in anaerobic reactors (ST and UAF); additionally, Bacteroidetes and Actinobacteria were highly abundant in the HFCW.
The study of Desta et al. [28] reported the microbial communities within a multi-stage system treating tannery wastewater located in Modjo, Ethiopia. The system was integrated with two anaerobic reactors, followed by one aerobic reactor and a vertical-flow constructed wetland (VFCW) planted with Phragmites australis as a final step. These authors reported a relative abundance of 53% for Firmicutes and 24% for Proteobacteria in the aerobic reactor, a relative abundance of 52% for Firmicutes and 14% for Proteobacteria in the anaerobic reactor, and 44% for both Firmicutes and Proteobacteria in the VFCW [28]. In contrast, in this study, Firmicutes presented a lower relative abundance in the ST (26%) and the UAF (21%), while Proteobacteria showed a higher relative abundance in the ST (34%) and the UAF (28%). Although the system reported by Desta et al. [28] and that described in the present study are both in a subtropical region, the differences in abundance of these important phyla could be attributed to the wastewater characteristics and differences in system configuration, since in Desta et al. [28] the system described included an aerobic reactor that functioned as a pretreatment for the VFCW.
Song et al. [29] studied six activated-sludge WWTPs located in different climatic regions (tropical, subtropical, and temperate) and reported that Proteobacteria, Bacteroidetes, Chloroflexi, Acidobacteria and Nitrospirae were the major phyla in the WWTPs analyzed. However, Actinobacteria, Bacteroidetes, and Chloroflexi were more abundant in subtropical and temperate WWTPs compared to those in tropical regions. In the present study, Proteobacteria, Firmicutes, Bacteroidetes and Caldiserica were the most abundant phyla in the ST and the UAF, while Proteobacteria, Bacteroidetes, Actinobacteria and Chloroflexi were the most abundant in the HFWC. Based on these results, the microbial composition of the HFCW studied here is the most similar to that of the subtropical WWTPs studied by Song et al. [29]. Activated sludge systems and HFCWs are open processes highly affected by climate variations, while ST and UAF are confined spaces where more stable conditions can be maintained even with climate variability. In general, closed systems can present better conditions for bacteria susceptible to climatic variability. In the same study [29], the Nitrospirae phylum presented a higher abundance in moderately high temperatures, reaching higher nitrogen removal rates in tropical regions than in subtropical and temperate regions. This fact can be considered when improving the nitrogen removal rates in the decentralized system studied here. For example, a greenhouse could be installed to house the HFCW to provide higher temperatures inside the system, which could also enhance plant growth and allow for the cultivation of a wider variety of plants.
According to the RDA (Figure 9), family members of Mycobacteriaceae, Microbacteriaceae, Moraxellaceae, and Porphyromonadaceae are positively influenced by temperature. Conversely, temperature showed no significant effect on the families Rhizobiaceae, Nitrospiraceae, Methylococcaceae and Desulfomicrobiaceae. Previous studies have reported that the members of the family Nitrospiraceae are involved in nitrification, a process that may be affected by temperature changes in WWTPs located in regions with temperate climates. However, in tropical and subtropical regions, as in the case of the present study, Nitrospiraceae are not affected significantly by temperature, as the weather is warmer and more stable throughout the year. Accordingly, open systems, such as HFCWs, located in tropical/subtropical regions are adequate in maintaining more stable conditions for microbial communities throughout the year to enhance the wastewater bioremediation processes.
In general, a dominance of Proteobacteria, Actinobacteria, Bacteroidetes, Chloroflexi and Firmicutes can be found in tropical and subtropical regions, based on the studies of WWTPs located in these regions. However, the dominance of a specific phylum in these systems cannot be generalized, as their abundances vary widely from one study to another. Further studies in subtropical regions are required to generalize the microbial communities that may be expected in a WWTP, but these must also consider other factors that affect bacterial distribution, such as the type of wastewater, process features and design, and seasonality, among others. Detailed studies can also be useful in finding bacterial species that are favored in these regions and in developing strategies to use them to enhance the performance of decentralized technologies.

4. Conclusions

Passive wastewater treatment technologies are especially appropriate for tropical and sub-tropical regions as the climatic conditions facilitate adequate and stable performance throughout the year. Furthermore, the cost and infrastructure required to implement these systems in developing countries are acceptable. This study’s contribution lies in the detailed description of the presence and distribution of the bacterial communities throughout a complete wastewater treatment system composed of ST, UAF, and HFCW. The pollutant removal pathways implemented by specific bacterial families within the different treatment stages were elucidated. Additionally, we described possible microbial interactions that enhance the removal of specific pollutants, as well as the influence of physicochemical parameters on the composition of the bacterial communities.
The characterization of the spatial variation in the microbial communities in our experimental system provides an in-depth understanding of the complexity of bacterial communities in a subtropical WWTP that combines an ST, a UAF, and an HFCW, and lays the foundation for future studies where manipulation of these microbial communities can result in better WWTP performance. Future studies should also focus on the complex interconnections of pollutant removal pathways and microbial interaction networks.

Supplementary Materials

The following are available online at https://www.mdpi.com/article/10.3390/w13091157/s1, Table S1. Removal efficiencies of the overall system and for stage; Figure S1. Rarefaction curve of 16S rRNA gene samples; Table S2. Percentage of reads classified as bacterial phyla > 1% using Greengenes 13_8. Comparison between the three treatment stages (ST, UAF and HFCW) for nitrogen degrading families; Table S3. Percentage of reads classified as bacteria phyla > 1% using Greengenes 13_8. Vertical variations within the UAF; Table S4. Percentage of reads classified as bacteria phyla > 1% using Greengenes 13_8. Vertical variations within the HFCW; Table S5. Percentage of reads classified as bacteria phyla > 1% using Greengenes 13_8. Longitudinal variations within the HFCW (Inlet, Middle and Outlet); Table S6. Percentage of reads classified as bacteria family > 1% using Greengenes 13_8. Comparison between the three treatment stages (ST, UAF and HFCW) regarding the nitrogen degrading families; Table S7. Percentage of reads classified as bacteria family > 1% using Greengenes 13_8. Vertical variations of nitrogen degrading families within the UAF; Table S8. Percentage of reads classified as bacteria family > 1% using Greengenes 13_8. Vertical variations of nitrogen degrading families within the HFCW; Table S9. Percentage of reads classified as bacteria family removal > 1% using Greengenes 13_8. Longitudinal variations of nitrogen degrading families within the HFCW (Inlet, Middle and Outlet); Table S10. Percentage of reads classified as bacteria family > 1% using Greengenes 13_8. Comparison between the three treatment stages (ST, UAF and HFCW) for organic matter degrading families; Table S11. Percentage of reads classified as bacteria family > 1% using Greengenes 13_8 involved in organic degradation at vertical variations within the UAF; Table S12. Percentage of reads classified as bacteria > 1% using Greengenes 13_8 involved in organic degradation of vertical variations within the HFCW depth; Table S13. Percentage of reads classified as bacteria family > 1% using Greengenes 13_8. Longitudinal variations of organic matter degrading families within the HFCW (Inlet, Middle and Outlet); Table S14. PerMANOVA and ANOSIM analyses for the vertical (UAF and HFCW) and longitudinal variations (HFCW) for nitrogen and organic matter degrading families; Figure S2. PCoA for nitrogen removal related bacterial families. (a) Comparison between the treatment units (ST, UAF, and HFCW), (b) Vertical variations within the UAF. (c) Longitudinal variations within the HFCW (d) Vertical variation within the HFCW; Figure S3. PCoA for organic matter removal degrading families. (a) Comparison between the treatment units (ST, UAF, and HFCW), (b) Vertical variations within the UAF. (c) Longitudinal variations within the HFCW (d) Vertical variation within the HFCW; Table S15. RDA for nitrogen degrading families (first four significant redundancy components; Table S16. RDA for organic matter degrading families (first four significant redundancy components).

Author Contributions

Conceptualization, M.S.G.-H., C.S.-G. and J.d.A.; methodology, M.V.G. and M.S.G.-H.; software, M.V.G., O.D.T. and C.Y.-M.; validation, M.S.G.-H., J.d.A. and C.S.-G.; formal analysis, M.V.G.; investigation, M.V.G. and A.F.d.C.; resources, M.S.G.-H., C.S.-G. and J.d.A.; data curation, M.V.G. and O.D.T.; writing—original draft preparation, M.V.G. and A.F.d.C..; writing—review and editing, M.S.G.-H.; visualization, C.Y.-M.; supervision, M.S.G.-H. and C.S.-G.; project administration, M.S.G.-H., C.S.-G. and J.d.A.; funding acquisition, M.S.G.-H., C.S.-G. and J.d.A. All authors have read and agreed to the published version of the manuscript.

Funding

This research was funded by Tecnológico de Monterrey and Centro de Investigación y Asistencia en Tecnología y Diseño del Estado de Jalisco, A. C., Public Research Center of the National Council of Science and Technology, Government of México.

Institutional Review Board Statement

Not applicable.

Informed Consent Statement

Not applicable.

Data Availability Statement

The sequencing run data presented in this study are deposited and public available at the Sequence Read Archive on the NCBI with the following link: https://www.ncbi.nlm.nih.gov/bioproject/PRJNA700667 (accessed on 12 April 2021).

Acknowledgments

The authors appreciate the effort and excellent work carried out by CIATEJ’s analytical services unit, who at all times supported the timely registration and processing of samples for analysis. Also, the authors are grateful to Tecnológico de Monterrey, Campus Guadalajara for allowing access to the laboratories and facilities of the Department of Bioengineering.

Conflicts of Interest

The authors declare no conflict of interest. The technology involved in this paper was already protected by “Centro de Investigación y Asistencia en Tecnología y Diseño del Estado de Jalisco, A. C.” under the law of the Mexican Institute of Industrial Protection, number MX/a/2010/014332.

References

  1. Water and the Sustainable Development Goals (SDGs)|2015 UN-Water Annual International Zaragoza Conference. Water and Sustainable Development: From Vision to Action. 15–17 January 2015. Available online: https://www.un.org/waterforlifedecade/waterandsustainabledevelopment2015/open_working_group_sdg.shtml (accessed on 4 November 2020).
  2. Zurita, F.; Roy, E.D.; White, J.R. Municipal Wastewater Treatment in Mexico: Current Status and Opportunities for Employing Ecological Treatment Systems. Environ. Technol. 2012, 33, 1151–1158. [Google Scholar] [CrossRef]
  3. De Anda, J.; López-López, A.; Villegas-García, E.; Valdivia-Aviña, K. High-Strength Domestic Wastewater Treatment and Reuse with Onsite Passive Methods. Water 2018, 10, 99. [Google Scholar] [CrossRef] [Green Version]
  4. Fernández del Castillo, A.; Verduzco Garibay, M.; Senés-Guerrero, C.; Yebra-Montes, C.; de Anda, J.; Gradilla-Hernández, M.S. Mathematical Modeling of a Domestic Wastewater Treatment System Combining a Septic Tank, an Up Flow Anaerobic Filter, and a Constructed Wetland. Water 2020, 12, 3019. [Google Scholar] [CrossRef]
  5. Álvarez, J.A.; Ruíz, I.; Soto, M. Anaerobic Digesters as a Pretreatment for Constructed Wetlands. Ecol. Eng. 2008, 33, 54–67. [Google Scholar] [CrossRef]
  6. Zhang, L.; De Vrieze, J.; Hendrickx, T.L.G.; Wei, W.; Temmink, H.; Rijnaarts, H.; Zeeman, G. Anaerobic Treatment of Raw Domestic Wastewater in a UASB-Digester at 10 °C and Microbial Community Dynamics. Chem. Eng. J. 2018, 334, 2088–2097. [Google Scholar] [CrossRef]
  7. Xiong, W.; Wang, L.; Zhou, N.; Fan, A.; Wang, S.; Su, H. High-Strength Anaerobic Digestion Wastewater Treatment by Aerobic Granular Sludge in a Step-by-Step Strategy. J. Environ. Manag. 2020, 262, 110245. [Google Scholar] [CrossRef]
  8. Abedi, T.; Mojiri, A. Constructed Wetland Modified by Biochar/Zeolite Addition for Enhanced Wastewater Treatment. Environ. Technol. Innov. 2019, 16, 100472. [Google Scholar] [CrossRef]
  9. Huang, J.; Cao, C.; Liu, J.; Yan, C.; Xiao, J. The Response of Nitrogen Removal and Related Bacteria within Constructed Wetlands after Long-Term Treating Wastewater Containing Environmental Concentrations of Silver Nanoparticles. Sci. Total Environ. 2019, 667, 522–531. [Google Scholar] [CrossRef]
  10. Tao, W. Microbial Removal and Plant Uptake of Nitrogen in Constructed Wetlands: Mesocosm Tests on Influencing Factors. Environ. Sci. Pollut. Res. 2018, 25. [Google Scholar] [CrossRef]
  11. Knowles, P.; Dotro, G.; Nivala, J.; García, J. Clogging in Subsurface-Flow Treatment Wetlands: Occurrence and Contributing Factors. Ecol. Eng. 2011, 37, 99–112. [Google Scholar] [CrossRef]
  12. Handayani, N.I.; Yuliasni, R.; Setianingsih, N.I.; Budiarto, A. Full Scale Application of Integrated Upflow Anaerobic Filter (UAF)-Constructed Wetland (CWs) in Small Scale Batik Industry Wastewater Treatment. J. Ris. Teknol. Pencegah. Pencemaran Ind. 2020, 11, 27–35. [Google Scholar] [CrossRef]
  13. Ruiz, I.; Álvarez, J.A.; Díaz, M.A.; Serrano, L.; Soto, M. Municipal Wastewater Treatment in an Anaerobic Digester-Constructed Wetland System. Environ. Technol. 2008, 29, 1249–1256. [Google Scholar] [CrossRef]
  14. Wu, H.; Zhang, J.; Ngo, H.H.; Guo, W.; Hu, Z.; Liang, S.; Fan, J.; Liu, H. A Review on the Sustainability of Constructed Wetlands for Wastewater Treatment: Design and Operation. Bioresour. Technol. 2015, 175, 594–601. [Google Scholar] [CrossRef]
  15. Rajan, R.J.; Sudarsan, J.S.; Nithiyanantham, S. Microbial Population Dynamics in Constructed Wetlands: Review of Recent Advancements for Wastewater Treatment. Environ. Eng. Res. 2018, 24, 181–190. [Google Scholar] [CrossRef]
  16. Jia, F.; Lai, C.; Chen, L.; Zeng, G.; Huang, D.; Liu, F.; Li, X.; Luo, P.; Wu, J.; Qin, L. Spatiotemporal and Species Variations in Prokaryotic Communities Associated with Sediments from Surface-Flow Constructed Wetlands for Treating Swine Wastewater. Chemosphere 2017, 185, 1–10. [Google Scholar] [CrossRef]
  17. Bedoya, K.; Coltell, O.; Cabarcas, F.; Alzate, J.F. Metagenomic Assessment of the Microbial Community and Methanogenic Pathways in Biosolids from a Municipal Wastewater Treatment Plant in Medellín, Colombia. Sci. Total Environ. 2019, 648, 572–581. [Google Scholar] [CrossRef]
  18. Zhang, C.-B.; Wang, J.; Liu, W.-L.; Zhu, S.-X.; Ge, H.-L.; Chang, S.X.; Chang, J.; Ge, Y. Effects of Plant Diversity on Microbial Biomass and Community Metabolic Profiles in a Full-Scale Constructed Wetland. Ecol. Eng. 2010, 36, 62–68. [Google Scholar] [CrossRef]
  19. He, T.; Guan, W.; Luan, Z.; Xie, S. Spatiotemporal Variation of Bacterial and Archaeal Communities in a Pilot-Scale Constructed Wetland for Surface Water Treatment. Appl. Microbiol. Biotechnol. 2015, 100. [Google Scholar] [CrossRef] [PubMed]
  20. Cao, Q.; Wang, H.; Chen, X.; Wang, R.; Liu, J. Composition and Distribution of Microbial Communities in Natural River Wetlands and Corresponding Constructed Wetlands. Ecol. Eng. 2017, 98, 40–48. [Google Scholar] [CrossRef]
  21. Button, M.; Nivala, J.; Weber, K.P.; Aubron, T.; Müller, R.A. Microbial Community Metabolic Function in Subsurface Flow Constructed Wetlands of Different Designs. Ecol. Eng. 2015, 80, 162–171. [Google Scholar] [CrossRef]
  22. Sánchez, O. Constructed Wetlands Revisited: Microbial Diversity in the–Omics Era. Microb. Ecol. 2017, 73, 722–733. [Google Scholar] [CrossRef]
  23. Fu, G.; Huangshen, L.; Guo, Z.; Zhou, Q.; Wu, Z. Effect of Plant-Based Carbon Sources on Denitrifying Microorganisms in a Vertical Flow Constructed Wetland. Bioresour. Technol. 2017, 224, 214–221. [Google Scholar] [CrossRef]
  24. Ferrera, I.; Sánchez, O. Insights into Microbial Diversity in Wastewater Treatment Systems: How Far Have We Come? Biotechnol. Adv. 2016, 34, 790–802. [Google Scholar] [CrossRef] [Green Version]
  25. He, G.; Yi, F.; Zhou, S.; Lin, J. Microbial Activity and Community Structure in Two Terrace-Type Wetlands Constructed for the Treatment of Domestic Wastewater. Ecol. Eng. 2014, 67, 198–205. [Google Scholar] [CrossRef]
  26. Cheng, Y.; Kong, J.; Li, M. High-Throughput Sequencing Analysis of Bacterial Community Spatiotemporal Distribution in Response to Clogging in Vertical Flow Constructed Wetlands. Bioresour. Technol. 2018, 248, 104–112. [Google Scholar] [CrossRef]
  27. Li, B.; Chen, J.; Wu, Z.; Wu, S.; Xie, S.; Liu, Y. Seasonal and Spatial Dynamics of Denitrification Rate and Denitrifier Community in Constructed Wetland Treating Polluted River Water. Int. Biodeterior. Biodegrad. 2018, 126, 143–151. [Google Scholar] [CrossRef]
  28. Desta, A.F.; Assefa, F.; Leta, S.; Stomeo, F.; Wamalwa, M.; Njahira, M.; Appolinaire, D. Microbial Community Structure and Diversity in an Integrated System of Anaerobic-Aerobic Reactors and a Constructed Wetland for the Treatment of Tannery Wastewater in Modjo, Ethiopia. PLOS ONE 2014, 9, e115576. [Google Scholar] [CrossRef] [PubMed]
  29. Song, Y.; Mhuantong, W.; Liu, S.-Y.; Pisutpaisal, N.; Wongwilaiwalin, S.; Kanokratana, P.; Wang, A.-J.; Jiang, C.-Y.; Champreda, V.; Qiu, D.-R.; et al. Tropical and Temperate Wastewater Treatment Plants Assemble Different and Diverse Microbiomes. Appl. Microbiol. Biotechnol. 2021, 105, 853–867. [Google Scholar] [CrossRef] [PubMed]
  30. CONAGUA Resúmenes Mensuales de Temperaturas y Lluvia. Available online: https://smn.conagua.gob.mx/es/climatologia/temperaturas-y-lluvias/resumenes-mensuales-de-temperaturas-y-lluvias (accessed on 9 November 2020).
  31. Eaton, A.D.; Clesceri, L.S.; Rice, E.W.; Greenberg, A.E.; Franson, M.A.H. Standard Methods for the Examination of Water and Wastewater. American Public Health Association, American Water Works Association, Water Environment Federation. Port City Baltim. 2005, 21. [Google Scholar]
  32. Kuczynski, J.; Stombaugh, J.; Walters, W.A.; González, A.; Caporaso, J.G.; Knight, R. Using QIIME to Analyze 16S RRNA Gene Sequences from Microbial Communities. Curr. Protoc. Bioinform. 2011, 36, 10.7. [Google Scholar] [CrossRef] [Green Version]
  33. Bokulich, N.A.; Kaehler, B.D.; Rideout, J.R.; Dillon, M.; Bolyen, E.; Knight, R.; Huttley, G.A.; Caporaso, J.G. Optimizing Taxonomic Classification of Marker Gene Amplicon Sequences. PeerJ Prepr. 2018, 6, e3208v2. [Google Scholar]
  34. McDonald, D.; Price, M.N.; Goodrich, J.; Nawrocki, E.P.; DeSantis, T.Z.; Probst, A.; Andersen, G.L.; Knight, R.; Hugenholtz, P. An Improved Greengenes Taxonomy with Explicit Ranks for Ecological and Evolutionary Analyses of Bacteria and Archaea. ISME J. 2012, 6, 610–618. [Google Scholar] [CrossRef]
  35. Hall, M.; Beiko, R. 16S rRNA Gene Analysis with QIIME2: Methods and Protocols. In Methods in Molecular Biology; Humana Press: New York, NY, USA, 2018; pp. 113–129. ISBN 978-1-4939-8726-9. [Google Scholar]
  36. Hurlbert, S.H. The Nonconcept of Species Diversity: A Critique and Alternative Parameters. Ecology 1971, 52, 577–586. [Google Scholar] [CrossRef] [PubMed]
  37. Heck, K.L., Jr.; van Belle, G.; Simberloff, D. Explicit Calculation of the Rarefaction Diversity Measurement and the Determination of Sufficient Sample Size. Ecology 1975, 56, 1459–1461. [Google Scholar] [CrossRef]
  38. Love, M.; Anders, S.; Huber, W. Differential Analysis of Count Data–the DESeq2 Package. Genome Biol 2014, 15, 10.1186. [Google Scholar]
  39. Everitt, B.; Hothorn, T. An Introduction to Applied Multivariate Analysis with R; Springer Science & Business Media: Heidelberg/Berlin, Germany, 2011; ISBN 1-4419-9650-8. [Google Scholar]
  40. Zuur, A.; Leno, E.N.; Smith, G.M. Analyzing Ecological Data; Springer: New York, NY, USA, 2011; ISBN 978-0-387-45972-1. [Google Scholar]
  41. Borcard, D.; Gillet, F.; Legendre, P. Numerical Ecology with R; Springer: New York, NY, USA, 2011; ISBN 978-1-4419-7976-6. [Google Scholar]
  42. Oksanen, J.; Blanchet, F.G.; Kindt, R.; Legendre, P.; Minchin, P.; O’Hara, R.; Simpson, G.; Solymos, P.; Stevenes, M.; Wagner, H. Vegan: Community Ecology Package. R Package Version 2.0-2. 2012. Available online: https://www.researchgate.net/publication/282247686_Vegan_Community_Ecology_Package_R_package_version_20-2 (accessed on 12 April 2021).
  43. Clarke, K.R. Non-parametric Multivariate Analyses of Changes in Community Structure. Aust. J. Ecol. 1993, 18, 117–143. [Google Scholar] [CrossRef]
  44. Wickham, H. Ggplot2: Elegant Graphics for Data Analysis; Springer: New York, NY, USA, 2016; ISBN 3-319-24277-6. [Google Scholar]
  45. Dixon, P. VEGAN, a Package of R Functions for Community Ecology. J. Veg. Sci. 2003, 14, 927–930. [Google Scholar] [CrossRef]
  46. Pind, P.F.; Angelidaki, I.; Ahring, B.K.; Stamatelatou, K.; Lyberatos, G. Monitoring and Control of Anaerobic Reactors. In Biomethanation II; Ahring, B.K., Ahring, B.K., Angelidaki, I., Dolfing, J., EUegaard, L., Gavala, H.N., Haagensen, F., Mogensen, A.S., Lyberatos, G., Pind, P.F., et al., Eds.; Advances in Biochemical Engineering/Biotechnology; Springer: Berlin/Heidelberg, Germany, 2003; pp. 135–182. ISBN 978-3-540-45838-8. [Google Scholar]
  47. Tchobanoglus, G.; Burton, F.; Stensel, H.D. Wastewater Engineering: Treatment and Reuse. Am. Water Works Assoc. J. 2003, 95, 201. [Google Scholar]
  48. Zhao, C.; Xie, H.; Xu, J.; Xu, X.; Zhang, J.; Hu, Z.; Liu, C.; Liang, S.; Wang, Q.; Wang, J. Bacterial Community Variation and Microbial Mechanism of Triclosan (TCS) Removal by Constructed Wetlands with Different Types of Plants. Sci. Total Environ. 2015, 505, 633–639. [Google Scholar] [CrossRef]
  49. Zhang, L.; Shen, Z.; Fang, W.; Gao, G. Composition of Bacterial Communities in Municipal Wastewater Treatment Plant. Sci. Total Environ. 2019, 689, 1181–1191. [Google Scholar] [CrossRef]
  50. Usharani, B. Metagenomics Study of the Microbes in Constructed Wetland System Treating Sewage. Int. Lett. Nat. Sci. 2019, 74, 26–48. [Google Scholar]
  51. Ansola, G.; Arroyo, P.; Sáenz de Miera, L.E. Characterisation of the Soil Bacterial Community Structure and Composition of Natural and Constructed Wetlands. Sci. Total Environ. 2014, 473–474, 63–71. [Google Scholar] [CrossRef] [PubMed]
  52. Meng, P.; Pei, H.; Hu, W.; Shao, Y.; Li, Z. How to Increase Microbial Degradation in Constructed Wetlands: Influencing Factors and Improvement Measures. Bioresour. Technol. 2014, 157, 316–326. [Google Scholar] [CrossRef]
  53. Ma, S.; Ma, H.; Hu, H.; Ren, H. Effect of Mixing Intensity on Hydrolysis and Acidification of Sewage Sludge in Two-Stage Anaerobic Digestion: Characteristics of Dissolved Organic Matter and the Key Microorganisms. Water Res. 2019, 148, 359–367. [Google Scholar] [CrossRef]
  54. Li, X.; Li, Y.; Li, Y.; Wu, J. Diversity and Distribution of Bacteria in a Multistage Surface Flow Constructed Wetland to Treat Swine Wastewater in Sediments. Appl. Microbiol. Biotechnol. 2018, 102, 10755–10765. [Google Scholar] [CrossRef]
  55. Nierychlo, M.; Andersen, K.S.; Xu, Y.; Green, N.; Jiang, C.; Albertsen, M.; Dueholm, M.S.; Nielsen, P.H. MiDAS 3: An Ecosystem-Specific Reference Database, Taxonomy and Knowledge Platform for Activated Sludge and Anaerobic Digesters Reveals Species-Level Microbiome Composition of Activated Sludge. Water Res. 2020, 182, 115955. [Google Scholar] [CrossRef]
  56. Iguchi, A.; Terada, T.; Narihiro, T.; Yamaguchi, T.; Kamagata, Y.; Sekiguchi, Y. In Situ Detection and Quantification of Uncultured Members of the Phylum Nitrospirae Abundant in Methanogenic Wastewater Treatment Systems. Microbes Environ. 2008, advpub, 0903100063. [Google Scholar] [CrossRef] [PubMed] [Green Version]
  57. Chen, Y.; Wen, Y.; Tang, Z.; Huang, J.; Zhou, Q.; Vymazal, J. Effects of Plant Biomass on Bacterial Community Structure in Constructed Wetlands Used for Tertiary Wastewater Treatment. Ecol. Eng. 2015, 84, 38–45. [Google Scholar] [CrossRef]
  58. Adrados, B.; Sánchez, O.; Arias, C.A.; Becares, E.; Garrido, L.; Mas, J.; Brix, H.; Morató, J. Microbial Communities from Different Types of Natural Wastewater Treatment Systems: Vertical and Horizontal Flow Constructed Wetlands and Biofilters. Water Res. 2014, 55, 304–312. [Google Scholar] [CrossRef] [Green Version]
  59. Hanada, S.; Sekiguchi, Y. The Phylum Gemmatimonadetes. In The Prokaryotes: Other Major Lineages of Bacteria and The Archaea; Rosenberg, E., DeLong, E.F., Lory, S., Stackebrandt, E., Thompson, F., Eds.; Springer: Berlin/Heidelberg, Germany, 2014; pp. 677–681. ISBN 978-3-642-38954-2. [Google Scholar]
  60. Vohla, C.; Alas, R.; Nurk, K.; Baatz, S.; Mander, Ü. Dynamics of Phosphorus, Nitrogen and Carbon Removal in a Horizontal Subsurface Flow Constructed Wetland. Contam. Nat. Constr. Wetl. Pollut. Dyn. Control 2007, 380, 66–74. [Google Scholar] [CrossRef]
  61. Xu, D.; Liu, S.; Chen, Q.; Ni, J. Microbial Community Compositions in Different Functional Zones of Carrousel Oxidation Ditch System for Domestic Wastewater Treatment. AMB Express 2017, 7, 40. [Google Scholar] [CrossRef] [PubMed] [Green Version]
  62. Yang, K.; Yue, Q.; Kong, J.; Zhao, P.; Gao, Y.; Fu, K.; Gao, B. Microbial Diversity in Combined UAF–UBAF System with Novel Sludge and Coal Cinder Ceramic Fillers for Tetracycline Wastewater Treatment. Chem. Eng. J. 2016, 285, 319–330. [Google Scholar] [CrossRef]
  63. Xu, S.; Yao, J.; Ainiwaer, M.; Hong, Y.; Zhang, Y. Analysis of Bacterial Community Structure of Activated Sludge from Wastewater Treatment Plants in Winter. BioMed Res. Int. 2018, 2018. [Google Scholar] [CrossRef] [PubMed] [Green Version]
  64. He, S.; Wang, Y.; Li, C.; Li, Y.; Zhou, J. The Nitrogen Removal Performance and Microbial Communities in a Two-Stage Deep Sequencing Constructed Wetland for Advanced Treatment of Secondary Effluent. Bioresour. Technol. 2018, 248, 82–88. [Google Scholar] [CrossRef]
  65. Vymazal, J. Plants Used in Constructed Wetlands with Horizontal Subsurface Flow: A Review. Hydrobiologia 2011, 674, 133–156. [Google Scholar] [CrossRef]
  66. Adhikari, J.R.; Lohani, S.P. Design, Installation, Operation and Experimentation of Septic Tank–UASB Wastewater Treatment System. Renew. Energy 2019, 143, 1406–1415. [Google Scholar] [CrossRef]
  67. McFarlane, P.N.; Melcer, H. Pilot-Scale Evaluation of Design Criteria for Anaerobic Photosynthetic Lagoons Treating Fellmongery (Unhairing) Wastewater. Water Res. 1981, 15, 609–613. [Google Scholar] [CrossRef]
  68. Meyer, D.D.; de Andrade, P.A.M.; Durrer, A.; Andreote, F.D.; Corção, G.; Brandelli, A. Bacterial Communities Involved in Sulfur Transformations in Wastewater Treatment Plants. Appl. Microbiol. Biotechnol. 2016, 100, 10125–10135. [Google Scholar] [CrossRef]
  69. Liao, R.; Shen, K.; Li, A.-M.; Shi, P.; Li, Y.; Shi, Q.; Wang, Z. High-Nitrate Wastewater Treatment in an Expanded Granular Sludge Bed Reactor and Microbial Diversity Using 454 Pyrosequencing Analysis. Bioresour. Technol. 2013, 134, 190–197. [Google Scholar] [CrossRef]
  70. Wang, Q.; Hu, Y.; Xie, H.; Yang, Z. Constructed Wetlands: A Review on the Role of Radial Oxygen Loss in the Rhizosphere by Macrophytes. Water 2018, 10, 678. [Google Scholar] [CrossRef] [Green Version]
  71. Stottmeister, U.; Wießner, A.; Kuschk, P.; Kappelmeyer, U.; Kästner, M.; Bederski, O.; Müller, R.A.; Moormann, H. Effects of Plants and Microorganisms in Constructed Wetlands for Wastewater Treatment. Biotechnol. Adv. 2003, 22, 93–117. [Google Scholar] [CrossRef]
  72. Zhang, B.; Xu, X.; Zhu, L. Activated Sludge Bacterial Communities of Typical Wastewater Treatment Plants: Distinct Genera Identification and Metabolic Potential Differential Analysis. AMB Express 2018, 8, 184. [Google Scholar] [CrossRef]
  73. Saeed, T.; Sun, G. A Review on Nitrogen and Organics Removal Mechanisms in Subsurface Flow Constructed Wetlands: Dependency on Environmental Parameters, Operating Conditions and Supporting Media. J. Environ. Manag. 2012, 112, 429–448. [Google Scholar] [CrossRef]
  74. Pincam, T.; Brix, H.; Jampeetong, A. Treatment of Anaerobic Digester Effluent Using Acorus Calamus: Effects on Plant Growth and Tissue Composition. Plants 2018, 7, 36. [Google Scholar] [CrossRef] [Green Version]
  75. Wang, Z.-B.; Miao, M.-S.; Kong, Q.; Ni, S.-Q. Evaluation of Microbial Diversity of Activated Sludge in a Municipal Wastewater Treatment Plant of Northern China by High-Throughput Sequencing Technology. Desalination Water Treat. 2016, 57, 23516–23521. [Google Scholar] [CrossRef]
  76. Wu, H.; Wang, X.; He, X.; Zhang, S.; Liang, R.; Shen, J. Effects of Root Exudates on Denitrifier Gene Abundance, Community Structure and Activity in a Micro-Polluted Constructed Wetland. Sci. Total Environ. 2017, 598, 697–703. [Google Scholar] [CrossRef]
  77. Si, Z.; Song, X.; Wang, Y.; Cao, X.; Zhao, Y.; Wang, B.; Chen, Y.; Arefe, A. Intensified Heterotrophic Denitrification in Constructed Wetlands Using Four Solid Carbon Sources: Denitrification Efficiency and Bacterial Community Structure. Bioresour. Technol. 2018, 267, 416–425. [Google Scholar] [CrossRef]
  78. Heeg, K.; Pohl, M.; Sontag, M.; Mumme, J.; Klocke, M.; Nettmann, E. Microbial Communities Involved in Biogas Production from Wheat Straw as the Sole Substrate within a Two-Phase Solid-State Anaerobic Digestion. Syst. Appl. Microbiol. 2014, 37, 590–600. [Google Scholar] [CrossRef]
  79. Gagen, E.J.; Padmanabha, J.; Denman, S.E.; McSweeney, C.S. Hydrogenotrophic Culture Enrichment Reveals Rumen Lachnospiraceae and Ruminococcaceae Acetogens and Hydrogen-Responsive Bacteroidetes from Pasture-Fed Cattle. FEMS Microbiol. Lett. 2015, 362. [Google Scholar] [CrossRef] [Green Version]
  80. Abdelgadir, A.; Chen, X.; Liu, J.; Xie, X.; Zhang, J.; Zhang, K.; Wang, H.; Liu, N. Characteristics, Process Parameters, and Inner Components of Anaerobic Bioreactors. BioMed Res. Int. 2014, 2014, 841573. [Google Scholar] [CrossRef] [Green Version]
  81. Ma, J.; Wang, Z.; Zou, X.; Feng, J.; Wu, Z. Microbial Communities in an Anaerobic Dynamic Membrane Bioreactor (AnDMBR) for Municipal Wastewater Treatment: Comparison of Bulk Sludge and Cake Layer. Process Biochem. 2013, 48, 510–516. [Google Scholar] [CrossRef]
  82. Jang, H.M.; Kim, J.H.; Ha, J.H.; Park, J.M. Bacterial and Methanogenic Archaeal Communities during the Single-Stage Anaerobic Digestion of High-Strength Food Wastewater. Bioresour. Technol. 2014, 165, 174–182. [Google Scholar] [CrossRef] [PubMed]
  83. Da Silva, M.L.B.; Cantão, M.E.; Mezzari, M.P.; Ma, J.; Nossa, C.W. Assessment of Bacterial and Archaeal Community Structure in Swine Wastewater Treatment Processes. Microb. Ecol. 2015, 70, 77–87. [Google Scholar] [CrossRef]
  84. Shu, D.; He, Y.; Yue, H.; Wang, Q. Microbial Structures and Community Functions of Anaerobic Sludge in Six Full-Scale Wastewater Treatment Plants as Revealed by 454 High-Throughput Pyrosequencing. Bioresour. Technol. 2015, 186, 163–172. [Google Scholar] [CrossRef]
  85. Jia, S.; Han, H.; Zhuang, H.; Hou, B. The Pollutants Removal and Bacterial Community Dynamics Relationship within a Full-Scale British Gas/Lurgi Coal Gasification Wastewater Treatment Using a Novel System. Bioresour. Technol. 2016, 200, 103–110. [Google Scholar] [CrossRef]
  86. Zhong, F.; Wu, J.; Dai, Y.; Yang, L.; Zhang, Z.; Cheng, S.; Zhang, Q. Bacterial Community Analysis by PCR-DGGE and 454-Pyrosequencing of Horizontal Subsurface Flow Constructed Wetlands with Front Aeration. Appl. Microbiol. Biotechnol. 2015, 99, 1499–1512. [Google Scholar] [CrossRef]
  87. Van Lier, J.B.; Mahmoud, N.; Zeeman, G. Anaerobic Wastewater Treatment; IWA Publishing: London, UK, 2008; pp. 415–456. [Google Scholar]
  88. Rajagopal, R.; Choudhury, M.R.; Anwar, N.; Goyette, B.; Rahaman, M.S. Influence of Pre-Hydrolysis on Sewage Treatment in an Up-Flow Anaerobic Sludge BLANKET (UASB) Reactor: A Review. Water 2019, 11, 372. [Google Scholar] [CrossRef] [Green Version]
  89. Enitan-Folami, A.; Kumari, S.; Swalaha, F.; Odiyo, J.; Bux, F. Microbiota of a Full-Scale UASB Reactor Treating Brewery Wastewater Using Illumina MiSeq Sequencing. Open Microbiol. J. 2019, 13, 1–9. [Google Scholar] [CrossRef] [Green Version]
  90. Sidhu, C.; Vikram, S.; Pinnaka, A.K. Unraveling the Microbial Interactions and Metabolic Potentials in Pre- and Post-Treated Sludge from a Wastewater Treatment Plant Using Metagenomic Studies. Front. Microbiol. 2017, 8. [Google Scholar] [CrossRef]
  91. Kim, Y.K.; Yoo, K.; Kim, M.S.; Han, I.; Lee, M.; Kang, B.R.; Lee, T.K.; Park, J. The Capacity of Wastewater Treatment Plants Drives Bacterial Community Structure and Its Assembly. Sci. Rep. 2019, 9, 14809. [Google Scholar] [CrossRef] [Green Version]
  92. Krasnits, E.; Friedler, E.; Sabbah, I.; Beliavski, M.; Tarre, S.; Green, M. Spatial Distribution of Major Microbial Groups in a Well Established Constructed Wetland Treating Municipal Wastewater. Ecol. Eng. 2009, 35, 1085–1089. [Google Scholar] [CrossRef]
  93. Liu, L.; Li, J.; Fan, H.; Huang, X.; Wei, L.; Liu, C. Fate of Antibiotics from Swine Wastewater in Constructed Wetlands with Different Flow Configurations. Int. Biodeterior. Biodegrad. 2019, 140, 119–125. [Google Scholar] [CrossRef]
  94. Rizvi, H.; Ahmad, N.; Abbas, F.; Bukhari, I.H.; Yasar, A.; Ali, S.; Yasmeen, T.; Riaz, M. Start-up of UASB Reactors Treating Municipal Wastewater and Effect of Temperature/Sludge Age and Hydraulic Retention Time (HRT) on Its Performance. Arab. J. Chem. 2015, 8, 780–786. [Google Scholar] [CrossRef] [Green Version]
  95. Hülsen, T.; Barry, E.M.; Lu, Y.; Puyol, D.; Batstone, D.J. Low Temperature Treatment of Domestic Wastewater by Purple Phototrophic Bacteria: Performance, Activity, and Community. Water Res. 2016, 100, 537–545. [Google Scholar] [CrossRef] [Green Version]
  96. Wang, X.; Hu, M.; Xia, Y.; Wen, X.; Ding, K. Pyrosequencing Analysis of Bacterial Diversity in 14 Wastewater Treatment Systems in China. Appl. Environ. Microbiol. 2012, 78, 7042. [Google Scholar] [CrossRef] [Green Version]
  97. Miura, T.; Kita, A.; Okamura, Y.; Aki, T.; Matsumura, Y.; Tajima, T.; Kato, J.; Nakashimada, Y. Effect of Salinity on Methanogenic Propionate Degradation by Acclimated Marine Sediment-Derived Culture. Appl. Biochem. Biotechnol. 2015, 177, 1541–1552. [Google Scholar] [CrossRef]
  98. Hou, D.; Huang, Z.; Zeng, S.; Liu, J.; Wei, D.; Deng, X.; Weng, S.; He, Z.; He, J. Environmental Factors Shape Water Microbial Community Structure and Function in Shrimp Cultural Enclosure Ecosystems. Front. Microbiol. 2017, 8, 2359. [Google Scholar] [CrossRef] [Green Version]
  99. Grattieri, M.; Minteer, S.D. Microbial Fuel Cells in Saline and Hypersaline Environments: Advancements, Challenges and Future Perspectives. Bioelectrochemistry 2018, 120, 127–137. [Google Scholar] [CrossRef]
  100. Chen, Y.-T.; Yu, N.; Sun, Z.-Y.; Gou, M.; Xia, Z.-Y.; Tang, Y.-Q.; Kida, K. Acclimation Improves Methane Production from Molasses Wastewater with High Salinity in an Upflow Anaerobic Filter Reactor: Performance and Microbial Community Dynamics. Appl. Biochem. Biotechnol. 2020, 191, 397–411. [Google Scholar] [CrossRef] [PubMed]
  101. Dutta, A.; Davies, C.; Ikumi, D.S. Performance of Upflow Anaerobic Sludge Blanket (UASB) Reactor and Other Anaerobic Reactor Configurations for Wastewater Treatment: A Comparative Review and Critical Updates. J. Water Supply Res. Technol. Aqua 2018, 67, 858–884. [Google Scholar] [CrossRef]
  102. Liang, Y.; Zhu, H.; Bañuelos, G.; Yan, B.; Zhou, Q.; Yu, X.; Cheng, X. Constructed Wetlands for Saline Wastewater Treatment: A Review. Ecol. Eng. 2017, 98, 275–285. [Google Scholar] [CrossRef]
  103. Lu, S.; Hu, H.; Sun, Y.; Yang, J. Effect of Carbon Source on the Denitrification in Constructed Wetlands. J. Environ. Sci. 2009, 21, 1036–1043. [Google Scholar] [CrossRef]
  104. Fierer, N.; Jackson, R.B. The Diversity and Biogeography of Soil Bacterial Communities. Proc. Natl. Acad. Sci. USA 2006, 103, 626. [Google Scholar] [CrossRef] [Green Version]
  105. Lu, L.; Xing, D.; Ren, Z.J. Microbial Community Structure Accompanied with Electricity Production in a Constructed Wetland Plant Microbial Fuel Cell. Microb. Fuel Cells 2015, 195, 115–121. [Google Scholar] [CrossRef]
  106. Xu, F.; Cao, F.; Kong, Q.; Zhou, L.; Yuan, Q.; Zhu, Y.; Wang, Q.; Du, Y.; Wang, Z. Electricity Production and Evolution of Microbial Community in the Constructed Wetland-Microbial Fuel Cell. Chem. Eng. J. 2018, 339, 479–486. [Google Scholar] [CrossRef]
  107. Cydzik-Kwiatkowska, A. Bacterial Structure of Aerobic Granules Is Determined by Aeration Mode and Nitrogen Load in the Reactor Cycle. Bioresour. Technol. 2015, 181, 312–320. [Google Scholar] [CrossRef]
  108. Taubert, M.; Grob, C.; Crombie, A.; Howat, A.M.; Burns, O.J.; Weber, M.; Lott, C.; Kaster, A.-K.; Vollmers, J.; Jehmlich, N.; et al. Communal Metabolism by Methylococcaceae and Methylophilaceae Is Driving Rapid Aerobic Methane Oxidation in Sediments of a Shallow Seep near Elba, Italy. Environ. Microbiol. 2019, 21, 3780–3795. [Google Scholar] [CrossRef]
  109. Gray, N.D.; Sherry, A.; Grant, R.J.; Rowan, A.K.; Hubert, C.R.J.; Callbeck, C.M.; Aitken, C.M.; Jones, D.M.; Adams, J.J.; Larter, S.R.; et al. The Quantitative Significance of Syntrophaceae and Syntrophic Partnerships in Methanogenic Degradation of Crude Oil Alkanes. Environ. Microbiol. 2011, 13, 2957–2975. [Google Scholar] [CrossRef] [PubMed] [Green Version]
  110. Wu, S.; Kuschk, P.; Brix, H.; Vymazal, J.; Dong, R. Development of Constructed Wetlands in Performance Intensifications for Wastewater Treatment: A Nitrogen and Organic Matter Targeted Review. Water Res. 2014, 57, 40–55. [Google Scholar] [CrossRef] [PubMed]
  111. Westgate, P.J.; Park, C. Evaluation of Proteins and Organic Nitrogen in Wastewater Treatment Effluents. Environ. Sci. Technol. 2010, 44, 5352–5357. [Google Scholar] [CrossRef] [PubMed]
Figure 1. Horizontal flow constructed wetland (HFCW) planted with Agapanthus africanus.
Water 13 01157 g001
Figure 2. Diagram of sampling points for sequencing and water quality analysis where (a) represents a lateral view of the WWTP, sampling points for sequencing analysis are indicated by red boxes and sampling points for water quality analysis (SP1, SP2, SP3, and SP4) are indicated by blue boxes; (b) represents an aerial view of the HFCW, individual samples used in the preparation of the composite samples are grouped in red boxes.
Water 13 01157 g002
Figure 3. Removal efficiencies for each unit and the system overall. The image represents the mean of six observations taken fortnightly for three months (January to March 2020). ST: septic tank; UAF: up-flow anaerobic filter; HFCW: horizontal-flow constructed wetland; BOD5: biological oxygen demand; COD: chemical oxygen demand; TNK: total Kjeldahl nitrogen; NH3-N: ammoniacal nitrogen; ON: organic nitrogen; TSS: total suspended solids; NO2: nitrites, and NO3: nitrates.
Water 13 01157 g003
Figure 4. Phylum level taxonomic classification of bacterial sequences, Others refers to bacteria with relative read abundances < 1%, (a) Comparison between the treatment units (ST, UAF, and HFCW), (b) Vertical variation within the UAF, (c) Longitudinal variation within the HFCW, and (d) Vertical variation within the HFCW.
Water 13 01157 g004
Figure 5. Nitrogen degrading families (a) Comparison between the treatment units (ST, UAF, and HFCW), (b) Vertical variation within the UAF, (c) Longitudinal variation within the HFCW, and (d) Vertical variation within the HFCW.
Water 13 01157 g005
Figure 6. Biplots for nitrogen degrading bacterial families (a) Comparison between the treatment units (ST, UAF, and HFCW), (b) Vertical variation within the UAF. (c) Longitudinal variation within the HFCW (d) Vertical variation within the HFCW. For illustration purposes, only the families that appear in the discussion are shown.
Water 13 01157 g006
Figure 7. Organic matter degrading families (a) Comparison between the treatment units (ST, UAF, and HFCW), (b) Vertical variation within the UAF, (c) Longitudinal variation within the HFCW, and (d) Vertical variation within the HFCW.
Water 13 01157 g007
Figure 8. Biplots for organic matter degrading families (a) Comparison between the treatment units (ST, UAF, and HFCW), (b) Vertical variation within the UAF, (c) Longitudinal variation within the HFCW, (d) Vertical variation within the HFCW. For illustration purposes, only the families that appear in the discussion are shown.
Water 13 01157 g008
Figure 9. Redundancy analysis (RDA) showing correlations between physicochemical parameters and selected bacterial families (a) RDA for nitrogen degrading families, (b) RDA for organic matter degrading bacteria families. Each blue vector represents a physicochemical parameter and each red vector represents a bacterial family. Table 2 presents the bacterial families assigned to each number.
Water 13 01157 g009
Table 1. Average values of physicochemical parameters measured.
OS (n = 24)SP1 (n = 6)SP2 (n = 6)SP3 (n = 6)SP4 (n = 6)
DO (mg/L)0.5 ± 0.50.5 ± 0.50.3 ± 0.10.7 ± 0.50.6 ± 0.7
EC (ms/cm)1.5 ± 0.21.4 ± 0.31.7 ± 0.21.6 ± 0.21.5 ± 0.1
pH7.4 ± 0.77.8 ± 0.97.2 ± 0.77.3 ± 0.77.4 ± 0.4
Temperature (°C)20.4 ± 2.321.0 ± 1.721.1 ± 220.9 ± 2.318.5 ± 2.3
DO: dissolved oxygen; EC: electrical conductivity; OS: overall system; SP1: sampling point 1; SP2: sampling point 2; SP3: sampling point 3; SP4: sampling point 4. The mean values of six observations are presented. Measurements were made fortnightly for three months (January to March 2020) at all four sampling points.
Table 2. Numbers assigned to bacterial families.
A) Nitrogen Degrading FamiliesB) Organic Matter Degrading Families
NumberFamilyNumberFamilyNumberFamily
1Xanthomonadaceae1Desulfobulbaceae19Methylophilaceae
2Caulobacteraceae2Ruminococcaceae20Sphingomonadaceae
3Comamonadaceae3Moraxellaceae21Rhodobacteraceae
4Chromatiaceae4Porphyromonadaceae22Xanthobacteraceae
5Mycobacteriaceae5Bacteroidaceae23Desulfomicrobiaceae
6Microbacteriaceae6Syntrophaceae24Lachnospiraceae
7Rhodocyclaceae7Geobacteraceae25Mogibacteriaceae
8Pseudomonadaceae8Desulfobacteraceae26Clostridiaceae
9Bacillaceae9Acidaminobacteraceae27Desulfovibrionaceae
10Propionibacteriaceae10Syntrophobacteraceae28Lactobacillaceae
11Rhizobiaceae11Hydrogenophilaceae29Enterobacteriaceae
12Cellulomonadaceae12Methylococcaceae
13Thermodesulfovibrionaceae13Acetobacteraceae
14Paenibacillaceae14Sinobacteraceae
15Rhodospirillaceae15Saprospiraceae
16Hyphomicrobiaceae16Chitinophagaceae
17Bradyrhizobiaceae17Methylocystaceae
18Nitrospiraceae18Cytophagaceae
Publisher’s Note: MDPI stays neutral with regard to jurisdictional claims in published maps and institutional affiliations.

