
A New Algorithm for Monitoring Backflow from River to Lake (BRL) Using Satellite Images: A Case of Poyang Lake, China


1
National and Local Joint Engineering Laboratory of Hydraulic Engineering Safety and Efficient Utilization of Water Resources in Poyang Lake Basin, Nanchang Institute of Technology, Nanchang 330099, China
2
State Key Laboratory of Information Engineering in Surveying, Mapping and Remote Sensing, Wuhan University, Wuhan 430079, China
*
Author to whom correspondence should be addressed.
Water 2021, 13(9), 1166; https://doi.org/10.3390/w13091166
Submission received: 9 March 2021
/
Revised: 18 April 2021
/
Accepted: 19 April 2021
/
Published: 23 April 2021
(This article belongs to the Special Issue Water and the Ecosphere in the Anthropocene)
Abstract
:Backflow from river to lake (BRL) usually happens in inland lakes and affects water exchange, matter migration, and variations in the water quality and eco-environment. However, at present, discharge data derived from hydrological stations are the only way to monitor BRL, and the influence scope of BRL has not been monitored through hydrological stations. To address this problem, we propose a novel algorithm to monitor BRL using satellite images of Poyang Lake (the largest freshwater lake in China). The following results were obtained: (1) According to the difference in suspended sediment from rivers and lakes, an algorithm using the total suspended sediment (TSS), which was used as a tracer, was designed for monitoring BRL in Poyang Lake. (2) An innovative extraction method for the mutation line using the TSS was developed to analyze BRL via satellite images. A gradient variation method was developed to extract the mutation line accurately. (3) The satellites with daily acquisition or higher-frequency resolution images (e.g., Moderate-Resolution Imaging Spectroradiometer (MODIS)) were satisfactory for monitoring the characteristics of BRL. The MODIS-derived band combination Rrs(645) − Rrs(859))/(Rrs(555) − Rrs(859) yielded a higher fitting accuracy (R2 = 0.858, RMSE = 10.25 mg/L) derived from an exponential model, which was helpful to highlighting the mutation line. (4) The important parameters of BRL, such as the beginning time, the duration, the end time, and the influence scope, were quantitatively determined by judging the movement of the mutation line. This algorithm was applied to quickly and effectively extract the information of two instances of BRL in Poyang Lake in July 2000 and July to August 2007, and the results were accurate and reasonable. This algorithm can save a great deal on monitoring costs. A BRL monitoring algorithm using remote sensing is an efficient government measure supplement to address the limitations of hydrological stations. These results provide technological support for lake management and can serve as a valuable reference for water bodies similar to Poyang Lake worldwide.
1. Introduction
With the effects of natural climatic conditions and human activities, inland lakes are undergoing dramatic changes, such as shrinking area, deteriorating water quality, and serious damage to the ecological environment [1,2]. These problems have hit a plateau of social sustainable development in inland lakes. Mastering the river-lake relationship is an important task for the virtuous development of the ecological environment in a watershed [3,4]. The water flows from the lake to the river when the water level of the lake is higher than that of the river. The current of the river will flow backward to the lake when the water level of the lake is lower than that of the river, which is called “backflow from river to lake (BRL)”. BRL tends to increase the magnitude of the water levels in the lake’s main flow channels, and the effects of backflow on flow direction and water velocities propagate to virtually upstream [5]. The BRL process, in the functioning of many lakes, may affect the sediment transport and the fate of pollutants in the general water quality [6,7]. Other potential impacts include storage and sediment modifications to the lake [8]. This phenomenon typically occurs in Poyang Lake [9]. Poyang Lake is the largest freshwater lake in China, taking in and sending out water. Its hydrological characteristics depend on water from the Yangtze River and the five rivers in the upper reaches of Poyang Lake. Monitoring of BRL in Poyang Lake has an important role in observing the evolution of the water environment and matter exchange of the lake [10,11], which provides a scientific basis for its comprehensive management. Innovative data mining using time series remote sensing big data for the ecological monitoring of lakes plays an important role in protecting the ecological environment. Therefore, it is necessary to scientifically explore the occurrence, process, and influence of BRL.
BRL is usually monitored by setting up a hydrological station at the junction of the river and lake to monitor the discharge and current direction. Hydrological data can be used to analyze the situation of water entering and flowing into the lake and to monitor whether the BRL phenomenon exists in the lake [12]. However, the historical BRL situation before the construction of the hydrological station cannot be obtained. At present, it is difficult to determine the phenomenon of BRL in many lakes because few lakes have a hydrological station constructed at their exit. Even if there is a hydrological station at the exit of a lake, the influence scope of BRL cannot be obtained due to the hydrological measurement near the station without monitoring a larger area.
Total suspended sediment (TSS) is a critical water quality parameter in the aquatic ecological environment [13]. The transparency, turbidity, and euphotic depth are all closely related to TSS [14,15]. TSS is the main influencing factor of lake geomorphological evolution and an important carrier of nutrient and pollutant transport [16]. However, a difference in TSS concentrations in rivers and lakes usually exists because of different watersheds, different natural or climatic conditions, and artificial factors [17]. As a water color parameter, which is the main factor directly affecting remote sensing signals, the TSS can be retrieved directly from remote sensing images. An empirical model, semi-analytical model, or analytical model can be used, giving it strong universality [18,19]. Secondly, TSS has strong water scattering characteristics and high estimation accuracy using remote sensing [20]. Thirdly, the TSS can be retrieved with higher accuracy than chlorophyll-a because the chlorophyll-a concentration is relatively smaller in a flood season, when BRL usually occurs [21]. According to the difference in water suspended sediment from different watersheds, an algorithm extracting the mutation line of the TSS, which refers to the boundary formed by the great difference between the TSS concentration in river water and that in lake water, would make it possible to monitor BRL. Therefore, we developed an algorithm to dynamically monitor BRL by using remote sensing technology and extract the beginning time, duration, end time, and influence scope of BRL.
Aiming at inland lakes, in this paper we propose using satellite images to retrieve the TSS concentration in lake water to monitor the phenomenon of backflows from Yangtze River to Poyang Lake. This algorithm solves the problem of wholly depending on data from hydrological stations and incomplete information from hydrological station monitoring.
2. Materials and Methods
2.1. Study Area
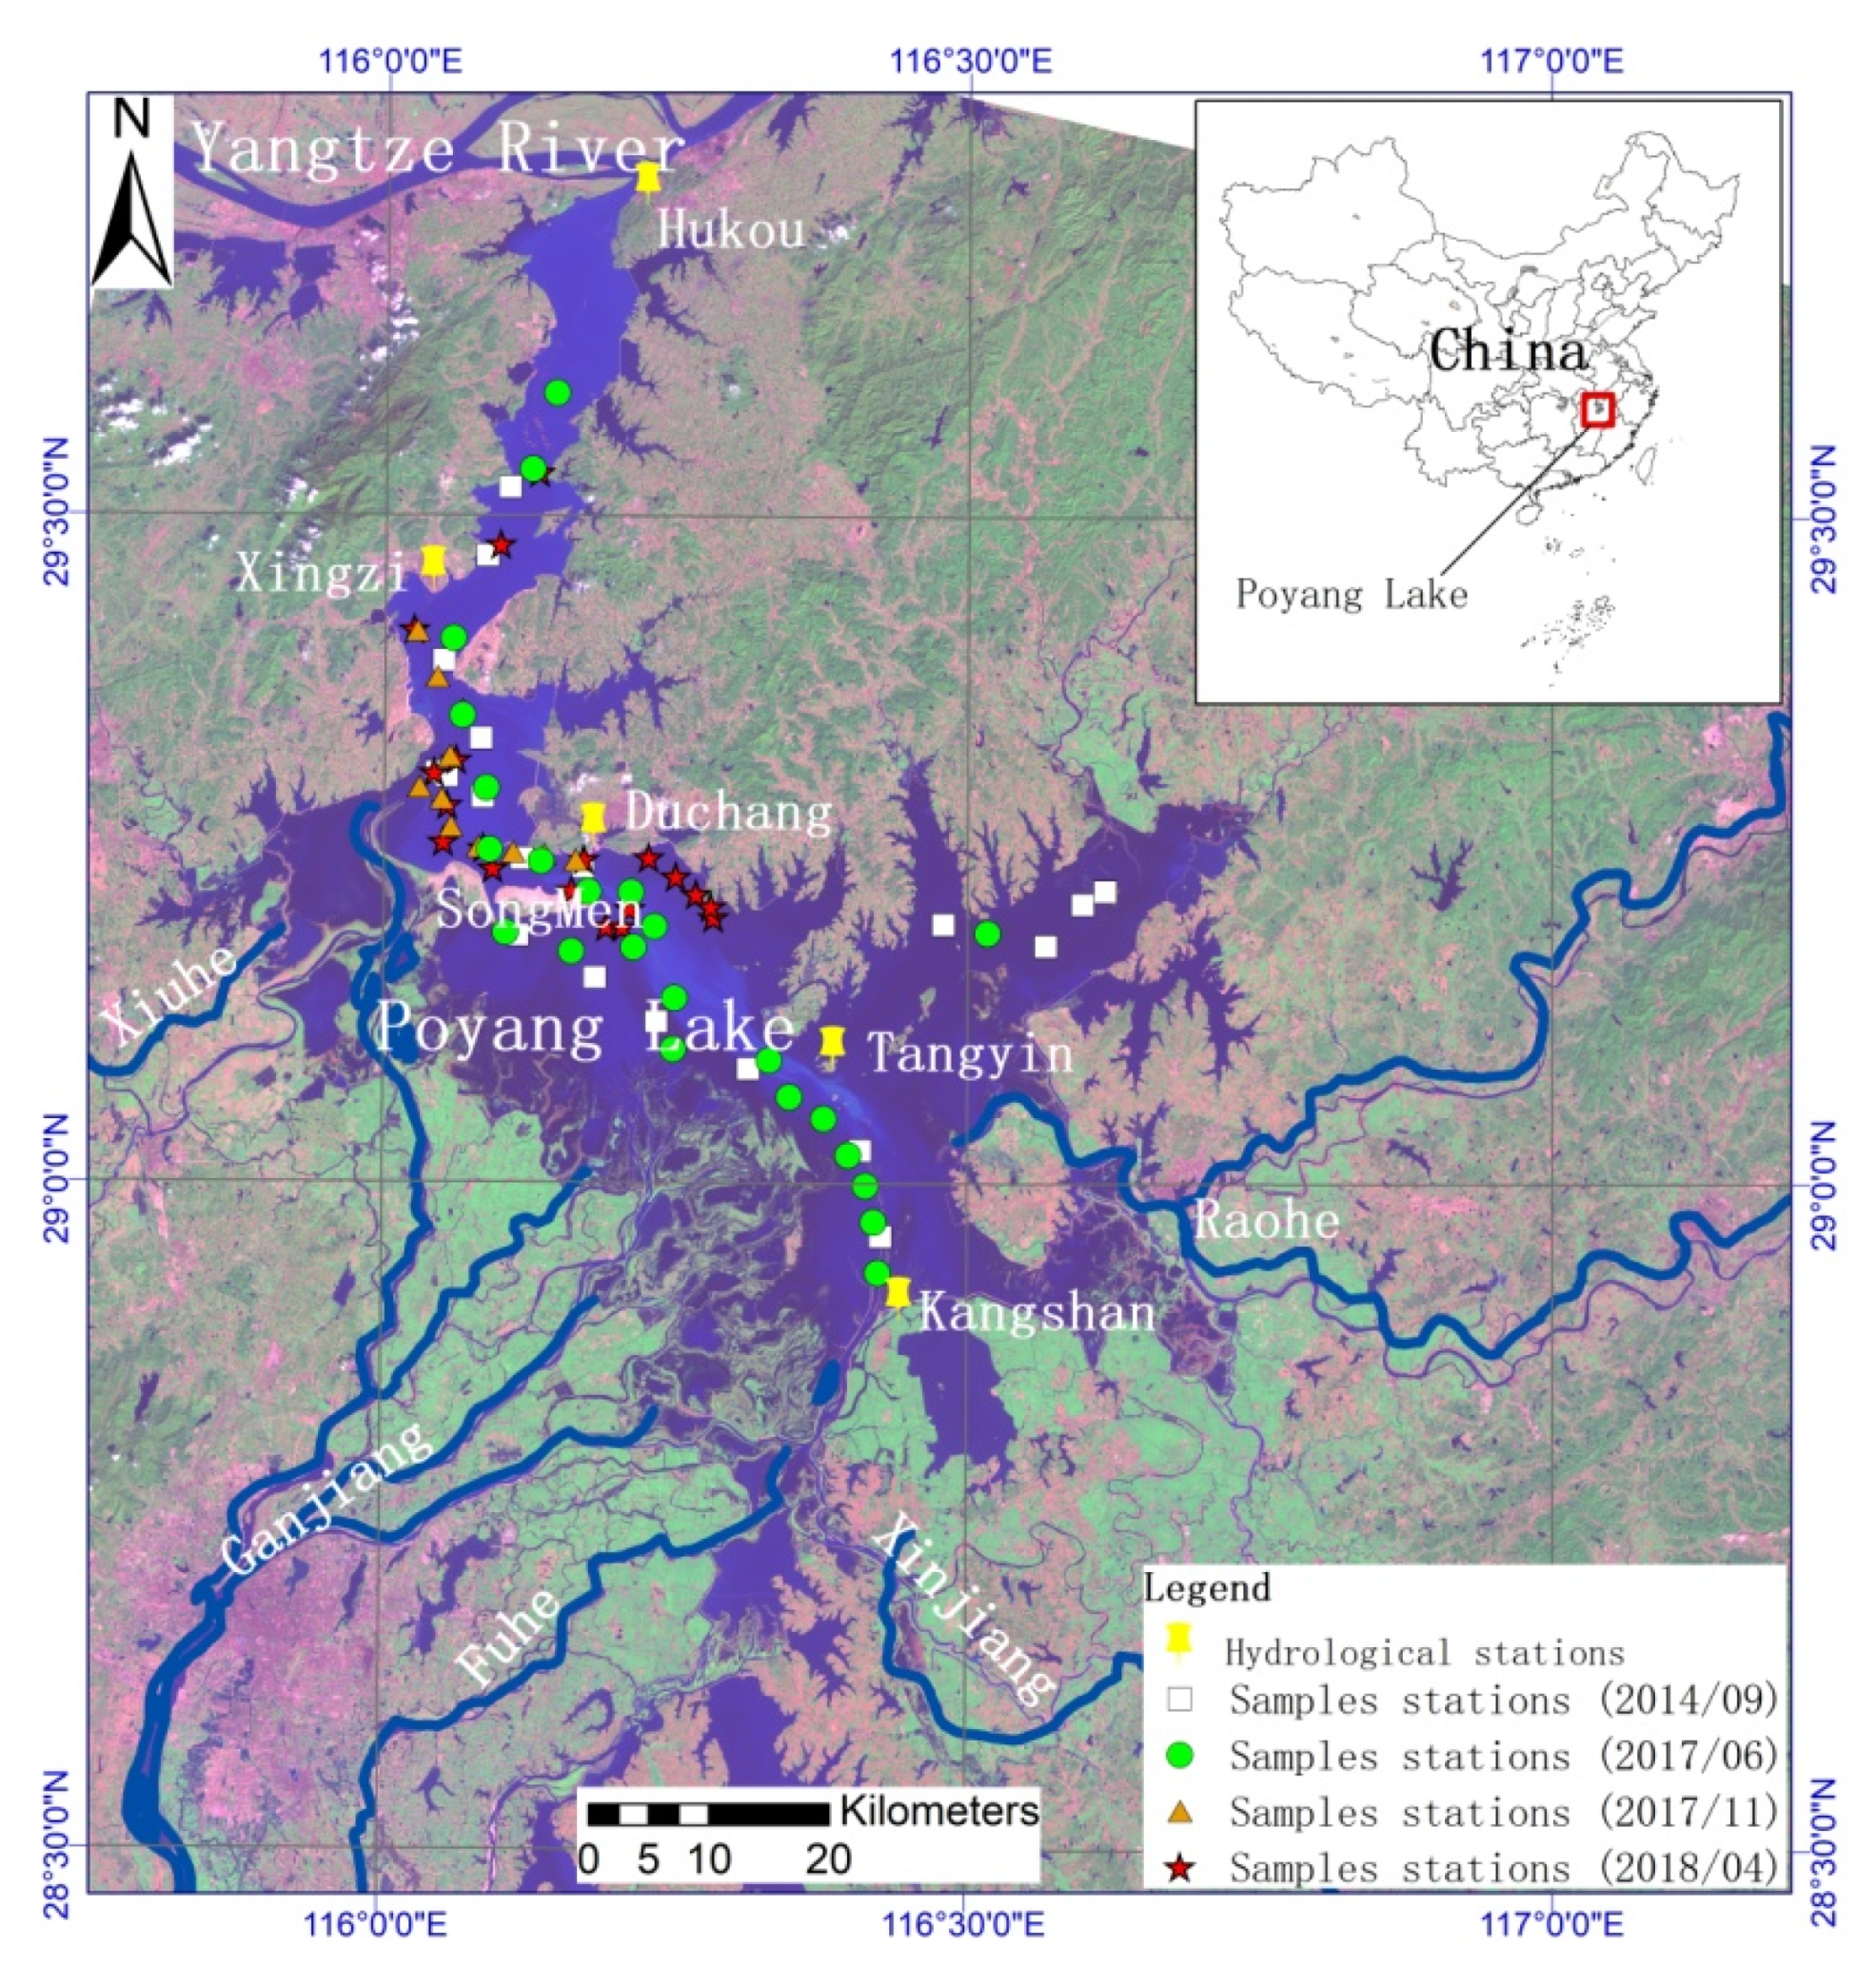
Poyang Lake (115°49′ E–116°46′ E, 28°24′ N–29°46′ N) is located in the north of Jiangxi Province, which is at the middle and lower reaches of the Yangtze River. Poyang Lake Basin is composed of Ganjiang, Fuhe, Xinjiang, Raohe, Xiuhe, and the Poyang Lake area (Figure 1). As a unique inland lake, Poyang Lake has high variability in water level. The flood season begins in April, and the water level usually reaches a maximum value of over 4000 km2 during June or July. On the contrary, the dry season is from November to February the next year, when the river channel is narrow with a water level of less than 1000 km2 [22].
Poyang Lake contains a vast gene pool of animals and plants and is a National Nature Reserve for migratory birds, so the biodiversity of the lake plays an important role. Reports show that the water quality in Poyang Lake is gradually decreasing [23]. The Yangtze River has a great impact on regulating the outflow from the lake, and backflows from the Yangtze River to Poyang Lake are a direct and obvious phenomenon. The main hydrological stations in Poyang Lake include Hukou, Xingzi, Duchang, Tangyin, and Kangshan [24]. Backflows from the Yangtze River to Poyang Lake are monitored using current data from Hukou station because the station is located in the outlet of Poyang Lake—a privileged geographical location for monitoring backflow. BRL occurs when the discharge at Hukou station is negative. The discharge may reverse sometime between July and September, with a frequency of 735 days from 1956 to 2016. In this time, there was no BRL in only 12 years, and BRL occurred in the other 49 years [25].
2.2. In Situ Measurements
In situ measurements of water quality parameters and spectral reflectance curves in Poyang Lake were carried out in September 2014 and June 2017, representing the wet season, and in November 2017 and April 2018, representing the dry season. Seventy-one sampling sites were collected from during four cruises. The total suspended sediment concentration () was measured by filtering water samples on weighted Whatman GF/F glass-fiber filters. The TSS concentration was determined by reweighing the sample after the filter was dried at 45 ℃ for 24 h [26]. The in situ TSS ranged widely from 1 to 168.6 mg/L (mean ρTSS = 40.0 mg/L, standard deviation = 28.6 mg/L).
Samples from all in situ stations were collected to determine the via spectral measurement using an SVC HR-1024 field-portable spectroradiometer (Spectra Vista Corporation, Poughkeepsie, NY, USA), which provides high-spatial-resolution hyperspectral data from 350 to 2500 nm. In the above-water water spectra measurement method used, was computed as follows [27]:
where is the wavelength; denote the radiance spectra of the water-leaving, skylight, downwelling, and upwelling, respectively; r is the Fresnel reflectance of the water surface (about 0.022 for a calm water surface); and is the reflectance (30%, provided by the manufacturer) of the reference plank.
2.3. Remote Sensing Data and Preprocessing
Due to the fact that the backflow duration in Poyang Lake is usually over one day [11], it is necessary to monitor the lake water body using satellite images with a revisit frequency of at least once per day and monitor the whole process of BRL dynamically in real-time. The Moderate-Resolution Imaging Spectroradiometer (MODIS) satellite, with a revisit interval of one day is, thus, an effective satellite for extracting the characteristic parameters of BRL.
The MODIS 500 m resolution daily data and MOD02HKM were downloaded from the NASA website (https://modis.gsfc.nasa.gov/) in 1 April 2020. The images under cloud-free conditions were used to extract the water TSS concentrations for Poyang Lake in July 2000 and July to August 2007.
Before the application of remote sensing images, preprocessing via geometric correction, radiometric correction, and atmospheric correction was carried out. The UTM Zone 50 projection type was used, and WGS84 was selected as the datum. Many atmospheric correction models have been proposed, such as the histogram matching method, dark object method, and the 6S and MODTRAN atmospheric correction models. The 6S and MODTRAN models are founded on the atmospheric transfer method, and the accuracy of the models are higher, but there are more input parameters [22]. Although the histogram matching method and the dark object method are relatively simple, they are built under certain conditions, so the accuracy of correction is not high and the practicability is limited [28]. In this study the MODIS images were atmospherically corrected by applying the Fast Line-of-sight Atmospheric Analysis of Spectral Hypercubes (FLAASH) model based on the MODTRAN4 atmospheric transfer method [29,30]. The reflectances of the satellite images were computed.
2.4. MODIS Spectral Simulation
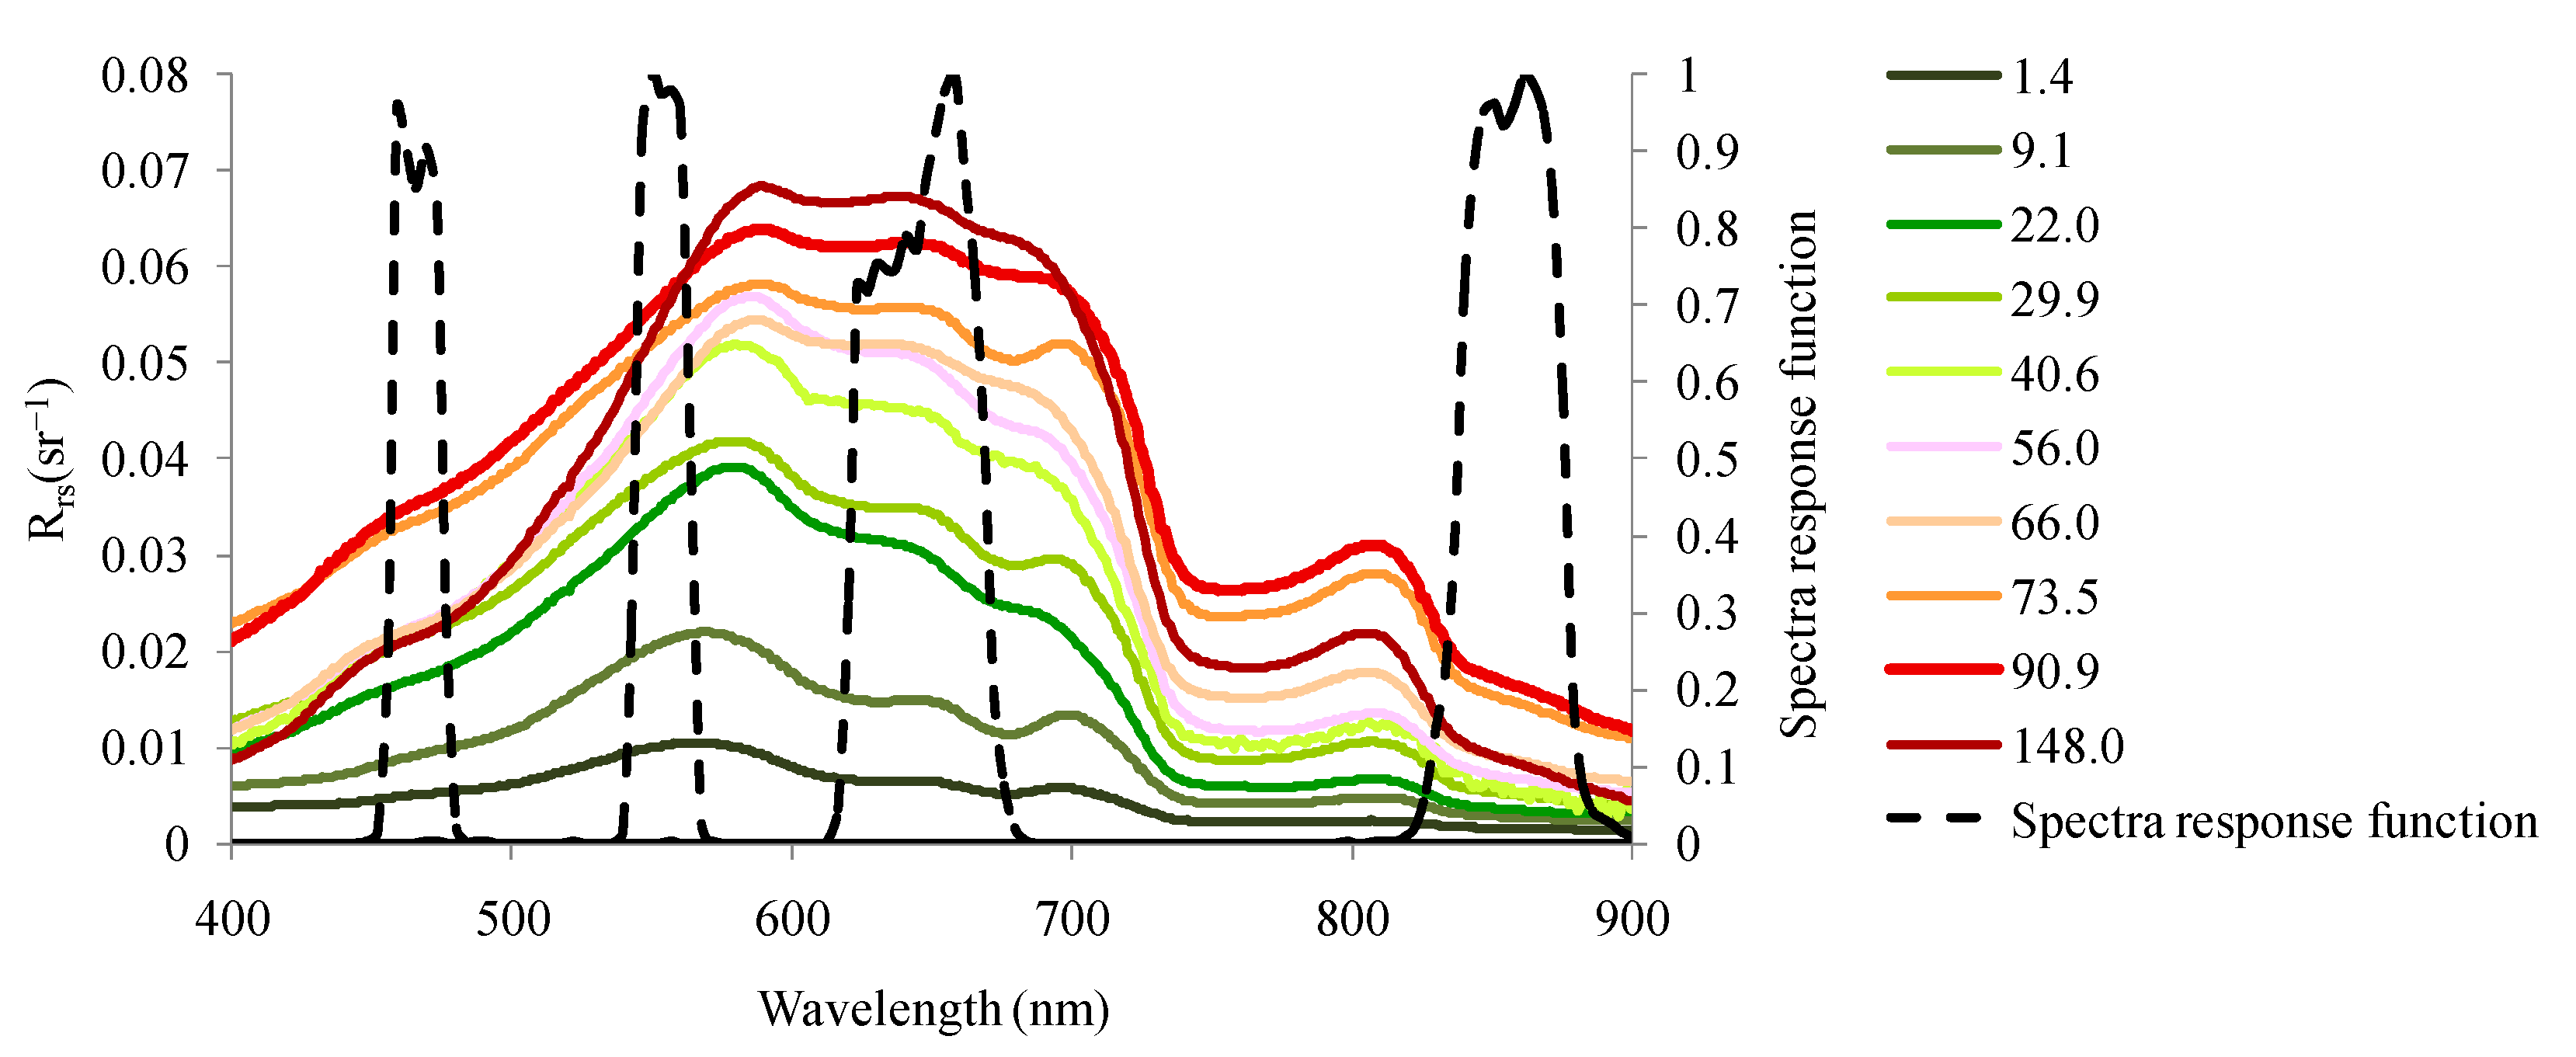
The 500 m resolution MODIS data include seven bands, namely, band 1 (620–670 nm), band 2 (841–876 nm), band 3 (459–479 nm), band 4 (545–564 nm), band 5 (1230–1250 nm), band 6 (1638–1652 nm), and band 7 (2105–2135 nm). Using the measured spectral data to simulate MODIS bands can effectively eliminate atmospheric interference and help to accurately extract band information and establish a model. The field Rrs spectral curve was simulated using the relative spectra response function of the MODIS. The water spectral curve and relative spectral response functions of the MODIS data are shown in Figure 2. The remote sensing reflectance ( of the MODIS was simulated using the following formula [31]:
where and are the starting and ending wavelengths, respectively, of band i; and is the relative spectral response (RSR) function of the MODIS for band i at wavelength .
3. Algorithm Development
3.1. Characteristic Parameters of BRL
Due to the fact that the optical matter in the water of Poyang Lake is dominated by suspended sediment matter [32] it is the most appropriate to use the TSS as a tracer to monitor BRL. If a clear and turbid boundary in the TSS concentration and the mutation line move to the lake area, and the water flowing into the lake shows a smaller or greater TSS concentration, it means that BRL happens at that time (the beginning of BRL). According to the different durations of BRL, we should select time-series images with less than one day resolution to monitor BRL, so that the short-term phenomena of BRL can be found.
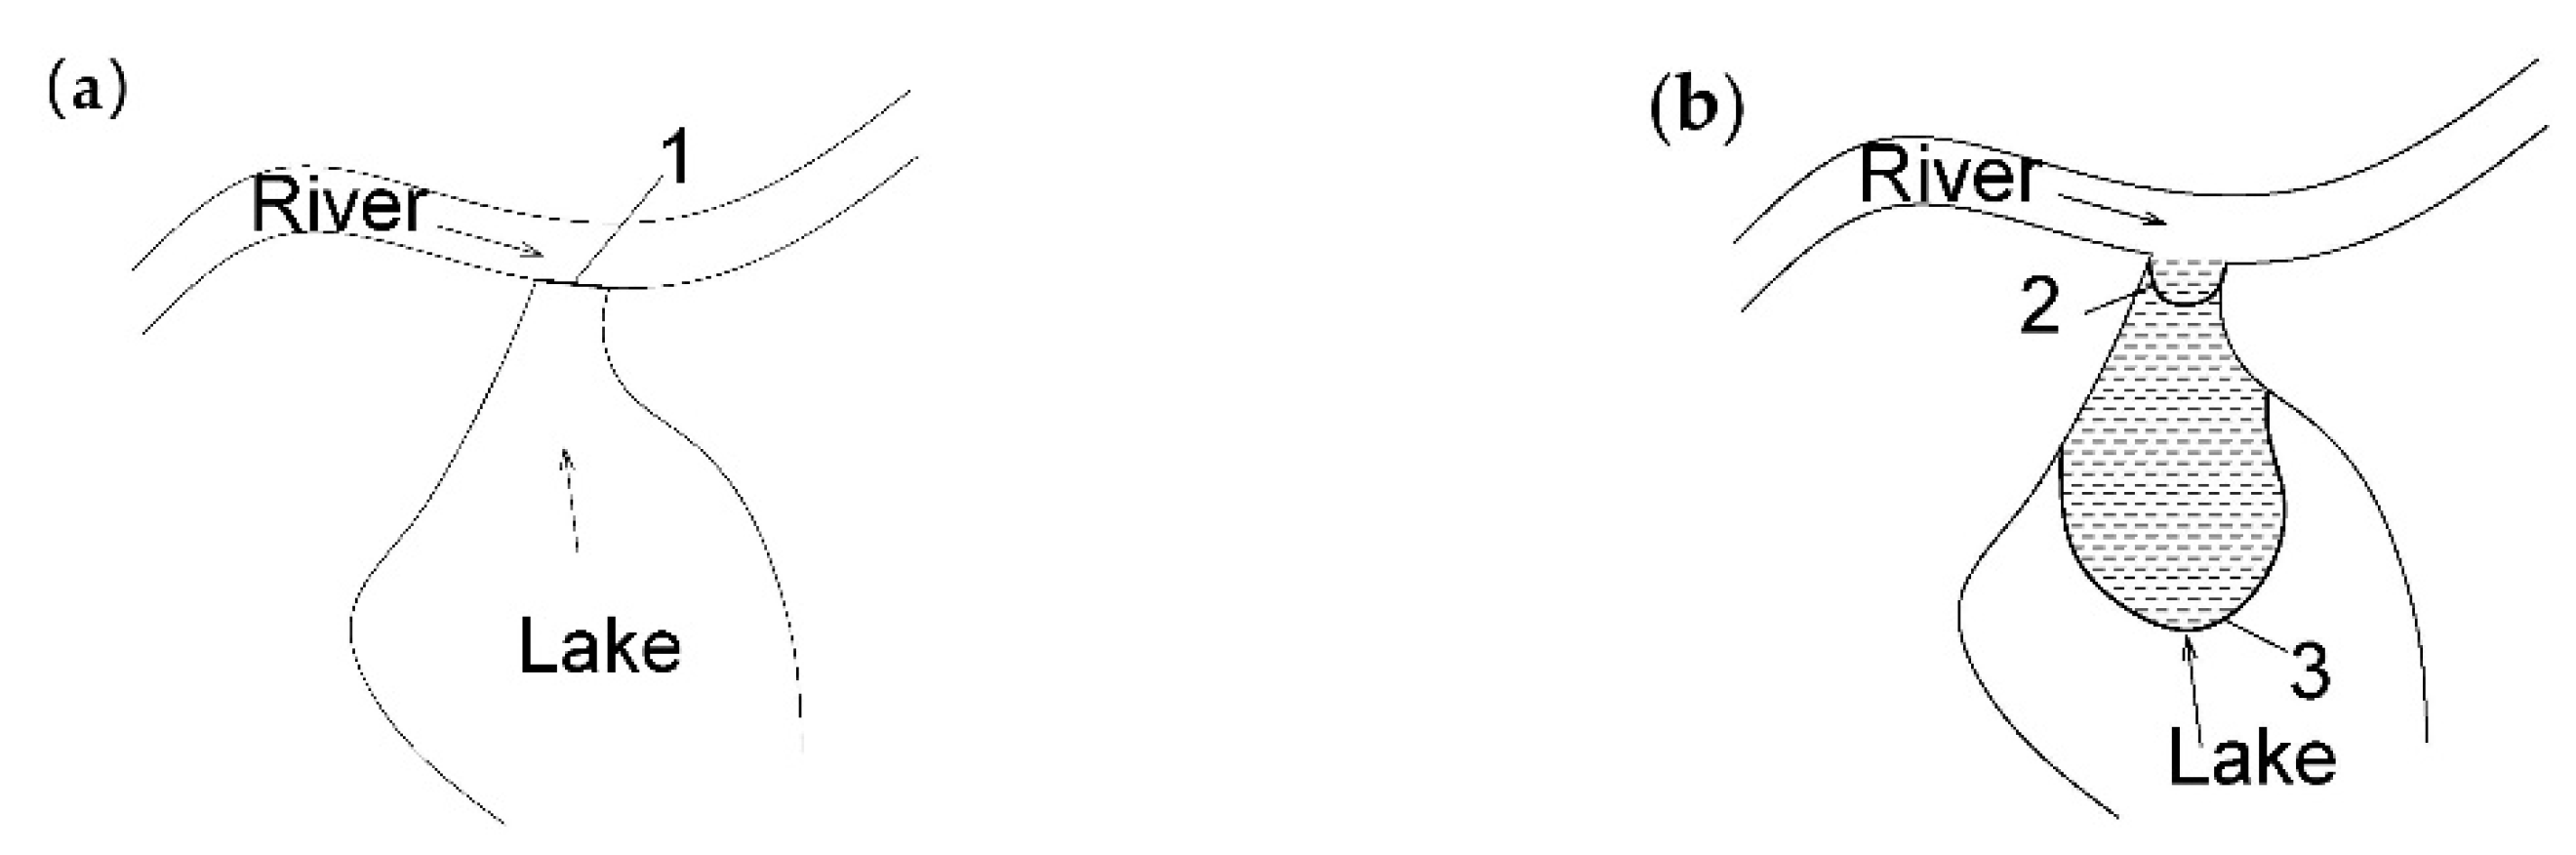
It is key for BRL to monitor the variation degree of the TSS concentration in the water flowing into the lake. Extracting the mutation line of the TSS concentration is an efficient method for this. In this paper, a method for extracting mutation lines is constructed. Firstly, the spatial distributions of the TSS concentration were retrieved using satellite images of lake water, and the TSS concentration at the previous time (ρ(TSSi)) was used as the background value. Secondly, in order to highlight the mutation line, a new image was produced by the subtraction of the spatial distribution of ρ(TSSi) from that of the TSS concentration at the next time point (ρ(TSSj)). In the end, when the ratio of TSS concentrations in the water body area changes greatly more than a selected threshold, the continuous pixels of the concentration difference form the mutation line (Figure 3). The gradient is derived as:
Gradient = |ρ(TSSi) − ρ(TSSj)|/max(ρ(TSSi) or ρ(TSSj))
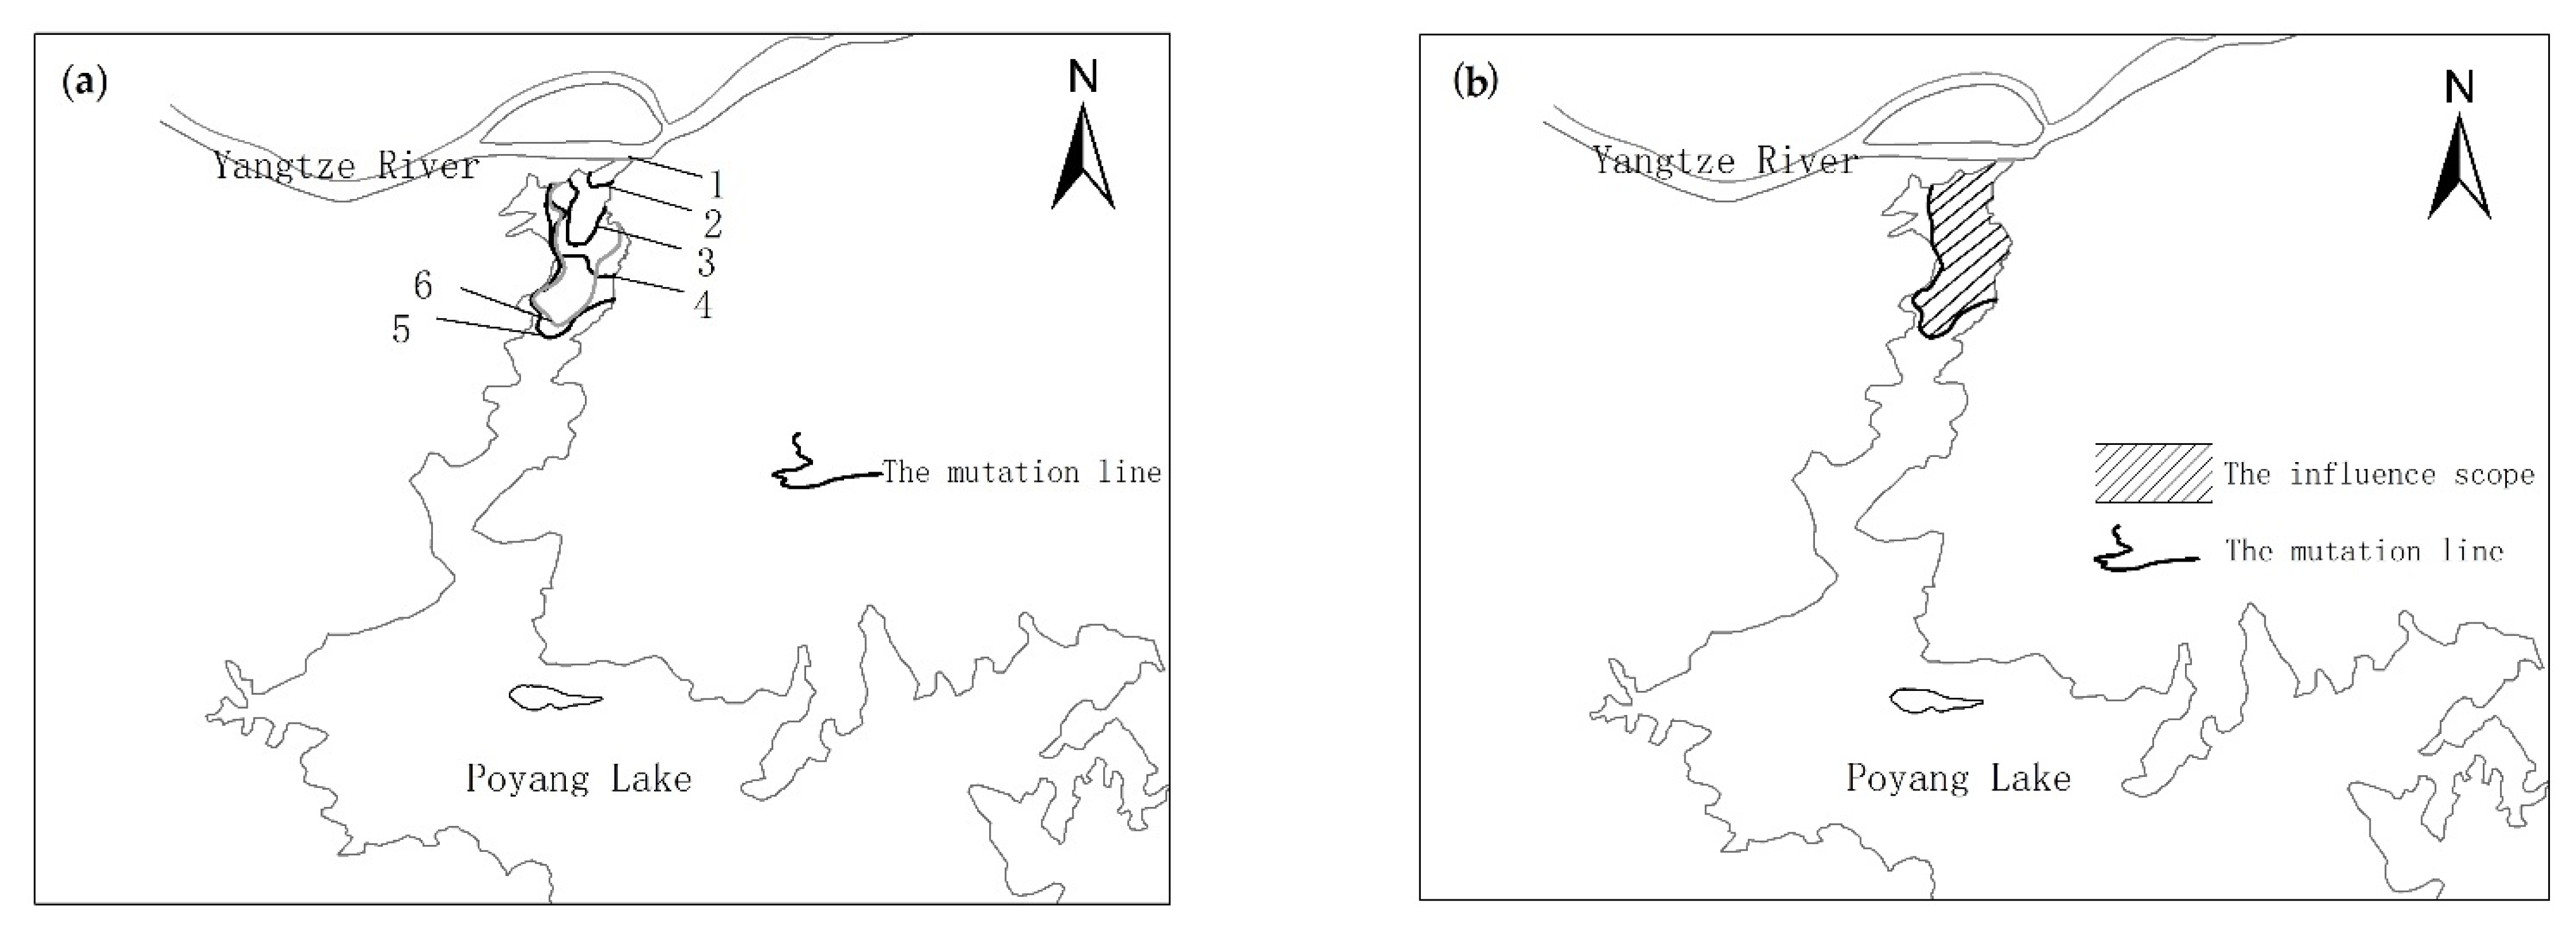
Figure 3a shows the mutation line located at the junction of a river and a lake when there is no BRL. The beginning time, the end time, the duration, and the influence scope of BRL were judged through the following steps: (1) When the position of the mutation line (Line 1) changes and moves upstream (Line 2) into the lake, BRL begins. (2) When the mutation line (Line 3) is stationary for a certain time and starts to move to downstream, the BRL is over. At this time, the range from the mutation line to the outlet of the lake is the influence scope of the BRL, which is shown as the filled area in Figure 3b. (3) The duration of BRL is the time from the beginning to the end.
3.2. TSS Model Development Based on the Extracted Mutation Line
The calibration dataset (51 samplings) and validation dataset (20 samplings) were randomly extracted from measured and simulated MODIS-derived reflectance sync data of seventy-one sampling sites. The TSS retrieval model was developed based on calibration datasets and evaluating of that was used validation dataset. The MODIS-derived simulated reflectance and corresponding measured TSS concentration were used to develop the best-fitting model for estimating the TSS from actual MODIS images in July 2000 and July to August 2007. The R2 and RMSE between the measured and estimated values were calculated to assess the fitting and validation accuracy. The correlations between different bands and their combinations and the TSS concentration were analyzed to determine the most sensitive bands and their combinations.
The widely used linear, quadratic, exponential, and power models of against and the simulated MODIS-derived reflectance were calibrated using the least squares technique, respectively. The ratio of red and green bands was a remote sensing technique widely used to identify the water TSS [33], and NIR band was less affected by thin cloud. The band combination (x) was founded in the retrieval model, and it was the ratio of the red band (band 1) minus the near-infrared band (band 2) and the green band (band 4) minus the near-infrared band (band 2), which can reduce the impact of the atmosphere and improve the sensitivity in monitoring the TSS concentration. The formula is as follows:
where R, G, and NIR refer to the remote sensing reflectance of the band 1, band 4, and band 2, respectively.
Through the empirical model method, the linear, exponential, power, multiple term, and other functional empirical relations between the measured TSS and a single band or band combination were then respectively calibrated using the least-squares technique to find the best-fitting model for TSS estimation. The determination coefficient (R2) and the root-mean-square error (RMSE) of all the calibrated models were obtained to determine the best-fitting model. However, the exponential model is less sensitive to low-TSS water and a small variation range of TSS; it is more sensitive to high-TSS concentration water and a large variation range of the TSS concentration, when it is easier to judge the mutation line. The exponential model formula is as follows:
where is the concentration of TSS; a and b are the fitting coefficients; and x is the input band or band combination.
4. Results
4.1. In Situ Spectral Data
Figure 3 shows that the measured Rrs values of Poyang Lake were similar to the typical characteristics of inland water. The Rrs values at 400–500 nm were low due to the intense absorption of chlorophyll-a and CDOM (chromophoric dissolved organic matter). The Rrs values at 500–570 nm increased rapidly. A reflectance peak in the range of 570–590 nm appeared and a second peak exited at around 810 nm because of higher backscattering of TSS. The Rrs values at 570–700 nm rose in an obvious manner while the TSS concentration increased gradually.
4.2. TSS Model Development
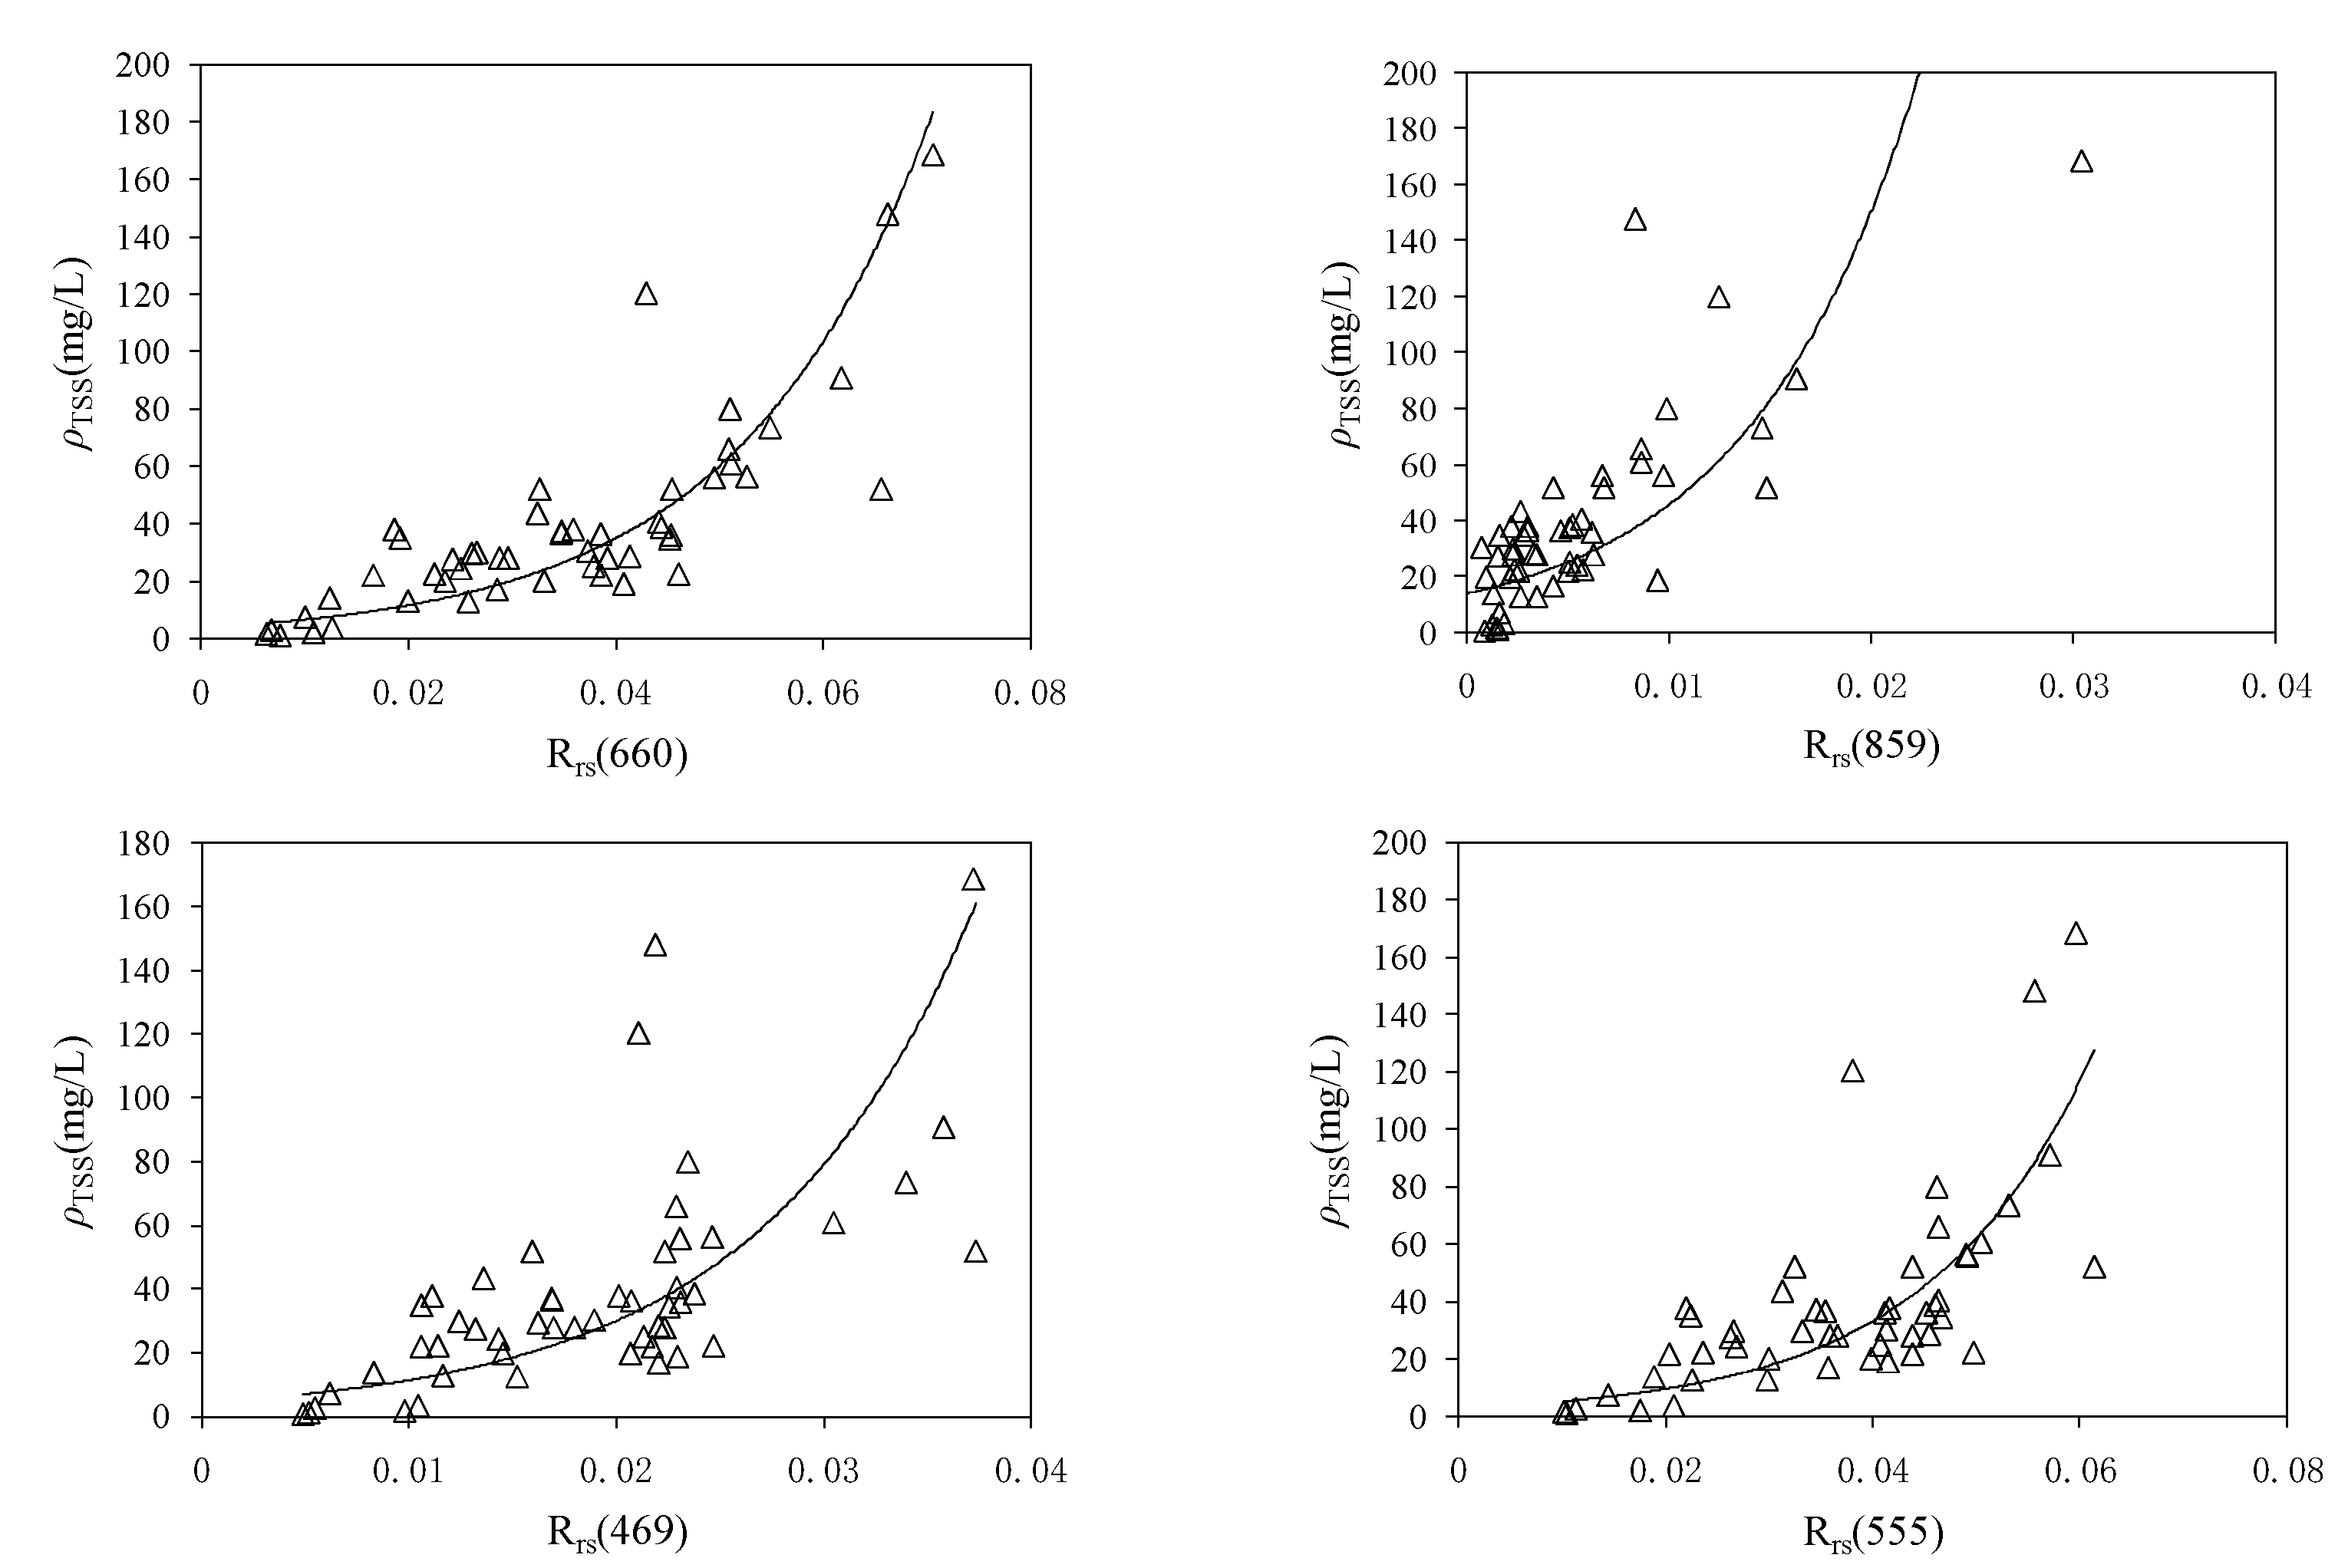
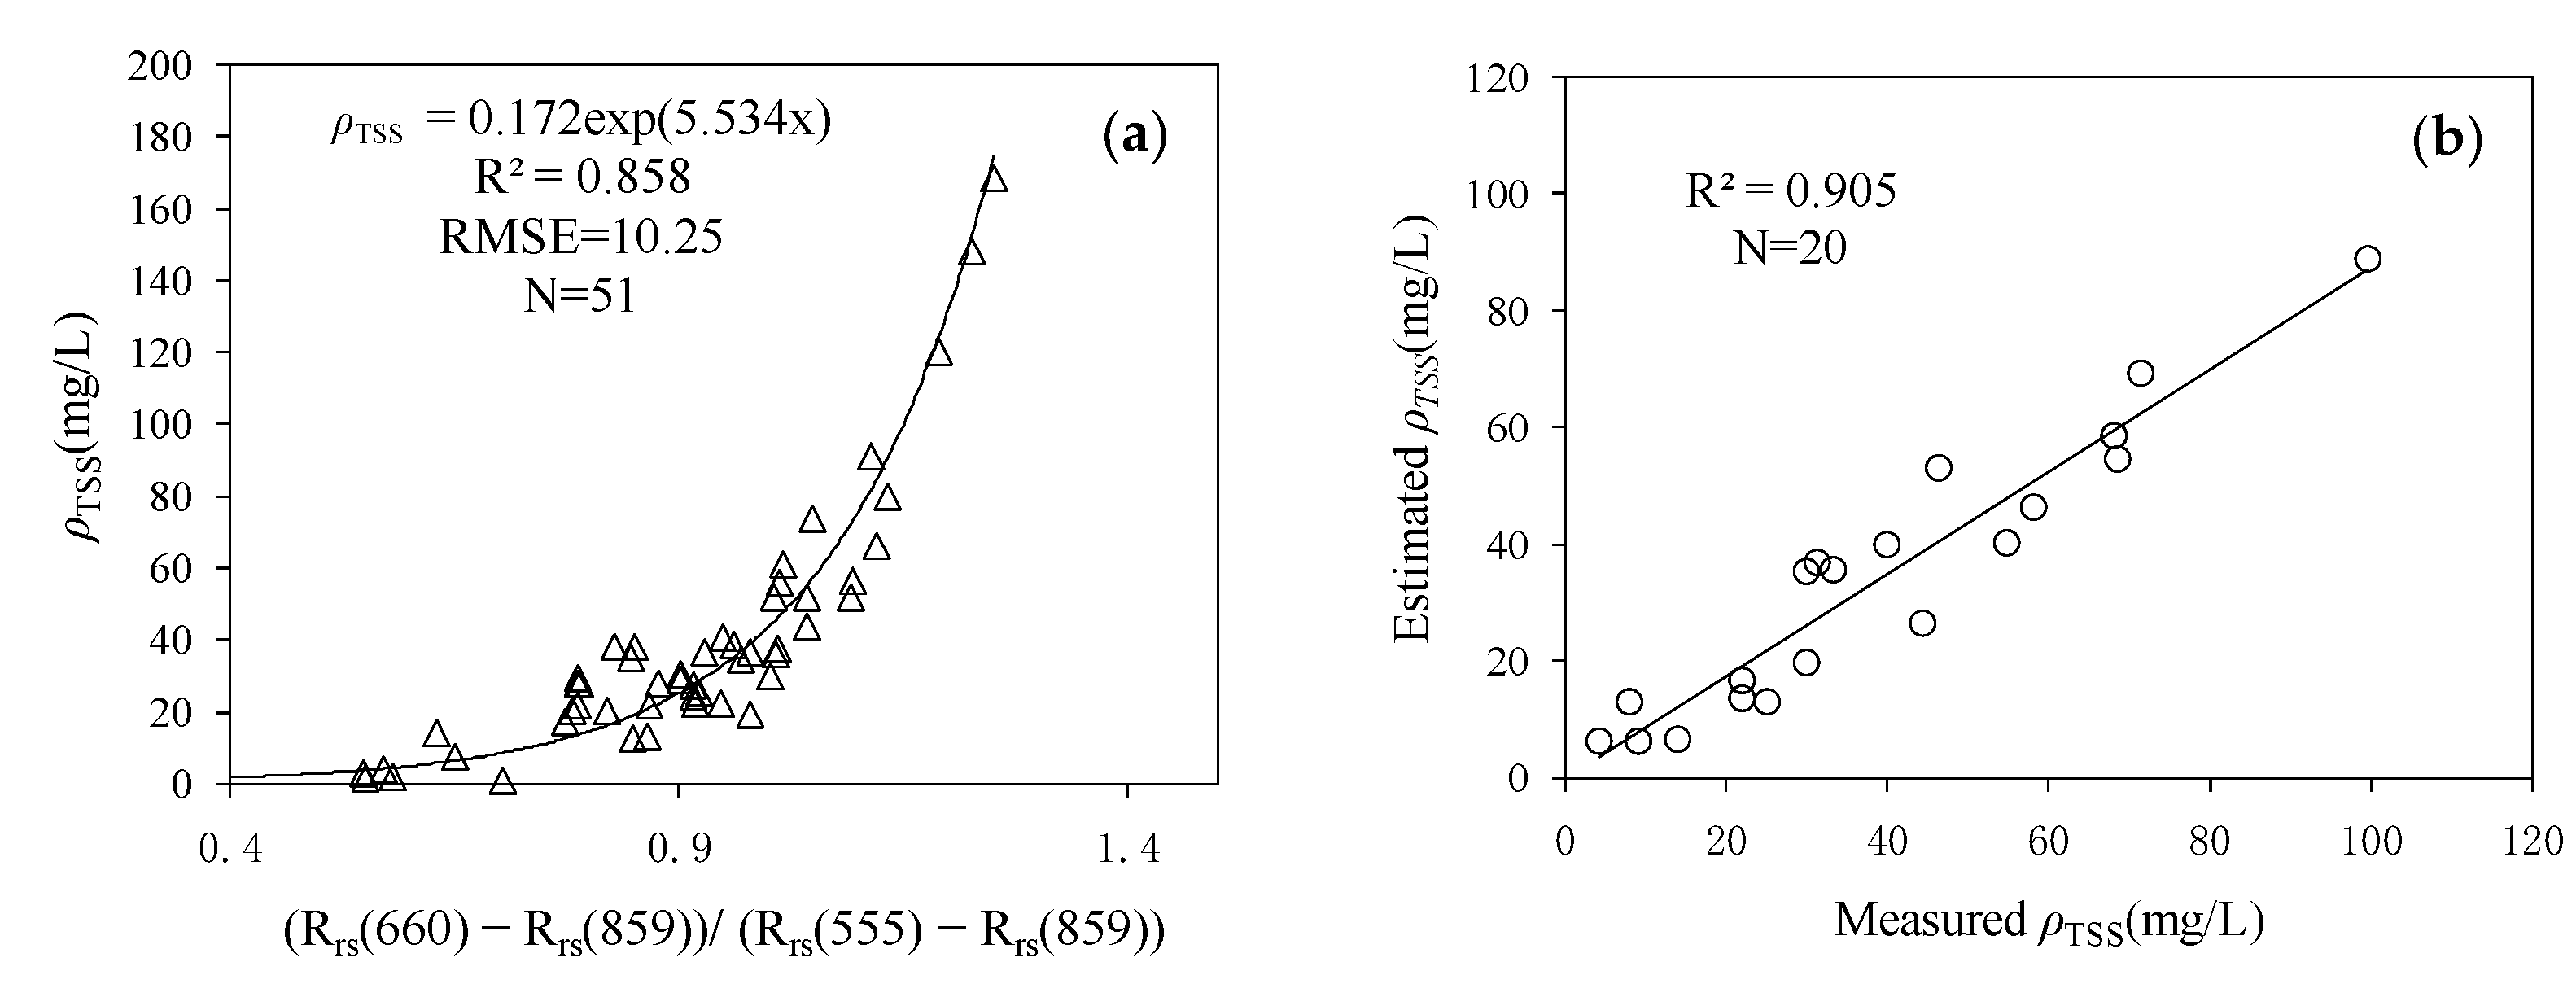
Since the reflectances from 400 nm to 900 nm were more stable than those over 900 nm, simulation of MODIS-derived bands 1–4 was employed to construct the TSS model, and they positively correlated with TSS (Figure 4). The red band and green band were found to be more sensitive than the others. For the red band, the exponential model explained the variation in TSS with an R2 of 0.757. For the green band, the exponential model explained the variation in TSS with an R2 of 0.604. The band combination of Rrs(645) − Rrs(859))/(Rrs(555) − Rrs(859) yielded a higher fitting accuracy compared with the single bands. The highest R2 (0.858) and the lowest RMSE (10.25 mg/L) were derived from an exponential model (Figure 5a):
where x is the ratio Rrs(645) − Rrs(859))/(Rrs(555) − Rrs(859).
A scatter plot (Figure 5b) indicated a significantly strong correlation between the measured and estimated TSS concentrations (R2 = 0.905, p < 0.001). The exponential model of the band combination (x) obtained the best performance.
4.3. TSS Distribution Derived from MODIS
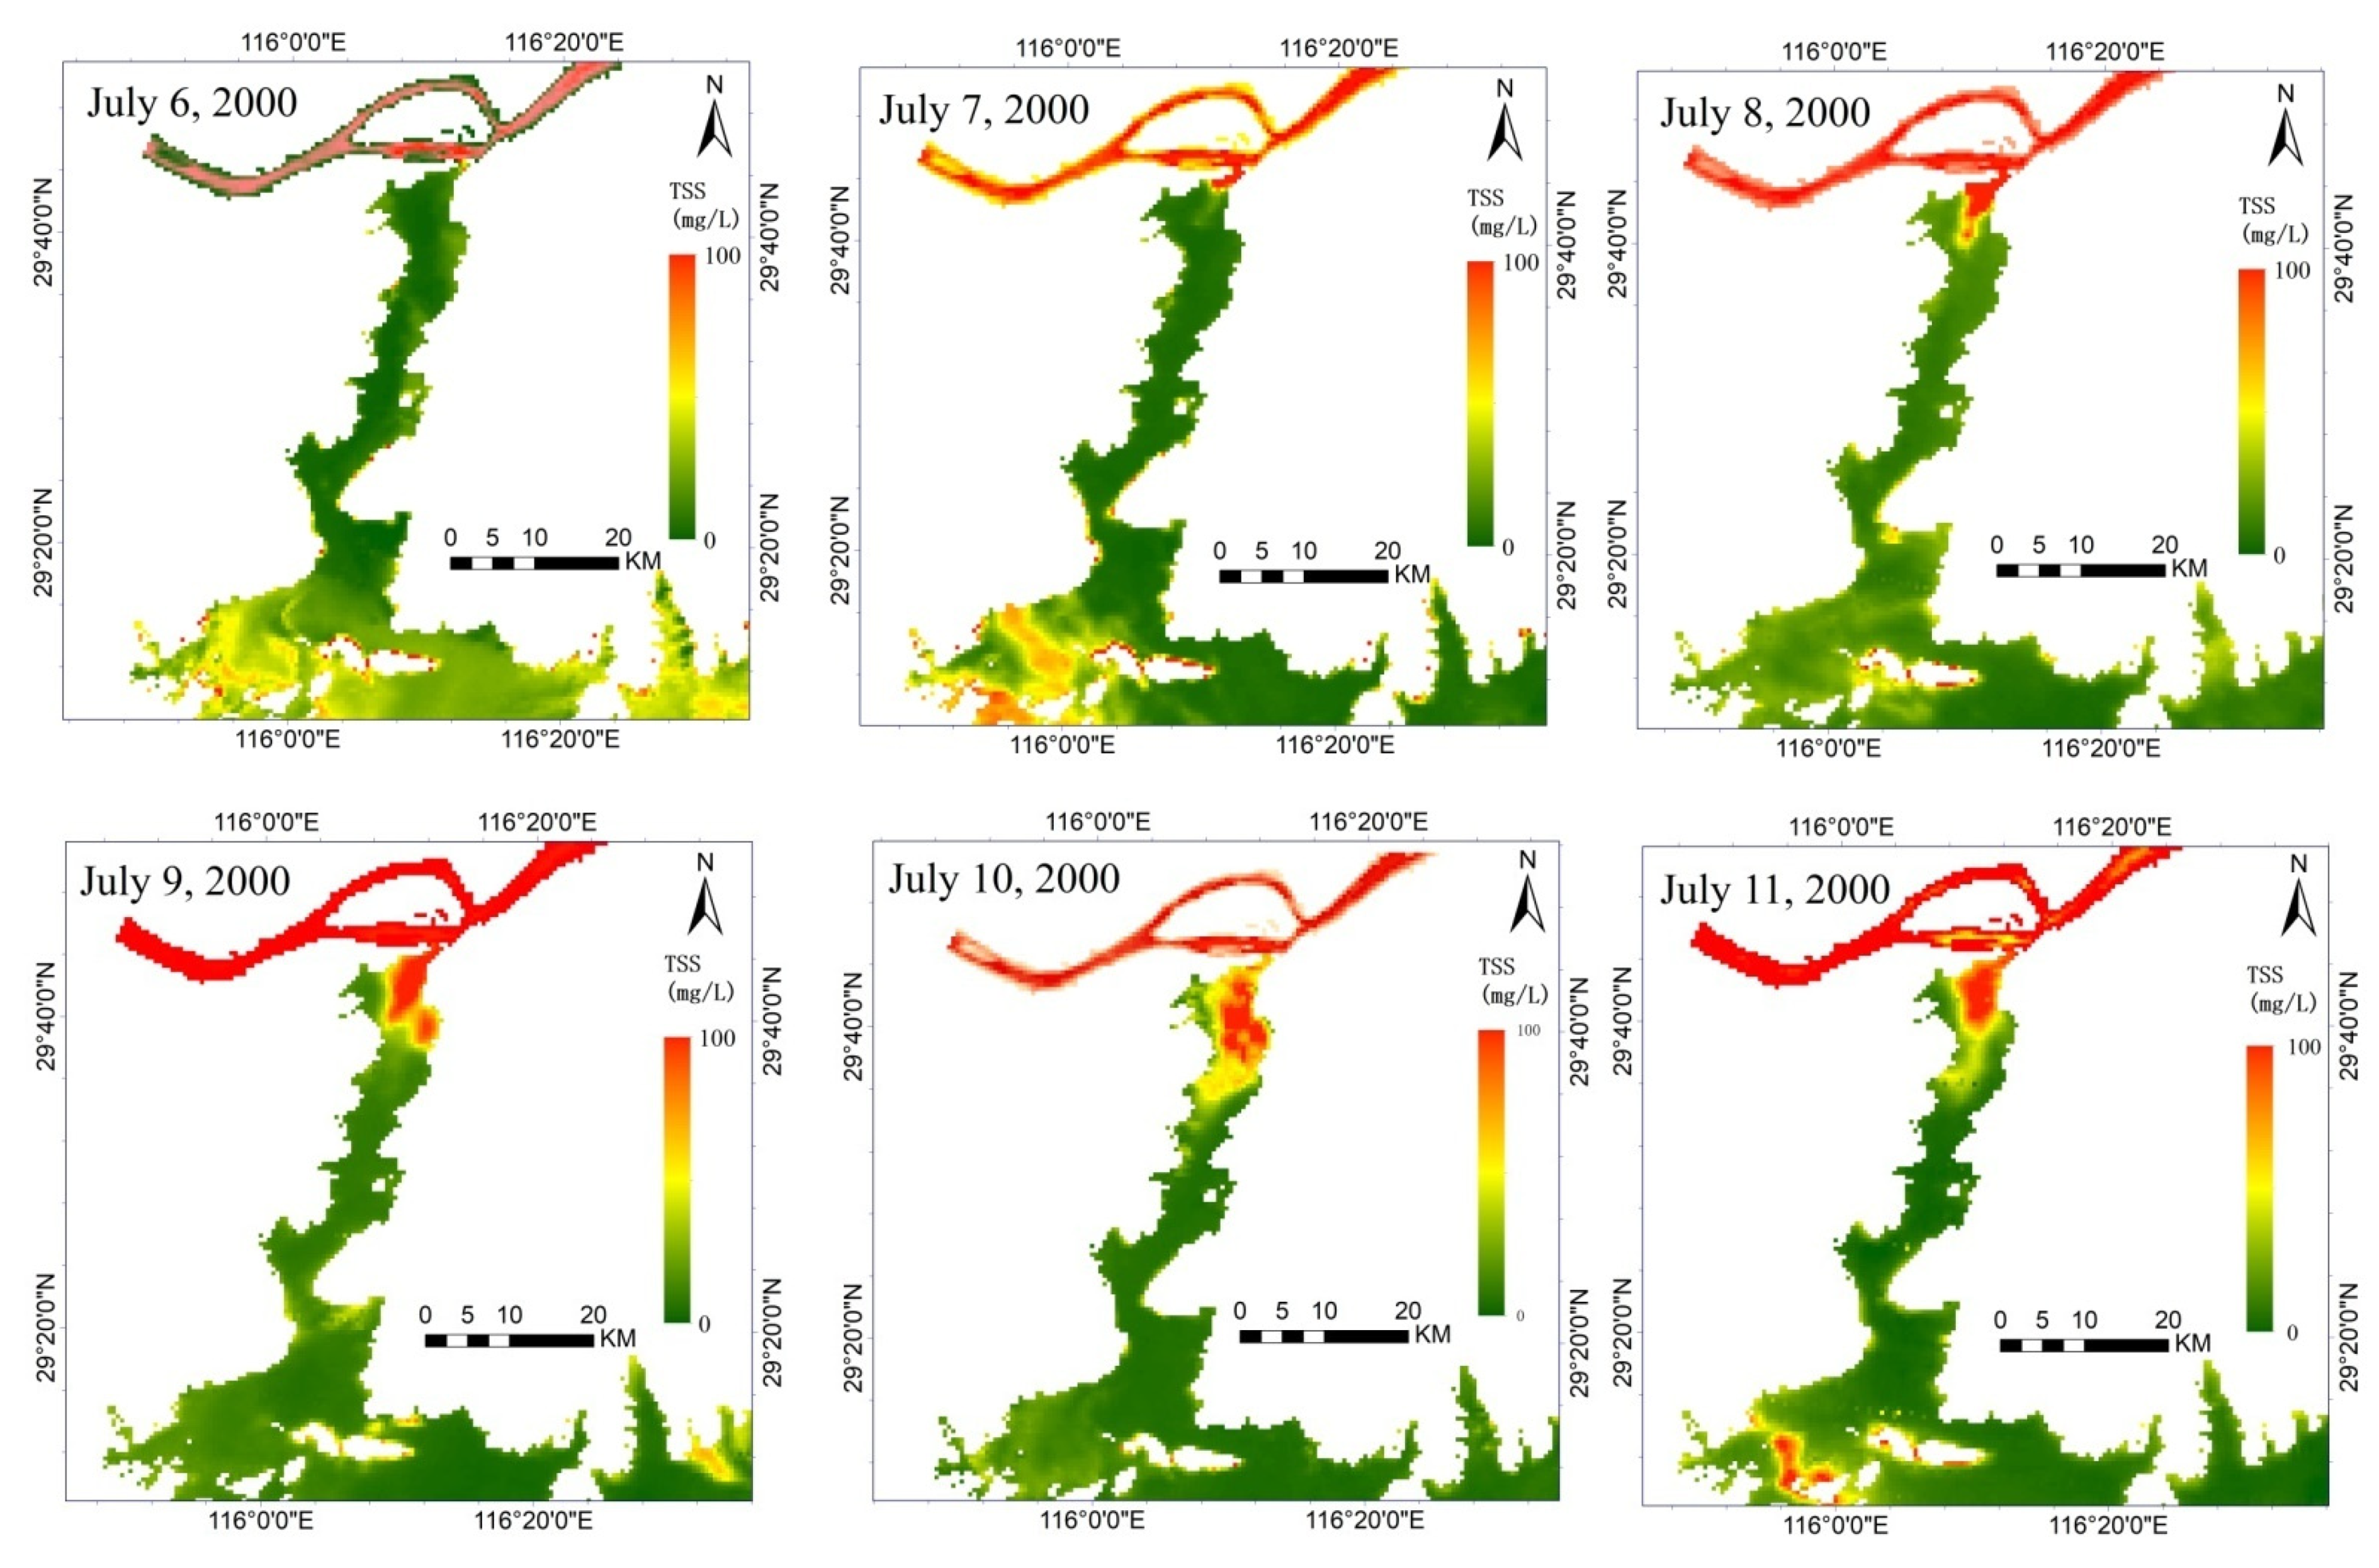
The spatial-temporal distribution of values was estimated by using Formula (5); The MODIS images used were cloud-free images of Poyang Lake taken in July 2000 and in July and August 2007. Figure 6 shows the spatial-temporal distribution of in Poyang Lake during the period of a BRL in July 2000. To contrast the TSS variation before and after the BRL, the TSS distributions from 6 to 11 July 2000 are shown. The northern lake was rather clear with TSS of <5 mg/L. However, a red portion ( > 50 mg/L) at the exit of the lake appeared and gradually became larger and larger.
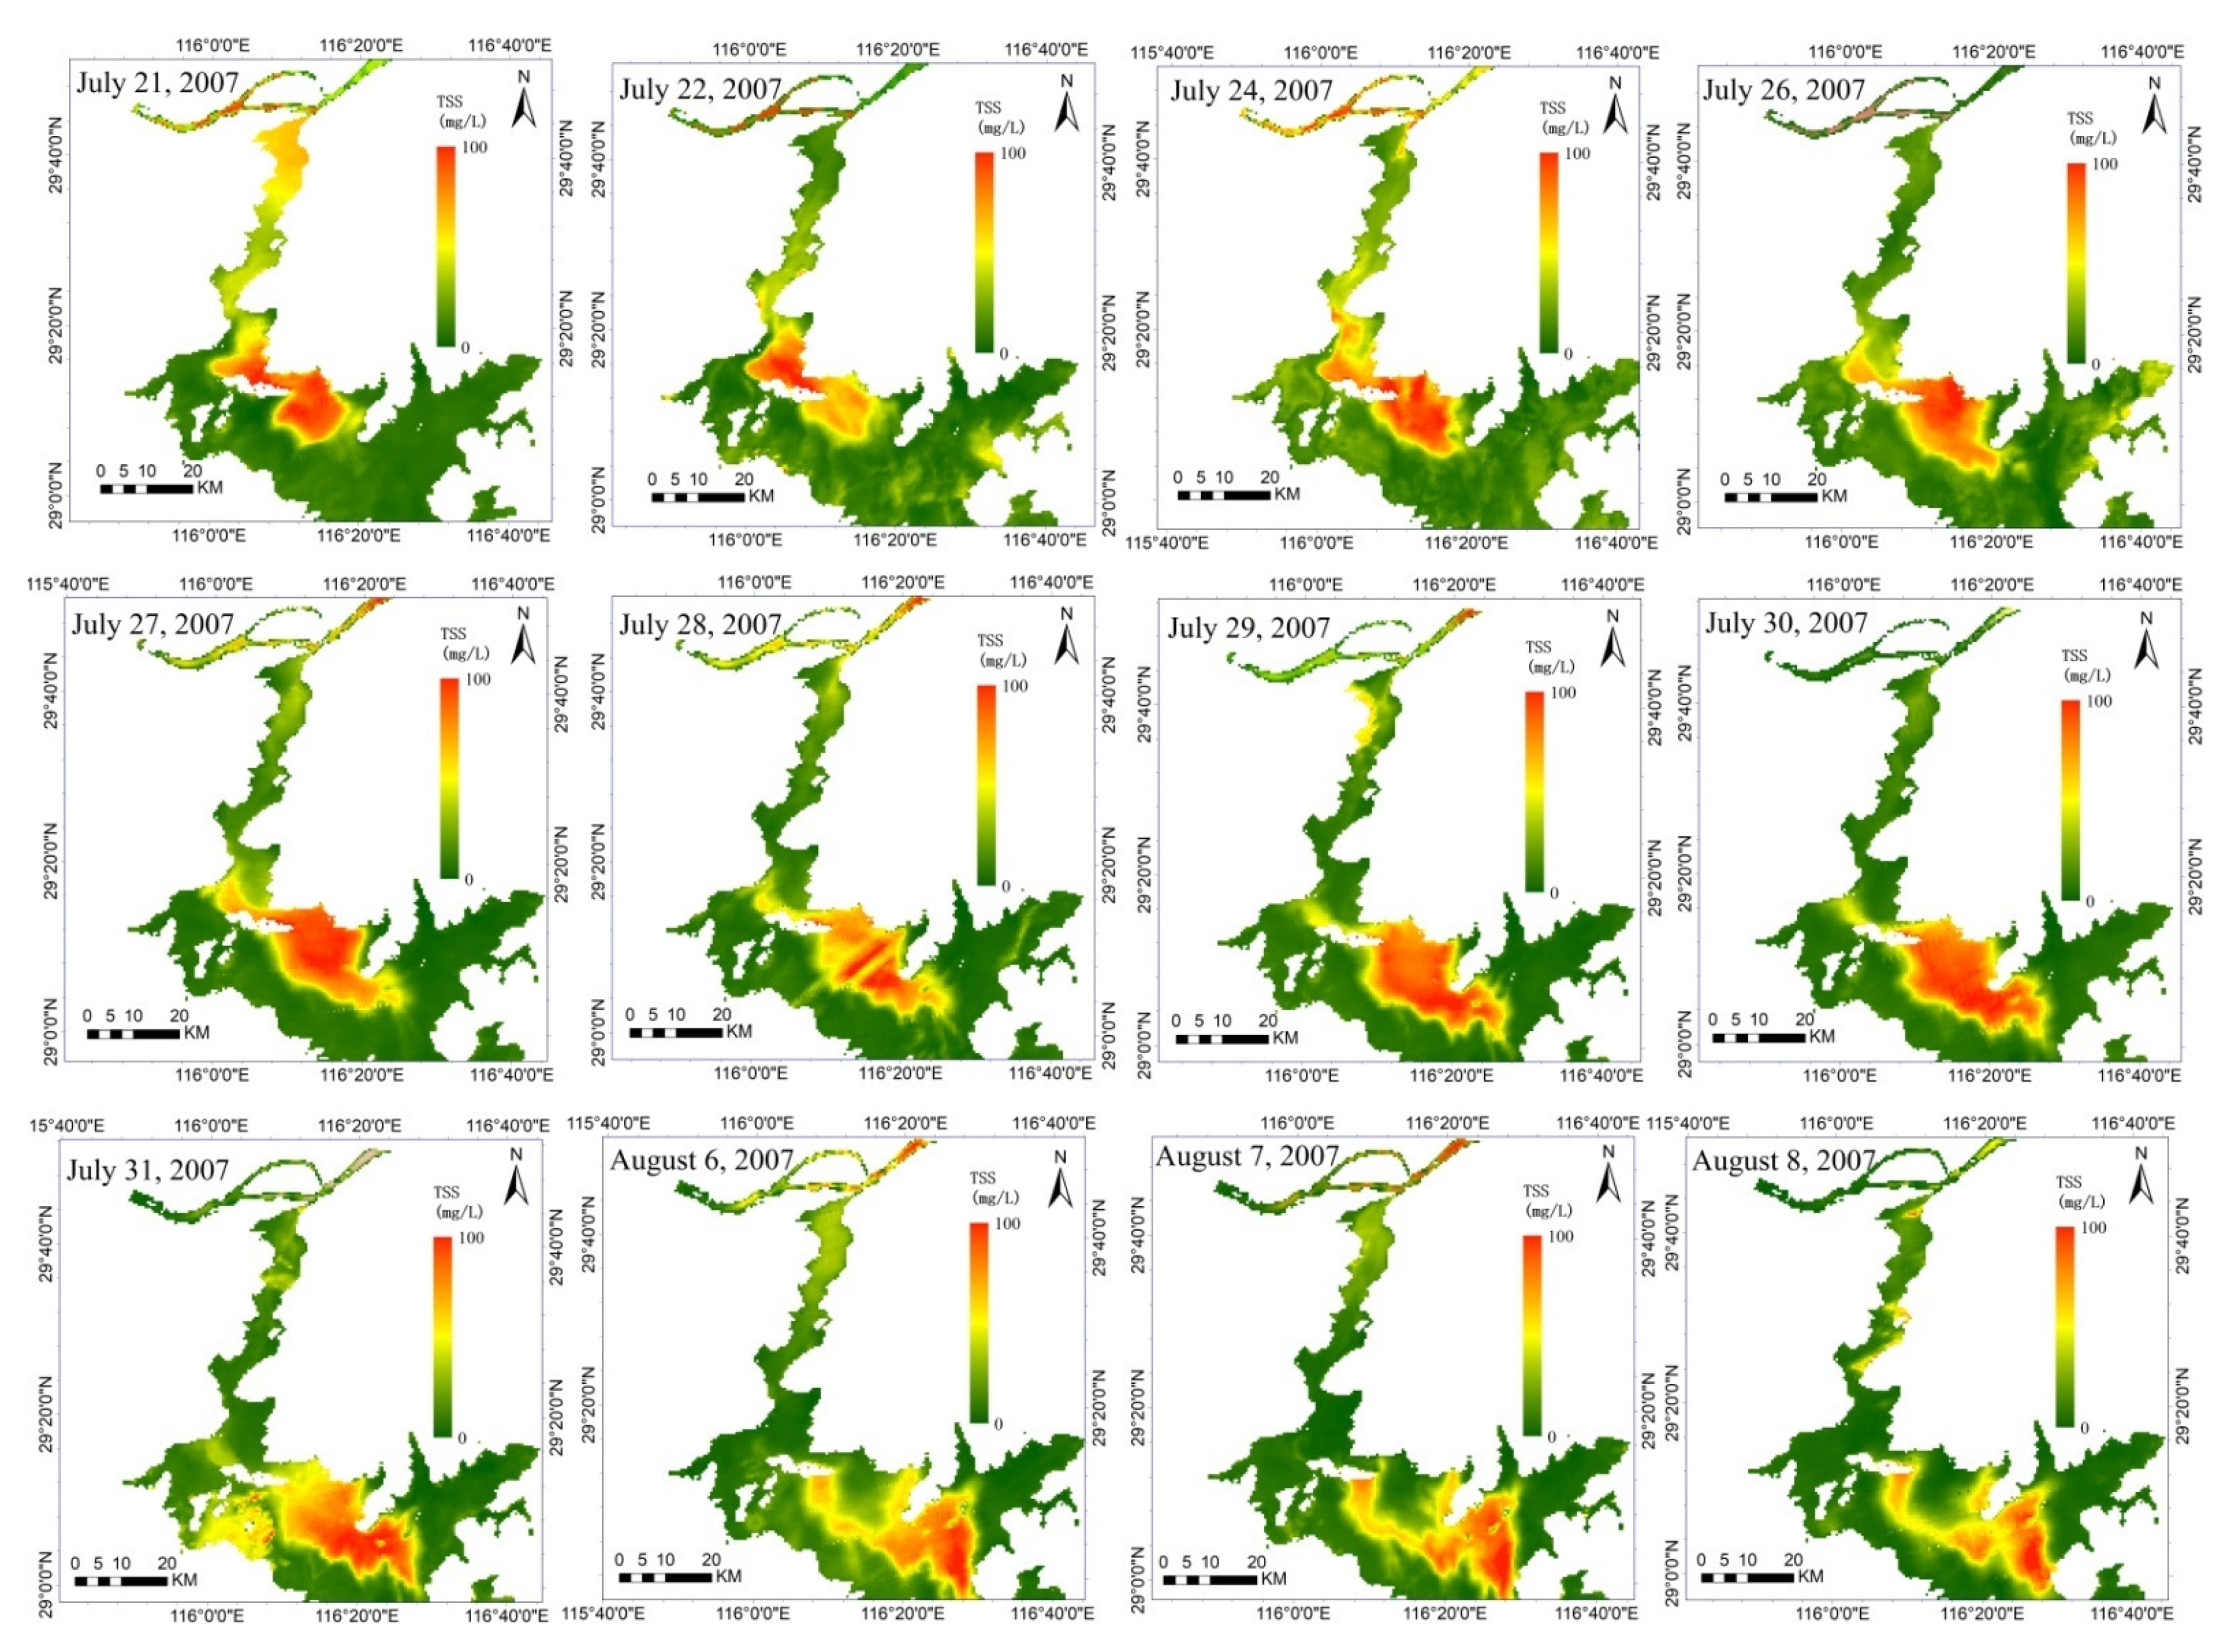
The spatial-temporal distributions of in Poyang Lake during the period of a BRL from July to August 2007 were also produced using MODIS cloud-free images (Figure 7). There was a high TSS level ( > 50 mg/L) in the main lake and northern lake on 21 July 2007, and low TSS ( < 10 mg/L) in the southern lake. The large red portion moved toward the south of the lake in the maps, and the water was continuously clearer to the north of Songmeng Mountain.
4.4. Characteristic Parameters of BRL
In this study, mutation lines were obvious when using a threshold of more than 0.8, and the results were obtained by using MODIS images from each day in July 2000 (Figure 8). To effectively judge whether BRL happened at that time, the mutation line of each successive image could be superimposed to analyze their movement information from Yangtze River into Poyang Lake. The values in Poyang Lake were lower than those of the water from the Yangtze River in July 2000. From Figure 8a, it seems that there were mutation lines at the interface between the exit of the lake and the river.
In Figure 8a, Line 1 is located at the junction of the river and lake with no BRL. The mutation line did not move from 1 to 6 July 2000, and then it moved towards the center of the lake on 7 July 2000 (Figure 8a), which indicates that BRL had happened in the lake on 7 July 2000 (Line 2). The mutation lines from 8 July (Line 3) and 9 July (Line 4) continued to gradually move towards the center of the lake and arrived at the position of the 10 July mutation line (Line 5); however, the mutation line moved downstream in the lake on 11 July 2000 (Line 6).This result indicated that the mutation line was stationary on 10 July (Line 5) and then started to move downstream, so 10 July was the end time of the BRL. The inflow distance of the BRL was 21.40 km. Therefore, the period of BRL was from 7 to 10 July 2000 (4 days). Figure 8b shows that the area from the mutation line on 10 July 2000 to the exit of the lake—the influence scope of the BRL—was an area of 110.90 km2 (Figure 8b). According to the observation data of Hukou hydrological station (Table 1), the negative discharge values from 7 to 10 July 2000 show a water current from the Yangtze River to Poyang Lake, so the parameters of BRL were completely consistent with the hydrological data.
The suspended sediment in most of the main lake and the northern lake was affected by sand mining, so the TSS concentration increased in July and August 2007. At the same time, the water in the Yangtze River was relatively clearer than that in Poyang Lake after the impoundment of the Three Gorges project located in the upstream area of the Yangtze River [34,35,36]; the project was constructed in 2003, so the TSS flowing into the lake area showed a sudden change from low to high concentration, which was in contrast to the BRL in July 2000.
Figure 9 shows that the position of the mutation line moved upstream in the lake on 22 July 2007 (Line 1), which was the beginning time of BRL. The results indicated that the mutation line was stationary on 7 August (Line 2) and started to move downstream, so 7 August was the end time of the BRL. The period of this BRL was thus from 22 July to 7 August 2007 (17 days). Figure 9 shows that the inflow distance of the BRL was 88.04 km, and the filled area from the mutation line on 7 August 2007 to the exit of the lake—the influence scope of the BRL—was 585.24 km2. Thus, the duration, inflow distance, and influence scope of this BRL were greater than those of the BRL in July 2000.According to the observation data from Hukou hydrological station (Table 2), negative discharge values from 22 July to 7 August 2007 reflected a water current from the Yangtze River to Poyang Lake, so the parameters of BRL were completely consistent with hydrological observation data. Therefore, it seems that this algorithm can robustly obtain correct information on BRL, despite the TSS concentration of the water backflow to the lake being higher or lower than that of the lake area.
5. Discussion
5.1. Validity of the Algorithm
There are several algorithms for obtaining the information of BRL before, such as in situ observation, hydrodynamic model and particle tracking model. The temporal variation of BRL and its influencing factors were analyzed through the observation hydrological data recorded at Hukou Hydrologic station [9,10]. Hydrodynamic model reveals that, in general, backflow disturbs the normal northward water flow direction in Poyang Lake and transports mass southward into the lake. The current study represents a first attempt to explore backflow and causal factors for a highly dynamic floodplain lake system [8]. The real-time field monitoring method is accurate and effective, and the disadvantage is that there must be hydrological stations. However, the hydrological stations cannot obtain the influence scope of the BRL. The numerical simulation method needs to collect a large amount of data, and cannot reflect the real-time phenomenon of BRL. It can be seen that remote sensing monitoring is a large area, real-time, economic and effective tool to capture BRL phenomenon, which provides a well-developed prospect.
Optical substance classifications of lakes usually include sediment-dominated optical substances, chlorophyll-a-dominated optical substances, and mixed optical substances [37,38]. Suspended sediment is the main optical substance in Poyang Lake, and it is helpful to finding the mutation line. If lakes with vigorous algae growth are to be monitored, using chlorophyll-a and other tracers can be used to realize BRL monitoring. Further research on this will be carried out in the future.
The model using the field data in 2014, 2017, and 2018 was founded in this study. The lack of field spectral measurements in 2015 and 2016 may affect the accuracy of model with discontinuous years. Due to the cloud coverage during field measurement, the sync satellite data was unavailable, which would affect the construction of the model. Consequently, the simulated MERIS data were used to construct TSS retrieval model, and the NSSI algorithm using MERIS band 5 (560 nm) and band 11 (760 nm) was recommended and an exponential function (R2 = 0.90, p < 0.01) finally chosen to apply to Poyang Lake [26]. The simulated Sentinel 2 MIS spectra were also used in Poyang Lake, which showed that the Sentinel 2 MSI B4-B8b models achieved acceptable results with highly fitting accuracies between 81–93% of the variation of TSS [22].As well, an exponential model (R2 = 0.95, RMSE = 15.2 mg/L) has been established by the simulated Landsat 8 OLI band 4 (660 nm) data and TSS [39]. In this study, the simulated MODIS data were used to construct TSS retrieval model, in which the exponential function of the band combination obtained the best performance. However, there are differences between reflectances of the simulated satellite data and that of the atmospheric corrected satellite images in optically complex inland waters, which may affect the estimated accuracy of TSS.
The climate conditions affect dynamic monitoring of BRL via remote sensing. Cloud cover or greater aerosol thickness can make it more difficult for satellite remote sensing to retrieve the TSS or can affect the model accuracy [39,40,41]. In order to better reflect the BRL process, cloud-free MODIS satellite images during July 2000 and July to August 2007 were requested in these two cases. However, the partial processes of BRL may still be difficult to obtain as well as a validation limitation were employed on 1 to 5 August 2007, on which the study area was covered by clouds. To solve the problem of climate impacts, the platforms of unmanned aerial vehicles can be employed to monitor lakes [42].
To discover BRL, the temporal resolution of sensors must be higher than the duration of the BRL. Although Landsat, Sentinel, and other satellites can capture the phenomenon of BRL, a temporal resolution of over five days is too low to obtain the characteristic parameters of BRL. The non-geosatellites with one- or two-day resolution (e.g., MODIS, HJ-1, etc.) [43] and geosynchronous Earth orbit satellites (e.g., GOCI) with 1 h resolution [44] can greatly improve the accuracy of monitoring BRL characteristics. In order to meet monitoring requirements, we may incorporate multiple satellites’ data to achieve high-frequency observation, and further steps must be taken to address the inconsistency in atmospheric correction and spatial resolution of multi-source satellites.
According to the width of the monitored lake, the spatial resolution of the images should be less than the width of the BRL area, especially the narrow exit of the lake. It is difficult to discover the mutation line for the mixed pixels if the spatial resolution of the images is too small. At that time, the coarse resolution of images influence algorithm developed, calibration process, the results obtained, etc.
When the difference in TSS concentration between the lake water and the river water flowing into the lake is not obvious, the mutation line is difficult to produce. Conversely, if the accuracy of information acquisition is higher, the mutation line is more obvious. In this study, the RMSE was about 10 mg/L, so remote sensing could not respond sensitively due to the low difference in TSS concentration.
5.2. Implications for Future Eco-Environment Management
The results of BRL monitoring using remote sensing can play an important role in researching the impact of human activities, making scientific decisions on whether to build water conservancy projects in the lake, and arranging to scientifically organize sand mining activities. Mastering the influence scope of BRL can help to research the alternation of the water quality and eco-environment between rivers and lakes, and to analyze matter migration regularity.
6. Conclusions
- (1)
- In this paper, a new algorithm was proposed to monitor BRL using satellite remote sensing, and an effective model was established. This algorithm was applied to quickly and effectively extract information on two instances of BRL in Poyang Lake in July 2000 and July to August 2007, and the results were found to be accurate and reasonable.
- (2)
- An innovative extraction method for the mutation line was proposed using satellite technology. The 645 nm, 859 nm, and 555 nm bands of MODIS-derived images were used as the bands sensitive to the TSS concentration to develop the fitting model. A band combination of Rrs(645) − Rrs(859))/(Rrs(555) − Rrs(859) yielded a higher fitting accuracy (R2 = 0.858, RMSE = 10.25 mg/L) derived from an exponential model, which was helpful to highlighting the mutation line. A gradient variation method was developed to extract the mutation line accurately.
- (3)
- Using the algorithm, we were able to quickly mine the important parameters of BRL, such as the beginning time, the duration, the end time, and the influence scope. The influence scope of BRL is not available from hydrological stations and can now be monitored in real time by remote sensing.
- (4)
- Extracting the BRL information using real-time remote sensing is conducive to the study of phytoplankton and organisms affected by BRL. This approach can also greatly save on monitoring costs. The results should help in exploring the relationship between rivers and lakes, matter migration, and so on, and provide an important technical means for the study of lake ecological environments. This study addresses the possibilities and limitations of this algorithm that should be considered in further research.
Author Contributions
Conceptualization and methodology: H.J.; Data processing and validation: Y.L.; writing—review and editing: H.J., Y.L. and J.L.; funding acquisition: H.J. All authors have read and agreed to the published version of the manuscript.
Funding
This work was supported by the Science and Technology Project of Jiangxi Education Department (GJJ170979), the Key Projects of Jiangxi (20201BBG71002), the National Natural Science Foundation of China (51869012, 41461080), the Frontier Project of Applied Foundation of Wuhan (2019020701011502), and the Natural Science Foundation of Jiangxi (20171ACB21051, 20192ACBL20041).
Institutional Review Board Statement
Not applicable.
Informed Consent Statement
Not applicable.
Data Availability Statement
Data is contained within the article.
Acknowledgments
We appreciate the insightful and constructive comments and suggestions from the anonymous reviewers and the editor that helped improve the quality of the manuscript.
Conflicts of Interest
The authors declare no conflict of interest.
References
- Roy, R.; Majumder, M. Assessment of water quality trends in Loktak Lake, Manipur, India. Environ. Earth Sci. 2019, 78, 383. [Google Scholar] [CrossRef]
- Wang, L.; Zhao, X.; Gao, J.; Butterly, C.R.; Xiao, X. Effects of fertilizer types on nitrogen and phosphorous loss from rice-wheat rotation system in the Taihu Lake region of China. Agric. Ecosyst. Environ. 2019, 285, 106605. [Google Scholar] [CrossRef]
- Wang, Z.H.; Fan, H.X.; Zhu, L.J.; Liu, B.B. Review on the influence to Poyang Lake by flowing backward of the Yangtze River and the study processes of micro physical model. J. Sediment Res. 2019, 44, 59–66. [Google Scholar]
- Grizzetti, B.; Liquete, C.; Pistocchi, A.; Vigiak, O.; Zulian, G.; Bouraoui, F.; De Roo, A.; Cardoso, A.C. Relationship between ecological condition and ecosystem services in european rivers, lakes and coastal waters. Sci. Total Environ. 2019, 671, 452–465. [Google Scholar] [CrossRef]
- Peters, D.L.; Buttle, J.M. The effects of flow regulation and climatic variability on obstructed drainage and reverse flow contribution in a Northern river-lake-delta complex, Mackenzie basin headwaters. River Res. Appl. 2010, 26, 1065–1089. [Google Scholar] [CrossRef]
- Yao, J.; Zhang, Q.; Li, Y.L.; Li, M. The influence of uniform winds on hydrodynamics of Lake Poyang. J. Lake Sci. 2016, 28, 225–236. [Google Scholar]
- Liu, X.; Li, Y.L.; Liu, B.G.; Qian, K.M.; Chen, Y.W.; Gao, J.F. Cyanobacteria in the complex river-connected Poyang Lake: Horizontal distribution and transport. Hydrobiologia 2016, 768, 95–110. [Google Scholar] [CrossRef]
- Li, Y.; Zhang, Q.; Werner, A.D.; Yao, J.; Ye, X. The influence of river-to-lake backflow on the hydrodynamics of a large floodplain lake system (Poyang Lake, China). Hydrol. Process. 2017, 1, 117–132. [Google Scholar] [CrossRef]
- Wang, X.; Zhao, X.F.; Zhao, X.J. Comparative analysis of back-flow characteristics of Poyang Lake before and after operation of Three Gorges Project. J. Chang. Inst. Technol. 2017, 34, 9–12. [Google Scholar]
- Gao, J.H.; Jia, J.; Kettner, A.J.; Xing, F.; Wang, Y.P.; Xu, X.N.; Yang, Y.; Zou, X.Q.; Gao, S.; Qi, S. Changes in water and sediment exchange between the Changjiang River and Poyang Lake under natural and anthropogenic conditions, China. Sci. Total Environ. 2014, 481, 542–553. [Google Scholar] [CrossRef]
- Li, Y.; Xu, Q. Characteristics of backflows from the Yangtze River to Poyang Lake after using of the Three Gorges Reservoir. Adv. Eng. Sci. 2017, 49, 10–17. [Google Scholar]
- Ye, X.C.; Li, X.H.; Zhang, Q. Temporal variation of backflow frequency from the Yangtze River to Poyang Lake and its influencing factors. J. Southwest Univ. Nat. Sci. Ed. 2012, 34, 69–75. [Google Scholar]
- Ciancia, E.; Campanelli, A.; Lacava, T.; Palombo, A.; Pascucci, S.; Pergola, N.; Pignatti, S.; Satriano, V.; Tramutoli, V. Modeling and multi-temporal characterization of total suspended matter by the combined use of Sentinel 2-MSI and Landsat 8-OLI data: The Pertusillo Lake case study (Italy). Remote Sens. 2020, 12, 2147. [Google Scholar] [CrossRef]
- Ouni, H.; Kawachi, A.; Irie, M.; M’Barek, B.N.; Hariga-Tlatli, N.; Tarhouni, J. Development of water turbidity index (wti) and seasonal characteristics of total suspended matter (tsm) spatial distribution in ichkeul lake, a shallow brackish wetland, northern-east tunisia. Environ. Earth Sci. 2019, 78, 228. [Google Scholar] [CrossRef]
- Li, N.; Shi, K.; Zhang, Y.; Gong, Z.; Peng, K.; Zhang, Y. Decline in transparency of lake Hongze from long-term MODIS observations: Possible causes and potential significance. Remote Sens. 2019, 11, 177. [Google Scholar] [CrossRef] [Green Version]
- Xu, J.; Gao, C.; Wang, Y.Q. Extraction of spatial and temporal patterns of concentrations of chlorophyll-a and total suspended matter in Poyang Lake using GF-1 satellite data. Remote Sens. 2020, 12, 622. [Google Scholar] [CrossRef] [Green Version]
- Li, Y.S.; Wang, G.X.; Shen, Y.P.; Wang, J.D.; Wang, Y.B. Impacts of Land Coverage on Runoff Production and Sediment Yield in the Headwaters of the Yangtze River, China. J. Glaciol. Geocryol. 2005, 27, 869–875. [Google Scholar]
- Wang, J.J.; Lu, X.X. Estimation of suspended sediment concentrations using Terra MODIS: An example from the lower Yangtze River, China. Sci. Total Environ. 2010, 408, 1131–1138. [Google Scholar] [CrossRef]
- Sokoletsky, L.; Fang, S.; Yang, X.P.; Wei, X.D. Evaluation of empirical and semianalytical spectral reflectance models for surface suspended sediment concentration in the highly variable estuarine and coastal waters of east china. IEEE J. Sel. Top. Appl. Earth Obs. Remote Sens. 2016, 9, 5182–5192. [Google Scholar] [CrossRef]
- Balasubramanian, S.V.; Pahlevan, N.; Smith, B.; Binding, C.; Boss, E. Robust algorithm for estimating total suspended solids (tss) in inland and nearshore coastal waters. Remote Sens. Environ. 2020, 246, 111768. [Google Scholar] [CrossRef]
- Luo, C.T.; Chen, Y.Y.; Zhang, C. The concentration variation of chlorophyll-a in artificial shallow lake during high suspended sediment water supplement. J. Agro Environ. Sci. 2013, 9, 1848–1854. [Google Scholar]
- Liu, H.; Li, Q.; Shi, T.; Hu, S.; Wu, G.; Zhou, Q. Application of Sentinel 2 MSI images to retrieve suspended particulate matter concentrations in Poyang Lake. Remote Sens. 2017, 9, 761. [Google Scholar] [CrossRef] [Green Version]
- Liu, H.; Zhang, Q.; Niu, Y.Y.; Xu, L.G.; Hu, Y.H. A dataset of water environment survey in Poyang Lake from 2013 to 2018. Sci. Data Bank 2020, 5. [Google Scholar] [CrossRef]
- Lu, J.; Li, H.; Chen, X.; Liang, D. Numerical study of remote sensed dredging impacts on the suspended sediment transport in China’s largest freshwater lake. Water 2019, 11, 2449. [Google Scholar]
- Chen, J.F.; Qian, X.Y.; Bureau, H. Variation characteristics of water recharge from Changjiang River into Poyang Lake. J. Yangtze River Sci. Res. Inst. 2019, 36, 18–22. [Google Scholar]
- Chen, X.L.; Han, X.X.; Feng, L. Towards a practical remote-sensing model of suspended sediment concentrations in turbid waters using meris measurements. Int. J. Remote Sens. 2015, 15, 3875–3889. [Google Scholar] [CrossRef]
- Xu, J.; Fang, C.; Gao, D.; Zhang, H.; Gao, C.; Xu, Z.; Wang, Y.Q. Optical models for remote sensing of chromophoric dissolved organic matter (CDOM) absorption in Poyang Lake. ISPRS J. Photogramm. Remote Sens. 2018, 142, 124–136. [Google Scholar] [CrossRef]
- Zheng, W.; Zeng, Z.Y. A Review on methods of atmospheric correction for remote sensing images. Remote Sens. Inf. 2004, 4, 66–70. [Google Scholar]
- Li, G.Y.; Zhang, Z.; Zheng, Y.; Liu, X. Atmospheric correction of MODIS and its application in cyanobacteria bloom monitoring in lake Taihu. J. Lake Sci. 2008, 2, 160–166. [Google Scholar]
- Cooley, T.; Anderson, G.P.; Felde, G.W.; Hoke, M.L.; Ratkowski, A.J.; Chetwynd, J.H.; Gardner, J.A.; Adler-Golden, S.M.; Matthew, M.W.; Berk, A.; et al. FLAASH, a MODTRAN4-based atmospheric correction algorithm, its application and validation. In Proceedings of the IEEE International Geoscience and Remote Sensing Symposium, Toronto, ON, Canada, 24–28 June 2002; pp. 1414–1418. [Google Scholar]
- Trrigg, S.; Flasse, S. Characterizing the spectral-temporal response of burned savannah using in situ spectroradiometry and infrared thermometry. Int. J. Remote Sens. 2000, 21, 3161–3168. [Google Scholar] [CrossRef]
- Jiang, H.; Xie, S.X.; Liu, Y.; Yu, Z.Q.; Xia, Q. Spatial distribution of particle size of suspended particulate matters in Poyang Lake during wet season. J. Nanchang Inst. Technol. 2018, 37, 43–47. [Google Scholar]
- Bid, S.; Siddique, G. Identification of seasonal variation of water turbidity using NDTI method in Panchet Hill Dam, India. Model. Earth Syst. Environ. 2019, 4, 1179–1200. [Google Scholar] [CrossRef]
- Wang, X.; Li, X.; Baiyinbaoligao; Wu, Y.H. Maintaining the connected river-lake relationship in the middle Yangtze River reaches after completion of the Three Gorges Project. Int. J. Sediment Res. 2017, 32, 487–494. [Google Scholar] [CrossRef]
- Corbari, C.; Mancini, M. Effect of the Three Gorges Dam on total suspended sediments from MODIS and Landsat satellite data. Water 2020, 10, 3390. [Google Scholar]
- Zuo, L.Q.; Lu, Y.J.; Liu, H.X.; Ren, F.F.; Sun, Y.Y. Responses of river bed evolution to flow-sediment process changes after three gorges project in middle Yangtze river: A case study of Yaojian reach. Water Sci. Eng. 2020, 13. [Google Scholar] [CrossRef]
- Jiang, H.; Liu, Y. Analysis and inversion of the nutritional status of China’s Poyang Lake using MODIS data. J. Indian Soc. Remote Sens. 2016, 44, 837–842. [Google Scholar]
- Igor, O.; Enner, A.; Marcelo, C.; Marcos, A.; Renata, N.; Arley, S.; José, S.; Milton, K. Performance analysis of MODIS 500-m spatial resolution products for estimating chlorophyll-a concentrations in oligo- to meso-trophic waters case study: Itumbiara reservoir, Brazil. Remote Sens. 2014, 6, 1634–1653. [Google Scholar]
- Li, J.; Chen, X.; Tian, L.; Huang, J.; Feng, L. Improved capabilities of the Chinese high-resolution remote sensing satellite GF-1 for monitoring suspended particulate matter (SPM) in inland waters: Radiometric and spatial considerations. ISPRS J. Photogramm. Remote Sens. 2015, 8, 145–156. [Google Scholar] [CrossRef]
- Li, J.; Cheng, X.L.; Tian, L.; Ding, J.; Song, Q.; Yu, Z. On the consistency of HJ-1A CCD1 and Terra/MODIS measurements for improved spatio-temporal monitoring of inland water: A case in Poyang Lake. Remote Sens. Lett. 2015, 6, 351–359. [Google Scholar] [CrossRef]
- Dorji, P.; Fearns, P. Atmospheric correction of geostationary Himawari-8 satellite data for Total Suspended Sediment mapping: A case study in the coastal waters of western Australia. ISPRS J. Photogramm. Remote Sens. 2018, 144, 81–93. [Google Scholar] [CrossRef]
- Gai, Y.; Yu, D.; Zhou, Y.; Yang, L.; Chen, J. An improved model for chlorophyll-a concentration retrieval in coastal waters based on UAV-Borne hyperspectral imagery: A case study in Qingdao, China. Water 2020, 12, 2769. [Google Scholar] [CrossRef]
- Li, X.; Zhang, Q. Variation of floods characteristics and their responses to climate and Human activities in Poyang Lake, China. Chin. Geogr. Sci. 2015, 25, 13–25. [Google Scholar] [CrossRef] [Green Version]
- Chau, P.M.; Wang, C.K.; Huang, A.T. The spatial-temporal distribution of GOCI-derived suspended sediment in Taiwan coastal water induced by typhoon Soudelor. Remote Sens. 2021, 13, 194. [Google Scholar] [CrossRef]
Figure 1.
The location of Poyang Lake, the exits of the five rivers, hydrological stations and sampling stations.
Figure 1.
The location of Poyang Lake, the exits of the five rivers, hydrological stations and sampling stations.

Figure 2.
Remote sensing reflectance (Rrs) values (dashed lines) for various (mg/L) levels and relative spectral response functions of the MODIS (broken lines).
Figure 2.
Remote sensing reflectance (Rrs) values (dashed lines) for various (mg/L) levels and relative spectral response functions of the MODIS (broken lines).

Figure 3.
Schematic processing of backflow from river to lake (BRL). (a) the beginning of the BRL; (b) the processing and the influence scope of the BRL.
Figure 3.
Schematic processing of backflow from river to lake (BRL). (a) the beginning of the BRL; (b) the processing and the influence scope of the BRL.

Figure 4.
Comparison between total suspended sediment (TSS) and simulated Moderate-Resolution Imaging Spectroradiometer (MODIS)-derived single bands.
Figure 4.
Comparison between total suspended sediment (TSS) and simulated Moderate-Resolution Imaging Spectroradiometer (MODIS)-derived single bands.

Figure 5.
The fitting model between in situ TSS and a simulated MODIS-derived band combination and its validation. (a) the fitting model; (b) validation of the model.
Figure 5.
The fitting model between in situ TSS and a simulated MODIS-derived band combination and its validation. (a) the fitting model; (b) validation of the model.

Figure 6.
The spatial-temporal distribution of in Poyang Lake during the period of a BRL in July 2000.
Figure 6.
The spatial-temporal distribution of in Poyang Lake during the period of a BRL in July 2000.

Figure 7.
The spatial-temporal distribution of ρ in Poyang Lake during the period of a BRL from July to August 2007.
Figure 7.
The spatial-temporal distribution of ρ in Poyang Lake during the period of a BRL from July to August 2007.

Figure 8.
Schematic processing of the backflow from river to lake (BRL) on 7–10 July 2000. (a) the processing of the BRL; (b) the influence scope of the BRL.
Figure 8.
Schematic processing of the backflow from river to lake (BRL) on 7–10 July 2000. (a) the processing of the BRL; (b) the influence scope of the BRL.

Figure 9.
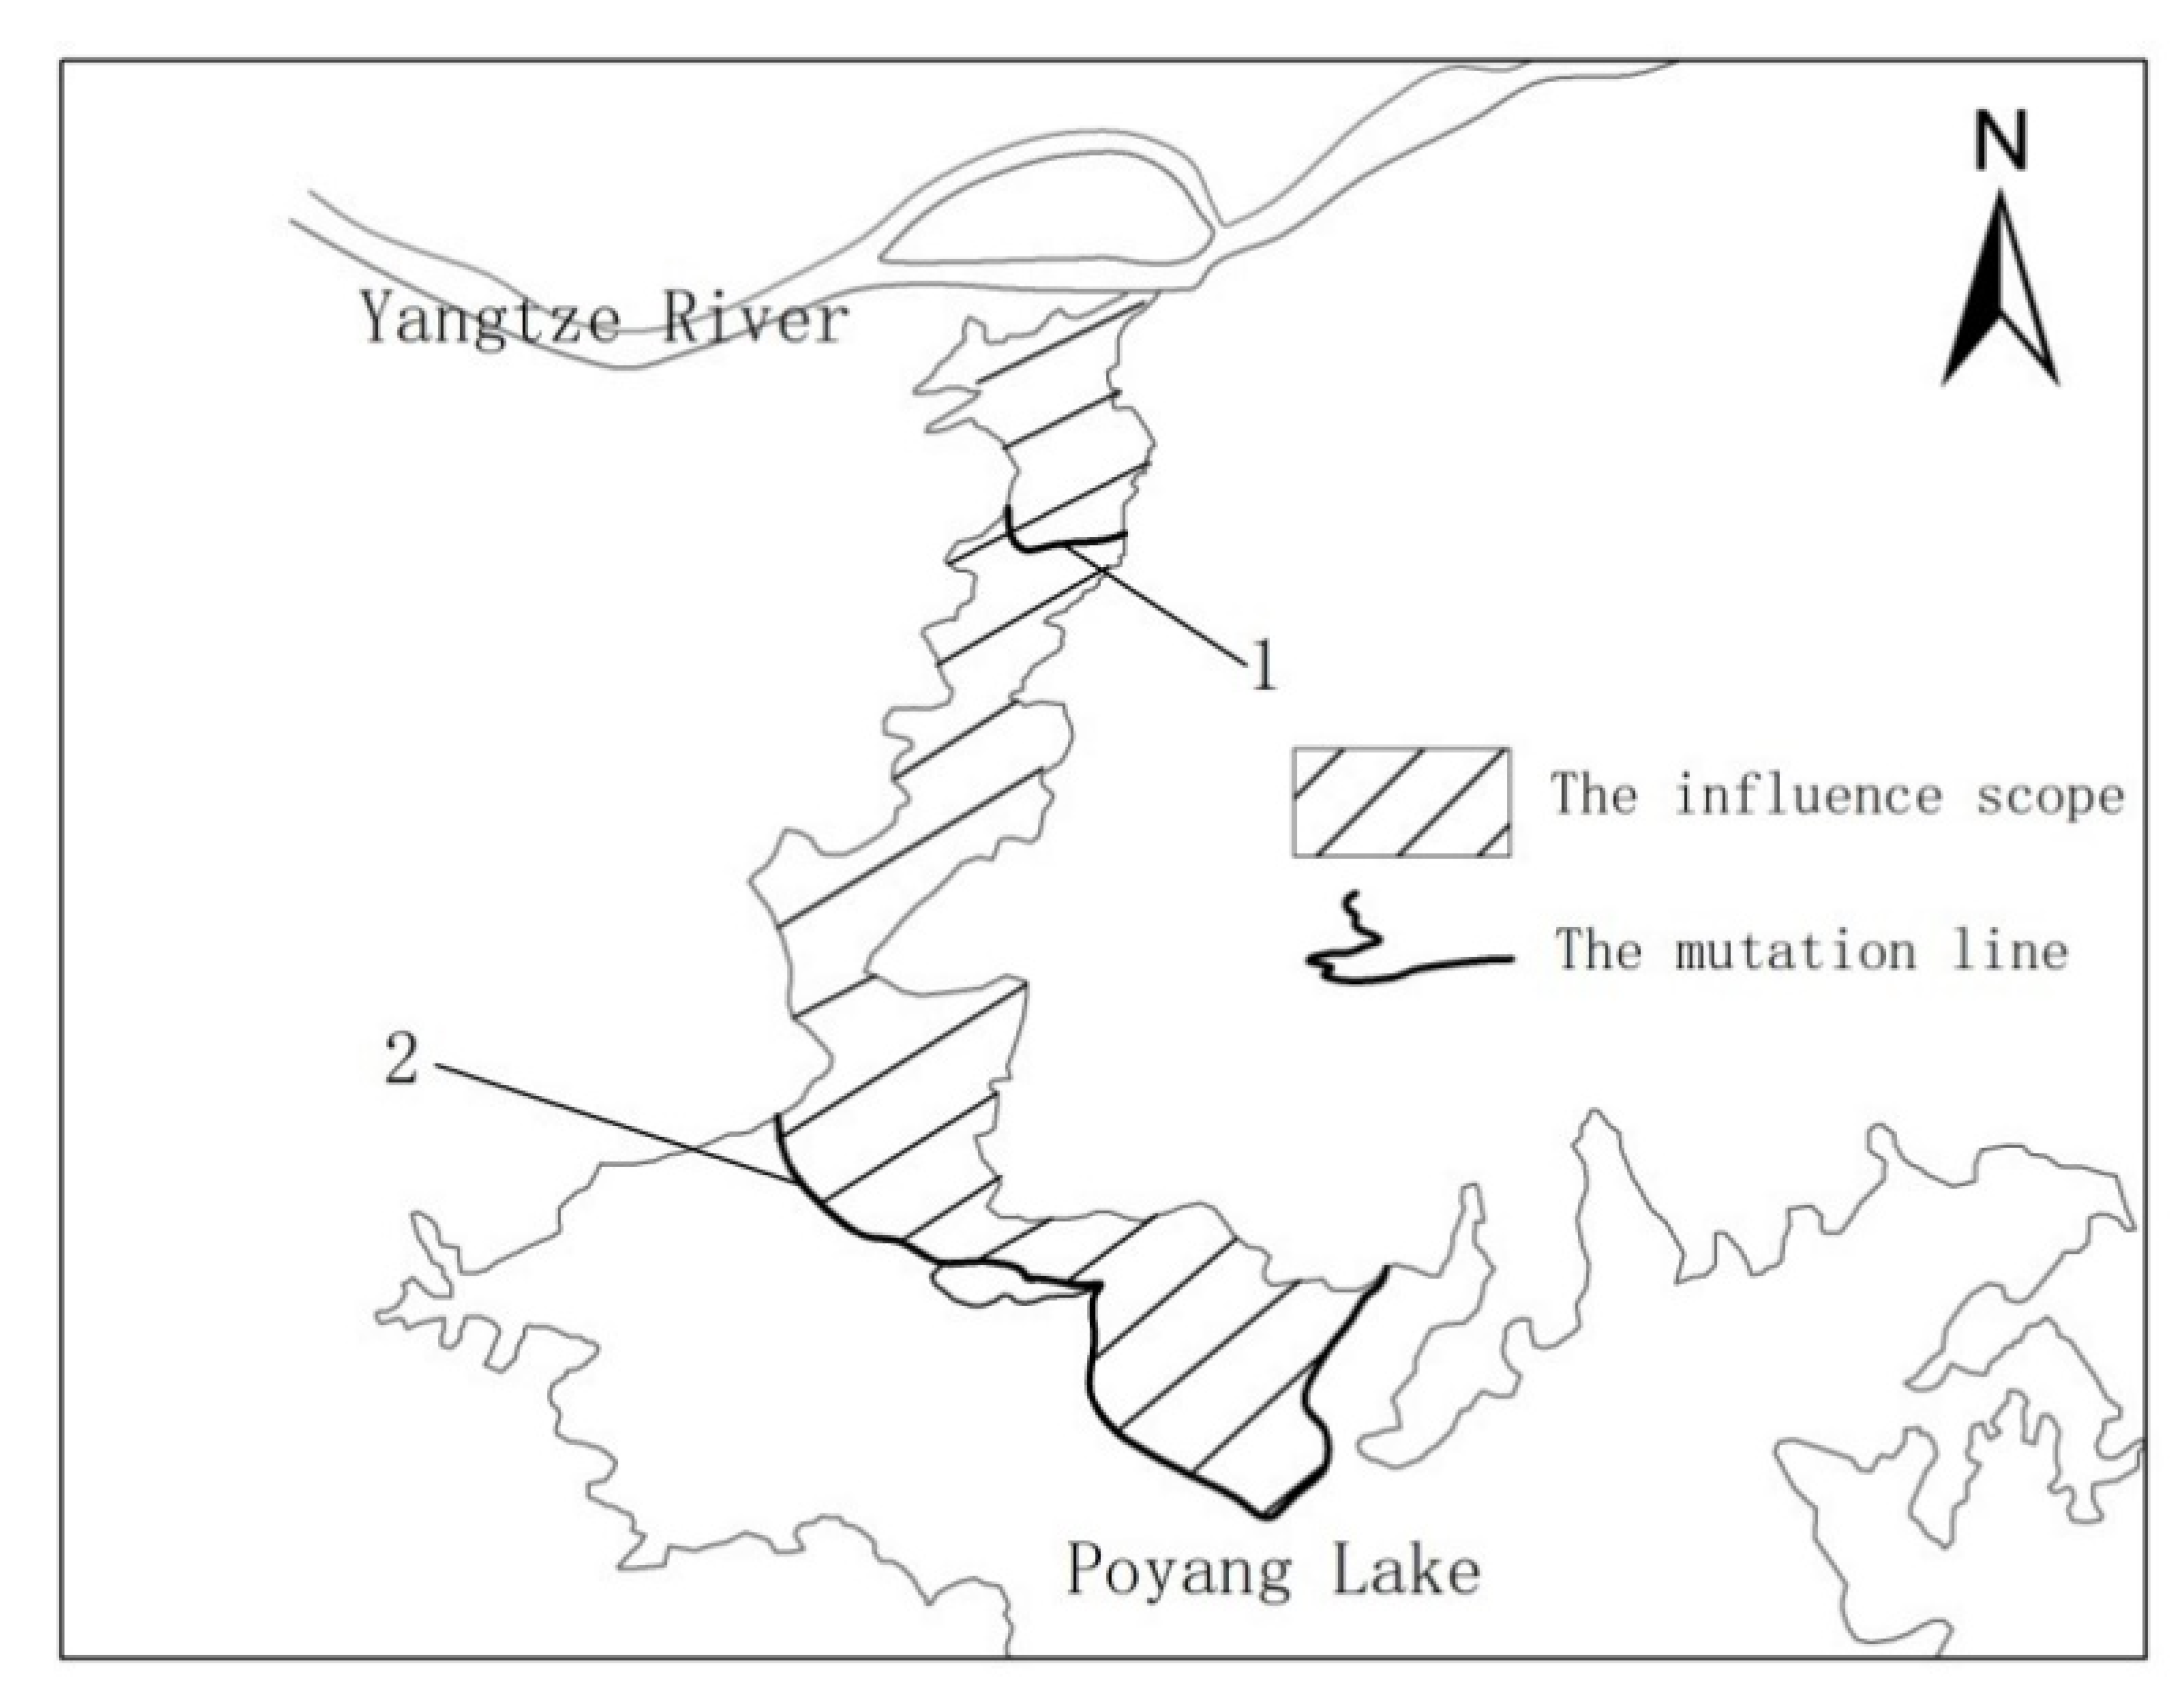
Schematic processing of the backflow from river to lake (BRL) from 22 July to 7 August 2007. Line 1 and Line 2 are the locations of the mutation lines at the beginning and end of the BRL, and the filled area is the influence scope of this BRL.
Figure 9.
Schematic processing of the backflow from river to lake (BRL) from 22 July to 7 August 2007. Line 1 and Line 2 are the locations of the mutation lines at the beginning and end of the BRL, and the filled area is the influence scope of this BRL.


Table 1.
The observation discharge data of Hukou hydrological station from 7 to 10 July 2000.
| Date | 6 July 2000 | 7 July 2000 | 8 July 2000 | 9 July 2000 | 10 July 2000 | 11 July 2000 |
| Discharge m3/s | 1140 | −1500 | −1380 | −984 | −539 | 275 |
Table 2.
The observation discharge data of Hukou hydrological station from 21 July to 8 August 2007.
Table 2.
The observation discharge data of Hukou hydrological station from 21 July to 8 August 2007.
| Date | 21 July 2007 | 22 July 2007 | 23 July 2007 | 24 July 2007 | 25 July 2007 | 26 July 2007 | 27 July 2007 | 28 July 2007 | 29 July 2007 | 30 July 2007 |
| Discharge m3/s | 900 | −149 | −1190 | −2130 | −2760 | −3260 | −3470 | −3520 | −3020 | −2500 |
| Date | 31 July 2007 | 1 August 2007 | 2 August 2007 | 3 August 2007 | 4 August 2007 | 5 August 2007 | 6 August 2007 | 7 August 2007 | 8 August 2007 | |
| Discharge m3/s | −2210 | −2070 | −2450 | −2820 | −3040 | −2980 | −1560 | −110 | 1010 |
Publisher’s Note: MDPI stays neutral with regard to jurisdictional claims in published maps and institutional affiliations. |
© 2021 by the authors. Licensee MDPI, Basel, Switzerland. This article is an open access article distributed under the terms and conditions of the Creative Commons Attribution (CC BY) license (https://creativecommons.org/licenses/by/4.0/).
Share and Cite
MDPI and ACS Style
Jiang, H.; Liu, Y.; Lu, J. A New Algorithm for Monitoring Backflow from River to Lake (BRL) Using Satellite Images: A Case of Poyang Lake, China. Water 2021, 13, 1166. https://doi.org/10.3390/w13091166
AMA Style
Jiang H, Liu Y, Lu J. A New Algorithm for Monitoring Backflow from River to Lake (BRL) Using Satellite Images: A Case of Poyang Lake, China. Water. 2021; 13(9):1166. https://doi.org/10.3390/w13091166
Chicago/Turabian StyleJiang, Hui, Yao Liu, and Jianzhong Lu. 2021. "A New Algorithm for Monitoring Backflow from River to Lake (BRL) Using Satellite Images: A Case of Poyang Lake, China" Water 13, no. 9: 1166. https://doi.org/10.3390/w13091166
Note that from the first issue of 2016, this journal uses article numbers instead of page numbers. See further details here.