
Impact of the Intermittency Movement of Center Pivots on Irrigation Uniformity
by
 , , and
Abdelmoneim Z. Mohamed
1,2,* ,
,
R. Troy Peters
1,
Abid Sarwar
1,3,
Behnaz Molaei
1 and
Don McMoran
4 1
Department of Biological Systems Engineering, Washington State University, Pullman, WA 99164, USA
2
Agricultural Engineering Research Institute (AEnRI), Agricultural Research Centre, Giza 12619, Egypt
3
Department of Irrigation and Drainage, University of Agriculture Faisalabad (UAF), Faisalabad 38000, Pakistan
4
WSU Skagit County Extension, Burlington, WA 98233, USA
*
Author to whom correspondence should be addressed.
Water 2021, 13(9), 1167; https://doi.org/10.3390/w13091167
Submission received: 2 March 2021
/
Revised: 11 April 2021
/
Accepted: 21 April 2021
/
Published: 23 April 2021
(This article belongs to the Section Water, Agriculture and Aquaculture)
Abstract
:A computer model was developed to simulate the varying depths of water applied to the ground due to the intermittent movements of a typical center pivot. The stop–go model inputs include the sprinkler application depth, the sprinkler pattern, that pattern’s wetted radius, the center pivot’s % timer setting, the move cycle time, and the end tower maximum travel speed. The model outputs were the depth of application in the pivot’s movement direction, the distribution uniformity (DU), and the coefficient of uniformity (CU). The results revealed that the pivot circular application uniformity is mostly a function of the move distance as a percent of the sprinklers’ wetted radius. This, in turn, is a function of the percent timer setting, the cycle time, and the end tower travel speed. Due to this, the high-speed center pivots had corresponding lower application uniformities compared to low-speed machines, and sprinklers with larger wetted radii resulted in better uniformity. Shortening the cycle time also resulted in higher uniformity coefficients. Based on these results, it is recommended that the run time be set based on the pivot end-tower’s travel speed and sprinkler wetted radius, such that the end tower move distance is equivalent to the sprinkler wetted radius. This will reduce wear to the tower motors due to the on–off cycling, especially for slow travel settings and for sprinklers with larger wetted radii. The ponding depths at different percent of the move distance, for the potential runoff, were estimated, which were set to be equivalent to the wetted radius.
1. Introduction
More than half of the irrigated acreage in the United States (US) is irrigated by center pivots. Small improvements to the performances of these machines can have a great impact on the overall water conservation in the US [1]. In order to adequately irrigate a field, additional water needs to be applied everywhere in order to adequately irrigate the areas of the field that are getting small amounts of water. Therefore, adjusting irrigation uniformity for unimportant variability on a small scale of a filed is required for good irrigation efficiency [1]. Additionally, uniformity can be achieved by modeling sprinklers pattern along center pivot’s pipeline or along the machine path. Modeling the application pattern of sprinklers on center pivot may help in the design of the machine’s nozzle chart to reach a high uniformity [2,3,4].
Significant efforts have been made on modeling the water delivery application pattern of the center pivot. These models categorized under four groups: numerical, statistical, ballistic, and semi-empirical models.
Numerical models were used to simulate the sprinklers pattern of center pivot. This can be achieved by overlapping experimentally measured isolated sprinkler patterns [5]. Heermann and Hein [3] designed a computer model to predict the water pattern from adjacent sprinklers that modeled the actual movement pattern in terms of application depth. They concluded that the close spacing of sprinklers along the pivot pipeline most likely concealed the effect of the two theoretical sprinkler distribution patterns that they tested (triangular and elliptical). In the same research line, a mathematical analysis was introduced by Amir and Alchanatis [6] to predict the instantaneous and the cumulative water application pattern (WAP) as a function of the travel path [7]. Furthermore, Alchanatis and Amir [8] introduced the coefficient Pa that measures the actual water application pattern by comparing it to any desired pattern. A model for the water application patterns under pivots was developed by Bremond and Molle [9] in the form of irrigation uniformity. In their study, the water application pattern was a function of the pivot speed.
Other researchers simulated the application of sprinklers by statistical distributions, such as the lognormal, uniform (linear), specialized power, and beta and gamma distributions [10,11,12].
On the other hand, generally, ballistic models were applied by many researcher [13,14,15,16] in modeling the irrigation uniformity of sprinkler irrigation systems. More specifically, ballistic models were used in moving sprinkler systems by Ouazaa et al. [15]. They developed a model using a ballistic approach for center pivot sprinklers using parameters such as the nozzle diameter, operating pressure, and wind speed. The model was used to assess the impact of the variable tower alignment, wind conditions, and travel speed on water application performance.
Finally, semi-empirical models calculate and map the effect of wind speed and direction on the distribution pattern of sprinklers as a water distribution uniformity [11,17,18].
Most center pivot towers are controlled with a simple electric motor that turns on and off intermittently to control the movement and alignment of the pivot. On most pivots, the travel speed and, therefore, the irrigation water application depth is controlled by a timer that dictates the percentage of a given time interval that the motor driving the last tower is running. The other towers’ motors move simply to keep the pivot lateral straight. At least one pivot manufacturer uses a hydraulic drive to keep all of the towers in constant motion (T&L Manufacturing). There are also several after-market packages that use variable frequency drive controllers on the electric drive motors on each tower to also keep the towers in constant motion. The manufacturers claim that eliminating the stop–go motion of the pivot towers considerably increases the irrigation application uniformity.
The start–stop movement and speed variations of the center pivots impacts irrigation application uniformity in the direction of travel [19]. It has been found that the variation in travel speed of the center pivot lateral due to start–stop sequences and towers alignment leads to random variability similar to wind drift [20]. Moreover, Hanson and Wallender [21] concluded that nonuniformity along the lateral was related in part to the movement of the towers. However, a firm correlation was difficult to create.
The stop–move action of a center pivot was used to integrate three sprinkler patterns along the travel path [22]. It was generally found that the most common geometric patterns to represent the center pivot water application rates are elliptical and triangular shapes [22]. However, and according to DeBoer [23], the application distributions of field irrigation datasets were likely trapezoidal patterns. Furthermore, Bittinger and Longenbaugh [7] analyzed elliptical and triangular stationary distributions for linear-move and center pivot irrigation systems, and they concluded that the theoretical uniformity differs from the actual field uniformity. However, the actual pattern generally had a donut shape. Thus, it has less application uniformity than the triangle pattern. Furthermore, Heermann and Hein [3] assumed in their model a stationary pattern shape of either triangular or elliptical; later on, Heermann [24] introduced the CPED (center pivot evaluation and design) software package, based on Bittinger and Longenbaugh [7], study with an assumption of triangular, elliptical, and toroidal application patterns. Then, Heermann [25] expanded the model to include donut-shaped patterns to represent low-pressure spray heads.
There are many parameters that may affect the water distribution uniformity. These parameters were presented in research as combined or separate. Kohl and DeBoer [26] investigated the water application pattern as a function of pressure, nozzle diameter, and impact plate. Moreover, Kincaid [20] reported the results related to the water application pattern as affected by the height of the sprinklers and pressure. Another analysis of the effect of pressure and discharge on the wetted area was presented by Kincaid [27]. Additionally, Omary and Sumner [28] developed a model to calculate the water application depth, which was the sum of two movements: (1) continuously moving and applying water and (2) the application depths while it is stopped at each location. They also used the cycle time in their model. They found that there was no significant effect of the percentage of moving time for the short cycle time on the uniformity coefficient, and the uniformity coefficient was increased by 12.9% by reducing the cycle time from 60 to 30 s when the application depth remained the same. After that, a modification was applied to this model to include the effect of direction and wind speed on sprinkler pattern [29]. Additionally, the impact of two center-pivot travel speeds and two cycle times on the irrigation performance was analyzed by Yan et al. [30]. They concluded that the cycle time has a minor impact on radial uniformity but no effect on the circular uniformity.
Calculating the potential runoff is a helpful tool for the accurate design and management of the center pivot [4,31]. The intermittency movements of a moving sprinkler irrigation system not only affect the water distribution uniformity but the runoff as well. Runoff under moving sprinkler irrigation systems is common when the application rate exceeds the soil infiltration [23,32,33,34,35]. This runoff may be estimated and controlled using different approaches [34,36,37,38,39,40,41,42,43,44]. The stop–go movement of the center pivot may affect the ponding and the runoff depending on the system run time setting and sprinklers configuration. Choosing a proper run time of center pivot can prevent runoff. Uniformity measured along the machine travel path is thought to be high, because as the machine moves continuously, it integrates sprinkler pattern irregularities [45]. However, the intermittent movements of center pivots can affect the uniformity. To date, research that discusses the relationship between runtime, move distance, and sprinklers’ wetted radius and irrigation uniformities as a result of the intermittency movements of the center pivots have not yet been adequately defined. The objective of this paper was to develop a model of sprinkler application depths of a center pivot in the direction of travel for different sprinkler application patterns (elliptical, triangular, rectangular, and donut) that makes the move distance a percent of the sprinkler wetted radius. This will help investigate how the stop–go movement of a center pivot for a given set of parameters (percent timer setting, the cycle time, and the end tower travel speed) might affect the irrigation uniformity in terms of the distribution uniformity (DU) and the coefficient of uniformity (CU). This could help in decision-making on the sprinkler package selection and pivot configurations and design. Additionally, we wanted to know if the same parameter (move distance as a percent of sprinkler wetted radius) will affect the ponding and runoff from the sprinklers.
2. Materials and Methods
Model Development
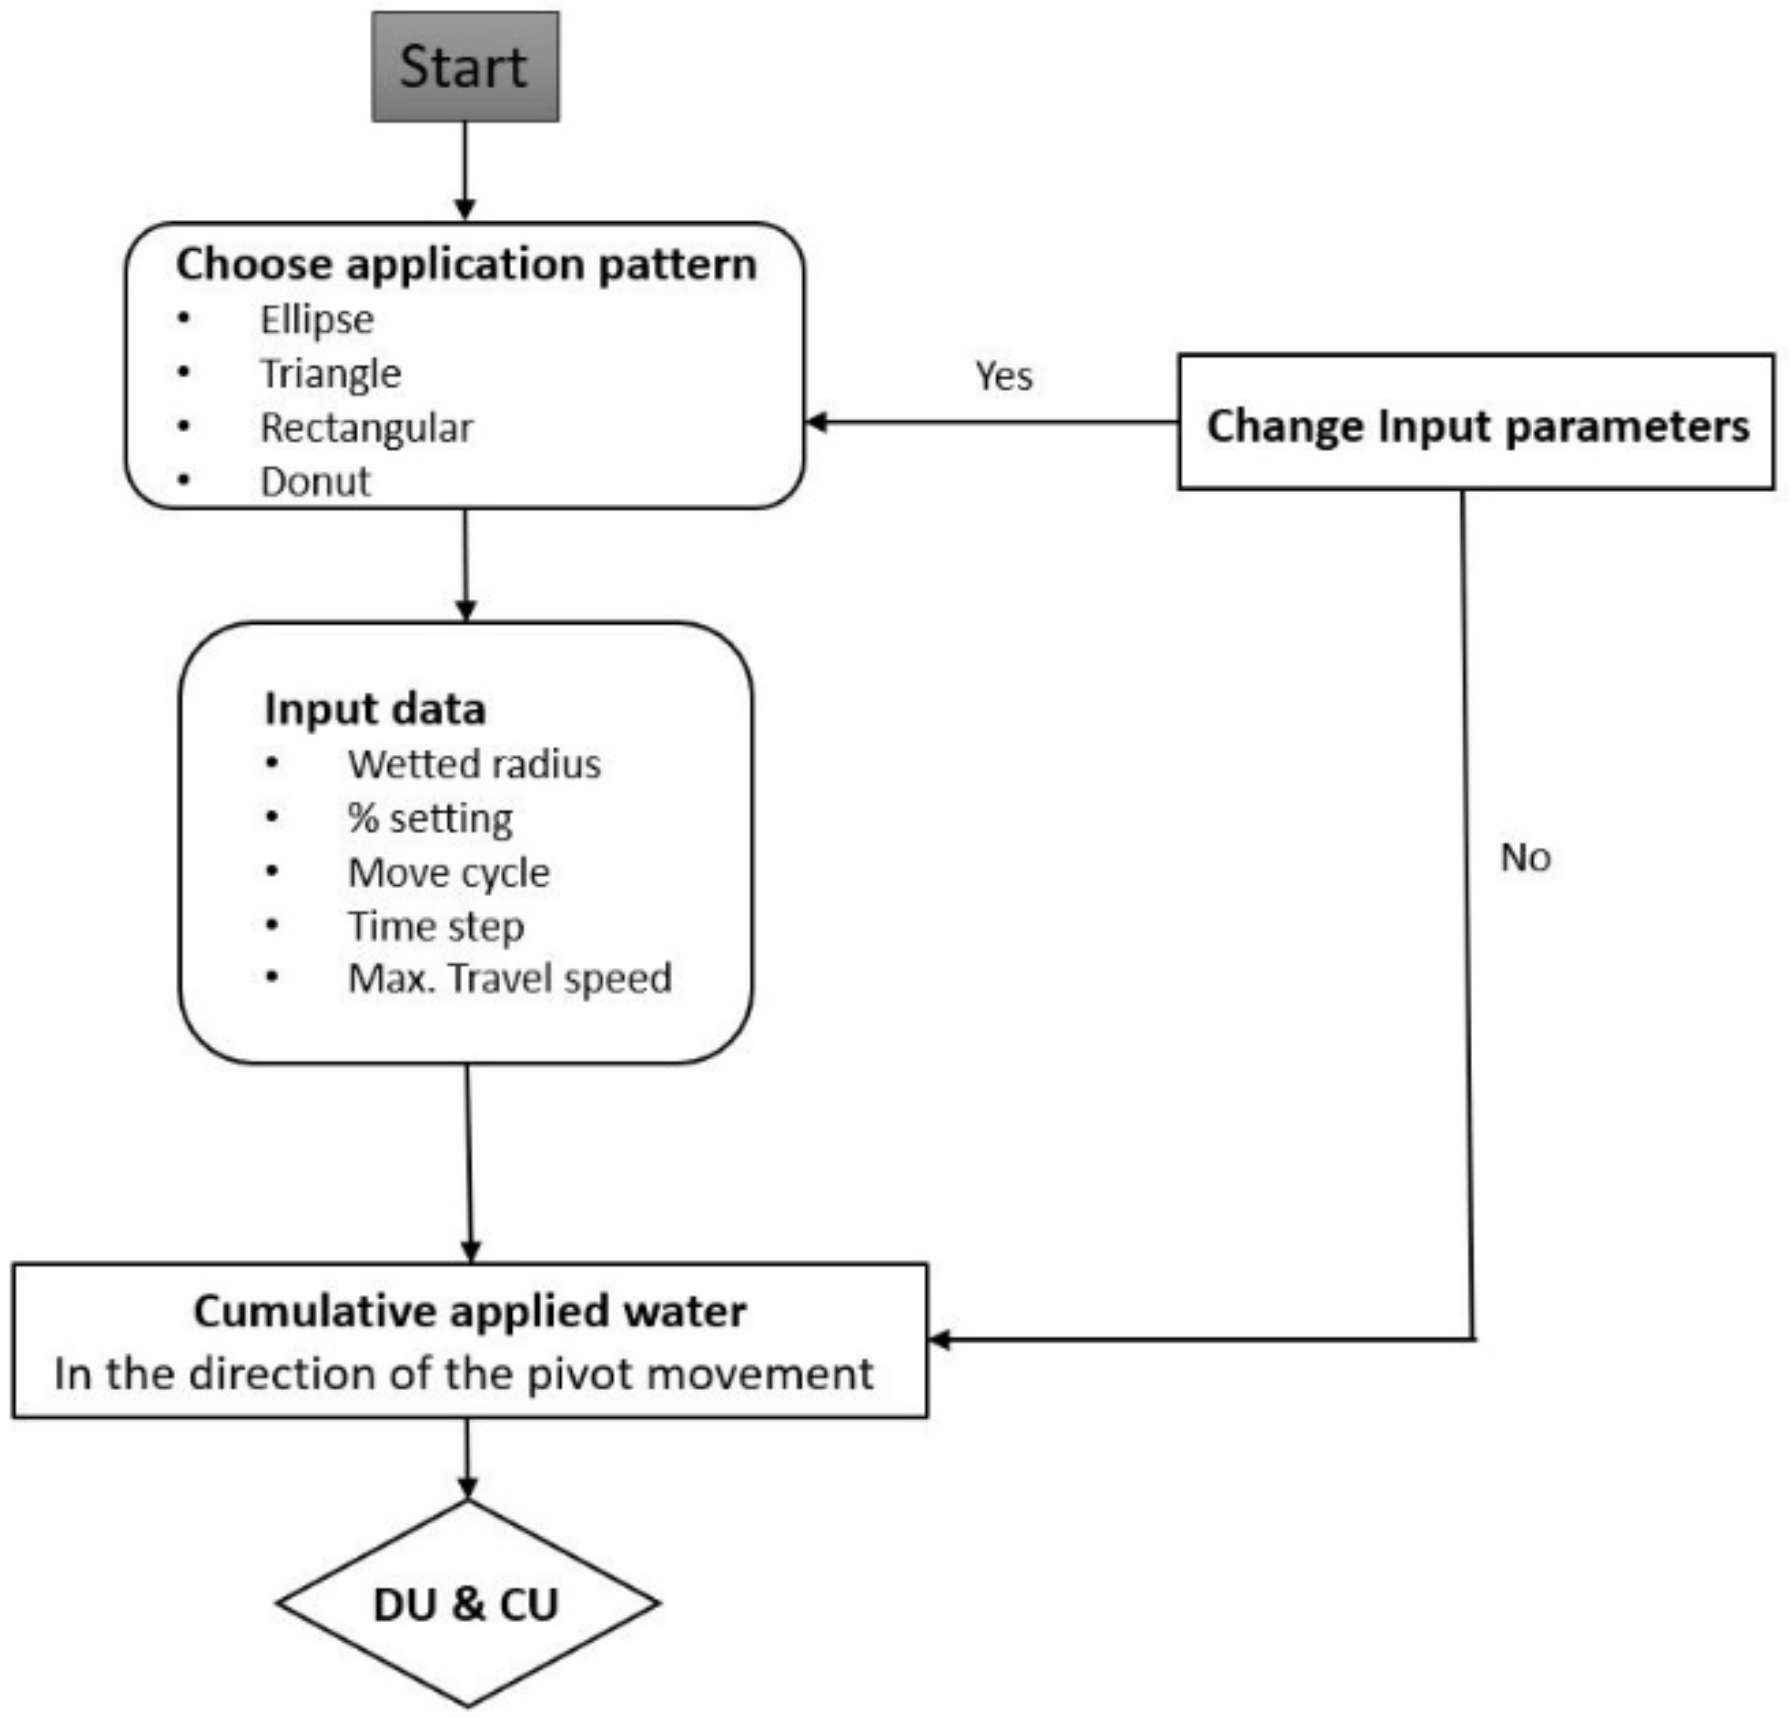
A computer model was developed using visual basic for applications (VBA) to simulate the application depth in the direction of movement resulting from the stop and go movements of a center pivot using different sprinkler application patterns (Figure 1 and Figure 2). The patterns chosen (triangular, elliptical, and rectangular) are generalized approximations of what the application rate of the overlapped sprinklers might be with distance from the pivot lateral. The actual pattern is never perfectly any of these and changes with the pressure, sprinkler type, wind, and nozzle sizes. However, we might approximate these using these two-dimensional shapes to investigate how the stop–go movement affects the uniformity in general. Certainly, the three-dimensional application pattern is conical instead of triangular, etc. However, when these are all overlapped, we might generally approximate the application rate with distance from the pivot lateral. The stop–go model also calculates the resultant irrigation uniformities (DU and CU). Four different sprinkler application pattern models were used to approximate the changes in the sprinkler application rates with distance from the pivot line: elliptical, triangular, rectangular, and donut. In the first step of the stop–go model, different travel speed, timer setting, and wetted radius were simulated (Figure 2). Then, the relationship between these parameters were simulated to calculate the cycle and run time. Since we were primarily interested in the effects of the stop–go movement, we assumed that the irrigation application patterns were uniform between sprinklers, i.e., the pattern was uniform across the length of the pivot and only varied with distance from the pivot pipeline. The wetted radius of each of these is a set parameter, but the maximum application depth is calculated so that the total amount of water applied in a pass (the area underneath the application rate pattern curve) remains constant across the different patterns.
We assumed, for the model inputs, that the center pivot was about 402 m long with a capacity of 64.8 L s−1 ha−1. Different values of the machine parameters can be used in this model. Sprinkler spacing on the pivot pipe lateral was approximately 3 m (The span length does not affect the model, and it is negligible.). The application uniformity was modeled near the end of the pivot at 396 m. To calculate the application depths, a 2-s time step was used in the simulation, and the maximum end tower travel speed was an input variable. The model is time-based, not distance based. It depends on the travel speed of the pivot. We assume that the pivot moves similar to a linear-move machine and does not take into account the radial and angular differences of a center pivot, since they would have very little affect due to the circular application pattern of the sprinklers, and the very small differences between the outside and inside move distances (about 2 cm towards the end of the pivot). Move distance is the move distance between one start and stop cycle. DU and CU are estimated at a particular radial distance, and the model does not simulate a full revolution. This is only a look into the stop–go movement of a pivot. The inside towers, which move somewhat independently of the end tower, will be different. The model outputs were distribution uniformity (DU) and the coefficient of uniformity (CU).
DU of the low quarter or DUlq was calculated after Burt et al. [46] to characterize the performance of the sprinkler package.
where = average of the lowest one-fourth of the application depths (mm), and = average of all application depths (mm).
The Christiansen coefficient of uniformity was calculated following [47,48]
where CU = uniformity coefficient developed by Christiansen (%), i = each observed application depth (mm), and u = mean observed application (mm).
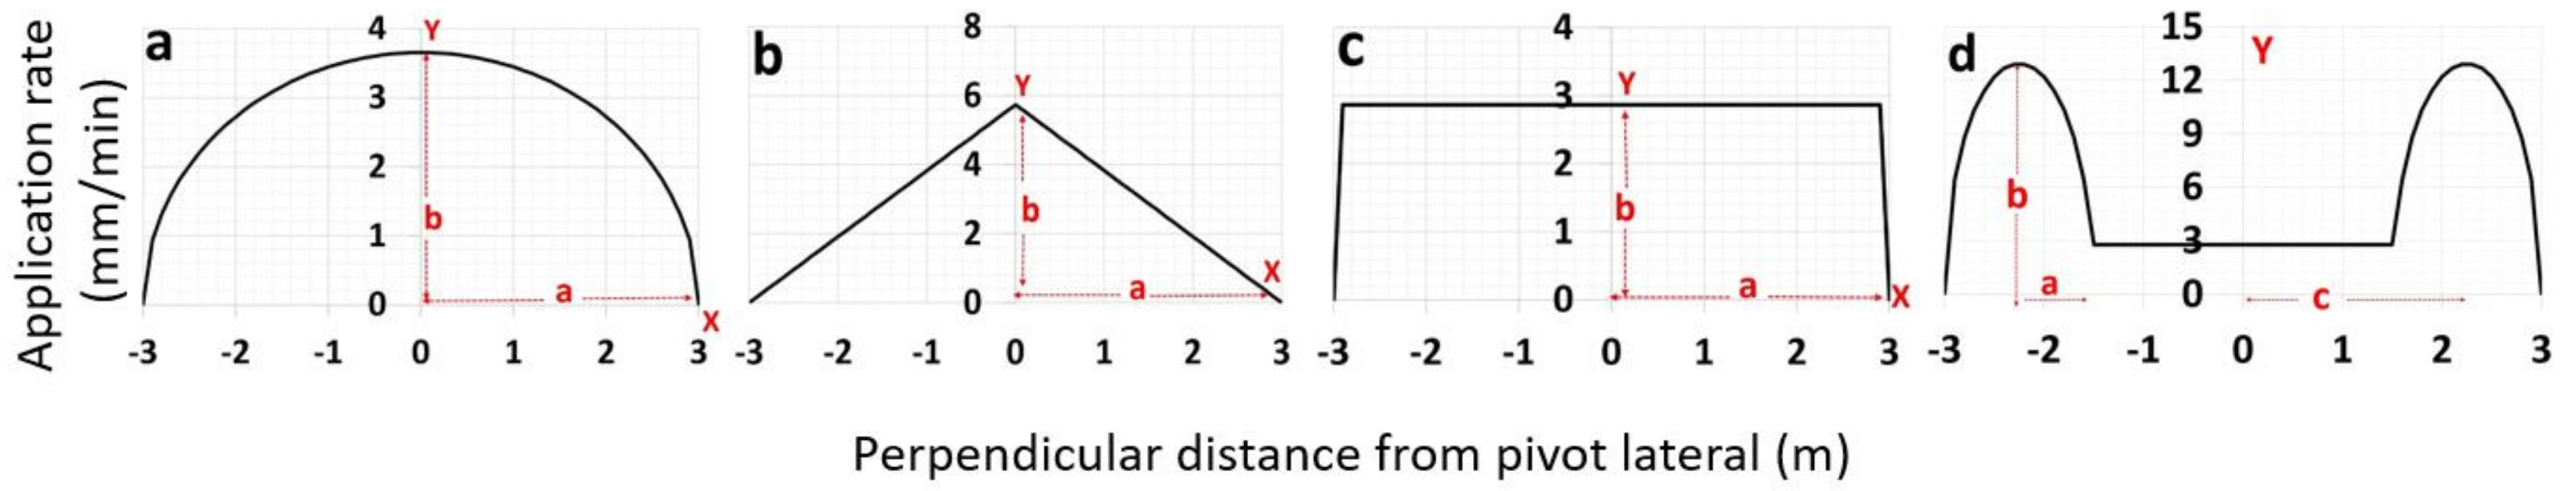
Water distribution by center pivot sprinklers is a function of their patterns. The theoretical application rate for the elliptical, triangular, rectangular, and donut sprinkler patterns (Figure 2 and Figure 3) were calculated as follows:
Elliptical pattern:
Triangular pattern:
Rectangular pattern:
Donut pattern:
where Y is the instantaneous application rate of the pattern (mm/min), b is the maximum application rate (mm/min), a is the wetted radius of the sprinkler (m), X is the distance from the sprinkler (m), and c is the center of the offset distance from the sprinkler for the donut pattern (m).
The application depth at the % setting was calculated as:
where Cd is a constant equal to the minimum application depth (mm) at the 100% setting, and d is the application depth (mm) at the current machine % setting.
Cycle time (Ct) is a set parameter equal to the time (s) between the starting times of each movement cycle of the end tower. The most commonly used cycle time is 60 s [49]. However, this can be chosen to be anything that is appropriate. This is used with the percent setting (%) to calculate the run time (Rt in seconds) as:
The time that the pivot is stopped and irrigating in a stationary location is Ct − Rt.
Different input parameters, such as cycle times (30, 60, and 120 s); travel speed; % setting (Figure 4); and wetted radius, were modeled to compare their impact on water application uniformities in the direction of the pivot movement. In the presented model, we did not account for wind drift and evaporation losses, since these depend on variable weather conditions [50]. The model was designed for a typical center pivot system without an end gun. Various combinations of parameters were tested to analyze the relationship between them and the DU and CU.
3. Results
Firstly, we simulated the effect of different cycle times, travel speed, % setting, and wetted radius as separate on the irrigation uniformity; then, we investigated their relationship on irrigation uniformity. Depending on the summarized relation between these parameters, new two equations were provided (discussed later) for calculating the cycle and run time and, also, the number of cycles per season if such a new method is used. We investigated how the model performs for the small, wetted radii sprinkler configurations, such as low-energy precision application (LEPA) and low-elevation spray application (LESA), which have the worst application uniformity. Using the small, wetted radii allows investigating if there is a significant difference in machine travel speed and the timer setting on the DU and CU.
It was generally found from the simulations that high-speed center pivots have corresponding lower application uniformities compared to low-speed machines. For example, center pivots having an ellipse sprinkler pattern with a wetted radius of 1.5 m, moving on 70% setting, end tower travel speed of 1.5 m/min, and move cycle of 60 s yielded a DU of 91% and 95% CU, while a modeling travel speed of 2.5 m/min using the same previous settings decreased the DU to 76% and CU to 80%.
The sprinkler wetted radius also had a marked effect on the irrigation uniformities. Increasing the wetted radius resulted in higher DU and CU values. Holding other parameters constant, a wetted radius of 3 m resulted in a DU of 98% and a CU of 98% but were typically lower in their value for smaller wetted radius 0.3 m to 70% and 66% for the DU and CU, respectively.
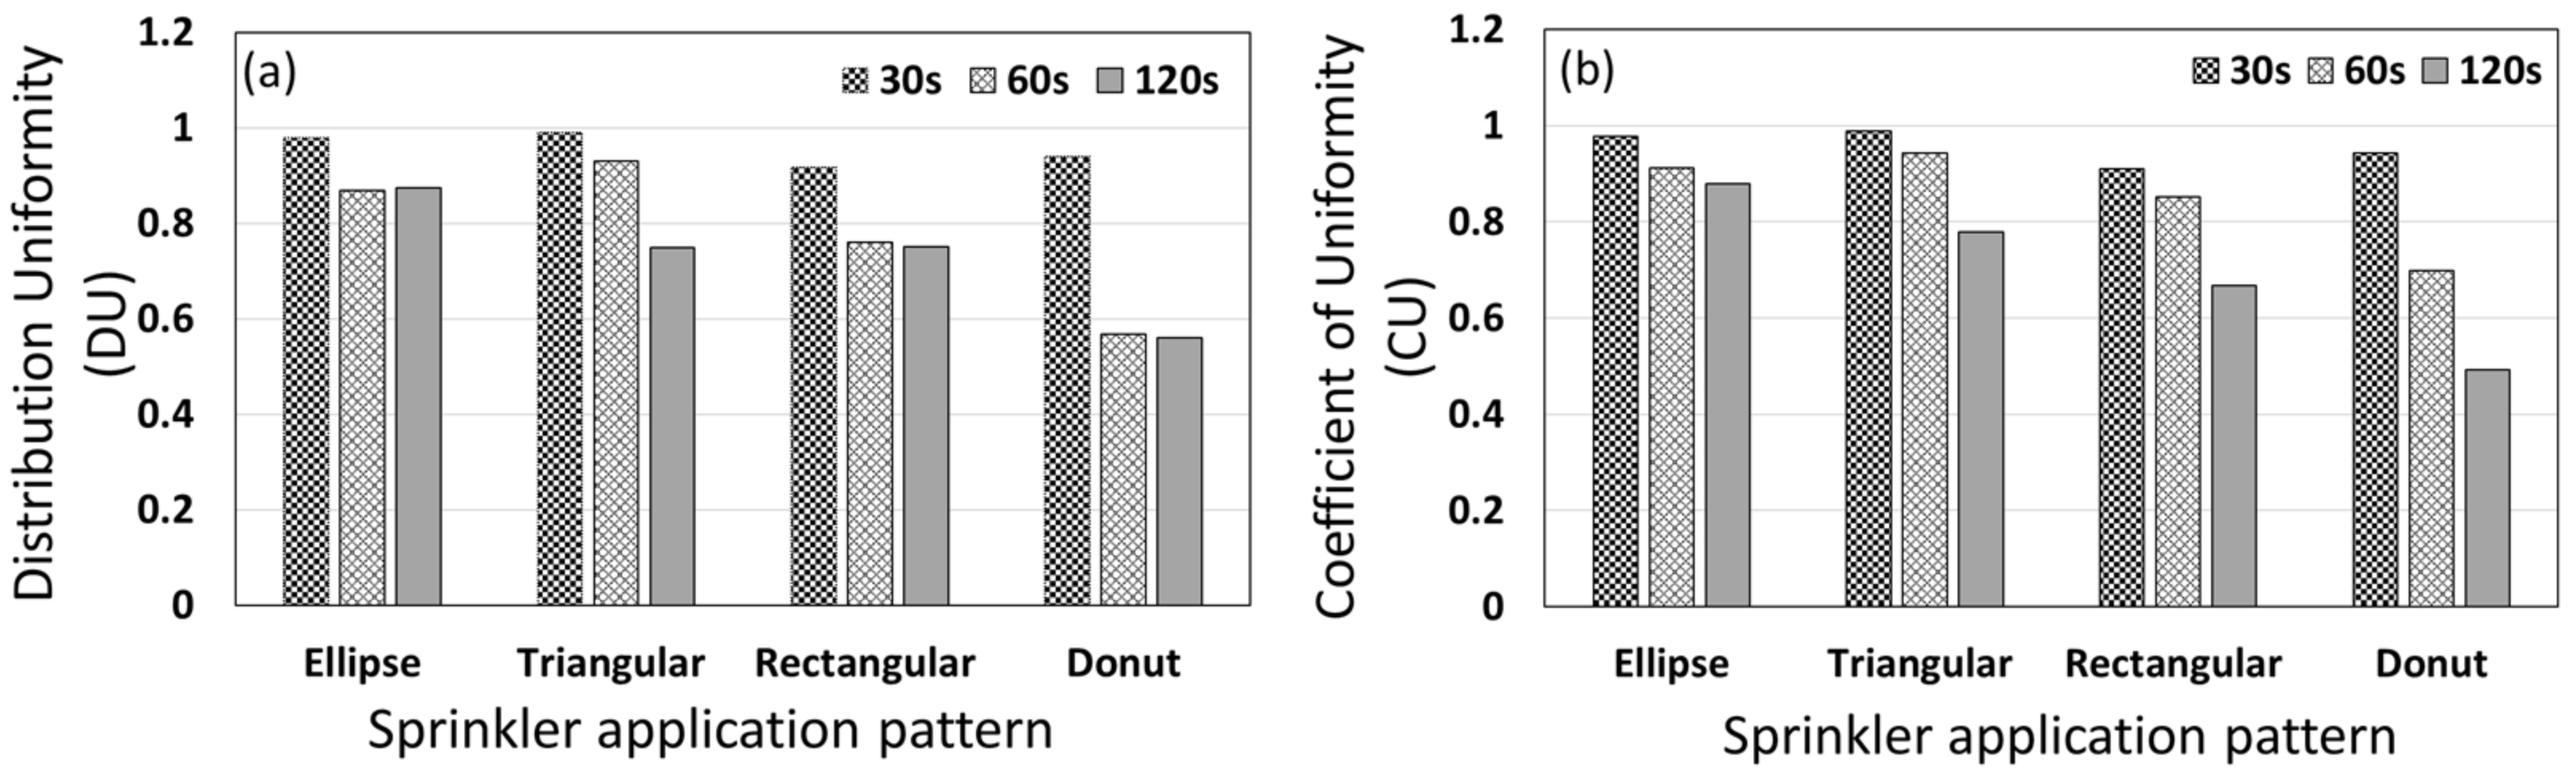
Using the similar previous settings and changing the move cycle to 30 s yielded a considerable increase in the DU and CU of 6% and 11%, respectively. In general, it was found that DU and CU were higher when using a 30-s cycle time and lowest for a 120-s cycle time (Figure 5a,b).
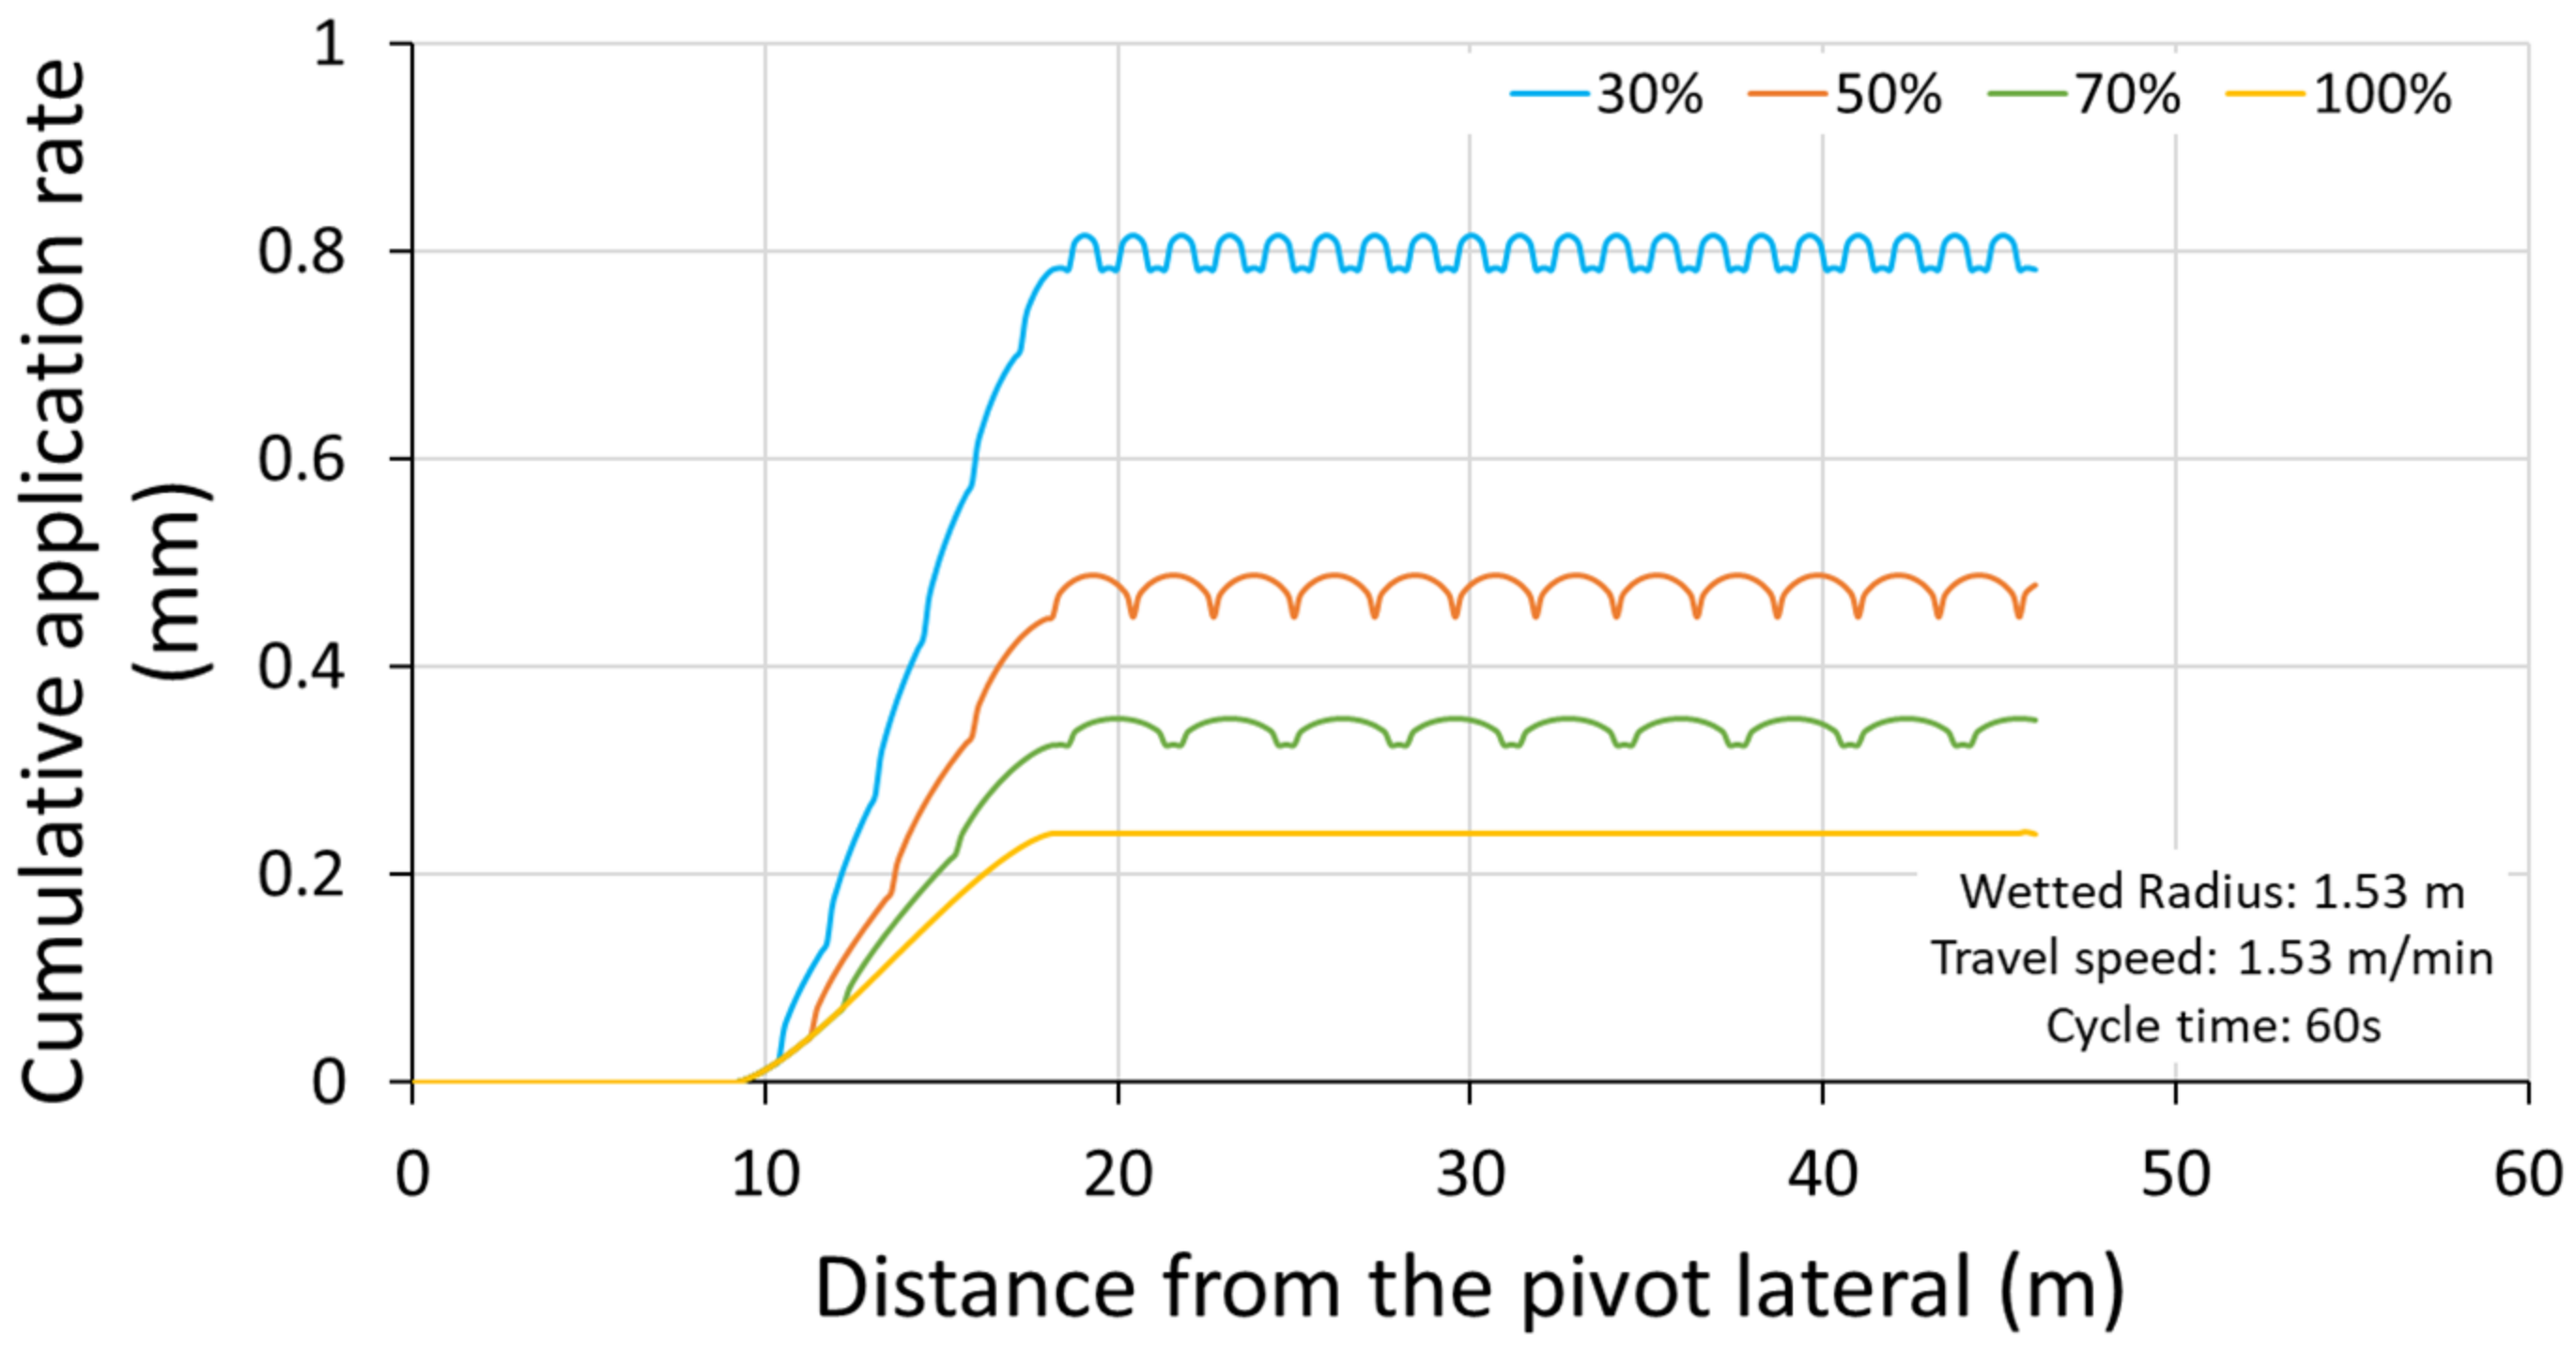
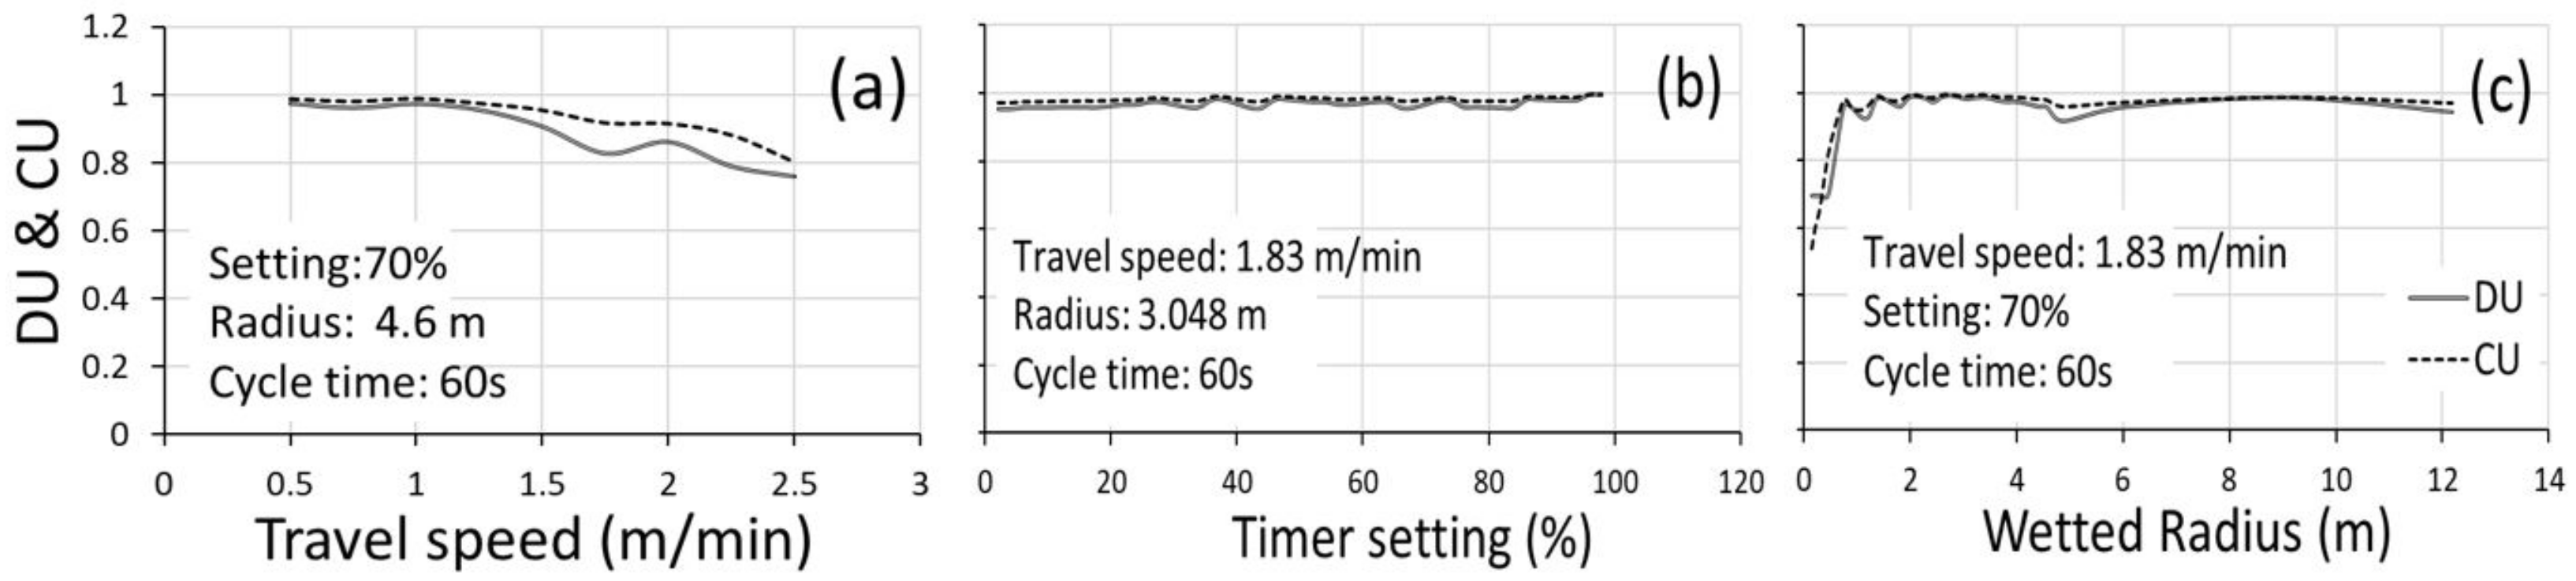
The effects on the DU and CU resulting from changing the machine travel speed (m/min), the timer setting (%), and the wetted radius (m) are given in Figure 6a–c, respectively. Travel speed and wetted radius had a large effect on the irrigation uniformities (DU and CU), while the timer setting had a minimal effect on the DU and CU using the previous settings. Regardless of the sprinkler pattern, wetted radius, or travel speed, it was found a 100% uniformity in the direction of movement when there is constant movement of the pivot (Figure 4).
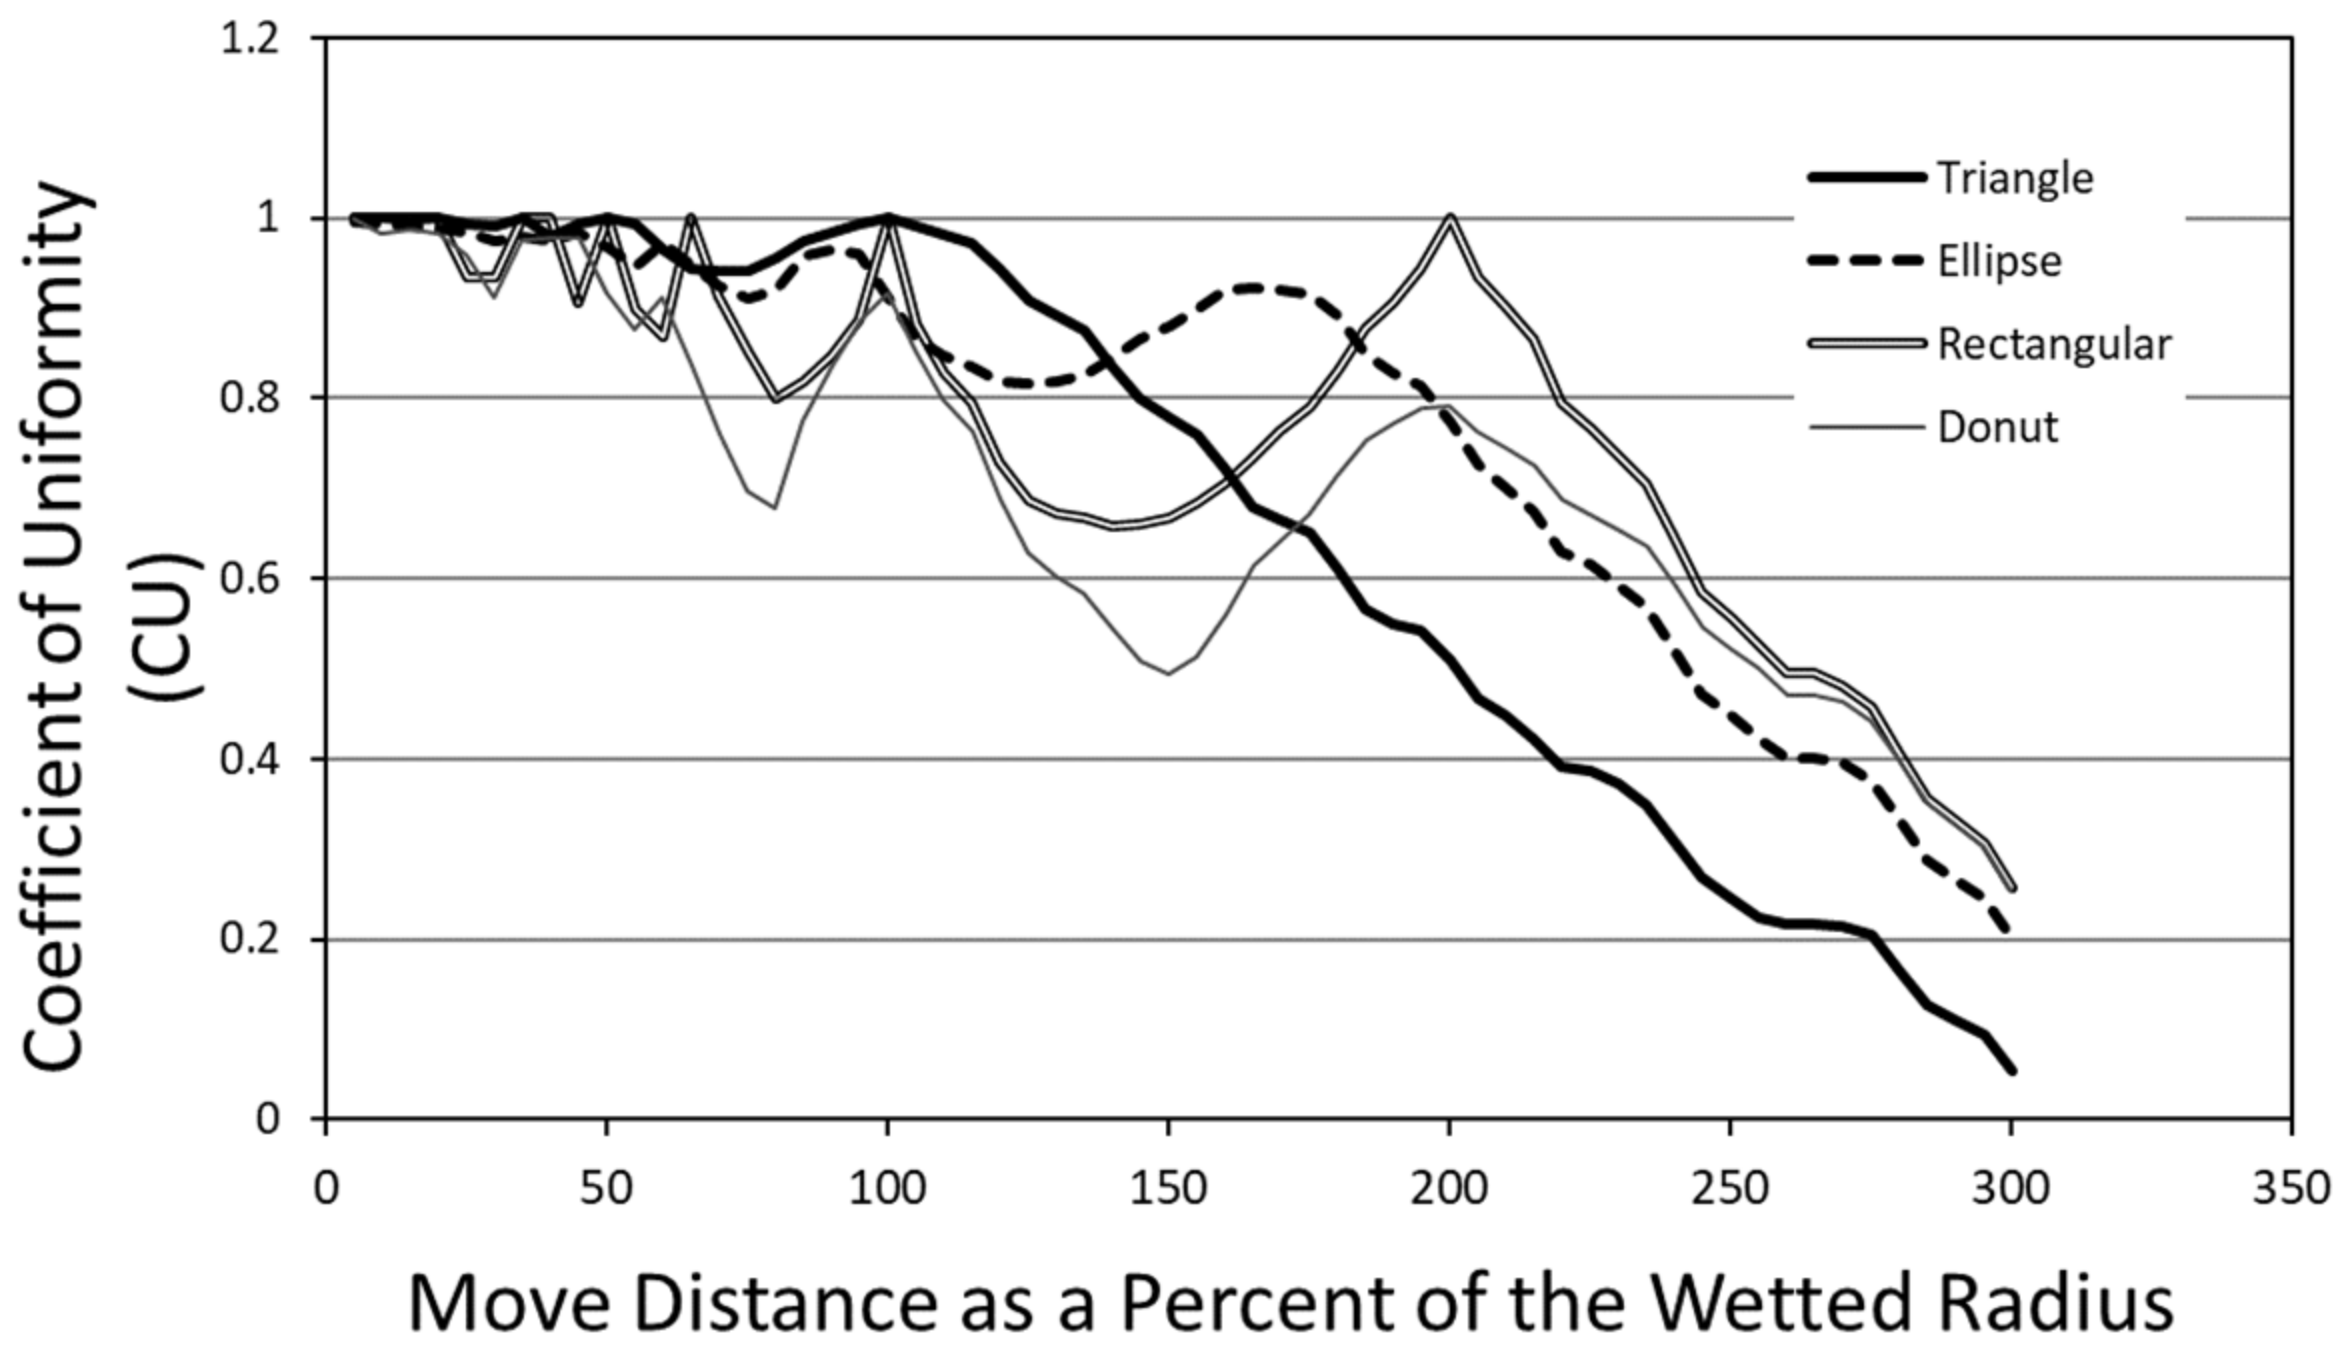
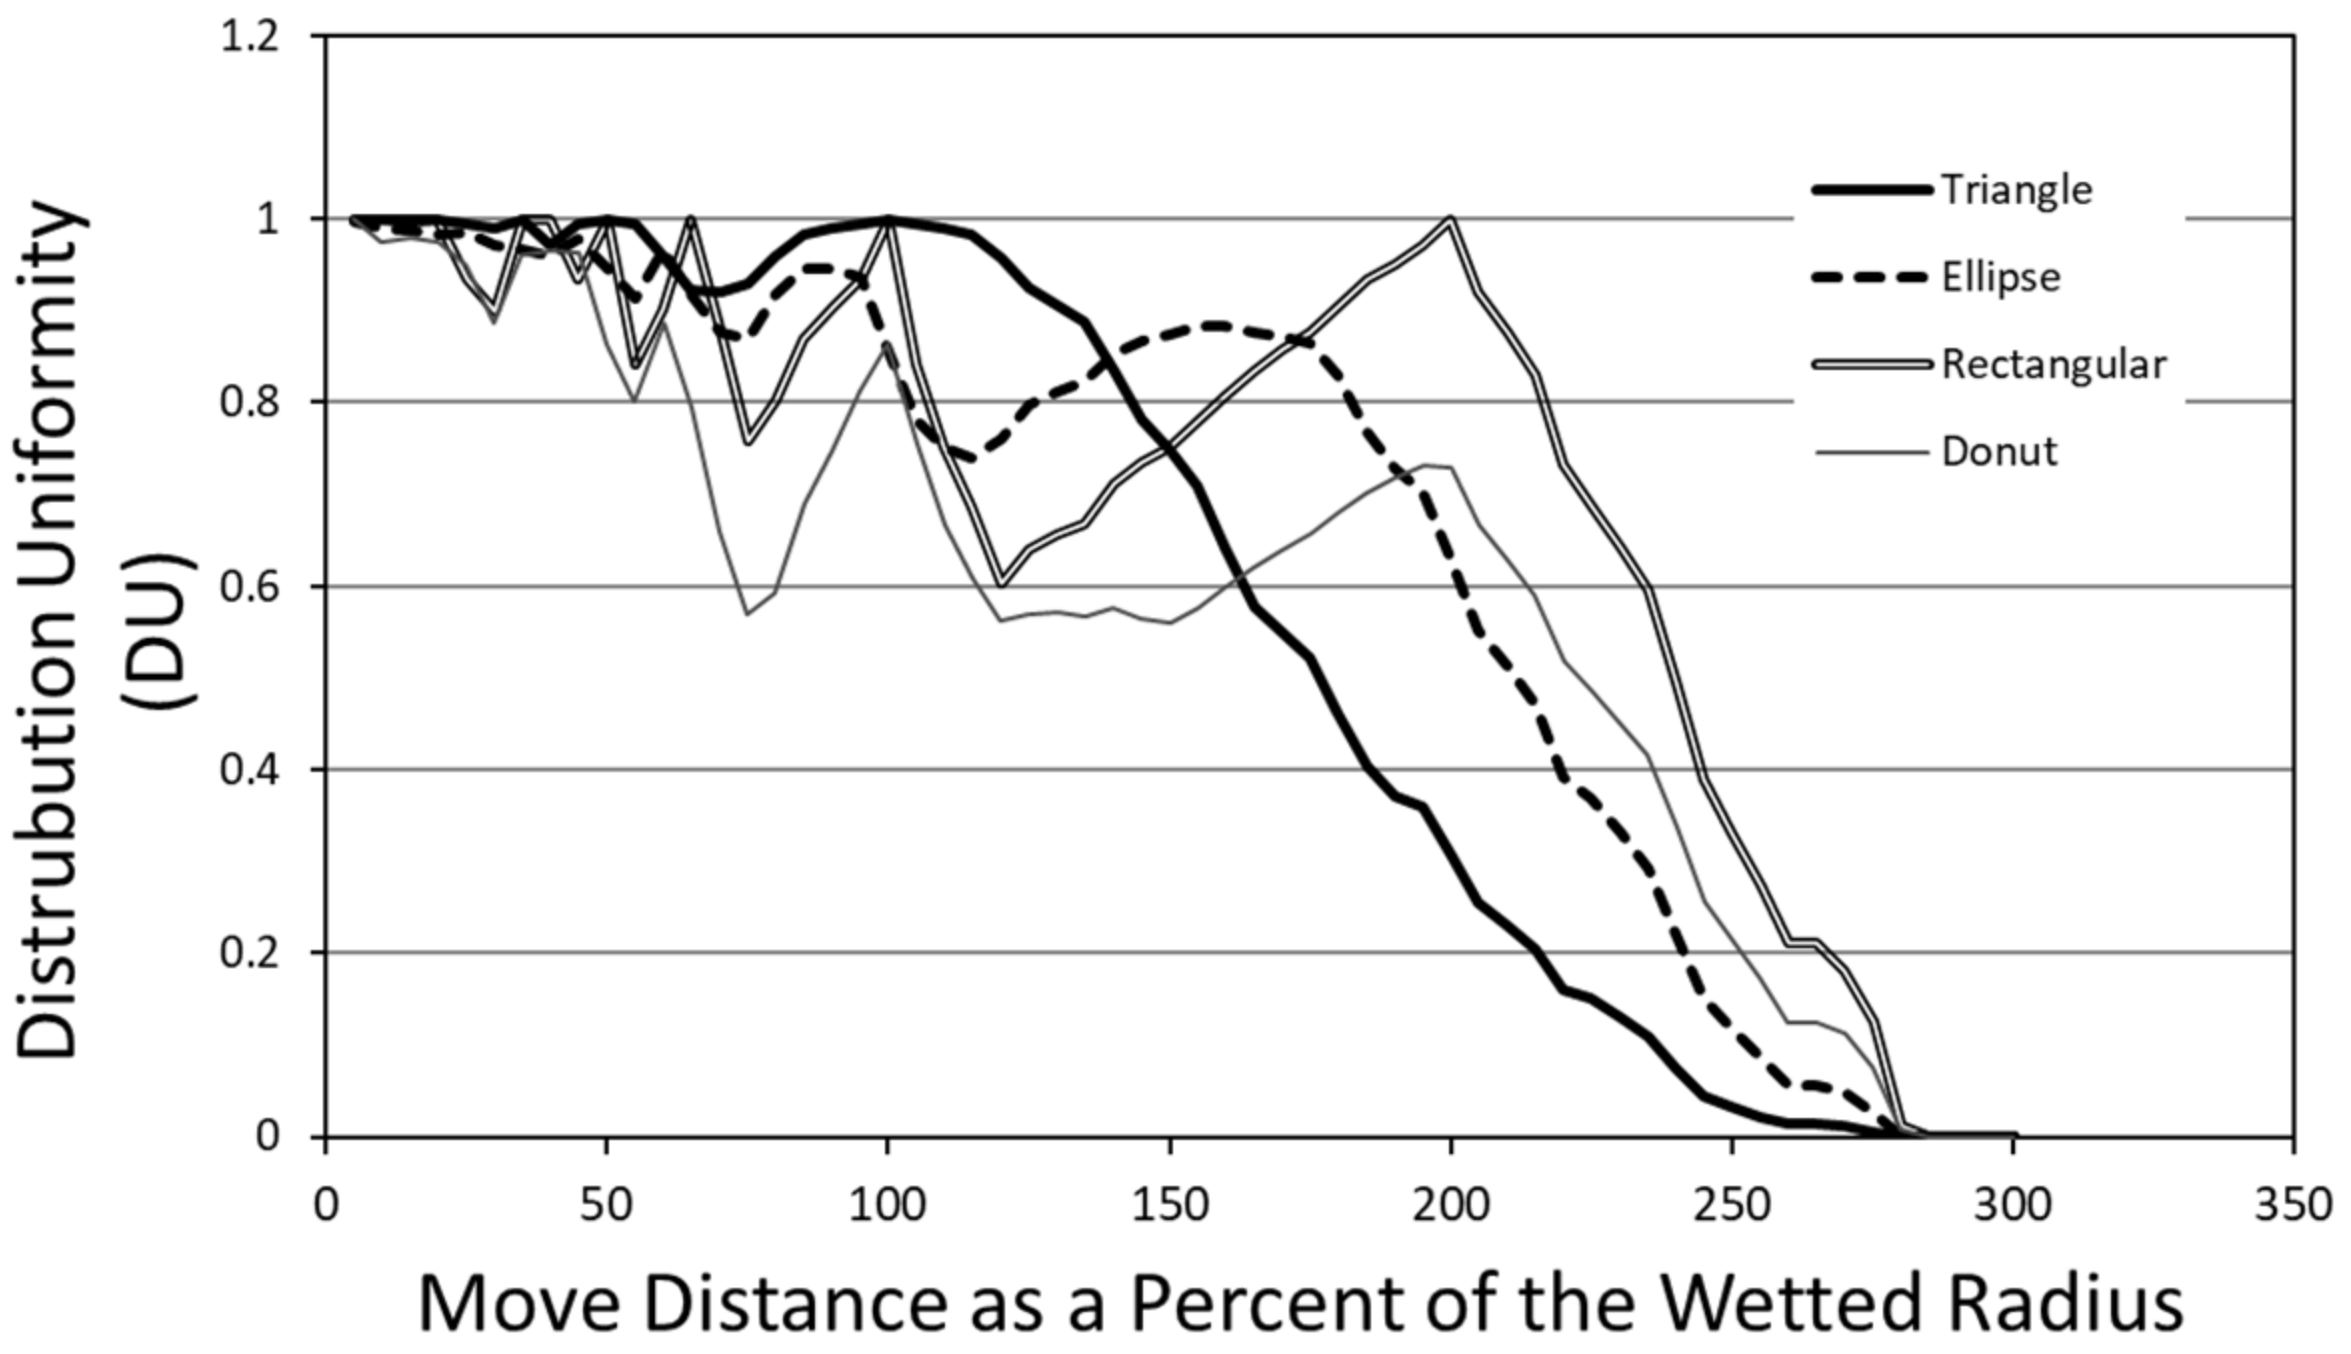
There was an obvious interaction between these parameters (wetted radius of the sprinkler, the speed, the % setting, and the cycle time) and application uniformities. This relationship can be summarized as the relationship between the pivot move distance as a percent of the sprinklers’ wetted radii (Figure 7 and Figure 8) and discussed later in Equation (11). From this, we can see that the optimal pattern depends on the particular sprinkler application pattern. We can also see that a perfectly uniform application rate (rectangular pattern) is not necessarily ideal for overlapping sprinklers or a moving irrigation system.
Irrigation uniformities were the most variable using the rectangular and donut pattern distributions (Figure 7 and Figure 8) with the donut pattern performing the worse overall. The triangular pattern performed generally better up to about 100% of the wetted radius and then dropped off quickly afterwards. After that, it is better with the rectangular pattern. The elliptical pattern was a little more stable at all of the overlapping distances and, therefore, may perform best as an all-around sprinkler.
High-efficiency sprinkler configurations, such as low-energy precision application (LEPA) and low-elevation spray application (LESA), are much more efficient [50], but they have small, wetted radii. However, these sprinklers with a smaller wetted radius have lower uniformity [51] due to the stop–go pattern. To counteract this, a shorter cycle time (Ct) should be chosen to increase the overlap between moves.
Good uniformity can be maintained for most sprinkler application patterns if the move distance is set equal to the wetted radius. The pivot speed and, therefore, the application depth of the pivot is most often set by a percent timer. This percent timer setting is used to alter the end tower runtime in Equation (10). However, the same travel speed and application depth can be set by altering the cycle time such that the end tower runs until it has moved a distance equal to the sprinkler wetted radius and then shut off for a variable amount of time based on the pivot’s percent timer setting. This could drastically reduce the stop–go cycles of the motors and gear boxes, extending their useful lives. The end tower controls the entire movement of the pivot. The inside towers move to keep the towers aligned, and this movement is somewhat unpredictable and depends on how the limit switches are set up. With fewer starts and stops of the end tower, it should similarly result in fewer starts and stops of the inside towers and that the move distance during each movement of the inside towers will be generally less than the move distance of the end tower. Additionally, sprinklers toward the distal end of the pivot use larger nozzles and will therefore likely have a slightly larger wetted radius. However, the larger move distance of the distal towers compared with the inner towers should more than compensate for this.
We suggest the following equation to calculate the appropriate cycle time to accomplish these benefits.
where Ct is the cycle time (s), Wr is the wetted radius of the sprinkler (m), Send is the travel speed of the end tower (m/s), % is the timer percent setting, and k is a coefficient to take into account that, based on our model, it was chosen when the move distance as a percent of the wetted radius gave the optimal uniformity (Figure 7 and Figure 8).
Not all sprinkler application patterns have local maximum DU and CU values at 100% of the wetted radius. In particular, for the elliptical pattern, the best uniformities were found at about 90% of the wetted radius (Figure 7 and Figure 8). Based on our modeled results, we would select values for k to be 0.9, 1.0, 1.0, and 1.0 for the ellipse, triangular, rectangular, and donut patterns, respectively.
With this method, the end tower motor runtime (s) would be set, such that the move distance was related to only the sprinkler wetted radius.
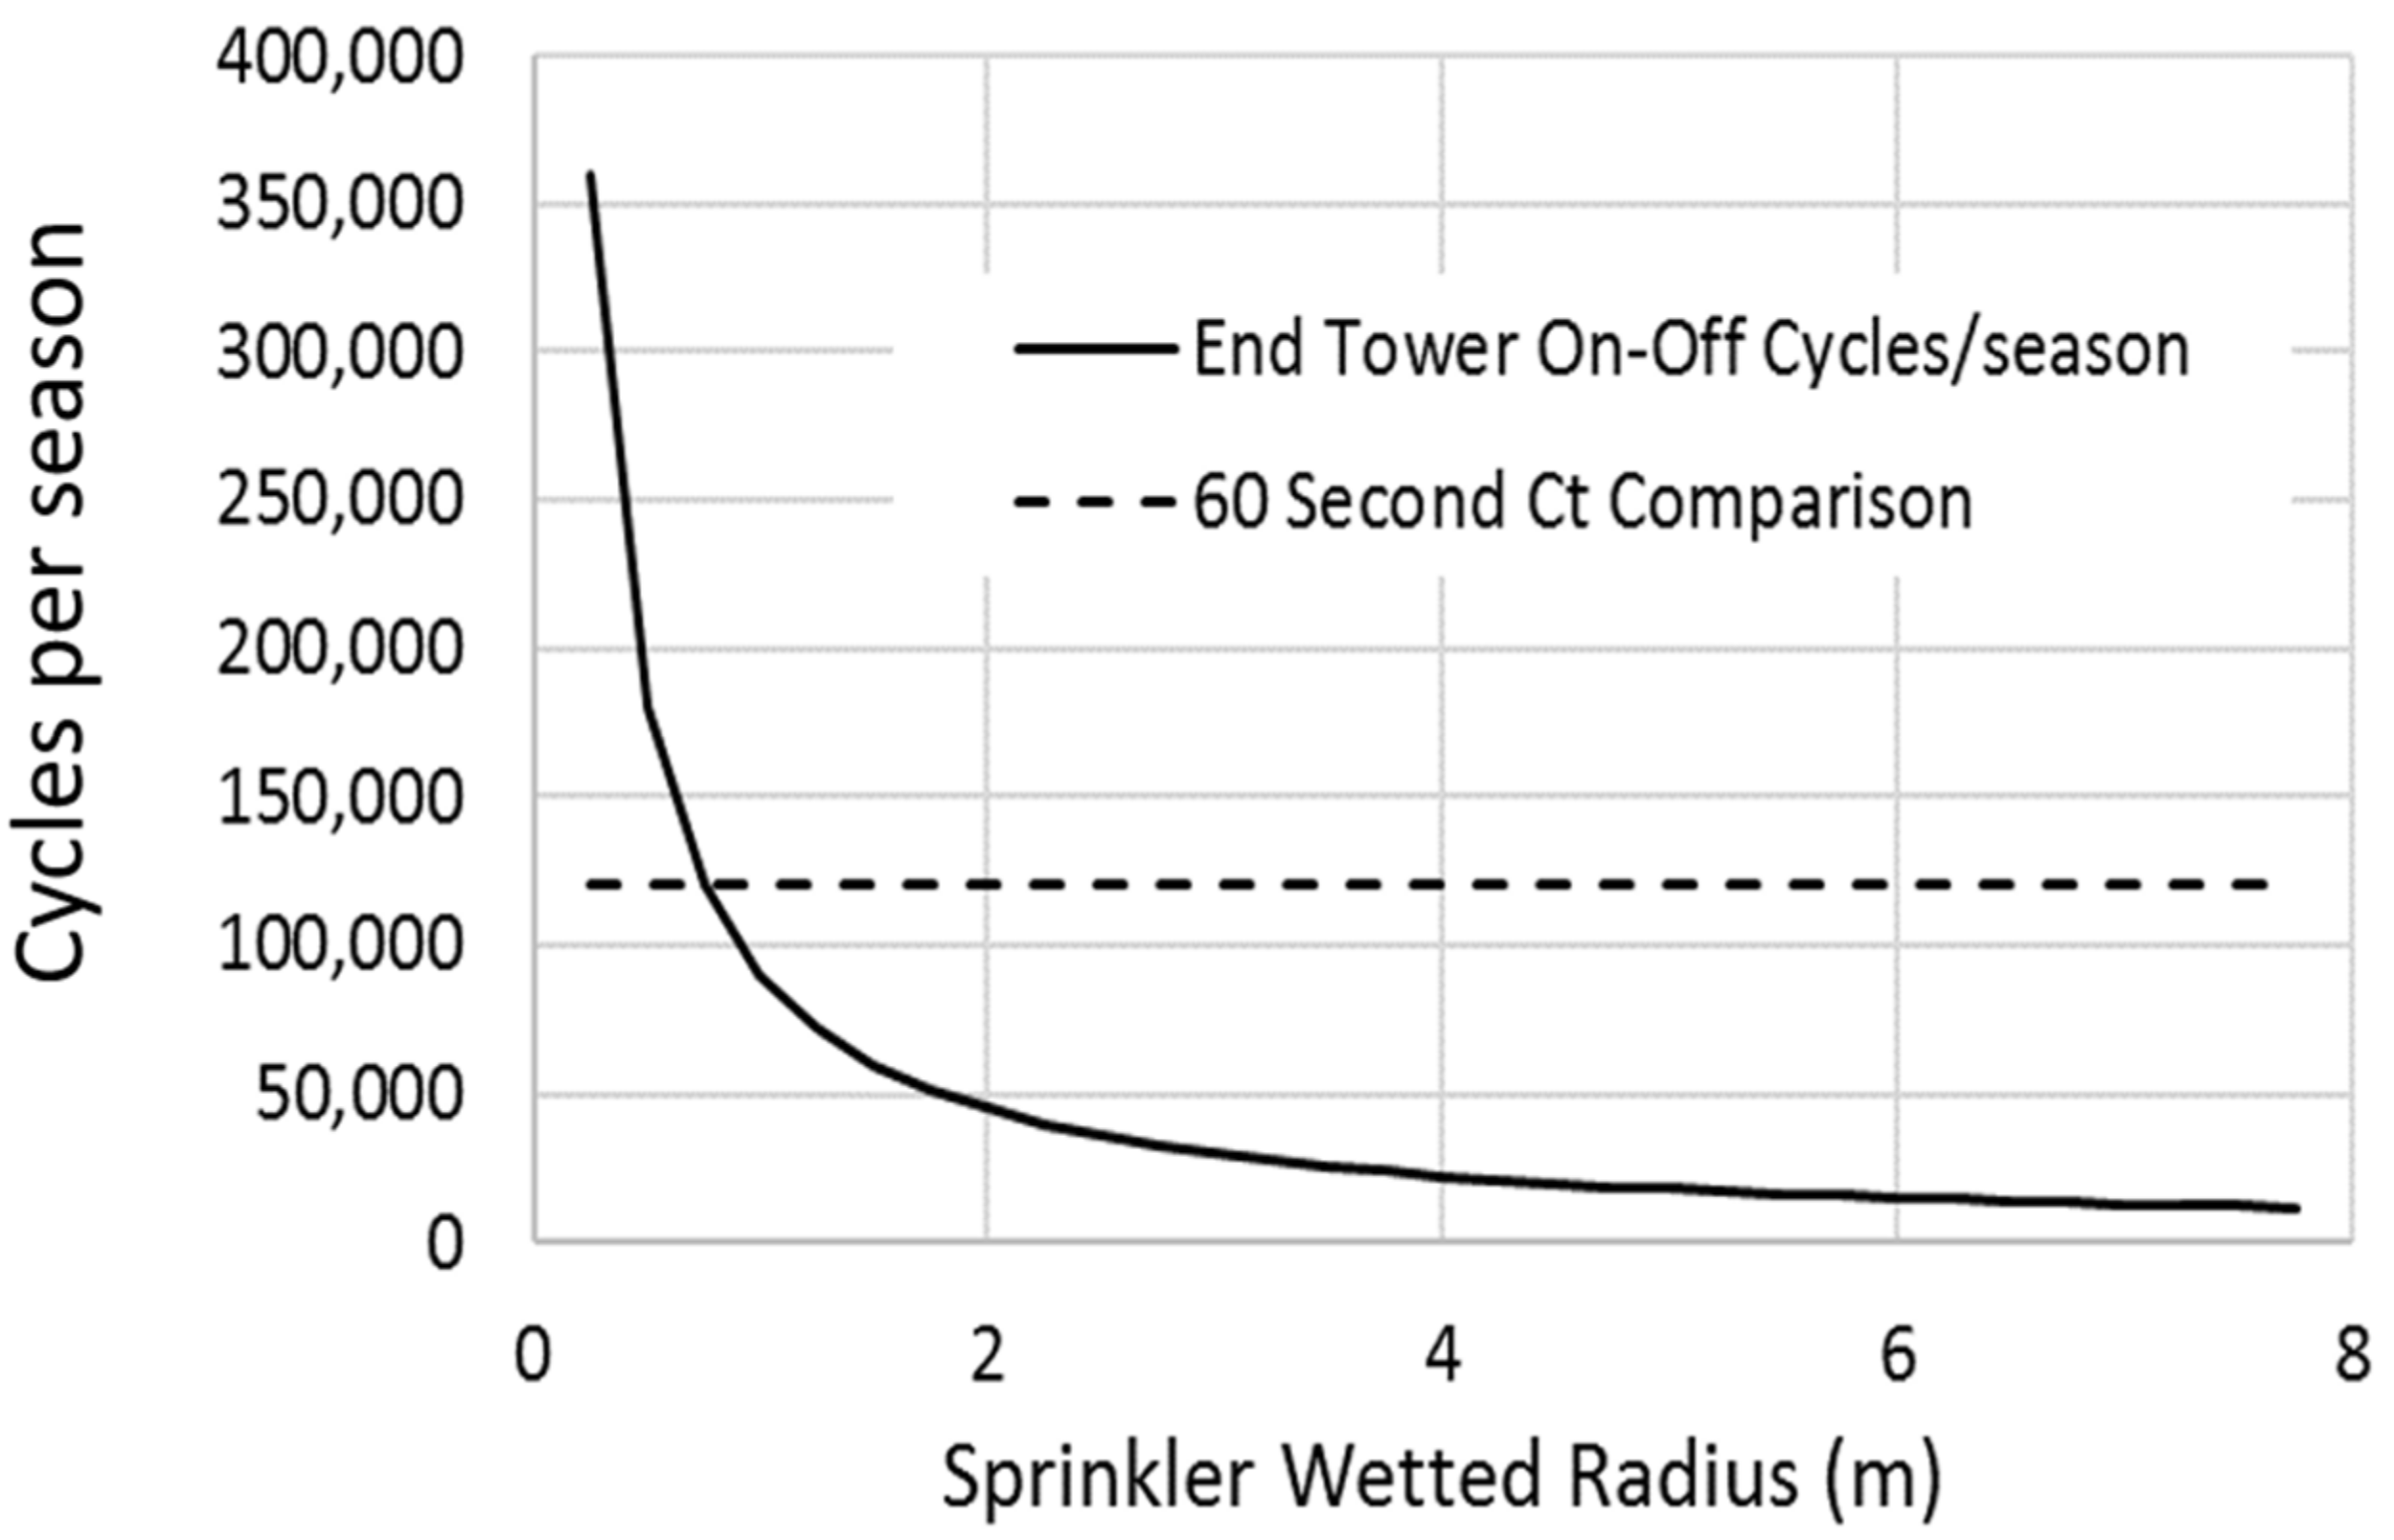
Using this new method (Equation (11)) of altering the cycle time instead of the runtime can reduce the total number of motor and gearbox on–off cycles per season for sprinklers with larger wetted radii (Figure 9). For sprinklers with small, wetted diameters, a reduced cycle time will ensure good uniformity but may increase the cycling of the motors and, thus, the wear and tear on the motors and gear boxes. Offset booms (boombacks) could help improve the uniformity in this case by effectively increasing the wetted area.
Then, the total number of cycles per season can be calculated as:
Potential Effects to Infiltration and Runoff
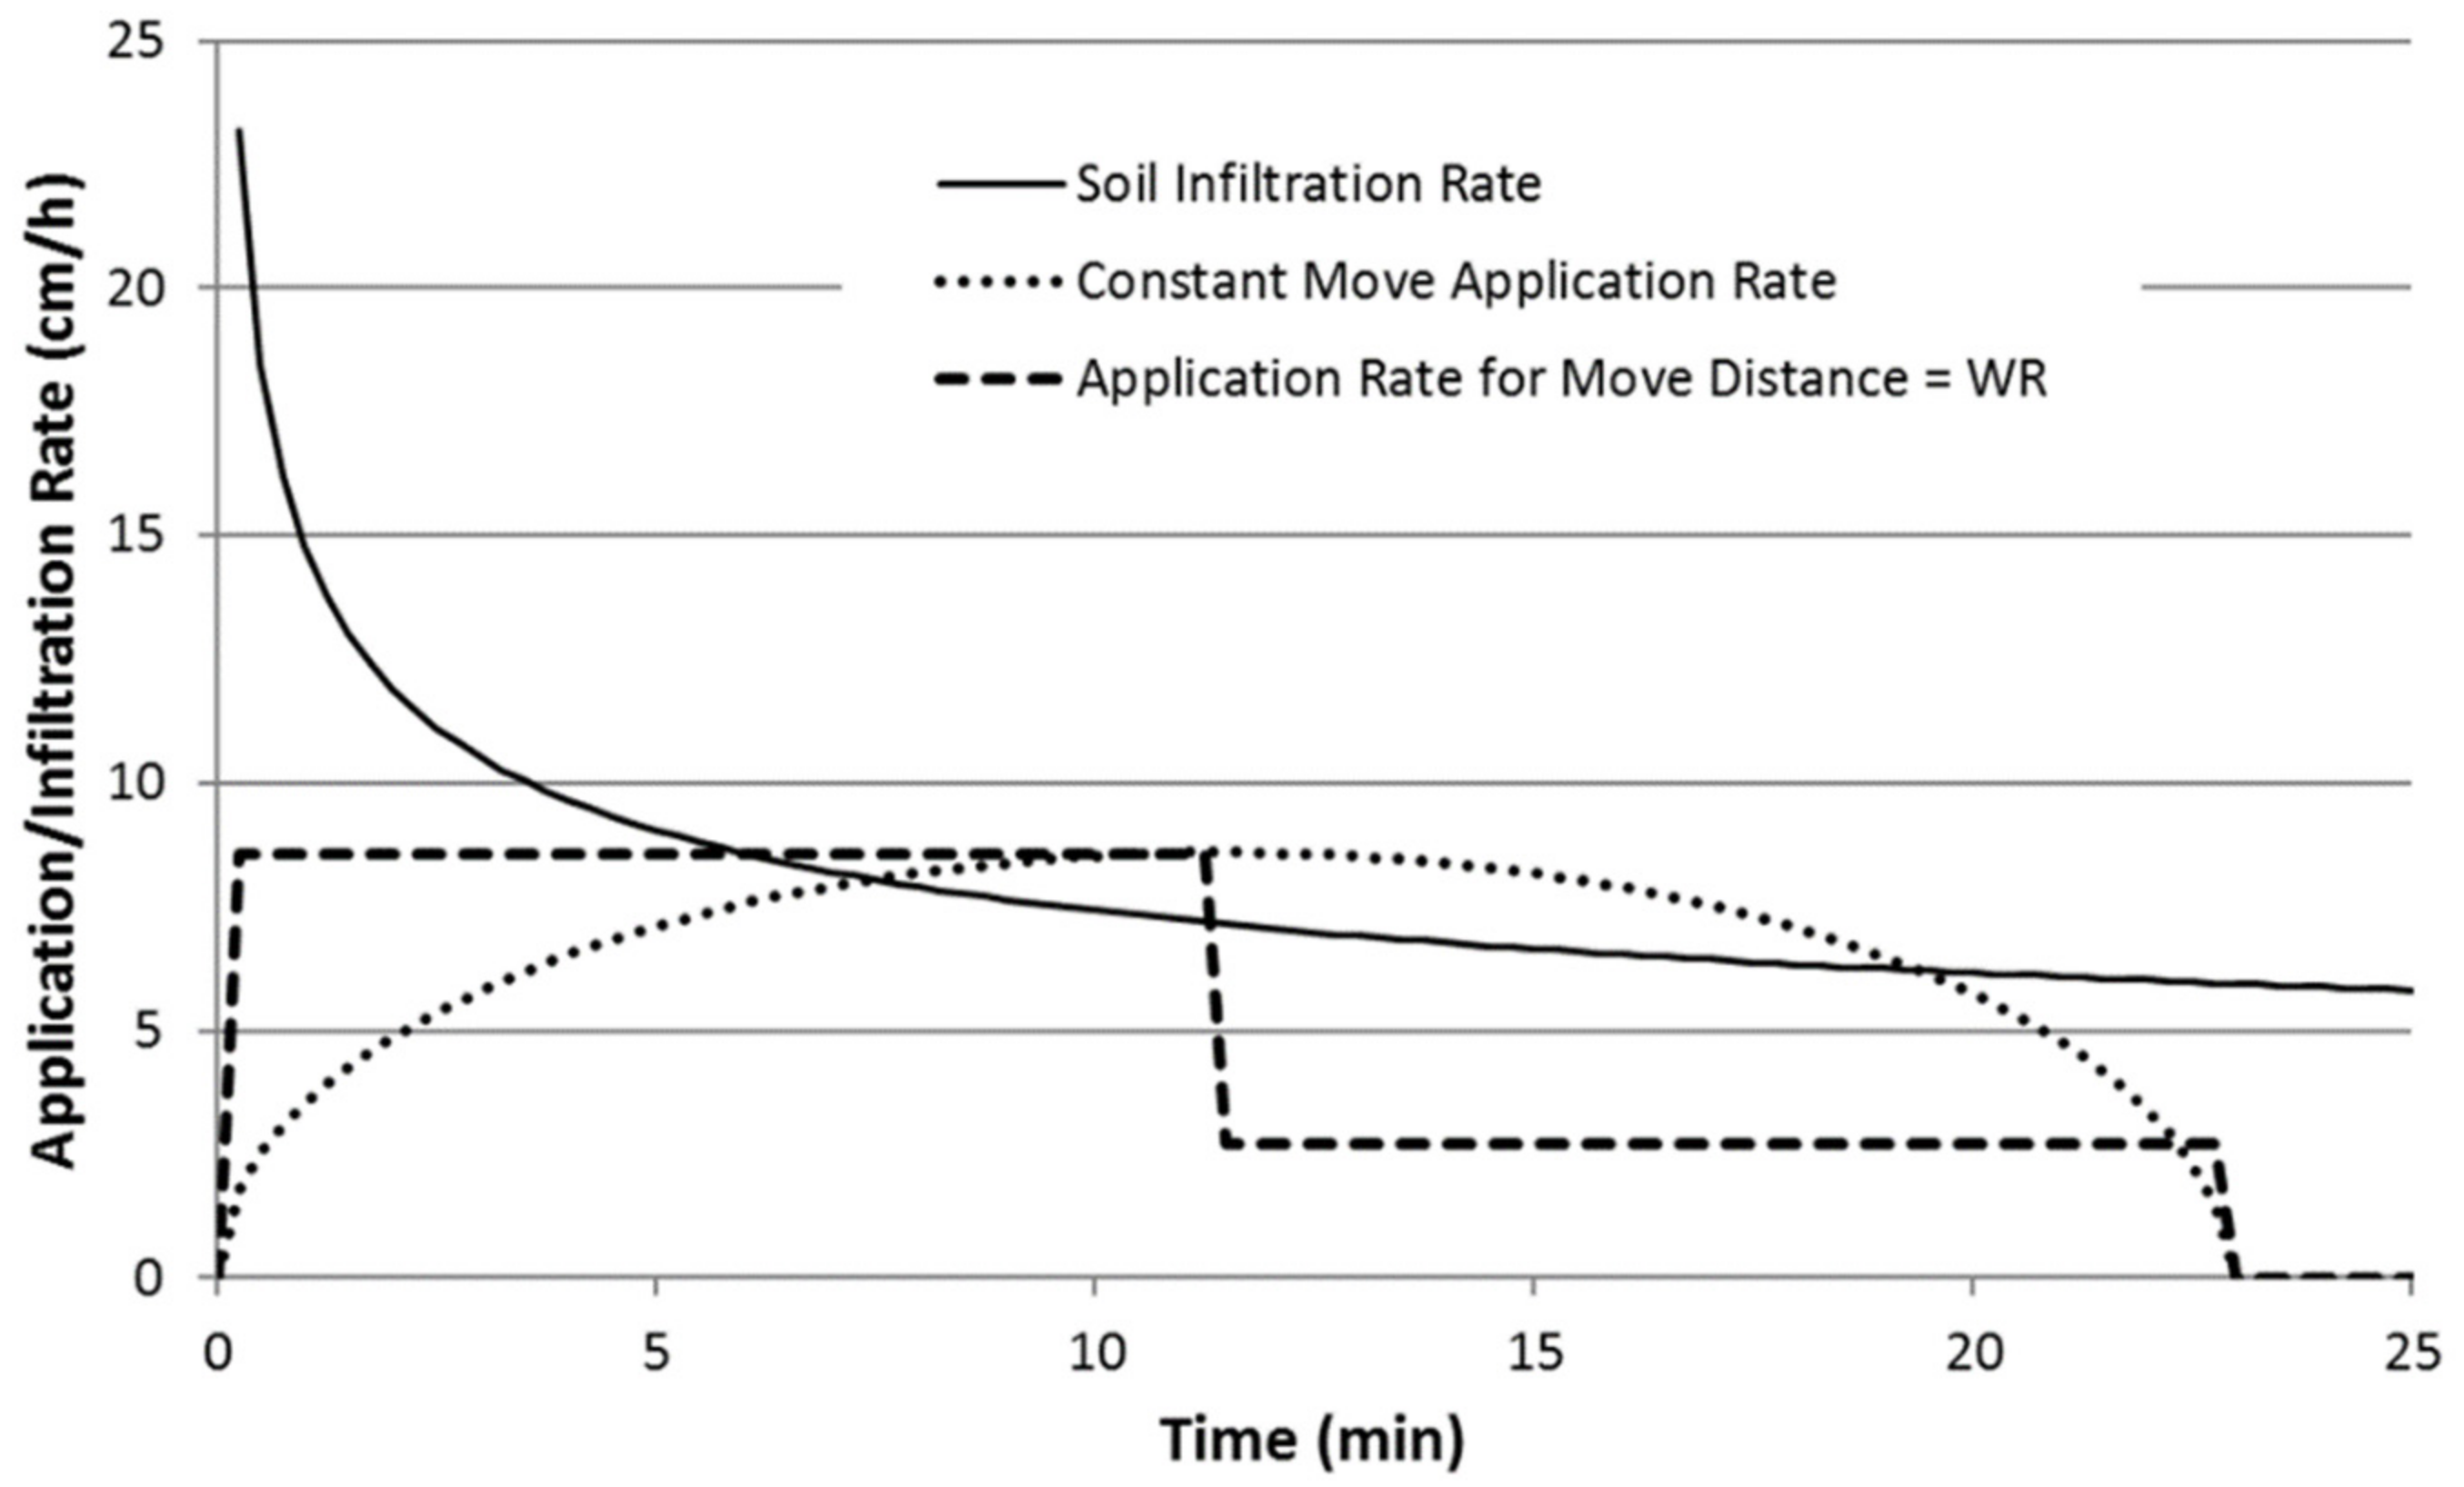
If the cycle time is adjusted to match the pivot percent setting instead of adjusting only the pivot run time, and if this cycle time is set such that the move distance is equivalent to the sprinkler wetted radius, then, for sprinklers with larger wetted radii, it will cause the pivot to irrigate motionless a much larger percent of the time and then move larger distances. We wanted to know if this will affect the ponding and runoff from the sprinklers. The total depth of water applied will still be controlled by the percent timer. However, if the move distance is set equivalent to the wetted radius (as the analysis above found to be optimal for most sprinklers), the soil will see two discrete application rates instead of a more constantly changing one. The two discrete application rates depend on the sprinkler application pattern and the distance into the move cycle the pivot moves over each portion of soil. This is illustrated in Figure 10 for the soil that happens to be located 5% into the total move distance (or sprinkler wetted radius) and in Figure 10 for soil that happens to be located 95% into the total move distance.
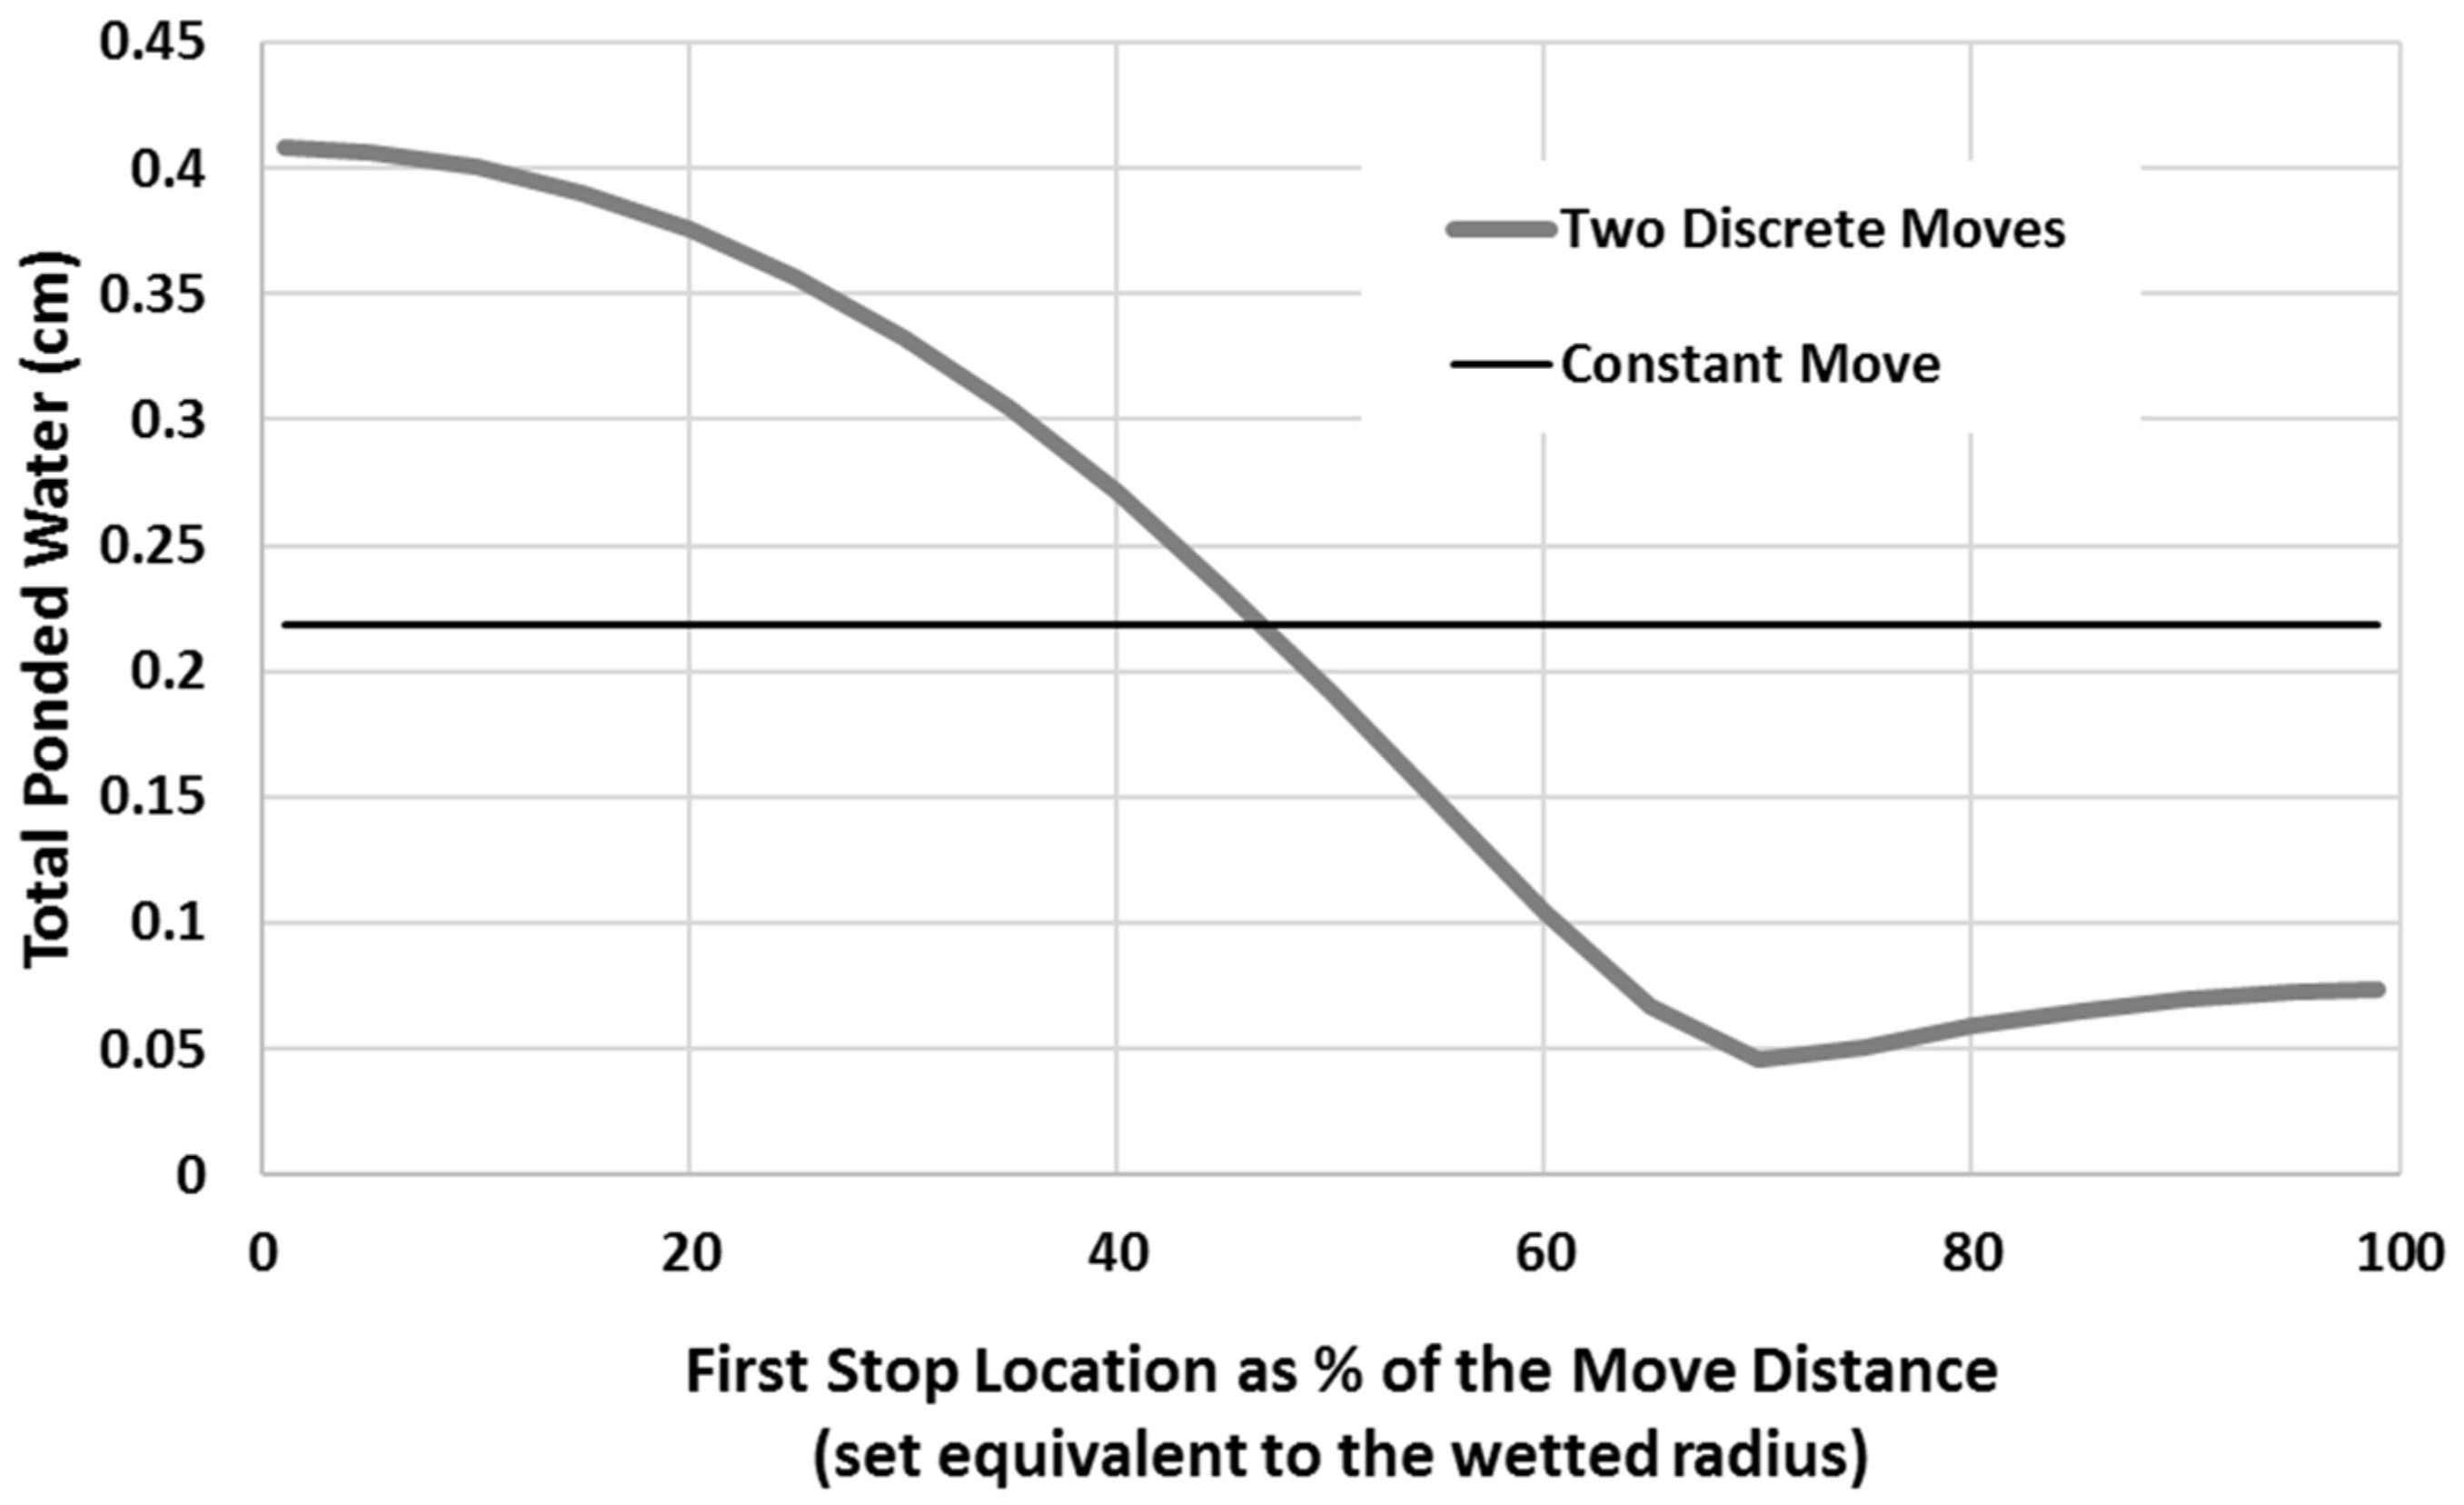
If we assume that the soil infiltration rate is reduced over time as if the soil was saturated (as in Figure 10 from 0 to 12 min), even though it may not reach saturation, then we can calculate the ponded water as the area between the sprinkler application rate and the soil infiltration rate at times where the sprinkler application rate exceeds the soil infiltration rate. This was done at different areas at move directions that lie at different percent of the move distance if the pivot moves occur in two discrete application rates compared to a constant move application rate for an elliptical sprinkler pattern (Figure 11). These greater move distances and set times for sprinklers with larger wetted radii may result in additional runoff in some areas of the soil and less runoff in others. These might occur in strips, with a width of about one-half of the wetted radius at the last tower, that are parallel to the pivot lateral. This assumes that the soil takes water in as if it were saturated (even though it will not be) in the first half of the pattern. Whether this really affects the overall runoff from the pivot should be further experimented on. These patterns would be different at locations closer to the pivot center point. This explained that the water application uniformity on a small scale of the field is not that important, since water can be redistributed by the soil, and plants can get the water from nearby wetted regions [1]. Thus, we set the runtime as a percent move distance, which is set equivalent to the wetted radius and may reduce the ponding and runoff, as shown in Figure 12.
4. Conclusions
A model was developed to calculate irrigation uniformities for a center pivot in the direction of movement by simulating different sprinkler application patterns as a function of stop–go movement of a center pivot for a given set of parameters. Based on the results of this study, there appears to be an interaction between the sprinkler application depth pattern, that pattern’s wetted radius, the center pivot’s % setting, and the move cycle time (time between end tower starts). Irrigation uniformities in the direction of movement are a function of wetted radius, cycle time, and end tower maximum travel speed. This application uniformity is ultimately mostly a function of the move distance as a percent of the sprinklers’ wetted radius. The simulations showed that the DU and CU values were not as high for smaller wetted radii and that fast pivots that makes for problems. The DU and CU were significantly higher when using a 30-s cycle time and lowest for a 120-s cycle time. Regardless of the sprinkler pattern, wetted radius, or travel speed, it was found that there is a typically 100% uniformity in the lateral direction of movement when there is constant movement of the pivot. The effects on uniformity can be reduced to essentially the move distance as a % of the wetted radius, which can be used to control the quality of center pivots’ irrigation systems. New methods to calculate the cycle time, run time, and total cycles per season were suggested based on the results of this research. We concluded that the intermittent movement of the center pivot affects the ponding and runoff as a percent of the move distance that is set equivalent to the wetted radius. Further the research should be examined if the overall runoff in such a method was used and which sprinkler pattern has the most potential runoff that is connected to the intermittency movement of the center pivot.
Author Contributions
Conceptualization, A.Z.M. and R.T.P.; data curation, A.Z.M. and R.T.P.; funding acquisition, D.M. and R.T.P.; investigation, A.Z.M., A.S., and B.M.; methodology, A.Z.M. and R.T.P.; project administration, R.T.P. and D.M.; resources, R.T.P. and D.M.; software, A.Z.M. and R.T.P.; supervision, R.T.P. and D.M.; writing—original draft, A.Z.M.; and writing—review and editing, A.Z.M., R.T.P., A.S., B.M., and D.M. All authors have read and agreed to the published version of the manuscript.
Funding
This research was funded by the USDA-CIG program.
Institutional Review Board Statement
Not applicable.
Informed Consent Statement
Not applicable.
Data Availability Statement
Not applicable.
Acknowledgments
The authors acknowledge Kate Seymour, the Bonneville Power Administration, and the Washington State University Center for Precision and Automated Agricultural Systems (CPAAS) for their support.
Conflicts of Interest
The authors declare no conflict of interest.
References
- Mohamed, A.Z.; Peters, R.T.; Zhu, X.; Sarwar, A. Adjusting Irrigation Uniformity Coefficients for Unimportant Variability on a Small Scale. Agric. Water Manag. 2019, 213, 1078–1083. [Google Scholar] [CrossRef]
- Heermann, D.F. Center Pivot Design and Evaluation. In Proceedings of the 15th Annual Central Plains Irrigation Conference and Exposition Proceedings, Colby, KS, USA, 4–5 February 2003. [Google Scholar]
- Heermann, D.F.; Hein, P.R. Performance Characteristics of Self-Propelled Center-Pivot Sprinkler Irrigation System. Trans. ASAE 1968, 11, 11–15. [Google Scholar]
- Valín, M.I.; Cameira, M.R.; Teodoro, P.R.; Pereira, L.S. DEPIVOT: A Model for Center-Pivot Design and Evaluation. Comput. Electron. Agric. 2012, 87, 159–170. [Google Scholar] [CrossRef]
- Clark, G.A.; Srinivas, K.; Rogers, D.H.; Stratton, R.; Martin, V.L. Measured and Simulated Uniformity of Low Drift Nozzle Sprinklers. Trans. ASAE 2003, 46, 321. [Google Scholar] [CrossRef]
- Amir, I.; Alchanatis, V. Procedure for Predicting and Designing Moving Sprinkler Application Patterns. Irrig. Sci. 1992, 13, 93–98. [Google Scholar] [CrossRef]
- Bittinger, M.W.; Longenbaugh, R.A. Theoretical Distribution of Water from a Moving Irrigation Sprinkler. Am. Soc. Agric. Biol. Eng. 1962, 5, 26–30. [Google Scholar]
- Alchanatis, V.; Amir, I. A Pattern Fit Coefficient for Water Application. Irrig. Drain. Syst. 1990, 4, 29–36. [Google Scholar] [CrossRef]
- Bremond, B.; Molle, B. Characterization of Rainfall under Center Pivot: Influence of Measuring Procedure. J. Irrig. Drain. Eng. 1995, 121, 347–353. [Google Scholar] [CrossRef]
- Elliott, R.L.; Nelson, J.D.; Loftis, J.C.; Hart, W.E. Comparison of Sprinkler Uniformity Models. J. Irrig. Drain. Div. 1980, 106, 321–330. [Google Scholar] [CrossRef]
- Gat, Y.L.; Molle, B. Model of Water Application under Pivot Sprinkler. I: Theoretical Grounds. J. Irrig. Drain. Eng. 2000, 126, 343–347. [Google Scholar] [CrossRef]
- Warrick, A.W. Interrelationships of Irrigation Uniformity Terms. J. Irrig. Drain. Eng. 1983, 109, 317–332. [Google Scholar] [CrossRef]
- Carrión, P.; Tarjuelo, J.; Montero, J. SIRIAS: A Simulation Model for Sprinkler Irrigation. Irrig. Sci. 2001, 20, 73–84. [Google Scholar] [CrossRef]
- Dechmi, F.; Playán, E.; Cavero, J.; Martínez-Cob, A.; Faci, J.M. Coupled Crop and Solid Set Sprinkler Simulation Model. I: Model Development. J. Irrig. Drain. Eng. 2004, 130, 499–510. [Google Scholar] [CrossRef] [Green Version]
- Ouazaa, S.; Latorre, B.; Burguete, J.; Serreta, A.; Playán, E.; Salvador, R.; Paniagua, P.; Zapata, N. Effect of the Start–Stop Cycle of Center-Pivot Towers on Irrigation Performance: Experiments and Simulations. Agric. Water Manag. 2015, 147, 163–174. [Google Scholar] [CrossRef] [Green Version]
- Playán, E.; Zapata, N.; Faci, J.M.; Tolosa, D.; Lacueva, J.L.; Pelegrín, J.; Salvador, R.; Sánchez, I.; Lafita, A. Assessing Sprinkler Irrigation Uniformity Using a Ballistic Simulation Model. Agric. Water Manag. 2006, 84, 89–100. [Google Scholar] [CrossRef] [Green Version]
- Han, S.; Evans, R.G.; Kroeger, M.W. Sprinkler Distribution Patterns in Windy Conditions. Trans. ASAE 1994, 37, 1481–1489. [Google Scholar] [CrossRef]
- Seginer, I.; Kantz, D.; Nir, D. The Distortion by Wind of the Distribution Patterns. J. Irrig. Drain. Eng. 1991, 117, 285–305. [Google Scholar] [CrossRef]
- Heermann, D.F.; Stahl, K.M. Center Pivot Uniformity for Chemigation. Am. Soc. Agric. Eng. Microfiche Collect. (USA) 1986, in press. [Google Scholar]
- Kincaid, D.C. Sprinkler Pattern Analysis for Center Pivot Irrigation. Irrig. Bus. Technol. 1996, 414–415. [Google Scholar]
- Hanson, B.R.; Wallender, W.W. Bidirectional Uniformity of Water Applied by Continuous-Move Sprinkler Machines. Trans. ASAE 1986, 29, 1047–1053. [Google Scholar] [CrossRef]
- Gilley, J.R. Suitability of Reduced Pressure Center-Pivots. J. Irrig. Drain. Eng. 1984, 110, 22–34. [Google Scholar] [CrossRef] [Green Version]
- DeBoer, D.W. Technical Notes: Sprinkler Application Pattern Shape and Surface Runoff. Trans. ASAE 2001, 44, 1217. [Google Scholar] [CrossRef]
- Heermann, D. Center Pivot Evaluation and Design (CPED); USDA ARS: Fort Collins, CO, USA, 2004. [Google Scholar]
- Heermann, D.F. Center Pivot Evaluation and Design. In Proceedings of the Proceedings for 2005 Central Plains Irrigation Conference, Sterling, CO, USA, 16–17 February 2005; p. 137. [Google Scholar]
- Kohl, R.A.; DeBoer, D.W. Drop Size Distributions for a Low Pressure Spray Type Agricultural Sprinkler. Trans. ASAE 1984, 27, 1836–1840. [Google Scholar] [CrossRef]
- Kincaid, D.C. Sprinkler Pattern Radius. Trans. ASAE 1982, 25, 1668–1672. [Google Scholar] [CrossRef]
- Omary, M.; Sumner, H. Modeling Water Distribution for Irrigation Machine with Small Spray Nozzles. J. Irrig. Drain. Eng. 2001, 127, 156–160. [Google Scholar] [CrossRef]
- Delirhasannia, R.; Sadraddini, A.A.; Nazemi, A.H.; Farsadizadeh, D.; Playán, E. Dynamic Model for Water Application Using Centre Pivot Irrigation. Biosyst. Eng. 2010, 105, 476–485. [Google Scholar] [CrossRef] [Green Version]
- Yan, H.; Jin, H.; Qian, Y. Characterizing Center Pivot Irrigation with Fixed Spray Plate Sprinklers. Sci. China Technol. Sci. 2010, 53, 1398–1405. [Google Scholar] [CrossRef]
- Thooyamani, K.P.; Norum, D.I.; Dubetz, S. Application Rates and Uniformity under Center-Pivot Sprinkler Irrigation Systems Using Spray Nozzles. Can. Agric. Eng. 1987, 29, 149–154. [Google Scholar]
- Ben-Hur, M.; Plaut, Z.; Levy, G.J.; Agassi, M.; Shaiberg, I. Surface Runoff, Uniformity of Water Distribution, and Yield of Peanut Irrigated with a Moving Sprinkler System. Agron. J. 1995, 87, 609–613. [Google Scholar] [CrossRef]
- Kincaid, D.C. The WEPP Model for Runoff and Erosion Prediction under Sprinkler Irrigation. Trans. ASAE 2002, 45, 67. [Google Scholar] [CrossRef] [Green Version]
- King, B.A.; Bjorneberg, D.L. Evaluation of Potential Runoff and Erosion of Four Center Pivot Irrigation Sprinklers. Appl. Eng. Agric. 2011, 27, 75–85. [Google Scholar] [CrossRef]
- Silva, L.L. The Effect of Spray Head Sprinklers with Different Deflector Plates on Irrigation Uniformity, Runoff and Sediment Yield in a Mediterranean Soil. Agric. Water Manag. 2006, 85, 243–252. [Google Scholar] [CrossRef]
- Al-Baaj, A.A.A.; Lewis, A. Variable Pulsed Irrigation Algorithm (VPIA) to Reduce Runoff Losses Under a Low-Pressure Lateral Move Irrigation Machine. Horticulturae 2019, 5, 10. [Google Scholar] [CrossRef] [Green Version]
- Amini, M.Z.; Peters, R.T. Reduced Runoff from Center Pivot and Linear Move Irrigation Systems with Off-Set Booms (Boombacks). In Proceedings of the 2015 ASABE Annual International Meeting, New Orleans, LA, USA, 26–29 July 2015; p. 1. [Google Scholar]
- Hasheminia, S.M. Controlling Runoff under Low Pressure Center Pivot Irrigation Systems. Irrig. Drain. Syst. 1994, 8, 25–34. [Google Scholar] [CrossRef]
- Luz, P.B. A Graphical Solution to Estimate Potential Runoff in Center-Pivot Irrigation. Trans. ASABE 2011, 54, 81–92. [Google Scholar] [CrossRef]
- Luz, P.B.; Heermann, D. A Statistical Approach to Estimating Runoff in Center Pivot Irrigation with Crust Conditions. Agric. Water Manag. 2005, 72, 33–46. [Google Scholar] [CrossRef]
- Nakawuka, P.; Okwany, R.O.; Peters, T.R.; Desta, K.; Sadeghi, S.H. Efficacy of Boom Systems in Controlling Runoff under Center Pivots and LinearMove Irrigation Systems. Appl. Eng. Agric. 2014, 30, 797–801. [Google Scholar]
- Rossi, M.J.; Ares, J.O. Efficiency Improvement in Linear-Move Sprinkler Systems through Moderate Runoff–Runon Control. Irrig. Sci. 2015, 33, 205–219. [Google Scholar] [CrossRef]
- Silva, L.L. Are Basin and Reservoir Tillage Effective Techniques to Reduce Runoff under Sprinkler Irrigation in Mediterranean Conditions? Agric. Water Manag. 2017, 191, 50–56. [Google Scholar] [CrossRef]
- Silva, L.L.; Marques da Silva, J.R.; Pisco, A.; Torres, C.J. No-till and Basin Tillage for Reducing Runoff and Sediment Yield on Centre-Pivot Irrigated Maize in a Mediterranean Soil. In Proceedings of the International Conference on Agricultural Engineering-AgEng, Ferrand, France, 6–8 September 2010. [Google Scholar]
- Heermann, D.F.; Kohl, R.A. Fluid Dynamics of Sprinkler Systems. Fluid Dyn. Sprink. Syst. 1980, 583–618. [Google Scholar]
- Burt, C.M.; Clemmens, A.J.; Strelkoff, T.S.; Solomon, K.H.; Bliesner, R.D.; Hardy, L.A.; Howell, T.A.; Eisenhauer, D.E. Irrigation Performance Measures: Efficiency and Uniformity. J. Irrig. Drain. Eng. 1997, 123, 423–442. [Google Scholar] [CrossRef] [Green Version]
- Christiansen, J.E. The Uniformity of Application of Water by Sprinkler Systems. Agric. Eng. 1941, 22, 89–92. [Google Scholar]
- ASABE. Test Procedure for Determining the Uniformity of Water Distribution of Center Pivot and Lateral Move Irrigation Machines Equipped with Spray of Sprinkler Nozzles. ANSI/ASABE Standard S436.1; American Society of Agricultural Engineers Standards: St. Joseph, MI, USA, 2001. [Google Scholar]
- Harting, G.B. As the Pivot Turns. Resource 1999, 6, 13–14. [Google Scholar]
- Sarwar, A.; Peters, R.T.; Mehanna, H.; Amini, M.Z.; Mohamed, A.Z. Evaluating Water Application Efficiency of Low and Mid Elevation Spray Application under Changing Weather Conditions. Agric. Water Manag. 2019, 221, 84–91. [Google Scholar] [CrossRef]
- Mohamed, A.Z.; Peters, T.R.; Sarwar, A.; McMoran, D. The Accuracy of Distribution Uniformity Test under Different Moving Irrigation Systems. In Proceedings of the 2018 ASABE Annual International Meeting, Detroit, MI, USA, 29 July–1 August 2018; p. 1. [Google Scholar]
Figure 1.
Stop–move model flowchart.

Figure 2.
Different sprinkler water application patterns: elliptical (a), triangular (b), rectangular (c), and donut (d).
Figure 2.
Different sprinkler water application patterns: elliptical (a), triangular (b), rectangular (c), and donut (d).

Figure 3.
Different application patterns of sprinklers along the pivot lateral for an elliptical (a), triangular (b), rectangular (c), and donut (d).
Figure 3.
Different application patterns of sprinklers along the pivot lateral for an elliptical (a), triangular (b), rectangular (c), and donut (d).

Figure 4.
An example for the effect of different % settings on the elliptical application pattern uniformity of the center pivot.
Figure 4.
An example for the effect of different % settings on the elliptical application pattern uniformity of the center pivot.

Figure 5.
DU (a) and CU (b) for different cycle times (s) and application patterns.

Figure 6.
Distribution uniformity and coefficient of uniformity for the ellipse sprinkler pattern using different travel speed (a), percent timer setting (b), and wetted radius (c).
Figure 6.
Distribution uniformity and coefficient of uniformity for the ellipse sprinkler pattern using different travel speed (a), percent timer setting (b), and wetted radius (c).

Figure 7.
Distribution uniformity (DU) for triangular, ellipse, rectangular, and donut application patterns as a move distance as a percent of the wetted radius.
Figure 7.
Distribution uniformity (DU) for triangular, ellipse, rectangular, and donut application patterns as a move distance as a percent of the wetted radius.

Figure 8.
Coefficient of uniformity (CU) for triangular, ellipse, rectangular, and donut application patterns as a move distance as a percent of the wetted radius.
Figure 8.
Coefficient of uniformity (CU) for triangular, ellipse, rectangular, and donut application patterns as a move distance as a percent of the wetted radius.

Figure 9.
A comparison of the number of pivot tower motor on–off cycles per season when varying the cycle time to move the end tower of the sprinkler’s wetted radius, compared to simply using a 60-s cycle time, assumes 2000 h run time per season and a 2.5 m/min maximum end tower travel speed.
Figure 9.
A comparison of the number of pivot tower motor on–off cycles per season when varying the cycle time to move the end tower of the sprinkler’s wetted radius, compared to simply using a 60-s cycle time, assumes 2000 h run time per season and a 2.5 m/min maximum end tower travel speed.

Figure 10.
The application rate to a portion of soil 5% into the move distance (set to be equivalent to the wetted radius) compared to a constant move application rate for an elliptical sprinkler pattern. This can result in more runoff in this portion of soil if the soil takes water in as if it were saturated in the first half of the application time.

Figure 11.
The application rate to the soil 95% into the move distance (set to be equivalent to the wetted radius) occurs in two discrete application rates compared to a constant move application rate for an elliptical sprinkler pattern. This results in less total runoff in this portion of the soil.

Figure 12.
Calculated ponding depths at different percent of the move distance if the pivot moves occur in two discrete application rates compared to a constant move application rate for an elliptical sprinkler pattern. The move distance was set equivalent to the wetted radius.
Figure 12.
Calculated ponding depths at different percent of the move distance if the pivot moves occur in two discrete application rates compared to a constant move application rate for an elliptical sprinkler pattern. The move distance was set equivalent to the wetted radius.

Publisher’s Note: MDPI stays neutral with regard to jurisdictional claims in published maps and institutional affiliations. |
© 2021 by the authors. Licensee MDPI, Basel, Switzerland. This article is an open access article distributed under the terms and conditions of the Creative Commons Attribution (CC BY) license (https://creativecommons.org/licenses/by/4.0/).
Share and Cite
MDPI and ACS Style
Mohamed, A.Z.; Peters, R.T.; Sarwar, A.; Molaei, B.; McMoran, D. Impact of the Intermittency Movement of Center Pivots on Irrigation Uniformity. Water 2021, 13, 1167. https://doi.org/10.3390/w13091167
AMA Style
Mohamed AZ, Peters RT, Sarwar A, Molaei B, McMoran D. Impact of the Intermittency Movement of Center Pivots on Irrigation Uniformity. Water. 2021; 13(9):1167. https://doi.org/10.3390/w13091167
Chicago/Turabian StyleMohamed, Abdelmoneim Z., R. Troy Peters, Abid Sarwar, Behnaz Molaei, and Don McMoran. 2021. "Impact of the Intermittency Movement of Center Pivots on Irrigation Uniformity" Water 13, no. 9: 1167. https://doi.org/10.3390/w13091167
Note that from the first issue of 2016, this journal uses article numbers instead of page numbers. See further details here.