
Spatiotemporal Evolution of Lakes under Rapid Urbanization: A Case Study in Wuhan, China


1
School of Urban Design, Wuhan University, Wuhan 430072, China
2
China Construction Third Bureau Green Industry Investment Co., Ltd., Wuhan 430072, China
3
College of Urban and Environmental Sciences, Peking University, Beijing 100871, China
*
Author to whom correspondence should be addressed.
Water 2021, 13(9), 1171; https://doi.org/10.3390/w13091171
Submission received: 27 February 2021
/
Revised: 13 April 2021
/
Accepted: 17 April 2021
/
Published: 23 April 2021
(This article belongs to the Section Urban Water Management)
Abstract
:The impact of urbanization on lakes in the urban context has aroused continuous attention from the public. However, the long-term evolution of lakes in a certain megacity and the heterogeneity of the spatial relationship between related influencing factors and lake changes are rarely discussed. The evolution of 58 lakes in Wuhan, China from 1990 to 2019 was analyzed from three aspects of lake area, lake landscape, and lakefront ecology, respectively. The Multi-Scale Geographic Weighted Regression model (MGWR) was then used to analyze the impact of related influencing factors on lake area change. The investigation found that the total area of 58 lakes decreased by 15.3%. A worsening trend was found regarding lake landscape with the five landscape indexes of lakes dropping; in contrast, lakefront ecology saw a gradual recovery with variations in the remote sensing ecological index (RSEI) in the lakefront area. The MGWR regression results showed that, on the whole, the increase in Gross Domestic Product (GDP), RSEI in the lakefront area, precipitation, and humidity contributed to lake restoration. The growth of population and the proportion of impervious surface (IS) in the lakefront area had different effects on different lakes. Specifically, the increase in GDP and population in all downtown districts and two suburb districts promoted lake restoration (e.g., Wu Lake), while the increase in population in Jiangxia led to lake loss. The growth of RSEI in lakefront area promoted the restoration of most lakes. A higher proportion of IS in lakefront area normally resulted in more lake loss. However, in some cases, the growth of IS was caused by lake conservation, which contributed to lake restoration (e.g., Tangxun Lake). The study reveals the spatiotemporal evolution of multiple lakes in Wuhan and provides a useful reference for the government to formulate differentiated protection policies.
1. Introduction
As an essential part of the urban ecosystem, the urban lake plays a vital role in protecting biodiversity, restoring natural resources, and providing people with a suitable living environment [1,2,3]. In the past few decades, urbanization at an unprecedented scale made maintaining the balance of urban lake ecology a challenging task for many cities, especially for those megacities in fast-growing economies with rapid urban expansion [4,5]. At present, the conservation of urban lakes is facing severe challenges [6], such as the continuous reduction in lake area and the degradation of riparian vegetation [7,8], which also hinder the development of the economy. Therefore, it is necessary to conduct intensive research on the long-term evolutionary characteristics of multiple lakes in the context of rapid urbanization and the impact of related factors affecting lake area to guide future city development better.
Previous studies on urban lakes mainly focused on the changes in the landscape and environment of a single or a few urban lakes [3,9,10]. They often ignored the long-term evolutionary characteristics of multiple lakes. Extensive current studies show that lake area and lake landscape changes were considered two fundamental research issues in lake change study [11,12]. However, with the growing impact of urbanization, lake research should pay attention to these two issues and the changes of multiple lakes in a city, including those in the lakefront area, caused by urban expansion [13,14]. Several pioneering studies reported that the changes in lake area and lakefront ecology were closely related to urban expansion in the main urban area [15,16]. However, the variation of the lake located in the outer suburban district is rarely considered in these studies, as the study area is generally limited to the main urban area. Additionally, previous studies that mainly focused on a few lakes in a local area failed to distinguish the long-term evolutionary characteristics among these lakes and to evaluate the impact of related factors affecting lake changes.
Since districts in a city differ in their geographical environment and urbanization levels, and thus urbanization polices, some other related influencing factors can have different, complex impacts on urban lakes located in different districts [17]. Therefore, it is challenging to explore the spatial non-stationary relationship between these factors and lake changes. For instance, some studies reported that the decrease in Wuhan lakes was mainly caused by urban sprawl [9,15,18], whereas others with more extensive study areas revealed that the reduction in Wuhan lakes was primarily driven by agriculture and fishery activities [19]. Besides, some studies indicated that lake changes were closely related to the urban social economy and meteorology factors, by using statistical methods such as the Ordinary Least Squares (OLS) regression model [20,21,22,23]. Such contrasting findings may be attributed to the limitation of study area and methods, which created difficulties in revealing urban lake changes in the city. Lakes located in the downtown districts are generally smaller than those in the suburbs [24], and are more vulnerable to urbanization policies [16]. Besides, regression models like OLS estimate the correlation between the independent variable and the dependent variable based on stationarity and linearity, and generate constant global coefficients [25], which often leads to over- or underestimation of the correlation coefficients and even improper statistical inferences. In this context, remote sensing data and machine learning technology can provide reliable research data and are efficient methods for lake research in a city [26,27]. In addition, considering the deficiencies of OLS, the Geographically Weighted Regression (GWR) model and its extension, the Multi-scale Geographically Weighted Regression (MGWR) model, which can establish many local regression models of multiple sampling points and help to obtain local estimation coefficients [28,29], are better choices for demonstrating this spatial non-stationary relationship. Therefore, we applied remote sensing data and the regression models to obtain a more accurate understanding of lake changes and provide more reliable support for future policymaking.
This study intends to analyze quantitatively the evolutionary characteristics of lakes and explore the impact of related influencing factors on lake area change in Wuhan in the context of rapid urbanization. To meet these goals, we first extracted the lakes and land use data of Wuhan from the remote sensing images from 1990 to 2019 and analyzed the evolutionary characteristics of 58 lakes in this period, including changes in lake area, conversion of the reduced lake area, lake landscape, and lakefront ecology. Then, by comparing the performances of OLS, GWR, and MGWR, MGWR was selected to study the impact of socio-economic and natural environmental factors on lake area change. Finally, the findings, implications, limitations, and conclusions were summarized.
2. Materials and Methods
2.1. Study Area
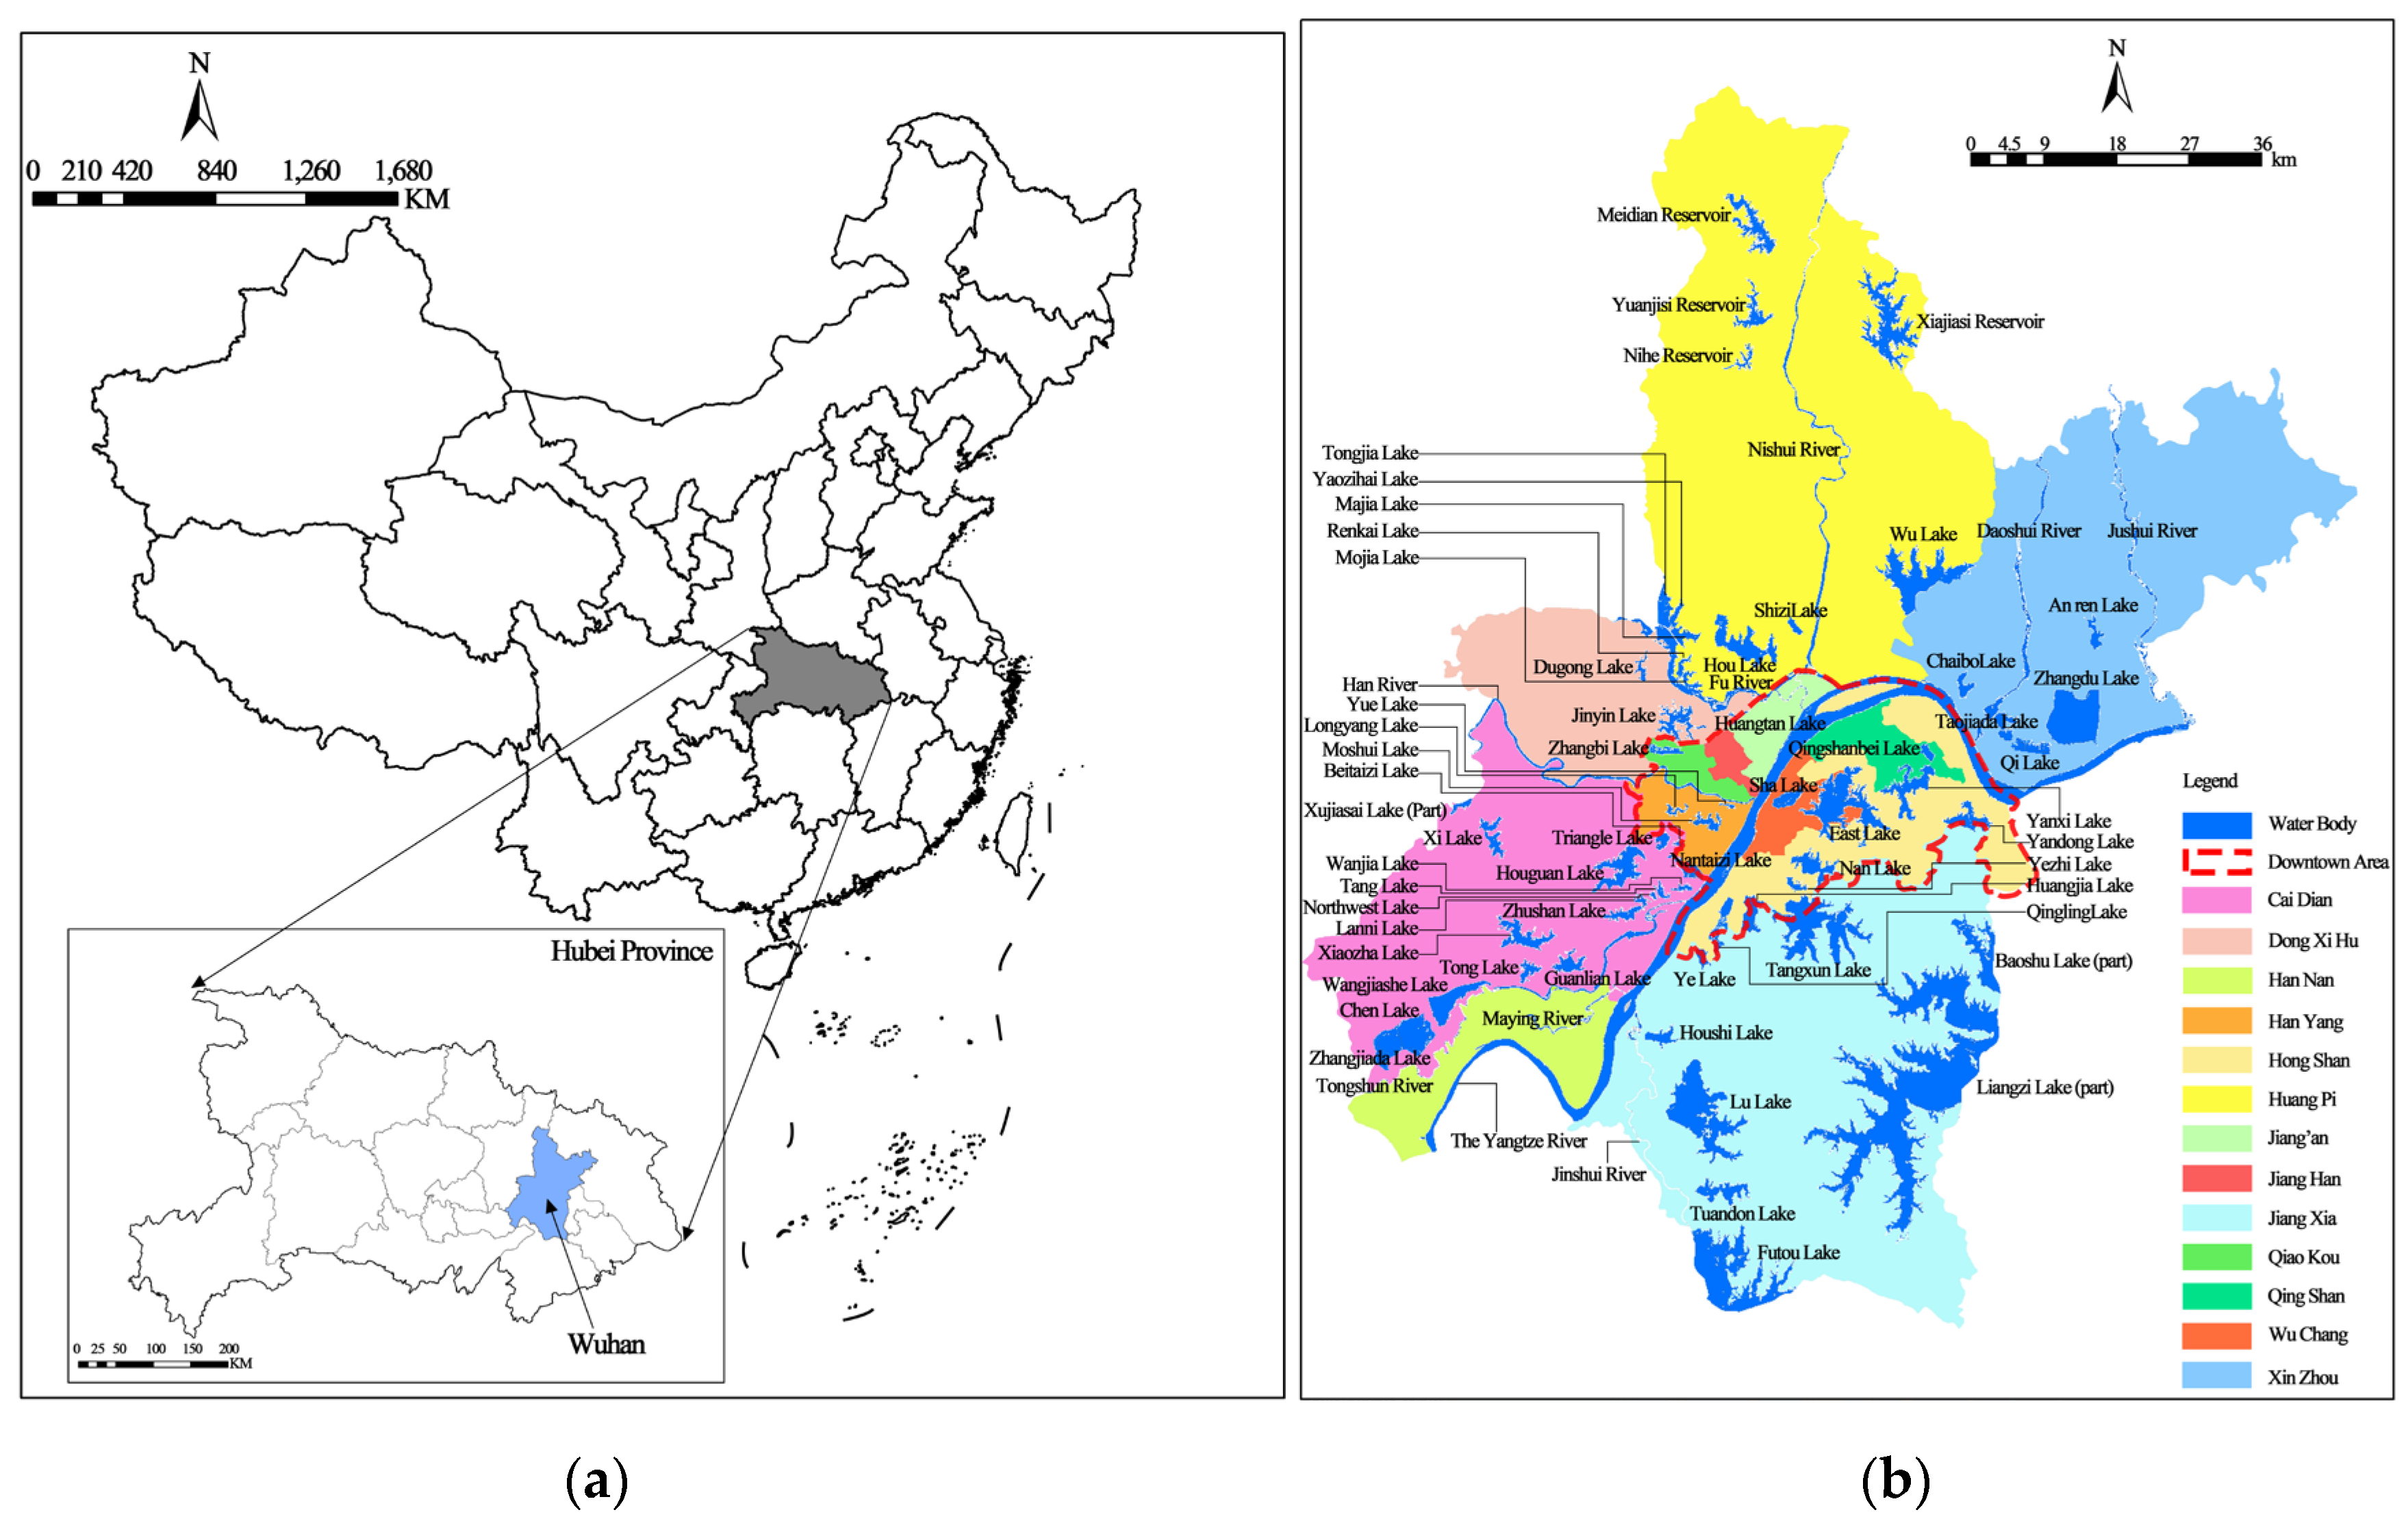
Located in central China, Wuhan, the capital of the Hubei Province, is a fast-developing megacity with abundant water resources [3]. The evolution of lakes in Wuhan reveals the impact of urbanization on urban lakes, especially in growing economies. The period between 1990 and 2019 saw rapid urban expansion [18], during which urban lakes, including their surrounding landscapes, were greatly affected. At present, the deterioration of the lake ecosystem has imposed an adverse impact on the sustainable development of the society and economy [18], calling for more extensive study on the long-term evolutionary characteristics of urban lakes.
There are 13 administrative districts in Wuhan, of which seven districts, Hanyang, Hongshan, Jiang’an, Jianghan, Qiaokou, Qingshan, and Wuchang, constitute the downtown area, while the other six districts, Caidian, Dongxihu, Hannan, Huangpi, Jiangxia, and Xinzhou, constitute the suburb area. Wuhan has a subtropical monsoon climate with abundant precipitation, with most rain falling between April and August.
Based on the remote sensing images in 2019 and the list of key protected lakes in Wuhan, we selected 58 lakes, accounting for one-third of all the lakes in Wuhan, and each with an area larger than 1 km2, a size that is more representative and more reliable to analyze considering the resolution of the remote sensing images, for the study (Figure 1 and Table 1). These 58 lakes distribute throughout the 12 administrative districts, revealing the general characteristics of lakes in the city.
2.2. Data Preparation and Preconditioning
2.2.1. Remote Sensing Data
Landsat images and Seninel-2 images, with their superior spatial resolution and high precision [26,30], were used to map the land cover of Wuhan. Due to the vast territory of Wuhan, two to three images with few cloud coverages (less than 10%) are needed to be stitched to obtain the complete data of the whole city every year, which poses a great challenge to image selection. Besides, we need to select images with similar hydrometeorological conditions and exclude the images of those years with floods between April and September (such as the images in 1998 and 2016, both of which flooded in July). Additionally, considering the urbanization process of Wuhan and the implementation of important lake protection regulations, the images of some years are crucial for lake change study. For instance, the period from 2005 to 2014 is a vital period of urban expansion in Wuhan, and two important lake protection regulations were issued in 2005 (Detailed Rules of Wuhan Lake Protection Regulation) [15] and 2014 (Wuhan Key Lake “Three Line and One Road” Protection Planning), respectively [15,31]. Finally, the Landsat images between 1990 and 2014 and Seninel-2 images for 2019 were selected. All the images were obtained from the United States Geological Survey (http://glovis.usgs.gov/, accessed data: 2020/02/03). All images selected were obtained between April and September in order to make sure that they were acquired under consistent climate conditions. Detailed information on the data is shown in Table 2.
For Landsat data, level-1 products were adopted and subject to system radiometric correction, ground control point geometric correction, and DEM topographic correction. On this basis, ENVI 5.3 software was used for radiation calibration and atmospheric correction pretreatment. For Sentinel-2 images, Sen2COR software provided by the European Space Agency (ESA) and was used for radiometric calibration and atmospheric correction.
2.2.2. Meteorological Data
Meteorological data corresponded with the study period, including monthly total precipitation (PRE), monthly average temperature (TEM), and monthly average relative humidity (HUM), and were obtained from China National Meteorological Data Network (http://data.cma.cn, accessed data: 2020/02/04) to investigate the impact of meteorology on lake area change. Several studies used meteorological factors, such as annual average precipitation and annual average temperature, generally calculated based on the monthly average data, for relationship investigation, ensuring the consistency of these factors on time scales [32,33]; however, there is a large margin of error in the use of these factors for the investigation, while using the monthly data corresponding to the study period can reduce some error. Since all these data were collected from meteorological stations, we applied the ordinary Kriging interpolation method, where the semivariogram is a Gaussian, to obtain the spatial distribution of meteorological elements and extracted the mean value of these elements based on the vector geographic information of lakes to obtain meteorological variable data of each lake.
2.2.3. Socioeconomic Data
Socio-economic data were used to investigate the impact of urban development on lakes. It was confirmed that lake area change has a close relationship with the growth of population and economy, and with urban construction activities [15,16]. Therefore, the data, including the population and GDP of each administrative district, were obtained from the Wuhan Statistical Yearbook (http://tjj.wuhan.gov.cn/tjfw/tjnj/, accessed data: 2020/02/16). Besides, in order to better reveal the impact of urban construction activity on lake area change, based on the extracted land use data, two new indicators can be obtained for our study, i.e., the remote sensing ecological index (RSEI) [34] and the proportion of impervious surface (IS) [16] in the lakefront area. RSEI, proposed by Xu [34], aims to integrate the four ecological indicators of greenness, wetness, dryness, and heat. The four indicators can be represented by four remote sensing indices or components, which are the normalized difference vegetation index (NDVI), the normalized difference built-up and soil index (NDBSI), the wetness (WET) component of the tasseled cap transformation, and land surface temperature (LST). The principal component analysis (PCA) was used to compress the four indices into one to construct: the index for assessing overall urban ecological status. After Xu’s careful comparison, the first principal component (PC1) derived from the four indicators was found to integrate most of the information of the four indicators [34]. The RSEI, a widely used index composed of the four indexes [35,36,37], can make the judgment of the eco-environment more reasonable and comprehensively reveal the eco-environment of a large area of a city. Therefore, using the RSEI can fully reflect the development of lakefront ecology in an all-round way. The proportion of IS can directly reflect the changes in urban construction activities in the lakefront area of a specific lake.
As for the delimitation of the lakefront area, there is no recognized definition. Previous studies proposed different ranges ranging from several meters to hundreds of meters for lakefront zone [18,38]. Based on the delimitation of lakefront area determined by the Regulation of Hubei Province on Lake Protection issued by the government [31], we calculated the proportion of IS and the RSEI in the 500 m lakefront area of each lake, which can reflect both the ecology and urban construction situation in the lakefront area and help to analyze the influence of protection regulations on lake changes.
2.2.4. Index Summary
For the study of lake landscape, the five most commonly used landscape indexes, perimeter area fractal dimension (PAFRAC), edge density (ED), mean patch area (MPA), the aggregation index (AI), and the cohesion index (COHESION) [39], were calculated in Fragstats 4.2 to calculate the impact of urban sprawl on urban lakes, where PAFRAC represents the complexity of lake shoreline; ED shows the length of the landscape element boundary per unit area; MPA reflects the average area of lakes; and the AI and COHESION reveal the connections and aggregation strength among different lakes.
For the research on lakefront ecology, the RSEI of a 500 m lakefront area was applied. In this study, the normal difference vegetation index (NDVI), the normal difference built-up and soil index (NDBSI), the wetness component of the tasseled cap transformation (WET), and land surface temperature (LST) represent vegetation cover, urban construction, humidity, and land surface temperature (LST), respectively [34].
The calculations of the NDBSI, the WET, LST, and the NDVI are shown in Table 3, Equations (1)–(10). NDBSI (Equation (3)) includes the bare soil index (SI) (Equation (1)) and the building index (BI) (Equation (2)), for bare soil and building are the common causes for surface “dry-out” in cities [35]. The wetness component of remote sensing images was obtained by the remote sensing tassel transform, which can reflect the humidity of water, soil, and vegetation [40]. Equations (4) and (5) are the calculations of the WET for the Thematic Mapper (TM) and Operational Land Imager (OLI) sensors, respectively. Equation (6) is for the NDVI calculation. The equation of LST based on the TM sensor is shown as (7–9) [41]. For LST calculation of Landsat 8 image, the tenth band was selected for thermal infrared inversion (Equation (10)) [42].
The results were further processed for better comparison. We used Equation (11) to normalize the values of the NDVI, the NDBSI, the WET, and LST into the range of 0–1. The first principal component (PC1) of the four indexes was obtained by the principal component module of ENVI software to represent the remote sensing ecological index. In order to achieve a positive correlation between the increase in the remote sensing ecological index and the improvement of ecology, Equation (12) was used for processing the initial value of the index. Finally, Equation (13) was used to normalize the initial remote sensing ecological index (RESI0) to obtain the final RSEI.
2.3. Methods
2.3.1. Random Forest Model
The random forest (RF) model was used to extract water information and land use data. The RF model is a supervised machine learning method with high accuracy and efficiency [43], which can be used to extract land cover and waterbody data. The RF model contains a series of base classifiers, each as an independent decision tree model, and the final classification result can be obtained by the voting results of the decision tree models [43]. In addition to processing the original bands of the remote sensing image to obtain the land use data, the enhanced modified normal difference water index (MNDWI) (Equation (14)), the normal difference building index (NDBI) (Equation (15)), and the NDVI (Equation (6)) were calculated and put into the classifier of the RF model to enhance the differences among water, building, and vegetation. Finally, remote sensing extraction of Wuhan land use and water body was mainly performed by combining the original bands of the remote sensing image, the three indexes, and artificial visual interpretation.
where , , and are green band, near-infrared band, and mid infrared band of remote sensing images, respectively.
Classification accuracy and the Kappa coefficient were applied to evaluate the supervised classification results. The original training sample set was randomly divided into two parts at a ratio of 1:2. Two-thirds of the data were used to construct the RF classification model, and the remaining one-third was used for model evaluation. The accuracy and Kappa coefficient were above 89% and 0.86, respectively, indicating that the results were reliable. In order to improve the accuracy further, manual checking and revision based on the lake data published by Wuhan Municipal Natural Resources Planning Bureau (http://zrzyhgh.wuhan.gov.cn/zwgk_18/fdzdgk/ghjh/zzqgh/202001/t20200107_602862.shtml, accessed data: 2020/03/05) were carried out to reduce errors caused by aquatic plants and models.
Land use types were categorized into water body, impervious surface, vegetation, agricultural land, and unused land. Water body mainly refers to lakes, reservoirs, and rivers. Impervious surface mainly refers to urban and rural construction areas, houses, roads, and other hard grounds. Vegetation means natural forest and grassland. Agricultural land means arable land, fallow land without planting crops, and aquatic plants. Unused land is the sandy beaches surrounding water bodies.
2.3.2. Regression Analysis and Evaluation
The impact of the social, economic, and meteorological factors on lake area change was investigated by OLS, GWR, and MGWR (Table 4). Since districts in a city differ in their geographical environment and urbanization level, related influencing factors may impose different impacts on lakes located in different districts. OLS (Equation (16)) is a widely used global model for correlational analysis, which can obtain a set of constant parameters for all locations and may induce some errors for the spatial non-stationary relationship study between related influencing factors and lake change. GWR is an extension of OLS in space, and the parameters of each sampling location can be obtained by using the GWR model [28]. The calculation of GWR is shown in Equation (17). The calculation of βk(ui, vi) is shown in Equation (18). Spatial weight of the estimated data can be calculated by distance weighting functions. Here, the Bi-square function was applied for weight calculation (Equation (19)). However, the GWR model assumes that all influencing factors affect the results on the same scale, which may cause some errors in the estimation [29]. MGWR (Equation (20)) is the extension of GWR. It can optimize the specific bandwidths of each independent variable’s relationship with the dependent variable, based on the preliminary estimation results of GWR to decide an optimal influencing scale by using backward fitting technology to obtain a more accurate result [29].
Considering that urban lakes can impact both society and the environment, we investigated the factors driving the change in lake area from socio-economic and natural environmental perspectives. In addition to factors including population, GDP, and natural meteorology, the proportion of impervious surface (IS) and the RSEI in the lakefront area, which can directly reveal urban construction activities and lakefront ecology surrounding a specific lake, respectively, were also considered. All independent variables were standardized prior to analysis.
In order to evaluate objectively the performance of these three models, the coefficient of determination (R2), corrected Akaike information criterion (AICc), and residual sum of squares (RSS) were used for evaluation.
3. Results
3.1. The Spatiotemporal Evolution of Urban Land Use Types and Urban Water Bodies
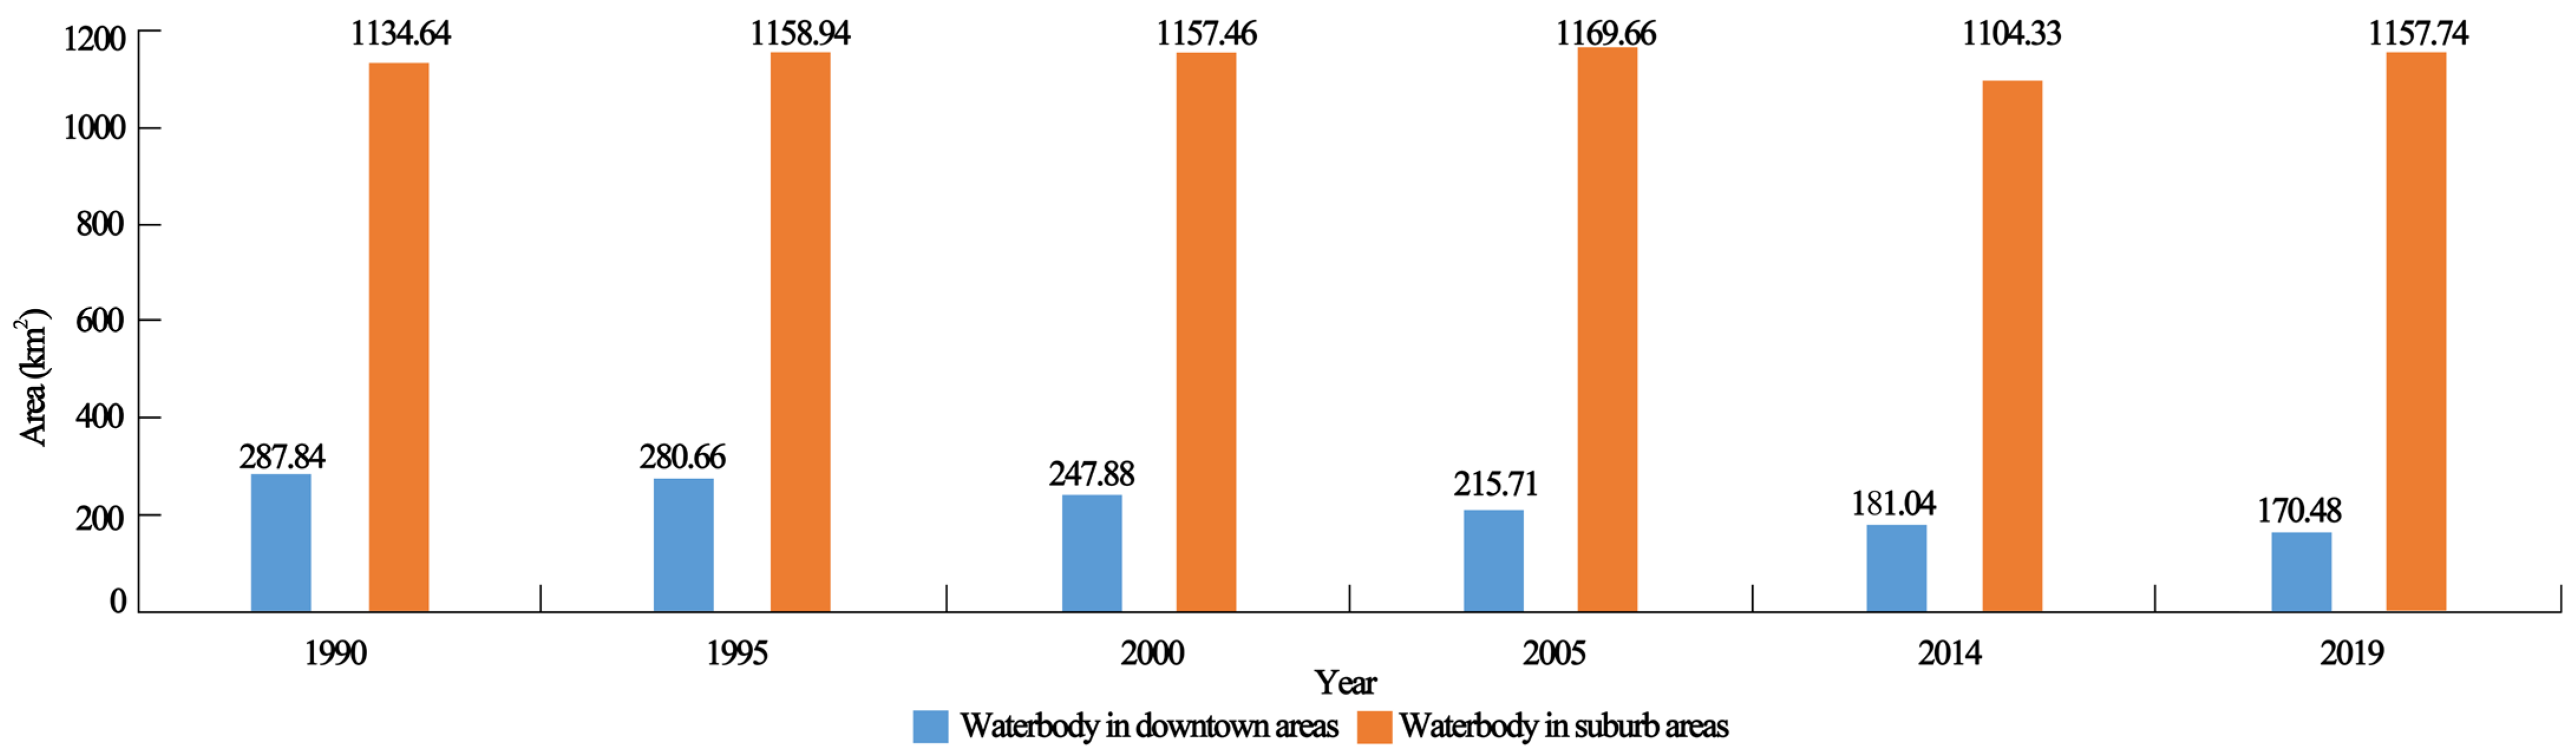
From 1990 to 2019, under rapid urban expansion, water body changes in the downtown area were more significant than those in the suburbs. Table 5 shows that the growth of impervious land in Wuhan has more than tripled. Compared with 1990, the agricultural land, vegetation area, and water area decreased by 35.7%, 33.3%, and 6.6%, respectively, suggesting that urban expansion mainly occupies agricultural, vegetation land, and water bodies, consistent with previous findings [44]. Figure 2 shows that the total water area in downtown districts decreased by 40.8% in terms of regions, while that in the suburbs it decreased by 6.6%. It is worth noting that the water area increased from 2014 to 2019, which may be attributed to conservation policies that the government implemented since 2014 [15].
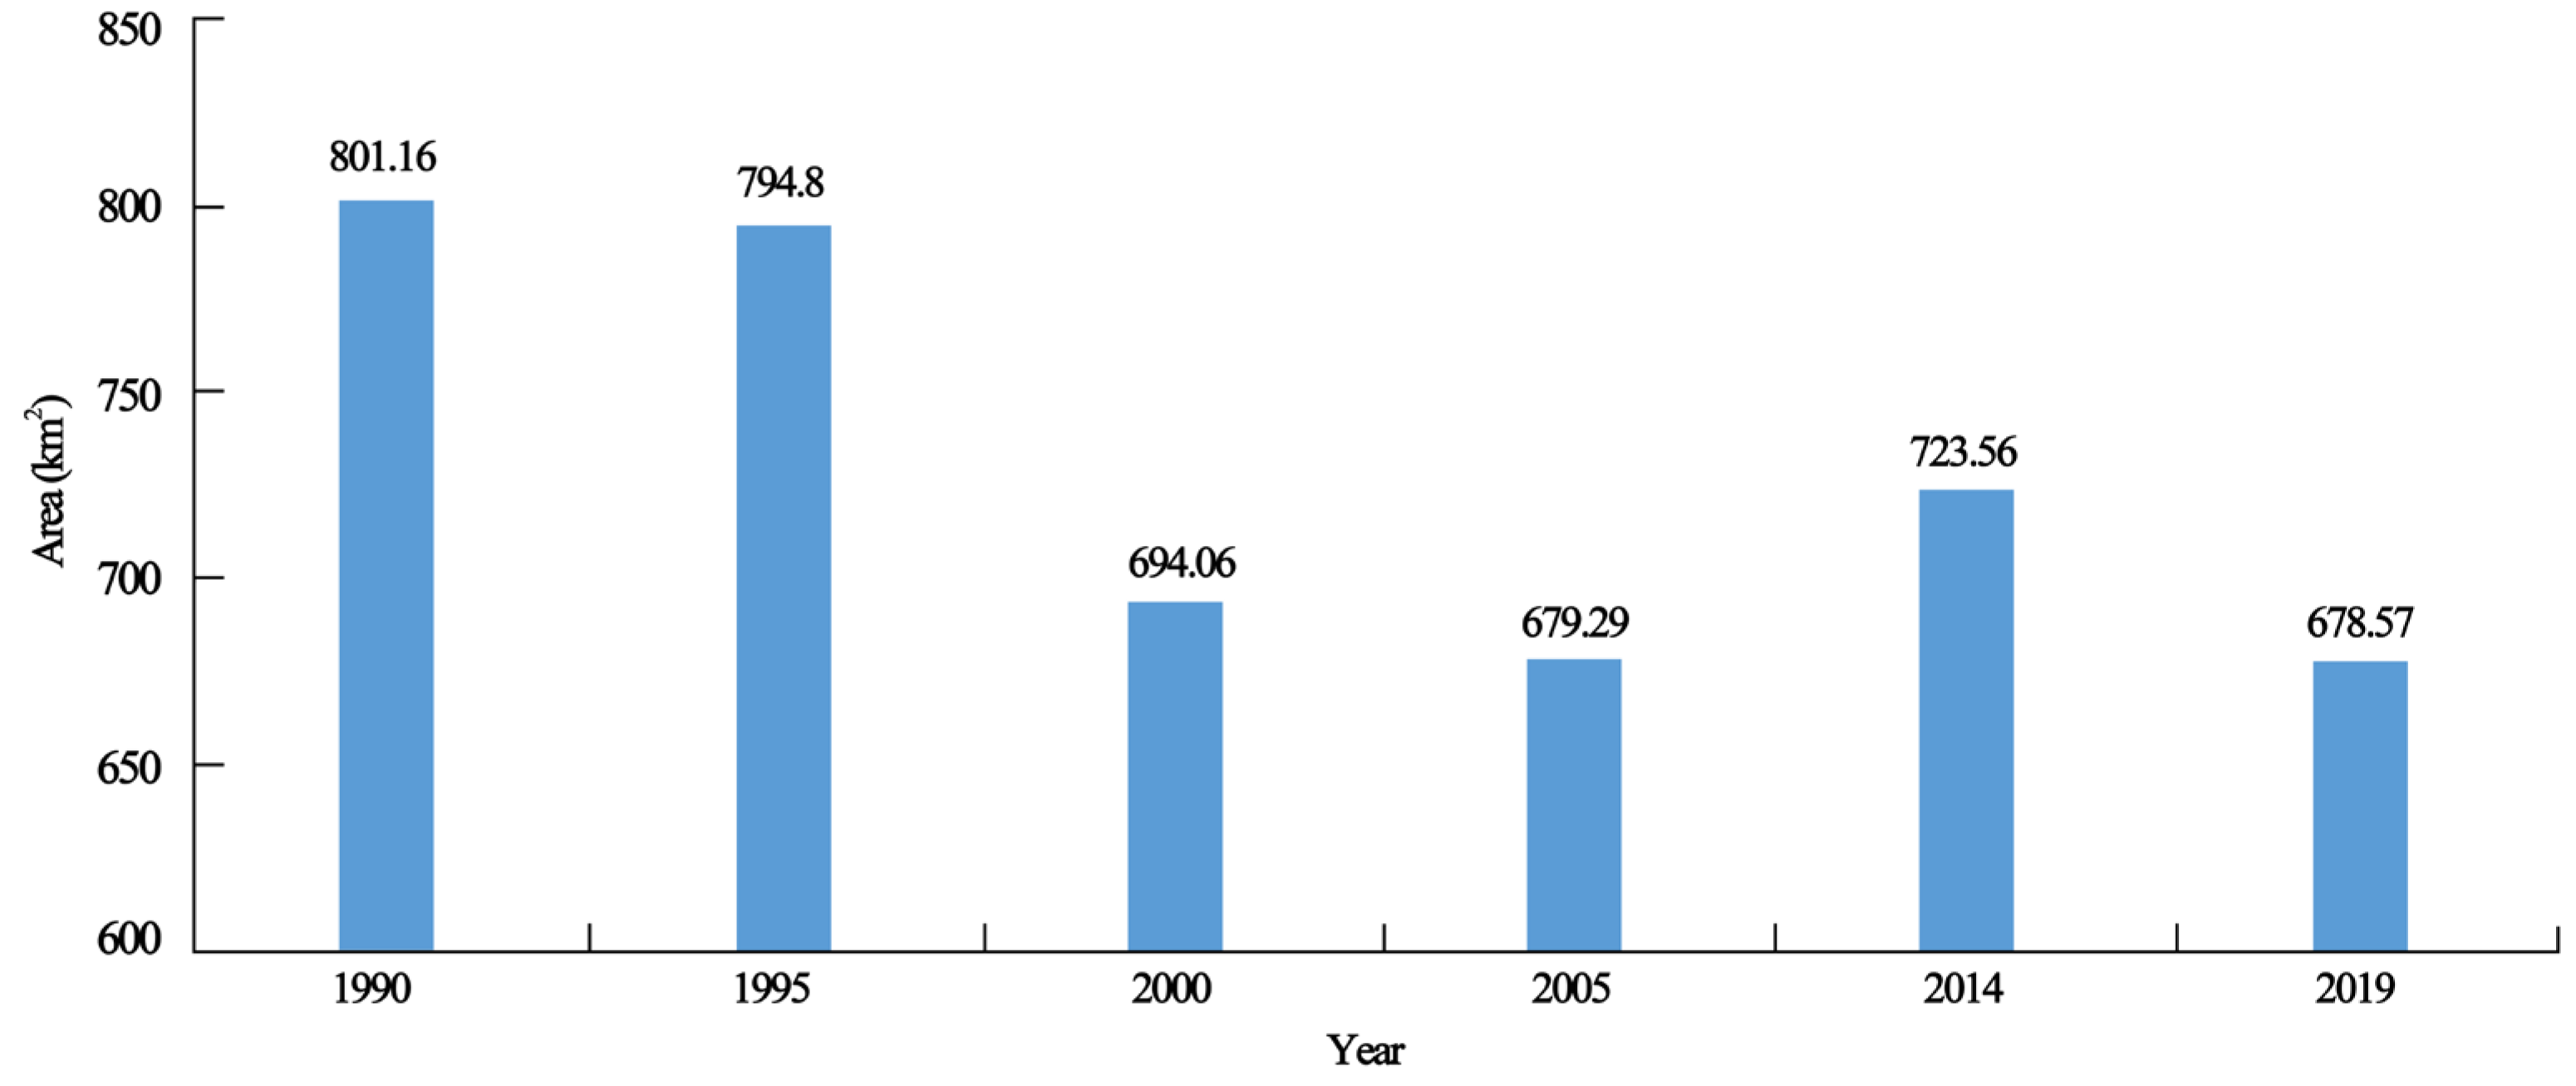
In terms of lake area, the total area of all 58 lakes decreased by 15.3%; 49 lakes had a decreasing rate between 0%-81%; and only four reservoirs and five lakes connected with rivers showed a rising tendency (Figure 3, Table 6 and Table 7). Lake area in all districts declined. For instance, the lake area of the Qiaokou, Hanyang, Hannan, and Hongshan districts reduced by more than 20%, while that of Jiang’an, Jiangxia, Wuchang, Caidian, and Dongxihu decreased by more than 10%. The top ten lakes with the highest reduction rate were mostly distributed in the downtown districts (Table 7).
The analysis on the conversion of the shrinking lake area revealed that urban construction and agriculture activities were the main drivers of lake degradation in Wuhan (Table 8). In downtown districts, the shrinking lake area was mainly converted into impervious surfaces. For example, in Jianghan, Qiaokou, Wuchang, Hanyang, and Qingshan, more than 50% of the shrinking lakes were transformed into impervious surfaces. In Hongshan and Jiang’an, the numbers were 43% and 34%, respectively. While in the suburbs, the shrinking lakes were mainly converted into agricultural land. For example, in Jiangxia and Xinzhou, more than 57% of the shrinking lakes were transformed into agricultural land. In Caidian, Hannan, and Huangpi, the numbers were 47%, 38%, and 34%, respectively. However, the situation in Dongxihu was quite different. The impact of urban construction on this suburb district was more prominent, with 50% of the shrinking lake area converted into impervious surface, and 23% converted into agricultural land.
Former studies suggested that urban expansion, which resulted in 54–60% of the total lake shrinkage, is the primary cause of lake shrinkage in Wuhan [3,9,18]. However, our research on the lakes located in the suburb districts found other different significant factors affecting lake changes. Therefore, due to complex lake evolution characteristics, a comprehensive analysis should be carried out on the influencing factors of lake area by considering multiple perspectives.
3.2. Landscape Analysis of Urban Lakes
From 1990 to 2019, the lake landscape has undergone drastic changes, with all five landscape indexes of urban lake dropping (Table 9). The decrease of PAFRAC revealed that the lake shoreline was increasingly regularly [21]. ED fell from 17.16 to 12.41, and MPA reduced from 11.42 km2 to 2.66 km2, indicating the vanishment of many scattered lake patches and prominent encroachment of large lakes. The AI and COHESION both showed a downward trend, demonstrating decreased lake connectivity. The AI is related to the number of adjacent edges and spatial distance among different lake patches [39]. The variations of ED, MPA, and the AI showed that some adjacent lake patches disappeared, which indirectly increased the spatial distance among different lakes. In general, the lake landscape of Wuhan presented a trend of gradual deterioration, with a decreasing number of lake patches and looser connections among different lakes.
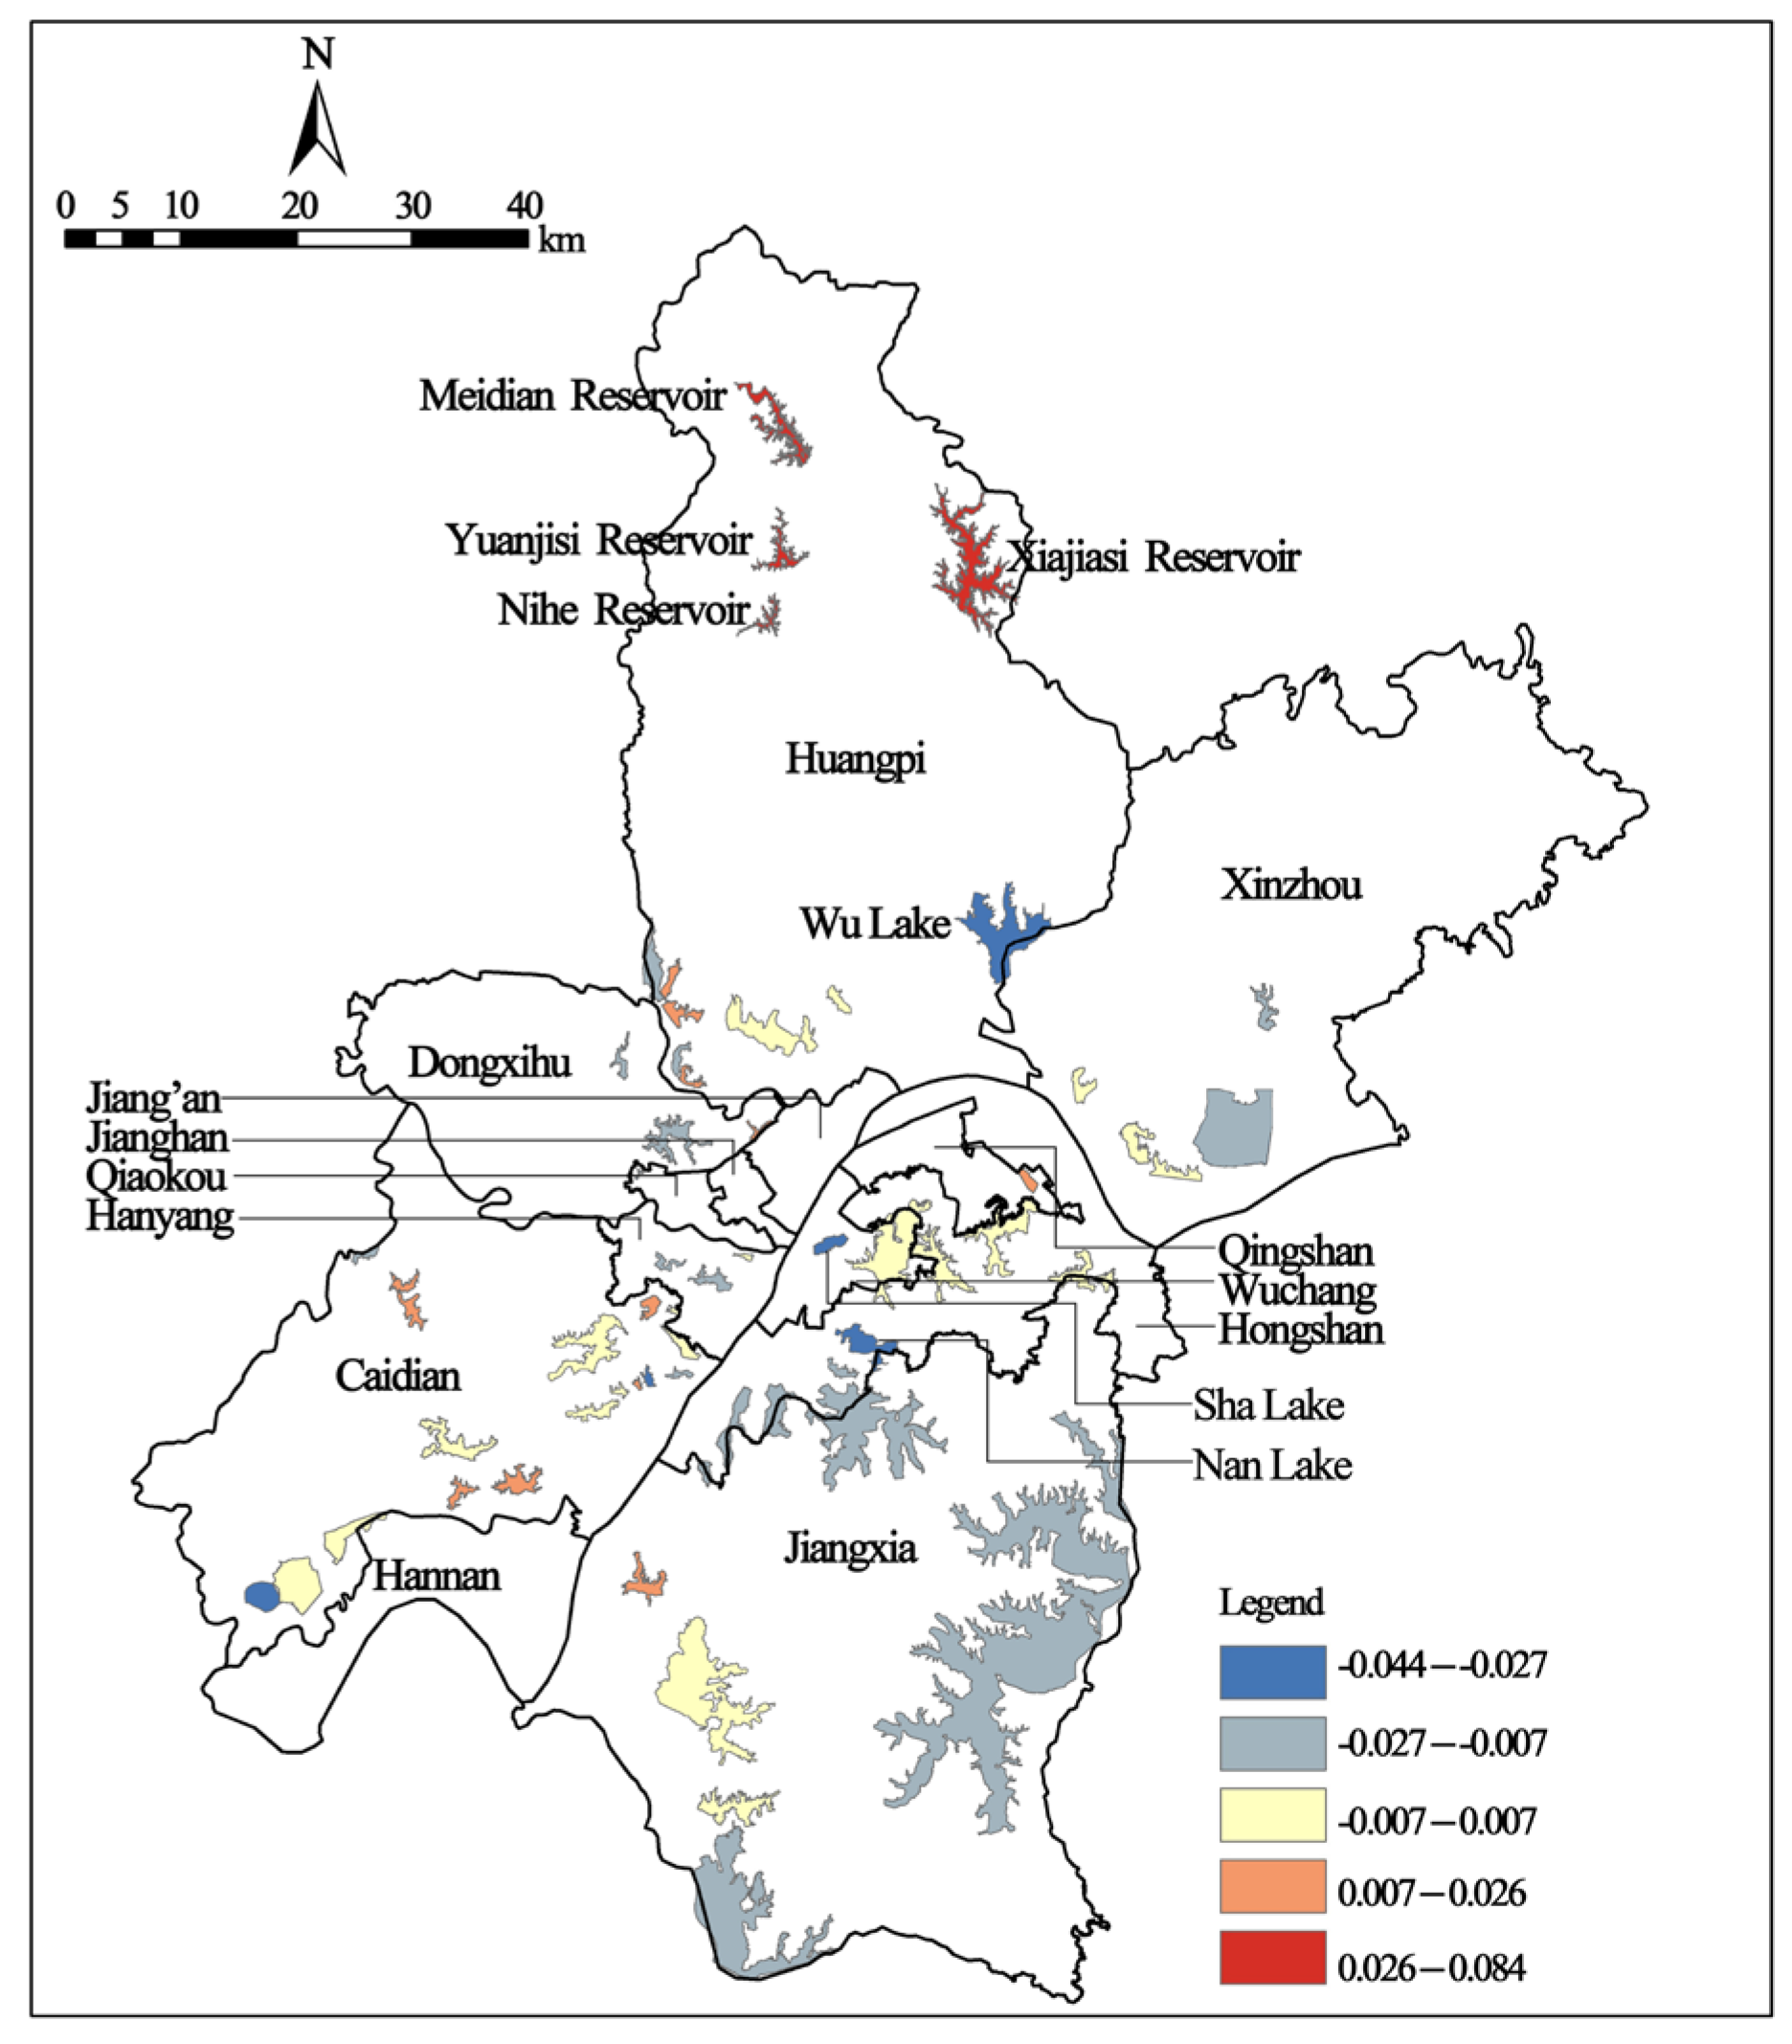
Among all 58 Lakes, their PAFRAC variations were quite different (Figure 4). PAFRAC of most key lakes located in the downtown districts were relatively stable, and only a few lakes had a significant decrease. PAFRAC of most lakes in the suburb districts declined, while that of the reservoirs in Huangpi showed an increasing trend, which may be related to the special regulations and the continuous shoreline restoration and reservoir management implemented by the Wuhan government, protecting the reservoirs in Huangpi in the form of statutory planning [15].
The top three with the most significant reduction of PAFRAC were Nan Lake, Sha Lake, and Wu Lake. The evolution of three lakes was a typical example of lakes with decreasing PAFRAC. Nan Lake and Sha Lake are located in the downtown area, and Wu Lake is located in the suburbs. Nan Lake and Sha Lake were significantly affected by urban construction activities. The shrinking area of the two lakes was converted into land for residence, administration, commerce, and education, resulting in very straight lake shorelines. As for Wu Lake, a large part of the lake was divided into fishponds and paddy fields with neat and straight boundaries. Therefore, construction activities with different orientations can impose distinct impacts on the lake landscape, and the formulation of lake protection policies plays a vital role in lake protection.
3.3. Lakefront RSEI Analysis
From 1990 to 2000, due to blind urban expansion and the common practice of encroaching lakefront areas for urban construction [16,45], the RSEI dropped, showing that the lake ecology was damaged. Later on, owing to enhanced awareness of environmental protection and the launch of a series of regulations and plans [15], the RSEI gradually picked up, signifying that the ecology was restored. Therefore, in general, variations in the RSEI in the lakefront area over the years presented a recovery trend of ecology in both downtown and suburb districts (Table 10) [16].
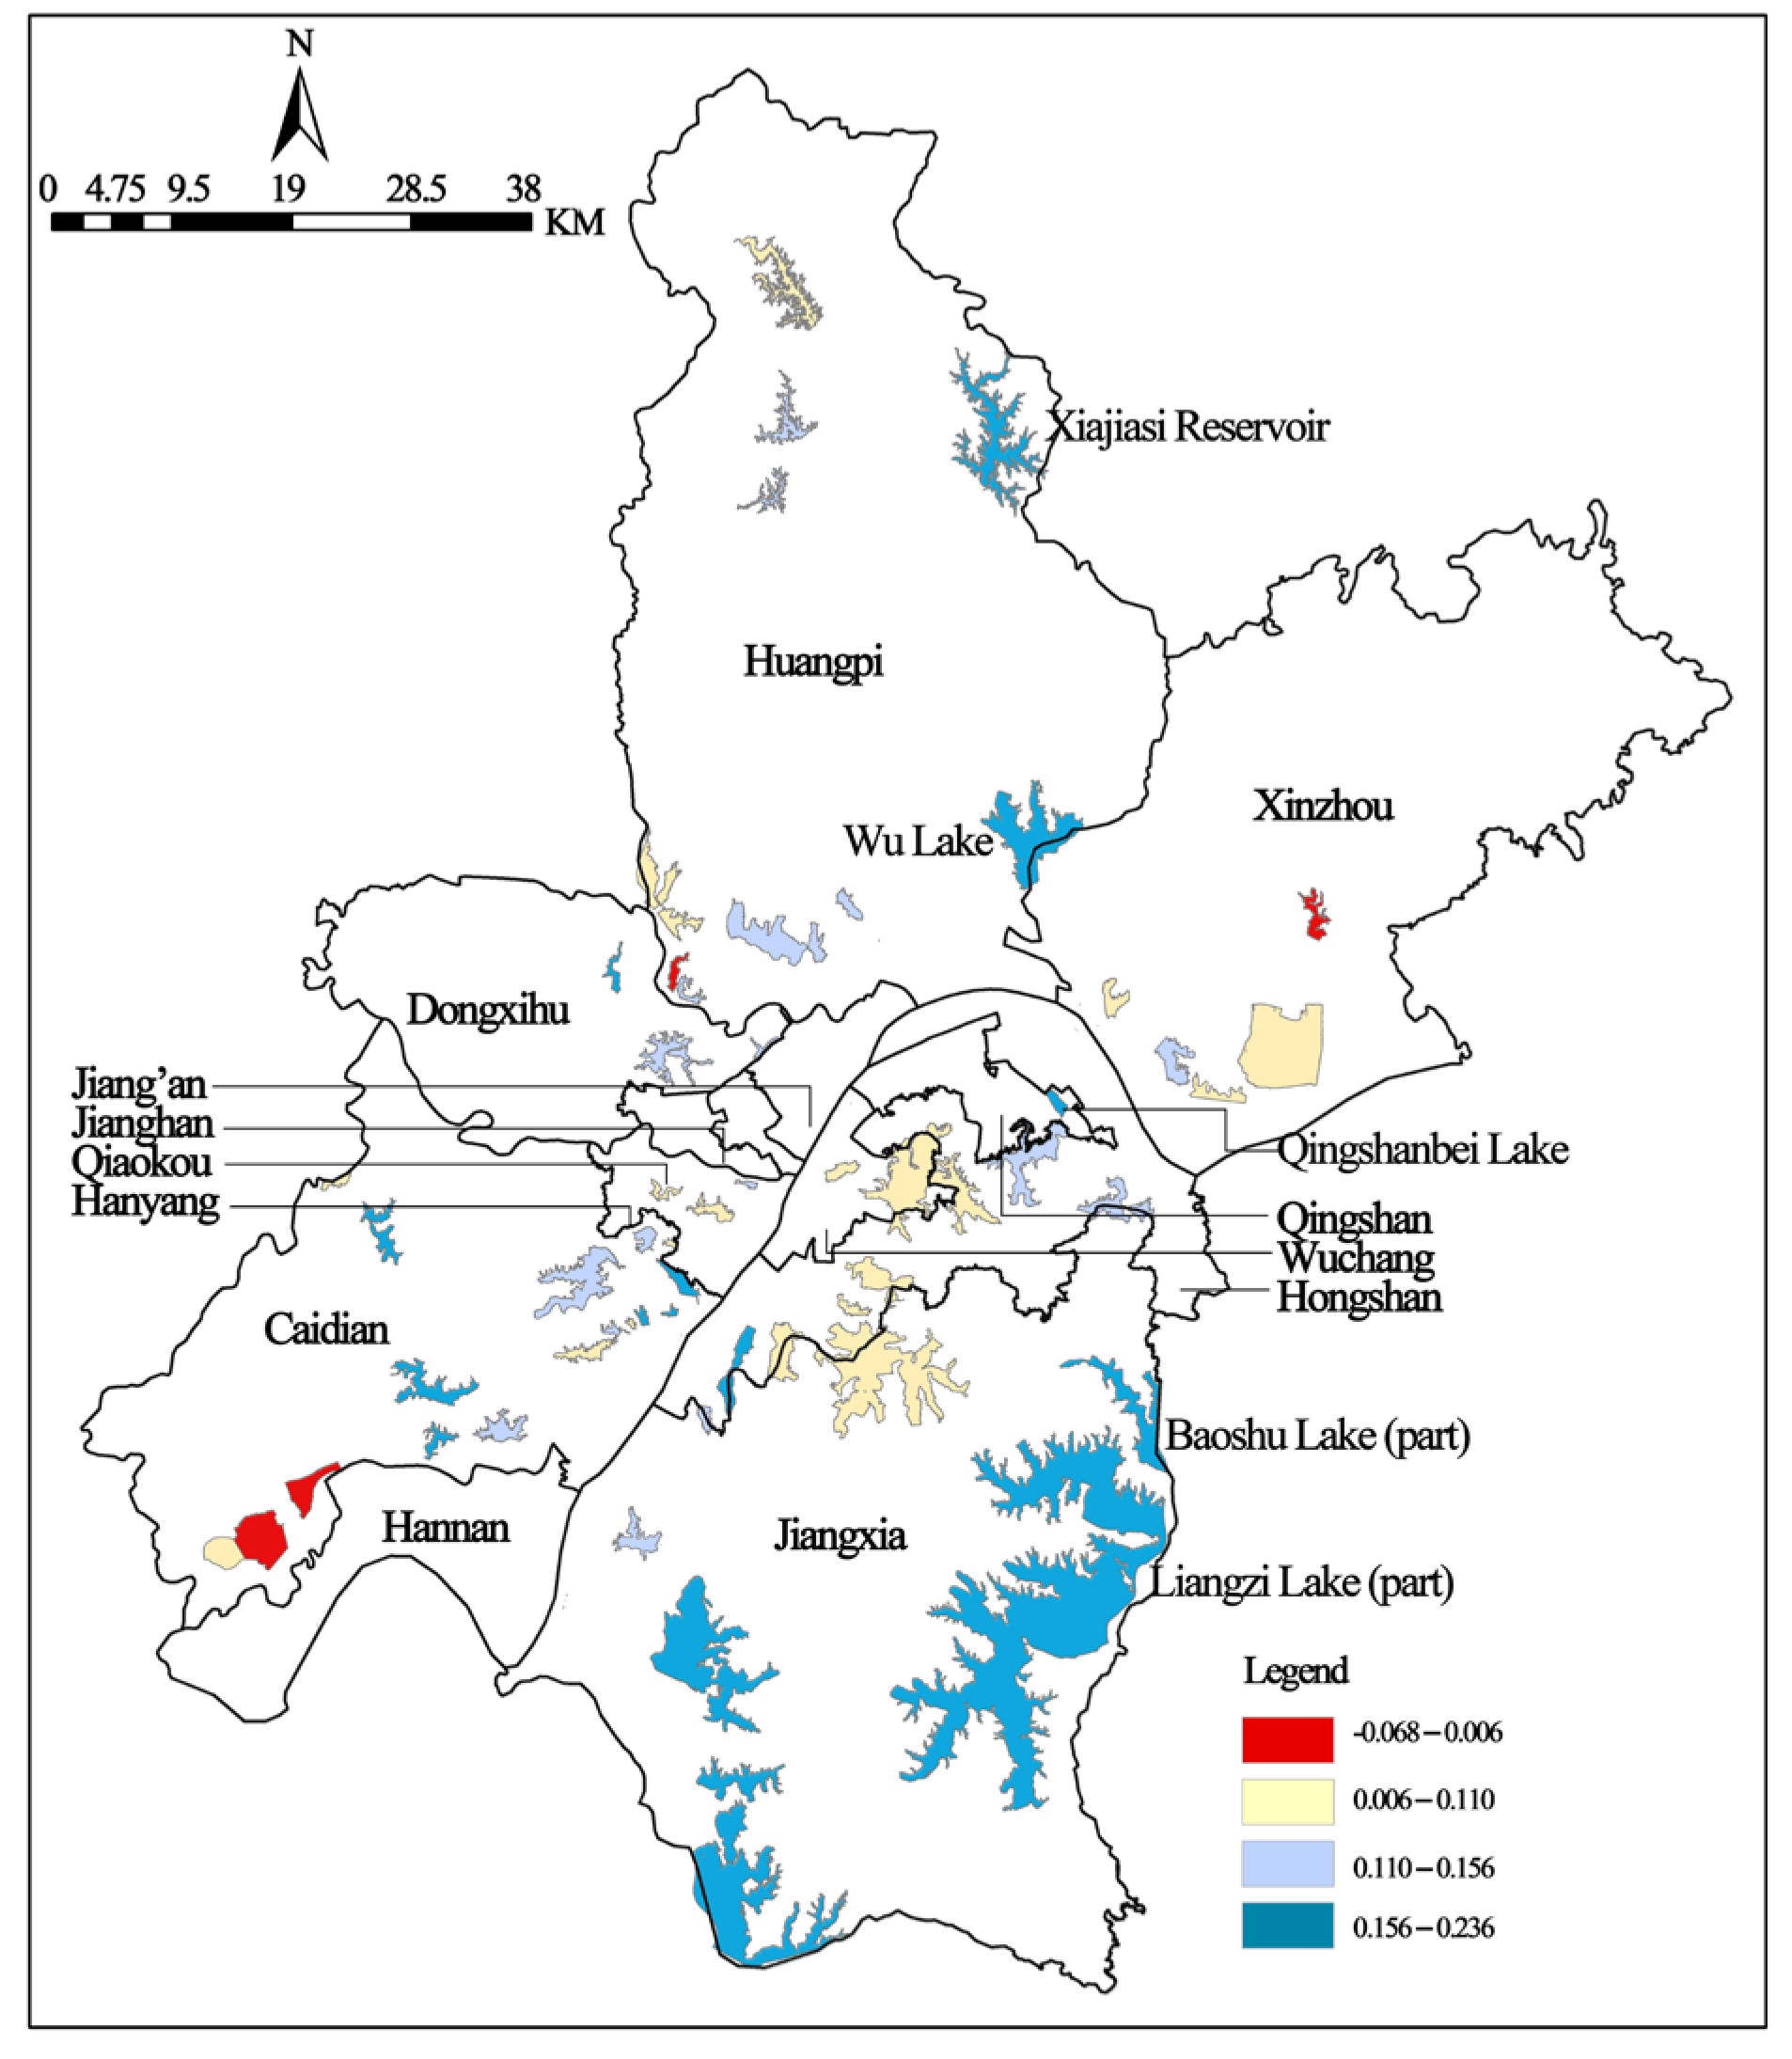
Figure 5 shows that the ecology of most lakes revealed a recovery trend, in which the top five most improved lakes were Qingshanbei Lake, Liangzi Lake, Baoshu Lake, Wu Lake, and Xiajiasi Reservoir. Qingshanbei Lake is located in the Qingshan district, where most heavy industry factories in Wuhan are located. In order to reduce pollution and restore lake ecology, the government formulated a series of environmental protection policies, and many factories adopted new technologies. Liangzi Lake and Baoshu Lake, for their large lake area and high vegetation coverage, received special conservation from the government in order to preserve the lake ecology. For instance, the Wuhan government continuously invested billions to strengthen the dam of the reservoir and renovate the irrigated areas of the reservoir to save water since 2006, according to consultations of Wuhan water environment experts. Located downstream of Xujiaqiao River and Wujiasi River, Wu Lake is certainly affected by the ecology of these two upstream rivers. The variations of the RSEI and landscape indicators suggest that lake ecology still needs to be improved further.
3.4. The Impacts of the Influencing Factors on Lake Area Change
3.4.1. Model Performance and Comparison
The performances of OLS, GWR, and MGWR are summarized in Table 11. GWR and MGWR performed much better than OLS, indicating that there were apparent disparities among different regions regarding the impact of related influencing factors on the lakes.
In comparison, MGWR (R2 = 0.857) was better than GWR (R2 = 0.720). The results of RSS and AICc of MGWR were 47.043 and 470.079, respectively. Therefore, the MGWR model was selected for further analysis.
3.4.2. The Impacts of the Influencing Factors on Lake Area Change in Different Regions
The MGWR model was applied to obtain the optimal bandwidths of the seven variables; the model implied the different influencing scales and the local coefficients of each independent variable (Table 12). The results included the minimum, maximum, mean value, and standard deviation of each variable’s coefficients. The bandwidths of POP, IS, and the RSEI were smaller, indicating that population growth and urban development can pose different impacts on the lakes in different regions. The other four factors with a higher bandwidth of 393 indicate that they could pose an overall impact on the lakes as a whole.
Figure 6 and Figure 7 show that the specific influencing area of each factor varied spatially. In terms of socio-economic factors, the increase in GDP in each administrative district contributed to the recovery of lake area, especially for the lakes located in the downtown area, and Xinzhou and Huangpi. The growth of population helped restore ake area in all downtown districts and two suburb districts (Xinzhou and Huangpi), while the increase of population in Jiangxia led to a decrease of lake area. The IS in the lakefront area, to a large extent, reflects the impact of urban construction activities in the lakefront area [18], while the RSEI in this area reveals the restoration of lakefront ecology. As Figure 6 shows, the increase of IS leads to lake loss, while the growth of the RSEI promotes the restoration of most lakes. However, in some local areas, the increase of IS was mainly caused by lake protection policy which positively influenced lake conservation. For example, influenced by a special protection policy, many greenways and dams were built around Tangxun Lake, Nan Lake, and the reservoirs in Huangpi in recent years. The spatial coefficients of the RSEI of several lakes located in the edge of the downtown area were negative, which may be attributed to urban construction activities. For instance, Hou Lake, Shizi Lake, and several other lakes in Huangpi, Xinzhou, and Dongxihu, were mainly affected by the construction of Panlong New Town, Yangluo New Town, and real estate [46], respectively, which contributed to the restoration of lakefront ecology and landscape, but led to lake loss. In general, the impacts of POP, IS and the RSEI on different lakes confirm the optimal bandwidths of these factors calculated by MGWR, indicating that the regression results are reliable.
The disparities in socio-economic factors may be attributed to different local government’s policies and the public’s awareness of lake protection in different areas. With the increasingly stable built environment and the improvement of lake protection awareness in the downtown areas, a series of lake protection regulations were implemented, such as the Wuhan Lake Protection Regulations (implemented in 2002) [15]. Given the huge cost of lake restoration and different urbanization levels in each district, the socio-economic factors have different, complex impacts on lakes in each district. In the downtown districts with large population densities, given increasing public demand for lakefront green space and relatively fewer lake resources, the government invested billions and carried out a series of construction activities to restore some key lakes. In the suburbs, Huangpi and Xinzhou are two ecological protection areas and ecotourism areas in Wuhan, which attracted public attention and received a large sum of government funds for exemplary conservation. Besides, reservoirs in the suburbs, such as Liangzi Lake and the four reservoirs in Huangpi, were continuously repaired by the government. For instance, reservoir dam reinforcement, water-saving reconstruction of reservoir irrigation area, and reservoir shoreline renovation have become the normal management measures implemented by the Wuhan government, which consume a huge amount of funds every year, according to the consultations of Wuhan water environment experts. Therefore, the growth of the GDP, population, and the RSEI in the downtown areas, and Huangpi and Xinzhoum can promote the implementation of protective actions. However, as new development zones, Jiangxia, Caidian, and Dongxihu introduced many new industries and construction projects in recent years [47,48], thus attracting a large number of employees who care more about the development of infrastructures than protection of lakes. Therefore, the population growth in Jiangxia caused lake loss.
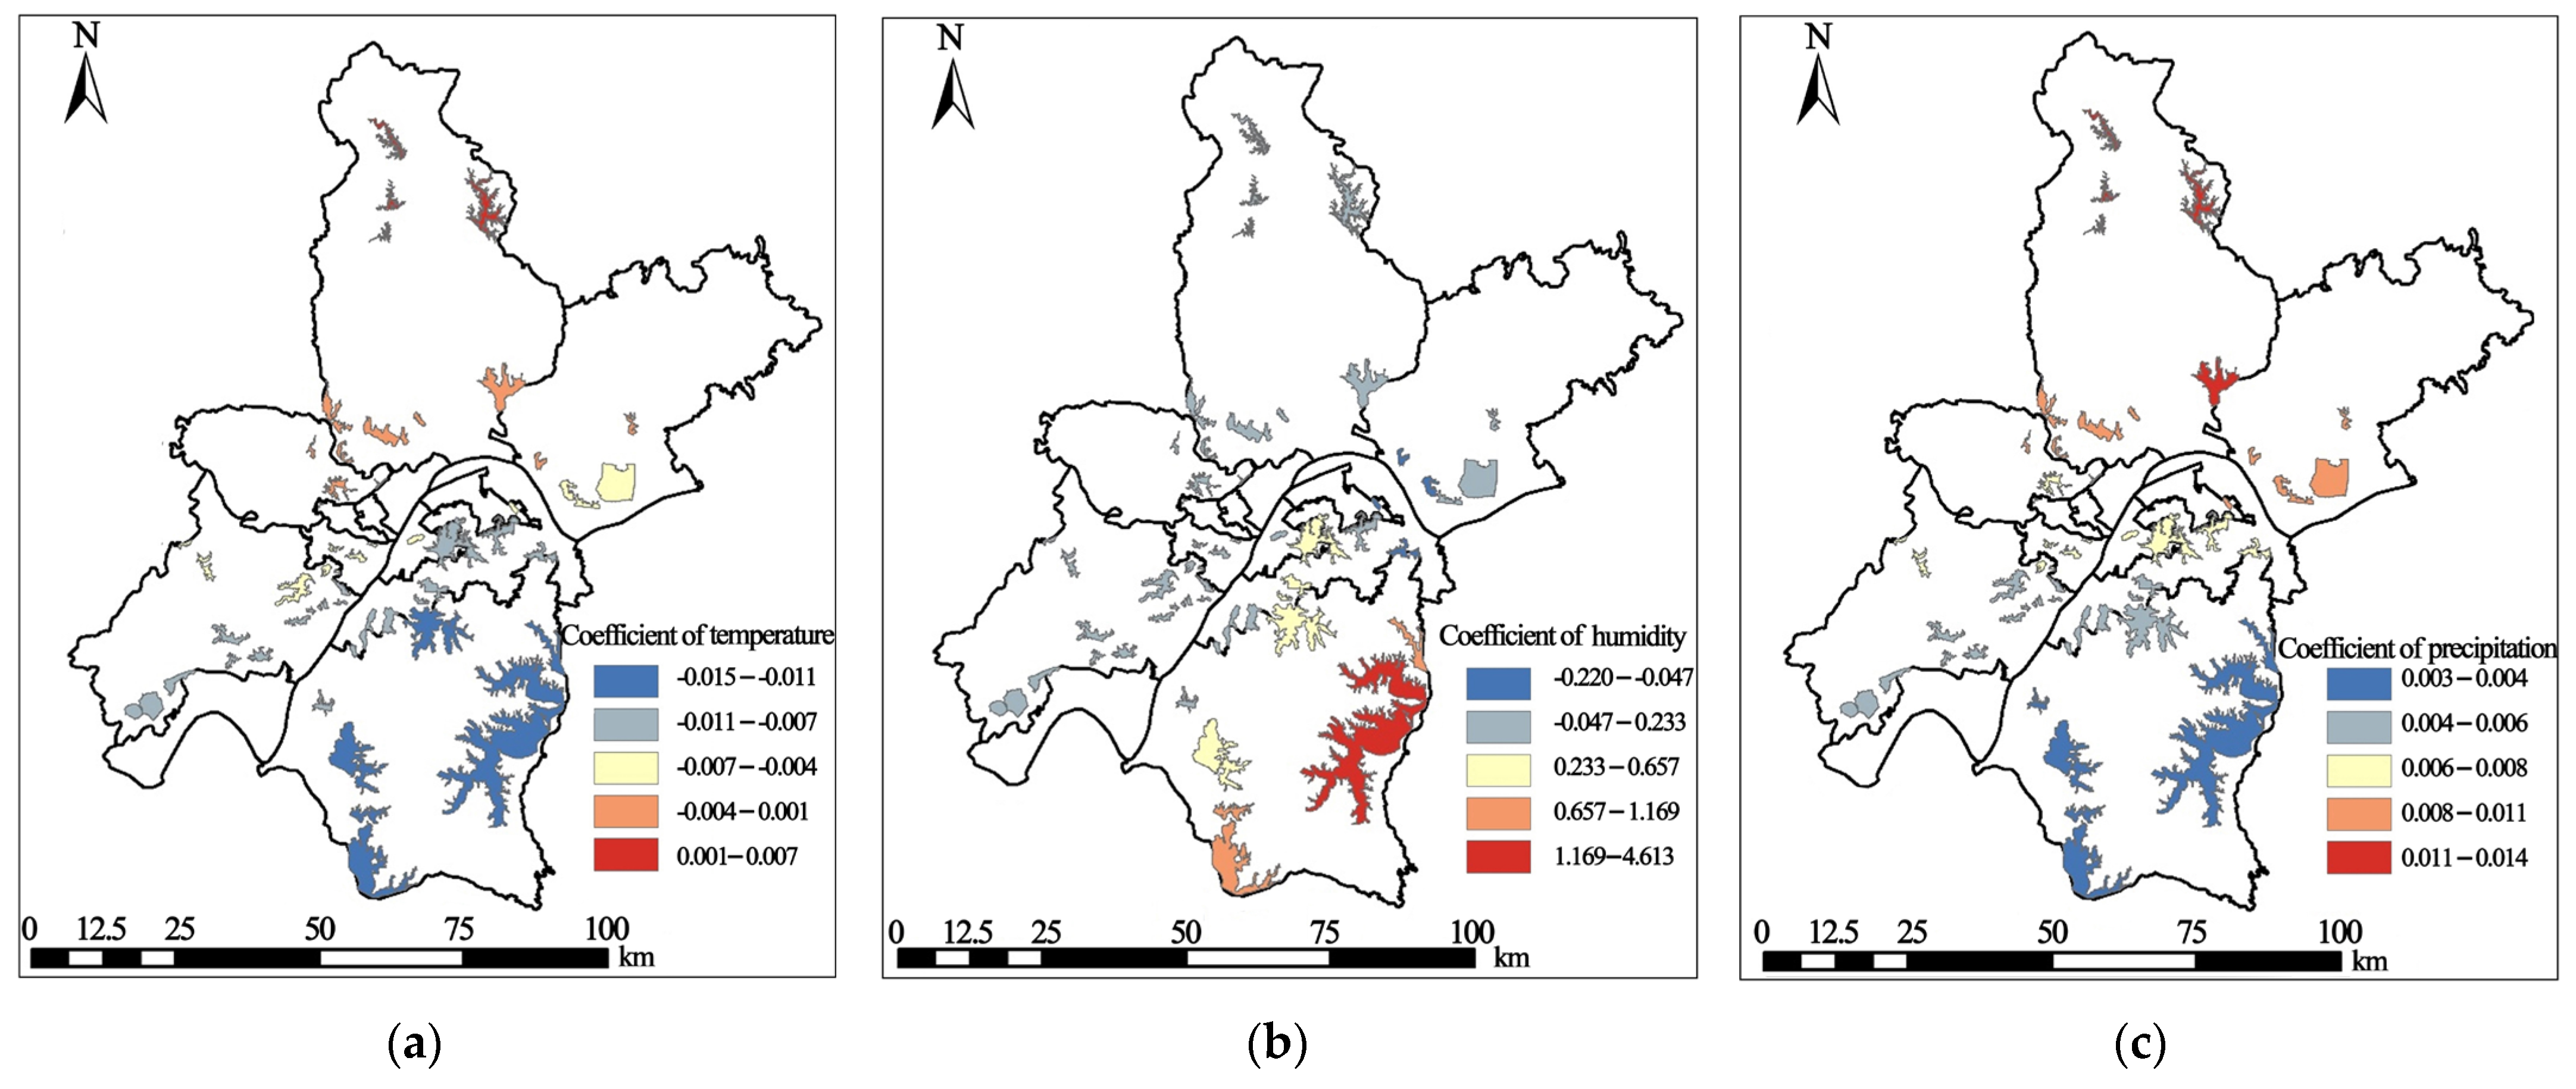
Figure 7 presents the spatial coefficients of meteorological factors. The spatial coefficient of TEM in most lakes was negative, and the values were gradually increasing from southeast to northwest. The lakes significantly affected by humidity were located in the southeast of Wuhan, especially Liangzi Lake and Futou Lake in Jiangxia, with lots of vegetation and wetlands around. Precipitation was positively related to all lakes. The reservoirs in Huangpi and Wu Lake were most affected by precipitation. Liangzi Lake and Lu Lake in Jiangxia were least affected by precipitation due to large lake areas and close interconnections between the two lakes.
4. Discussion
4.1. The Impacts of Urban Development on Urban Lakes
The impacts of urban development on urban lakes vary from different time periods. According to the “EKC” [47], in the period of rapid urbanization, to tackle the challenge of population explosion and achieve capital accumulation, developing at the expense of the environment, especially the lake ecology, is the typical approach adopted by the fast-developing megacities in East and Southeast Asia [8,48,49]. Later, as the development pace slows down, lake resources shrink, and the public’s awareness rises, effective protection measures will be taken, and urban development will have a positive influence on lake conservation at this period [39,50]. In fact, the evolution of lakes in the megacities of Southeast Asia was influenced by high rates of migration [51], which may lead to a similar development tendency in lake evolution in this region. The detected trend of lake deterioration in Wuhan is similar to those reported in other megacities in Southeast Asia, such as Bengaluru, India [52]; Mumbai, India [53]; and Colombo, Sri Lanka [54], where lakes have been subjected to rapid urban expansion. As urban sprawl stabilizes, the social value of lakes continues to emerge. The improvement of lake ecology is not only conducive to maintaining the balance of an urban ecosystem, but also helpful to different urban residents to enhance their sense of identity with the city [54,55]. Therefore, the evolution of lakes in Southeast Asia is often characterized by strong complexity and obvious stages.
The spatiotemporal evolution of urban lakes in Wuhan corresponded to the changes in public lake protection awareness and urbanization policies, which corresponds to the prediction result of the “Environmental Kuznets Curve (EKC)” [47]. Since the 1980s, the Wuhan government formulated and launched the policy of returning farmland to lakes, which slowed down lake area reduction [15]. However, after the 1990s, to tackle the functional space demands generated by a population explosion and realize urban economic development, Wuhan joined the boom of real estate in downtown areas and the development of new zones in the suburbs [18], encroaching on a large area of lake and other land [56]. Then, after 2000, with the improvement of lake protection awareness, a series of lake protection plans and regulations were implemented, such as the Wuhan Lake Protection Regulations (implemented in 2002), a key lake shoreline protection (implemented since 2014) [15]. In 2018, the master plan for lake protection in Wuhan was promulgated [31], which defined the classification and functional orientation of 166 lakes in Wuhan, and put forward countermeasures for lake protection from multiple perspectives, such as lakefront area management, lake resources and ecology protection, and lake pollution control. The implementation of these protection measures marks the transformation of lake protection from the formulation of the legal system to the implementation level of specific protections.
Due to obvious disparities in the development direction and different urbanization level in each district, the impacts of urban development on urban lakes vary from different regions. In Wuhan, in the downtown districts, the main means of urban expansion was to occupy lake areas to form functional zones, such as residences and shopping malls during rapid urbanization. At the same time, in the suburbs, many economic and technological development zones emerged, occupying a large area of vegetation, arable land, and lakes, for instance, the implementation of projects like Nan Lake and Huangjia Lake residential districts in the downtown areas and a series of economic and technological development zones in the suburbs, including Wuhan Economic and Technological Development Zone, and new towns, including Yangluo and Panlong New town [46]. However, in the outer suburbs, lakes were more affected by farming and fishery, which reveals the complexity of lake evolution in different regions. Besides, we also found that the improvement of lakefront ecology was not completely beneficial to lake area recovery. Specifically, some real estate development projects often occupy part of the lake to transform the lakefront landscape ecology to enhance the added value of real estate. Compared with the existing studies limited to the main built-up areas, this paper provides a more comprehensive understanding of the complexity of the lake evolution in mega cities.
As for the regression models, the performance of OLS is quite poor (R2 = 0.041), which reveals that the global model has a strong inadaptability in studying the non-stationary spatial relationship between dependent variables and independent variables. In Wuhan, the areas of lakes in the suburbs are normally several times that of lakes in the downtown areas. The GDP and population scale of the downtown area are much more than that of the suburbs. Even though we standardized the data during the data preprocessing, the significant difference still exists, which is the main reason for the poor performance of the global model. Local models such as MGWR, which can reflect the impacts of related influencing factors in different areas, should be applied to obtain a more accurate understanding of the mechanism of lake change.
Since obvious disparities in the evolution of lakes in different districts, it is necessary to identify and analyze the major problems and give a systematic evaluation of each lake located in different areas [17]. Then, more targeted protection policies can be put forward to protect lakes with different development situations better. Therefore, before restoration, it is of great significance to study the evolutionary characteristics of multiple lakes, including lake area changes, conversion types, landscape, and ecology in lakefront area, and their driving forces. Furthermore, we should identify the risk factors and carry out protection measures according to each lake’s specific situation, to restore the lake ecology better.
4.2. Limitation and Future Study
There are several limitations worthy of discussion. First, the images were selected with irregular intervals because of the impact of cloud cover. Wuhan has a subtropical monsoon climate, and the cloudy conditions account for more than half of the day-to-day weather [57], making it challenging to obtain remote sensing images without any cloud from April to September. Besides, due to the vast territory of Wuhan, 2–3 images with good meteorological conditions are needed to be stitched to obtain the complete remote sensing data of each year, and the data of some years are vital for studying the influence of urban policies on lakes, which poses a great limitation to this study. Second, the hydrometeorological conditions of images in each year have some difference. In the long-term evolutionary study of urban lakes, the inconsistency of hydrometeorological conditions is an important problem, and using image data with similar meteorological conditions for analysis is the solution adopted by many researchers [15,16,58,59,60]. By querying hydrometeorological data, we tried our best to select images with similar hydrometeorological conditions for research. However, there are inevitable differences which are within the acceptable range in meteorological conditions every year. Meanwhile, during the research process, we consulted with more than ten experts from the Wuhan Water Bureau and Environmental Protection Bureau to ensure the reliability of the research conclusions. In addition, due to the low resolution of image data in the early years, we spent a much time looking up data and manually checking each lake of every year. Therefore, we believe that this “misrepresentation” of lake properties will not incorporate biases into the final conclusions. Third, the study only quantitatively analyzed the impact of related influencing factors on lake area change, while the analysis on the changes of lake landscape and the lakefront RSEI was mainly based on field investigation, which may lack objectivity.
We will analyze the lake changes based on more remote sensing images, geospatial big datam and physicochemical parameters that can reflect the lake water quality in the future. An evaluation system of urban lakes will be constructed to estimate and identify the risk factors of lakes, better promoting the improvement of lake ecology.
5. Conclusions
This paper conducted an analysis using Wuhan as the study area to identify the evolutionary characteristics of multiple urban natural lakes and analyzed the factors affecting lake area change based on the remote sensing data from 1990 to 2019. The main findings are as follows: (1) from 1990 to 2019, the total water area in Wuhan and water area of 58 lakes decreased by 6.6% and 15.3%, respectively, and the decrease in lakes in downtown areas was more significant; the lake degradation in downtown areas was mainly caused by urban expansion, while in the suburbs, urban expansion and agricultural activities were the main drivers for lake degradation; (2) a worsening trend was found regarding lake landscape, with lake landscape complexity, edge density, mean patch area, and connectivity all impaired, while lakefront ecology demonstrated a trend of restoration in recent years, with the RSEI showing an increasing trend; (3) MGWR analysis showed that the specific influencing area of each factor varied spatially; specifically, the growth of the GDP and POP had a more positive influence on the restoration of lake bodies in all downtown districts and two suburb districts (Huangpi and Xinzhou), while the increase of POP led to lake loss in Jiangxia; the increase in the RSEI in lakefront was helpful for lake conservation; the growth of IS in lakefront generally led to lake loss, but it is helpful to the restoration of a few lakes, such as Tangxun Lake; the different impacts of socio-economic factors coincided with the different local government’s policies and public’s awareness of water protection in different time periods; HUM was more significant on lakes in Jiangxia, especially on Liangzi Lake and Futou lake; PRE contributed to lake restoration; and TEM caused area loss in most lakes.
The study deepens the understanding of the spatiotemporal evolutionary characteristics of multiple lakes in Wuhan, and the results provide useful references for sustainable urban lake management. However, due to unequal time intervals in data selection and inadequate analysis on the influence of urban expansion on lake area changes, the study still has some limitations. In the future, more metadata will be used to explore the impact of urban function change on multiple lakes in megacities further.
Author Contributions
Conceptualization, C.W. and Q.Z.; data curation, C.W.; formal analysis, C.W.; funding acquisition, Q.Z., D.Z. and H.Z.; investigation, C.W.; methodology, C.W.; project administration, Q.Z., D.Z. and H.Z.; resources, Q.Z., D.Z. and H.Z.; software, C.W.; supervision, Q.Z. and D.Z.; validation, C.W.; writing—original draft, C.W.; Writing—review & editing, C.W., Q.Z. and C.Y. All authors will be informed about each step of manuscript processing including submission, revision, revision reminder, etc. via emails from our system or the assigned Assistant Editor. All authors have read and agreed to the published version of the manuscript.
Funding
This research was funded by National Natural Science Foundation of China (No. 52078389), and the Consultancy Project for the Hubei Branch of Chinese Academy of Engineering (No. HB2019B14).
Institutional Review Board Statement
Not applicable.
Informed Consent Statement
Not applicable.
Data Availability Statement
Not applicable.
Acknowledgments
We are sincerely appreciated Zhiyu Fan for his help in data processing and the anonymous reviewers for their excellent comments and efforts.
Conflicts of Interest
The authors declare no conflict of interest.
References
- Cuffney, T.F.; Brightbill, R.A.; May, J.T.; Waite, I.R. Responses of benthic macroinvertebrates to environmental changes associated with urbanization in nine metropolitan areas. Ecol. Appl. 2010, 20, 1384–1401. [Google Scholar] [CrossRef] [PubMed]
- Irwin, E.G.; Bockstael, N.E. The evolution of urban sprawl: Evidence of spatial heterogeneity and increasing land fragmentation. Proc. Natl. Acad. Sci. USA 2007, 104, 20672–20677. [Google Scholar] [CrossRef] [PubMed] [Green Version]
- Xu, K.; Kong, C.; Liu, G.; Wu, C.; Deng, H.; Zhang, Y.; Zhuang, Q. Changes of urban wetlands in Wuhan, China, from 1987 to 2005. Prog. Phys. Geogr. 2010, 34, 207–220. [Google Scholar] [CrossRef]
- Grimm, N.B.; Faeth, S.H.; Golubiewski, N.E.; Redman, C.L.; Wu, J.; Bai, X.; Briggs, J.M. Global change and the ecology of cities. Science 2008, 319, 756–760. [Google Scholar] [CrossRef] [Green Version]
- Seto, K.C.; Satterthwaite, D. Interactions between urbanization and global environmental change. Curr. Opin. Sustain. 2010, 2, 127–128. [Google Scholar] [CrossRef]
- Suyadi, G.J.; Lundquist, C.J.; Schwendenmann, L. Characterizing landscape patterns in changing mangrove ecosystems at high, latitudes using spatial metrics. Estuar. Coast. Shelf Sci. 2018, 215, 1–10. [Google Scholar] [CrossRef]
- Liu, H.; Li, L.; Yin, C.; Shan, B. Fraction distribution and risk assessment of heavy metals in sediments of Moshui Lake. J. Environ. Sci. 2008, 20, 390–397. [Google Scholar] [CrossRef]
- Li, Y.; Zhao, S.; Zhao, K.; Xie, P.; Fang, J. Land-cover changes in an urban lake watershed in a mega-city, Central China. Environ. Monit. Assess. 2006, 115, 349–359. [Google Scholar] [CrossRef]
- Wang, X.L.; Ning, L.M.; Yu, J.; Xiao, R.; Li, T. Changes of urban wetland landscape pattern and impacts of urbanization on wetland in Wuhan City. Chin. Geogr. Sci. 2008, 18, 47–53. [Google Scholar] [CrossRef] [Green Version]
- Yu, X.; Ng, C. An integrated evaluation of landscape change using remote sensing and landscape metrics: A case study of Panyu, Guangzhou. Int. J. Remote Sens. 2006, 27, 1075–1092. [Google Scholar] [CrossRef]
- Yeo, I.-Y.; Lee, S.; Lang, M.W.; Yetemen, O.; McCarty, G.W.; Sadeghi, A.M.; Evenson, G. Mapping landscape-level hydrological connectivity of headwater wetlands to downstream waters: A catchment modeling approach—Part 2. Sci. Total Environ. 2019, 653, 1557–1570. [Google Scholar] [CrossRef]
- Maheshwari, B.L.; Simmons, B.L.; Singh, V.P. Role and Complexity of Integrated Water-Resources Management for Periurban Landscapes in Australia. J. Hydrol. Eng. 2012, 17, 229–236. [Google Scholar] [CrossRef]
- Bogard, M.J.; Donald, D.B.; Finlay, K.; Leavitt, P.R. Distribution and regulation of urea in lakes of central North America. Freshw. Biol. 2012, 57, 1277–1292. [Google Scholar] [CrossRef]
- Yang, M.N. The Impact of Urban Building Planning on Soil and Water Loss in the Peripheral Eco-environment. Ekoloji 2019, 28, 2521–2531. [Google Scholar]
- Wu, J.; Luo, J.M.; Tang, L. Coupling Relationship between Urban Expansion and Lake Change—A Case Study of Wuhan. Water 2019, 11, 1215. [Google Scholar] [CrossRef] [Green Version]
- Zhu, J.; Zhang, Q.; Tong, Z. Impact Analysis of Lakefront Land Use Changes on Lake Area in Wuhan, China. Water 2015, 7, 4869–4886. [Google Scholar] [CrossRef]
- Su, W.; Wu, J.; Zhu, B.; Chen, K.; Peng, W.; Hu, B. Health Evaluation and Risk Factor Identification of Urban Lakes—A Case Study of Lianshi Lake. Water 2020, 12, 1428. [Google Scholar] [CrossRef]
- Du, N.R.; Ottens, H.; Sliuzas, R. Spatial impact of urban expansion on surface water bodies—A case study of Wuhan, China. Landsc. Urban Plan. 2010, 94, 175–185. [Google Scholar] [CrossRef]
- Xie, C.; Huang, X.; Mu, H.; Yin, W. Impacts of Land-Use Changes on the Lakes across the Yangtze Floodplain in China. Environ. Sci. Technol. 2017, 51, 3669–3677. [Google Scholar] [CrossRef]
- Snortheim, C.A.; Hanson, P.C.; McMahon, K.D.; Read, J.S.; Carey, C.C.; Dugan, H.A. Meteorological drivers of hypolimnetic anoxia in a eutrophic, north temperate lake. Ecol. Model. 2017, 343, 39–53. [Google Scholar] [CrossRef] [Green Version]
- Chen, K.; Wang, X.; Li, D.; Li, Z. Driving force of the morphological change of the urban lake ecosystem: A case study of Wuhan, 1990–2013. Ecol. Model. 2015, 318, 204–209. [Google Scholar] [CrossRef]
- Lukawska-Matuszewska, K.; Urbanski, J.A. Prediction of near-bottom water salinity in the Baltic Sea using Ordinary Least Squares and Geographically Weighted Regression models. Estuar. Coast. Shelf Sci. 2014, 149, 255–263. [Google Scholar] [CrossRef]
- Sharma, V.; Rudnick, D.R.; Irmak, S. Development and evaluation of ordinary least squares regression models for predicting irrigated and rainfed maize and soybean yields. Trans. ASABE 2013, 56, 1361–1378. [Google Scholar]
- Duan, G.; Niu, R. Lake Area Analysis Using Exponential Smoothing Model and Long Time-Series Landsat Images in Wuhan, China. Sustainability 2018, 10, 149. [Google Scholar] [CrossRef] [Green Version]
- Sanchez, J.M. Linear calibrations in chromatography: The incorrect use of ordinary least squares for determinations at low levels, and the need to redefine the limit of quantification with this regression model. J. Sep. Sci. 2020, 43, 2708–2717. [Google Scholar] [CrossRef]
- Singh, R.K.; Khand, K.; Kagone, S.; Schauer, M.; Senay, G.B.; Wu, Z. A novel approach for next generation water-use mapping using Landsat and Sentinel-2 satellite data. Hydrol. Sci. J. 2020, 65, 2508–2519. [Google Scholar] [CrossRef]
- Haq, M.A.; Rahaman, G.; Baral, P.; Ghosh, A. Deep Learning Based Supervised Image Classification Using UAV Images for Forest Areas Classification. J. Indian Soc. Remote Sens. 2020, 49, 601–606. [Google Scholar] [CrossRef]
- Harris, P.; Fotheringham, A.S.; Crespo, R.; Charlton, M. The Use of Geographically Weighted Regression for Spatial Prediction: An Evaluation of Models Using Simulated Data Sets. Math. Geosci. 2010, 42, 657–680. [Google Scholar] [CrossRef]
- Harris, P.; Brunsdon, C.; Fotheringham, A.S. Links, comparisons and extensions of the geographically weighted regression model when used as a spatial predictor. Stoch. Environ. Res. Risk Assess. 2011, 25, 123–138. [Google Scholar] [CrossRef] [Green Version]
- Birk, S.; Ecke, F. The potential of remote sensing in ecological status assessment of coloured lakes using aquatic plants. Ecol. Indic. 2014, 46, 398–406. [Google Scholar] [CrossRef]
- Yan, J.; Shi, W.; Li, F. Evaluation and Countermeasures of the Implementation of the Lake Protection and Governance System in Wuhan City, Middle China. Sustainability 2018, 10, 3379. [Google Scholar] [CrossRef] [Green Version]
- Liang, W.; Chun, X.; Liu, J.; Bai, X.; Siqin, B.; Wu, Z.; Song, J. Research on the area change processes in the past 40a of Daihai Lake. J. Arid Land Resour. Environ. 2017, 31, 93–98. [Google Scholar]
- Zhang, H.; Tao, S.; Tang, Z.; Fang, J. Lake Area Changes in Jing-Jin-Ji Region in Recent 30 Years. Acta Sci. Nat. Univ. Pekin. 2020, 56, 324–330. [Google Scholar]
- Xu, H.Q.; Wang, M.Y.; Shi, T.T.; Guan, H.D.; Fang, C.Y.; Lin, Z.L. Prediction of ecological effects of potential population and impervious surface increases using a remote sensing based ecological index (RSEI). Ecol. Indic. 2018, 93, 730–740. [Google Scholar] [CrossRef]
- Xu, H.Q.; Wang, Y.F.; Guan, H.D.; Shi, T.T.; Hu, X.S. Detecting Ecological Changes with a Remote Sensing Based Ecological Index (RSEI) Produced Time Series and Change Vector Analysis. Remote Sens. 2019, 11, 2345. [Google Scholar] [CrossRef] [Green Version]
- Ning, L.; Wang, J.Y.; Fen, Q. The improvement of ecological environment index model RSEI. Arab. J. Geosci. 2020, 13, 1–14. [Google Scholar] [CrossRef]
- Wen, X.; Ming, Y.; Gao, Y.; Hu, X. Dynamic Monitoring and Analysis of Ecological Quality of Pingtan Comprehensive Experimental Zone, a New Type of Sea Island City, Based on RSEI. Sustainability 2020, 12, 21. [Google Scholar] [CrossRef] [Green Version]
- Xiang, W.-N. GIS-based riparian buffer analysis: Injecting geographic information into landscape planning. Landsc. Urban Plan. 1996, 34, 1–10. [Google Scholar] [CrossRef]
- Fang, C.; Li, G.; Wang, S. Changing and Differentiated Urban Landscape in China: Spatiotemporal Patterns and Driving Forces. Environ. Sci. Technol. 2016, 50, 2217–2227. [Google Scholar] [CrossRef] [PubMed]
- Baig, M.H.A.; Zhang, L.; Shuai, T.; Tong, Q. Derivation of a tasselled cap transformation based on Landsat 8 at-satellite reflectance. Remote Sens. Lett. 2014, 5, 423–431. [Google Scholar] [CrossRef]
- Crist, E.P. A TM tasseled cap equivalent transformation for reflectance factor data. Remote Sens. Environ. 1985, 17, 301–306. [Google Scholar] [CrossRef]
- Yu, X.; Guo, X.; Wu, Z. Land Surface Temperature Retrieval from Landsat 8 TIRS-Comparison between Radiative Transfer Equation-Based Method, Split Window Algorithm and Single Channel Method. Remote Sens. 2014, 6, 9829–9852. [Google Scholar] [CrossRef] [Green Version]
- Breiman, L. Random forests. Mach. Learn. 2001, 45, 5–32. [Google Scholar] [CrossRef] [Green Version]
- Wang, J.; Cai, X.; Chen, F.; Zhang, Z.; Zhang, Y.; Sun, K.; Zhang, T.; Chen, X. Hundred-year spatial trajectory of lake coverage changes in response to human activities over Wuhan. Environ. Res. Lett. 2020, 15, 094022. [Google Scholar] [CrossRef]
- Ding, L.; Chen, K.L.; Cheng, S.G.; Wang, X. Water ecological carrying capacity of urban lakes in the context of rapid urbanization: A case study of East Lake in Wuhan. Phys. Chem. Earth 2015, 89–90, 104–113. [Google Scholar] [CrossRef]
- Zhan, Q.; Yue, Y.; Xiao, Y. Evolution of built-up area expansion and verification of planning implementation in Wuhan. City Plan. Rev. 2018, 42, 63–71. [Google Scholar]
- Lawson, L.A.; Martino, R.; Nguyen-Van, P. Environmental convergence and environmental Kuznets curve: A unified empirical framework. Ecol. Model. 2020, 437, 109289. [Google Scholar] [CrossRef]
- Matsushita, B.; Xu, M.; Fukushima, T. Characterizing the changes in landscape structure in the Lake Kasumigaura Basin, Japan using a high-quality GIS dataset. Landsc. Urban Plan. 2006, 78, 241–250. [Google Scholar] [CrossRef]
- Nagendra, H.; Ostrom, E. Applying the social-ecological system framework to the diagnosis of urban lake commons in Bangalore, India. Ecol. Soc. 2014, 19, 67. [Google Scholar] [CrossRef]
- Jin, M. Interpolation of surface radiative temperature measured from polar orbiting satellites to a diurnal cycle. 2. Cloudy-pixel treatment. J. Geophys. Res. 2000, 105, 4061–4076. [Google Scholar] [CrossRef]
- D’Souza, R.; Nagendra, H. Changes in Public Commons as a Consequence of Urbanization: The Agara Lake in Bangalore, India. Environ. Manag. 2011, 47, 840–850. [Google Scholar] [CrossRef]
- Brinkmann, K.; Hoffmann, E.; Buerkert, A. Spatial and Temporal Dynamics of Urban Wetlands in an Indian Megacity over the Past 50 Years. Remote Sens. 2020, 12, 662. [Google Scholar] [CrossRef] [Green Version]
- Vaz, E. Managing urban coastal areas through landscape metrics: An assessment of Mumbai’s mangrove system. Ocean Coast. Manag. 2014, 98, 27–37. [Google Scholar] [CrossRef]
- Hettiarachchi, M.; Morrison, T.H.; Wickramsinghe, D.; Mapa, R.; De Alwis, A.; McAlpine, C.A. The eco-social transformation of urban wetlands: A case study of Colombo, Sri Lanka. Landsc. Urban Plan. 2014, 132, 55–68. [Google Scholar] [CrossRef]
- Sen, A.; Nagendra, H. Local community engagement, environmental placemaking and stewardship by migrants: A case study of lake conservation in Bengaluru, India. Landsc. Urban Plan. 2020, 204, 103933. [Google Scholar] [CrossRef]
- Zhang, Z.; Tan, S.; Tang, W. A GIS-based spatial analysis of housing price and road density in proximity to urban lakes in Wuhan City, China. Chin. Geogr. Sci. 2015, 25, 775–790. [Google Scholar] [CrossRef] [Green Version]
- Menglin, J.; Dickinson, R.E. Interpolation of surface radiative temperature measured from polar orbiting satellites to a diurnal cycle. 1. Without clouds. J. Geophys. Res. 1999, 104, 2105–2116. [Google Scholar] [CrossRef] [Green Version]
- Shojaeian, M.R.; Karimidastenaei, Z.; Rahmati, O.; Haghighi, A.T. Assessing morphological changes in a human-impacted alluvial system using hydro-sediment modeling and remote sensing. Int. J. Sediment Res. 2021, 36, 439–448. [Google Scholar] [CrossRef]
- Xia, M.; Dong, S.; Chen, Y.; Liu, H. Study on evolution of groundwater-lake system in typical prairie open-pit coal mine area. Environ. Geochem. Health 2021. online ahead of print. [Google Scholar] [CrossRef]
- Chipman, J.W.; Lillesand, T.M. Satellite-based assessment of the dynamics of new lakes in southern Egypt. Int. J. Remote Sens. 2007, 28, 4365–4379. [Google Scholar] [CrossRef]
Figure 1.
(a) Location overview of Wuhan City; (b) Distribution of Key Lakes in Wuhan.

Figure 2.
Statistics of Water Area in Downtown and Suburb Districts from 1990 to 2019.

Figure 3.
Statistics of Water Area of 58 lakes from 1990 to 2019.

Figure 4.
Variations of PAFRAC of Key Lakes from 1990 to 2019.

Figure 5.
Variations of Average RSEI in Lakefront of Key Lakes from 1990 to 2018.

Figure 6.
Spatial Coefficients of GDP, POP, IS, and RSEI. If there are multiple panels, they should be listed as: (a) Spatial Coefficients of GDP; (b) Spatial Coefficients of POP; (c) Spatial Coefficients of IS; (d) Spatial Coefficients of RSEI.
Figure 6.
Spatial Coefficients of GDP, POP, IS, and RSEI. If there are multiple panels, they should be listed as: (a) Spatial Coefficients of GDP; (b) Spatial Coefficients of POP; (c) Spatial Coefficients of IS; (d) Spatial Coefficients of RSEI.

Figure 7.
Spatial Coefficients of TEM, HUM, and PRE. (a) Spatial Coefficients of TEM; (b) Spatial Coefficients of HUM; (c) Spatial Coefficients of PRE.
Figure 7.
Spatial Coefficients of TEM, HUM, and PRE. (a) Spatial Coefficients of TEM; (b) Spatial Coefficients of HUM; (c) Spatial Coefficients of PRE.


Table 1.
List of key lakes in Wuhan.
| Administrative Districts | Lakes | |
|---|---|---|
| Downtown | Hanyang | Longyang Lake, Moshui Lake, Sanjiao Lake, South Taizi Lake, Wanjia Lake, Yue Lake |
| Hongshan | Huangjia Lake, Qingling Lake, South Lake, Ye Lake, Yezhi Lake | |
| Jiang’an | Huangtan Lake | |
| Qiaokou | Zhangbi Lake | |
| Qingshan | Qingshanbei Lake, Yanxi Lake | |
| Wuchang | East Lake, Sha Lake | |
| Suburb | Caidian | Chen Lake, Guanlian Lake, Houguan Lake, Lanni Lake, North Taizi Lake, Tong Lake, Wangjiashe Lake, West Lake, Xiaozha Lake, Xujiasai Lake (part), Zhangjiada Lake, Zhushan Lake |
| Dongxihu | Dugong Lake, Jinyin Lake | |
| Hannan | Northwest Lake, Tang Lake | |
| Huangpi | Hou Lake, Majia Lake, Mojia Lake, Renkai Lake, Shizi Lake, Tongjia Lake (part), Wu Lake, Yaozihai Lake (part), Meidian Reservoir, Nihe Reservoir, Xiajiasi Reservoir, Yuanjisi Reservoir | |
| Jiangxia | Baoshu Lake (part), Futou Lake, Houshi Lake, Liangzi Lake (part), Lu Lake, Tangxun Lake, Tuandun Lake, Yandong Lake | |
| Xinzhou | Anren Lake, Chaibo Lake, Qi Lake, Taojiada Lake, Zhangdu Lake | |
Table 2.
The image data set.
| Date | Sensor | Spatial Resolution (m) |
|---|---|---|
| 2 September 1990 | Thematic Mapper (TM) | Bands 1–5 and 7: 30 m; Band 6: 120 m |
| 31 August 1995 | Thematic Mapper (TM) | |
| 18 June 2000 | Thematic Mapper (TM) | |
| 20 April 2005 | Thematic Mapper (TM) | |
| 8 August 2014 | Operational Land Imager (OLI) | Bands 1–5 and 7: 30 m; Band 6: 60 m |
| 12 September 2019 | Multispectral Instrument Imagery (MSI) | Band 1: 60 m, Bands 2–4: 10 m, Bands 5–7: 20 m |
Table 3.
Equations of NDBSI, WET, NDVI, LST, and RSEI.
| Metrics | Abbreviation | Equation | Equation Number | Description |
|---|---|---|---|---|
| Normal Difference Built-up and Soil Index | NDBSI | (1) | , , , and , are blue band, green band, near-infrared band, and red band of the images; and are mid infrared band 1 and mid infrared band 2 of the images. | |
| (2) | ||||
| (3) | ||||
| wetness | WET | (4) | ||
| (5) | ||||
| Normal Difference Vegetation Index | NDVI | (6) | ||
| Land Surface Temperature | LST | (7) | L6 is the radiation value of the thermal infrared band sensor; gain and bias are 6-band gain and bias values; K1 and K2 are calibration parameters; ; T is the temperature value at the sensor; λ is the central wavelength of thermal infrared band; Ɛ6 is the emissivity. | |
| (8) | ||||
| (9) | ||||
| (10) | ||||
| Remote Sensing Ecological Index | RSEI | (11) | I is the original value of NDVI, WET, LST, NDBSI; Imax and Imin are the maximum and minimum values of the indicator; NI is the normalized index. | |
| (12) | ||||
| (13) |
Table 4.
Equations of OLS, GWR, MGWR.
| Regression Model | Equation | Equation Number | Description |
|---|---|---|---|
| OLS | (16) | Y is the dependent variable; β0 is the intercept; βk is the estimation coefficient of Xk; n is the number of independent variables; Ɛ is the random error item. | |
| GWR | (17) | (ui, vi) is the coordinate of local sampling location; βk(ui, vi) is the estimation coefficient of Xk at (ui, vi); β0(ui, vi) is the intercept at (ui, vi); Ɛi is the random error at (ui, vi); W(ui, vi) is the spatial weight of the adjacence relationship between each sampling location and the location (ui, vi); dij is the Euclidean distance between location i and j. bi is the adaptive bandwidth of i. | |
| (18) | |||
| (19) | |||
| MGWR | (20) | bw0 is the bandwidth of intercept and bwk is the bandwidth of variable k. |
Table 5.
Statistics of Land Use Data in Wuhan from 1990 to 2019.
| Year | Impervious Surface (km2) | Water Body (km2) | Agricultural Land (km2) | Vegetation (km2) | Unused Land (km2) |
|---|---|---|---|---|---|
| 1990 | 736.95 | 1422.48 | 3599.04 | 2622.16 | 188.52 |
| 1995 | 934.04 | 1439.62 | 3599.04 | 2425.07 | 171.38 |
| 2000 | 1113.99 | 1405.34 | 3770.43 | 2108.01 | 171.38 |
| 2005 | 1328.22 | 1385.37 | 3487.64 | 2219.41 | 148.50 |
| 2014 | 2613.59 | 1285.37 | 3084.89 | 1465.33 | 119.97 |
| 2019 | 3076.33 | 1328.22 | 2313.67 | 1748.11 | 102.83 |
Table 6.
Ranges of Relative Change Rate of 58 Lakes from 1990 to 2019.
| Range of Relative Change Rate | Number of Lakes |
|---|---|
| −81% < relative change rate < −50% | 3 |
| −50% < relative change rate < −20% | 15 |
| −20% < relative change rate < 0% | 31 |
| 0% < relative change rate < 5% | 5 |
| 5% < relative change rate < 10% | 4 |
Table 7.
Top 10 Lakes with the Highest Reduction Rate from 1990 to 2019.
| Lake | Administrative District | Relative Reduction Rate |
|---|---|---|
| Zhangbi Lake | Qiaokou | 80.63% |
| Sha Lake | Wuchang | 62.02% |
| Wanjia Lake | Hanyang | 55.06% |
| Qi Lake | Xinzhou | 40.33% |
| South Taizi Lake | Hanyang | 40.31% |
| North Taizi Lake | Caidian | 34.80% |
| Zhangjiada Lake | Caidian | 32.80% |
| Yue Lake | Hanyang | 31.65% |
| Ye Lake | Hongshan | 31.40% |
| Tang Lake | Hannan | 30.99% |
Table 8.
The Conversion of Shrinking Lake Area in Downtown and Suburb Districts from 1990 to 2019.
| Administrative Districts | Impervious Surface (%) | Agricultural Land (%) | Vegetation (%) | Unused Land (%) | |
|---|---|---|---|---|---|
| Downtown | Hanyang | 52 | 30 | 14 | 4 |
| Hongshan | 43 | 30 | 17 | 10 | |
| Jiang’an | 34 | 8 | 46 | 12 | |
| Jianghan | 92 | 1 | 4 | 3 | |
| Qingshan | 51 | 23 | 14 | 12 | |
| Qiaokou | 71 | 13 | 15 | 1 | |
| Wuchang | 62 | 21 | 15 | 3 | |
| Suburb | Caidian | 35 | 47 | 15 | 3 |
| Dongxihu | 50 | 23 | 19 | 8 | |
| Hannan | 33 | 38 | 26 | 3 | |
| Huangpi | 34 | 34 | 15 | 7 | |
| Jiangxia | 17 | 66 | 16 | 1 | |
| Xinzhou | 18 | 57 | 22 | 3 | |
Table 9.
Statistics of Lake Landscape Indexes from 1990 to 2019.
| Year | PAFRAC | ED | MPA (km2) | AI | COHESION |
|---|---|---|---|---|---|
| 1990 | 1.37 | 17.16 | 11.42 | 99.24 | 94.67 |
| 1995 | 1.38 | 16.28 | 10.13 | 98.85 | 90.05 |
| 2000 | 1.35 | 12.23 | 3.28 | 98.00 | 86.75 |
| 2005 | 1.36 | 11.07 | 3.80 | 97.79 | 87.18 |
| 2014 | 1.33 | 11.82 | 3.59 | 97.72 | 88.75 |
| 2019 | 1.31 | 12.41 | 2.66 | 97.70 | 84.31 |
Table 10.
Mean Value of RSEI in Lakefront of Key Lakes in Downtown and Suburb Districts.
| RESI | 1990 | 1995 | 2000 | 2005 | 2014 | 2018 1 |
|---|---|---|---|---|---|---|
| Downtown | 0.28 | 0.21 | 0.21 | 0.22 | 0.35 | 0.32 |
| Suburb | 0.40 | 0.32 | 0.32 | 0.35 | 0.44 | 0.40 |
1 Due to data reasons, 2018 Landsat images were used instead of 2019 images for calculation.
Table 11.
Performance of OLS, GWR, and MGWR.
| Regression Methods | R2 | RSS | AICc |
|---|---|---|---|
| OLS | 0.041 | 382.726 | 1146.665 |
| GWR | 0.720 | 88.119 | 770.895 |
| MGWR | 0.857 | 47.043 | 470.079 |
Table 12.
Statistics of the Coefficients in the MGWR Model.
| Independent Variable | Mean Value | Standard Deviation | Minimum Value | Maximum Value | Bandwidth |
|---|---|---|---|---|---|
| GDP | 0.005 | 0.002 | 0.002 | 0.012 | 393 |
| POP | -0.031 | 0.171 | −1.1 | 0.281 | 50 |
| IS | -0.028 | 0.208 | −1.495 | 0.237 | 50 |
| RSEI | 0.027 | 0.224 | −0.209 | 1.564 | 50 |
| PRE | 0.007 | 0.003 | 0.003 | 0.014 | 393 |
| HUM | 0.204 | 0.639 | −0.22 | 4.613 | 393 |
| TEM | −0.005 | 0.005 | −0.015 | 0.007 | 393 |
Publisher’s Note: MDPI stays neutral with regard to jurisdictional claims in published maps and institutional affiliations. |
© 2021 by the authors. Licensee MDPI, Basel, Switzerland. This article is an open access article distributed under the terms and conditions of the Creative Commons Attribution (CC BY) license (https://creativecommons.org/licenses/by/4.0/).
Share and Cite
MDPI and ACS Style
Wen, C.; Zhan, Q.; Zhan, D.; Zhao, H.; Yang, C. Spatiotemporal Evolution of Lakes under Rapid Urbanization: A Case Study in Wuhan, China. Water 2021, 13, 1171. https://doi.org/10.3390/w13091171
AMA Style
Wen C, Zhan Q, Zhan D, Zhao H, Yang C. Spatiotemporal Evolution of Lakes under Rapid Urbanization: A Case Study in Wuhan, China. Water. 2021; 13(9):1171. https://doi.org/10.3390/w13091171
Chicago/Turabian StyleWen, Chao, Qingming Zhan, De Zhan, Huang Zhao, and Chen Yang. 2021. "Spatiotemporal Evolution of Lakes under Rapid Urbanization: A Case Study in Wuhan, China" Water 13, no. 9: 1171. https://doi.org/10.3390/w13091171
Note that from the first issue of 2016, this journal uses article numbers instead of page numbers. See further details here.