
Effects of Ferrihydrite-Impregnated Powdered Activated Carbon on Phosphate Removal and Biofouling of Ultrafiltration Membrane


1
Department of Environmental Engineering, Faculty of Engineering, Chulalongkorn University, 254 Phayathai Road, Wangmai, Pathumwan, Bangkok 10330, Thailand
2
Department of Urban Engineering, Graduate School of Engineering, The University of Tokyo, 7-3-1 Hongo, Bunkyo-ku, Tokyo 113-8656, Japan
*
Author to whom correspondence should be addressed.
Water 2021, 13(9), 1178; https://doi.org/10.3390/w13091178
Submission received: 28 March 2021
/
Revised: 12 April 2021
/
Accepted: 18 April 2021
/
Published: 24 April 2021
(This article belongs to the Special Issue Water Pollution and Sanitation)
Abstract
:The presence of multiple contaminant species in surface waters makes surface water treatment difficult to accomplish through a single process. Herein, we evaluated the ability of an integrated adsorption/ultrafiltration (UF) membrane filtration system to simultaneously remove phosphates and dissolved organic matter (DOM). When bare powdered activated carbon (PAC) and PAC impregnated with amorphous ferrihydrite (FHPAC) adsorbents were compared, FHPAC showed a greater adsorption rate and capacity for phosphate. FHPAC had a phosphate adsorption capacity of 2.32 mg PO43−/g FHPAC, even when DOM was present as a competing adsorbate. In a lab-scale hybrid FHPAC-UF system (i.e. integrated adsorption by FHPAC with UF membrane filtration), irreversible membrane fouling was ca. three times lower than that in a PAC-UF system. When membrane fouling in the PAC-UF system was described with pore blockage models, we found that the main cause of fouling was bacterial deposition on the membrane surface. CLSM analysis determined that the chemical composition of foulants in the PAC-UF system included higher proportions of proteins, nucleic acids, and alpha-polysaccharides than that in the FHPAC-UF system. Overall, FHPAC’s ability to undergo ligand exchanges with DOM helped to reduce the nutrients and bacteria that cause biofouling to accumulate on the membrane surface.
1. Introduction
Surface waters are always contaminated by multiple species, making them difficult to be treated and purified by a single unit process [1]. One strategy of treating surface waters is to couple membrane technologies with another unit process, such as adsorption or ion exchange [2]. Membranes are increasingly being considered in treatment systems because they reject nearly all pathogenic microbes and colloidal particles, leaving only dissolved contaminants for any accompanying adsorption process units to treat. Unfortunately, membrane fouling is the greatest obstacle that hinders technologies such as microfiltration (MF) or ultrafiltration (UF) from being used [3]. When MF or UF are used in treating natural waters, the main culprits of membrane fouling are dissolved organic matter (DOM), which is the dissolved fraction of natural organic matter (NOM).
The potential of using ferrihydrite (FH) as an adsorption pretreatment to alleviate membrane fouling has been studied before [4]. FH, an amorphous iron oxide particle, has a high adsorption affinity that gives it potential to be used as an adsorbent. FH has been represented by various chemical formulae in the literature, such as Fe(OH)3 nH2O [5] or Fe10O14(OH)2 [6]; however, these formulae are basically equivalent to FeOOH·0.4 H2O [7]. The ideal structure of FH was proposed by Michel [6], which consists of 20% FeO4 and 80% FeO6 polyhedral. As an adsorbent, FH has been used for the removal of arsenic and phosphate from contaminated groundwater [8,9,10] and surface water [11]. However, most relevant to the issue of membrane fouling, NOM can also be adsorbed by FH through a ligand exchange mechanism that is especially prevalent in acidic conditions [5]. Examples of this include the reaction of humic and fulvic acids, through their respective carboxyl and hydroxyl groups, with FH to form stable complexes.
The performance of hybrid adsorption–membrane filtration processes strongly depends on several factors, such as adsorbent dose, relative size of adsorbent to membrane pores, membrane properties, backflushing frequency, reactor size and configuration, mode of filtration, and DOM concentrations and characteristics [12,13,14,15]. Research into the removal of DOM and organic contaminants using an iron-impregnated powdered activated carbon (PAC) adsorbent already exists [16]. To prevent pore blocking or inner-pore constrictions, the size of the adsorbent should be ca. 2–3 orders of magnitude greater than the size of the membrane pores; Amaral [17] reported that although smaller PAC particles adsorb contaminants better than larger ones do, they also caused greater flux decline through the membrane. Particle charges are also a factor in the performance of hybrid adsorption/membrane filtration systems; for example, Yang [4] found that the deposition of positively charged ferrihydrite particles on the surface of a negatively charged high-flux polyethersulfone (PES) membrane exacerbated membrane fouling.
To complement these previous studies, specifically investigating the fouling behavior and biofouling characteristics of the membranes in hybrid adsorption–membrane filtration processes would be greatly beneficial in improving the removal efficiency and increasing the membranes’ operating time in these systems. Some researchers have expanded the concept of using iron-impregnated adsorbents to treat other contaminants, specifically phosphates, that are present in the contaminated waters at the same time [4]. However, to date, no research exists on the simultaneous removal of DOM and phosphate by iron-impregnated PAC. Therefore, this study investigated the simultaneous removal of DOM and phosphate using a hybrid ferrihydrite/PAC-UF (FHPAC-UF) system and assessed the effects that using FHPAC to pretreat contaminated waters had on membrane fouling. We evaluated the FHPAC-UF system’s membrane fouling behavior and mechanism and biofouling characteristics through several techniques, including surface morphology, elemental analysis, and macroscopic/microscopic characterization of biofilms and membrane fouling.
2. Materials and Methods
2.1. Synthesis of FHPAC
FHPAC was synthesized using a previously reported and patented method [16,18,19]. Exactly 2.0 g of pre-washed PAC (Norit DARCO S-51, Marshall, TX, USA) was placed in a PTFE flask, to which 30 mL of 0.1 M Fe(NO3)2·9H2O solution was added. The solution was agitated using a magnetic stirrer for 1 h at 200 rpm, followed by drying at 40 °C. After completely drying, approx. 10 mL of Milli-Q water was added to the flask content. The solution pH was adjusted to 7.0–8.0 by adding 2.0 M of NaOH solution dropwise. The solid FHPAC was collected by centrifugation at 3000 rpm for 10 min and washed with Milli-Q water to remove any salts until the supernatant’s electrical conductivity was less than 10 µS/cm. Finally, the FHPAC was dried at 40 °C again and stored in a desiccator until use.
2.2. Preparation of Feed Solutions
Phosphate solutions of different concentrations were used for adsorption kinetics and isotherm tests. Vendor-supplied KH2PO4 (KEMAUS, Cherrybrook, NSW, Australia) was dissolved in deionized water; then, the solution pH was measured with a pH meter (FiveEasy Plus, Mettler Toledo, LLC., Columbus, OH, USA) and adjusted to 7.0 (±0.1) by adding 0.1 N HCl (QRëCTM, New Zealand) or NaOH (KEMAUS, Cherrybrook, NSW, Australia) dropwise as needed.
Solutions containing a combination of D-Glucose (KEMAUS, Cherrybrook, NSW Australia) and KH2PO4 were used to evaluate the simultaneous adsorption of DOM and phosphate. They were prepared in a similar fashion to the pure phosphate solutions as described above. For the membrane filtration test, tap water was used as the solvent with D-Glucose acting as the DOM, KH2PO4 as the phosphorus source, and NH4Cl (KEMAUS, Cherrybrook, NSW, Australia) as the nitrogen source. The tap water quality is reported in Table S1, as provided by the Metropolitan Waterworks Authority (Bangkok, Thailand). All chemicals and reagents used in this study were of analytical reagent grade or higher (purity ≥ 99%).
Bacillus subtilis TISTR 1248 (Gram-positive) was used to introduce biological activity into the feed solutions as well as enhance the biological fouling in the membrane filtration test. The initial B. subtilis strain was obtained from the Thailand Institute of Scientific and Technological Research (Pathum Thani, Thailand). Once received, the strain was cultivated in NB medium (HiMedia®, Mumbai, India) based on previously reported procedures until a final optical density at 600 nm (OD600) of 0.40 ± 0.05 (ca. 108 CFU/mL) was obtained. This cultured bacterial suspension was then injected into various feedwaters as needed.
2.3. Batch Adsorption of DOM and Phosphate
We performed adsorption kinetic tests of the DOM and phosphate on PAC and FHPAC adsorbents. In each experimental setup, 0.2 g/L of PAC or FHPAC adsorbents were added to DOM/phosphate-containing solutions in conical flasks. The suspensions were held at room temperature and agitated with a shaker at 200 rpm. The amount of adsorbed phosphate per unit amount of dosed adsorbent (qt) at a given time (t) was calculated based on measured experimental data. All kinetic experiments were performed in triplicate. The experimental data were fitted to the pseudo-first-order and pseudo-second-order models expressed by Equations (1) and (2).
Pseudo-first-order model:
Pseudo-second-order model:
where qt and qe are the instantaneous and equilibrium adsorption capacities (mg/g), respectively; and k1 and k2 are the pseudo- first-order (min−1) and pseudo-second-order rate constants (g mg−1 min−1), respectively. Thus, the adsorption time t was measured in units of min.
Isotherm tests were conducted in an almost identical manner as the kinetic tests, except with various amounts of adsorbates being added to the experimental suspension. Results from the above kinetic tests were used to determine the time it took suspensions to reach equilibrium. Once there was confidence that an equilibrium was reached, we measured the equilibrium adsorption capacity (qe) and the equilibrium liquid phase concentration (Ce) of each suspension. Isotherm experiments were also performed in triplicate. To determine the mechanisms of DOM/phosphate adsorption onto PAC and FHPAC, the commonly used Langmuir and Freundlich adsorption isotherms were applied; these models are given by Equations (3) and (4).
Langmuir isotherm:
Freundlich isotherm:
where qm (mg/g) is the theoretical maximum adsorption capacity, KL (L/mg) is the Langmuir isotherm constant, Ce is the equilibrium liquid phase concentration (mg/L), KF (L/mg) is the Freundlich isotherm constant, and n is the heterogeneity factor indicating the adsorption intensity of the adsorbent.
2.4. Membrane Filtration Processes
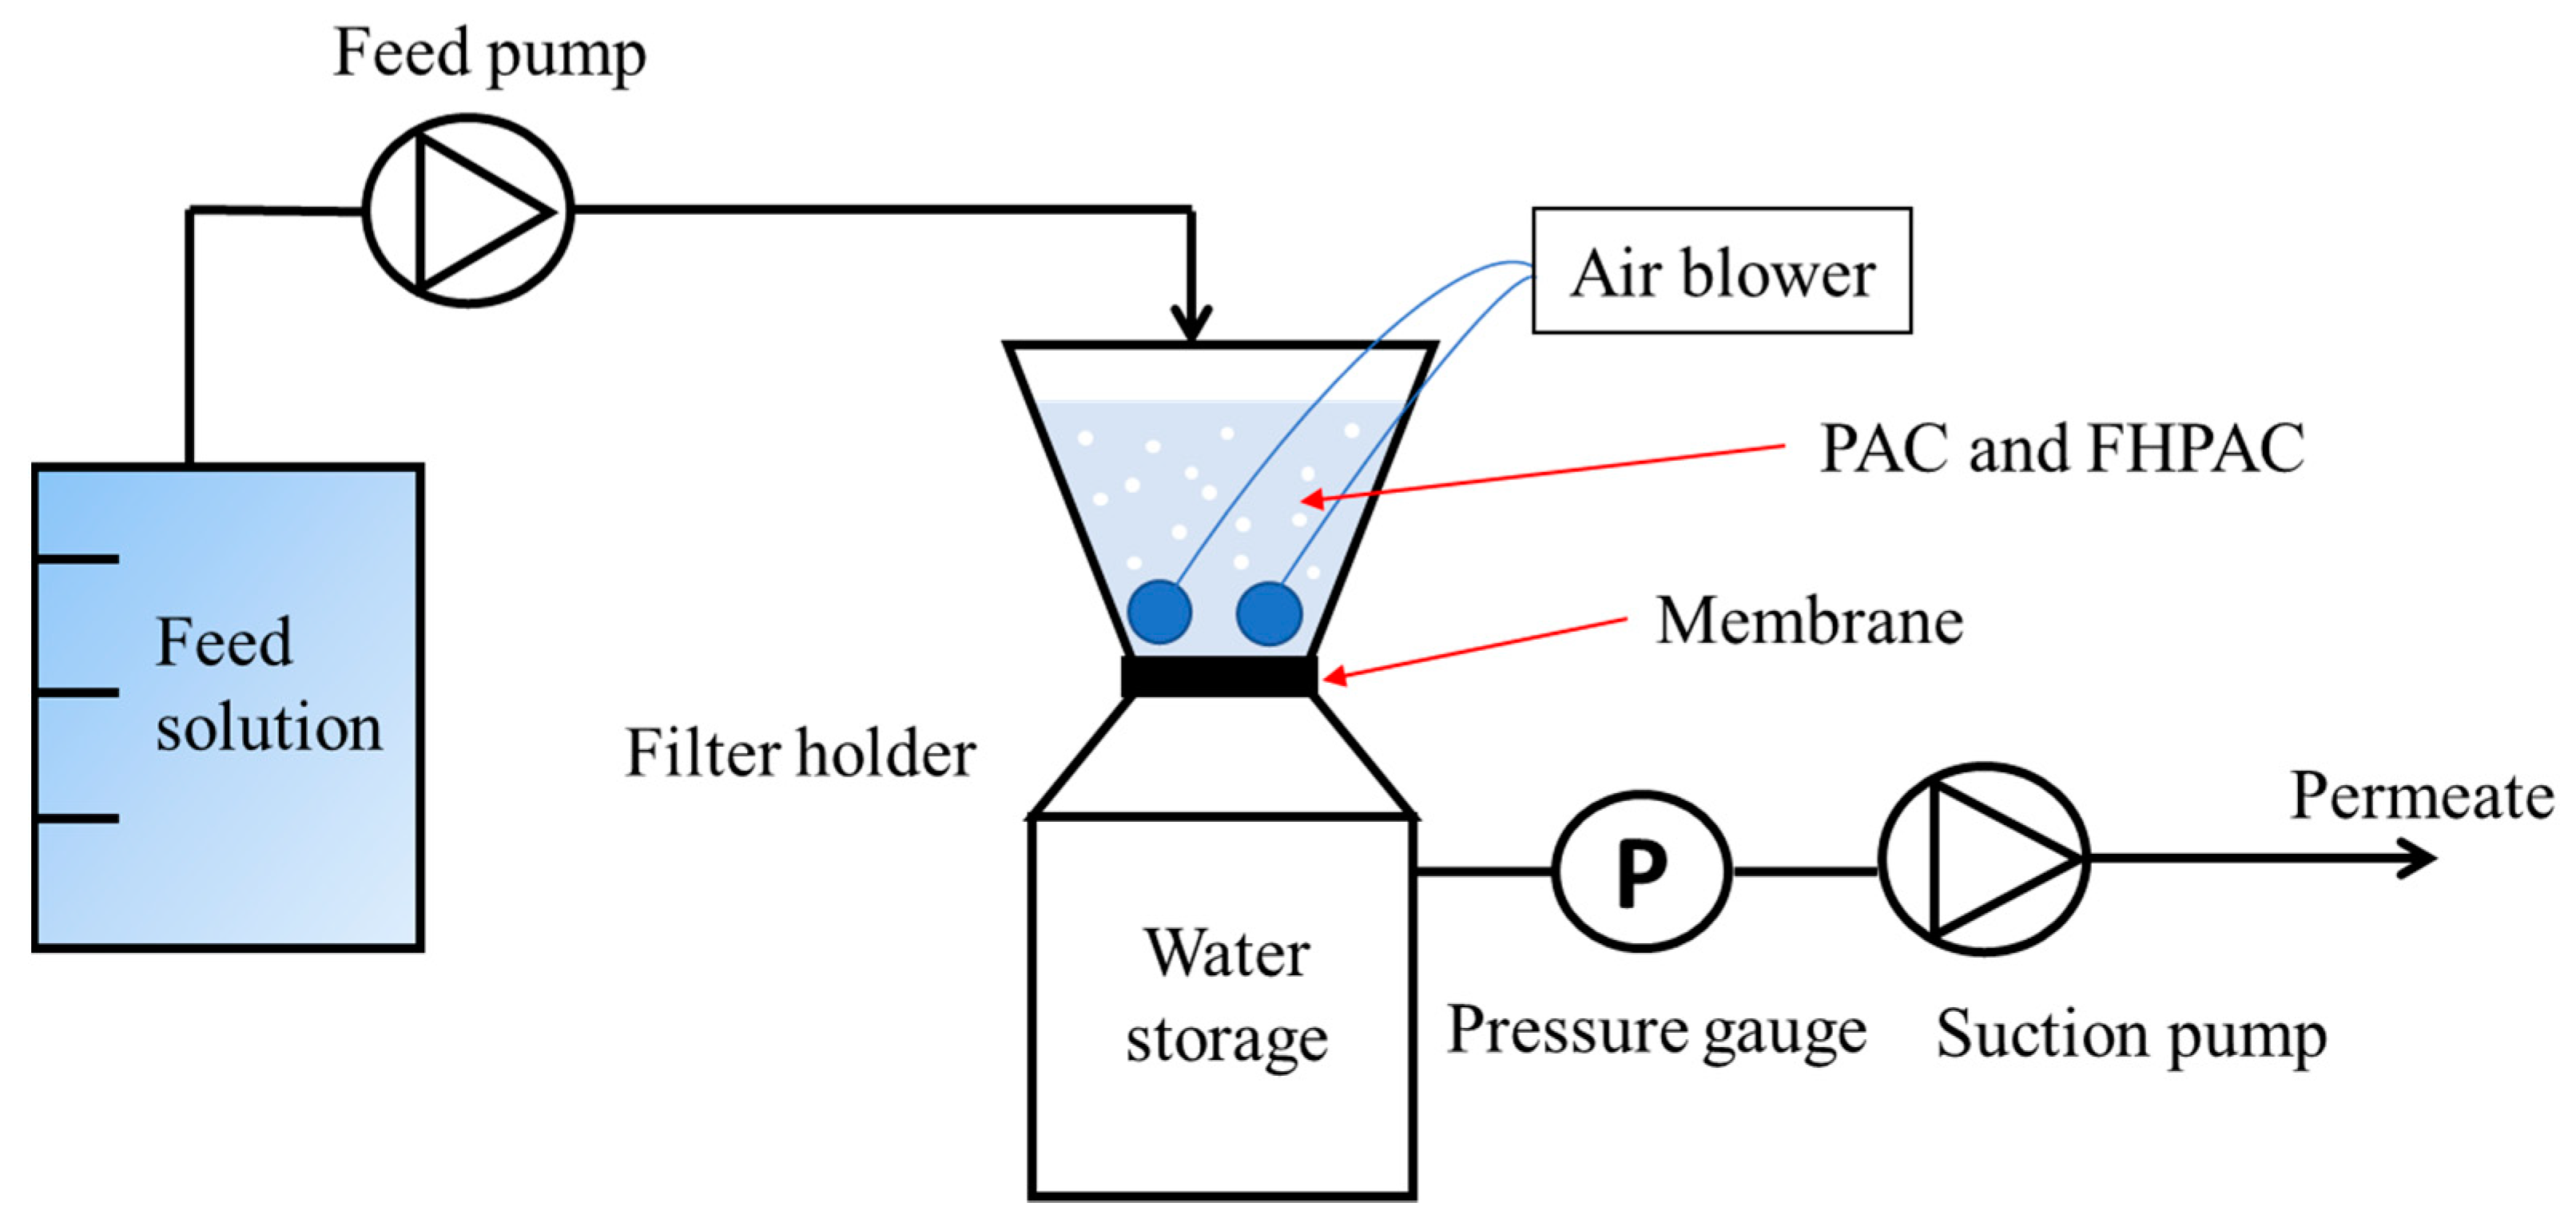
Polyacrylonitrile (PAN) UF membranes (SUEZ (GETM), Sterlitech, WA, USA) with a molecular weight cut-off ca. 50 kDa and an effective filtration area of 13.4 cm2 were used in our bench-scale UF system. The filtration experiment set-up is illustrated in Figure 1. The membranes were held in place by reusable polysulfone filter holders (Thermo Scientific Nalgene®, Waltham, MA, USA). Prior to use, the membranes were placed in DI water for 24 h to remove any wetting agents and production residues. Membrane filtration tests were performed at a constant trans-membrane pressure (TMP) of 50 kPa. Filtrate flux was calculated from the volume of water that permeated through the membrane over the operating time. The permeability of DI water through the membrane was 194.6 L/m2·h·bar.
At the beginning of the filtration experiment, 100 mg of PAC or FHPAC (0.2 g adsorbents/L) was added into the filtration chamber. A peristaltic pump fed feedwater into the upper chamber (500 mL storage). An aeration unit was used to keep adsorbents in suspension and also to support microbial activity. Two bench-scale filtration tests were running in parallel. Measurements were taken as membrane fouling developed, total membrane resistance increased, and filtrate flux declined. The hydraulic resistance (m−1) was calculated from measured flux and TMP data. When the filtrate flux decreased to below 60% of the initial flux, backflushing with DI water was performed to clean the membrane; this was intended to remove reversible fouling on the membrane surface and give the membrane a longer operational time.
Fouling mechanism models (blocking filtration laws) were applied to the data collected from the filtration experiment. Fouling models are complex, since filtration behaviors are controlled by multiple mechanisms that occur simultaneously. Mathematical representations of the blocking filtration laws under constant pressure conditions are given in Equations (5)–(8) [20].
Complete blocking (pore plugging):
Standard blocking (pore adsorption):
Intermediate blocking:
Cake filtration:
2.5. Biofouling Characteristics
The development of biofouling on UF membranes was investigated by analyzing the morphological structures and chemical compositions of membranes after operation. Membrane samples were cut-out, collected, and prepared with an ethanol gradient protocol prior to analysis. Surface morphologies of PAN membranes were observed by scanning electron microscopy (SEM) using a JSM-IT500HR SEM unit (JEOL, Peabody, MA, USA) at the Scientific and Technological Research Equipment Center, Chulalongkorn University.
Chemical compositions were observed by confocal laser scanning microscopy (CLSM) using a FluoView FV10i unit (Olympus, Tokyo, Japan). Different fluorescent stains were used to highlight specific biopolymer components, including SYTO 63 (Thermo Fisher, Waltham, MA, USA) for nucleic acids, FITC (Thermo Fisher, Waltham, MA, USA) for proteins, concanavalin A (Thermo Fisher, Waltham, MA, USA) for α-polysaccharides, and calcofluor white (Sigma Aldrich, St. Louis, MO, USA) for β-polysaccharides. Staining was performed following the procedure of Chen [21]. In brief, membrane specimens were first stained with SYTO 63 (20 µM), shaken for 30 min and then doused with 0.1 M NaHCO3 buffer to stabilize any amine groups. Then, FITC (10 g/L) was applied to the samples and allowed to react for 1 h, followed by Con A (0.2 g/L) for 30 min, and then, calcofluor white (1 g/L) was stained on membrane specimens for 1–2 min. CLSM images were captured from at least 3 different areas of the membrane surface and using the open source image processing program ImageJ (IJ 1.46 r) to determine the percentage of image pixels that were colored for each component.
2.6. Analytical Methods
A JSM-7500FA unit (JEOL Ltd., Tokyo, Japan) allowed for concurrent SEM and energy dispersive X-ray spectroscopy (EDS) analyses of material samples. At once, samples were subjected to surface morphology analysis by SEM and elemental analysis by EDS. Sliced FHPAC and PAC samples were analyzed using SEM-EDS to determine whether they had been subjected to ferrihydrite impregnation. The surface area, pore size, and pore volume of PAC and FHPAC adsorbents were characterized based on the nitrogen adsorption–desorption method using an Autosorb-1XR (Quantachrome, Boynton Beach, FL, USA); surface area was determined using the Brunauer–Emmett–Teller (BET) method, whereas pore size and volume were calculated using the Barret–Joyner–Halenda (BJH) and t-plot methods.
Phosphate concentrations were measured through an ascorbic acid method with a DR900 colorimeter (HACH, Loveland, CO, USA). Dissolved organic carbon (DOC) concentrations were measured with TOC analyzers (TOC-L Series, Shimadzu, Kyoto, Japan). All nitrogen species (ammonia, nitrite, and nitrate) were measured using colorimetric methods and a UV–Vis spectrophotometer (DR6000, HACH, Loveland, CO, USA). Feed and permeate pH was monitored through FiveEasy Plus pH meters (Mettler Toledo, LLC., Columbus, OH, USA) and their conductivity was measured with a SevenGoTM conductivity meter (Mettler-Toledo, OH, USA). Finally, total bacteria counts were determined by inoculation and counting via the typical heterotrophic plate count (HPC) method in units of CFU/mL.
3. Results and Discussion
3.1. FHPAC Characteristics
SEM images were used to initially characterize FHPAC particles by their surface morphologies (Figure S1). FHPAC particle surfaces appeared to have a lower surface roughness than that of PAC particles due to amorphous ferrihydrite nanoparticles’ entrapping inside the PAC pores [22]. EDS showed that the modified adsorbent (FHPAC) contained a higher iron content than PAC did (Figure S1, Suppl. Materials); the complete elemental breakdown of FHPAC was 47.9% carbon, 24.6% oxygen, 22.9% iron, 2.6% chloride, 1.5% sodium, and 0.5% aluminum.
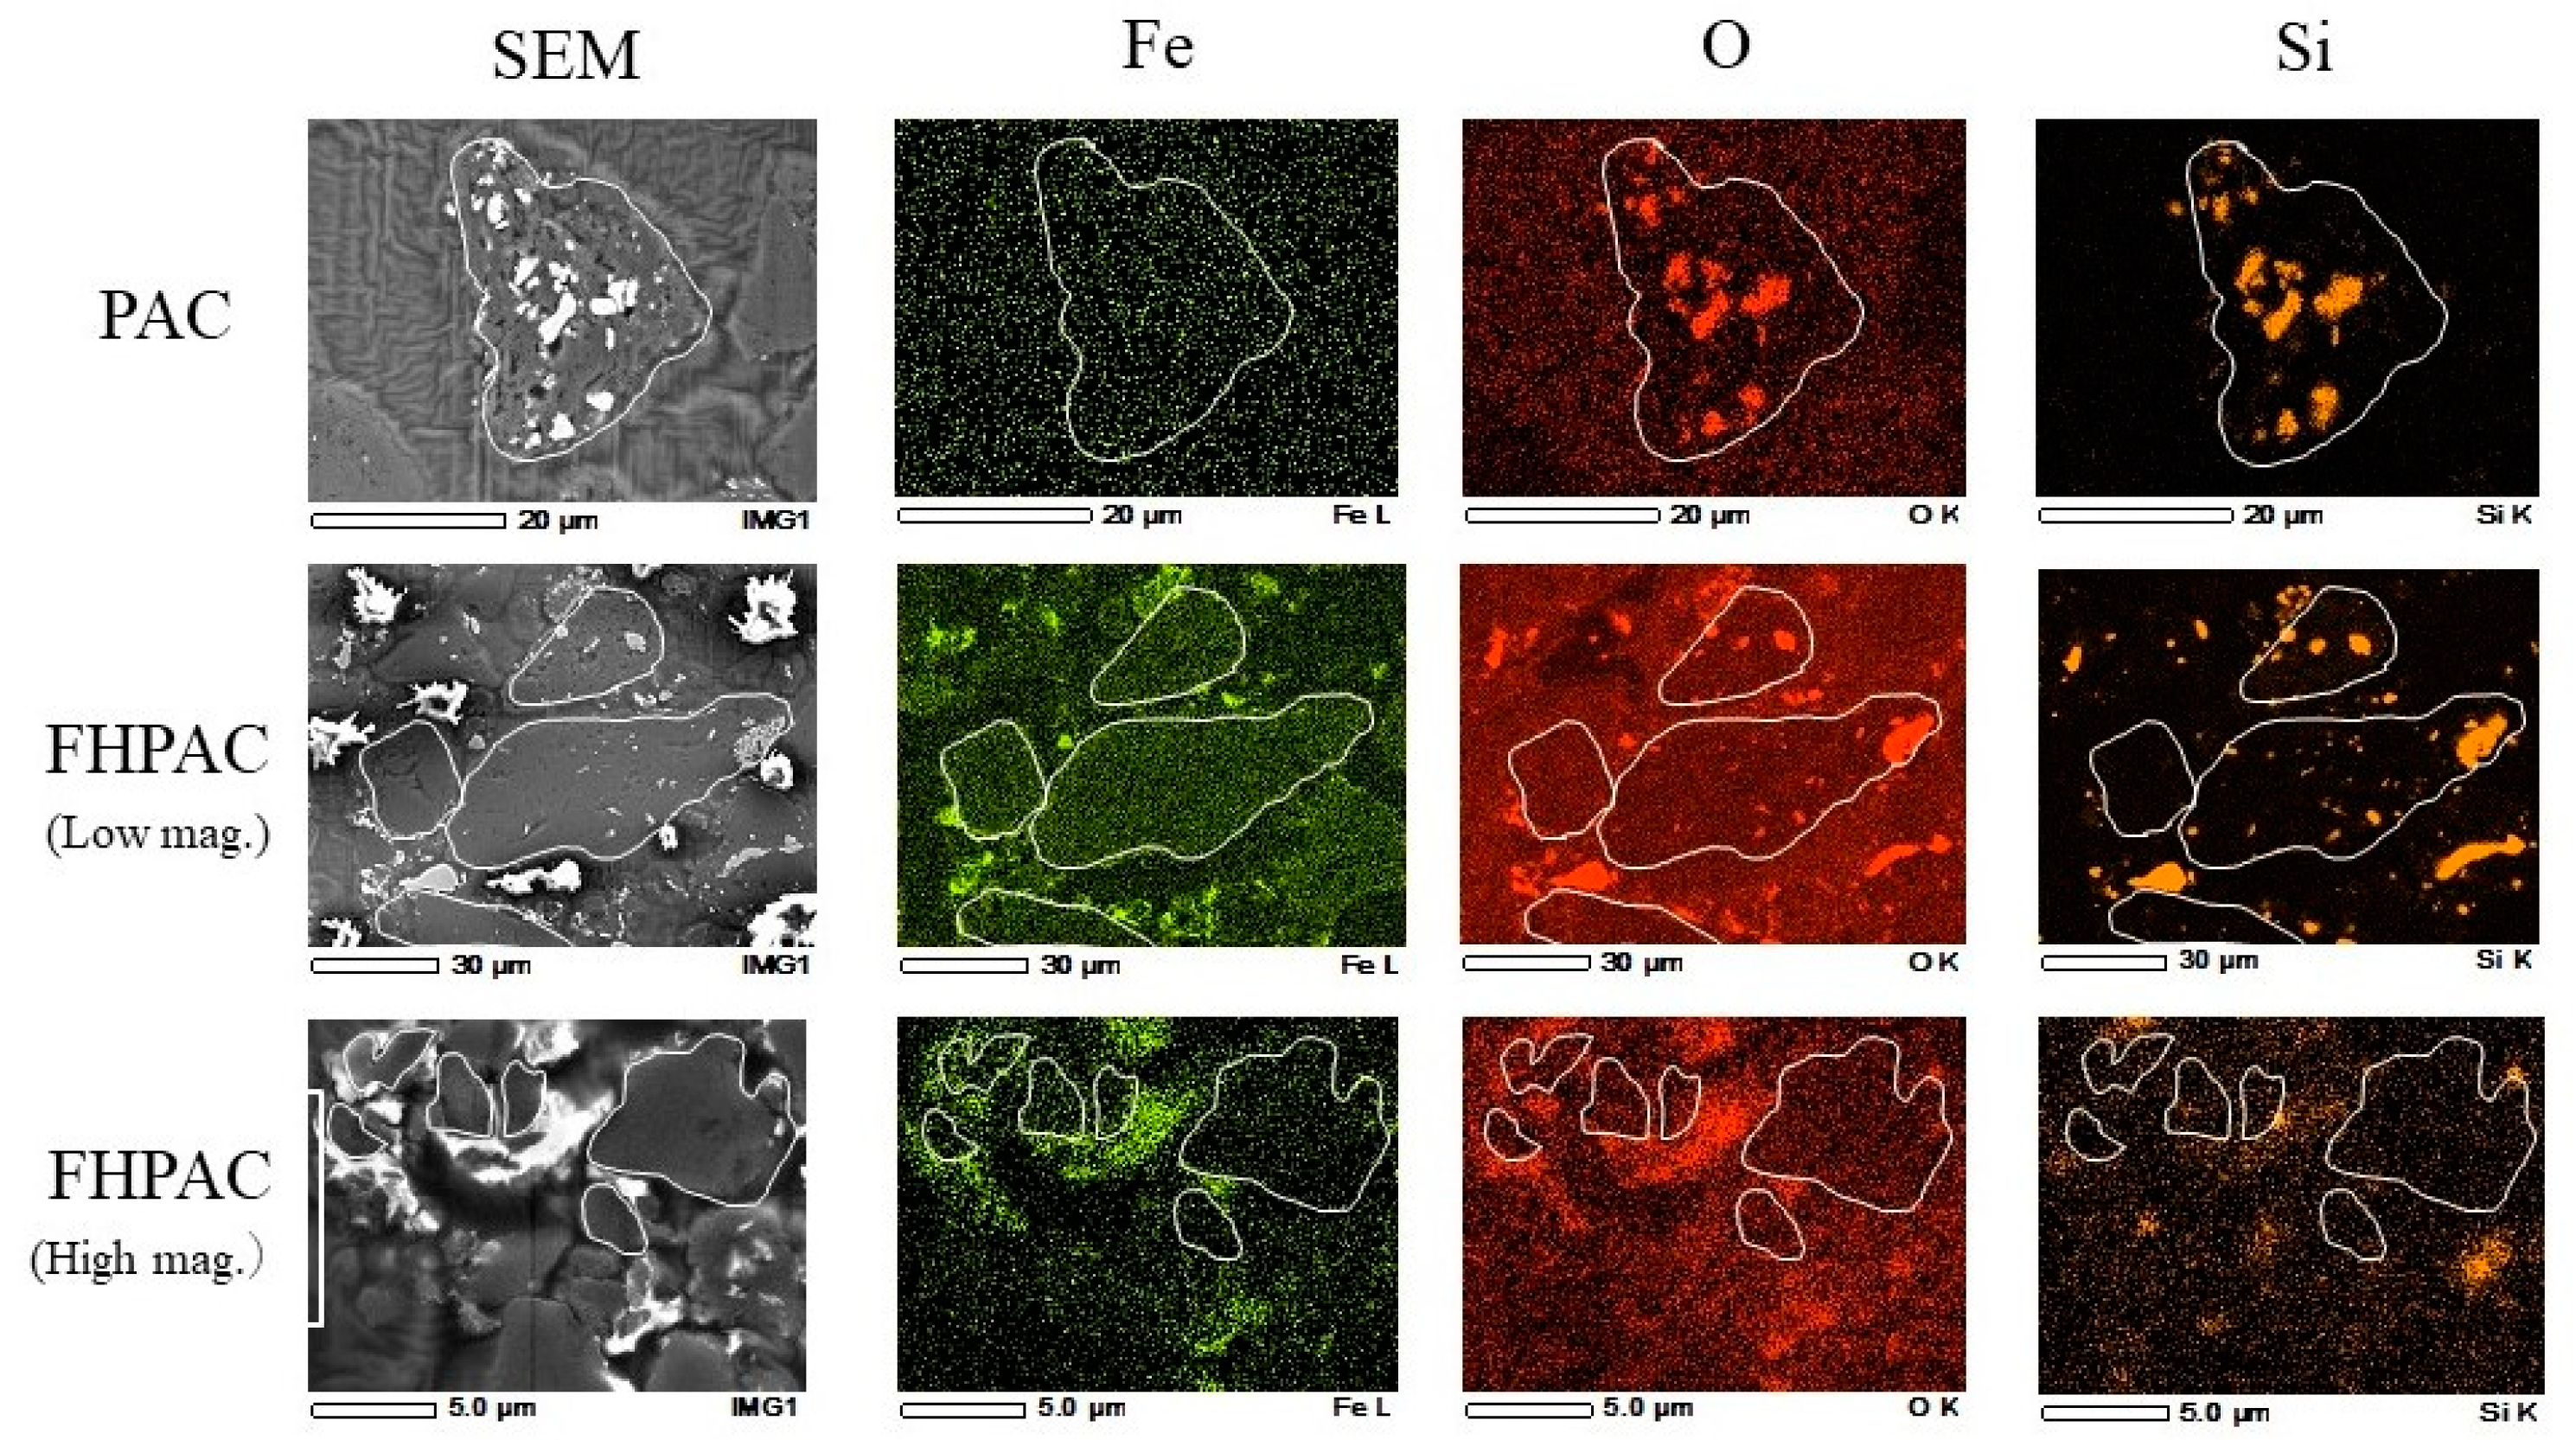
Cross-sectional SEM images of bare PAC and FHPAC particles with elemental distribution mapping of iron, oxygen, and silica contents are shown in Figure 2. The equipment scanned one cross-section of representative carbon particles. The white lines were drawn into these images to indicate the possible outline of individual PAC or FHPAC particles. On the bare PAC particles, no Fe signals were detected, but distinctive signals of oxygen and silica were apparent, indicating the existence of silicon dioxide (SiO2) inside the PAC. Numerous oxygen elements existed in the FHPAC particles, with some distributed on the surface. Fe and oxygen signals were both detected (bright green and red) around the outer surfaces. The SEM-EDS analysis with elemental mapping reflects the impregnation of iron oxide on the FHPAC surface.
Particle surface areas and porosities were investigated by nitrogen adsorption–desorption isotherms (Table 1). The adsorption–desorption pattern detected for both materials obeyed the hysteresis loop type H3 according to the IUPAC classification. The PAC and FHPAC surface areas (SBET) were determined to be 647 and 337 m2/g, respectively, using the BET surface area method. The PAC and FHPAC pore volumes were calculated to be 0.870 and 0.395 cm3/g, respectively, using the BJH method. The PAC and FHPAC pore sizes were similar with a diameter of 3.8 nm, calculated by the BJH method. The SBET of FHPAC was 1.92 times smaller than that of virgin PAC; the majority of this decrease was in the microporous surface area (Smic), which decreased 2.49 times after impregnation. The total pore volume (Vt) and micropore volume (Vmic) of FHPAC also had similar decreases compared to virgin PAC. On the contrary, the pore sizes of the modified FHPAC and bare PAC remained almost the same. These results suggest that the reductions in specific surface area and pore volume were caused by the impregnation of iron on the surface of PAC particles [23], but iron impregnation did not block pore mouths or channels or change the pore structure to a significant extent [24].
3.2. Adsorption Kinetics and Isotherms
3.2.1. Phosphate Adsorption Kinetics and Isotherm
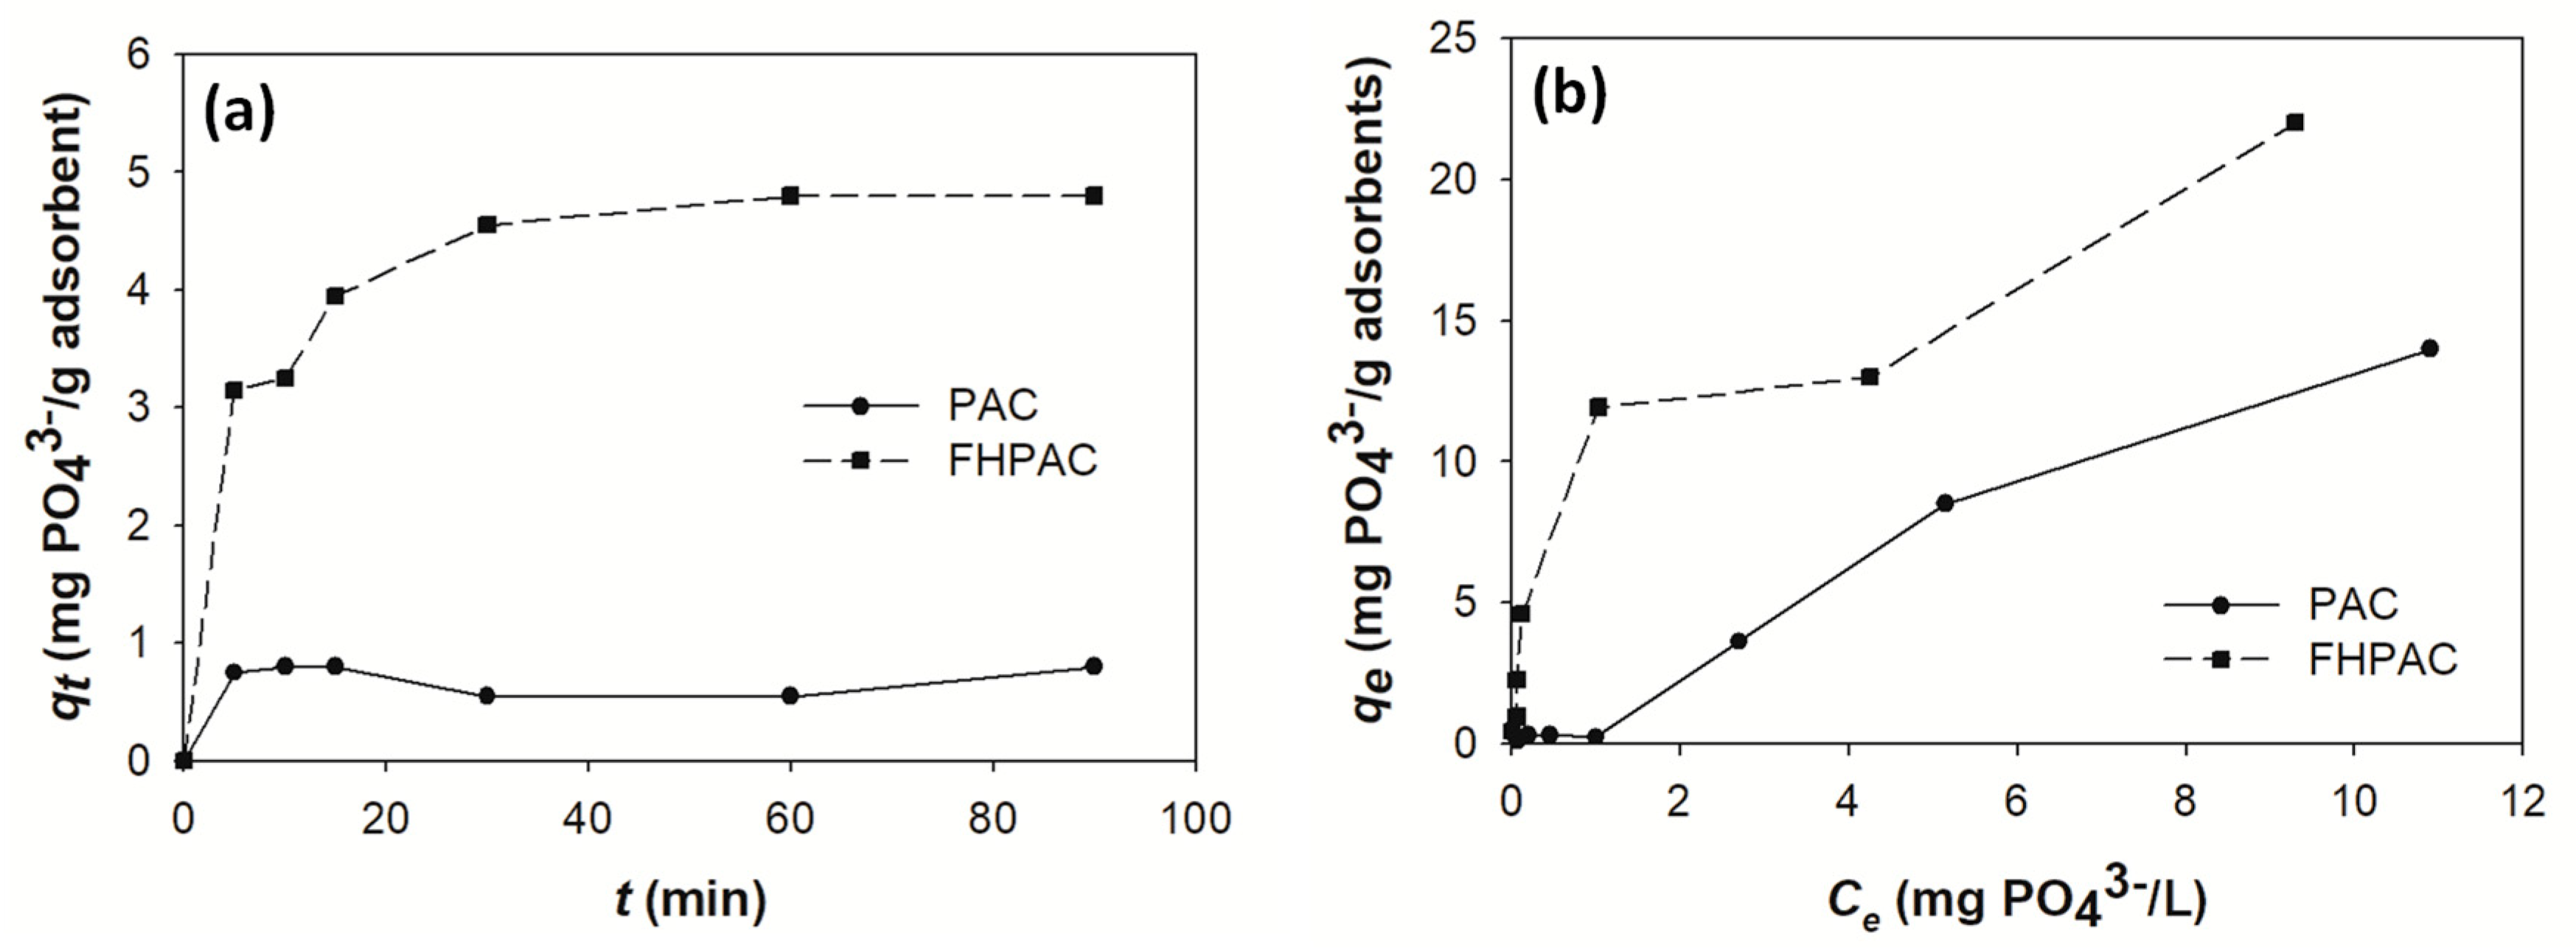
Figure 3a shows the profiles of phosphate adsorption onto the PAC and FHPAC adsorbents as a function of time. Fast diffusion of phosphate molecules from the liquid phase to the adsorbent surfaces was observed, as adsorption amounts increased with time until equilibria were reached after 5 and 60 min for PAC and FHPAC, respectively. The two adsorbents exhibited different sorption behaviors, as expected. The maximum phosphate removal efficiencies for PAC and FHPAC were 15.2% and 91.4%, respectively. A possible reason for the higher phosphate adsorption by FHPAC is probably that the bare adsorbent’s surface carries a more negative charge, which serves to repel the negatively charged phosphate species in solution, especially inorganic phosphate species [25]; thus, the iron particles on the surface of FHPAC particles help shield the native negative surface charge and promote interaction between adsorbent particles and phosphate ions. Other studies have also suggested that phosphate adsorption onto FHPAC is driven by a chemisorption process that involves valency forces and the sharing or exchange of electrons between adsorbent and adsorbate [26,27].
Table S2 shows the typical pseudo-first-order and pseudo-second-order adsorption kinetic constants of our experimental data. Our kinetic data on FHPAC adsorption fitted the pseudo-second-order model with a correlation coefficient (R2) of 0.985. The calculated and experimental qe values for FHPAC were in good agreement, at values of 5.01 and 4.80 mg PO43−/g, respectively.
Figure 3b shows the adsorption isotherms of qe against Ce. FHPAC typically had qe values that were 1.5–3.3 times larger than those for PAC at Ce values > 2 mg/L. The experimental results were fitted to two popular isotherm models: Langmuir and Freundlich; the model coefficients are summarized in Table S3. Comparing the models, the Freundlich isotherm had a slightly stronger correlation (R2 = 0.924) over the Langmuir isotherm (R2 = 0.921). The results indicated that the adsorption of phosphate ions onto FHPAC followed a monolayer surface reaction (Langmuir isotherms) mechanism at low phosphate concentrations [22,27] and a heterogeneous (Freundlich isotherms) mechanism if the initial phosphate concentrations were high [28]. Previous studies have reported that the phosphate adsorption mechanism is based on the coordination between phosphate ions and hydroxyl groups on iron oxide surfaces [29,30].
3.2.2. Simultaneous DOC and Phosphate Adsorption
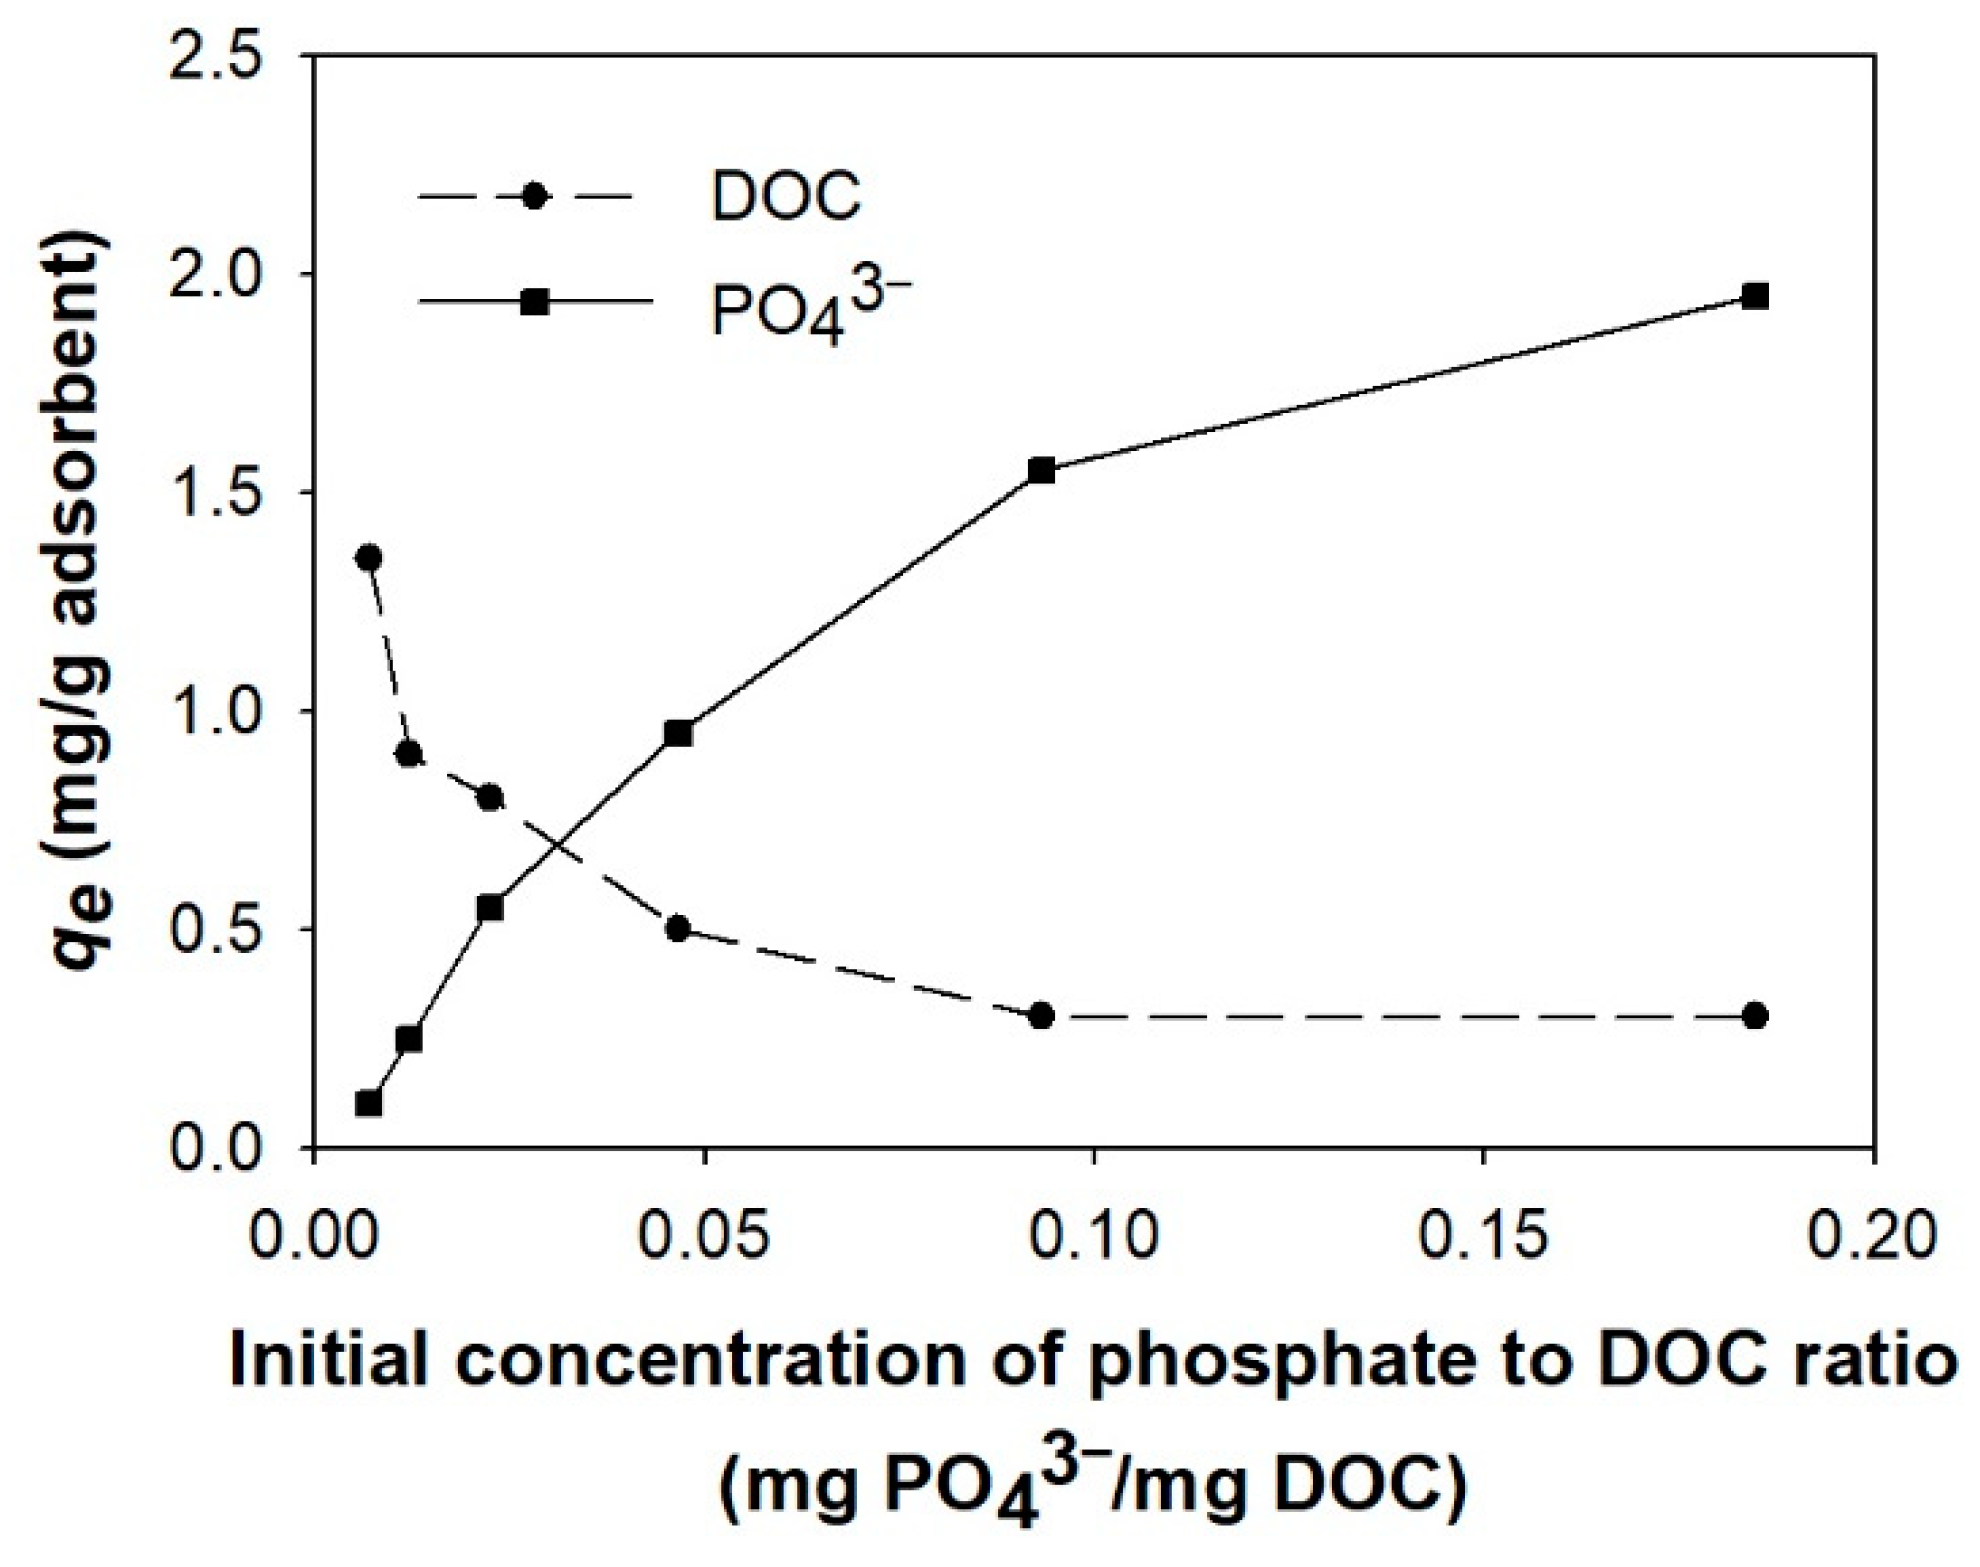
The previous section discussed FHPAC’s high potential for adsorbing phosphates. However, the introduction of DOM into the aqueous solution will change phosphate sorption behaviors, as mentioned in previous research [31]. Figure 4 shows the simultaneous adsorption capacities of DOC and phosphate in this study. There was only an apparent influence of DOC on phosphate adsorption at low (initial) PO43−/DOC ratios—less than 0.03 mg PO43−/mg DOC. As the initial phosphate concentrations increased, so did the phosphate adsorption capacity, while the DOC adsorption capacity decreased. However, the presence of DOC definitely reduced the phosphate adsorption capacity compared to when only phosphate was present in solution (Section 3.2.1). When data from simultaneous DOC and phosphate adsorption were fitted to a Langmuir monolayer adsorption model (R2 = 0.960), the resulting maximum adsorption capacity (qm) decreased 10 times from the sole phosphate adsorption isotherm, from 22.3 down to 2.32 mg PO43−/g FHPAC.
These results showed the competing adsorption of DOC (glucose) and phosphate molecules onto adsorbent surfaces. Previous research has shown similar trends, with high concentrations of DOC interfering with phosphate removal by metals [32]. DOC is not suspected of directly inhibiting the phosphate adsorption mechanism, since the surface ligand exchange mechanism has a higher affinity for phosphate ions than DOC; rather, DOC adsorbs to hydroxyl groups via hydrogen bonding after the groups’ negative charges are neutralized by attached phosphate ions [33].
3.3. Membrane Fouling and Filtration Resistance
3.3.1. Biofouling Test and Fouling Mechanism
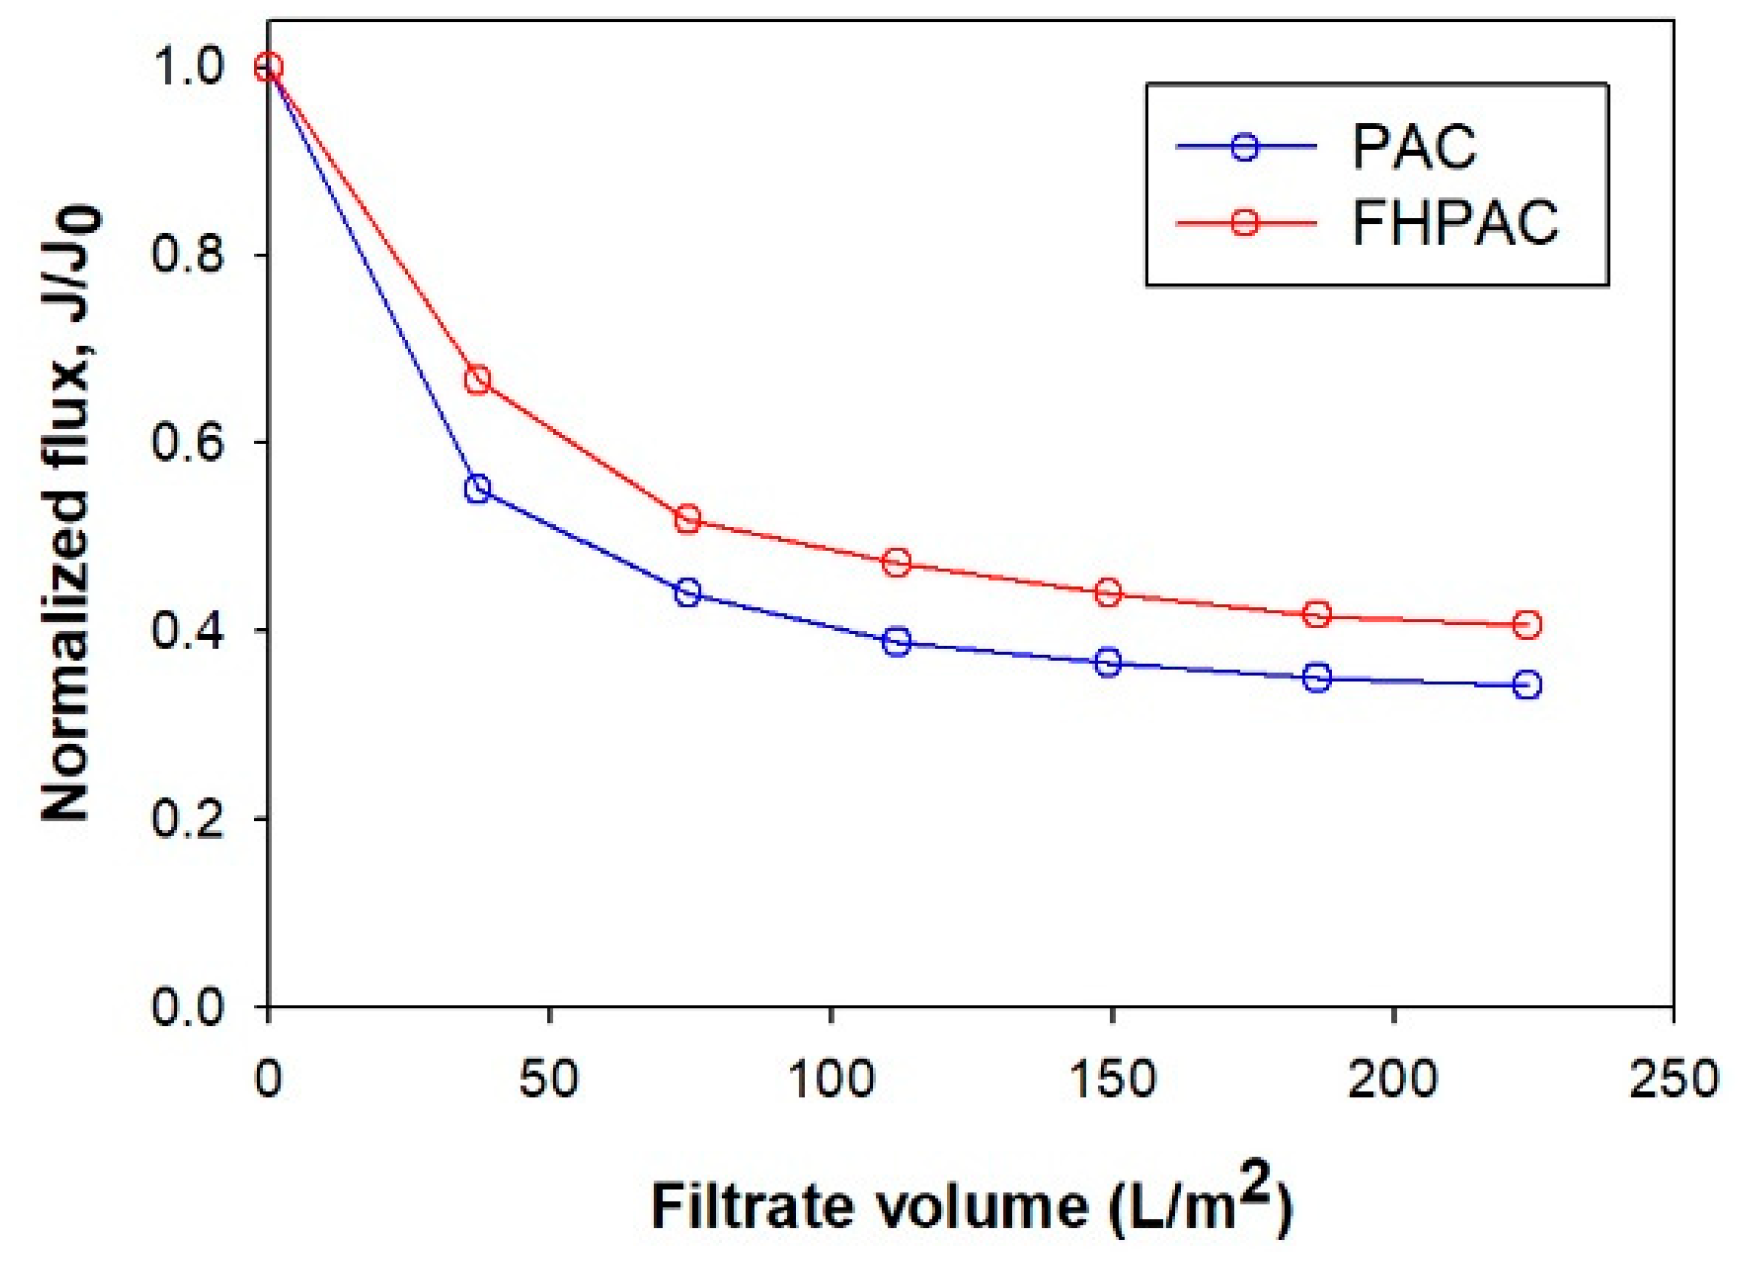
To evaluate the biofouling potential on PAN membranes during PAC and FHPAC adsorption, biofilm formation on the membranes was promoted by soaking them in waters with high biofouling potential (test waters supplemented with microbial inoculum, glucose, phosphate, and nutrients). The biofilms were monitored for organic carbon changes via UV absorbance measurements at wavelengths of 254 and 280 nm. Steady UV254 and UV280 values were obtained after 20 days in both PAC and FHPAC tests. Afterwards, the PAN membranes were tested for flux declines, with the results shown in Figure 5. The PAN membrane subjected to the addition of FHPAC suffered a greater flux decline than that with PAC addition. Overall, PAC adsorption caused a rapid initial decrease in the membrane flux before approaching a steady normalized flux ratio of about 65% of the initial flux. Meanwhile, FHPAC adsorption caused a 55% decrease in flux against the initial value at a filtrate volume of 150 L/m2. FHPAC’s higher DOC and phosphate removal efficiencies probably helped to control the amount of biofouling on the membrane surface [4]. In fact, it has previously been observed that the adsorption of DOC and phosphate by FHPAC helped to restrict bacterial growth [11].
Flux decline through the membrane is a result of increased membrane resistance caused by cake formation and pore blockage on the membrane surface. Figure S2 and Table S4 show the mechanisms that are considered influential in membrane fouling in the PAC and FHPAC adsorption/filtration test conditions. The rapid initial flux decline can be attributed to materials that act quickly in blocking the membrane pores, such as microbial cells and biofilm-related substances. The next stage of flux decline, after pore blocking, is due to cake layer formation (in Figure S2, the second and third straight lines represent the intermediate blocking and cake filtration, respectively). The greater initial flux decline (pore blockage) in the presence of PAC is representative of the overall differences between the conditions with the presence of PAC and FHPAC. The flux decline with PAC presence (slope of −0.762 h−1) was greater than that in the presence of FHPAC (−0.656 h−1), showing a greater initial rate of fouling caused by B. subtilis cells and organic matter. However, in the presence of FHPAC, these cells and organic matter can be better adsorbed by ferrihydrite via ligand exchange mechanism than by activated carbon before they are deposited onto the membrane surface [34].
3.3.2. Fouling Observation from Bench-Scale Filtration Test
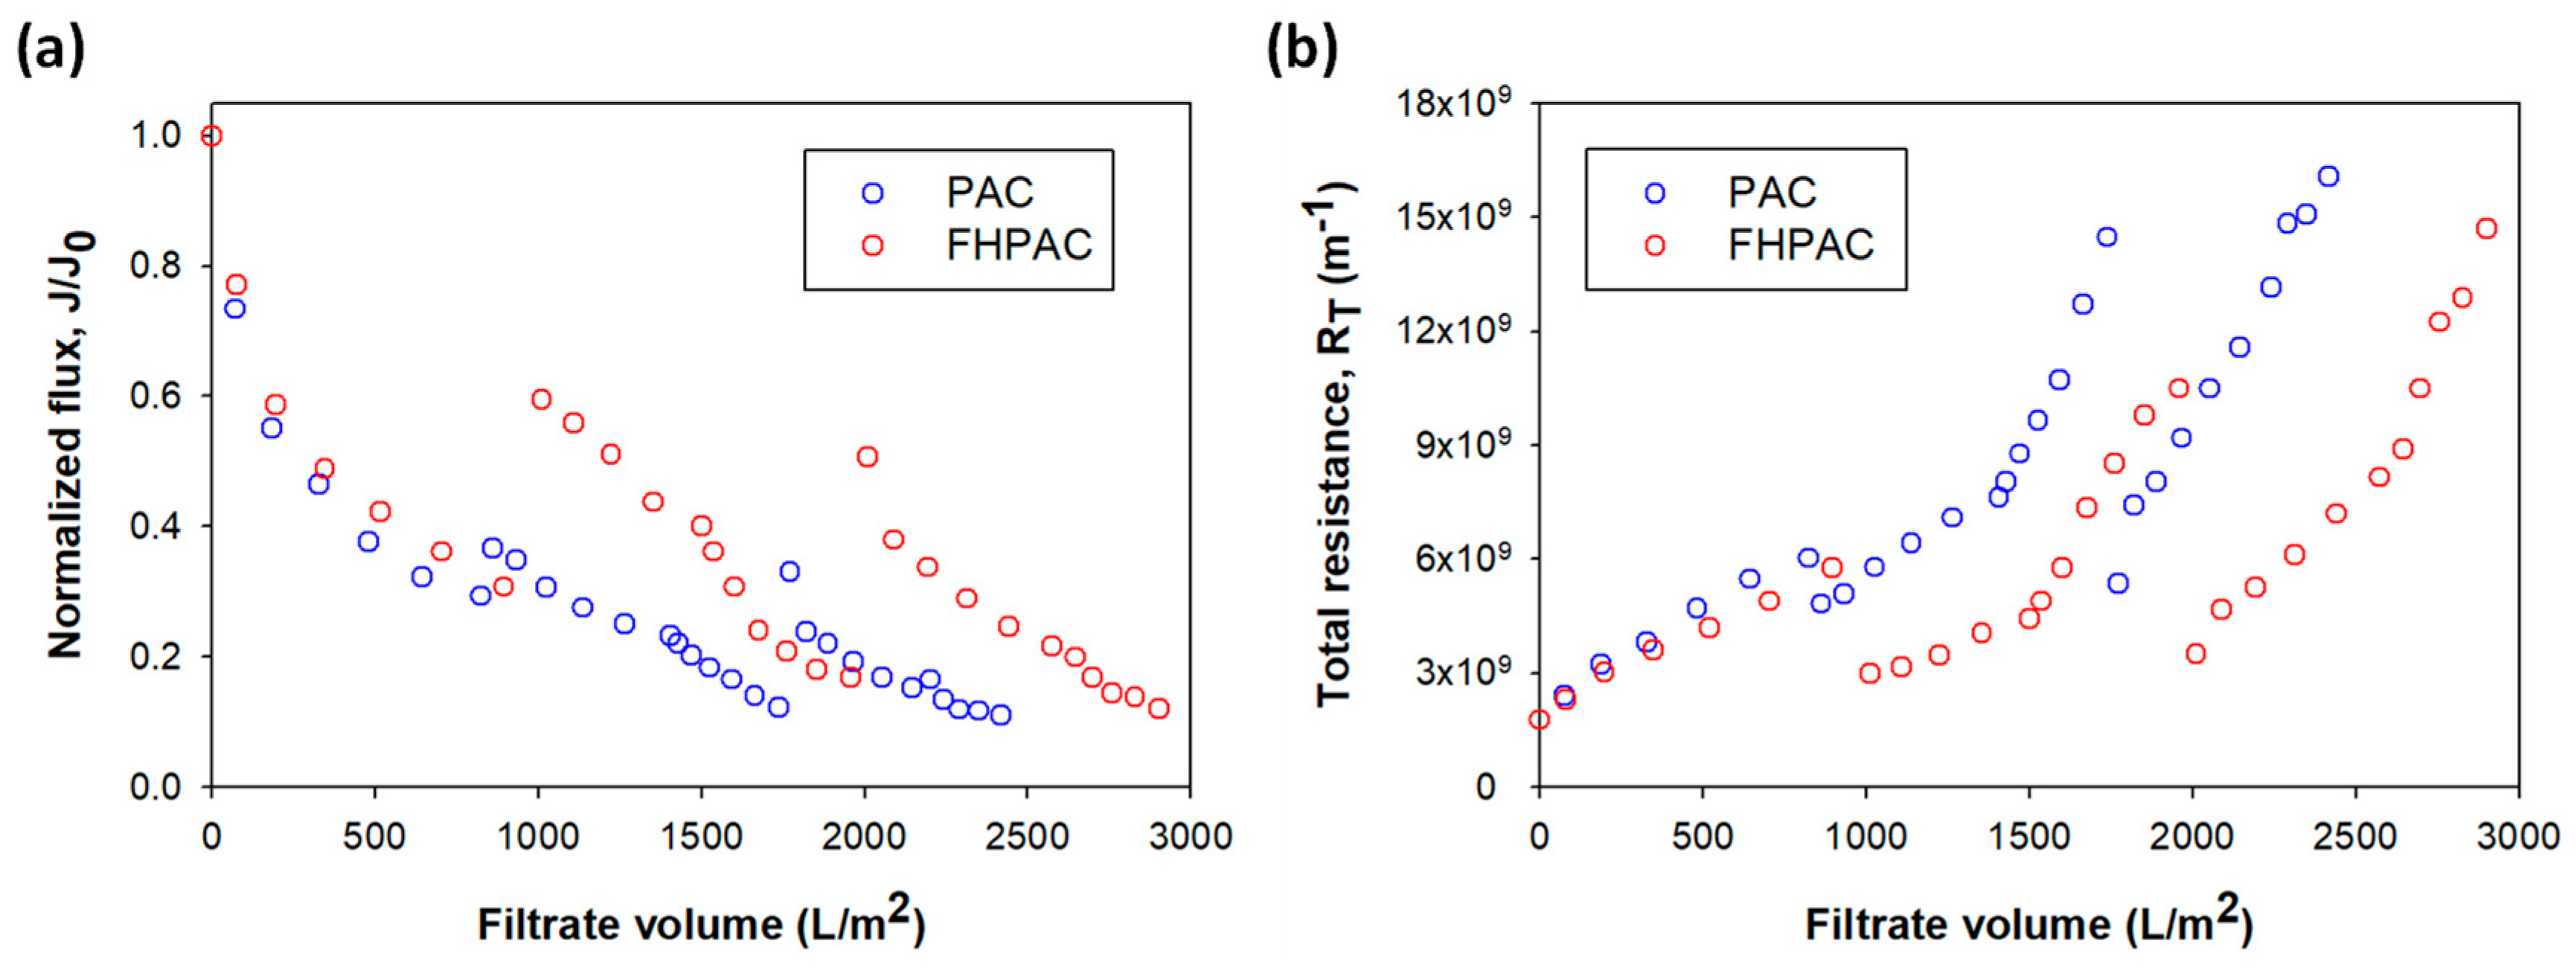
In our integrated adsorption–membrane filtration apparatus (Figure 1), the hydraulic residence time in the filtration cell was estimated to be approximately 180 min, which was sufficient for adsorption. The adsorbent-containing suspension and synthetic wastewater were completely mixed within the filtration cell by aeration. A transmembrane suction pressure of 0.5 bar was applied across the flat-sheet UF membrane that acted as a dead-end filter. Normalized flux and total membrane resistance data from the filtration tests are presented in Figure 6. Initially, the presence of PAC or FHPAC did not significantly affect filtrate flux nor membrane resistance; the PAN membranes under both conditions experienced a 60% flux decrease after a relatively similar period, at which time they were both backflushed with DI water. However, after backflushing, the membrane that was placed underneath FHPAC adsorption showed much higher potential for fouling reversal; the first backflush helped the membrane under the FHPAC condition to reduce its total resistance from 5.76 × 10⁹ to 2.98 × 10⁹ m−1, which was much more significant than the recovery by the membrane under the PAC condition (from 6.03 × 10⁹ to 4.82 × 10⁹ m−1). Similar results were observed after the second and third filtration/backflushing cycles; each cycle handled approximately 800 L/m2 of filtrate volume.
The different fouling regimes caused by PAC and FHPAC were apparent when the PAN membranes were backflushed. The irreversible fouling resistance (Rf) of FHPAC (1.21 × 10⁻⁹ and 1.73 × 10⁻⁹ m−1 for the 1st and 2nd backflushing, respectively) was only half of that of PAC (3.05 × 10⁻⁹ and 3.59 × 10⁻⁹ m−1). The difference may have been caused by ferrihydrite’s ability to undergo ligand exchange with potential foulants such as bacterial cells and biopolymers [34,35]. Since bare PAC does not have a mechanism to remove these foulants, the addition of ferrihydrite allowed FHPAC to prevent these foulants from strongly attaching to the membrane. Furthermore, ferrihydrite addition increased the DOM removal rate, possibly due to ligand exchange between the DOM’s carboxylic and phenolic groups and the hydrated ferrihydrite’s surface hydroxyl groups causing DOM adsorption [4].
With B. subtillis cells (diameter of 0.25–1 micron) being larger than the PAN membrane’s nominal pore size (0.01 micron, 50,000 Da) [36], the bacterial cells could behave like colloids, plugging the membrane pores. Large particles such as biopolymers or biofilm-related substances can become macrosolutes bound to the membrane pores and surface by adsorption [37]. Even PAC particles can completely block individual membrane pores, as the minimum size of PAC particles (d5 = 2.7 microns) is bigger than that of the PAN pores. The mathematical fouling mechanism models suggested that PAC caused complete blocking of the PAN membrane (Table S5).
Table 2 shows the water quality of feedwater and permeate during UF with PAC and FHPAC adsorption. Approximately 45% and 15% of the influent DOC was removed by the integrated adsorption/filtration systems using PAC and FHPAC, respectively. The FHPAC system removed less DOC than PAC did (ca. 3 times), but it did remove more phosphate (86% compared to 57%), which might have decreased the FHPAC’s adsorption capacity to remove DOC (as mentioned in Section 3.2.2). Phosphate removal in the FHPAC system was caused by a combination of adsorption and phosphate utilization by biological processes. The higher nitrate-nitrogen concentration (8.69 mg-N/L) in the FHPAC + UF system’s permeate was attributed to residual nitrates from the material synthesis method. Other parameters (i.e., pH, conductivity, ammonia-nitrogen, nitrite-nitrogen, and heterotrophic plate count) did not show significant differences between the PAC and FHPAC systems. Further study is required to evaluate whether any potential for removing other contaminants, e.g., microbial contaminants and heavy metals, may be obtained by the FHPAC-UF system.
3.4. Biofouling Observation
Biofilm coverage of the membrane surfaces in the hybrid adsorption/filtration systems was visually inspected by SEM; the images taken at 1000× and 5000× magnification are shown in Figure 7. The images clearly indicate the formation of bacterial colonies on the membrane surface of the PAC system, caused by pore plugging and membrane fouling. Fewer microbes were found on the membrane surface of the FHPAC system due to the ligand exchange interaction between bacterial cells and ferrihydrite surfaces [34].
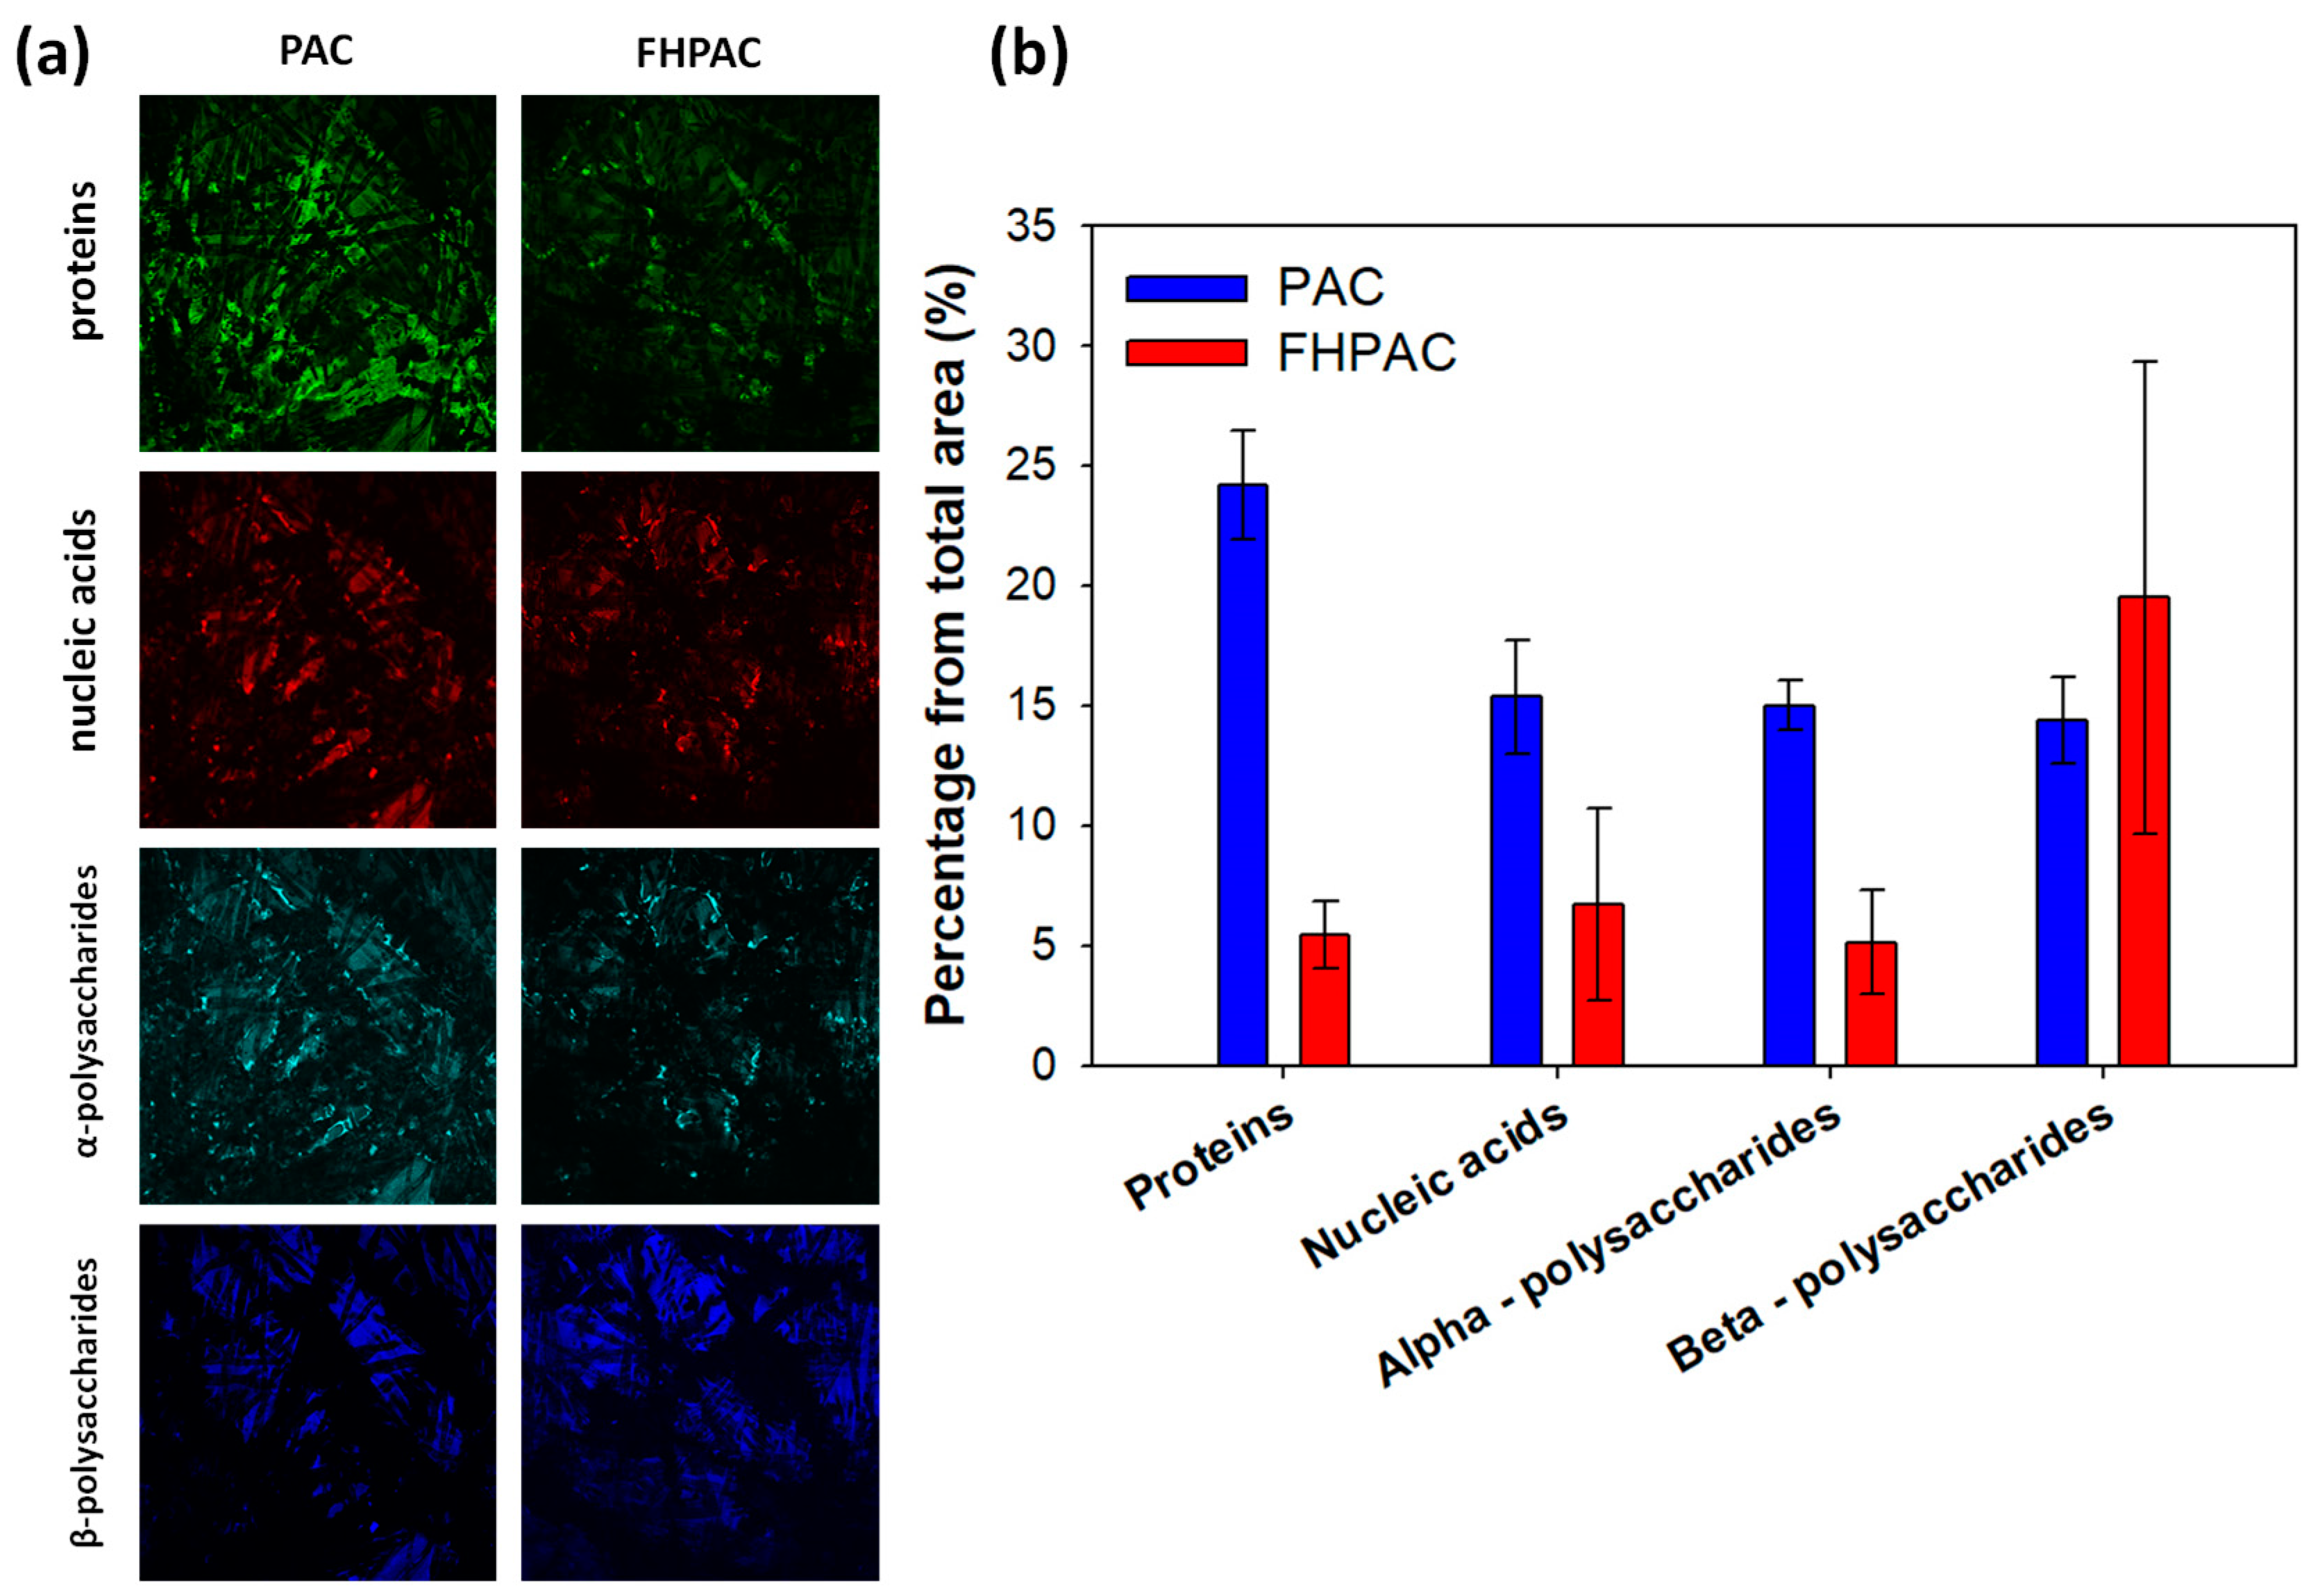
Using different fluorescent stains, CLSM images (1260 × 1260 μm2, 10× magnification, Figure 8) revealed the coverage of the following biofilm components on the PAN membrane: proteins (green), nucleic acids (red), and polysaccharide-based organic polymers (alpha-cyan, beta-blue). Overall, more biofilm substances were found on the membrane surface of the PAC adsorption/filtration system than on the FHPAC adsorption/filtration system, which aligns with the results of the membrane filtration test and fouling mechanism study of the previous sections. Higher relative percentages of all components were found deposited on the membrane surface of the PAC system compared to the FHPAC system. On the PAC system’s membrane, proteins were found in the highest proportion of 24.2 ± 2.2%, followed by nucleic acids, α-polysaccharides, and β-polysaccharides. While fewer proteins, nucleic acids, and α-polysaccharides were found on the FHPAC system’s membrane than on the PAC system’s membrane, comparable amounts of β-polysaccharides were found on both membranes (p-value of 0.4296). Recalling that less irreversible fouling occurred on the membrane of the FHPAC system, we may deduce that irreversible fouling is caused by materials composed of proteins, nucleic acids, and α-polysaccharides.
4. Conclusions
The adsorptive effects of PAC impregnated with FH when used in combination with membrane filtration were systematically investigated based on membrane fouling behavior, fouling mechanisms, and biofouling characteristics. FH impregnation imbued FHPAC with the ability to simultaneously adsorb phosphate and organic matter, which resulted in the slight mitigation of membrane fouling from biofilm-related substances. Consequently, transmembrane resistance caused by irreversible fouling was limited, helping to mediate the decline of transmembrane flux, and made flux recovery by backflushing possible.
Supplementary Materials
The following are available online at https://www.mdpi.com/article/10.3390/w13091178/s1. Figure S1: SEM images of PAC and FHPAC at different magnification levels (1000× and 30,000×) and elemental compositions analysis by SEM-EDS; Figure S2: Mathematical models of fouling mechanism in biofouling test of (a) PAC+UF and (b) FHPAC+UF; Table S1: Tap water quality from the Metropolitan Waterworks Authority, Bangkok, Thailand(October 2020); Table S2: Kinetic parameters of phosphate onto PAC and FHPAC with an initial phosphate concentration of 1.0 mg PO43−/L. Table S3: Isotherm parameters of phosphate onto FHPAC with the variation of initial phosphate concentration from 0.1–13.7 mg PO43−/L. Table S4: Mathematical models of fouling mechanism in biofouling test of PAC and FHPAC. Table S5: Fouling mechanism of PAC+UF and FHPAC+UF bench scale operation via mathematical models.
Author Contributions
Conceptualization, J.L.; methodology, J.L.; software, T.M.; validation, J.L and T.M.; investigation, T.M. and H.O.; resources, J.L.; data curation, T.M.; writing—original draft preparation, J.L. and T.M.; writing—review and editing, J.L. and S.T.; visualization, J.L. and T.M.; supervision, project administration and funding acquisition, J.L. All authors have read and agreed to the published version of the manuscript.
Funding
This research was funded by the TSRI, grant number CU_FRB640001_01_21_6, and was supported by the Research Grant for New Scholar Ratchadaphiseksomphot Endowment Fund (DNS 61-019-21-002-1), Chulalongkorn University.
Institutional Review Board Statement
Not applicable.
Informed Consent Statement
Not applicable.
Data Availability Statement
Supplementary data associated with this article can be found in the online version.
Acknowledgments
Not applicable.
Conflicts of Interest
The authors declare no conflict of interest.
References
- Edokpayi, J.N.; Odiyo, J.O.; Durowoju, O.S. Impact of Wastewater on Surface Water Quality in Developing Countries: A Case Study of South Africa. In Water Quality; InTech: London, UK, 2017; pp. 401–416. [Google Scholar] [CrossRef] [Green Version]
- Stoquart, C.; Servais, P.; Bérubé, P.R.; Barbeau, B. Hybrid Membrane Processes using activated carbon treatment for drinking water: A review. J. Membr. Sci. 2012, 411–412, 1–12. [Google Scholar] [CrossRef]
- Gao, W.; Liang, H.; Ma, J.; Han, M.; Chen, Z.-L.; Han, Z.-S.; Li, G.-B. Membrane fouling control in ultrafiltration technology for drinking water production: A review. Desalination 2011, 272, 1–8. [Google Scholar] [CrossRef]
- Yang, Y.; Lohwacharin, J.; Takizawa, S. Hybrid ferrihydrite-MF/UF membrane filtration for the simultaneous removal of dissolved organic matter and phosphate. Water Res. 2014, 65, 177–185. [Google Scholar] [CrossRef] [Green Version]
- Zhu, M.; Frandsen, C.; Wallace, A.F.; Legg, B.; Khalid, S.; Zhang, H.; Mørup, S.; Banfield, J.F.; Waychunas, G.A. Precipitation pathways for ferrihydrite formation in acidic solutions. Geochim. Cosmochim. Acta 2016, 172, 247–264. [Google Scholar] [CrossRef] [Green Version]
- Michel, F.; Ehm, L.; Antao, S.M.; Lee, P.L.; Chupas, P.J.; Liu, G.; Strongin, D.R.; Schoonen, M.A.A.; Phillips, B.L.; Parise, J.B. The Structure of Ferrihydrite, a Nanocrystalline Material. Science 2007, 316, 1726–1729. [Google Scholar] [CrossRef] [Green Version]
- Zhao, J.; Huggins, F.E.; Feng, Z.; Huffman, G.P. Ferrihydrite: Surface Structure and Its Effects on Phase Transformation. Clays Clay Miner. 1994, 42, 737–746. [Google Scholar]
- Chen, W.; Parette, R.; Zou, J.; Cannon, F.S.; Dempsey, B.A. Arsenic removal by iron-modified activated carbon. Water Res. 2007, 41, 1851–1858. [Google Scholar] [CrossRef]
- Maji, S.; Kao, Y.-H.; Liu, C.-W. Arsenic removal from real arsenic-bearing groundwater by adsorption on iron-oxide-coated natural rock (IOCNR). Desalination 2011, 280, 72–79. [Google Scholar] [CrossRef]
- Omoregie, E.O.; Couture, R.-M.; Van Cappellen, P.; Corkhill, C.L.; Charnock, J.M.; Polya, D.A.; Vaughan, D.; Vanbroekhoven, K.; Lloyd, J.R. Arsenic Bioremediation by Biogenic Iron Oxides and Sulfides. Appl. Environ. Microbiol. 2013, 79, 4325–4335. [Google Scholar] [CrossRef] [Green Version]
- Yang, Y.; Lohwacharin, J.; Takizawa, S.; Hou, L.-A. Comparison between ferrihydrite adsorption and full-scale advanced drinking water treatment processes for controlling bacterial regrowth potential. Chemosphere 2020, 241, 125001. [Google Scholar] [CrossRef]
- Campos, C.; Mariñas, B.J.; Snoeyink, V.L.; Baudin, I.; Laîné, J.M. Adsorption of trace organic compounds in CRISTAL® processes. Desalination 1998, 117, 265–271. [Google Scholar] [CrossRef]
- Mavrov, V.; Chmiel, H.; Kluth, J.; Meier, J.; Heinrich, F.; Ames, P.; Backes, K.; Usner, P. Comparative study of different MF and UF membranes for drinking water production. Desalination 1998, 117, 189–196. [Google Scholar] [CrossRef]
- Lebeau, T.; Lelièvre, C.; Buisson, H.; Cléret, D.; Van De Venter, L.W.; Côté, P. Immersed membrane filtration for the production of drinking water: Combination with PAC for NOM and SOCs removal. Desalination 1998, 117, 219–231. [Google Scholar] [CrossRef]
- Campinas, M.; Rosa, M.J. Assessing PAC contribution to the NOM fouling control in PAC/UF systems. Water Res. 2010, 44, 1636–1644. [Google Scholar] [CrossRef]
- Park, H.-S.; Koduru, J.R.; Choo, K.-H.; Lee, B. Activated carbons impregnated with iron oxide nanoparticles for enhanced removal of bisphenol A and natural organic matter. J. Hazard. Mater. 2015, 286, 315–324. [Google Scholar] [CrossRef] [PubMed]
- Amaral, P.; Partlan, E.; Li, M.; Lapolli, F.; Mefford, O.T.; Karanfil, T.; Ladner, D.A. Superfine powdered activated carbon (S-PAC) coatings on microfiltration membranes: Effects of milling time on contaminant removal and flux. Water Res. 2016, 100, 429–438. [Google Scholar] [CrossRef] [Green Version]
- Cui, X.; Choo, K.-H. Granular iron oxide adsorbents to control natural organic matter and membrane fouling in ultra-filtration water treatment. Water Res. 2013, 47, 4227–4237. [Google Scholar] [CrossRef]
- Leone, P.; Gennari, M.; Nègre, M.; Boero, V. Role of ferrihydrite in adsorption of three imidazolinone herbicides. J. Agric. Food Chem. 2001, 49, 1315–1320. [Google Scholar] [CrossRef] [PubMed]
- Iritani, E.; Katagiri, N. Developments of Blocking Filtration Model in Membrane Filtration. KONA Powder Part. J. 2016, 33, 179–202. [Google Scholar] [CrossRef] [Green Version]
- Chen, M.-Y.; Lee, D.-J.; Yang, Z.; Peng, X.F.; Lai, J.Y. Fluorecent Staining for Study of Extracellular Polymeric Substances in Membrane Biofouling Layers. Environ. Sci. Technol. 2006, 40, 6642–6646. [Google Scholar] [CrossRef] [PubMed]
- Mahardika, D.; Park, H.-S.; Choo, K.-H. Ferrihydrite-impregnated granular activated carbon (FH@GAC) for efficient phosphorus removal from wastewater secondary effluent. Chemosphere 2018, 207, 527–533. [Google Scholar] [CrossRef]
- Phetrak, A.; Sangkarak, S.; Ampawong, S.; Ittisupornrat, S.; Phihusut, D. Kinetic Adsorption of Hazardous Methylene Blue from Aqueous Solution onto Iron-Impregnated Powdered Activated Carbo. Environ. Nat. Resour. J. 2019, 17, 78–86. [Google Scholar] [CrossRef]
- Kim, S.; Kim, J.; Seo, G. Iron oxide nanoparticle-impregnated powder-activated carbon (IPAC) for NOM removal in MF membrane water treatment system. Desalination Water Treat. 2013, 51, 6392–6400. [Google Scholar] [CrossRef]
- Xu, G.; Zhang, Z.; Deng, L. Adsorption Behaviors and Removal Efficiencies of Inorganic, Polymeric and Organic Phosphates from Aqueous Solution on Biochar Derived from Sewage Sludge of Chemically Enhanced Primary Treatment Process. Water 2018, 10, 869. [Google Scholar] [CrossRef] [Green Version]
- Cui, H.-J.; Wang, M.K.; Fu, M.-L.; Ci, E. Enhancing phosphorus availability in phosphorus-fertilized zones by reducing phosphate adsorbed on ferrihydrite using rice straw-derived biochar. J. Soils Sediments 2011, 11, 1135–1141. [Google Scholar] [CrossRef]
- Wang, H.; Zhu, J.; Fu, Q.; Hu, H. Adsorption of phosphate on pure and humic acid-coated ferrihydrite. J. Soils Sediments 2015, 15, 1500–1509. [Google Scholar] [CrossRef]
- Mallet, M.; Barthélémy, K.; Ruby, C.; Renard, A.; Naille, S. Investigation of phosphate adsorption onto ferrihydrite by X-ray Photoelectron Spectroscopy. J. Colloid Interface Sci. 2013, 407, 95–101. [Google Scholar] [CrossRef]
- Kang, S.K.; Choo, K.H.; Lim, K.H. Use of Iron Oxide Particles as Adsorbents to Enhance Phosphorus Removal from Secondary Wastewater Effluent. Sep. Sci. Technol. 2003, 38, 3853–3874. [Google Scholar] [CrossRef]
- Park, H.-S.; Kwak, S.-H.; Mahardika, D.; Mameda, N.; Choo, K.-H. Mixed metal oxide coated polymer beads for enhanced phosphorus removal from membrane bioreactor effluents. Chem. Eng. J. 2017, 319, 240–247. [Google Scholar] [CrossRef]
- Borggaard, O.; Raben-Lange, B.; Gimsing, A.; Strobel, B. Influence of humic substances on phosphate adsorption by aluminium and iron oxides. Geoderma 2005, 127, 270–279. [Google Scholar] [CrossRef]
- Qualls, R.G.; Sherwood, L.J.; Richardson, C.J. Effect of natural dissolved organic carbon on phosphate removal by ferric chloride and aluminum sulfate treatment of wetland waters. Water Resour. Res. 2009, 45. [Google Scholar] [CrossRef]
- Li, X.; Kuang, Y.; Chen, J.; Wu, D. Competitive adsorption of phosphate and dissolved organic carbon on lanthanum modified zeolite. J. Colloid Interface Sci. 2020, 574, 197–206. [Google Scholar] [CrossRef] [PubMed]
- Jiang, L.; Zhu, J.; Wang, H.; Fu, Q.; Hu, H.; Huang, Q.; Violante, A.; Huang, L. Sorption of humic acid on Fe oxides, bacteria, and Fe oxide-bacteria composites. J. Soils Sediments 2014, 14, 1378–1384. [Google Scholar] [CrossRef]
- Yang, Y.; Lohwacharin, J.; Takizawa, S. Analysis of adsorption processes of dissolved organic matter (DOM) on ferrihydrite using surrogate organic compounds. Environ. Sci. Pollut. Res. 2017, 24, 21867–21876. [Google Scholar] [CrossRef] [PubMed]
- Juang, R.; Chen, H.; Chen, Y. Resistance-in-series analysis in cross-flow ultrafiltration of fermentation broths of Bacillus subtilis culture. J. Membr. Sci. 2008, 323, 193–200. [Google Scholar] [CrossRef]
- Fane, T. Irreversible Fouling. In Encyclopedia of Membranes; Drioli, E., Giorno, L., Eds.; Springer: Berlin/Heidelberg, Germany, 2015; pp. 1–2. [Google Scholar]
Figure 1.
Schematic diagram of the hybrid adsorption and membrane system.

Figure 2.
SEM-EDS images with iron, oxygen, and silica mapping of bare PAC and FHPAC.

Figure 3.
(a) Adsorption kinetics of phosphate onto PAC and FHPAC, and (b) adsorption isotherms of phosphate onto PAC and FHPAC.
Figure 3.
(a) Adsorption kinetics of phosphate onto PAC and FHPAC, and (b) adsorption isotherms of phosphate onto PAC and FHPAC.

Figure 4.
Adsorption capacity of simultaneous DOC and phosphate adsorption at different initial concentration ratios.
Figure 4.
Adsorption capacity of simultaneous DOC and phosphate adsorption at different initial concentration ratios.

Figure 5.
Flux decline in biofouling test under the PAC + UF and FHPAC + UF systems. J and J0 denote filtrate fluxes at any filtrate volume and at the beginning of filtration, respectively.
Figure 5.
Flux decline in biofouling test under the PAC + UF and FHPAC + UF systems. J and J0 denote filtrate fluxes at any filtrate volume and at the beginning of filtration, respectively.

Figure 6.
(a) Normalized filtrate flux (J/J0) and (b) total hydraulic resistance of UF membranes (RT) subjected to the presence of PAC and FHPAC. J and J0 denote filtrate fluxes at any filtrate volume and at the beginning of filtration, respectively.
Figure 6.
(a) Normalized filtrate flux (J/J0) and (b) total hydraulic resistance of UF membranes (RT) subjected to the presence of PAC and FHPAC. J and J0 denote filtrate fluxes at any filtrate volume and at the beginning of filtration, respectively.

Figure 7.
SEM images of PAN membrane after operation with PAC (a,b) and FHPAC (c,d) adsorption under magnifications of 1000× and 5000×, respectively.
Figure 7.
SEM images of PAN membrane after operation with PAC (a,b) and FHPAC (c,d) adsorption under magnifications of 1000× and 5000×, respectively.

Figure 8.
(a) CLSM images and (b) relative percentage in each chemical composition of PAN membranes with PAC and FHPAC adsorption. Each bar represents an average value. An error bar denotes 1SD.
Figure 8.
(a) CLSM images and (b) relative percentage in each chemical composition of PAN membranes with PAC and FHPAC adsorption. Each bar represents an average value. An error bar denotes 1SD.


Table 1.
Surface area and porosity analysis of PAC and FHPAC.
| Materials | SBET a (m2/g) | Smic b (m2/g) | Smic/SBET | Vtot c (cm3/g) | Vmic d (cm3/g) | Vmic/Vtot | Pore Diameter e (nm) |
|---|---|---|---|---|---|---|---|
| PAC | 647 | 127 | 0.196 | 0.870 | 0.064 | 0.074 | 3.8 |
| FHPAC | 337 | 51 | 0.151 | 0.395 | 0.035 | 0.089 | 3.8 |
a: Surface area was measured via the BET method with N2 adsorption at 77 K; b: Micropore surface area calculated using the t-plot method; c: Pore volume analyzed with the BJH method using cumulative desorption. d: Micropore volume calculated using the t-plot method. e: Pore sizes determined using the BJH method.
Table 2.
Water quality analysis of feed and permeate from the PAC + UF and FHPAC + UF systems.
| Parameters | Feedwater | Permeate | |
|---|---|---|---|
| PAC | FHPAC | ||
| pH | 7.49 | 7.56 | 7.52 |
| Conductivity, µS/cm | 1033 | 1007 | 991 |
| DOC, mg/L | 7.55 | 4.02 | 6.49 |
| Ammonia, mg-N/L | 1.24 | 0.09 | 0.07 |
| Nitrite, mg-N/L | ND | 0.03 | 0.05 |
| Nitrate, mg-N/L | 0.85 | 2.07 | 8.69 |
| Phosphate, mg-P/L | 0.51 | 0.22 | 0.07 |
| HPC *, CFU/ml | 1.63×10⁸ | ND | ND |
* Heterotrophic plate count.
Publisher’s Note: MDPI stays neutral with regard to jurisdictional claims in published maps and institutional affiliations. |
© 2021 by the authors. Licensee MDPI, Basel, Switzerland. This article is an open access article distributed under the terms and conditions of the Creative Commons Attribution (CC BY) license (https://creativecommons.org/licenses/by/4.0/).
Share and Cite
MDPI and ACS Style
Lohwacharin, J.; Maliwan, T.; Osawa, H.; Takizawa, S. Effects of Ferrihydrite-Impregnated Powdered Activated Carbon on Phosphate Removal and Biofouling of Ultrafiltration Membrane. Water 2021, 13, 1178. https://doi.org/10.3390/w13091178
AMA Style
Lohwacharin J, Maliwan T, Osawa H, Takizawa S. Effects of Ferrihydrite-Impregnated Powdered Activated Carbon on Phosphate Removal and Biofouling of Ultrafiltration Membrane. Water. 2021; 13(9):1178. https://doi.org/10.3390/w13091178
Chicago/Turabian StyleLohwacharin, Jenyuk, Thitiwut Maliwan, Hideki Osawa, and Satoshi Takizawa. 2021. "Effects of Ferrihydrite-Impregnated Powdered Activated Carbon on Phosphate Removal and Biofouling of Ultrafiltration Membrane" Water 13, no. 9: 1178. https://doi.org/10.3390/w13091178
Note that from the first issue of 2016, this journal uses article numbers instead of page numbers. See further details here.